Zip Codes with the Highest Percentage of Population Employed in Accommodation & Food Services in Grants Pass, OR
RELATED REPORTS & OPTIONS
Accommodation & Food Services
Grants Pass
Compare Zip Codes
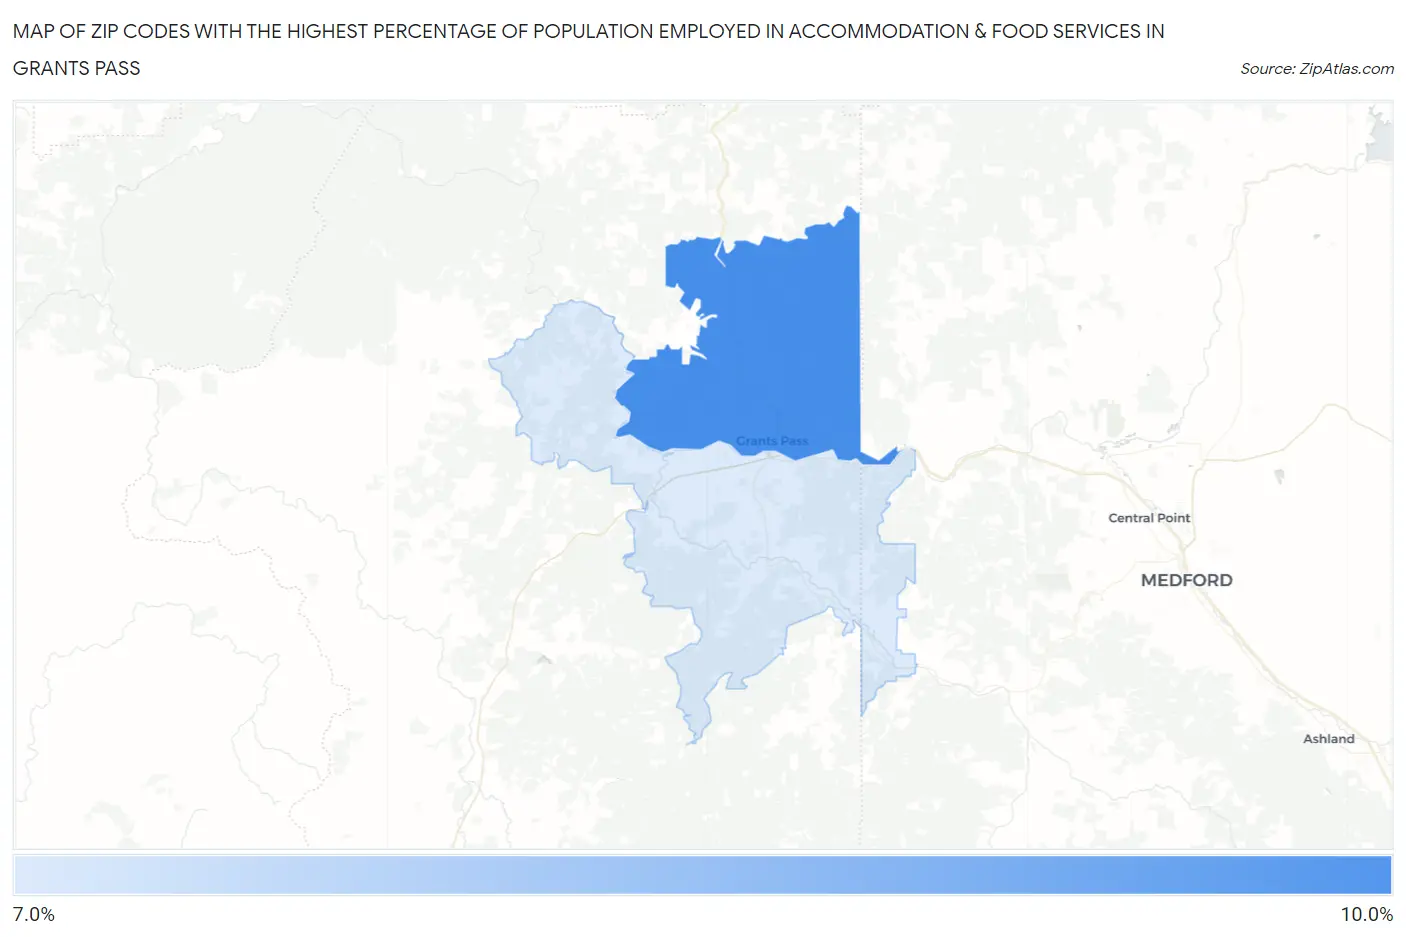
Map of Zip Codes with the Highest Percentage of Population Employed in Accommodation & Food Services in Grants Pass
7.4%
9.2%
Zip Codes with the Highest Percentage of Population Employed in Accommodation & Food Services in Grants Pass, OR
| Zip Code | % Employed | vs State | vs National | |
| 1. | 97526 | 9.2% | 7.2%(+2.00)#100 | 6.9%(+2.34)#5,623 |
| 2. | 97527 | 7.4% | 7.2%(+0.223)#158 | 6.9%(+0.568)#9,110 |
1
Common Questions
What are the Top Zip Codes with the Highest Percentage of Population Employed in Accommodation & Food Services in Grants Pass, OR?
Top Zip Codes with the Highest Percentage of Population Employed in Accommodation & Food Services in Grants Pass, OR are:
What zip code has the Highest Percentage of Population Employed in Accommodation & Food Services in Grants Pass, OR?
97526 has the Highest Percentage of Population Employed in Accommodation & Food Services in Grants Pass, OR with 9.2%.
What is the Percentage of Population Employed in Accommodation & Food Services in Grants Pass, OR?
Percentage of Population Employed in Accommodation & Food Services in Grants Pass is 9.5%.
What is the Percentage of Population Employed in Accommodation & Food Services in Oregon?
Percentage of Population Employed in Accommodation & Food Services in Oregon is 7.2%.
What is the Percentage of Population Employed in Accommodation & Food Services in the United States?
Percentage of Population Employed in Accommodation & Food Services in the United States is 6.9%.