Mount Holly, NC Map & Demographics
Mount Holly Map
Mount Holly Overview
$39,509
PER CAPITA INCOME
$99,444
AVG FAMILY INCOME
$73,923
AVG HOUSEHOLD INCOME
25.8%
WAGE / INCOME GAP [ % ]
74.2¢/ $1
WAGE / INCOME GAP [ $ ]
$11,671
FAMILY INCOME DEFICIT
0.42
INEQUALITY / GINI INDEX
17,644
TOTAL POPULATION
8,590
MALE POPULATION
9,054
FEMALE POPULATION
94.88
MALES / 100 FEMALES
105.40
FEMALES / 100 MALES
37.7
MEDIAN AGE
3.1
AVG FAMILY SIZE
2.5
AVG HOUSEHOLD SIZE
10,291
LABOR FORCE [ PEOPLE ]
71.6%
PERCENT IN LABOR FORCE
6.5%
UNEMPLOYMENT RATE
Mount Holly Zip Codes
Mount Holly Area Codes
Income in Mount Holly
Income Overview in Mount Holly
Per Capita Income in Mount Holly is $39,509, while median incomes of families and households are $99,444 and $73,923 respectively.
| Characteristic | Number | Measure |
| Per Capita Income | 17,644 | $39,509 |
| Median Family Income | 4,726 | $99,444 |
| Mean Family Income | 4,726 | $112,657 |
| Median Household Income | 7,037 | $73,923 |
| Mean Household Income | 7,037 | $96,741 |
| Income Deficit | 4,726 | $11,671 |
| Wage / Income Gap (%) | 17,644 | 25.83% |
| Wage / Income Gap ($) | 17,644 | 74.17¢ per $1 |
| Gini / Inequality Index | 17,644 | 0.42 |
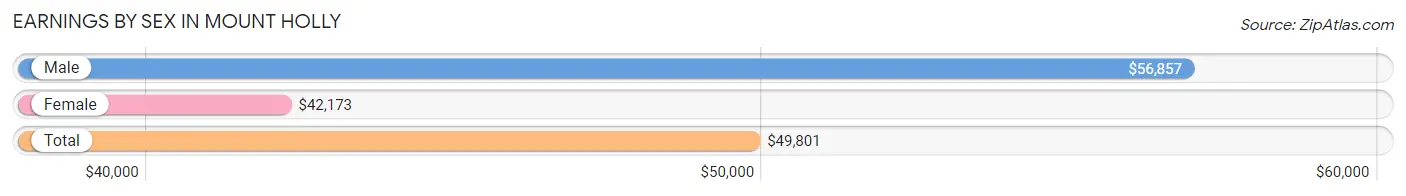
Earnings by Sex in Mount Holly
Average Earnings in Mount Holly are $49,801, $56,857 for men and $42,173 for women, a difference of 25.8%.
| Sex | Number | Average Earnings |
| Male | 5,522 (51.7%) | $56,857 |
| Female | 5,158 (48.3%) | $42,173 |
| Total | 10,680 (100.0%) | $49,801 |
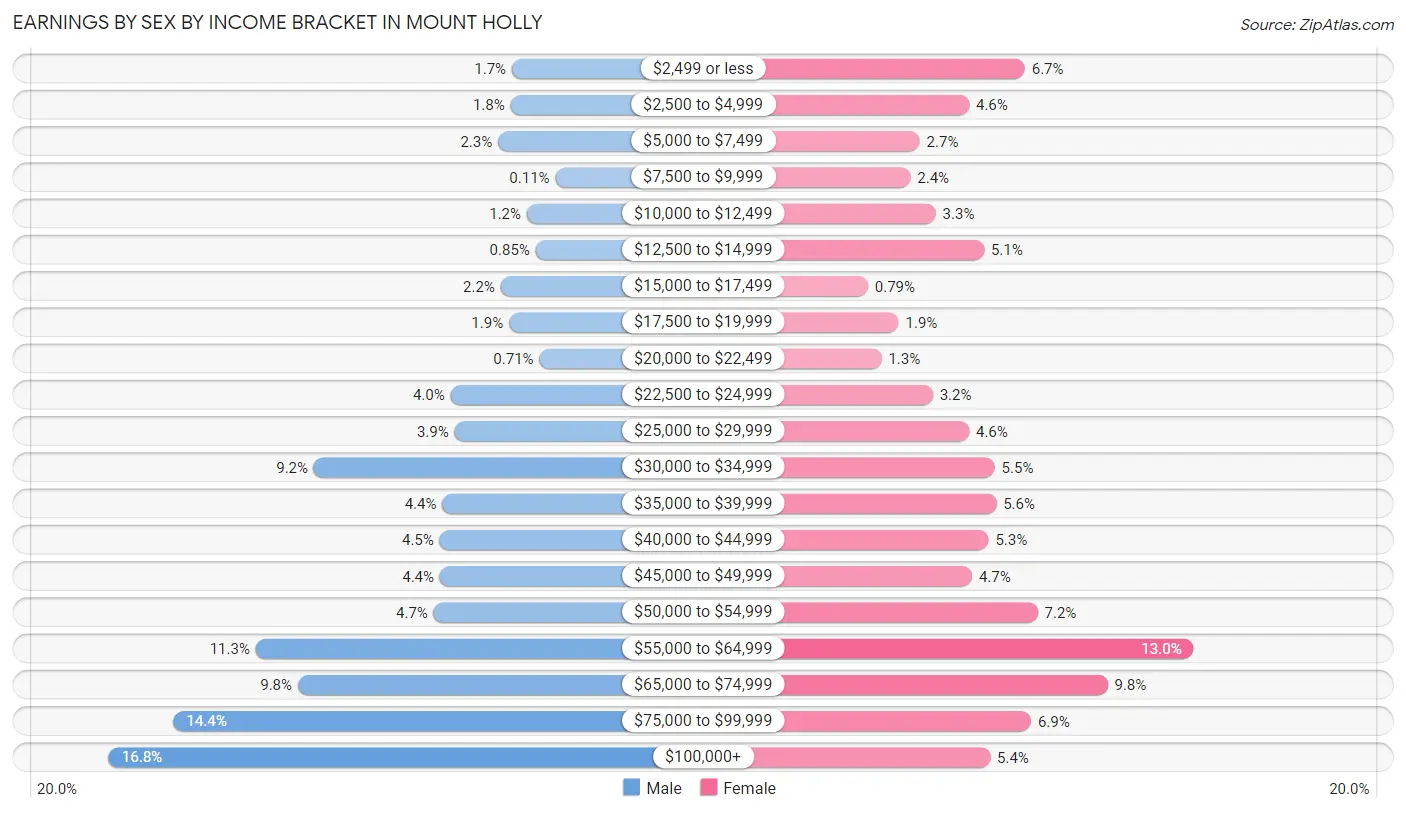
Earnings by Sex by Income Bracket in Mount Holly
The most common earnings brackets in Mount Holly are $100,000+ for men (930 | 16.8%) and $55,000 to $64,999 for women (670 | 13.0%).
| Income | Male | Female |
| $2,499 or less | 96 (1.7%) | 344 (6.7%) |
| $2,500 to $4,999 | 99 (1.8%) | 236 (4.6%) |
| $5,000 to $7,499 | 125 (2.3%) | 141 (2.7%) |
| $7,500 to $9,999 | 6 (0.1%) | 123 (2.4%) |
| $10,000 to $12,499 | 65 (1.2%) | 172 (3.3%) |
| $12,500 to $14,999 | 47 (0.9%) | 265 (5.1%) |
| $15,000 to $17,499 | 119 (2.2%) | 41 (0.8%) |
| $17,500 to $19,999 | 102 (1.8%) | 100 (1.9%) |
| $20,000 to $22,499 | 39 (0.7%) | 67 (1.3%) |
| $22,500 to $24,999 | 223 (4.0%) | 166 (3.2%) |
| $25,000 to $29,999 | 215 (3.9%) | 236 (4.6%) |
| $30,000 to $34,999 | 506 (9.2%) | 286 (5.5%) |
| $35,000 to $39,999 | 240 (4.3%) | 289 (5.6%) |
| $40,000 to $44,999 | 246 (4.4%) | 274 (5.3%) |
| $45,000 to $49,999 | 245 (4.4%) | 242 (4.7%) |
| $50,000 to $54,999 | 258 (4.7%) | 369 (7.1%) |
| $55,000 to $64,999 | 626 (11.3%) | 670 (13.0%) |
| $65,000 to $74,999 | 539 (9.8%) | 504 (9.8%) |
| $75,000 to $99,999 | 796 (14.4%) | 356 (6.9%) |
| $100,000+ | 930 (16.8%) | 277 (5.4%) |
| Total | 5,522 (100.0%) | 5,158 (100.0%) |
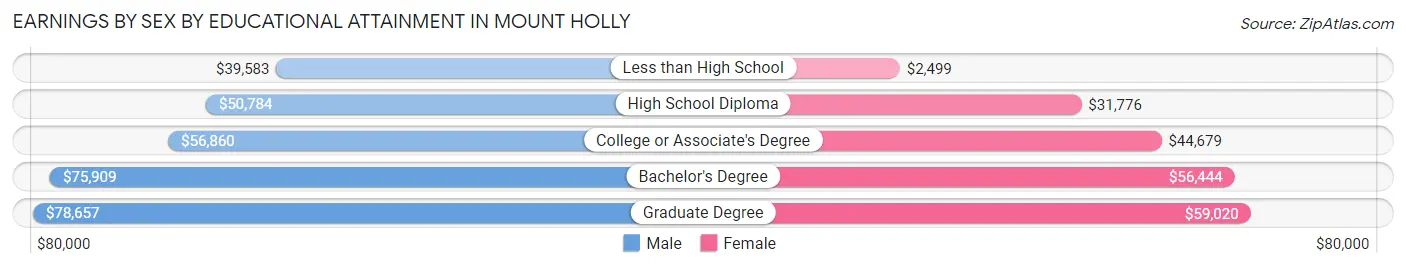
Earnings by Sex by Educational Attainment in Mount Holly
Average earnings in Mount Holly are $61,685 for men and $48,125 for women, a difference of 22.0%. Men with an educational attainment of graduate degree enjoy the highest average annual earnings of $78,657, while those with less than high school education earn the least with $39,583. Women with an educational attainment of graduate degree earn the most with the average annual earnings of $59,020, while those with less than high school education have the smallest earnings of $2,499.
| Educational Attainment | Male Income | Female Income |
| Less than High School | $39,583 | $2,499 |
| High School Diploma | $50,784 | $31,776 |
| College or Associate's Degree | $56,860 | $44,679 |
| Bachelor's Degree | $75,909 | $56,444 |
| Graduate Degree | $78,657 | $59,020 |
| Total | $61,685 | $48,125 |
Family Income in Mount Holly
Family Income Brackets in Mount Holly
According to the Mount Holly family income data, there are 1,130 families falling into the $100,000 to $149,999 income range, which is the most common income bracket and makes up 23.9% of all families. Conversely, the $10,000 to $14,999 income bracket is the least frequent group with only 61 families (1.3%) belonging to this category.
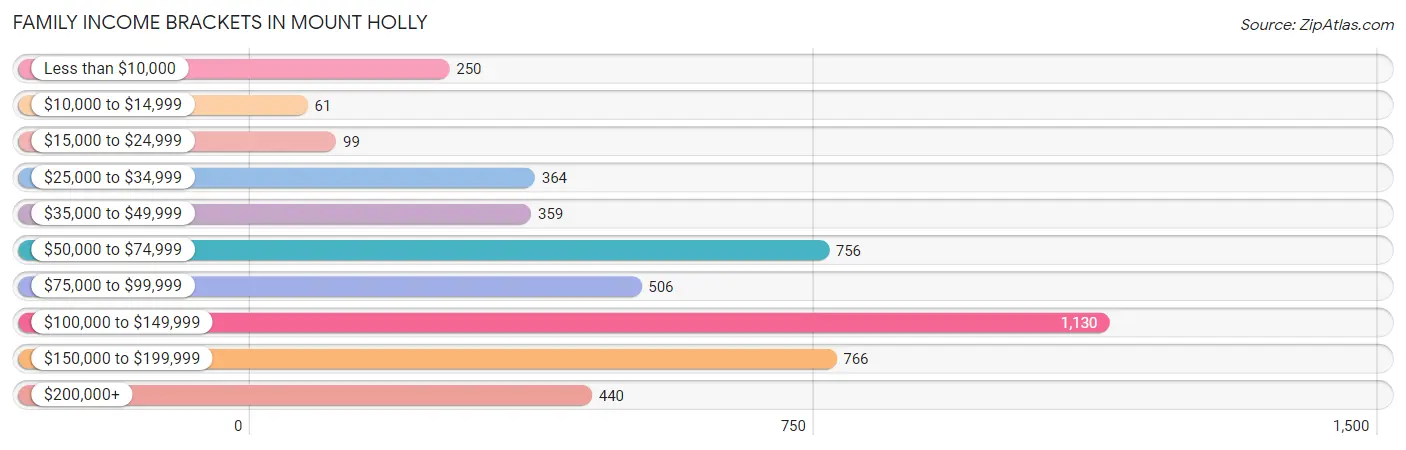
| Income Bracket | # Families | % Families |
| Less than $10,000 | 250 | 5.3% |
| $10,000 to $14,999 | 61 | 1.3% |
| $15,000 to $24,999 | 99 | 2.1% |
| $25,000 to $34,999 | 364 | 7.7% |
| $35,000 to $49,999 | 359 | 7.6% |
| $50,000 to $74,999 | 756 | 16.0% |
| $75,000 to $99,999 | 506 | 10.7% |
| $100,000 to $149,999 | 1,130 | 23.9% |
| $150,000 to $199,999 | 766 | 16.2% |
| $200,000+ | 440 | 9.3% |
Family Income by Famaliy Size in Mount Holly
6-person families (135 | 2.9%) account for the highest median family income in Mount Holly with $140,655 per family, while 2-person families (2,242 | 47.4%) have the highest median income of $36,340 per family member.
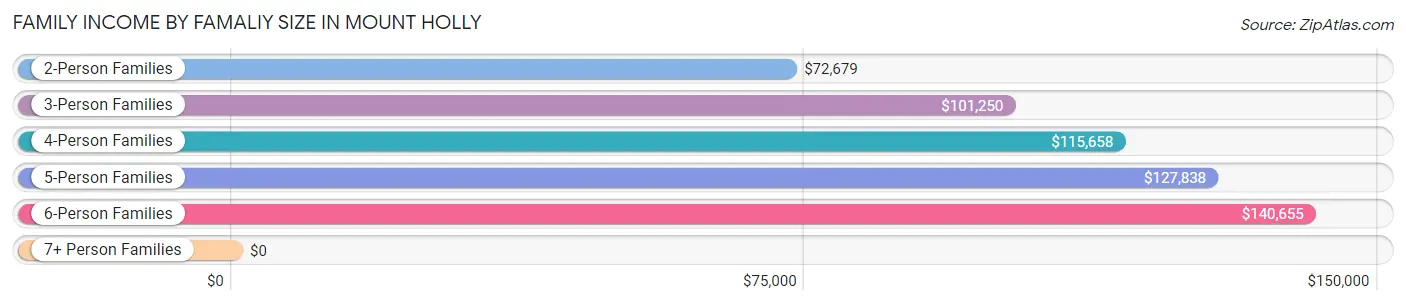
| Income Bracket | # Families | Median Income |
| 2-Person Families | 2,242 (47.4%) | $72,679 |
| 3-Person Families | 1,156 (24.5%) | $101,250 |
| 4-Person Families | 852 (18.0%) | $115,658 |
| 5-Person Families | 290 (6.1%) | $127,838 |
| 6-Person Families | 135 (2.9%) | $140,655 |
| 7+ Person Families | 51 (1.1%) | $0 |
| Total | 4,726 (100.0%) | $99,444 |
Family Income by Number of Earners in Mount Holly
The median family income in Mount Holly is $99,444, with families comprising 3+ earners (829) having the highest median family income of $167,933, while families with no earners (442) have the lowest median family income of $37,826, accounting for 17.5% and 9.3% of families, respectively.
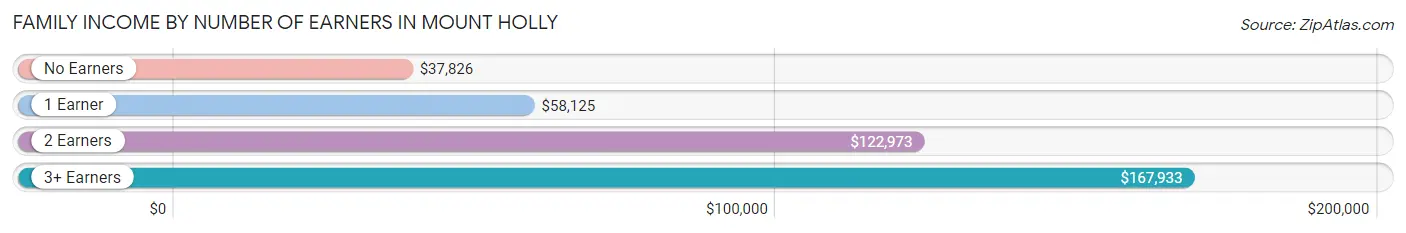
| Number of Earners | # Families | Median Income |
| No Earners | 442 (9.3%) | $37,826 |
| 1 Earner | 1,666 (35.2%) | $58,125 |
| 2 Earners | 1,789 (37.9%) | $122,973 |
| 3+ Earners | 829 (17.5%) | $167,933 |
| Total | 4,726 (100.0%) | $99,444 |
Household Income in Mount Holly
Household Income Brackets in Mount Holly
With 1,337 households falling in the category, the $50,000 to $74,999 income range is the most frequent in Mount Holly, accounting for 19.0% of all households. In contrast, only 176 households (2.5%) fall into the $10,000 to $14,999 income bracket, making it the least populous group.
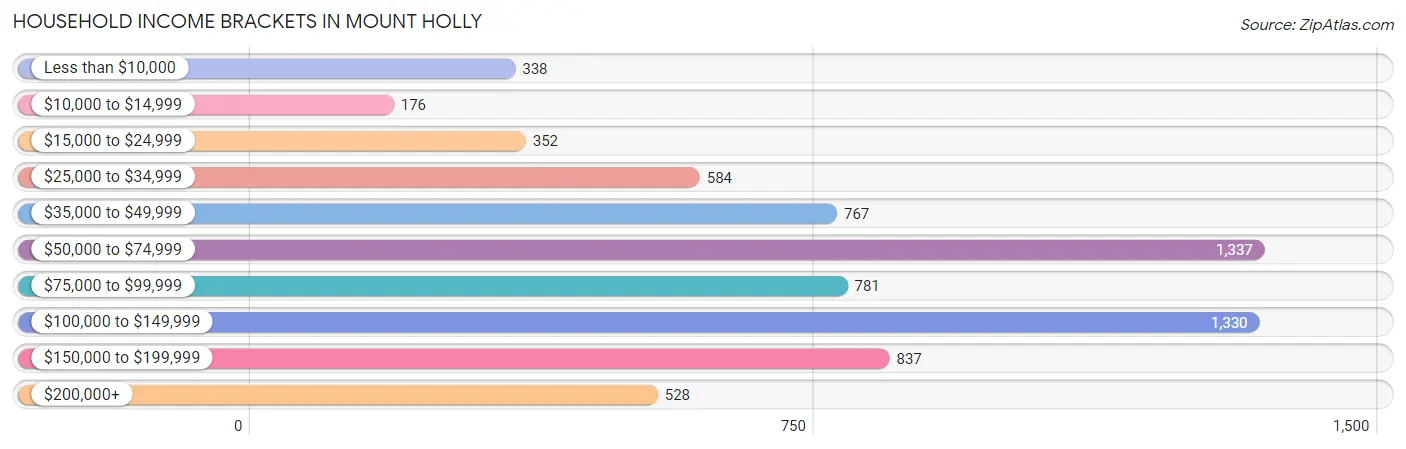
| Income Bracket | # Households | % Households |
| Less than $10,000 | 338 | 4.8% |
| $10,000 to $14,999 | 176 | 2.5% |
| $15,000 to $24,999 | 352 | 5.0% |
| $25,000 to $34,999 | 584 | 8.3% |
| $35,000 to $49,999 | 767 | 10.9% |
| $50,000 to $74,999 | 1,337 | 19.0% |
| $75,000 to $99,999 | 781 | 11.1% |
| $100,000 to $149,999 | 1,330 | 18.9% |
| $150,000 to $199,999 | 837 | 11.9% |
| $200,000+ | 528 | 7.5% |
Household Income by Householder Age in Mount Holly
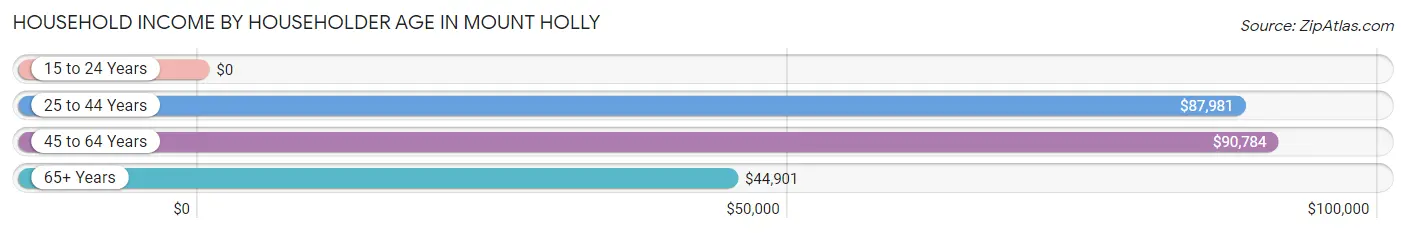
The median household income in Mount Holly is $73,923, with the highest median household income of $90,784 found in the 45 to 64 years age bracket for the primary householder. A total of 2,979 households (42.3%) fall into this category. Meanwhile, the 15 to 24 years age bracket for the primary householder has the lowest median household income of $0, with 131 households (1.9%) in this group.
| Income Bracket | # Households | Median Income |
| 15 to 24 Years | 131 (1.9%) | $0 |
| 25 to 44 Years | 2,728 (38.8%) | $87,981 |
| 45 to 64 Years | 2,979 (42.3%) | $90,784 |
| 65+ Years | 1,199 (17.0%) | $44,901 |
| Total | 7,037 (100.0%) | $73,923 |
Poverty in Mount Holly
Income Below Poverty by Sex and Age in Mount Holly
With 7.0% poverty level for males and 9.5% for females among the residents of Mount Holly, under 5 year old males and 25 to 34 year old females are the most vulnerable to poverty, with 103 males (17.8%) and 324 females (22.6%) in their respective age groups living below the poverty level.
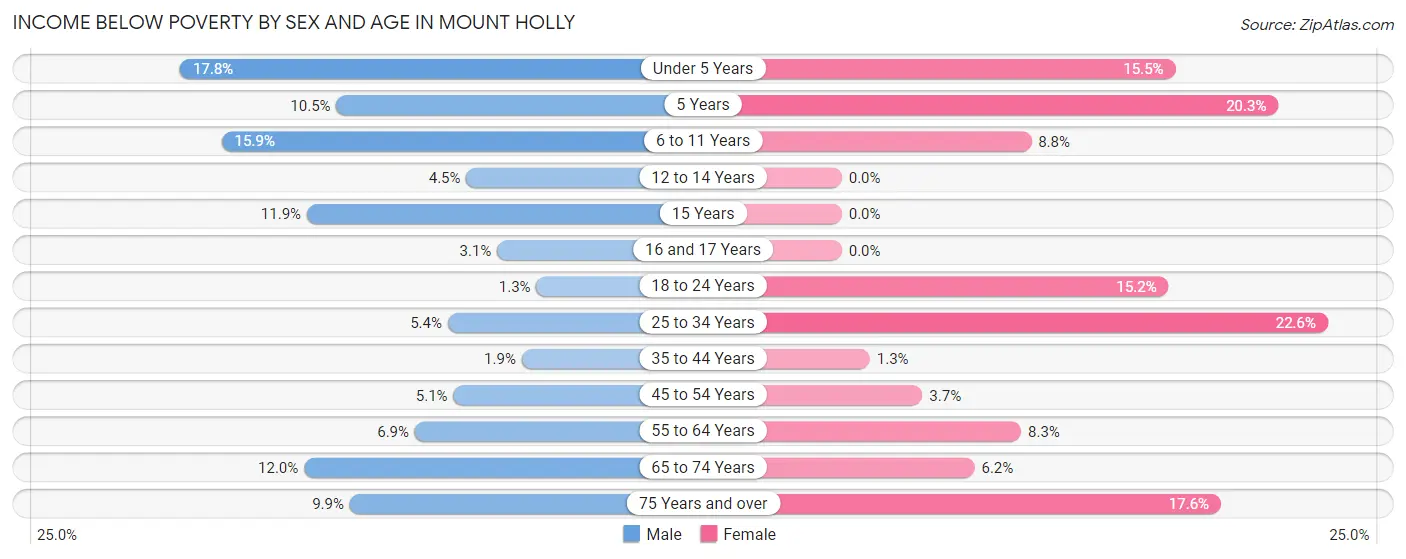
| Age Bracket | Male | Female |
| Under 5 Years | 103 (17.8%) | 48 (15.5%) |
| 5 Years | 8 (10.5%) | 32 (20.3%) |
| 6 to 11 Years | 115 (15.9%) | 50 (8.8%) |
| 12 to 14 Years | 15 (4.5%) | 0 (0.0%) |
| 15 Years | 10 (11.9%) | 0 (0.0%) |
| 16 and 17 Years | 5 (3.1%) | 0 (0.0%) |
| 18 to 24 Years | 9 (1.3%) | 102 (15.2%) |
| 25 to 34 Years | 74 (5.4%) | 324 (22.6%) |
| 35 to 44 Years | 24 (1.9%) | 16 (1.3%) |
| 45 to 54 Years | 70 (5.1%) | 52 (3.7%) |
| 55 to 64 Years | 76 (6.9%) | 112 (8.3%) |
| 65 to 74 Years | 67 (12.0%) | 45 (6.2%) |
| 75 Years and over | 22 (9.9%) | 79 (17.6%) |
| Total | 598 (7.0%) | 860 (9.5%) |
Income Above Poverty by Sex and Age in Mount Holly
According to the poverty statistics in Mount Holly, males aged 18 to 24 years and females aged 12 to 14 years are the age groups that are most secure financially, with 98.8% of males and 100.0% of females in these age groups living above the poverty line.
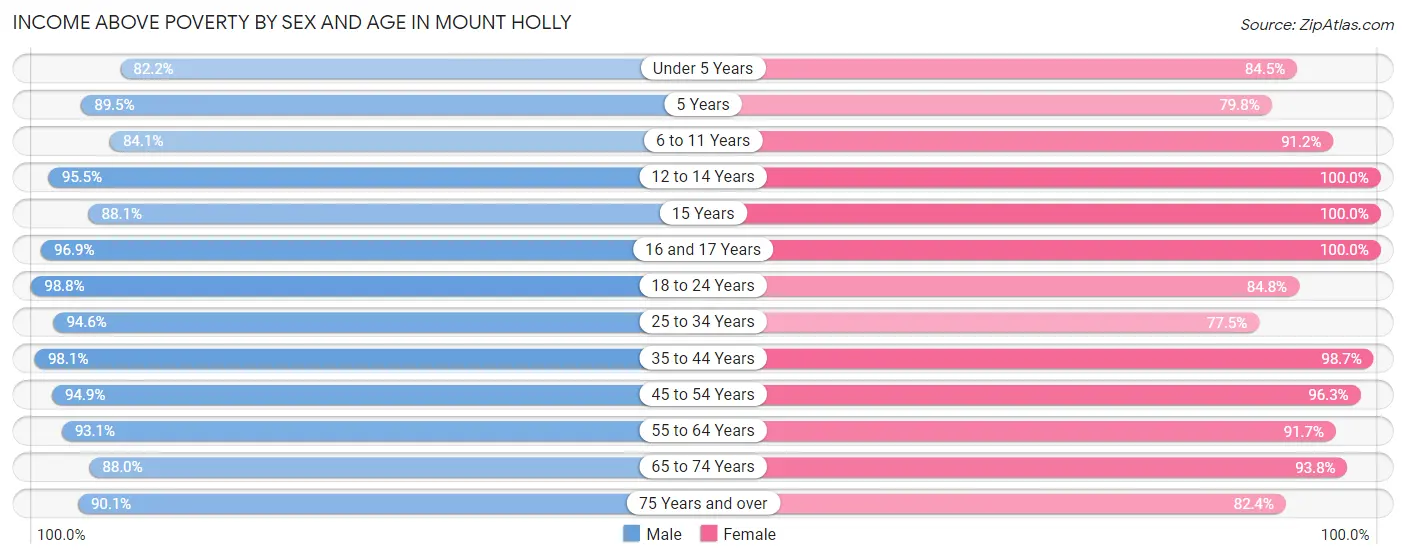
| Age Bracket | Male | Female |
| Under 5 Years | 476 (82.2%) | 262 (84.5%) |
| 5 Years | 68 (89.5%) | 126 (79.7%) |
| 6 to 11 Years | 610 (84.1%) | 519 (91.2%) |
| 12 to 14 Years | 318 (95.5%) | 397 (100.0%) |
| 15 Years | 74 (88.1%) | 11 (100.0%) |
| 16 and 17 Years | 158 (96.9%) | 328 (100.0%) |
| 18 to 24 Years | 710 (98.8%) | 571 (84.8%) |
| 25 to 34 Years | 1,306 (94.6%) | 1,113 (77.4%) |
| 35 to 44 Years | 1,217 (98.1%) | 1,219 (98.7%) |
| 45 to 54 Years | 1,302 (94.9%) | 1,340 (96.3%) |
| 55 to 64 Years | 1,027 (93.1%) | 1,234 (91.7%) |
| 65 to 74 Years | 490 (88.0%) | 685 (93.8%) |
| 75 Years and over | 200 (90.1%) | 370 (82.4%) |
| Total | 7,956 (93.0%) | 8,175 (90.5%) |
Income Below Poverty Among Married-Couple Families in Mount Holly
The poverty statistics for married-couple families in Mount Holly show that 2.6% or 90 of the total 3,412 families live below the poverty line. Families with 3 or 4 children have the highest poverty rate of 18.4%, comprising of 33 families. On the other hand, families with 5 or more children have the lowest poverty rate of 0.0%, which includes 0 families.
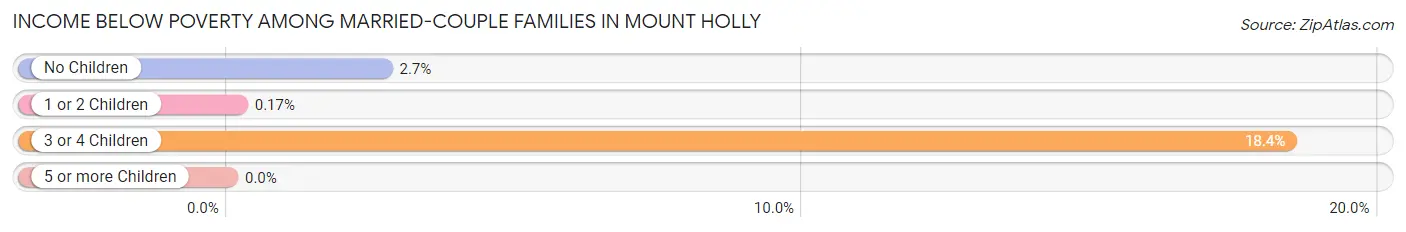
| Children | Above Poverty | Below Poverty |
| No Children | 1,993 (97.3%) | 55 (2.7%) |
| 1 or 2 Children | 1,156 (99.8%) | 2 (0.2%) |
| 3 or 4 Children | 146 (81.6%) | 33 (18.4%) |
| 5 or more Children | 27 (100.0%) | 0 (0.0%) |
| Total | 3,322 (97.4%) | 90 (2.6%) |
Income Below Poverty Among Single-Parent Households in Mount Holly
According to the poverty data in Mount Holly, 8.4% or 28 single-father households and 30.9% or 303 single-mother households are living below the poverty line. Among single-father households, those with 1 or 2 children have the highest poverty rate, with 19 households (9.4%) experiencing poverty. Likewise, among single-mother households, those with 1 or 2 children have the highest poverty rate, with 279 households (38.4%) falling below the poverty line.
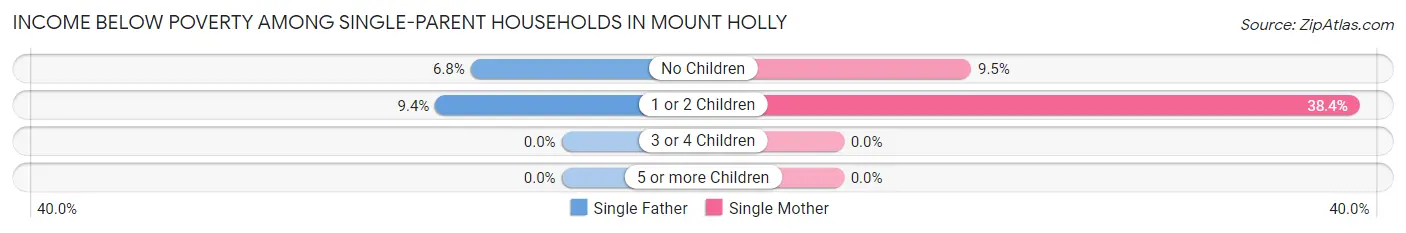
| Children | Single Father | Single Mother |
| No Children | 9 (6.8%) | 24 (9.5%) |
| 1 or 2 Children | 19 (9.4%) | 279 (38.4%) |
| 3 or 4 Children | 0 (0.0%) | 0 (0.0%) |
| 5 or more Children | 0 (0.0%) | 0 (0.0%) |
| Total | 28 (8.4%) | 303 (30.9%) |
Income Below Poverty Among Married-Couple vs Single-Parent Households in Mount Holly
The poverty data for Mount Holly shows that 90 of the married-couple family households (2.6%) and 331 of the single-parent households (25.2%) are living below the poverty level. Within the married-couple family households, those with 3 or 4 children have the highest poverty rate, with 33 households (18.4%) falling below the poverty line. Among the single-parent households, those with 1 or 2 children have the highest poverty rate, with 298 household (32.1%) living below poverty.
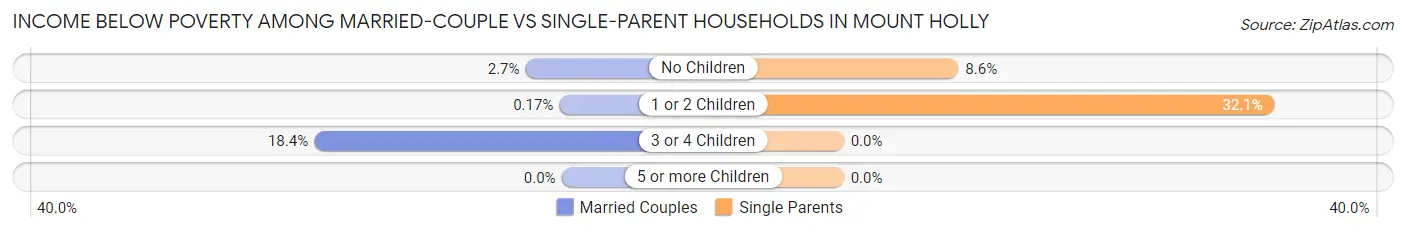
| Children | Married-Couple Families | Single-Parent Households |
| No Children | 55 (2.7%) | 33 (8.6%) |
| 1 or 2 Children | 2 (0.2%) | 298 (32.1%) |
| 3 or 4 Children | 33 (18.4%) | 0 (0.0%) |
| 5 or more Children | 0 (0.0%) | 0 (0.0%) |
| Total | 90 (2.6%) | 331 (25.2%) |
Race in Mount Holly
The most populous races in Mount Holly are White / Caucasian (13,141 | 74.5%), Black / African American (2,543 | 14.4%), and Hispanic or Latino (1,048 | 5.9%).
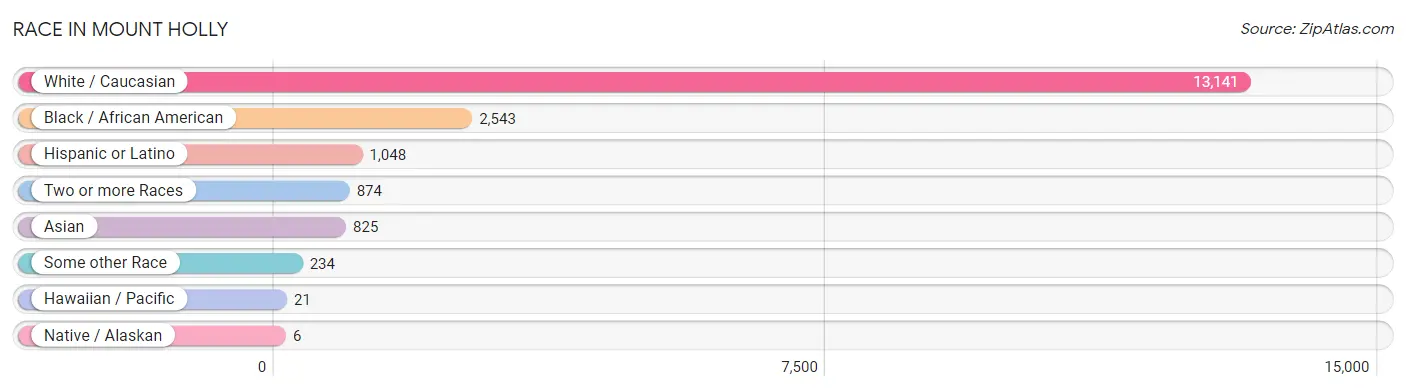
| Race | # Population | % Population |
| Asian | 825 | 4.7% |
| Black / African American | 2,543 | 14.4% |
| Hawaiian / Pacific | 21 | 0.1% |
| Hispanic or Latino | 1,048 | 5.9% |
| Native / Alaskan | 6 | 0.0% |
| White / Caucasian | 13,141 | 74.5% |
| Two or more Races | 874 | 5.0% |
| Some other Race | 234 | 1.3% |
| Total | 17,644 | 100.0% |
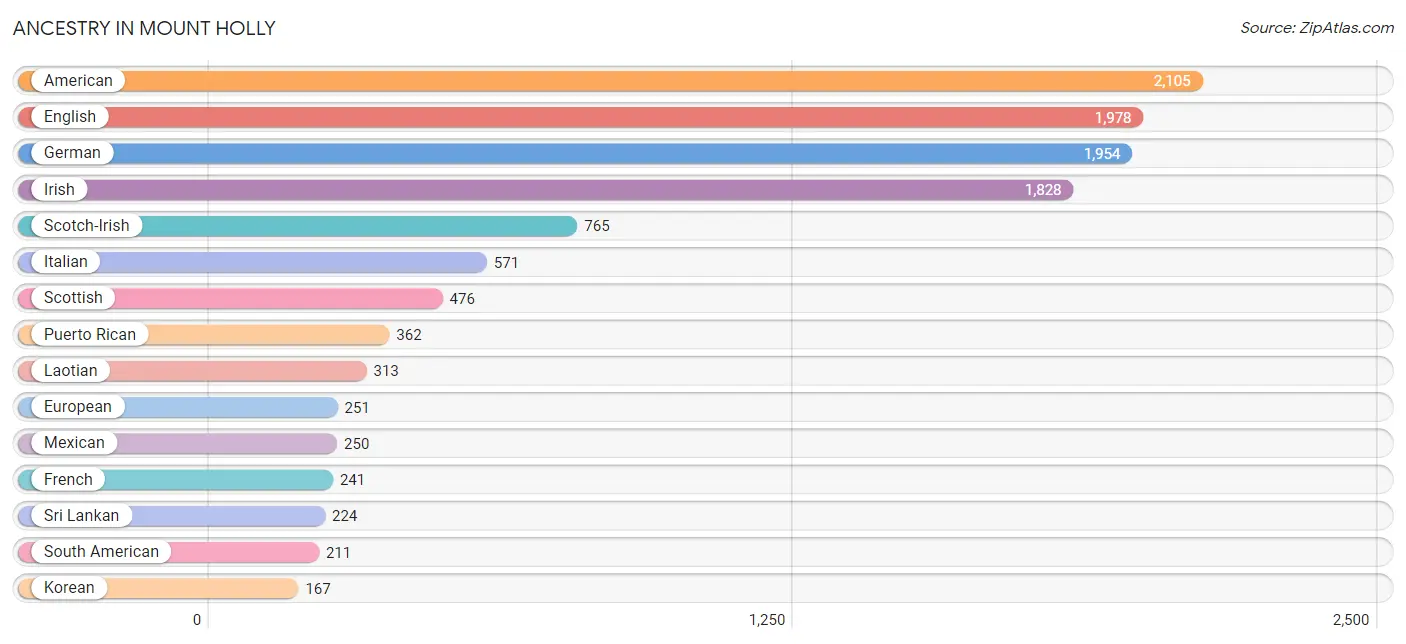
Ancestry in Mount Holly
The most populous ancestries reported in Mount Holly are American (2,105 | 11.9%), English (1,978 | 11.2%), German (1,954 | 11.1%), Irish (1,828 | 10.4%), and Scotch-Irish (765 | 4.3%), together accounting for 48.9% of all Mount Holly residents.
| Ancestry | # Population | % Population |
| African | 54 | 0.3% |
| American | 2,105 | 11.9% |
| Arab | 22 | 0.1% |
| Argentinean | 166 | 0.9% |
| Armenian | 132 | 0.7% |
| Austrian | 11 | 0.1% |
| Bahamian | 7 | 0.0% |
| Bhutanese | 7 | 0.0% |
| British | 34 | 0.2% |
| Burmese | 76 | 0.4% |
| Carpatho Rusyn | 18 | 0.1% |
| Celtic | 5 | 0.0% |
| Central American | 120 | 0.7% |
| Cherokee | 21 | 0.1% |
| Colombian | 28 | 0.2% |
| Croatian | 25 | 0.1% |
| Cuban | 11 | 0.1% |
| Czech | 15 | 0.1% |
| Danish | 36 | 0.2% |
| Dominican | 82 | 0.5% |
| Dutch | 67 | 0.4% |
| Eastern European | 14 | 0.1% |
| Ecuadorian | 6 | 0.0% |
| English | 1,978 | 11.2% |
| Ethiopian | 16 | 0.1% |
| European | 251 | 1.4% |
| Finnish | 9 | 0.1% |
| French | 241 | 1.4% |
| French Canadian | 92 | 0.5% |
| German | 1,954 | 11.1% |
| Greek | 30 | 0.2% |
| Guatemalan | 5 | 0.0% |
| Honduran | 70 | 0.4% |
| Hungarian | 52 | 0.3% |
| Indian (Asian) | 115 | 0.6% |
| Irish | 1,828 | 10.4% |
| Iroquois | 3 | 0.0% |
| Italian | 571 | 3.2% |
| Japanese | 47 | 0.3% |
| Korean | 167 | 0.9% |
| Laotian | 313 | 1.8% |
| Lebanese | 15 | 0.1% |
| Lithuanian | 6 | 0.0% |
| Lumbee | 10 | 0.1% |
| Macedonian | 30 | 0.2% |
| Malaysian | 32 | 0.2% |
| Mexican | 250 | 1.4% |
| Northern European | 23 | 0.1% |
| Norwegian | 46 | 0.3% |
| Peruvian | 11 | 0.1% |
| Polish | 145 | 0.8% |
| Portuguese | 62 | 0.4% |
| Puerto Rican | 362 | 2.1% |
| Romanian | 5 | 0.0% |
| Russian | 18 | 0.1% |
| Salvadoran | 45 | 0.3% |
| Scotch-Irish | 765 | 4.3% |
| Scottish | 476 | 2.7% |
| Slovene | 30 | 0.2% |
| South American | 211 | 1.2% |
| Spaniard | 12 | 0.1% |
| Sri Lankan | 224 | 1.3% |
| Subsaharan African | 70 | 0.4% |
| Swedish | 94 | 0.5% |
| Swiss | 46 | 0.3% |
| Syrian | 7 | 0.0% |
| Thai | 152 | 0.9% |
| Welsh | 24 | 0.1% |
| West Indian | 21 | 0.1% | View All 69 Rows |
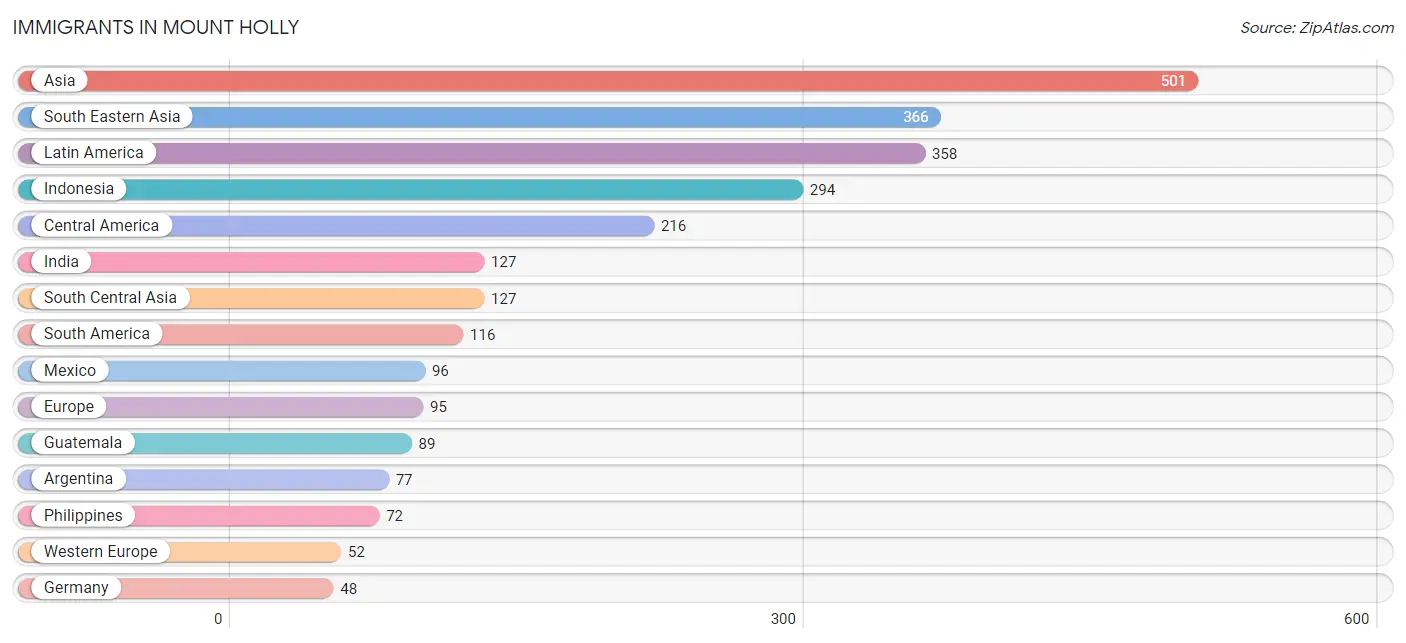
Immigrants in Mount Holly
The most numerous immigrant groups reported in Mount Holly came from Asia (501 | 2.8%), South Eastern Asia (366 | 2.1%), Latin America (358 | 2.0%), Indonesia (294 | 1.7%), and Central America (216 | 1.2%), together accounting for 9.8% of all Mount Holly residents.
| Immigration Origin | # Population | % Population |
| Africa | 24 | 0.1% |
| Argentina | 77 | 0.4% |
| Asia | 501 | 2.8% |
| Australia | 9 | 0.1% |
| Bahamas | 7 | 0.0% |
| Canada | 41 | 0.2% |
| Caribbean | 26 | 0.2% |
| Central America | 216 | 1.2% |
| Colombia | 28 | 0.2% |
| Congo | 8 | 0.1% |
| Dominican Republic | 8 | 0.1% |
| Eastern Africa | 16 | 0.1% |
| Eastern Asia | 7 | 0.0% |
| Eastern Europe | 30 | 0.2% |
| El Salvador | 24 | 0.1% |
| England | 13 | 0.1% |
| Ethiopia | 16 | 0.1% |
| Europe | 95 | 0.5% |
| Germany | 48 | 0.3% |
| Guatemala | 89 | 0.5% |
| Honduras | 7 | 0.0% |
| India | 127 | 0.7% |
| Indonesia | 294 | 1.7% |
| Korea | 7 | 0.0% |
| Latin America | 358 | 2.0% |
| Mexico | 96 | 0.5% |
| Middle Africa | 8 | 0.1% |
| Netherlands | 4 | 0.0% |
| North Macedonia | 30 | 0.2% |
| Northern Europe | 13 | 0.1% |
| Oceania | 30 | 0.2% |
| Peru | 11 | 0.1% |
| Philippines | 72 | 0.4% |
| South America | 116 | 0.7% |
| South Central Asia | 127 | 0.7% |
| South Eastern Asia | 366 | 2.1% |
| Western Asia | 1 | 0.0% |
| Western Europe | 52 | 0.3% | View All 38 Rows |
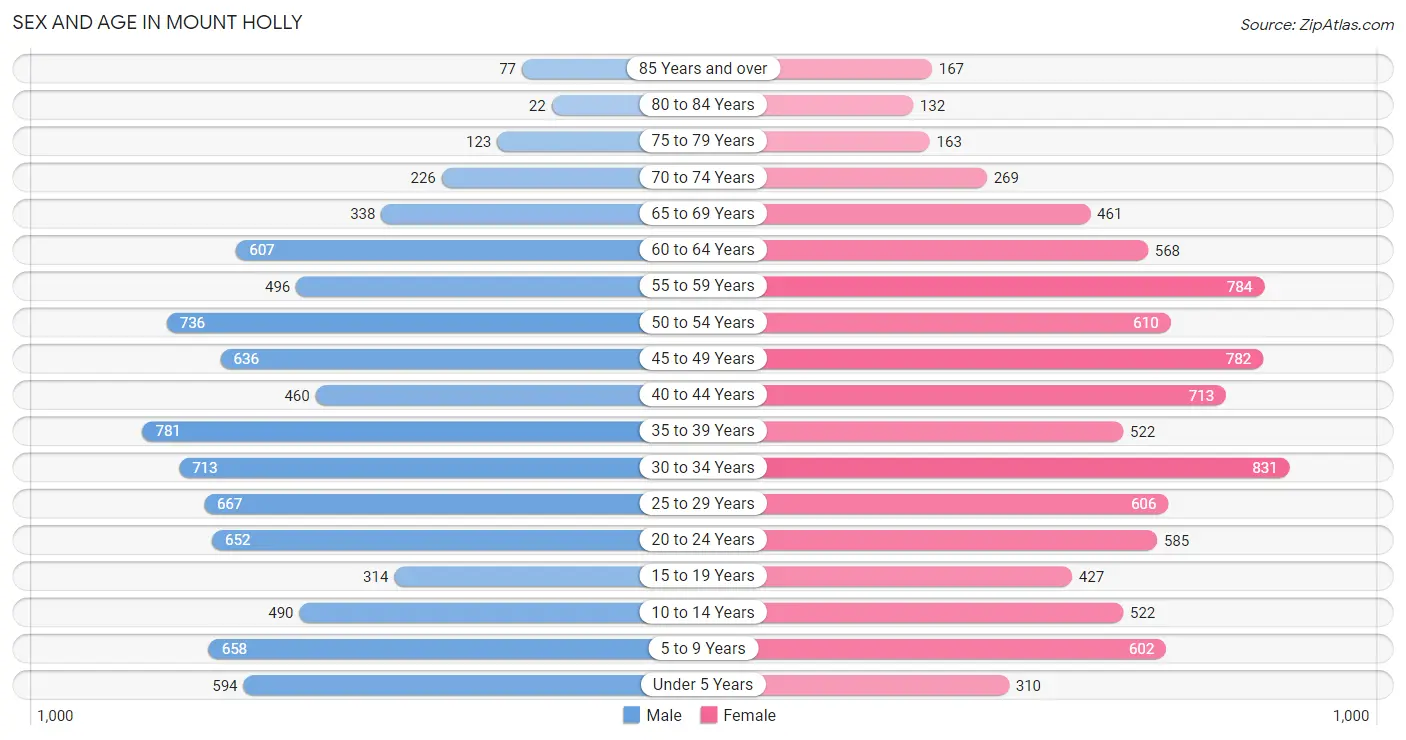
Sex and Age in Mount Holly
Sex and Age in Mount Holly
The most populous age groups in Mount Holly are 35 to 39 Years (781 | 9.1%) for men and 30 to 34 Years (831 | 9.2%) for women.
| Age Bracket | Male | Female |
| Under 5 Years | 594 (6.9%) | 310 (3.4%) |
| 5 to 9 Years | 658 (7.7%) | 602 (6.7%) |
| 10 to 14 Years | 490 (5.7%) | 522 (5.8%) |
| 15 to 19 Years | 314 (3.7%) | 427 (4.7%) |
| 20 to 24 Years | 652 (7.6%) | 585 (6.5%) |
| 25 to 29 Years | 667 (7.8%) | 606 (6.7%) |
| 30 to 34 Years | 713 (8.3%) | 831 (9.2%) |
| 35 to 39 Years | 781 (9.1%) | 522 (5.8%) |
| 40 to 44 Years | 460 (5.4%) | 713 (7.9%) |
| 45 to 49 Years | 636 (7.4%) | 782 (8.6%) |
| 50 to 54 Years | 736 (8.6%) | 610 (6.7%) |
| 55 to 59 Years | 496 (5.8%) | 784 (8.7%) |
| 60 to 64 Years | 607 (7.1%) | 568 (6.3%) |
| 65 to 69 Years | 338 (3.9%) | 461 (5.1%) |
| 70 to 74 Years | 226 (2.6%) | 269 (3.0%) |
| 75 to 79 Years | 123 (1.4%) | 163 (1.8%) |
| 80 to 84 Years | 22 (0.3%) | 132 (1.5%) |
| 85 Years and over | 77 (0.9%) | 167 (1.8%) |
| Total | 8,590 (100.0%) | 9,054 (100.0%) |
Families and Households in Mount Holly
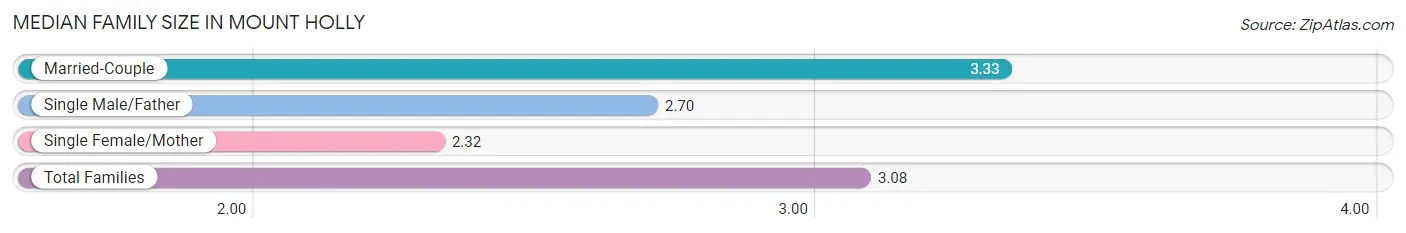
Median Family Size in Mount Holly
The median family size in Mount Holly is 3.08 persons per family, with married-couple families (3,412 | 72.2%) accounting for the largest median family size of 3.33 persons per family. On the other hand, single female/mother families (979 | 20.7%) represent the smallest median family size with 2.32 persons per family.
| Family Type | # Families | Family Size |
| Married-Couple | 3,412 (72.2%) | 3.33 |
| Single Male/Father | 335 (7.1%) | 2.70 |
| Single Female/Mother | 979 (20.7%) | 2.32 |
| Total Families | 4,726 (100.0%) | 3.08 |
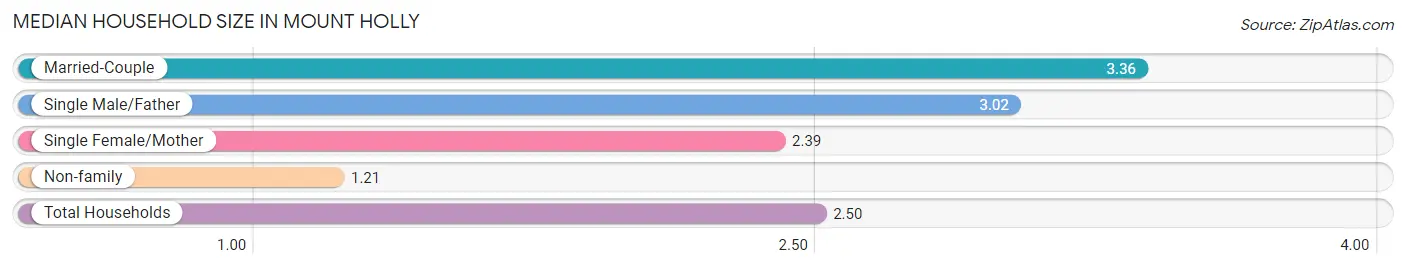
Median Household Size in Mount Holly
The median household size in Mount Holly is 2.50 persons per household, with married-couple households (3,412 | 48.5%) accounting for the largest median household size of 3.36 persons per household. non-family households (2,311 | 32.8%) represent the smallest median household size with 1.21 persons per household.
| Household Type | # Households | Household Size |
| Married-Couple | 3,412 (48.5%) | 3.36 |
| Single Male/Father | 335 (4.8%) | 3.02 |
| Single Female/Mother | 979 (13.9%) | 2.39 |
| Non-family | 2,311 (32.8%) | 1.21 |
| Total Households | 7,037 (100.0%) | 2.50 |
Household Size by Marriage Status in Mount Holly
Out of a total of 7,037 households in Mount Holly, 4,726 (67.2%) are family households, while 2,311 (32.8%) are nonfamily households. The most numerous type of family households are 2-person households, comprising 2,117, and the most common type of nonfamily households are 1-person households, comprising 1,901.
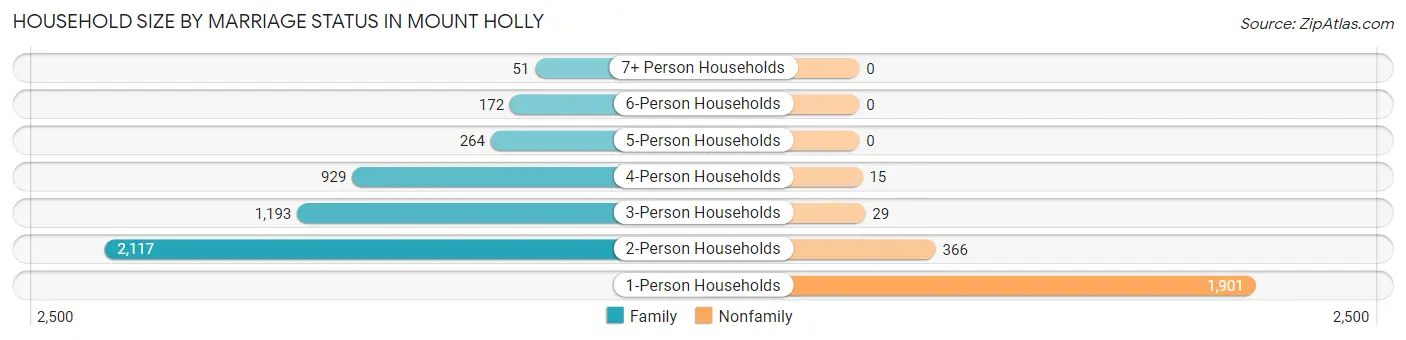
| Household Size | Family Households | Nonfamily Households |
| 1-Person Households | - | 1,901 (27.0%) |
| 2-Person Households | 2,117 (30.1%) | 366 (5.2%) |
| 3-Person Households | 1,193 (17.0%) | 29 (0.4%) |
| 4-Person Households | 929 (13.2%) | 15 (0.2%) |
| 5-Person Households | 264 (3.7%) | 0 (0.0%) |
| 6-Person Households | 172 (2.4%) | 0 (0.0%) |
| 7+ Person Households | 51 (0.7%) | 0 (0.0%) |
| Total | 4,726 (67.2%) | 2,311 (32.8%) |
Female Fertility in Mount Holly
Fertility by Age in Mount Holly
Average fertility rate in Mount Holly is 52.0 births per 1,000 women. Women in the age bracket of 20 to 34 years have the highest fertility rate with 69.0 births per 1,000 women. Women in the age bracket of 20 to 34 years acount for 57.6% of all women with births.
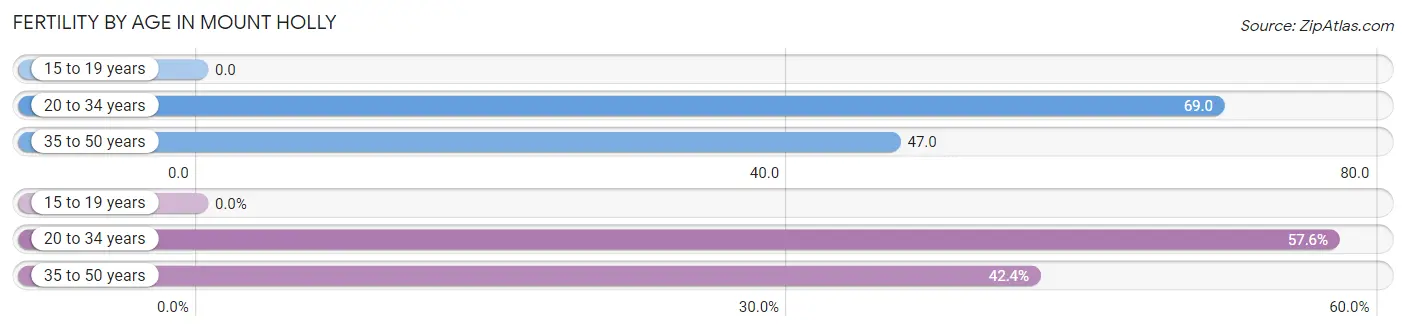
| Age Bracket | Women with Births | Births / 1,000 Women |
| 15 to 19 years | 0 (0.0%) | 0.0 |
| 20 to 34 years | 140 (57.6%) | 69.0 |
| 35 to 50 years | 103 (42.4%) | 47.0 |
| Total | 243 (100.0%) | 52.0 |
Fertility by Age by Marriage Status in Mount Holly
42.0% of women with births (243) in Mount Holly are married. The highest percentage of unmarried women with births falls into 35 to 50 years age bracket with 83.5% of them unmarried at the time of birth, while the lowest percentage of unmarried women with births belong to 20 to 34 years age bracket with 39.3% of them unmarried.
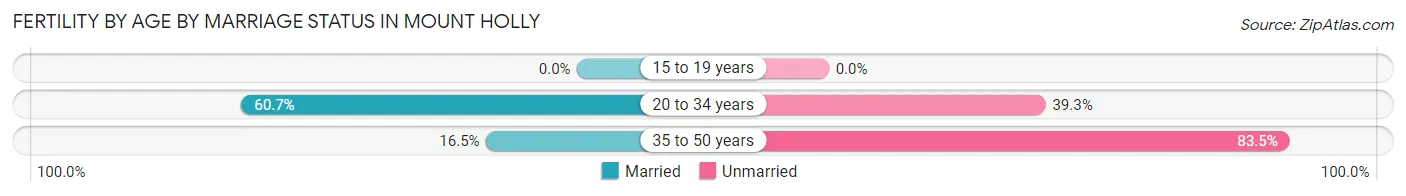
| Age Bracket | Married | Unmarried |
| 15 to 19 years | 0 (0.0%) | 0 (0.0%) |
| 20 to 34 years | 85 (60.7%) | 55 (39.3%) |
| 35 to 50 years | 17 (16.5%) | 86 (83.5%) |
| Total | 102 (42.0%) | 141 (58.0%) |
Fertility by Education in Mount Holly
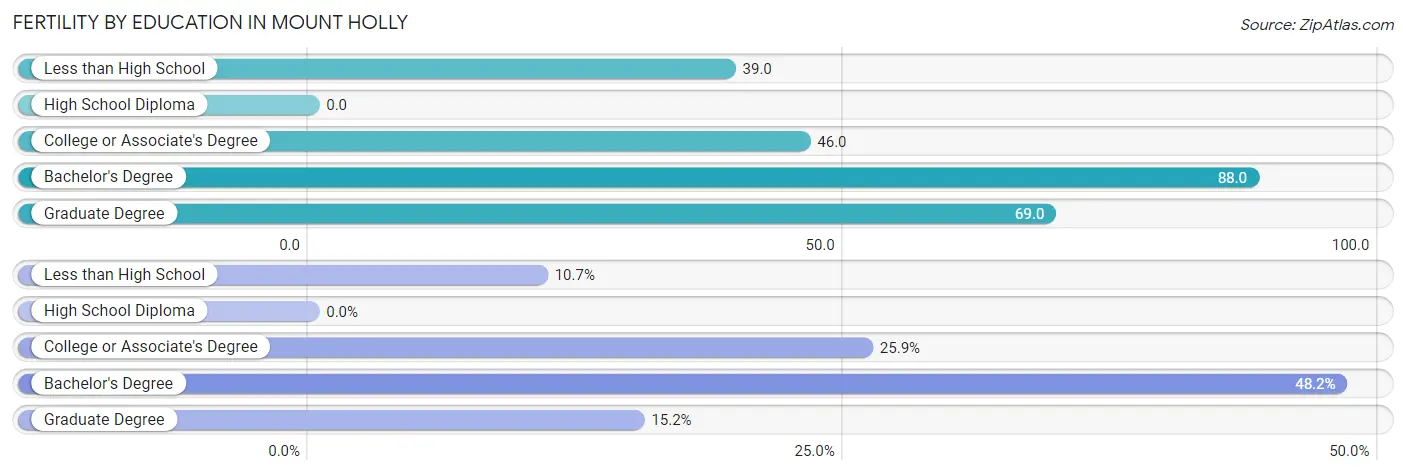
| Educational Attainment | Women with Births | Births / 1,000 Women |
| Less than High School | 26 (10.7%) | 39.0 |
| High School Diploma | 0 (0.0%) | 0.0 |
| College or Associate's Degree | 63 (25.9%) | 46.0 |
| Bachelor's Degree | 117 (48.1%) | 88.0 |
| Graduate Degree | 37 (15.2%) | 69.0 |
| Total | 243 (100.0%) | 52.0 |
Fertility by Education by Marriage Status in Mount Holly
58.0% of women with births in Mount Holly are unmarried. Women with the educational attainment of less than high school are most likely to be married with 100.0% of them married at childbirth, while women with the educational attainment of bachelor's degree are least likely to be married with 82.9% of them unmarried at childbirth.
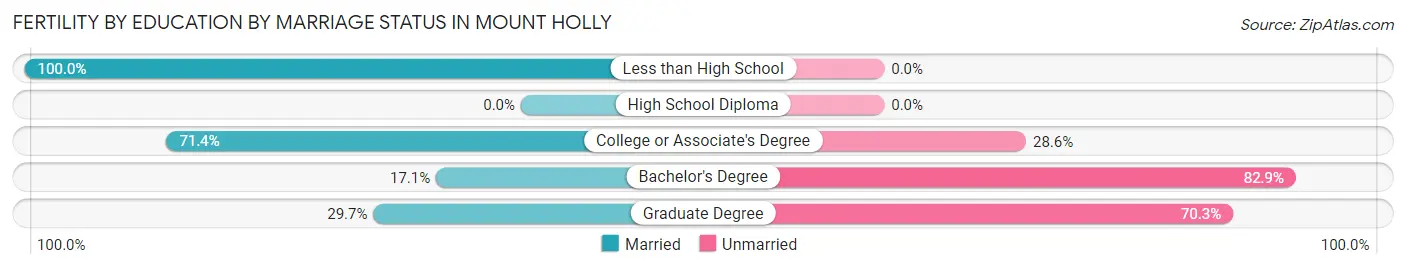
| Educational Attainment | Married | Unmarried |
| Less than High School | 26 (100.0%) | 0 (0.0%) |
| High School Diploma | 0 (0.0%) | 0 (0.0%) |
| College or Associate's Degree | 45 (71.4%) | 18 (28.6%) |
| Bachelor's Degree | 20 (17.1%) | 97 (82.9%) |
| Graduate Degree | 11 (29.7%) | 26 (70.3%) |
| Total | 102 (42.0%) | 141 (58.0%) |
Employment Characteristics in Mount Holly
Employment by Class of Employer in Mount Holly
Among the 9,129 employed individuals in Mount Holly, private company employees (7,025 | 76.9%), not-for-profit organizations (547 | 6.0%), and state government employees (392 | 4.3%) make up the most common classes of employment.
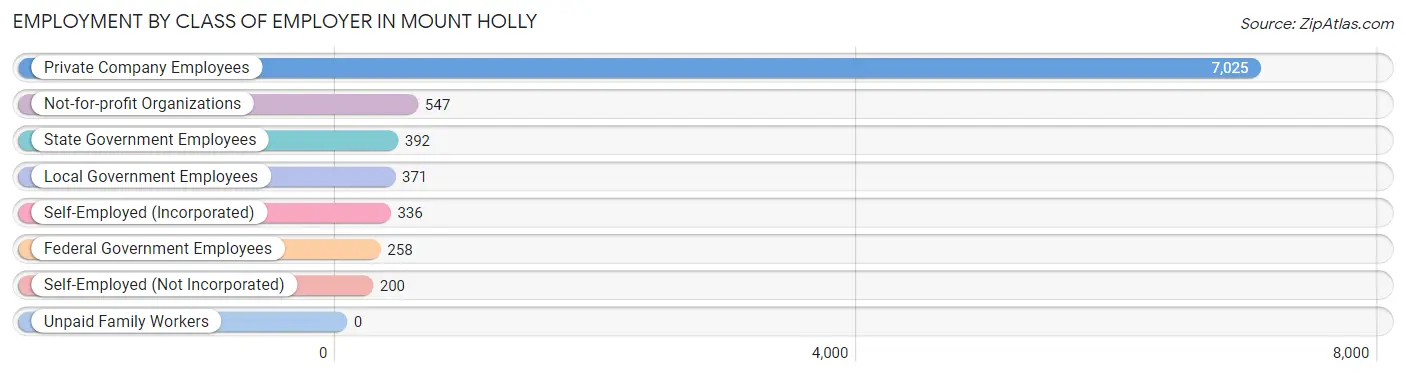
| Employer Class | # Employees | % Employees |
| Private Company Employees | 7,025 | 76.9% |
| Self-Employed (Incorporated) | 336 | 3.7% |
| Self-Employed (Not Incorporated) | 200 | 2.2% |
| Not-for-profit Organizations | 547 | 6.0% |
| Local Government Employees | 371 | 4.1% |
| State Government Employees | 392 | 4.3% |
| Federal Government Employees | 258 | 2.8% |
| Unpaid Family Workers | 0 | 0.0% |
| Total | 9,129 | 100.0% |
Employment Status by Age in Mount Holly
According to the labor force statistics for Mount Holly, out of the total population over 16 years of age (14,373), 71.6% or 10,291 individuals are in the labor force, with 6.5% or 669 of them unemployed. The age group with the highest labor force participation rate is 25 to 29 years, with 92.1% or 1,172 individuals in the labor force. Within the labor force, the 20 to 24 years age range has the highest percentage of unemployed individuals, with 23.2% or 242 of them being unemployed.
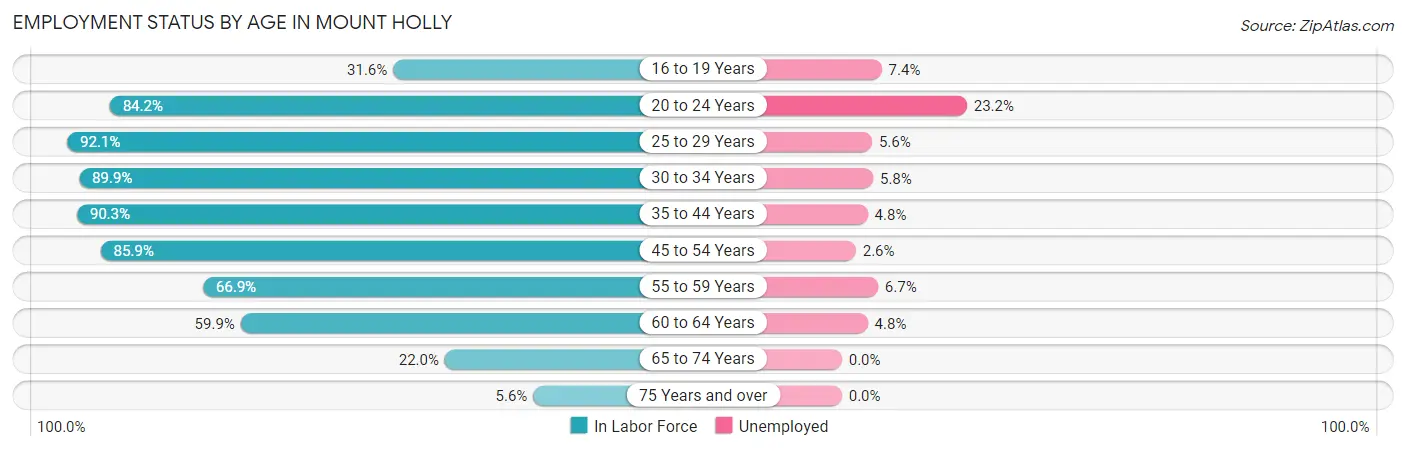
| Age Bracket | In Labor Force | Unemployed |
| 16 to 19 Years | 204 (31.6%) | 15 (7.4%) |
| 20 to 24 Years | 1,042 (84.2%) | 242 (23.2%) |
| 25 to 29 Years | 1,172 (92.1%) | 66 (5.6%) |
| 30 to 34 Years | 1,388 (89.9%) | 81 (5.8%) |
| 35 to 44 Years | 2,236 (90.3%) | 107 (4.8%) |
| 45 to 54 Years | 2,374 (85.9%) | 62 (2.6%) |
| 55 to 59 Years | 856 (66.9%) | 57 (6.7%) |
| 60 to 64 Years | 704 (59.9%) | 34 (4.8%) |
| 65 to 74 Years | 285 (22.0%) | 0 (0.0%) |
| 75 Years and over | 38 (5.6%) | 0 (0.0%) |
| Total | 10,291 (71.6%) | 669 (6.5%) |
Employment Status by Educational Attainment in Mount Holly
According to labor force statistics for Mount Holly, 83.0% of individuals (8,725) out of the total population between 25 and 64 years of age (10,512) are in the labor force, with 4.7% or 410 of them being unemployed. The group with the highest labor force participation rate are those with the educational attainment of high school diploma, with 86.8% or 1,881 individuals in the labor force. Within the labor force, individuals with high school diploma education have the highest percentage of unemployment, with 6.2% or 117 of them being unemployed.
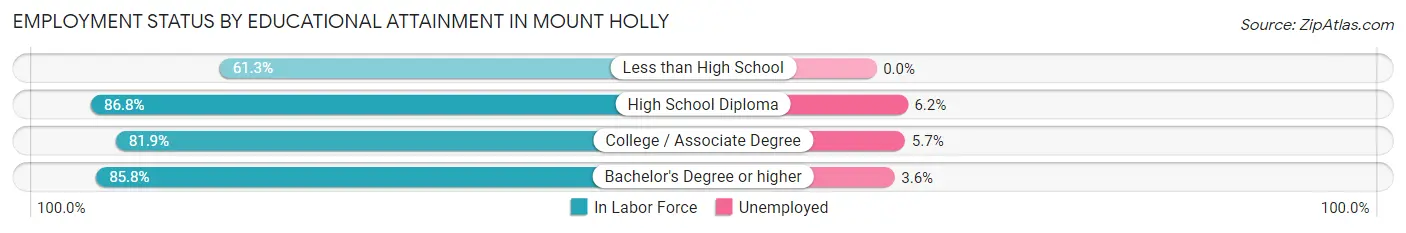
| Educational Attainment | In Labor Force | Unemployed |
| Less than High School | 433 (61.3%) | 0 (0.0%) |
| High School Diploma | 1,881 (86.8%) | 134 (6.2%) |
| College / Associate Degree | 2,863 (81.9%) | 199 (5.7%) |
| Bachelor's Degree or higher | 3,555 (85.8%) | 149 (3.6%) |
| Total | 8,725 (83.0%) | 494 (4.7%) |
Employment Occupations by Sex in Mount Holly
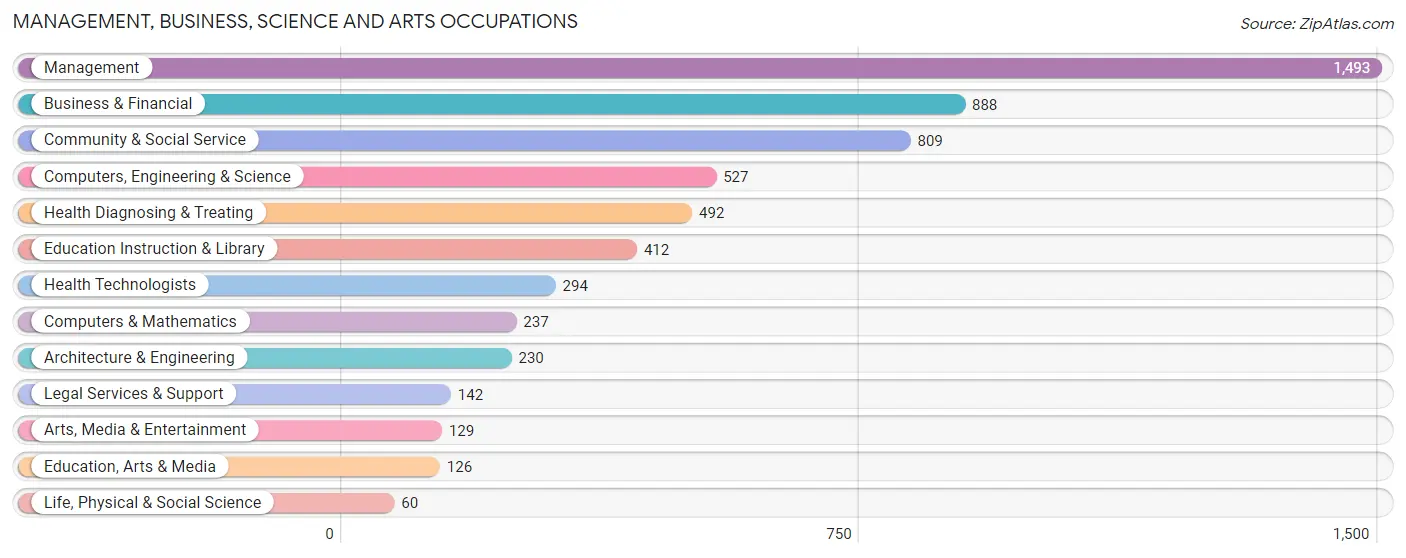
Management, Business, Science and Arts Occupations
The most common Management, Business, Science and Arts occupations in Mount Holly are Management (1,493 | 15.8%), Business & Financial (888 | 9.4%), Community & Social Service (809 | 8.6%), Computers, Engineering & Science (527 | 5.6%), and Health Diagnosing & Treating (492 | 5.2%).
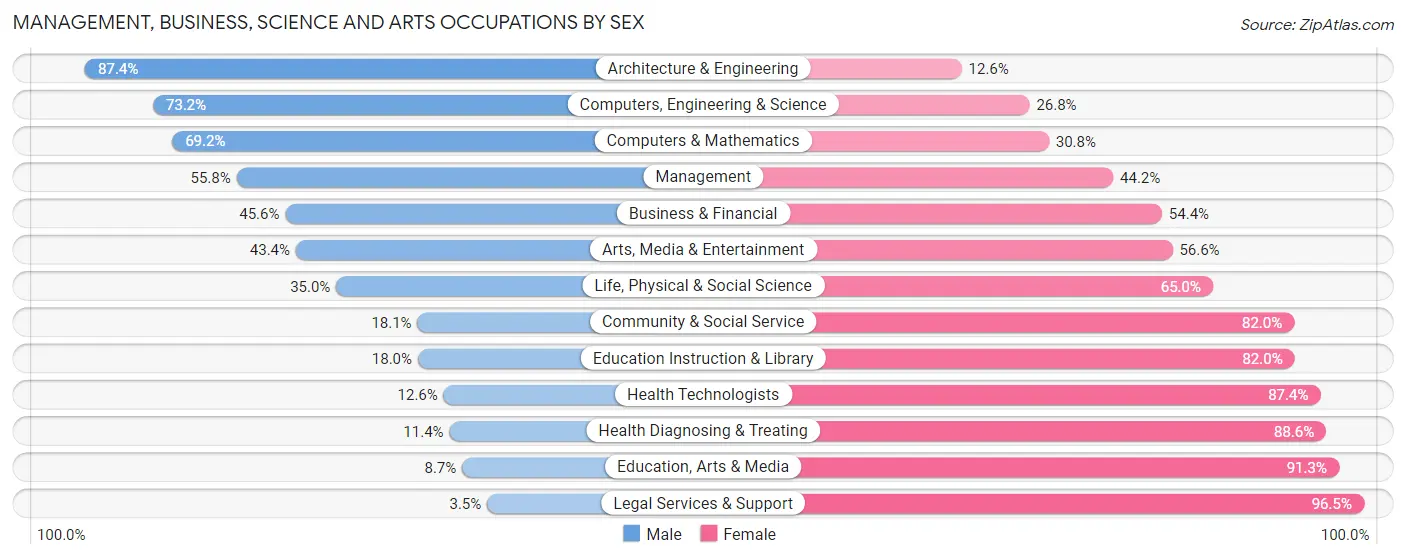
Management, Business, Science and Arts Occupations by Sex
Within the Management, Business, Science and Arts occupations in Mount Holly, the most male-oriented occupations are Architecture & Engineering (87.4%), Computers, Engineering & Science (73.2%), and Computers & Mathematics (69.2%), while the most female-oriented occupations are Legal Services & Support (96.5%), Education, Arts & Media (91.3%), and Health Diagnosing & Treating (88.6%).
| Occupation | Male | Female |
| Management | 833 (55.8%) | 660 (44.2%) |
| Business & Financial | 405 (45.6%) | 483 (54.4%) |
| Computers, Engineering & Science | 386 (73.2%) | 141 (26.8%) |
| Computers & Mathematics | 164 (69.2%) | 73 (30.8%) |
| Architecture & Engineering | 201 (87.4%) | 29 (12.6%) |
| Life, Physical & Social Science | 21 (35.0%) | 39 (65.0%) |
| Community & Social Service | 146 (18.0%) | 663 (82.0%) |
| Education, Arts & Media | 11 (8.7%) | 115 (91.3%) |
| Legal Services & Support | 5 (3.5%) | 137 (96.5%) |
| Education Instruction & Library | 74 (18.0%) | 338 (82.0%) |
| Arts, Media & Entertainment | 56 (43.4%) | 73 (56.6%) |
| Health Diagnosing & Treating | 56 (11.4%) | 436 (88.6%) |
| Health Technologists | 37 (12.6%) | 257 (87.4%) |
| Total (Category) | 1,826 (43.4%) | 2,383 (56.6%) |
| Total (Overall) | 4,904 (51.9%) | 4,545 (48.1%) |
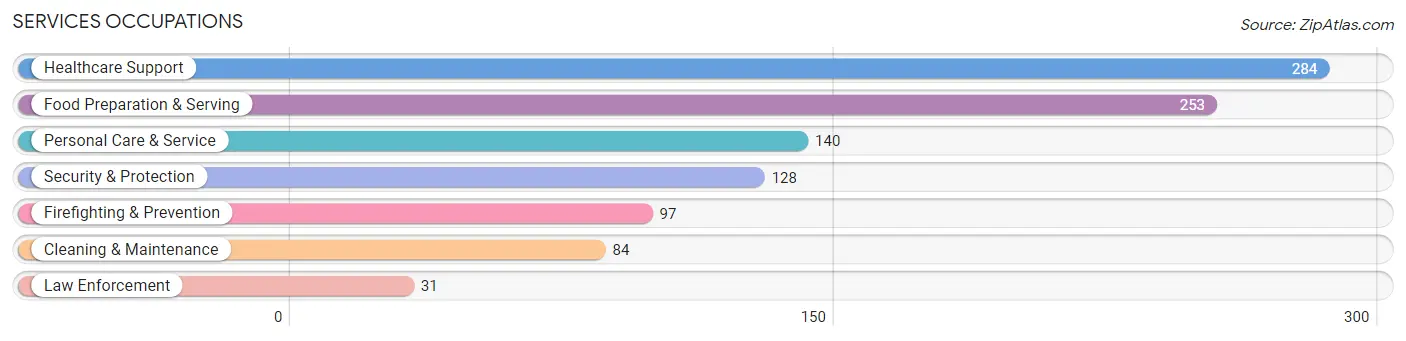
Services Occupations
The most common Services occupations in Mount Holly are Healthcare Support (284 | 3.0%), Food Preparation & Serving (253 | 2.7%), Personal Care & Service (140 | 1.5%), Security & Protection (128 | 1.3%), and Firefighting & Prevention (97 | 1.0%).
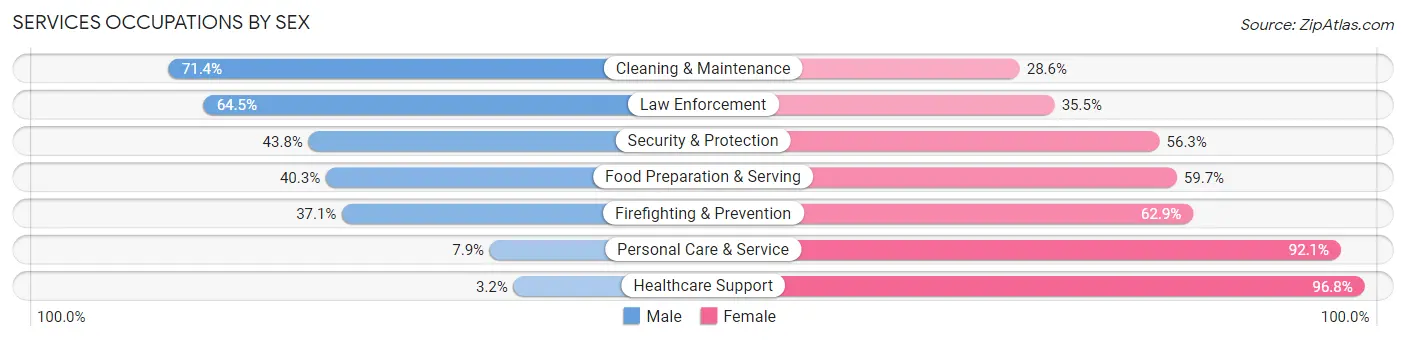
Services Occupations by Sex
Within the Services occupations in Mount Holly, the most male-oriented occupations are Cleaning & Maintenance (71.4%), Law Enforcement (64.5%), and Security & Protection (43.8%), while the most female-oriented occupations are Healthcare Support (96.8%), Personal Care & Service (92.1%), and Firefighting & Prevention (62.9%).
| Occupation | Male | Female |
| Healthcare Support | 9 (3.2%) | 275 (96.8%) |
| Security & Protection | 56 (43.8%) | 72 (56.2%) |
| Firefighting & Prevention | 36 (37.1%) | 61 (62.9%) |
| Law Enforcement | 20 (64.5%) | 11 (35.5%) |
| Food Preparation & Serving | 102 (40.3%) | 151 (59.7%) |
| Cleaning & Maintenance | 60 (71.4%) | 24 (28.6%) |
| Personal Care & Service | 11 (7.9%) | 129 (92.1%) |
| Total (Category) | 238 (26.8%) | 651 (73.2%) |
| Total (Overall) | 4,904 (51.9%) | 4,545 (48.1%) |
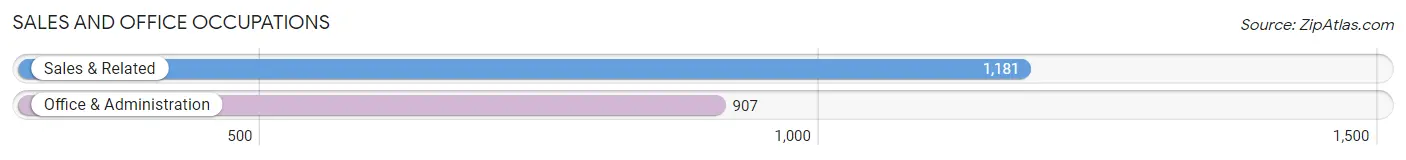
Sales and Office Occupations
The most common Sales and Office occupations in Mount Holly are Sales & Related (1,181 | 12.5%), and Office & Administration (907 | 9.6%).
Sales and Office Occupations by Sex
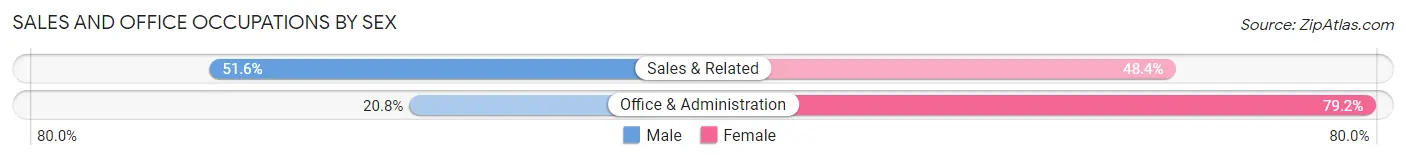
| Occupation | Male | Female |
| Sales & Related | 609 (51.6%) | 572 (48.4%) |
| Office & Administration | 189 (20.8%) | 718 (79.2%) |
| Total (Category) | 798 (38.2%) | 1,290 (61.8%) |
| Total (Overall) | 4,904 (51.9%) | 4,545 (48.1%) |
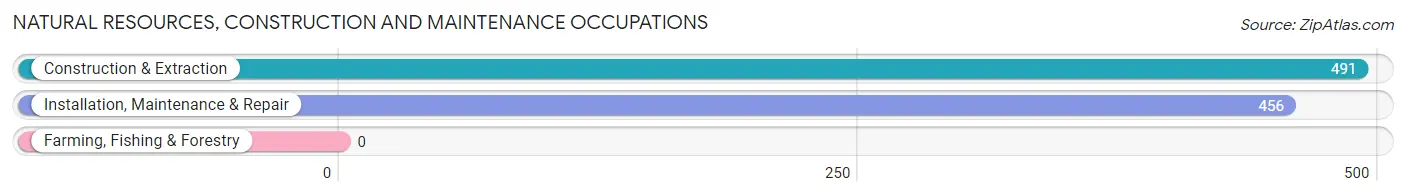
Natural Resources, Construction and Maintenance Occupations
The most common Natural Resources, Construction and Maintenance occupations in Mount Holly are Construction & Extraction (491 | 5.2%), and Installation, Maintenance & Repair (456 | 4.8%).
Natural Resources, Construction and Maintenance Occupations by Sex
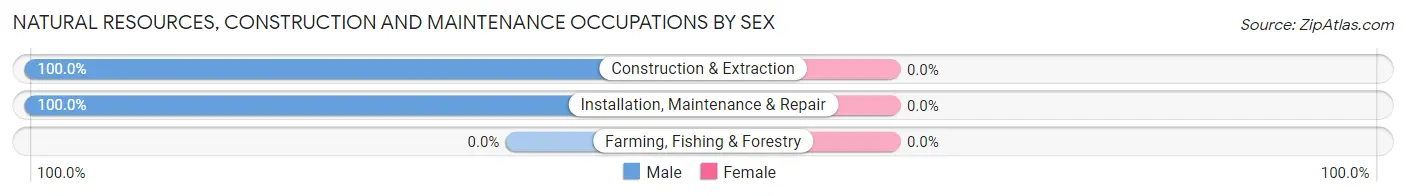
| Occupation | Male | Female |
| Farming, Fishing & Forestry | 0 (0.0%) | 0 (0.0%) |
| Construction & Extraction | 491 (100.0%) | 0 (0.0%) |
| Installation, Maintenance & Repair | 456 (100.0%) | 0 (0.0%) |
| Total (Category) | 947 (100.0%) | 0 (0.0%) |
| Total (Overall) | 4,904 (51.9%) | 4,545 (48.1%) |
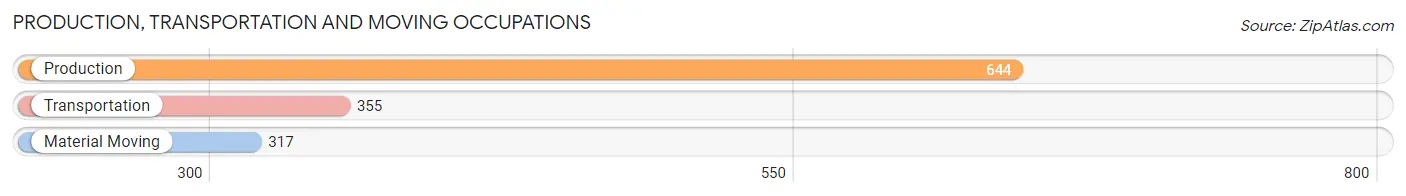
Production, Transportation and Moving Occupations
The most common Production, Transportation and Moving occupations in Mount Holly are Production (644 | 6.8%), Transportation (355 | 3.8%), and Material Moving (317 | 3.4%).
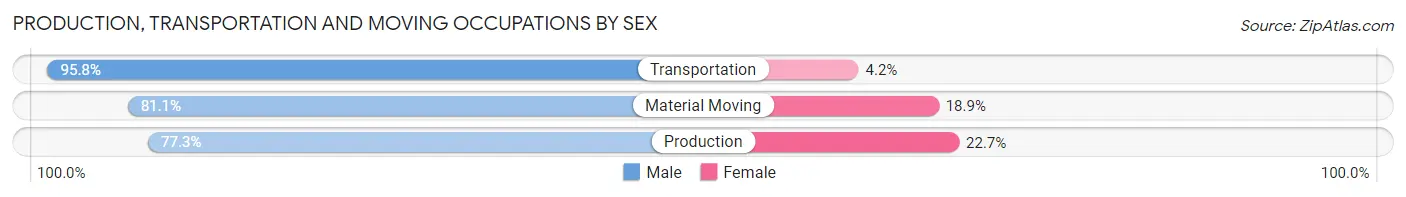
Production, Transportation and Moving Occupations by Sex
| Occupation | Male | Female |
| Production | 498 (77.3%) | 146 (22.7%) |
| Transportation | 340 (95.8%) | 15 (4.2%) |
| Material Moving | 257 (81.1%) | 60 (18.9%) |
| Total (Category) | 1,095 (83.2%) | 221 (16.8%) |
| Total (Overall) | 4,904 (51.9%) | 4,545 (48.1%) |
Employment Industries by Sex in Mount Holly
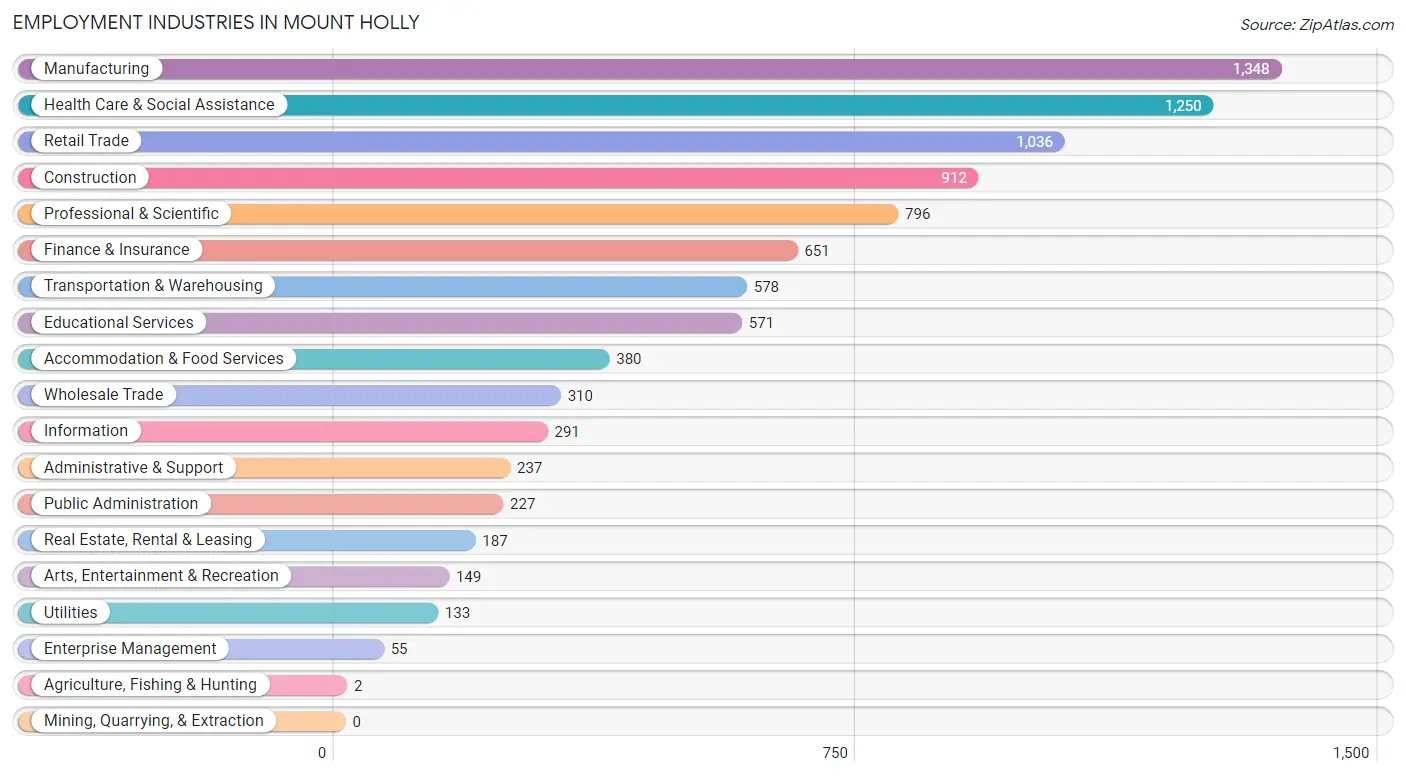
Employment Industries in Mount Holly
The major employment industries in Mount Holly include Manufacturing (1,348 | 14.3%), Health Care & Social Assistance (1,250 | 13.2%), Retail Trade (1,036 | 11.0%), Construction (912 | 9.7%), and Professional & Scientific (796 | 8.4%).
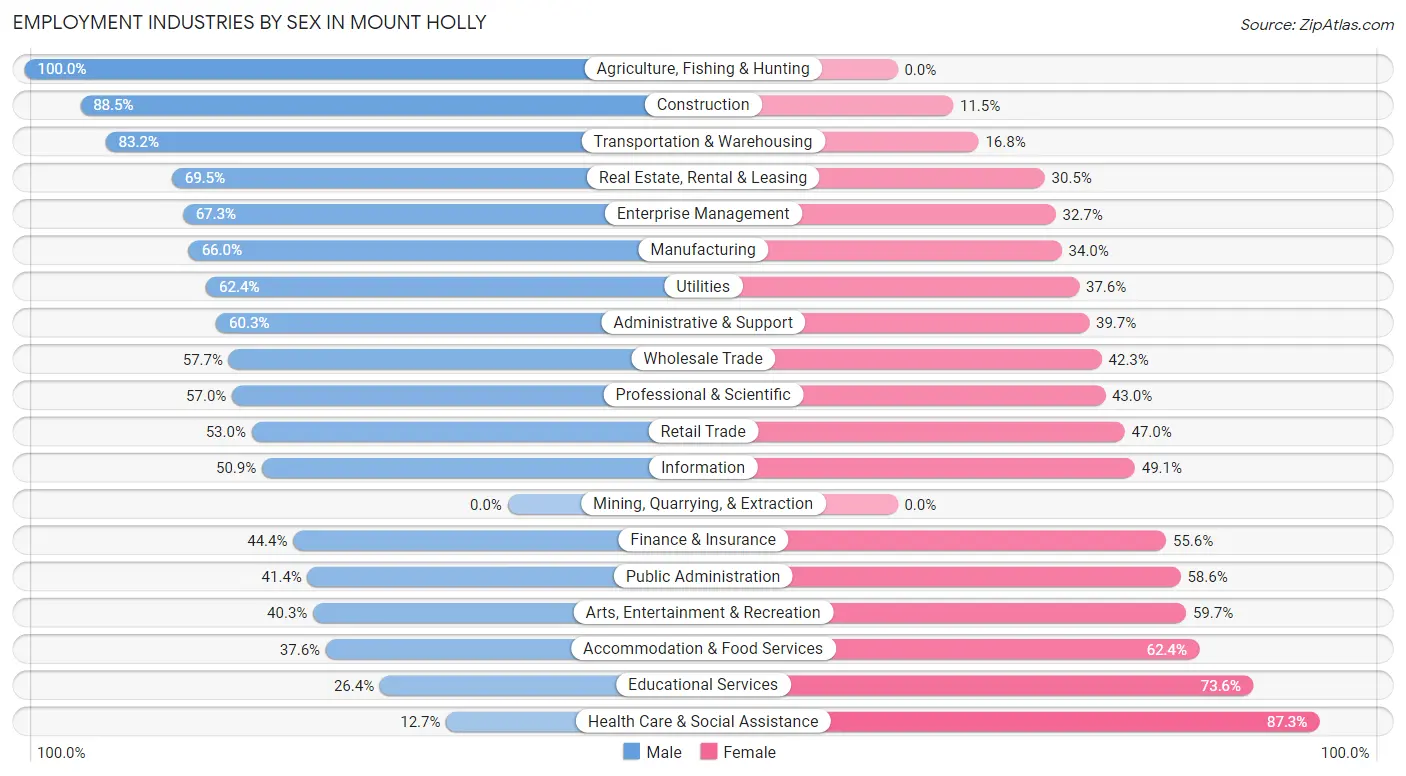
Employment Industries by Sex in Mount Holly
The Mount Holly industries that see more men than women are Agriculture, Fishing & Hunting (100.0%), Construction (88.5%), and Transportation & Warehousing (83.2%), whereas the industries that tend to have a higher number of women are Health Care & Social Assistance (87.3%), Educational Services (73.6%), and Accommodation & Food Services (62.4%).
| Industry | Male | Female |
| Agriculture, Fishing & Hunting | 2 (100.0%) | 0 (0.0%) |
| Mining, Quarrying, & Extraction | 0 (0.0%) | 0 (0.0%) |
| Construction | 807 (88.5%) | 105 (11.5%) |
| Manufacturing | 890 (66.0%) | 458 (34.0%) |
| Wholesale Trade | 179 (57.7%) | 131 (42.3%) |
| Retail Trade | 549 (53.0%) | 487 (47.0%) |
| Transportation & Warehousing | 481 (83.2%) | 97 (16.8%) |
| Utilities | 83 (62.4%) | 50 (37.6%) |
| Information | 148 (50.9%) | 143 (49.1%) |
| Finance & Insurance | 289 (44.4%) | 362 (55.6%) |
| Real Estate, Rental & Leasing | 130 (69.5%) | 57 (30.5%) |
| Professional & Scientific | 454 (57.0%) | 342 (43.0%) |
| Enterprise Management | 37 (67.3%) | 18 (32.7%) |
| Administrative & Support | 143 (60.3%) | 94 (39.7%) |
| Educational Services | 151 (26.4%) | 420 (73.6%) |
| Health Care & Social Assistance | 159 (12.7%) | 1,091 (87.3%) |
| Arts, Entertainment & Recreation | 60 (40.3%) | 89 (59.7%) |
| Accommodation & Food Services | 143 (37.6%) | 237 (62.4%) |
| Public Administration | 94 (41.4%) | 133 (58.6%) |
| Total | 4,904 (51.9%) | 4,545 (48.1%) |
Education in Mount Holly
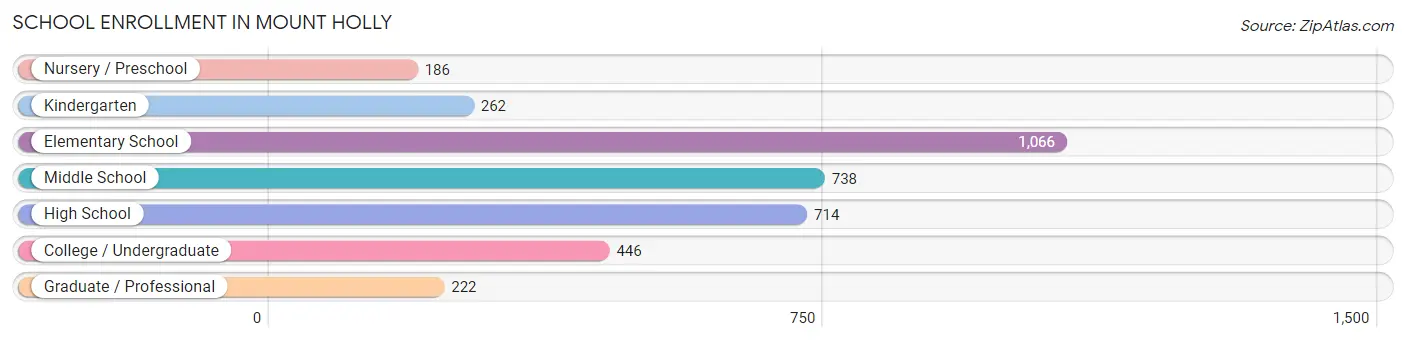
School Enrollment in Mount Holly
The most common levels of schooling among the 3,634 students in Mount Holly are elementary school (1,066 | 29.3%), middle school (738 | 20.3%), and high school (714 | 19.7%).
| School Level | # Students | % Students |
| Nursery / Preschool | 186 | 5.1% |
| Kindergarten | 262 | 7.2% |
| Elementary School | 1,066 | 29.3% |
| Middle School | 738 | 20.3% |
| High School | 714 | 19.7% |
| College / Undergraduate | 446 | 12.3% |
| Graduate / Professional | 222 | 6.1% |
| Total | 3,634 | 100.0% |
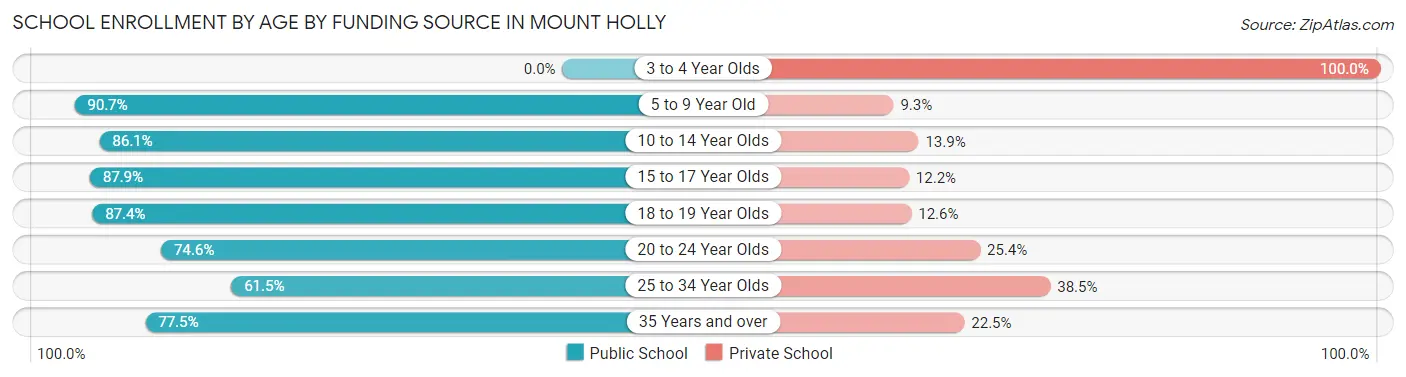
School Enrollment by Age by Funding Source in Mount Holly
Out of a total of 3,634 students who are enrolled in schools in Mount Holly, 661 (18.2%) attend a private institution, while the remaining 2,973 (81.8%) are enrolled in public schools. The age group of 3 to 4 year olds has the highest likelihood of being enrolled in private schools, with 143 (100.0% in the age bracket) enrolled. Conversely, the age group of 5 to 9 year old has the lowest likelihood of being enrolled in a private school, with 1,056 (90.7% in the age bracket) attending a public institution.
| Age Bracket | Public School | Private School |
| 3 to 4 Year Olds | 0 (0.0%) | 143 (100.0%) |
| 5 to 9 Year Old | 1,056 (90.7%) | 108 (9.3%) |
| 10 to 14 Year Olds | 871 (86.1%) | 141 (13.9%) |
| 15 to 17 Year Olds | 506 (87.8%) | 70 (12.1%) |
| 18 to 19 Year Olds | 111 (87.4%) | 16 (12.6%) |
| 20 to 24 Year Olds | 182 (74.6%) | 62 (25.4%) |
| 25 to 34 Year Olds | 147 (61.5%) | 92 (38.5%) |
| 35 Years and over | 100 (77.5%) | 29 (22.5%) |
| Total | 2,973 (81.8%) | 661 (18.2%) |
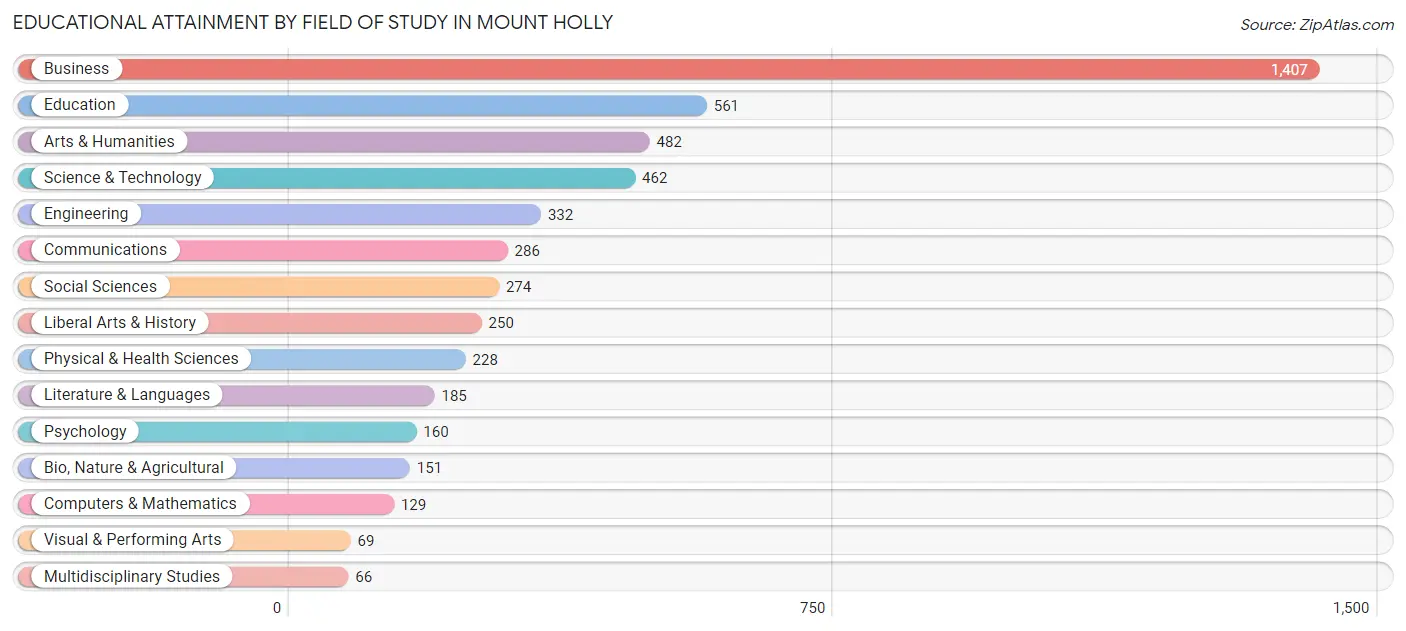
Educational Attainment by Field of Study in Mount Holly
Business (1,407 | 27.9%), education (561 | 11.1%), arts & humanities (482 | 9.6%), science & technology (462 | 9.2%), and engineering (332 | 6.6%) are the most common fields of study among 5,042 individuals in Mount Holly who have obtained a bachelor's degree or higher.
| Field of Study | # Graduates | % Graduates |
| Computers & Mathematics | 129 | 2.6% |
| Bio, Nature & Agricultural | 151 | 3.0% |
| Physical & Health Sciences | 228 | 4.5% |
| Psychology | 160 | 3.2% |
| Social Sciences | 274 | 5.4% |
| Engineering | 332 | 6.6% |
| Multidisciplinary Studies | 66 | 1.3% |
| Science & Technology | 462 | 9.2% |
| Business | 1,407 | 27.9% |
| Education | 561 | 11.1% |
| Literature & Languages | 185 | 3.7% |
| Liberal Arts & History | 250 | 5.0% |
| Visual & Performing Arts | 69 | 1.4% |
| Communications | 286 | 5.7% |
| Arts & Humanities | 482 | 9.6% |
| Total | 5,042 | 100.0% |
Transportation & Commute in Mount Holly
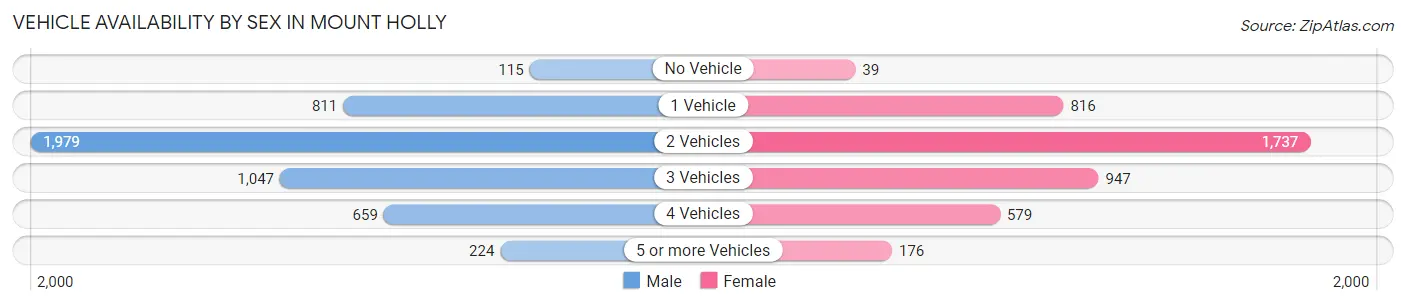
Vehicle Availability by Sex in Mount Holly
The most prevalent vehicle ownership categories in Mount Holly are males with 2 vehicles (1,979, accounting for 40.9%) and females with 2 vehicles (1,737, making up 46.1%).
| Vehicles Available | Male | Female |
| No Vehicle | 115 (2.4%) | 39 (0.9%) |
| 1 Vehicle | 811 (16.8%) | 816 (19.0%) |
| 2 Vehicles | 1,979 (40.9%) | 1,737 (40.5%) |
| 3 Vehicles | 1,047 (21.6%) | 947 (22.1%) |
| 4 Vehicles | 659 (13.6%) | 579 (13.5%) |
| 5 or more Vehicles | 224 (4.6%) | 176 (4.1%) |
| Total | 4,835 (100.0%) | 4,294 (100.0%) |
Commute Time in Mount Holly
The most frequently occuring commute durations in Mount Holly are 30 to 34 minutes (2,058 commuters, 26.3%), 20 to 24 minutes (1,098 commuters, 14.0%), and 45 to 59 minutes (861 commuters, 11.0%).
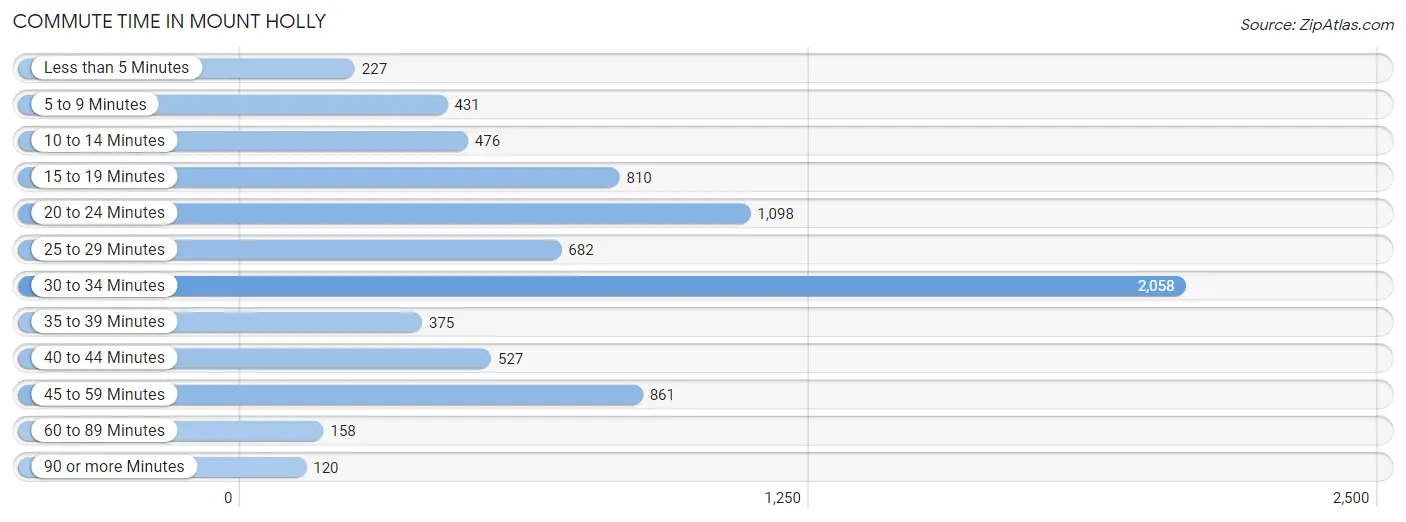
| Commute Time | # Commuters | % Commuters |
| Less than 5 Minutes | 227 | 2.9% |
| 5 to 9 Minutes | 431 | 5.5% |
| 10 to 14 Minutes | 476 | 6.1% |
| 15 to 19 Minutes | 810 | 10.3% |
| 20 to 24 Minutes | 1,098 | 14.0% |
| 25 to 29 Minutes | 682 | 8.7% |
| 30 to 34 Minutes | 2,058 | 26.3% |
| 35 to 39 Minutes | 375 | 4.8% |
| 40 to 44 Minutes | 527 | 6.7% |
| 45 to 59 Minutes | 861 | 11.0% |
| 60 to 89 Minutes | 158 | 2.0% |
| 90 or more Minutes | 120 | 1.5% |
Commute Time by Sex in Mount Holly
The most common commute times in Mount Holly are 30 to 34 minutes (1,233 commuters, 28.8%) for males and 30 to 34 minutes (825 commuters, 23.3%) for females.
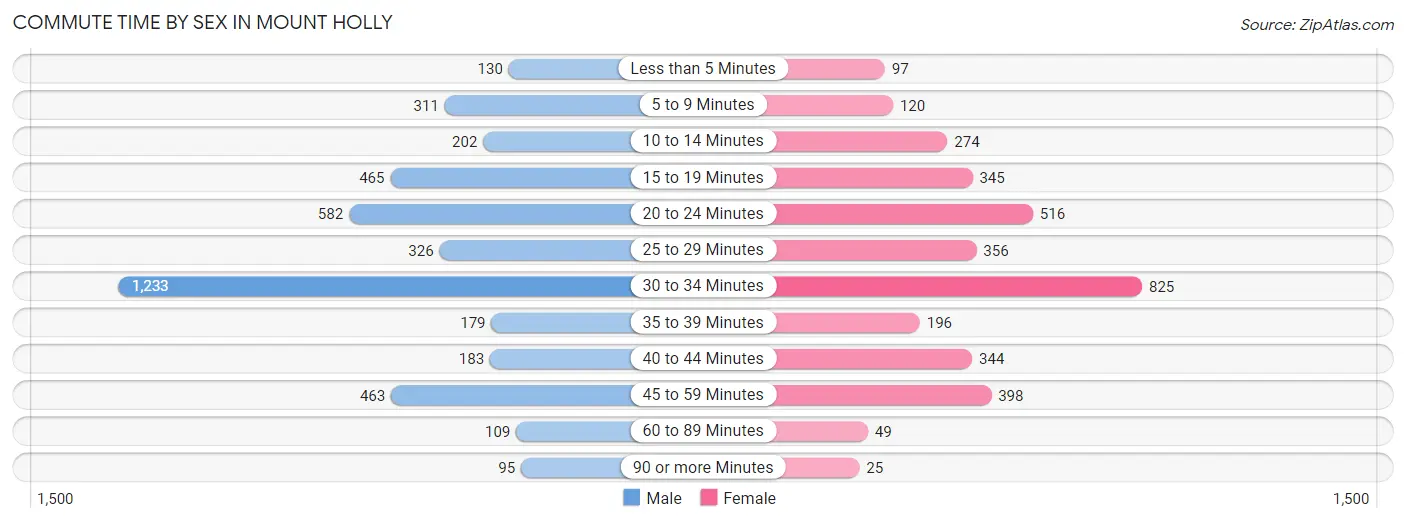
| Commute Time | Male | Female |
| Less than 5 Minutes | 130 (3.0%) | 97 (2.7%) |
| 5 to 9 Minutes | 311 (7.3%) | 120 (3.4%) |
| 10 to 14 Minutes | 202 (4.7%) | 274 (7.7%) |
| 15 to 19 Minutes | 465 (10.9%) | 345 (9.7%) |
| 20 to 24 Minutes | 582 (13.6%) | 516 (14.6%) |
| 25 to 29 Minutes | 326 (7.6%) | 356 (10.0%) |
| 30 to 34 Minutes | 1,233 (28.8%) | 825 (23.3%) |
| 35 to 39 Minutes | 179 (4.2%) | 196 (5.5%) |
| 40 to 44 Minutes | 183 (4.3%) | 344 (9.7%) |
| 45 to 59 Minutes | 463 (10.8%) | 398 (11.2%) |
| 60 to 89 Minutes | 109 (2.5%) | 49 (1.4%) |
| 90 or more Minutes | 95 (2.2%) | 25 (0.7%) |
Time of Departure to Work by Sex in Mount Holly
The most frequent times of departure to work in Mount Holly are 7:00 AM to 7:29 AM (867, 20.3%) for males and 7:30 AM to 7:59 AM (640, 18.0%) for females.
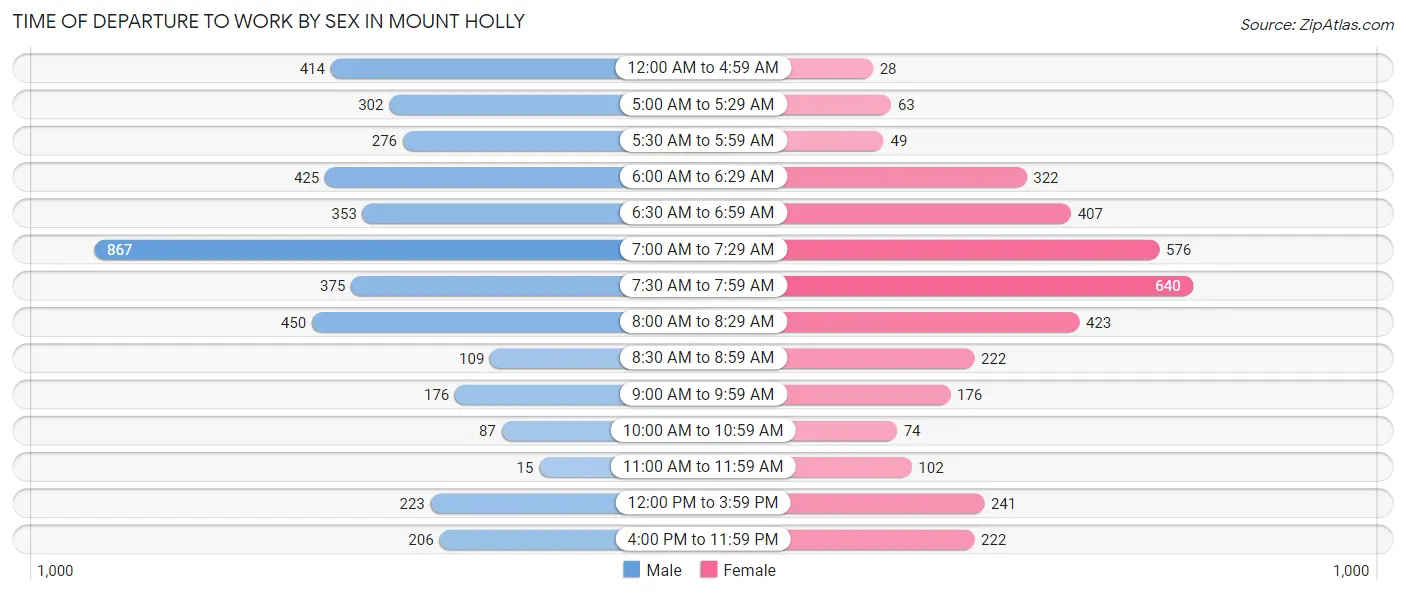
| Time of Departure | Male | Female |
| 12:00 AM to 4:59 AM | 414 (9.7%) | 28 (0.8%) |
| 5:00 AM to 5:29 AM | 302 (7.1%) | 63 (1.8%) |
| 5:30 AM to 5:59 AM | 276 (6.5%) | 49 (1.4%) |
| 6:00 AM to 6:29 AM | 425 (9.9%) | 322 (9.1%) |
| 6:30 AM to 6:59 AM | 353 (8.3%) | 407 (11.5%) |
| 7:00 AM to 7:29 AM | 867 (20.3%) | 576 (16.3%) |
| 7:30 AM to 7:59 AM | 375 (8.8%) | 640 (18.0%) |
| 8:00 AM to 8:29 AM | 450 (10.5%) | 423 (11.9%) |
| 8:30 AM to 8:59 AM | 109 (2.5%) | 222 (6.3%) |
| 9:00 AM to 9:59 AM | 176 (4.1%) | 176 (5.0%) |
| 10:00 AM to 10:59 AM | 87 (2.0%) | 74 (2.1%) |
| 11:00 AM to 11:59 AM | 15 (0.4%) | 102 (2.9%) |
| 12:00 PM to 3:59 PM | 223 (5.2%) | 241 (6.8%) |
| 4:00 PM to 11:59 PM | 206 (4.8%) | 222 (6.3%) |
| Total | 4,278 (100.0%) | 3,545 (100.0%) |
Housing Occupancy in Mount Holly
Occupancy by Ownership in Mount Holly
Of the total 7,037 dwellings in Mount Holly, owner-occupied units account for 4,867 (69.2%), while renter-occupied units make up 2,170 (30.8%).
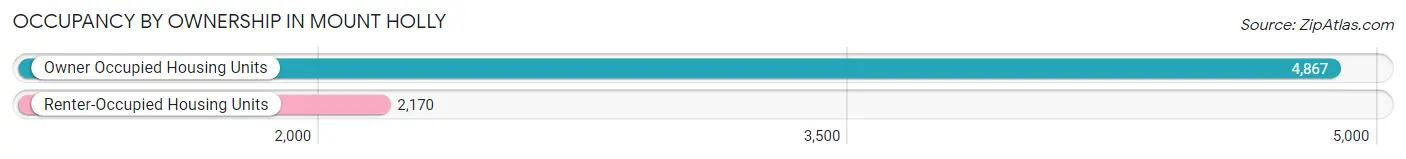
| Occupancy | # Housing Units | % Housing Units |
| Owner Occupied Housing Units | 4,867 | 69.2% |
| Renter-Occupied Housing Units | 2,170 | 30.8% |
| Total Occupied Housing Units | 7,037 | 100.0% |
Occupancy by Household Size in Mount Holly
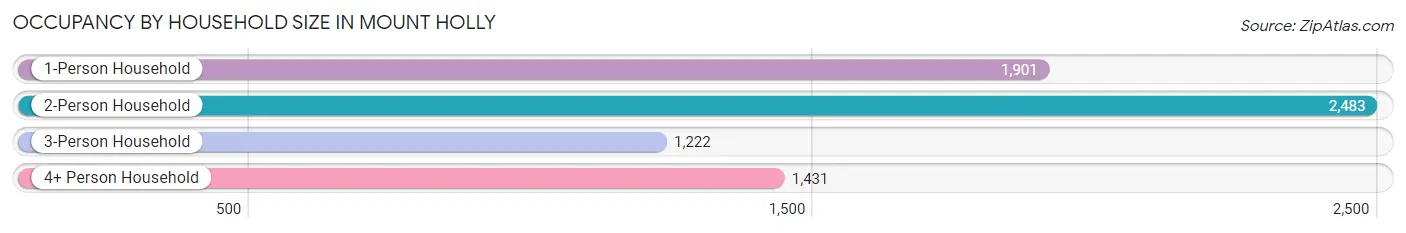
| Household Size | # Housing Units | % Housing Units |
| 1-Person Household | 1,901 | 27.0% |
| 2-Person Household | 2,483 | 35.3% |
| 3-Person Household | 1,222 | 17.4% |
| 4+ Person Household | 1,431 | 20.3% |
| Total Housing Units | 7,037 | 100.0% |
Occupancy by Ownership by Household Size in Mount Holly
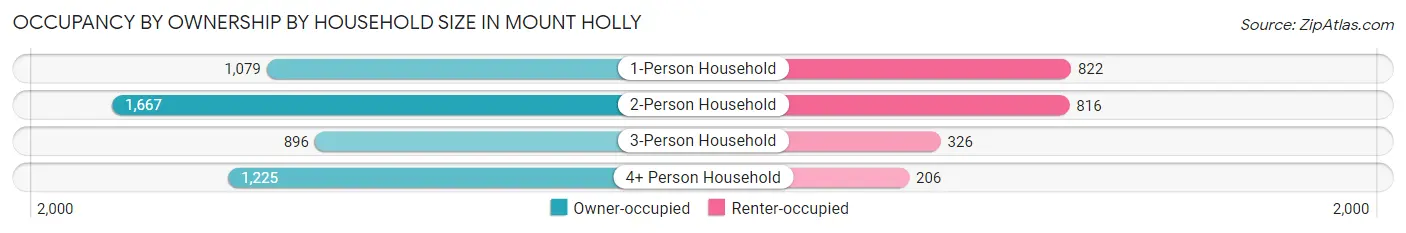
| Household Size | Owner-occupied | Renter-occupied |
| 1-Person Household | 1,079 (56.8%) | 822 (43.2%) |
| 2-Person Household | 1,667 (67.1%) | 816 (32.9%) |
| 3-Person Household | 896 (73.3%) | 326 (26.7%) |
| 4+ Person Household | 1,225 (85.6%) | 206 (14.4%) |
| Total Housing Units | 4,867 (69.2%) | 2,170 (30.8%) |
Occupancy by Educational Attainment in Mount Holly
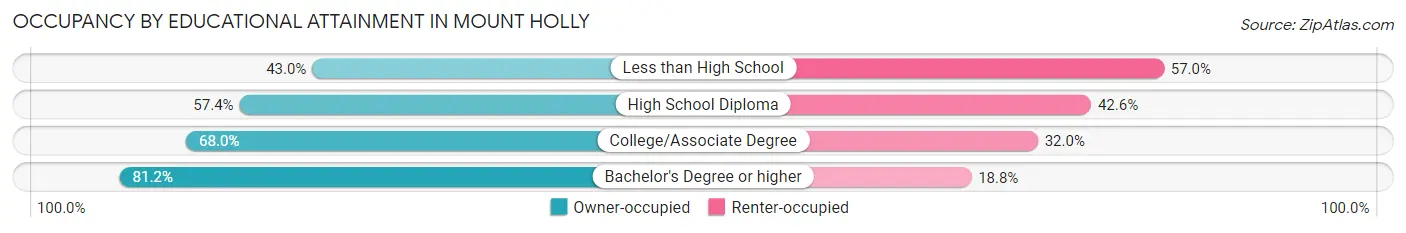
| Household Size | Owner-occupied | Renter-occupied |
| Less than High School | 260 (43.0%) | 345 (57.0%) |
| High School Diploma | 705 (57.4%) | 523 (42.6%) |
| College/Associate Degree | 1,657 (68.0%) | 781 (32.0%) |
| Bachelor's Degree or higher | 2,245 (81.2%) | 521 (18.8%) |
Occupancy by Age of Householder in Mount Holly
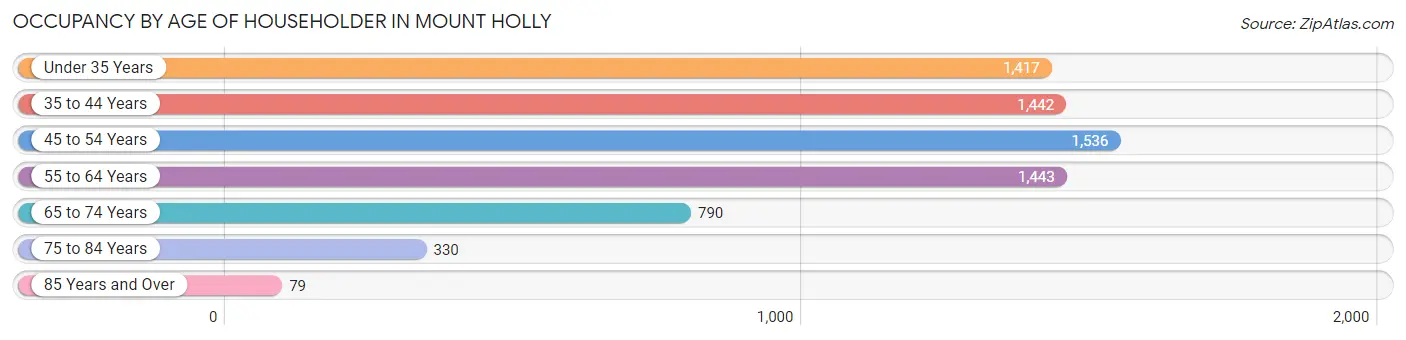
| Age Bracket | # Households | % Households |
| Under 35 Years | 1,417 | 20.1% |
| 35 to 44 Years | 1,442 | 20.5% |
| 45 to 54 Years | 1,536 | 21.8% |
| 55 to 64 Years | 1,443 | 20.5% |
| 65 to 74 Years | 790 | 11.2% |
| 75 to 84 Years | 330 | 4.7% |
| 85 Years and Over | 79 | 1.1% |
| Total | 7,037 | 100.0% |
Housing Finances in Mount Holly
Median Income by Occupancy in Mount Holly
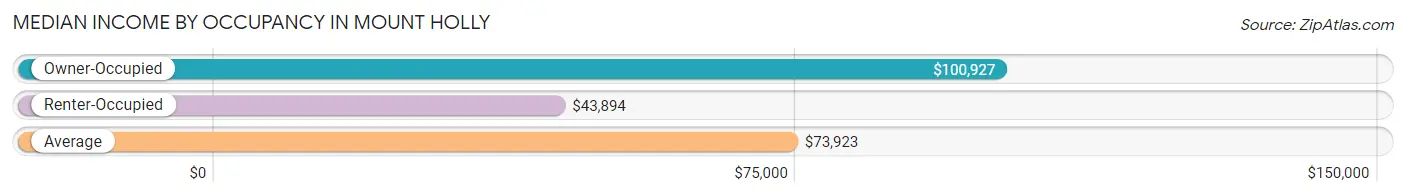
| Occupancy Type | # Households | Median Income |
| Owner-Occupied | 4,867 (69.2%) | $100,927 |
| Renter-Occupied | 2,170 (30.8%) | $43,894 |
| Average | 7,037 (100.0%) | $73,923 |
Occupancy by Householder Income Bracket in Mount Holly
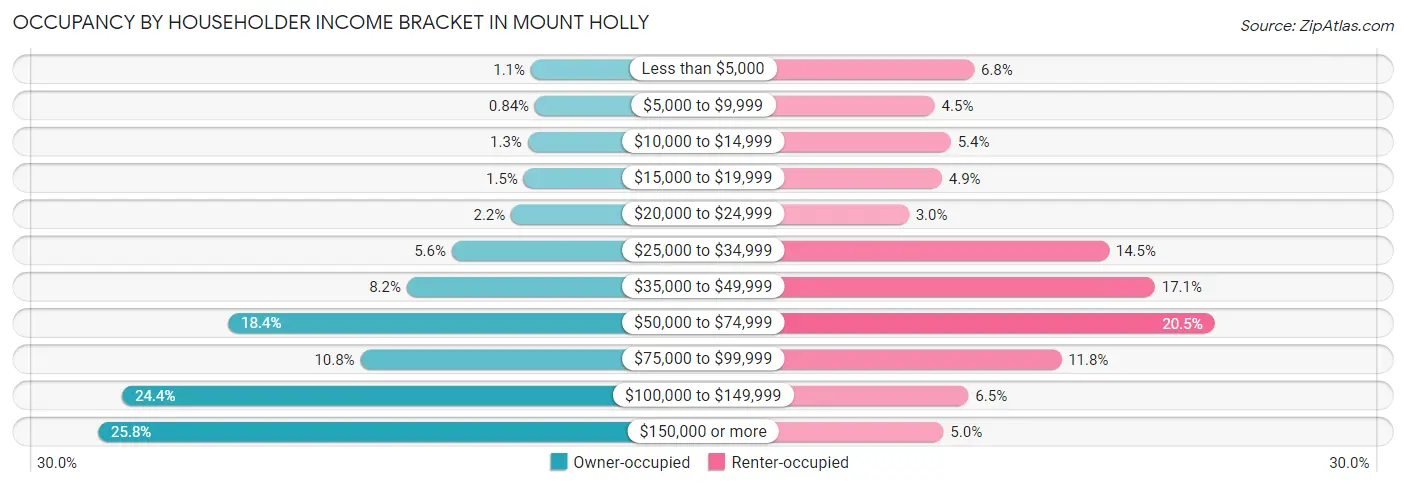
| Income Bracket | Owner-occupied | Renter-occupied |
| Less than $5,000 | 52 (1.1%) | 147 (6.8%) |
| $5,000 to $9,999 | 41 (0.8%) | 98 (4.5%) |
| $10,000 to $14,999 | 61 (1.3%) | 118 (5.4%) |
| $15,000 to $19,999 | 72 (1.5%) | 107 (4.9%) |
| $20,000 to $24,999 | 107 (2.2%) | 66 (3.0%) |
| $25,000 to $34,999 | 272 (5.6%) | 314 (14.5%) |
| $35,000 to $49,999 | 397 (8.2%) | 371 (17.1%) |
| $50,000 to $74,999 | 894 (18.4%) | 445 (20.5%) |
| $75,000 to $99,999 | 526 (10.8%) | 255 (11.7%) |
| $100,000 to $149,999 | 1,189 (24.4%) | 140 (6.5%) |
| $150,000 or more | 1,256 (25.8%) | 109 (5.0%) |
| Total | 4,867 (100.0%) | 2,170 (100.0%) |
Monthly Housing Cost Tiers in Mount Holly
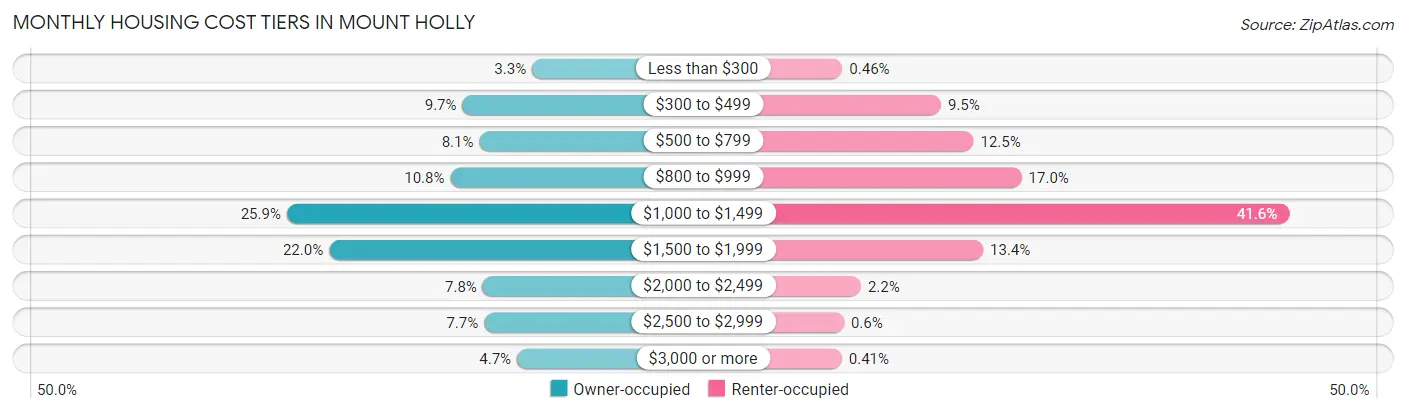
| Monthly Cost | Owner-occupied | Renter-occupied |
| Less than $300 | 160 (3.3%) | 10 (0.5%) |
| $300 to $499 | 472 (9.7%) | 207 (9.5%) |
| $500 to $799 | 396 (8.1%) | 272 (12.5%) |
| $800 to $999 | 526 (10.8%) | 368 (17.0%) |
| $1,000 to $1,499 | 1,259 (25.9%) | 902 (41.6%) |
| $1,500 to $1,999 | 1,070 (22.0%) | 291 (13.4%) |
| $2,000 to $2,499 | 381 (7.8%) | 47 (2.2%) |
| $2,500 to $2,999 | 375 (7.7%) | 13 (0.6%) |
| $3,000 or more | 228 (4.7%) | 9 (0.4%) |
| Total | 4,867 (100.0%) | 2,170 (100.0%) |
Physical Housing Characteristics in Mount Holly
Housing Structures in Mount Holly
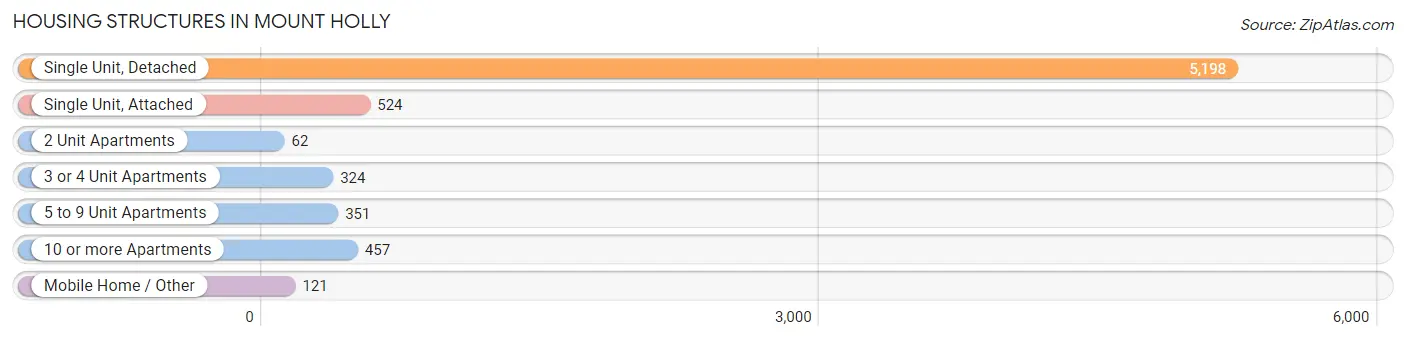
| Structure Type | # Housing Units | % Housing Units |
| Single Unit, Detached | 5,198 | 73.9% |
| Single Unit, Attached | 524 | 7.4% |
| 2 Unit Apartments | 62 | 0.9% |
| 3 or 4 Unit Apartments | 324 | 4.6% |
| 5 to 9 Unit Apartments | 351 | 5.0% |
| 10 or more Apartments | 457 | 6.5% |
| Mobile Home / Other | 121 | 1.7% |
| Total | 7,037 | 100.0% |
Housing Structures by Occupancy in Mount Holly
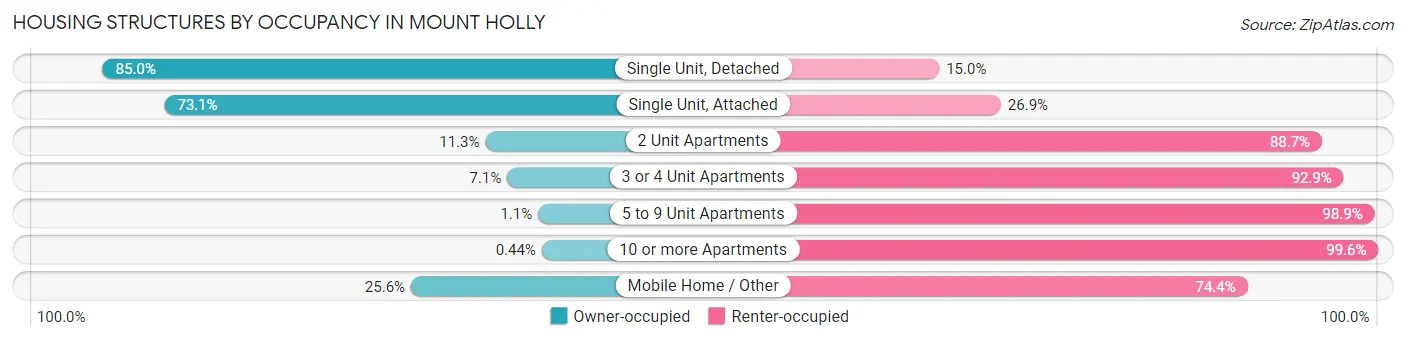
| Structure Type | Owner-occupied | Renter-occupied |
| Single Unit, Detached | 4,417 (85.0%) | 781 (15.0%) |
| Single Unit, Attached | 383 (73.1%) | 141 (26.9%) |
| 2 Unit Apartments | 7 (11.3%) | 55 (88.7%) |
| 3 or 4 Unit Apartments | 23 (7.1%) | 301 (92.9%) |
| 5 to 9 Unit Apartments | 4 (1.1%) | 347 (98.9%) |
| 10 or more Apartments | 2 (0.4%) | 455 (99.6%) |
| Mobile Home / Other | 31 (25.6%) | 90 (74.4%) |
| Total | 4,867 (69.2%) | 2,170 (30.8%) |
Housing Structures by Number of Rooms in Mount Holly
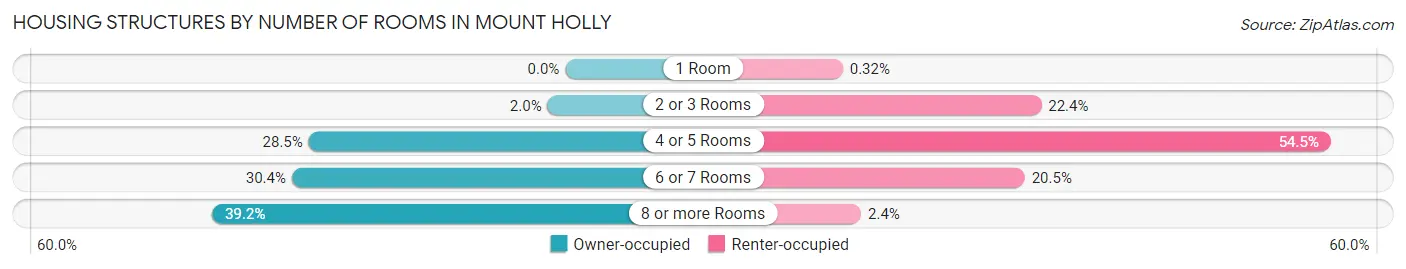
| Number of Rooms | Owner-occupied | Renter-occupied |
| 1 Room | 0 (0.0%) | 7 (0.3%) |
| 2 or 3 Rooms | 96 (2.0%) | 485 (22.4%) |
| 4 or 5 Rooms | 1,386 (28.5%) | 1,182 (54.5%) |
| 6 or 7 Rooms | 1,477 (30.3%) | 445 (20.5%) |
| 8 or more Rooms | 1,908 (39.2%) | 51 (2.4%) |
| Total | 4,867 (100.0%) | 2,170 (100.0%) |
Housing Structure by Heating Type in Mount Holly
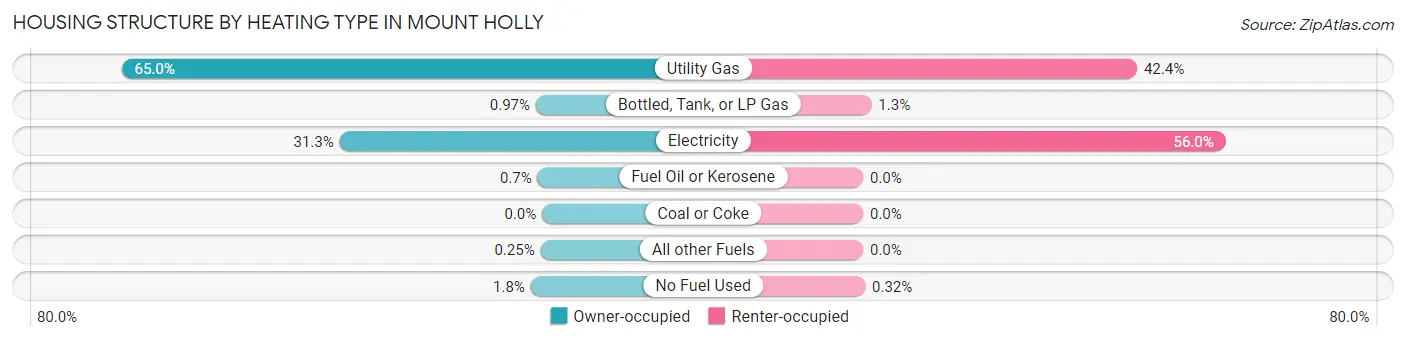
| Heating Type | Owner-occupied | Renter-occupied |
| Utility Gas | 3,164 (65.0%) | 919 (42.3%) |
| Bottled, Tank, or LP Gas | 47 (1.0%) | 28 (1.3%) |
| Electricity | 1,524 (31.3%) | 1,216 (56.0%) |
| Fuel Oil or Kerosene | 34 (0.7%) | 0 (0.0%) |
| Coal or Coke | 0 (0.0%) | 0 (0.0%) |
| All other Fuels | 12 (0.3%) | 0 (0.0%) |
| No Fuel Used | 86 (1.8%) | 7 (0.3%) |
| Total | 4,867 (100.0%) | 2,170 (100.0%) |
Household Vehicle Usage in Mount Holly
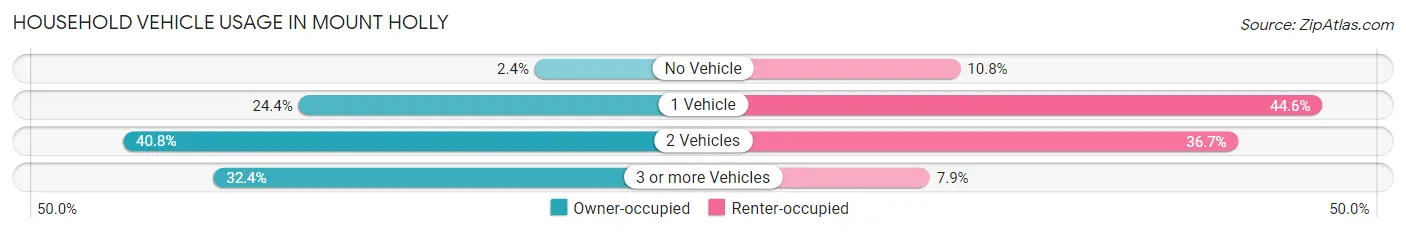
| Vehicles per Household | Owner-occupied | Renter-occupied |
| No Vehicle | 116 (2.4%) | 234 (10.8%) |
| 1 Vehicle | 1,189 (24.4%) | 967 (44.6%) |
| 2 Vehicles | 1,986 (40.8%) | 797 (36.7%) |
| 3 or more Vehicles | 1,576 (32.4%) | 172 (7.9%) |
| Total | 4,867 (100.0%) | 2,170 (100.0%) |
Real Estate & Mortgages in Mount Holly
Real Estate and Mortgage Overview in Mount Holly
| Characteristic | Without Mortgage | With Mortgage |
| Housing Units | 1,012 | 3,855 |
| Median Property Value | $205,900 | $260,400 |
| Median Household Income | $51,000 | $1,143 |
| Monthly Housing Costs | $466 | $228 |
| Real Estate Taxes | $1,854 | $19 |
Property Value by Mortgage Status in Mount Holly
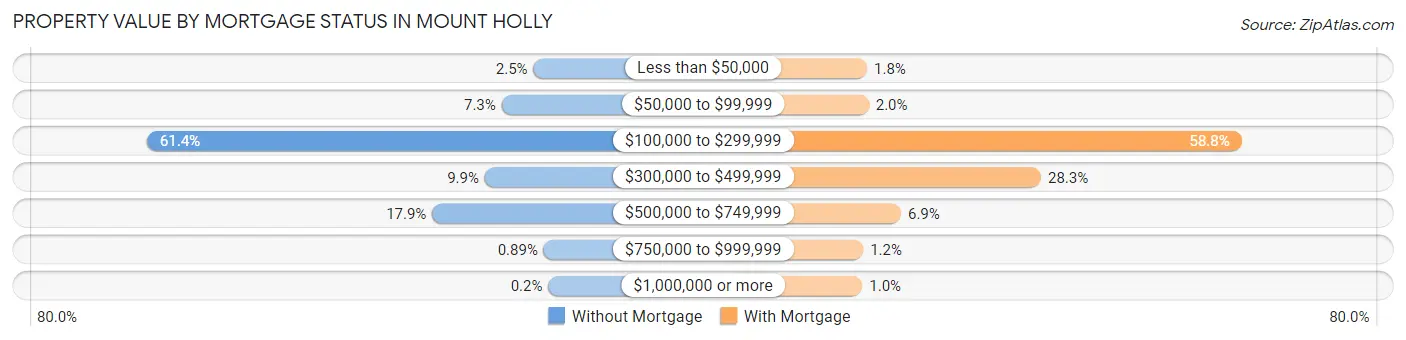
| Property Value | Without Mortgage | With Mortgage |
| Less than $50,000 | 25 (2.5%) | 68 (1.8%) |
| $50,000 to $99,999 | 74 (7.3%) | 78 (2.0%) |
| $100,000 to $299,999 | 621 (61.4%) | 2,267 (58.8%) |
| $300,000 to $499,999 | 100 (9.9%) | 1,090 (28.3%) |
| $500,000 to $749,999 | 181 (17.9%) | 267 (6.9%) |
| $750,000 to $999,999 | 9 (0.9%) | 45 (1.2%) |
| $1,000,000 or more | 2 (0.2%) | 40 (1.0%) |
| Total | 1,012 (100.0%) | 3,855 (100.0%) |
Household Income by Mortgage Status in Mount Holly
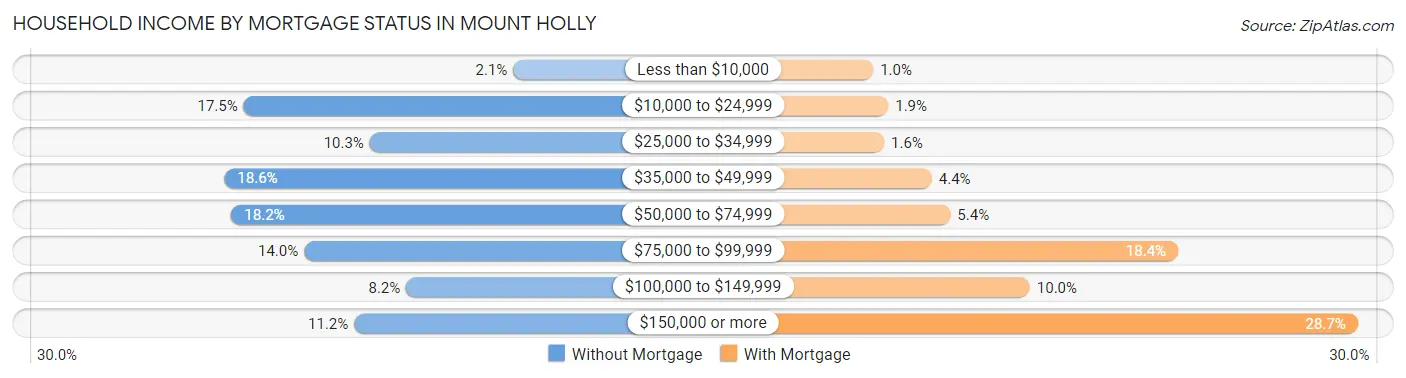
| Household Income | Without Mortgage | With Mortgage |
| Less than $10,000 | 21 (2.1%) | 39 (1.0%) |
| $10,000 to $24,999 | 177 (17.5%) | 72 (1.9%) |
| $25,000 to $34,999 | 104 (10.3%) | 63 (1.6%) |
| $35,000 to $49,999 | 188 (18.6%) | 168 (4.4%) |
| $50,000 to $74,999 | 184 (18.2%) | 209 (5.4%) |
| $75,000 to $99,999 | 142 (14.0%) | 710 (18.4%) |
| $100,000 to $149,999 | 83 (8.2%) | 384 (10.0%) |
| $150,000 or more | 113 (11.2%) | 1,106 (28.7%) |
| Total | 1,012 (100.0%) | 3,855 (100.0%) |
Property Value to Household Income Ratio in Mount Holly
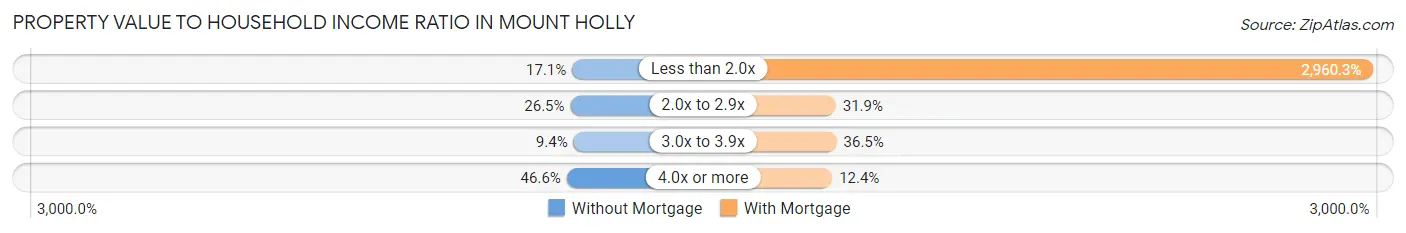
| Value-to-Income Ratio | Without Mortgage | With Mortgage |
| Less than 2.0x | 173 (17.1%) | 114,120 (2,960.3%) |
| 2.0x to 2.9x | 268 (26.5%) | 1,231 (31.9%) |
| 3.0x to 3.9x | 95 (9.4%) | 1,407 (36.5%) |
| 4.0x or more | 472 (46.6%) | 479 (12.4%) |
| Total | 1,012 (100.0%) | 3,855 (100.0%) |
Real Estate Taxes by Mortgage Status in Mount Holly
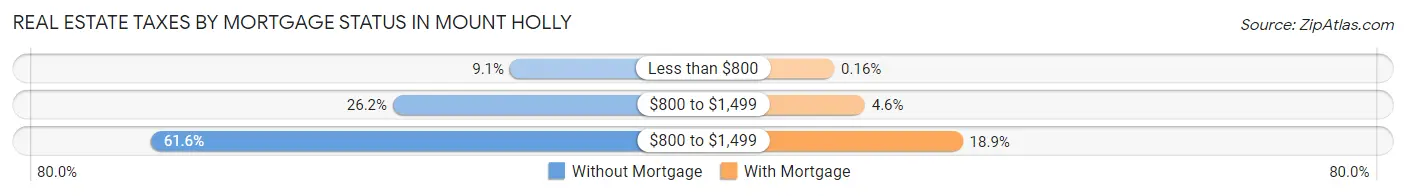
| Property Taxes | Without Mortgage | With Mortgage |
| Less than $800 | 92 (9.1%) | 6 (0.2%) |
| $800 to $1,499 | 265 (26.2%) | 179 (4.6%) |
| $800 to $1,499 | 623 (61.6%) | 730 (18.9%) |
| Total | 1,012 (100.0%) | 3,855 (100.0%) |
Health & Disability in Mount Holly
Health Insurance Coverage by Age in Mount Holly
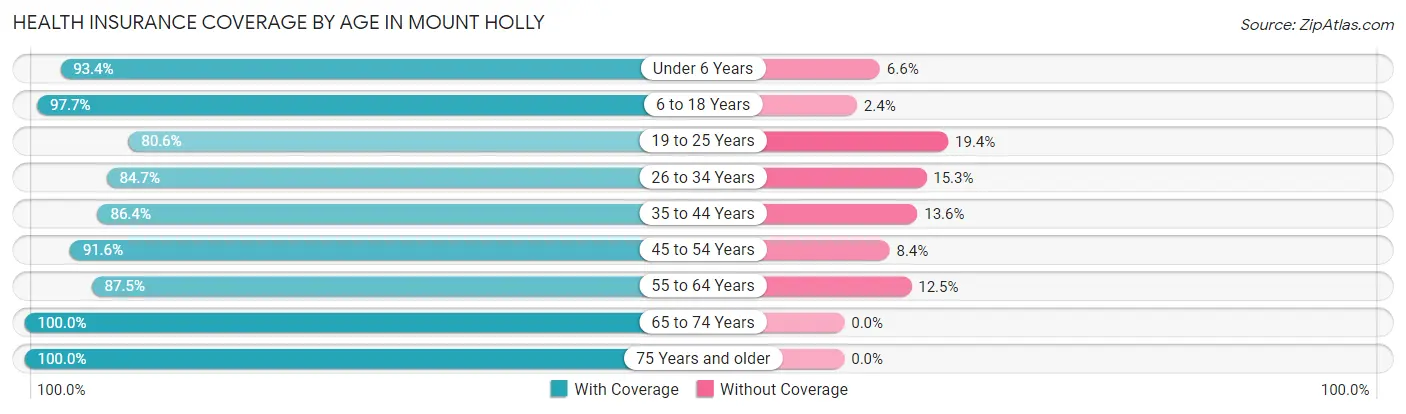
| Age Bracket | With Coverage | Without Coverage |
| Under 6 Years | 1,069 (93.4%) | 76 (6.6%) |
| 6 to 18 Years | 2,658 (97.7%) | 64 (2.4%) |
| 19 to 25 Years | 1,179 (80.6%) | 283 (19.4%) |
| 26 to 34 Years | 2,178 (84.7%) | 393 (15.3%) |
| 35 to 44 Years | 2,139 (86.4%) | 337 (13.6%) |
| 45 to 54 Years | 2,420 (91.6%) | 223 (8.4%) |
| 55 to 64 Years | 2,143 (87.5%) | 306 (12.5%) |
| 65 to 74 Years | 1,287 (100.0%) | 0 (0.0%) |
| 75 Years and older | 671 (100.0%) | 0 (0.0%) |
| Total | 15,744 (90.3%) | 1,682 (9.7%) |
Health Insurance Coverage by Citizenship Status in Mount Holly
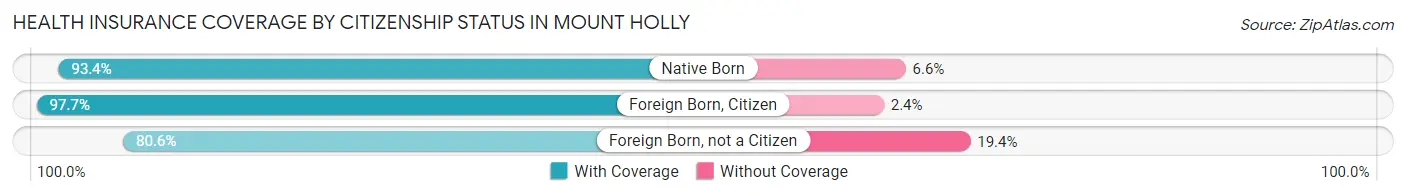
| Citizenship Status | With Coverage | Without Coverage |
| Native Born | 1,069 (93.4%) | 76 (6.6%) |
| Foreign Born, Citizen | 2,658 (97.7%) | 64 (2.4%) |
| Foreign Born, not a Citizen | 1,179 (80.6%) | 283 (19.4%) |
Health Insurance Coverage by Household Income in Mount Holly
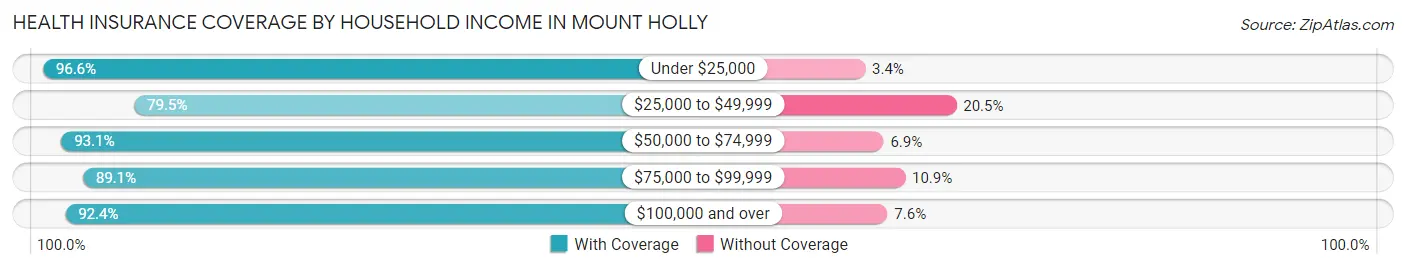
| Household Income | With Coverage | Without Coverage |
| Under $25,000 | 1,155 (96.6%) | 41 (3.4%) |
| $25,000 to $49,999 | 2,239 (79.5%) | 578 (20.5%) |
| $50,000 to $74,999 | 2,630 (93.1%) | 194 (6.9%) |
| $75,000 to $99,999 | 1,731 (89.1%) | 212 (10.9%) |
| $100,000 and over | 7,980 (92.4%) | 657 (7.6%) |
Public vs Private Health Insurance Coverage by Age in Mount Holly
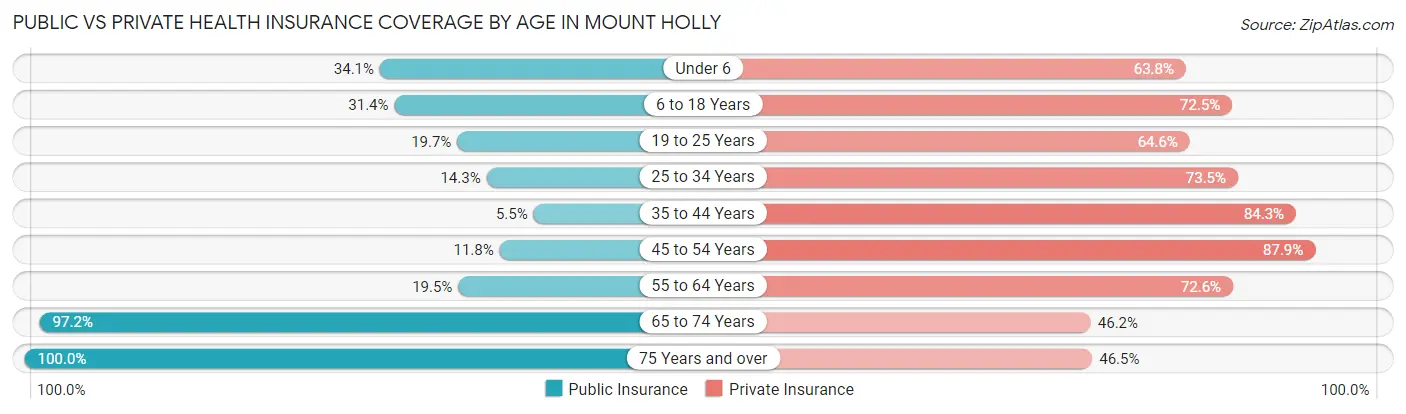
| Age Bracket | Public Insurance | Private Insurance |
| Under 6 | 390 (34.1%) | 731 (63.8%) |
| 6 to 18 Years | 854 (31.4%) | 1,972 (72.5%) |
| 19 to 25 Years | 288 (19.7%) | 944 (64.6%) |
| 25 to 34 Years | 367 (14.3%) | 1,890 (73.5%) |
| 35 to 44 Years | 137 (5.5%) | 2,087 (84.3%) |
| 45 to 54 Years | 313 (11.8%) | 2,322 (87.8%) |
| 55 to 64 Years | 478 (19.5%) | 1,778 (72.6%) |
| 65 to 74 Years | 1,251 (97.2%) | 595 (46.2%) |
| 75 Years and over | 671 (100.0%) | 312 (46.5%) |
| Total | 4,749 (27.3%) | 12,631 (72.5%) |
Disability Status by Sex by Age in Mount Holly
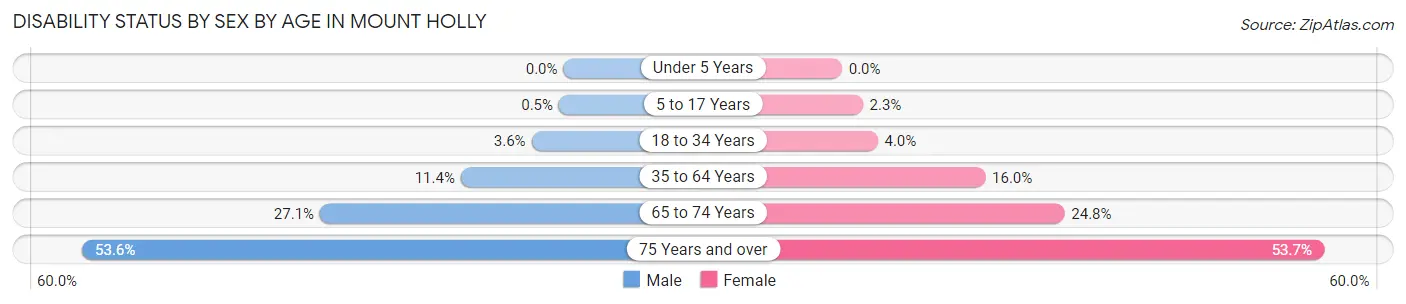
| Age Bracket | Male | Female |
| Under 5 Years | 0 (0.0%) | 0 (0.0%) |
| 5 to 17 Years | 7 (0.5%) | 34 (2.3%) |
| 18 to 34 Years | 72 (3.5%) | 84 (4.0%) |
| 35 to 64 Years | 411 (11.4%) | 634 (16.0%) |
| 65 to 74 Years | 151 (27.1%) | 181 (24.8%) |
| 75 Years and over | 119 (53.6%) | 241 (53.7%) |
Disability Class by Sex by Age in Mount Holly
Disability Class: Hearing Difficulty
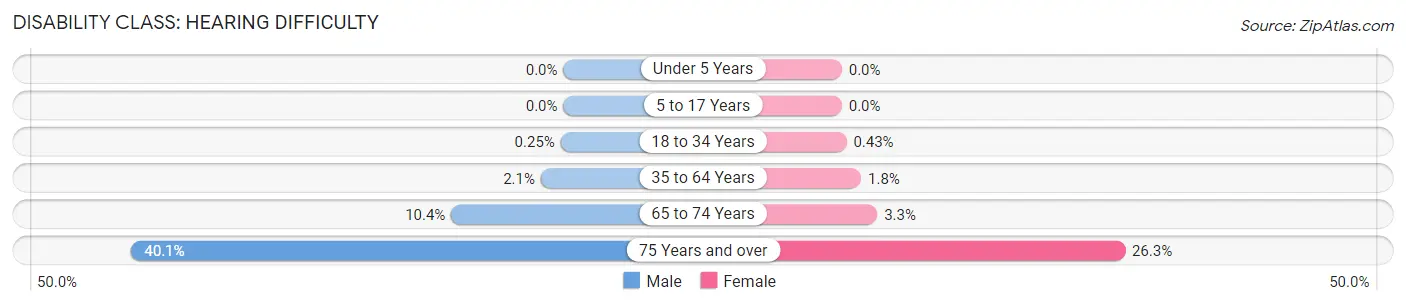
| Age Bracket | Male | Female |
| Under 5 Years | 0 (0.0%) | 0 (0.0%) |
| 5 to 17 Years | 0 (0.0%) | 0 (0.0%) |
| 18 to 34 Years | 5 (0.3%) | 9 (0.4%) |
| 35 to 64 Years | 75 (2.1%) | 71 (1.8%) |
| 65 to 74 Years | 58 (10.4%) | 24 (3.3%) |
| 75 Years and over | 89 (40.1%) | 118 (26.3%) |
Disability Class: Vision Difficulty
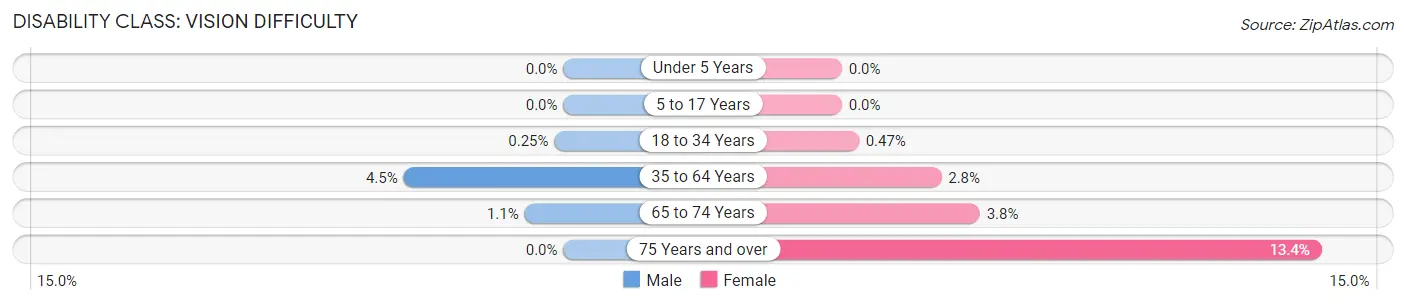
| Age Bracket | Male | Female |
| Under 5 Years | 0 (0.0%) | 0 (0.0%) |
| 5 to 17 Years | 0 (0.0%) | 0 (0.0%) |
| 18 to 34 Years | 5 (0.3%) | 10 (0.5%) |
| 35 to 64 Years | 160 (4.4%) | 110 (2.8%) |
| 65 to 74 Years | 6 (1.1%) | 28 (3.8%) |
| 75 Years and over | 0 (0.0%) | 60 (13.4%) |
Disability Class: Cognitive Difficulty
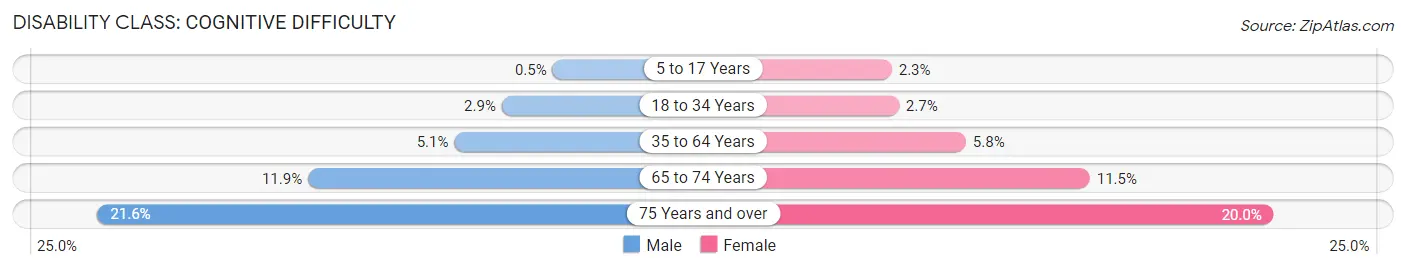
| Age Bracket | Male | Female |
| 5 to 17 Years | 7 (0.5%) | 34 (2.3%) |
| 18 to 34 Years | 58 (2.9%) | 56 (2.6%) |
| 35 to 64 Years | 182 (5.1%) | 229 (5.8%) |
| 65 to 74 Years | 66 (11.8%) | 84 (11.5%) |
| 75 Years and over | 48 (21.6%) | 90 (20.0%) |
Disability Class: Ambulatory Difficulty
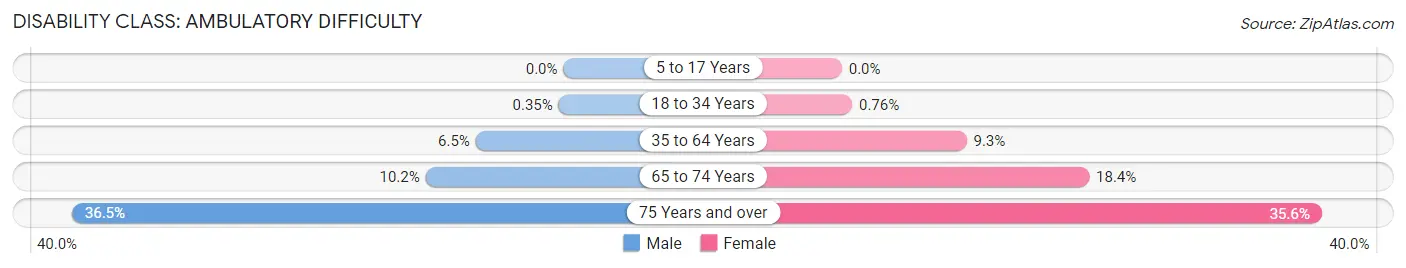
| Age Bracket | Male | Female |
| 5 to 17 Years | 0 (0.0%) | 0 (0.0%) |
| 18 to 34 Years | 7 (0.4%) | 16 (0.8%) |
| 35 to 64 Years | 234 (6.5%) | 368 (9.3%) |
| 65 to 74 Years | 57 (10.2%) | 134 (18.4%) |
| 75 Years and over | 81 (36.5%) | 160 (35.6%) |
Disability Class: Self-Care Difficulty
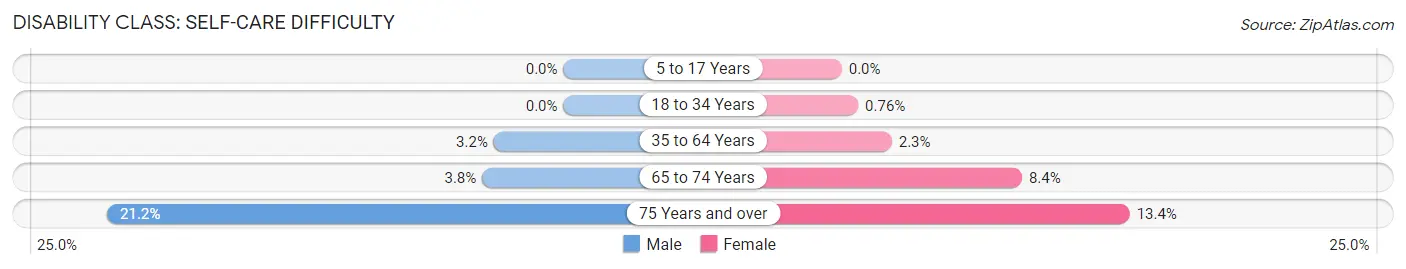
| Age Bracket | Male | Female |
| 5 to 17 Years | 0 (0.0%) | 0 (0.0%) |
| 18 to 34 Years | 0 (0.0%) | 16 (0.8%) |
| 35 to 64 Years | 116 (3.2%) | 92 (2.3%) |
| 65 to 74 Years | 21 (3.8%) | 61 (8.4%) |
| 75 Years and over | 47 (21.2%) | 60 (13.4%) |
Technology Access in Mount Holly
Computing Device Access in Mount Holly
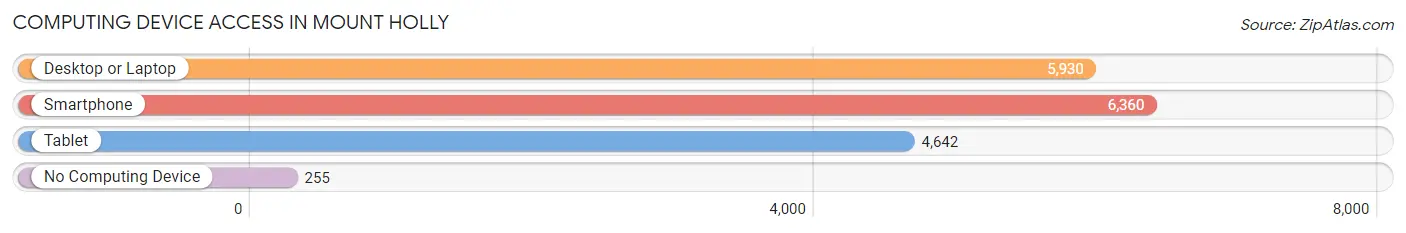
| Device Type | # Households | % Households |
| Desktop or Laptop | 5,930 | 84.3% |
| Smartphone | 6,360 | 90.4% |
| Tablet | 4,642 | 66.0% |
| No Computing Device | 255 | 3.6% |
| Total | 7,037 | 100.0% |
Internet Access in Mount Holly
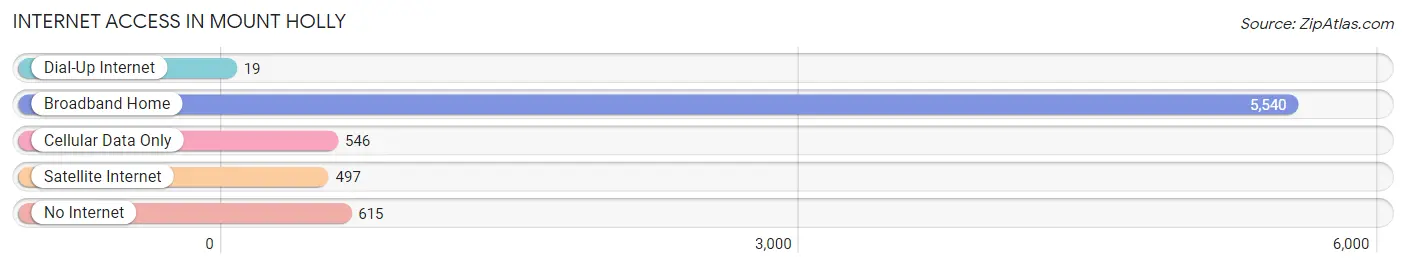
| Internet Type | # Households | % Households |
| Dial-Up Internet | 19 | 0.3% |
| Broadband Home | 5,540 | 78.7% |
| Cellular Data Only | 546 | 7.8% |
| Satellite Internet | 497 | 7.1% |
| No Internet | 615 | 8.7% |
| Total | 7,037 | 100.0% |
Mount Holly Summary
Holly, North Carolina is a small town located in the foothills of the Blue Ridge Mountains in Gaston County. It is situated along the Catawba River and is approximately 20 miles west of Charlotte. The town was founded in 1836 and was named after the holly trees that grew in abundance in the area. The town has a population of approximately 4,000 people and is known for its small-town charm and friendly atmosphere.
History
The area that is now known as Mount Holly was first settled in the late 1700s by a group of German immigrants. The town was originally known as Woodlawn, but was later renamed Mount Holly in 1836. The name was chosen to honor the holly trees that grew in abundance in the area.
The town was incorporated in 1845 and quickly became a thriving center of commerce and industry. The town was home to several mills, including a cotton mill, a grist mill, and a sawmill. The town also had a thriving furniture industry, which was centered around the Mount Holly Furniture Company.
The town was also home to several churches, including the First Baptist Church, which was founded in 1845. The town also had a thriving educational system, with several schools, including the Mount Holly Academy, which was founded in 1851.
Geography
Mount Holly is located in the foothills of the Blue Ridge Mountains in Gaston County. The town is situated along the Catawba River and is approximately 20 miles west of Charlotte. The town has a total area of 4.2 square miles, all of which is land.
The town is located at an elevation of 845 feet above sea level and has a humid subtropical climate. The average temperature in the summer is around 80 degrees Fahrenheit and the average temperature in the winter is around 40 degrees Fahrenheit.
Economy
The economy of Mount Holly is largely based on manufacturing and retail. The town is home to several manufacturing companies, including the Mount Holly Furniture Company, which produces furniture for the home and office. The town is also home to several retail stores, including a Walmart Supercenter and a Lowe’s Home Improvement store.
The town is also home to several restaurants, including the popular Mount Holly Barbecue. The town is also home to several small businesses, including a local newspaper, a hardware store, and a variety of other shops.
Demographics
As of the 2010 census, the population of Mount Holly was 4,018. The racial makeup of the town was 87.3% White, 8.2% African American, 0.4% Native American, 0.7% Asian, 0.1% Pacific Islander, 1.2% from other races, and 2.1% from two or more races. Hispanic or Latino of any race were 3.2% of the population.
The median income for a household in the town was $41,250, and the median income for a family was $50,000. The per capita income for the town was $20,845. About 11.2% of families and 14.2% of the population were below the poverty line, including 19.2% of those under age 18 and 8.2% of those age 65 or over.
Mount Holly is a small town with a rich history and a friendly atmosphere. The town is home to several manufacturing and retail businesses, as well as a variety of restaurants and small businesses. The town has a diverse population and a median income that is slightly higher than the national average.
Common Questions
What is Per Capita Income in Mount Holly?
Per Capita income in Mount Holly is $39,509.
What is the Median Family Income in Mount Holly?
Median Family Income in Mount Holly is $99,444.
What is the Median Household income in Mount Holly?
Median Household Income in Mount Holly is $73,923.
What is Income or Wage Gap in Mount Holly?
Income or Wage Gap in Mount Holly is 25.8%.
Women in Mount Holly earn 74.2 cents for every dollar earned by a man.
What is Family Income Deficit in Mount Holly?
Family Income Deficit in Mount Holly is $11,671.
Families that are below poverty line in Mount Holly earn $11,671 less on average than the poverty threshold level.
What is Inequality or Gini Index in Mount Holly?
Inequality or Gini Index in Mount Holly is 0.42.
What is the Total Population of Mount Holly?
Total Population of Mount Holly is 17,644.
What is the Total Male Population of Mount Holly?
Total Male Population of Mount Holly is 8,590.
What is the Total Female Population of Mount Holly?
Total Female Population of Mount Holly is 9,054.
What is the Ratio of Males per 100 Females in Mount Holly?
There are 94.88 Males per 100 Females in Mount Holly.
What is the Ratio of Females per 100 Males in Mount Holly?
There are 105.40 Females per 100 Males in Mount Holly.
What is the Median Population Age in Mount Holly?
Median Population Age in Mount Holly is 37.7 Years.
What is the Average Family Size in Mount Holly
Average Family Size in Mount Holly is 3.1 People.
What is the Average Household Size in Mount Holly
Average Household Size in Mount Holly is 2.5 People.
How Large is the Labor Force in Mount Holly?
There are 10,291 People in the Labor Forcein in Mount Holly.
What is the Percentage of People in the Labor Force in Mount Holly?
71.6% of People are in the Labor Force in Mount Holly.
What is the Unemployment Rate in Mount Holly?
Unemployment Rate in Mount Holly is 6.5%.