Zebulon, NC Map & Demographics
Zebulon Map
Zebulon Overview
$27,562
PER CAPITA INCOME
$46,832
AVG FAMILY INCOME
$50,934
AVG HOUSEHOLD INCOME
2.5%
WAGE / INCOME GAP [ % ]
97.5¢/ $1
WAGE / INCOME GAP [ $ ]
0.42
INEQUALITY / GINI INDEX
7,421
TOTAL POPULATION
2,997
MALE POPULATION
4,424
FEMALE POPULATION
67.74
MALES / 100 FEMALES
147.61
FEMALES / 100 MALES
35.6
MEDIAN AGE
3.2
AVG FAMILY SIZE
2.8
AVG HOUSEHOLD SIZE
3,500
LABOR FORCE [ PEOPLE ]
60.4%
PERCENT IN LABOR FORCE
9.0%
UNEMPLOYMENT RATE
Zebulon Zip Codes
Zebulon Area Codes
Income in Zebulon
Income Overview in Zebulon
Per Capita Income in Zebulon is $27,562, while median incomes of families and households are $46,832 and $50,934 respectively.
| Characteristic | Number | Measure |
| Per Capita Income | 7,421 | $27,562 |
| Median Family Income | 1,827 | $46,832 |
| Mean Family Income | 1,827 | $75,981 |
| Median Household Income | 2,633 | $50,934 |
| Mean Household Income | 2,633 | $73,696 |
| Income Deficit | 1,827 | $0 |
| Wage / Income Gap (%) | 7,421 | 2.49% |
| Wage / Income Gap ($) | 7,421 | 97.51¢ per $1 |
| Gini / Inequality Index | 7,421 | 0.42 |
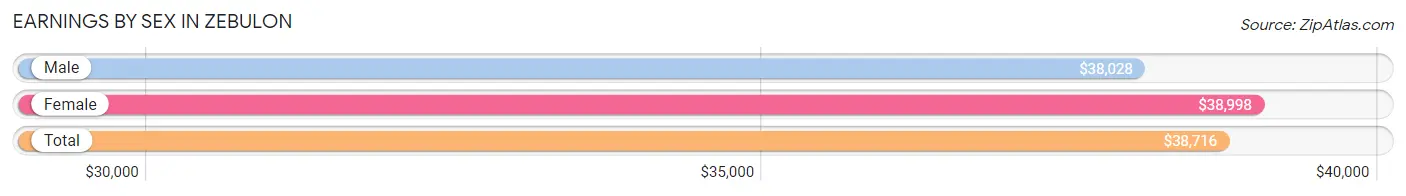
Earnings by Sex in Zebulon
Average Earnings in Zebulon are $38,716, $38,028 for men and $38,998 for women, a difference of 2.5%.
| Sex | Number | Average Earnings |
| Male | 1,779 (48.4%) | $38,028 |
| Female | 1,896 (51.6%) | $38,998 |
| Total | 3,675 (100.0%) | $38,716 |
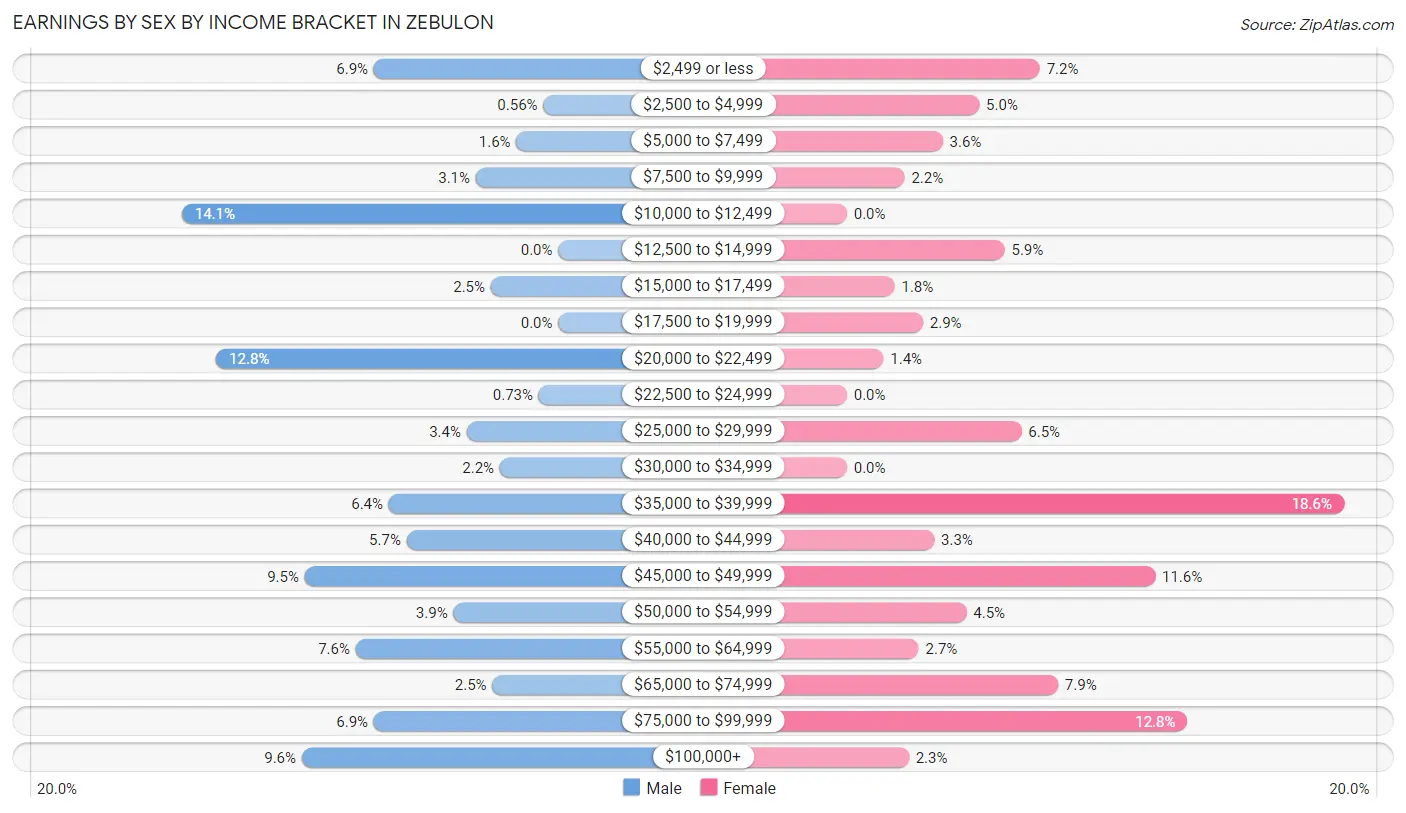
Earnings by Sex by Income Bracket in Zebulon
The most common earnings brackets in Zebulon are $10,000 to $12,499 for men (251 | 14.1%) and $35,000 to $39,999 for women (353 | 18.6%).
| Income | Male | Female |
| $2,499 or less | 123 (6.9%) | 137 (7.2%) |
| $2,500 to $4,999 | 10 (0.6%) | 94 (5.0%) |
| $5,000 to $7,499 | 28 (1.6%) | 68 (3.6%) |
| $7,500 to $9,999 | 55 (3.1%) | 41 (2.2%) |
| $10,000 to $12,499 | 251 (14.1%) | 0 (0.0%) |
| $12,500 to $14,999 | 0 (0.0%) | 112 (5.9%) |
| $15,000 to $17,499 | 45 (2.5%) | 34 (1.8%) |
| $17,500 to $19,999 | 0 (0.0%) | 54 (2.9%) |
| $20,000 to $22,499 | 228 (12.8%) | 26 (1.4%) |
| $22,500 to $24,999 | 13 (0.7%) | 0 (0.0%) |
| $25,000 to $29,999 | 61 (3.4%) | 124 (6.5%) |
| $30,000 to $34,999 | 39 (2.2%) | 0 (0.0%) |
| $35,000 to $39,999 | 113 (6.4%) | 353 (18.6%) |
| $40,000 to $44,999 | 101 (5.7%) | 62 (3.3%) |
| $45,000 to $49,999 | 169 (9.5%) | 219 (11.6%) |
| $50,000 to $54,999 | 70 (3.9%) | 85 (4.5%) |
| $55,000 to $64,999 | 135 (7.6%) | 51 (2.7%) |
| $65,000 to $74,999 | 44 (2.5%) | 150 (7.9%) |
| $75,000 to $99,999 | 123 (6.9%) | 242 (12.8%) |
| $100,000+ | 171 (9.6%) | 44 (2.3%) |
| Total | 1,779 (100.0%) | 1,896 (100.0%) |
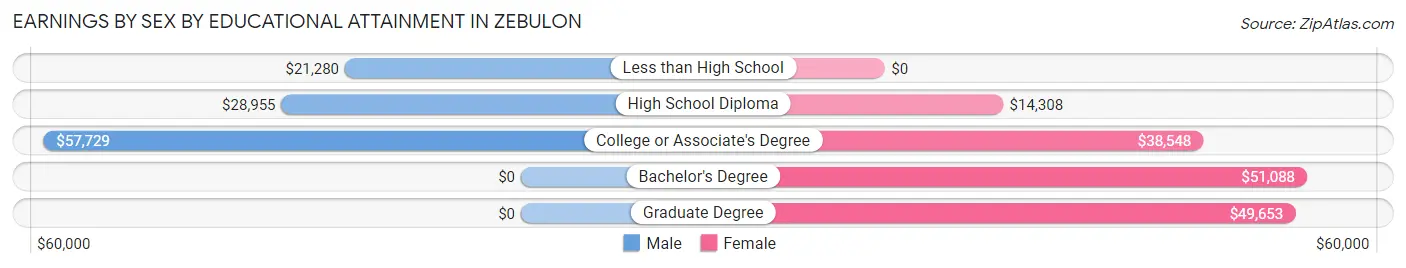
Earnings by Sex by Educational Attainment in Zebulon
Average earnings in Zebulon are $38,531 for men and $39,739 for women, a difference of 3.0%. Men with an educational attainment of college or associate's degree enjoy the highest average annual earnings of $57,729, while those with less than high school education earn the least with $21,280. Women with an educational attainment of bachelor's degree earn the most with the average annual earnings of $51,088, while those with high school diploma education have the smallest earnings of $14,308.
| Educational Attainment | Male Income | Female Income |
| Less than High School | $21,280 | $0 |
| High School Diploma | $28,955 | $14,308 |
| College or Associate's Degree | $57,729 | $38,548 |
| Bachelor's Degree | - | - |
| Graduate Degree | - | - |
| Total | $38,531 | $39,739 |
Family Income in Zebulon
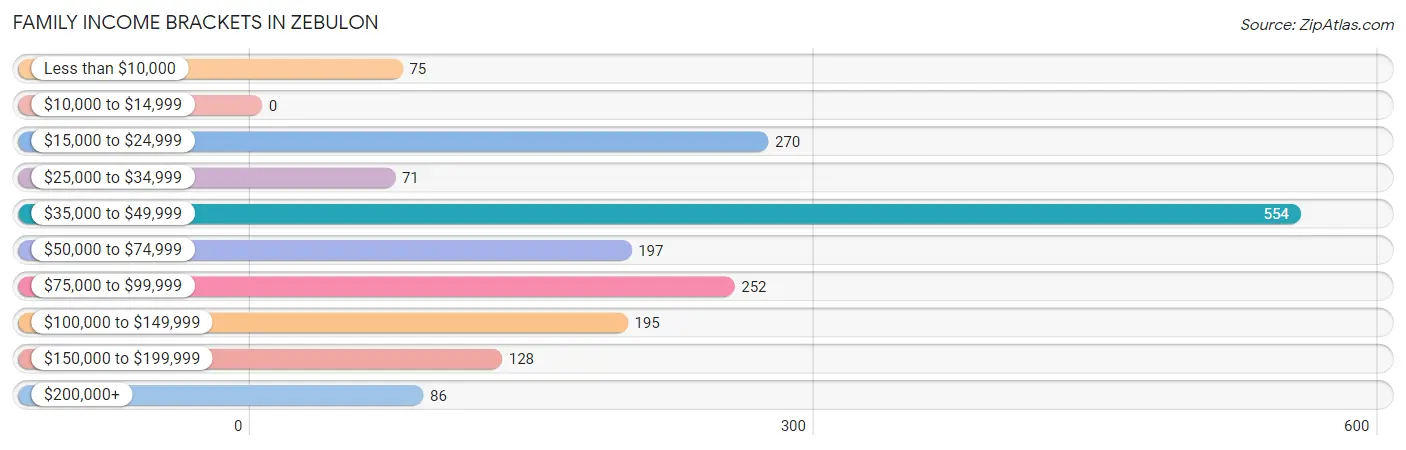
Family Income Brackets in Zebulon
According to the Zebulon family income data, there are 554 families falling into the $35,000 to $49,999 income range, which is the most common income bracket and makes up 30.3% of all families.
| Income Bracket | # Families | % Families |
| Less than $10,000 | 75 | 4.1% |
| $10,000 to $14,999 | 0 | 0.0% |
| $15,000 to $24,999 | 270 | 14.8% |
| $25,000 to $34,999 | 71 | 3.9% |
| $35,000 to $49,999 | 554 | 30.3% |
| $50,000 to $74,999 | 197 | 10.8% |
| $75,000 to $99,999 | 252 | 13.8% |
| $100,000 to $149,999 | 195 | 10.7% |
| $150,000 to $199,999 | 128 | 7.0% |
| $200,000+ | 86 | 4.7% |
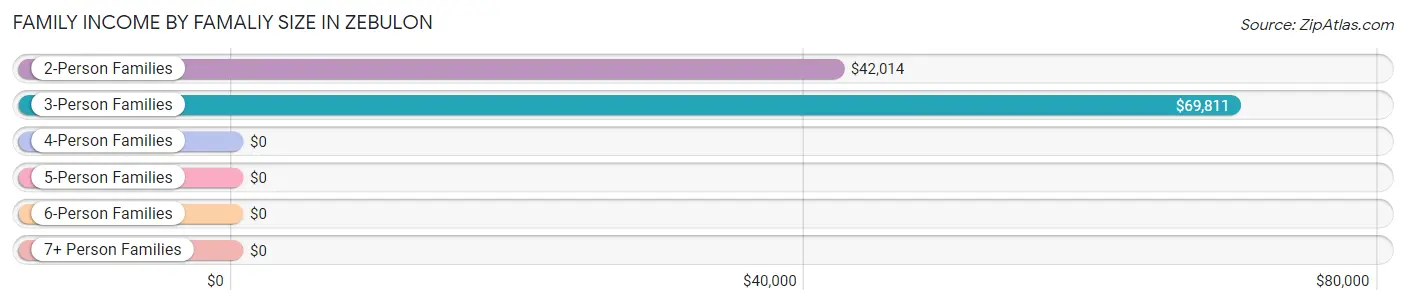
Family Income by Famaliy Size in Zebulon
3-person families (480 | 26.3%) account for the highest median family income in Zebulon with $69,811 per family, while 3-person families (480 | 26.3%) have the highest median income of $23,270 per family member.
| Income Bracket | # Families | Median Income |
| 2-Person Families | 821 (44.9%) | $42,014 |
| 3-Person Families | 480 (26.3%) | $69,811 |
| 4-Person Families | 229 (12.5%) | $0 |
| 5-Person Families | 255 (14.0%) | $0 |
| 6-Person Families | 27 (1.5%) | $0 |
| 7+ Person Families | 15 (0.8%) | $0 |
| Total | 1,827 (100.0%) | $46,832 |
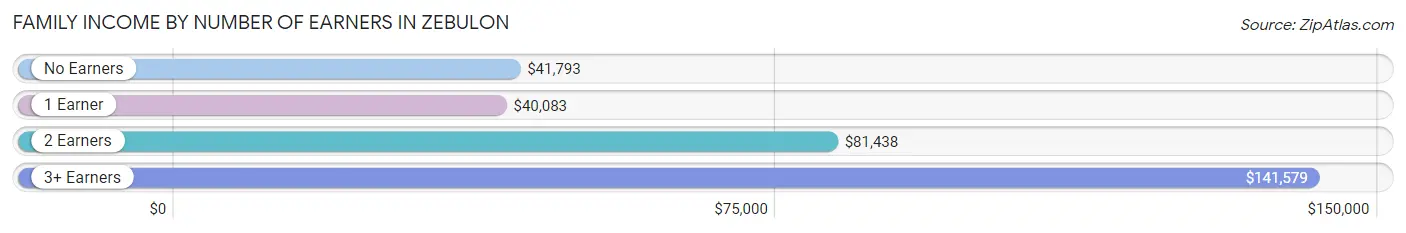
Family Income by Number of Earners in Zebulon
The median family income in Zebulon is $46,832, with families comprising 3+ earners (174) having the highest median family income of $141,579, while families with 1 earner (910) have the lowest median family income of $40,083, accounting for 9.5% and 49.8% of families, respectively.
| Number of Earners | # Families | Median Income |
| No Earners | 202 (11.1%) | $41,793 |
| 1 Earner | 910 (49.8%) | $40,083 |
| 2 Earners | 541 (29.6%) | $81,438 |
| 3+ Earners | 174 (9.5%) | $141,579 |
| Total | 1,827 (100.0%) | $46,832 |
Household Income in Zebulon
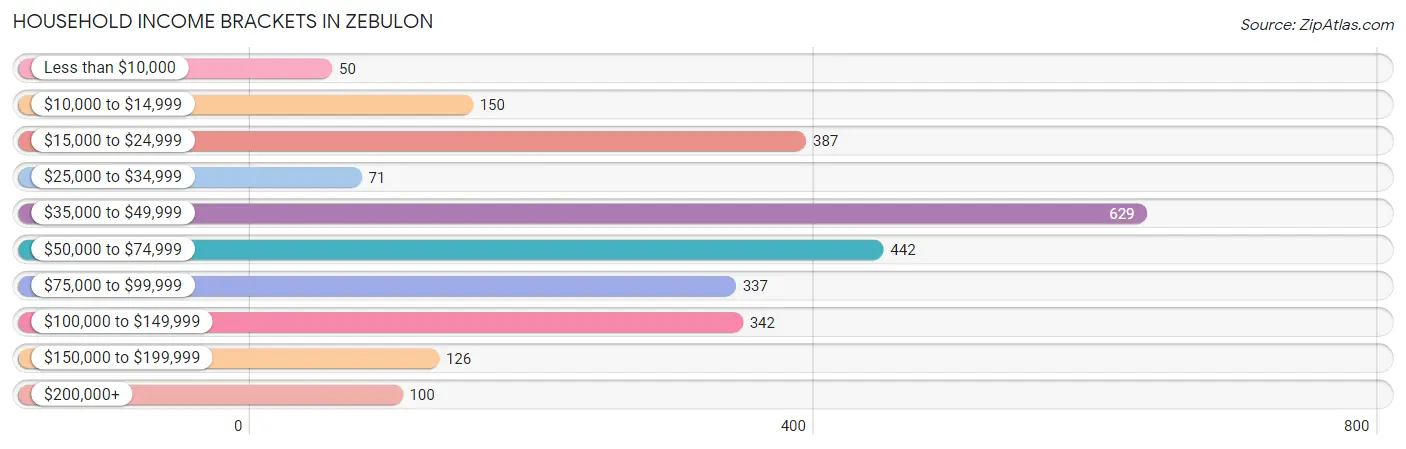
Household Income Brackets in Zebulon
With 629 households falling in the category, the $35,000 to $49,999 income range is the most frequent in Zebulon, accounting for 23.9% of all households. In contrast, only 50 households (1.9%) fall into the less than $10,000 income bracket, making it the least populous group.
| Income Bracket | # Households | % Households |
| Less than $10,000 | 50 | 1.9% |
| $10,000 to $14,999 | 150 | 5.7% |
| $15,000 to $24,999 | 387 | 14.7% |
| $25,000 to $34,999 | 71 | 2.7% |
| $35,000 to $49,999 | 629 | 23.9% |
| $50,000 to $74,999 | 442 | 16.8% |
| $75,000 to $99,999 | 337 | 12.8% |
| $100,000 to $149,999 | 342 | 13.0% |
| $150,000 to $199,999 | 126 | 4.8% |
| $200,000+ | 100 | 3.8% |
Household Income by Householder Age in Zebulon
The median household income in Zebulon is $50,934, with the highest median household income of $74,201 found in the 25 to 44 years age bracket for the primary householder. A total of 1,019 households (38.7%) fall into this category. Meanwhile, the 15 to 24 years age bracket for the primary householder has the lowest median household income of $0, with 74 households (2.8%) in this group.
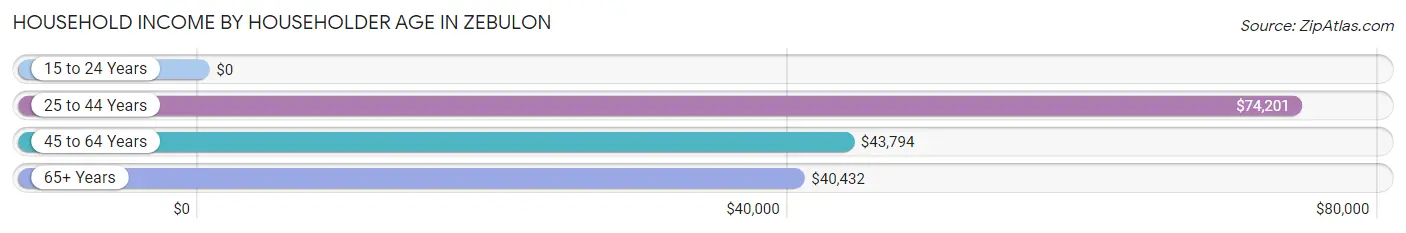
| Income Bracket | # Households | Median Income |
| 15 to 24 Years | 74 (2.8%) | $0 |
| 25 to 44 Years | 1,019 (38.7%) | $74,201 |
| 45 to 64 Years | 991 (37.6%) | $43,794 |
| 65+ Years | 549 (20.8%) | $40,432 |
| Total | 2,633 (100.0%) | $50,934 |
Poverty in Zebulon
Income Below Poverty by Sex and Age in Zebulon
With 10.6% poverty level for males and 12.4% for females among the residents of Zebulon, 12 to 14 year old males and 5 year old females are the most vulnerable to poverty, with 29 males (35.4%) and 75 females (47.5%) in their respective age groups living below the poverty level.
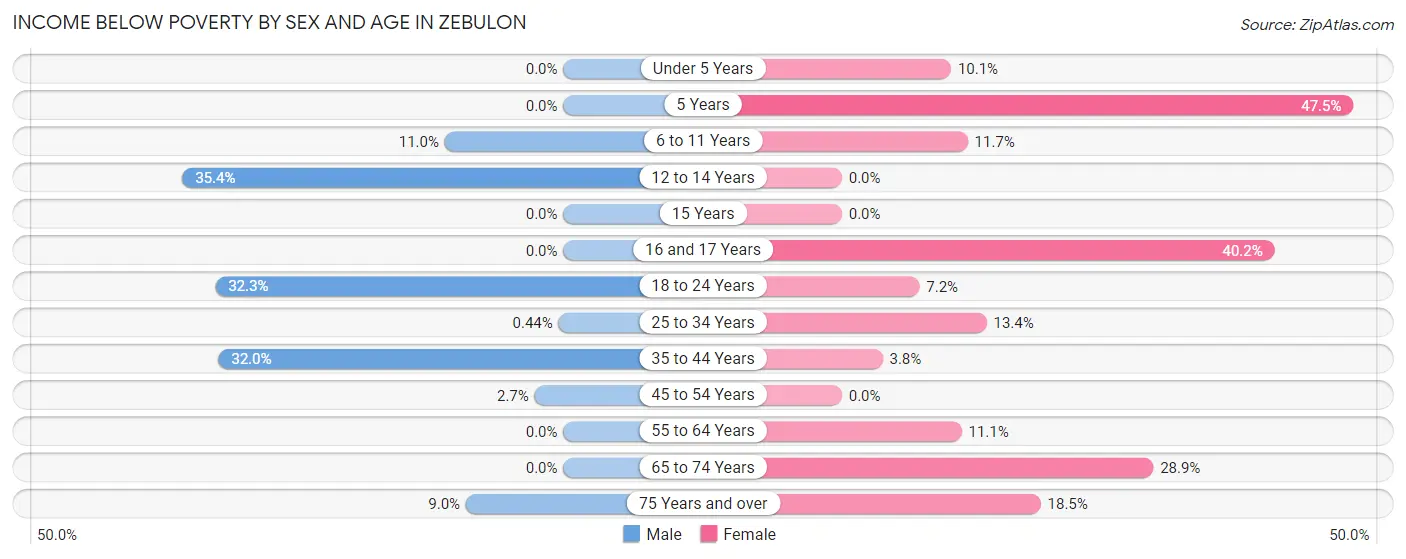
| Age Bracket | Male | Female |
| Under 5 Years | 0 (0.0%) | 23 (10.1%) |
| 5 Years | 0 (0.0%) | 75 (47.5%) |
| 6 to 11 Years | 22 (11.0%) | 46 (11.7%) |
| 12 to 14 Years | 29 (35.4%) | 0 (0.0%) |
| 15 Years | 0 (0.0%) | 0 (0.0%) |
| 16 and 17 Years | 0 (0.0%) | 51 (40.2%) |
| 18 to 24 Years | 74 (32.3%) | 26 (7.2%) |
| 25 to 34 Years | 2 (0.4%) | 101 (13.4%) |
| 35 to 44 Years | 154 (32.0%) | 30 (3.8%) |
| 45 to 54 Years | 14 (2.7%) | 0 (0.0%) |
| 55 to 64 Years | 0 (0.0%) | 34 (11.1%) |
| 65 to 74 Years | 0 (0.0%) | 126 (28.9%) |
| 75 Years and over | 17 (9.0%) | 31 (18.4%) |
| Total | 312 (10.6%) | 543 (12.4%) |
Income Above Poverty by Sex and Age in Zebulon
According to the poverty statistics in Zebulon, males aged under 5 years and females aged 12 to 14 years are the age groups that are most secure financially, with 100.0% of males and 100.0% of females in these age groups living above the poverty line.
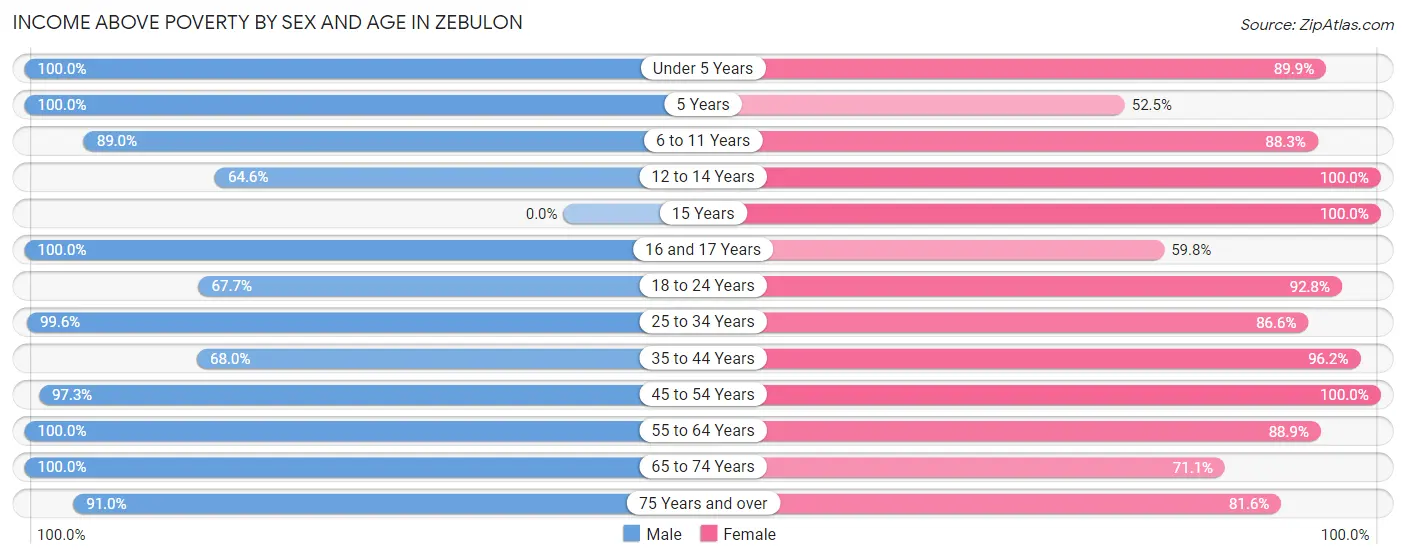
| Age Bracket | Male | Female |
| Under 5 Years | 219 (100.0%) | 204 (89.9%) |
| 5 Years | 87 (100.0%) | 83 (52.5%) |
| 6 to 11 Years | 178 (89.0%) | 348 (88.3%) |
| 12 to 14 Years | 53 (64.6%) | 167 (100.0%) |
| 15 Years | 0 (0.0%) | 79 (100.0%) |
| 16 and 17 Years | 95 (100.0%) | 76 (59.8%) |
| 18 to 24 Years | 155 (67.7%) | 335 (92.8%) |
| 25 to 34 Years | 457 (99.6%) | 651 (86.6%) |
| 35 to 44 Years | 327 (68.0%) | 764 (96.2%) |
| 45 to 54 Years | 511 (97.3%) | 420 (100.0%) |
| 55 to 64 Years | 109 (100.0%) | 272 (88.9%) |
| 65 to 74 Years | 277 (100.0%) | 310 (71.1%) |
| 75 Years and over | 171 (91.0%) | 137 (81.6%) |
| Total | 2,639 (89.4%) | 3,846 (87.6%) |
Income Below Poverty Among Married-Couple Families in Zebulon
The poverty statistics for married-couple families in Zebulon show that 5.0% or 61 of the total 1,220 families live below the poverty line. Families with 3 or 4 children have the highest poverty rate of 52.1%, comprising of 61 families. On the other hand, families with no children have the lowest poverty rate of 0.0%, which includes 0 families.
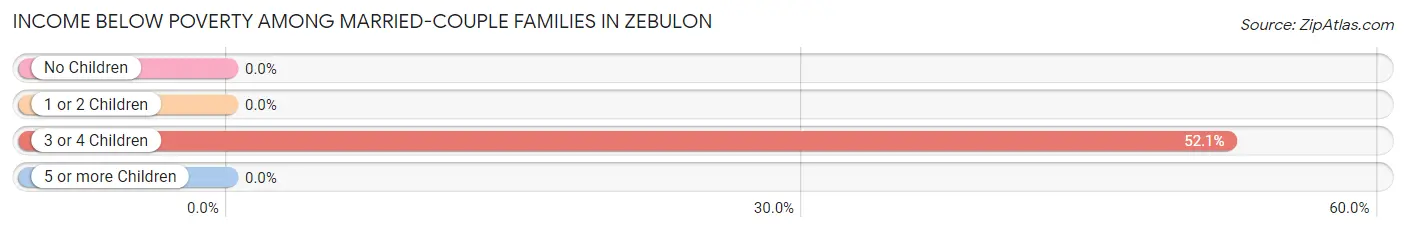
| Children | Above Poverty | Below Poverty |
| No Children | 676 (100.0%) | 0 (0.0%) |
| 1 or 2 Children | 427 (100.0%) | 0 (0.0%) |
| 3 or 4 Children | 56 (47.9%) | 61 (52.1%) |
| 5 or more Children | 0 (0.0%) | 0 (0.0%) |
| Total | 1,159 (95.0%) | 61 (5.0%) |
Income Below Poverty Among Single-Parent Households in Zebulon
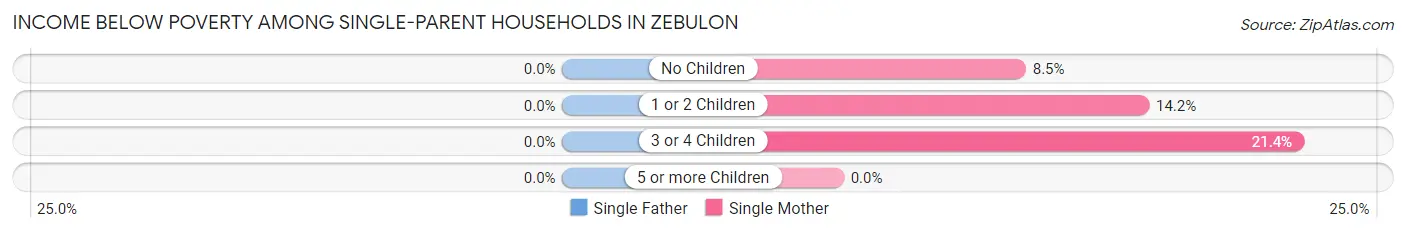
| Children | Single Father | Single Mother |
| No Children | 0 (0.0%) | 19 (8.5%) |
| 1 or 2 Children | 0 (0.0%) | 31 (14.2%) |
| 3 or 4 Children | 0 (0.0%) | 24 (21.4%) |
| 5 or more Children | 0 (0.0%) | 0 (0.0%) |
| Total | 0 (0.0%) | 74 (13.4%) |
Income Below Poverty Among Married-Couple vs Single-Parent Households in Zebulon
The poverty data for Zebulon shows that 61 of the married-couple family households (5.0%) and 74 of the single-parent households (12.2%) are living below the poverty level. Within the married-couple family households, those with 3 or 4 children have the highest poverty rate, with 61 households (52.1%) falling below the poverty line. Among the single-parent households, those with 3 or 4 children have the highest poverty rate, with 24 household (21.4%) living below poverty.
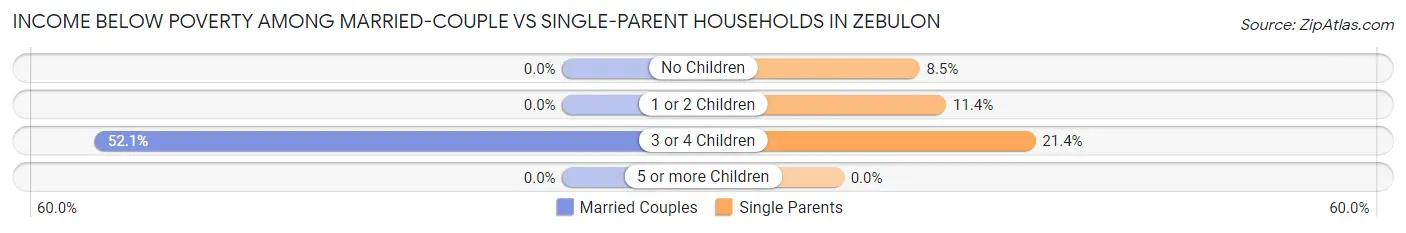
| Children | Married-Couple Families | Single-Parent Households |
| No Children | 0 (0.0%) | 19 (8.5%) |
| 1 or 2 Children | 0 (0.0%) | 31 (11.4%) |
| 3 or 4 Children | 61 (52.1%) | 24 (21.4%) |
| 5 or more Children | 0 (0.0%) | 0 (0.0%) |
| Total | 61 (5.0%) | 74 (12.2%) |
Race in Zebulon
The most populous races in Zebulon are White / Caucasian (3,227 | 43.5%), Black / African American (2,596 | 35.0%), and Hispanic or Latino (1,475 | 19.9%).
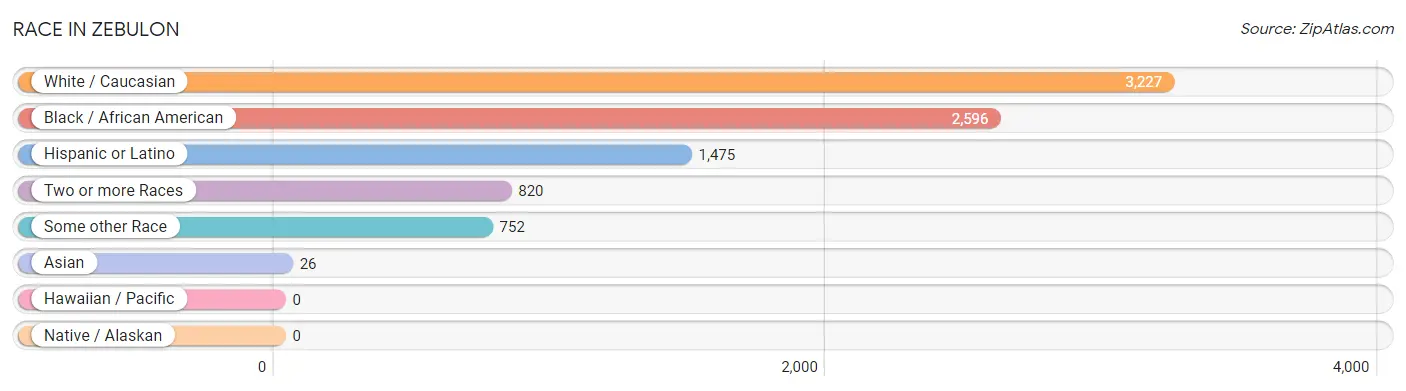
| Race | # Population | % Population |
| Asian | 26 | 0.4% |
| Black / African American | 2,596 | 35.0% |
| Hawaiian / Pacific | 0 | 0.0% |
| Hispanic or Latino | 1,475 | 19.9% |
| Native / Alaskan | 0 | 0.0% |
| White / Caucasian | 3,227 | 43.5% |
| Two or more Races | 820 | 11.1% |
| Some other Race | 752 | 10.1% |
| Total | 7,421 | 100.0% |
Ancestry in Zebulon
The most populous ancestries reported in Zebulon are Mexican (1,318 | 17.8%), English (828 | 11.2%), Irish (614 | 8.3%), German (542 | 7.3%), and Welsh (195 | 2.6%), together accounting for 47.1% of all Zebulon residents.
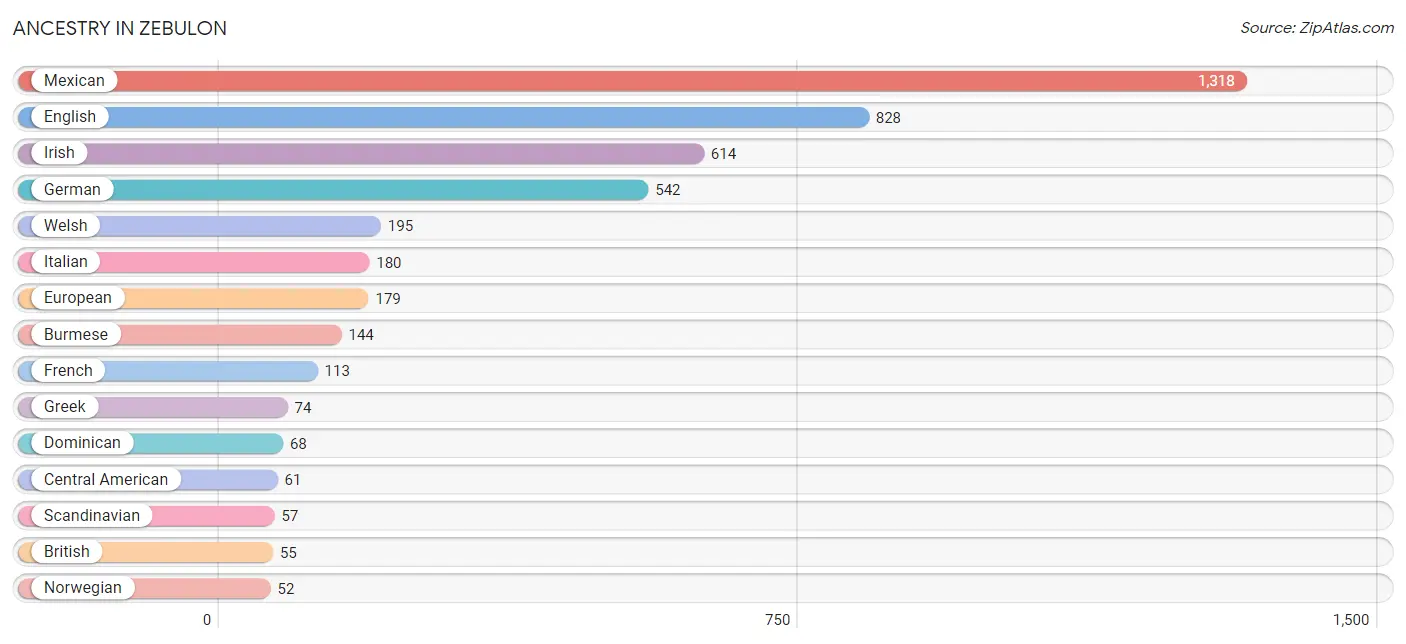
| Ancestry | # Population | % Population |
| African | 22 | 0.3% |
| American | 48 | 0.6% |
| Bhutanese | 3 | 0.0% |
| British | 55 | 0.7% |
| Burmese | 144 | 1.9% |
| Central American | 61 | 0.8% |
| Cherokee | 23 | 0.3% |
| Cheyenne | 23 | 0.3% |
| Dominican | 68 | 0.9% |
| Dutch | 34 | 0.5% |
| English | 828 | 11.2% |
| European | 179 | 2.4% |
| French | 113 | 1.5% |
| French Canadian | 51 | 0.7% |
| German | 542 | 7.3% |
| Greek | 74 | 1.0% |
| Guatemalan | 34 | 0.5% |
| Honduran | 18 | 0.2% |
| Hungarian | 16 | 0.2% |
| Indian (Asian) | 24 | 0.3% |
| Irish | 614 | 8.3% |
| Italian | 180 | 2.4% |
| Mexican | 1,318 | 17.8% |
| Norwegian | 52 | 0.7% |
| Polish | 45 | 0.6% |
| Puerto Rican | 2 | 0.0% |
| Russian | 13 | 0.2% |
| Salvadoran | 9 | 0.1% |
| Scandinavian | 57 | 0.8% |
| Scotch-Irish | 47 | 0.6% |
| Scottish | 17 | 0.2% |
| Slovak | 32 | 0.4% |
| Subsaharan African | 22 | 0.3% |
| Swiss | 19 | 0.3% |
| Ukrainian | 17 | 0.2% |
| Welsh | 195 | 2.6% | View All 36 Rows |
Immigrants in Zebulon
The most numerous immigrant groups reported in Zebulon came from Latin America (1,090 | 14.7%), Central America (996 | 13.4%), Mexico (971 | 13.1%), Africa (124 | 1.7%), and Nigeria (89 | 1.2%), together accounting for 44.1% of all Zebulon residents.
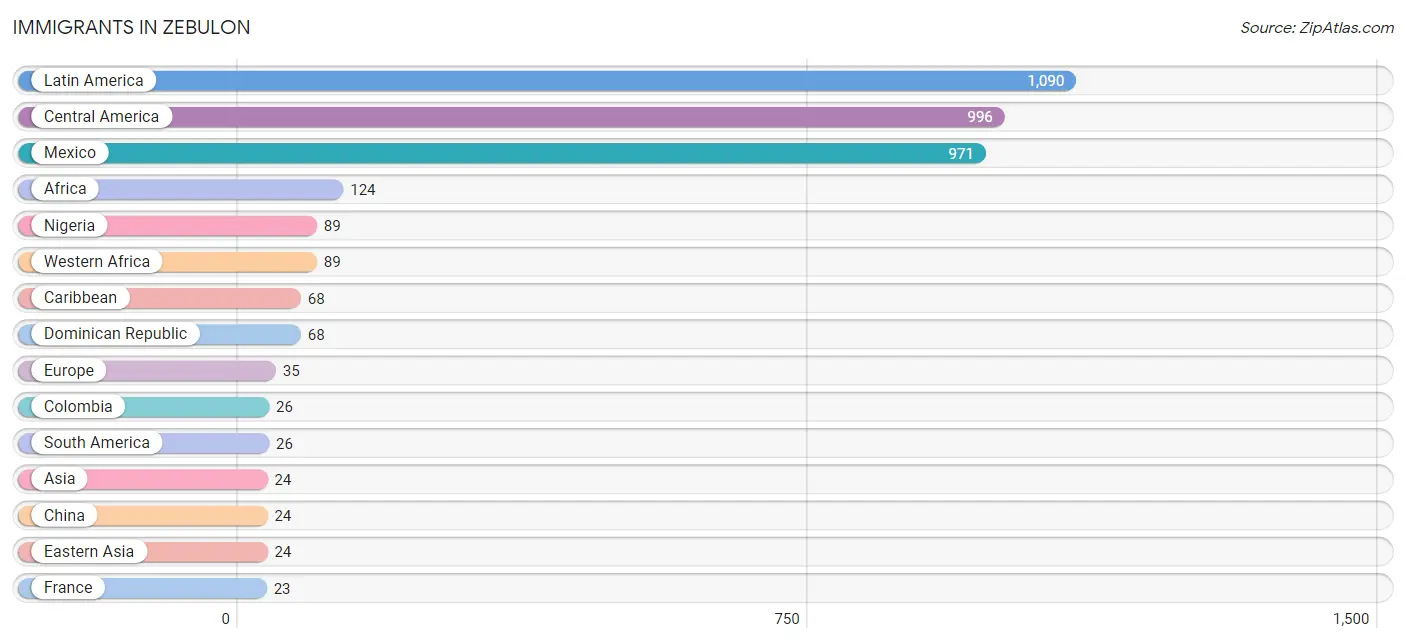
| Immigration Origin | # Population | % Population |
| Africa | 124 | 1.7% |
| Asia | 24 | 0.3% |
| Caribbean | 68 | 0.9% |
| Central America | 996 | 13.4% |
| China | 24 | 0.3% |
| Colombia | 26 | 0.4% |
| Dominican Republic | 68 | 0.9% |
| Eastern Asia | 24 | 0.3% |
| El Salvador | 9 | 0.1% |
| Europe | 35 | 0.5% |
| France | 23 | 0.3% |
| Guatemala | 16 | 0.2% |
| Latin America | 1,090 | 14.7% |
| Mexico | 971 | 13.1% |
| Nigeria | 89 | 1.2% |
| Northern Africa | 23 | 0.3% |
| Northern Europe | 12 | 0.2% |
| South Africa | 12 | 0.2% |
| South America | 26 | 0.4% |
| Western Africa | 89 | 1.2% |
| Western Europe | 23 | 0.3% | View All 21 Rows |
Sex and Age in Zebulon
Sex and Age in Zebulon
The most populous age groups in Zebulon are 45 to 49 Years (410 | 13.7%) for men and 40 to 44 Years (582 | 13.2%) for women.
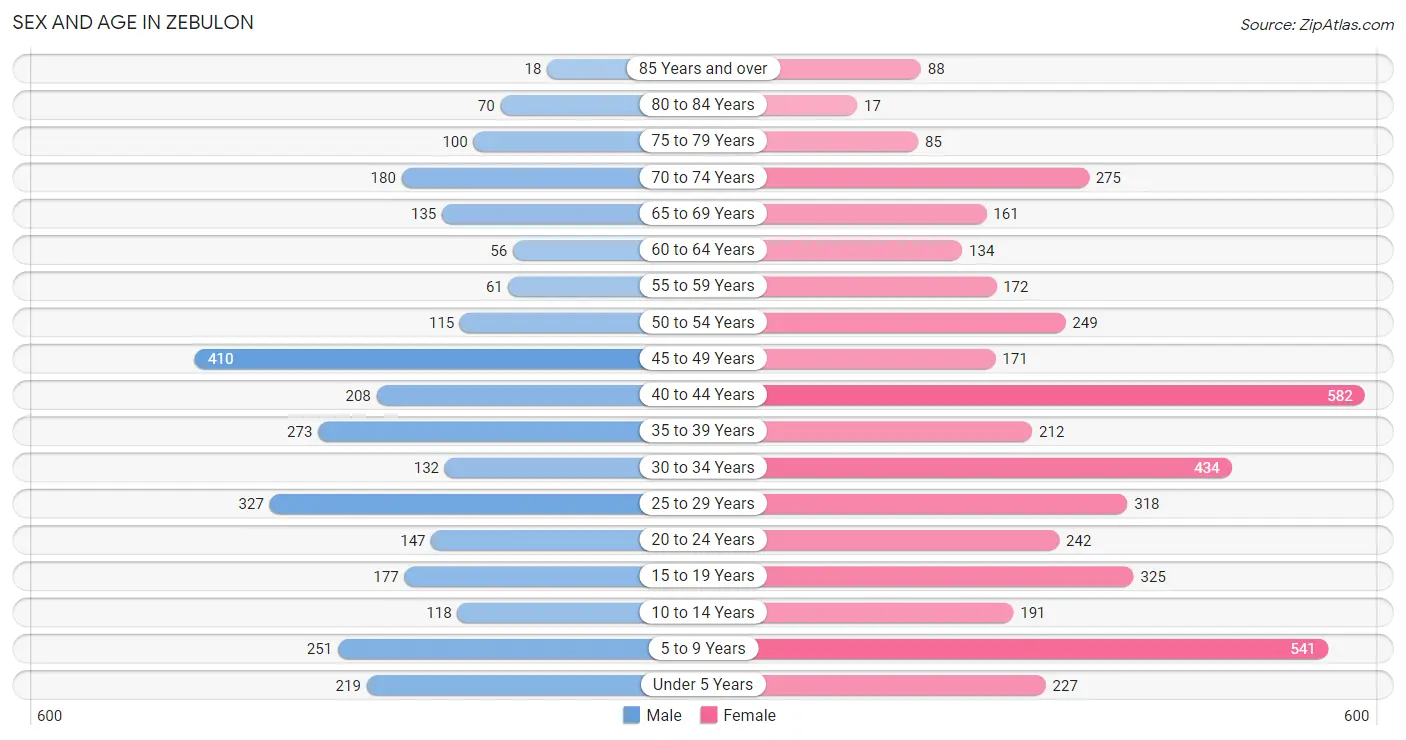
| Age Bracket | Male | Female |
| Under 5 Years | 219 (7.3%) | 227 (5.1%) |
| 5 to 9 Years | 251 (8.4%) | 541 (12.2%) |
| 10 to 14 Years | 118 (3.9%) | 191 (4.3%) |
| 15 to 19 Years | 177 (5.9%) | 325 (7.3%) |
| 20 to 24 Years | 147 (4.9%) | 242 (5.5%) |
| 25 to 29 Years | 327 (10.9%) | 318 (7.2%) |
| 30 to 34 Years | 132 (4.4%) | 434 (9.8%) |
| 35 to 39 Years | 273 (9.1%) | 212 (4.8%) |
| 40 to 44 Years | 208 (6.9%) | 582 (13.2%) |
| 45 to 49 Years | 410 (13.7%) | 171 (3.9%) |
| 50 to 54 Years | 115 (3.8%) | 249 (5.6%) |
| 55 to 59 Years | 61 (2.0%) | 172 (3.9%) |
| 60 to 64 Years | 56 (1.9%) | 134 (3.0%) |
| 65 to 69 Years | 135 (4.5%) | 161 (3.6%) |
| 70 to 74 Years | 180 (6.0%) | 275 (6.2%) |
| 75 to 79 Years | 100 (3.3%) | 85 (1.9%) |
| 80 to 84 Years | 70 (2.3%) | 17 (0.4%) |
| 85 Years and over | 18 (0.6%) | 88 (2.0%) |
| Total | 2,997 (100.0%) | 4,424 (100.0%) |
Families and Households in Zebulon
Median Family Size in Zebulon
The median family size in Zebulon is 3.19 persons per family, with single female/mother families (554 | 30.3%) accounting for the largest median family size of 3.33 persons per family. On the other hand, single male/father families (53 | 2.9%) represent the smallest median family size with 2.25 persons per family.
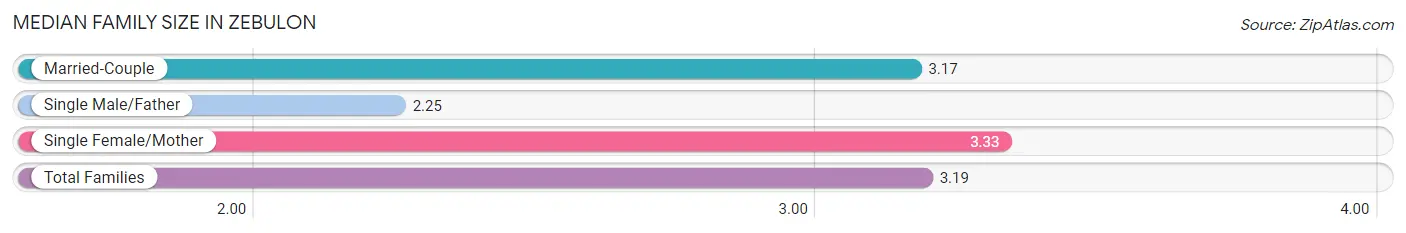
| Family Type | # Families | Family Size |
| Married-Couple | 1,220 (66.8%) | 3.17 |
| Single Male/Father | 53 (2.9%) | 2.25 |
| Single Female/Mother | 554 (30.3%) | 3.33 |
| Total Families | 1,827 (100.0%) | 3.19 |
Median Household Size in Zebulon
The median household size in Zebulon is 2.78 persons per household, with single female/mother households (554 | 21.0%) accounting for the largest median household size of 3.66 persons per household. non-family households (806 | 30.6%) represent the smallest median household size with 1.53 persons per household.
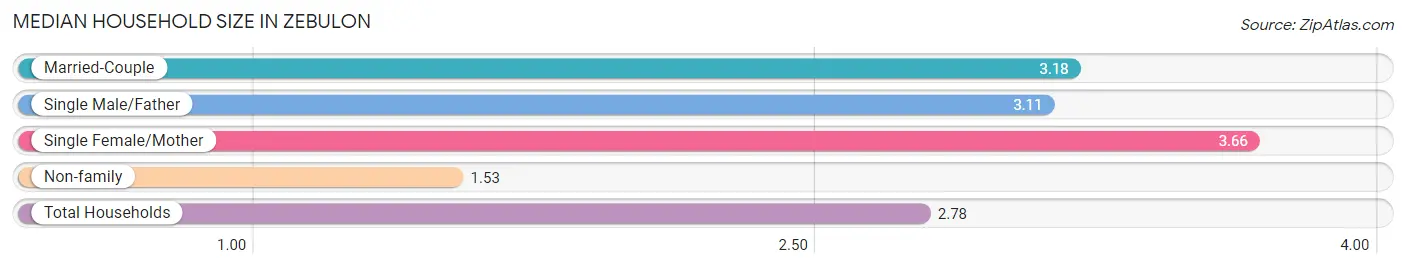
| Household Type | # Households | Household Size |
| Married-Couple | 1,220 (46.3%) | 3.18 |
| Single Male/Father | 53 (2.0%) | 3.11 |
| Single Female/Mother | 554 (21.0%) | 3.66 |
| Non-family | 806 (30.6%) | 1.53 |
| Total Households | 2,633 (100.0%) | 2.78 |
Household Size by Marriage Status in Zebulon
Out of a total of 2,633 households in Zebulon, 1,827 (69.4%) are family households, while 806 (30.6%) are nonfamily households. The most numerous type of family households are 2-person households, comprising 779, and the most common type of nonfamily households are 1-person households, comprising 510.
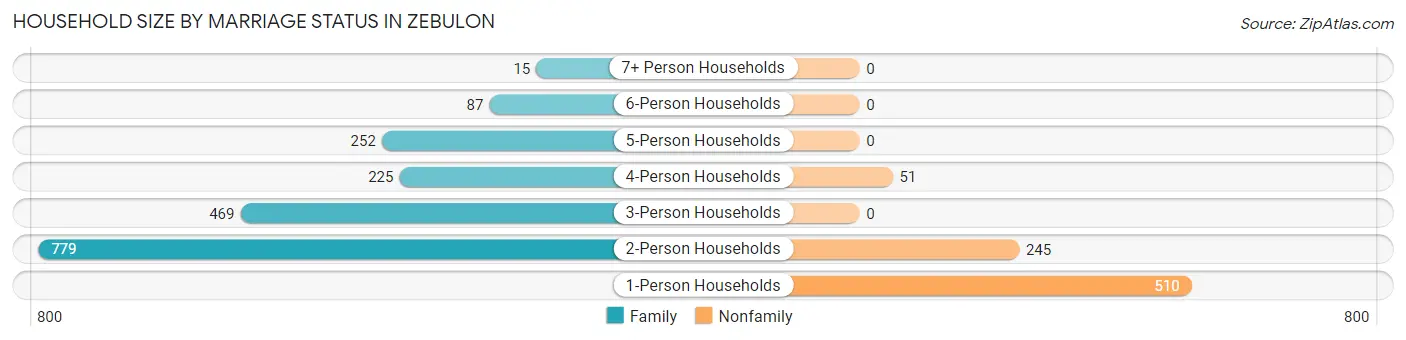
| Household Size | Family Households | Nonfamily Households |
| 1-Person Households | - | 510 (19.4%) |
| 2-Person Households | 779 (29.6%) | 245 (9.3%) |
| 3-Person Households | 469 (17.8%) | 0 (0.0%) |
| 4-Person Households | 225 (8.6%) | 51 (1.9%) |
| 5-Person Households | 252 (9.6%) | 0 (0.0%) |
| 6-Person Households | 87 (3.3%) | 0 (0.0%) |
| 7+ Person Households | 15 (0.6%) | 0 (0.0%) |
| Total | 1,827 (69.4%) | 806 (30.6%) |
Female Fertility in Zebulon
Fertility by Age in Zebulon
Average fertility rate in Zebulon is 56.0 births per 1,000 women. Women in the age bracket of 20 to 34 years have the highest fertility rate with 110.0 births per 1,000 women. Women in the age bracket of 20 to 34 years acount for 83.9% of all women with births.
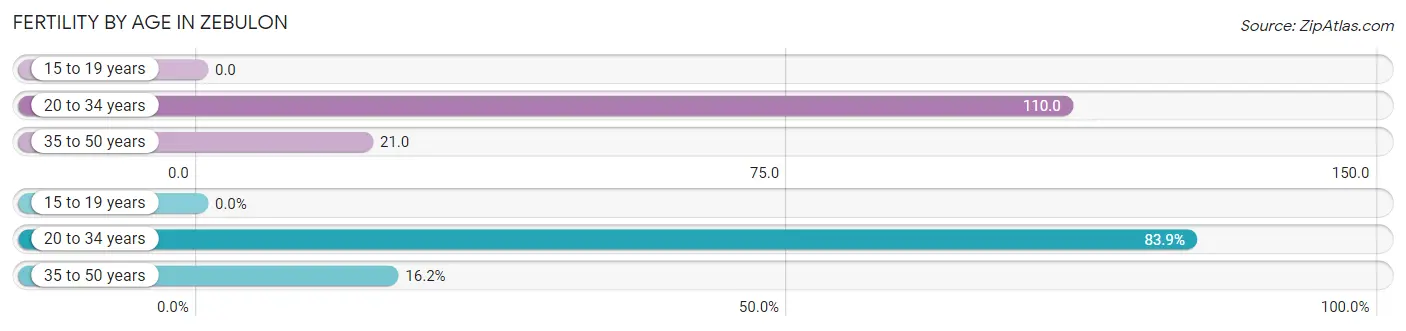
| Age Bracket | Women with Births | Births / 1,000 Women |
| 15 to 19 years | 0 (0.0%) | 0.0 |
| 20 to 34 years | 109 (83.9%) | 110.0 |
| 35 to 50 years | 21 (16.2%) | 21.0 |
| Total | 130 (100.0%) | 56.0 |
Fertility by Age by Marriage Status in Zebulon
81.5% of women with births (130) in Zebulon are married. The highest percentage of unmarried women with births falls into 20 to 34 years age bracket with 22.0% of them unmarried at the time of birth, while the lowest percentage of unmarried women with births belong to 35 to 50 years age bracket with 0.0% of them unmarried.
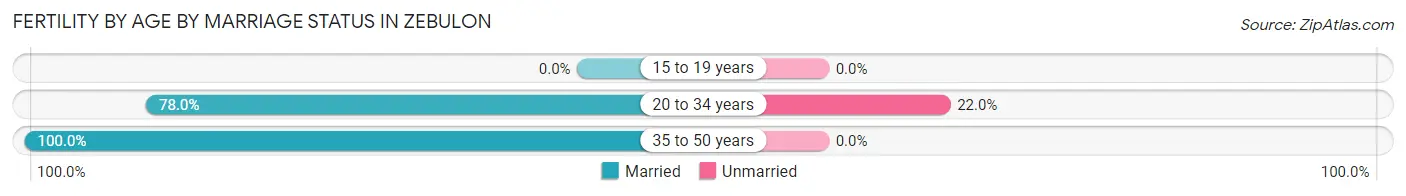
| Age Bracket | Married | Unmarried |
| 15 to 19 years | 0 (0.0%) | 0 (0.0%) |
| 20 to 34 years | 85 (78.0%) | 24 (22.0%) |
| 35 to 50 years | 21 (100.0%) | 0 (0.0%) |
| Total | 106 (81.5%) | 24 (18.5%) |
Fertility by Education in Zebulon
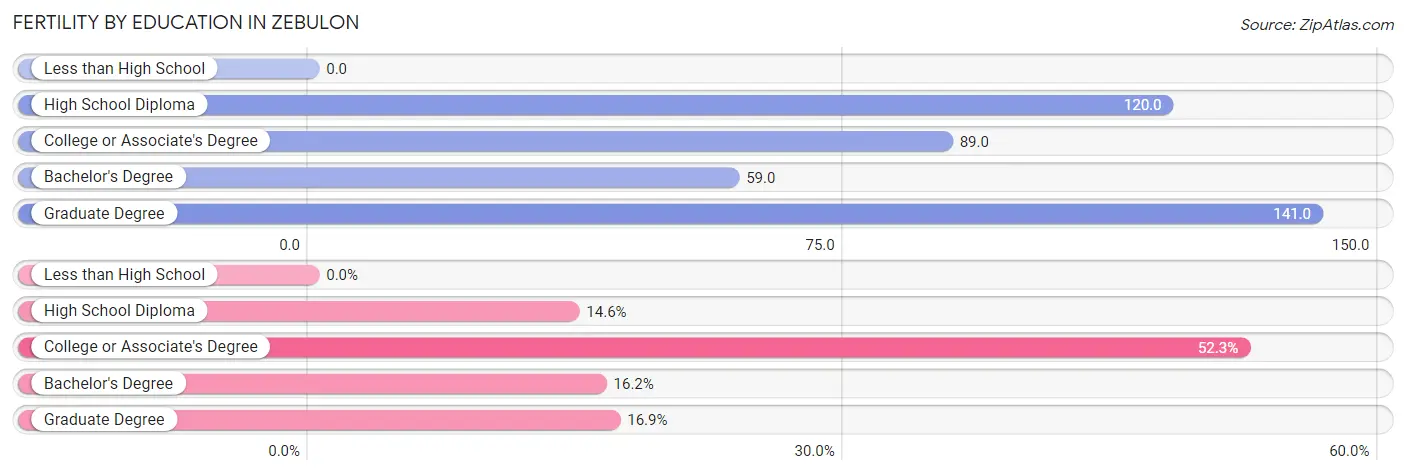
| Educational Attainment | Women with Births | Births / 1,000 Women |
| Less than High School | 0 (0.0%) | 0.0 |
| High School Diploma | 19 (14.6%) | 120.0 |
| College or Associate's Degree | 68 (52.3%) | 89.0 |
| Bachelor's Degree | 21 (16.2%) | 59.0 |
| Graduate Degree | 22 (16.9%) | 141.0 |
| Total | 130 (100.0%) | 56.0 |
Fertility by Education by Marriage Status in Zebulon
18.5% of women with births in Zebulon are unmarried. Women with the educational attainment of high school diploma are most likely to be married with 100.0% of them married at childbirth, while women with the educational attainment of college or associate's degree are least likely to be married with 35.3% of them unmarried at childbirth.
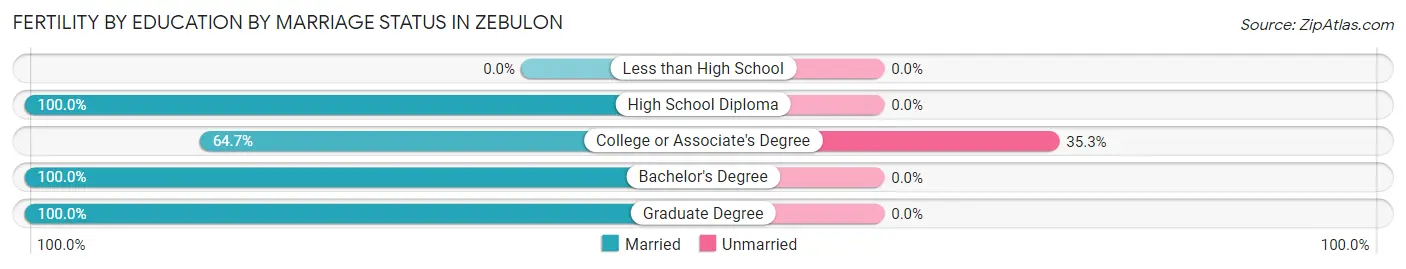
| Educational Attainment | Married | Unmarried |
| Less than High School | 0 (0.0%) | 0 (0.0%) |
| High School Diploma | 19 (100.0%) | 0 (0.0%) |
| College or Associate's Degree | 44 (64.7%) | 24 (35.3%) |
| Bachelor's Degree | 21 (100.0%) | 0 (0.0%) |
| Graduate Degree | 22 (100.0%) | 0 (0.0%) |
| Total | 106 (81.5%) | 24 (18.5%) |
Employment Characteristics in Zebulon
Employment by Class of Employer in Zebulon
Among the 3,151 employed individuals in Zebulon, private company employees (2,344 | 74.4%), state government employees (228 | 7.2%), and self-employed (not incorporated) (227 | 7.2%) make up the most common classes of employment.
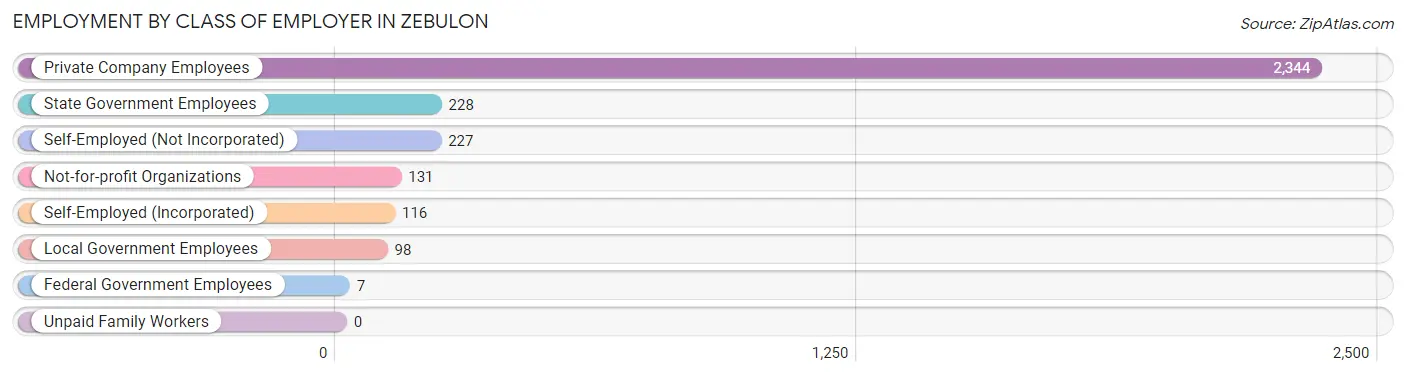
| Employer Class | # Employees | % Employees |
| Private Company Employees | 2,344 | 74.4% |
| Self-Employed (Incorporated) | 116 | 3.7% |
| Self-Employed (Not Incorporated) | 227 | 7.2% |
| Not-for-profit Organizations | 131 | 4.2% |
| Local Government Employees | 98 | 3.1% |
| State Government Employees | 228 | 7.2% |
| Federal Government Employees | 7 | 0.2% |
| Unpaid Family Workers | 0 | 0.0% |
| Total | 3,151 | 100.0% |
Employment Status by Age in Zebulon
According to the labor force statistics for Zebulon, out of the total population over 16 years of age (5,795), 60.4% or 3,500 individuals are in the labor force, with 9.0% or 315 of them unemployed. The age group with the highest labor force participation rate is 25 to 29 years, with 91.5% or 590 individuals in the labor force. Within the labor force, the 16 to 19 years age range has the highest percentage of unemployed individuals, with 57.8% or 67 of them being unemployed.
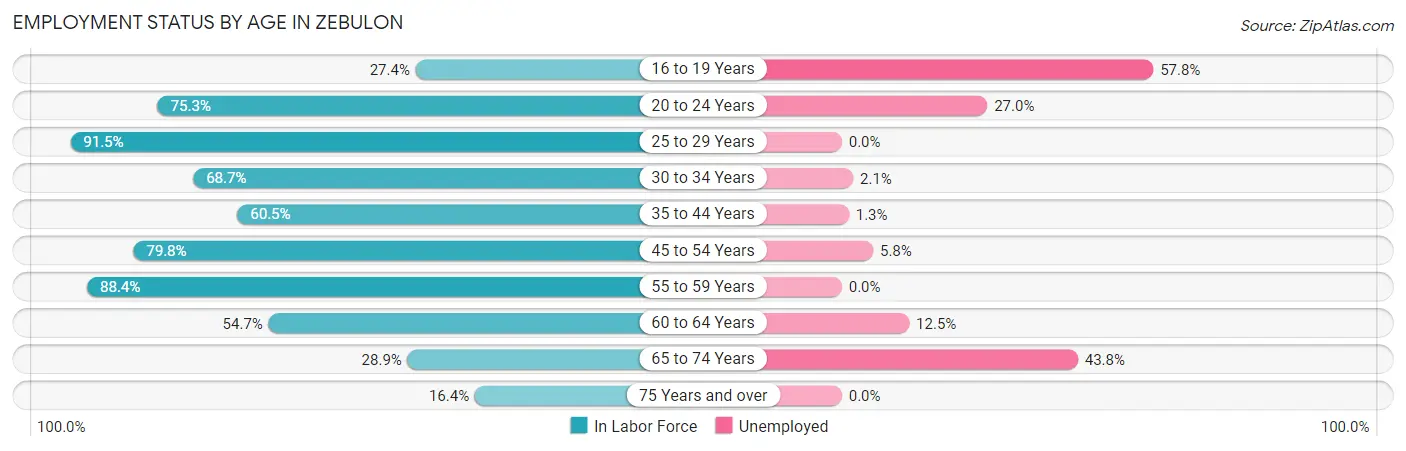
| Age Bracket | In Labor Force | Unemployed |
| 16 to 19 Years | 116 (27.4%) | 67 (57.8%) |
| 20 to 24 Years | 293 (75.3%) | 79 (27.0%) |
| 25 to 29 Years | 590 (91.5%) | 0 (0.0%) |
| 30 to 34 Years | 389 (68.7%) | 8 (2.1%) |
| 35 to 44 Years | 771 (60.5%) | 10 (1.3%) |
| 45 to 54 Years | 754 (79.8%) | 44 (5.8%) |
| 55 to 59 Years | 206 (88.4%) | 0 (0.0%) |
| 60 to 64 Years | 104 (54.7%) | 13 (12.5%) |
| 65 to 74 Years | 217 (28.9%) | 95 (43.8%) |
| 75 Years and over | 62 (16.4%) | 0 (0.0%) |
| Total | 3,500 (60.4%) | 315 (9.0%) |
Employment Status by Educational Attainment in Zebulon
According to labor force statistics for Zebulon, 73.0% of individuals (2,813) out of the total population between 25 and 64 years of age (3,854) are in the labor force, with 2.7% or 76 of them being unemployed. The group with the highest labor force participation rate are those with the educational attainment of bachelor's degree or higher, with 93.7% or 886 individuals in the labor force. Within the labor force, individuals with college / associate degree education have the highest percentage of unemployment, with 5.3% or 52 of them being unemployed.
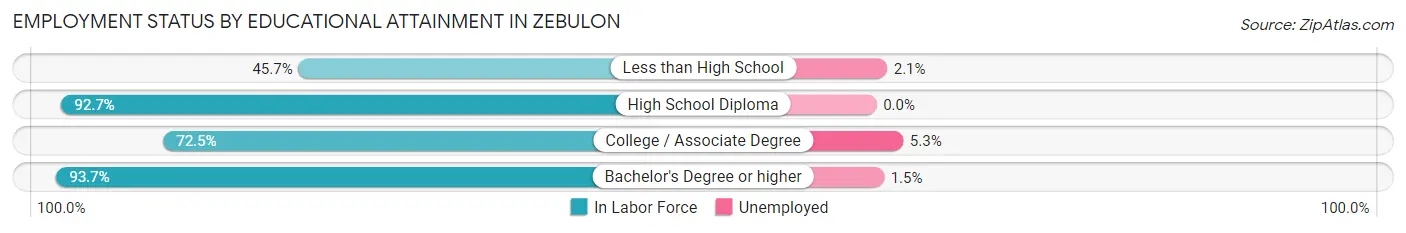
| Educational Attainment | In Labor Force | Unemployed |
| Less than High School | 481 (45.7%) | 22 (2.1%) |
| High School Diploma | 473 (92.7%) | 0 (0.0%) |
| College / Associate Degree | 975 (72.5%) | 71 (5.3%) |
| Bachelor's Degree or higher | 886 (93.7%) | 14 (1.5%) |
| Total | 2,813 (73.0%) | 104 (2.7%) |
Employment Occupations by Sex in Zebulon
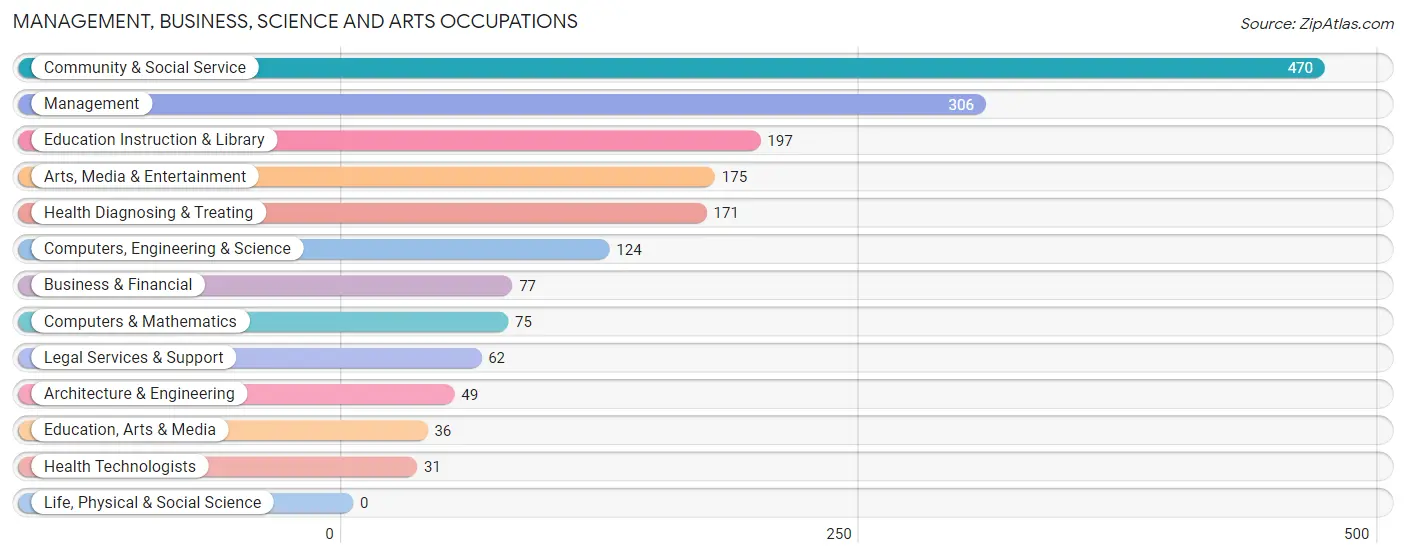
Management, Business, Science and Arts Occupations
The most common Management, Business, Science and Arts occupations in Zebulon are Community & Social Service (470 | 14.7%), Management (306 | 9.6%), Education Instruction & Library (197 | 6.2%), Arts, Media & Entertainment (175 | 5.5%), and Health Diagnosing & Treating (171 | 5.4%).
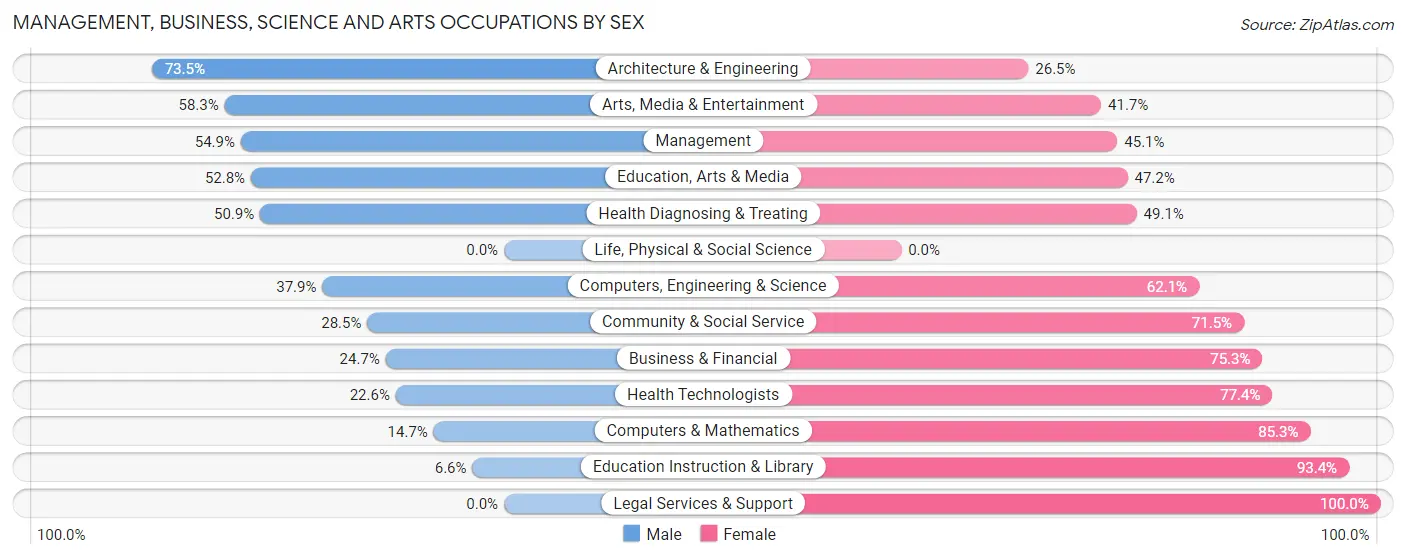
Management, Business, Science and Arts Occupations by Sex
Within the Management, Business, Science and Arts occupations in Zebulon, the most male-oriented occupations are Architecture & Engineering (73.5%), Arts, Media & Entertainment (58.3%), and Management (54.9%), while the most female-oriented occupations are Legal Services & Support (100.0%), Education Instruction & Library (93.4%), and Computers & Mathematics (85.3%).
| Occupation | Male | Female |
| Management | 168 (54.9%) | 138 (45.1%) |
| Business & Financial | 19 (24.7%) | 58 (75.3%) |
| Computers, Engineering & Science | 47 (37.9%) | 77 (62.1%) |
| Computers & Mathematics | 11 (14.7%) | 64 (85.3%) |
| Architecture & Engineering | 36 (73.5%) | 13 (26.5%) |
| Life, Physical & Social Science | 0 (0.0%) | 0 (0.0%) |
| Community & Social Service | 134 (28.5%) | 336 (71.5%) |
| Education, Arts & Media | 19 (52.8%) | 17 (47.2%) |
| Legal Services & Support | 0 (0.0%) | 62 (100.0%) |
| Education Instruction & Library | 13 (6.6%) | 184 (93.4%) |
| Arts, Media & Entertainment | 102 (58.3%) | 73 (41.7%) |
| Health Diagnosing & Treating | 87 (50.9%) | 84 (49.1%) |
| Health Technologists | 7 (22.6%) | 24 (77.4%) |
| Total (Category) | 455 (39.6%) | 693 (60.4%) |
| Total (Overall) | 1,621 (50.9%) | 1,566 (49.1%) |
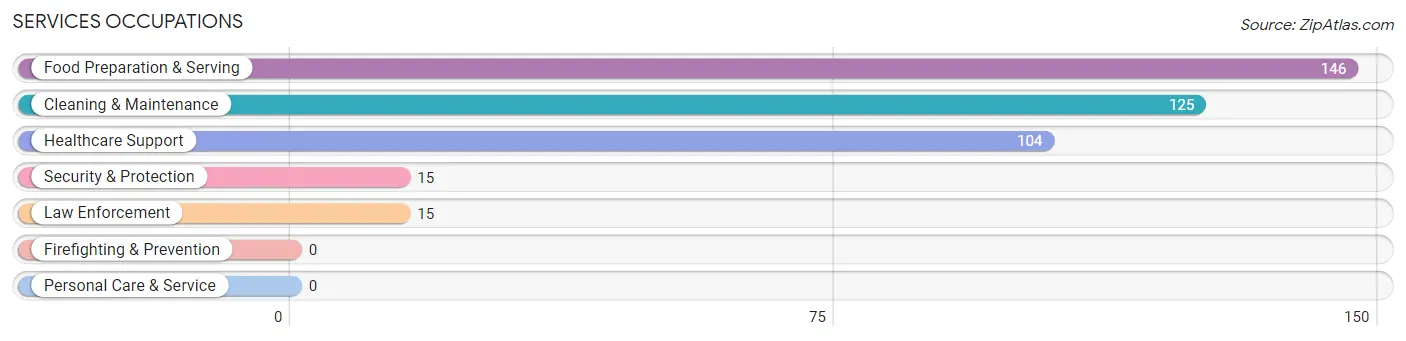
Services Occupations
The most common Services occupations in Zebulon are Food Preparation & Serving (146 | 4.6%), Cleaning & Maintenance (125 | 3.9%), Healthcare Support (104 | 3.3%), Security & Protection (15 | 0.5%), and Law Enforcement (15 | 0.5%).
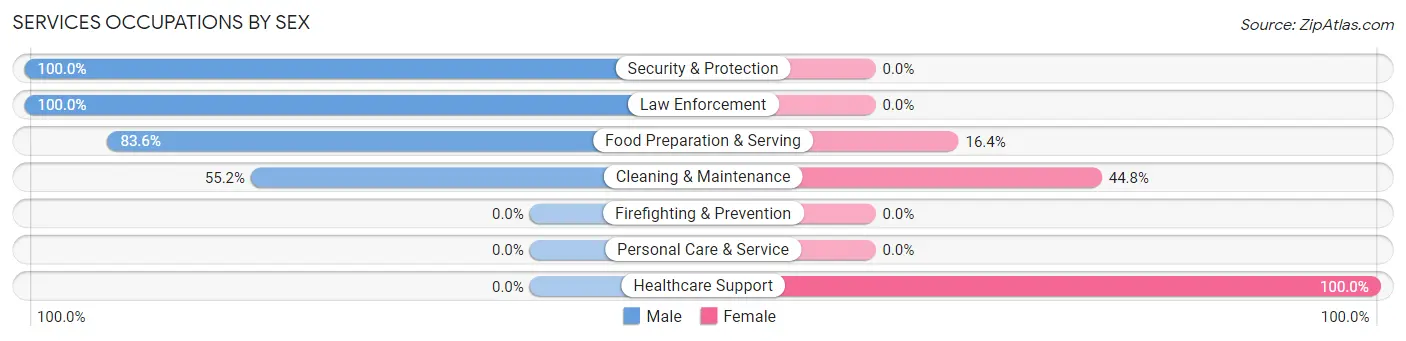
Services Occupations by Sex
Within the Services occupations in Zebulon, the most male-oriented occupations are Security & Protection (100.0%), Law Enforcement (100.0%), and Food Preparation & Serving (83.6%), while the most female-oriented occupations are Healthcare Support (100.0%), Cleaning & Maintenance (44.8%), and Food Preparation & Serving (16.4%).
| Occupation | Male | Female |
| Healthcare Support | 0 (0.0%) | 104 (100.0%) |
| Security & Protection | 15 (100.0%) | 0 (0.0%) |
| Firefighting & Prevention | 0 (0.0%) | 0 (0.0%) |
| Law Enforcement | 15 (100.0%) | 0 (0.0%) |
| Food Preparation & Serving | 122 (83.6%) | 24 (16.4%) |
| Cleaning & Maintenance | 69 (55.2%) | 56 (44.8%) |
| Personal Care & Service | 0 (0.0%) | 0 (0.0%) |
| Total (Category) | 206 (52.8%) | 184 (47.2%) |
| Total (Overall) | 1,621 (50.9%) | 1,566 (49.1%) |
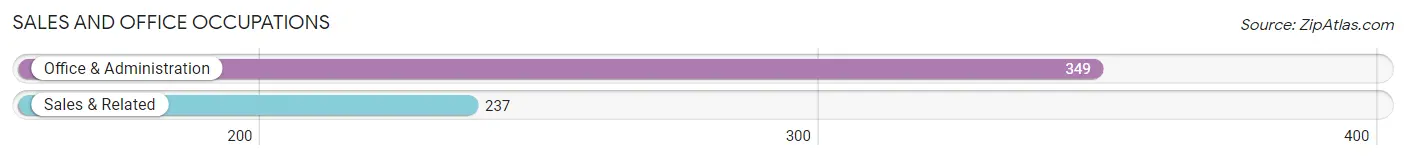
Sales and Office Occupations
The most common Sales and Office occupations in Zebulon are Office & Administration (349 | 11.0%), and Sales & Related (237 | 7.4%).
Sales and Office Occupations by Sex
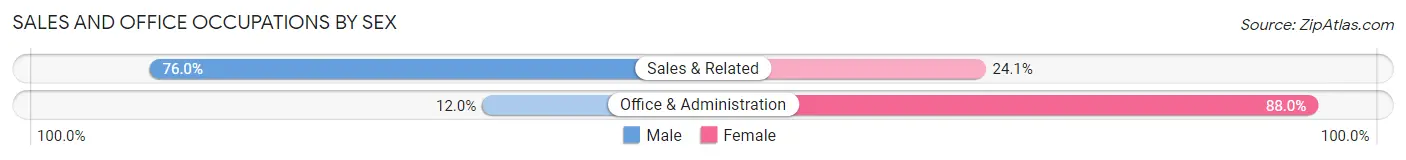
| Occupation | Male | Female |
| Sales & Related | 180 (75.9%) | 57 (24.0%) |
| Office & Administration | 42 (12.0%) | 307 (88.0%) |
| Total (Category) | 222 (37.9%) | 364 (62.1%) |
| Total (Overall) | 1,621 (50.9%) | 1,566 (49.1%) |
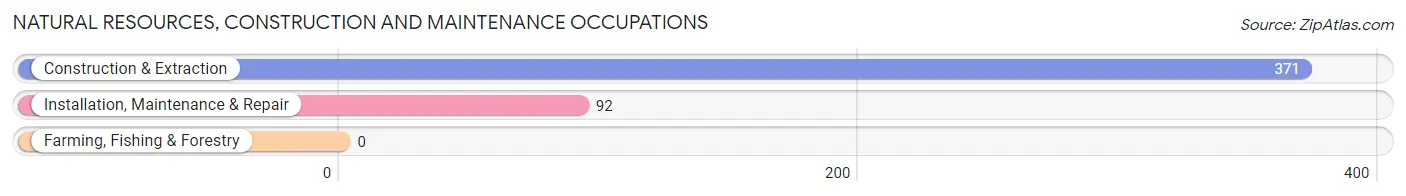
Natural Resources, Construction and Maintenance Occupations
The most common Natural Resources, Construction and Maintenance occupations in Zebulon are Construction & Extraction (371 | 11.6%), and Installation, Maintenance & Repair (92 | 2.9%).
Natural Resources, Construction and Maintenance Occupations by Sex
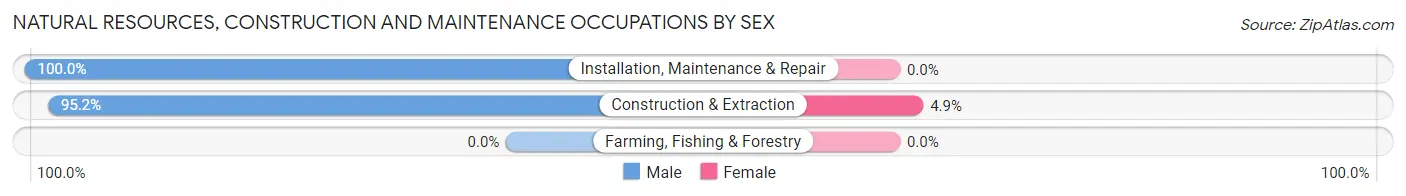
| Occupation | Male | Female |
| Farming, Fishing & Forestry | 0 (0.0%) | 0 (0.0%) |
| Construction & Extraction | 353 (95.2%) | 18 (4.9%) |
| Installation, Maintenance & Repair | 92 (100.0%) | 0 (0.0%) |
| Total (Category) | 445 (96.1%) | 18 (3.9%) |
| Total (Overall) | 1,621 (50.9%) | 1,566 (49.1%) |
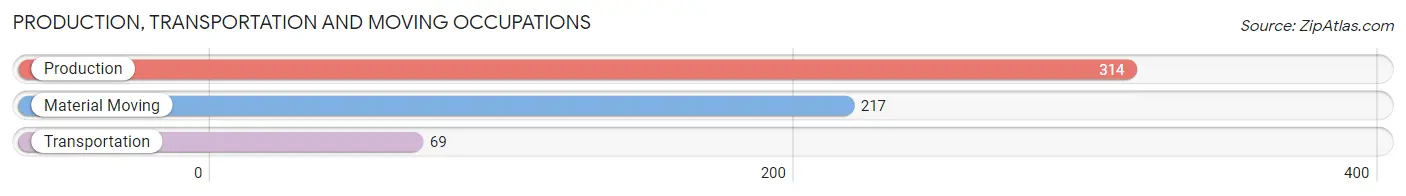
Production, Transportation and Moving Occupations
The most common Production, Transportation and Moving occupations in Zebulon are Production (314 | 9.9%), Material Moving (217 | 6.8%), and Transportation (69 | 2.2%).
Production, Transportation and Moving Occupations by Sex
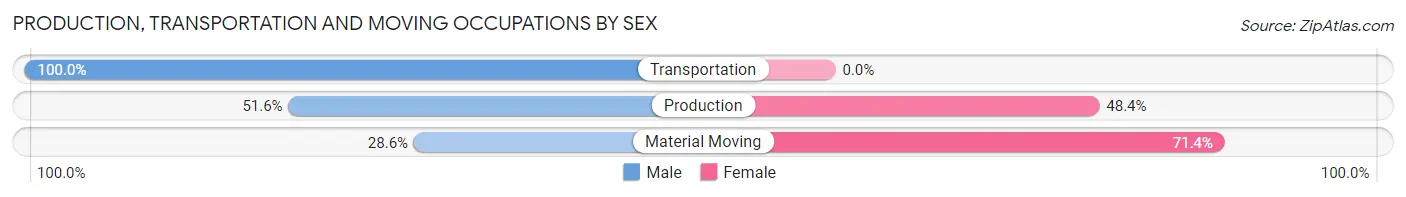
| Occupation | Male | Female |
| Production | 162 (51.6%) | 152 (48.4%) |
| Transportation | 69 (100.0%) | 0 (0.0%) |
| Material Moving | 62 (28.6%) | 155 (71.4%) |
| Total (Category) | 293 (48.8%) | 307 (51.2%) |
| Total (Overall) | 1,621 (50.9%) | 1,566 (49.1%) |
Employment Industries by Sex in Zebulon
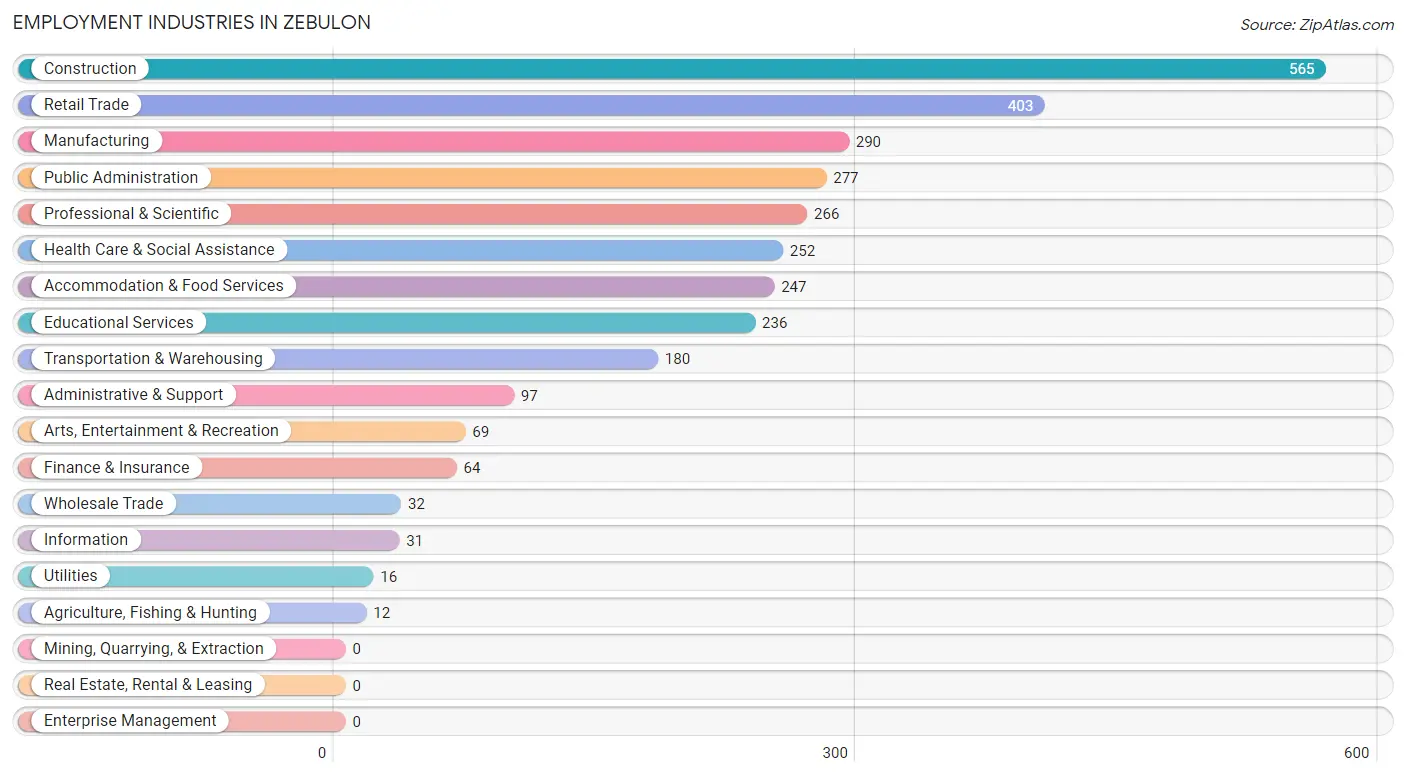
Employment Industries in Zebulon
The major employment industries in Zebulon include Construction (565 | 17.7%), Retail Trade (403 | 12.7%), Manufacturing (290 | 9.1%), Public Administration (277 | 8.7%), and Professional & Scientific (266 | 8.4%).
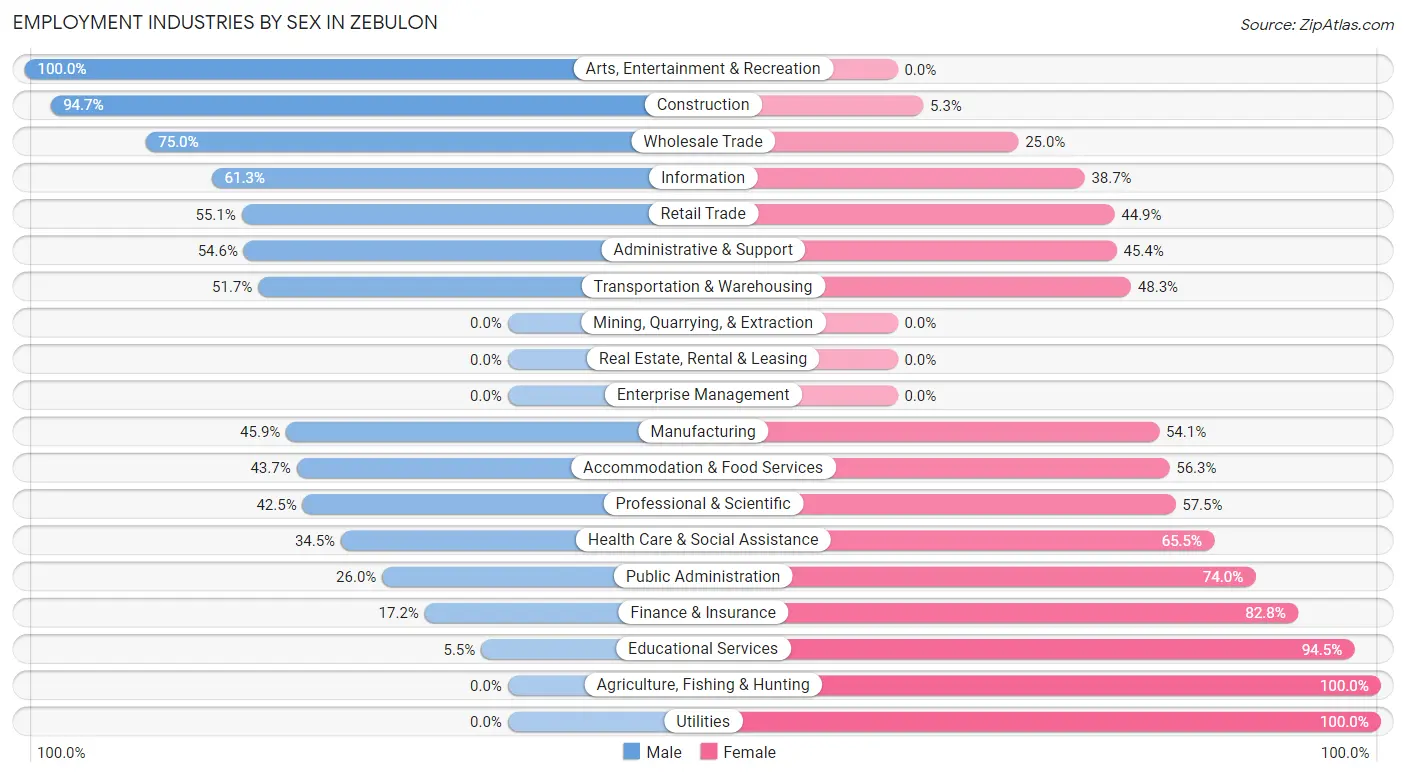
Employment Industries by Sex in Zebulon
The Zebulon industries that see more men than women are Arts, Entertainment & Recreation (100.0%), Construction (94.7%), and Wholesale Trade (75.0%), whereas the industries that tend to have a higher number of women are Agriculture, Fishing & Hunting (100.0%), Utilities (100.0%), and Educational Services (94.5%).
| Industry | Male | Female |
| Agriculture, Fishing & Hunting | 0 (0.0%) | 12 (100.0%) |
| Mining, Quarrying, & Extraction | 0 (0.0%) | 0 (0.0%) |
| Construction | 535 (94.7%) | 30 (5.3%) |
| Manufacturing | 133 (45.9%) | 157 (54.1%) |
| Wholesale Trade | 24 (75.0%) | 8 (25.0%) |
| Retail Trade | 222 (55.1%) | 181 (44.9%) |
| Transportation & Warehousing | 93 (51.7%) | 87 (48.3%) |
| Utilities | 0 (0.0%) | 16 (100.0%) |
| Information | 19 (61.3%) | 12 (38.7%) |
| Finance & Insurance | 11 (17.2%) | 53 (82.8%) |
| Real Estate, Rental & Leasing | 0 (0.0%) | 0 (0.0%) |
| Professional & Scientific | 113 (42.5%) | 153 (57.5%) |
| Enterprise Management | 0 (0.0%) | 0 (0.0%) |
| Administrative & Support | 53 (54.6%) | 44 (45.4%) |
| Educational Services | 13 (5.5%) | 223 (94.5%) |
| Health Care & Social Assistance | 87 (34.5%) | 165 (65.5%) |
| Arts, Entertainment & Recreation | 69 (100.0%) | 0 (0.0%) |
| Accommodation & Food Services | 108 (43.7%) | 139 (56.3%) |
| Public Administration | 72 (26.0%) | 205 (74.0%) |
| Total | 1,621 (50.9%) | 1,566 (49.1%) |
Education in Zebulon
School Enrollment in Zebulon
The most common levels of schooling among the 2,030 students in Zebulon are elementary school (597 | 29.4%), high school (472 | 23.3%), and college / undergraduate (328 | 16.2%).
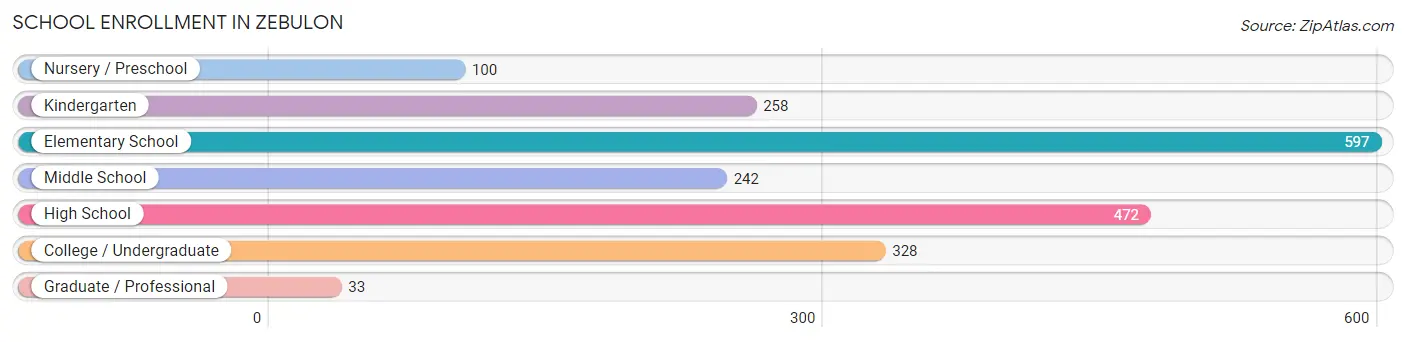
| School Level | # Students | % Students |
| Nursery / Preschool | 100 | 4.9% |
| Kindergarten | 258 | 12.7% |
| Elementary School | 597 | 29.4% |
| Middle School | 242 | 11.9% |
| High School | 472 | 23.3% |
| College / Undergraduate | 328 | 16.2% |
| Graduate / Professional | 33 | 1.6% |
| Total | 2,030 | 100.0% |
School Enrollment by Age by Funding Source in Zebulon
Out of a total of 2,030 students who are enrolled in schools in Zebulon, 473 (23.3%) attend a private institution, while the remaining 1,557 (76.7%) are enrolled in public schools. The age group of 3 to 4 year olds has the highest likelihood of being enrolled in private schools, with 150 (100.0% in the age bracket) enrolled. Conversely, the age group of 20 to 24 year olds has the lowest likelihood of being enrolled in a private school, with 150 (100.0% in the age bracket) attending a public institution.
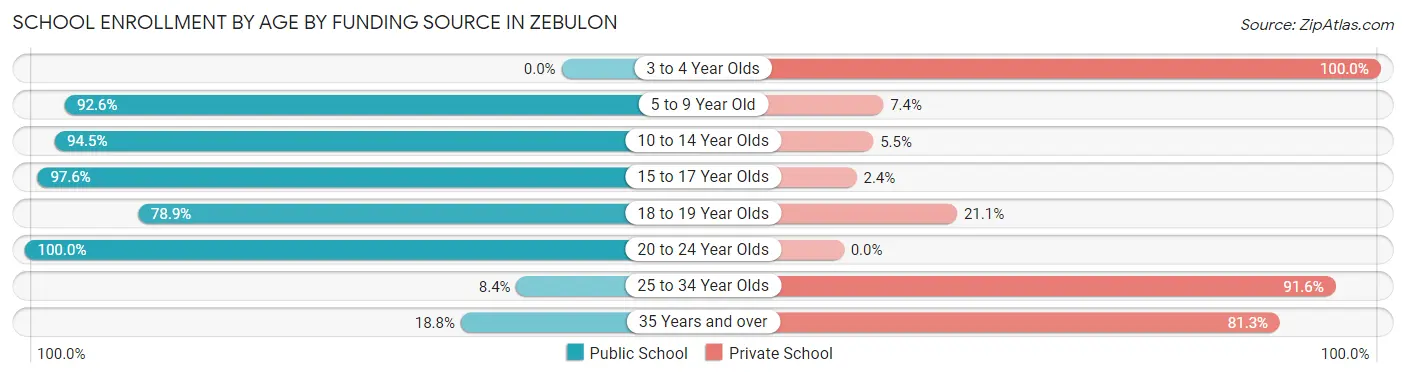
| Age Bracket | Public School | Private School |
| 3 to 4 Year Olds | 0 (0.0%) | 150 (100.0%) |
| 5 to 9 Year Old | 717 (92.6%) | 57 (7.4%) |
| 10 to 14 Year Olds | 275 (94.5%) | 16 (5.5%) |
| 15 to 17 Year Olds | 244 (97.6%) | 6 (2.4%) |
| 18 to 19 Year Olds | 142 (78.9%) | 38 (21.1%) |
| 20 to 24 Year Olds | 150 (100.0%) | 0 (0.0%) |
| 25 to 34 Year Olds | 13 (8.4%) | 142 (91.6%) |
| 35 Years and over | 15 (18.8%) | 65 (81.2%) |
| Total | 1,557 (76.7%) | 473 (23.3%) |
Educational Attainment by Field of Study in Zebulon
Business (442 | 35.6%), science & technology (109 | 8.8%), education (106 | 8.5%), visual & performing arts (105 | 8.5%), and social sciences (87 | 7.0%) are the most common fields of study among 1,242 individuals in Zebulon who have obtained a bachelor's degree or higher.
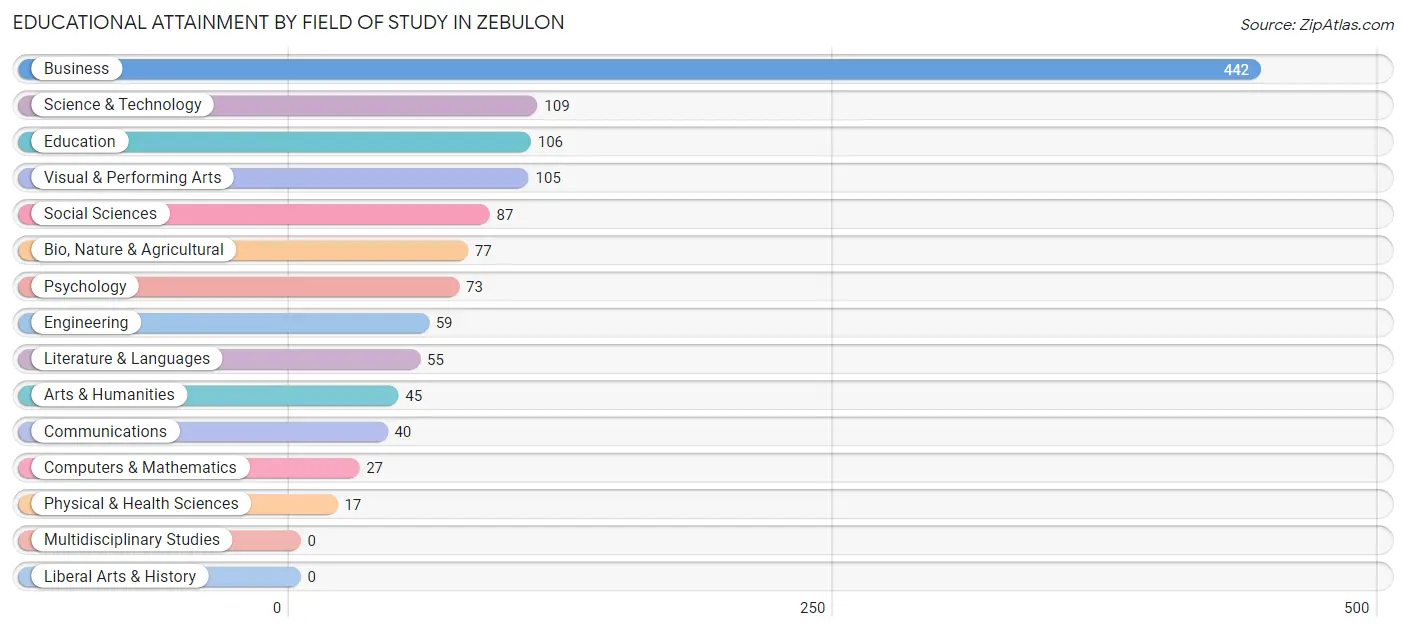
| Field of Study | # Graduates | % Graduates |
| Computers & Mathematics | 27 | 2.2% |
| Bio, Nature & Agricultural | 77 | 6.2% |
| Physical & Health Sciences | 17 | 1.4% |
| Psychology | 73 | 5.9% |
| Social Sciences | 87 | 7.0% |
| Engineering | 59 | 4.8% |
| Multidisciplinary Studies | 0 | 0.0% |
| Science & Technology | 109 | 8.8% |
| Business | 442 | 35.6% |
| Education | 106 | 8.5% |
| Literature & Languages | 55 | 4.4% |
| Liberal Arts & History | 0 | 0.0% |
| Visual & Performing Arts | 105 | 8.5% |
| Communications | 40 | 3.2% |
| Arts & Humanities | 45 | 3.6% |
| Total | 1,242 | 100.0% |
Transportation & Commute in Zebulon
Vehicle Availability by Sex in Zebulon
The most prevalent vehicle ownership categories in Zebulon are males with 3 vehicles (503, accounting for 31.7%) and females with 3 vehicles (528, making up 32.5%).
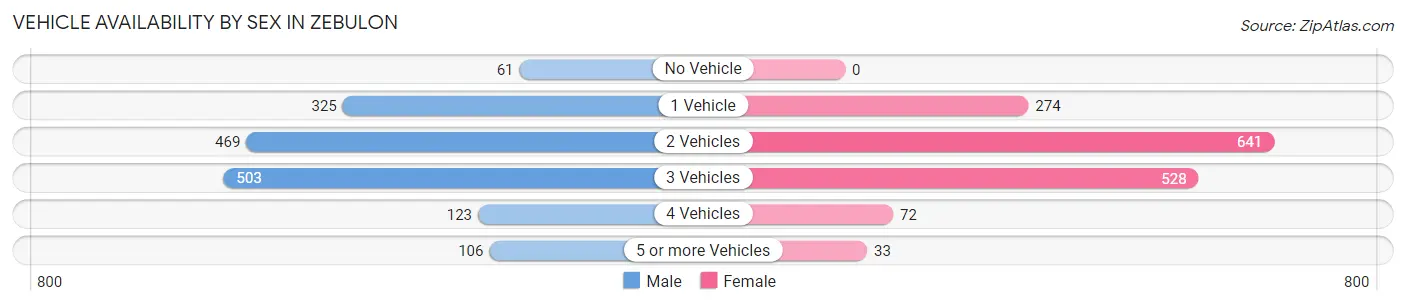
| Vehicles Available | Male | Female |
| No Vehicle | 61 (3.8%) | 0 (0.0%) |
| 1 Vehicle | 325 (20.5%) | 274 (17.7%) |
| 2 Vehicles | 469 (29.5%) | 641 (41.4%) |
| 3 Vehicles | 503 (31.7%) | 528 (34.1%) |
| 4 Vehicles | 123 (7.7%) | 72 (4.6%) |
| 5 or more Vehicles | 106 (6.7%) | 33 (2.1%) |
| Total | 1,587 (100.0%) | 1,548 (100.0%) |
Commute Time in Zebulon
The most frequently occuring commute durations in Zebulon are 30 to 34 minutes (908 commuters, 35.7%), 45 to 59 minutes (358 commuters, 14.1%), and 25 to 29 minutes (286 commuters, 11.2%).
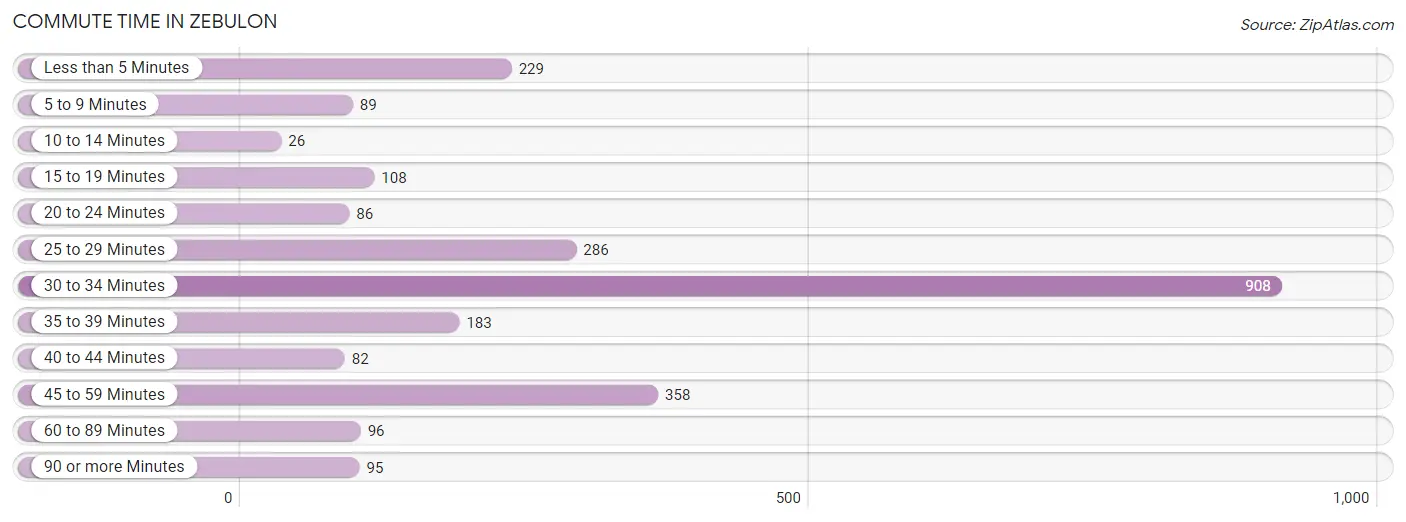
| Commute Time | # Commuters | % Commuters |
| Less than 5 Minutes | 229 | 9.0% |
| 5 to 9 Minutes | 89 | 3.5% |
| 10 to 14 Minutes | 26 | 1.0% |
| 15 to 19 Minutes | 108 | 4.2% |
| 20 to 24 Minutes | 86 | 3.4% |
| 25 to 29 Minutes | 286 | 11.2% |
| 30 to 34 Minutes | 908 | 35.7% |
| 35 to 39 Minutes | 183 | 7.2% |
| 40 to 44 Minutes | 82 | 3.2% |
| 45 to 59 Minutes | 358 | 14.1% |
| 60 to 89 Minutes | 96 | 3.8% |
| 90 or more Minutes | 95 | 3.7% |
Commute Time by Sex in Zebulon
The most common commute times in Zebulon are 30 to 34 minutes (685 commuters, 48.6%) for males and 30 to 34 minutes (223 commuters, 19.6%) for females.
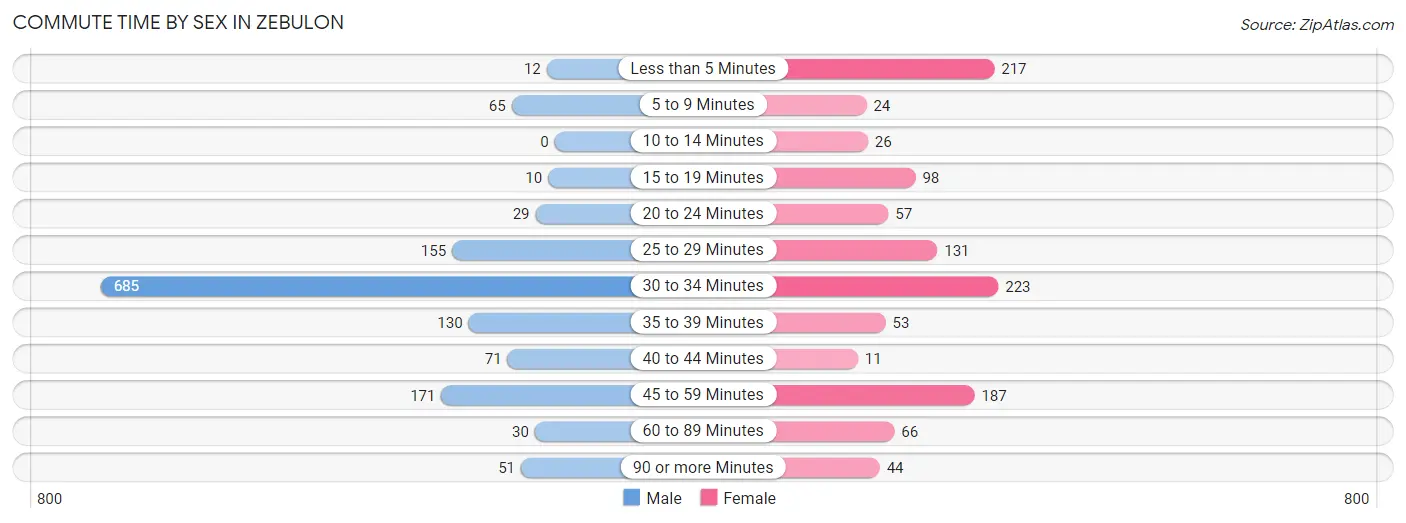
| Commute Time | Male | Female |
| Less than 5 Minutes | 12 (0.9%) | 217 (19.1%) |
| 5 to 9 Minutes | 65 (4.6%) | 24 (2.1%) |
| 10 to 14 Minutes | 0 (0.0%) | 26 (2.3%) |
| 15 to 19 Minutes | 10 (0.7%) | 98 (8.6%) |
| 20 to 24 Minutes | 29 (2.1%) | 57 (5.0%) |
| 25 to 29 Minutes | 155 (11.0%) | 131 (11.5%) |
| 30 to 34 Minutes | 685 (48.6%) | 223 (19.6%) |
| 35 to 39 Minutes | 130 (9.2%) | 53 (4.7%) |
| 40 to 44 Minutes | 71 (5.0%) | 11 (1.0%) |
| 45 to 59 Minutes | 171 (12.1%) | 187 (16.5%) |
| 60 to 89 Minutes | 30 (2.1%) | 66 (5.8%) |
| 90 or more Minutes | 51 (3.6%) | 44 (3.9%) |
Time of Departure to Work by Sex in Zebulon
The most frequent times of departure to work in Zebulon are 8:00 AM to 8:29 AM (299, 21.2%) for males and 6:30 AM to 6:59 AM (239, 21.0%) for females.
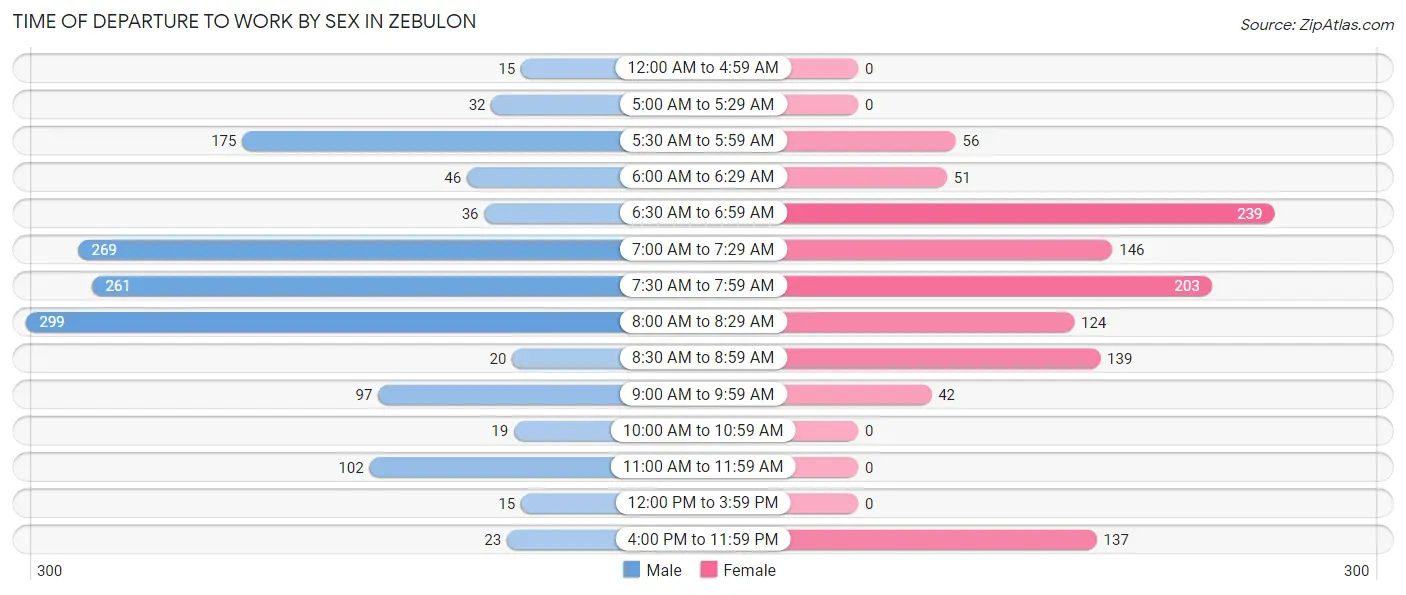
| Time of Departure | Male | Female |
| 12:00 AM to 4:59 AM | 15 (1.1%) | 0 (0.0%) |
| 5:00 AM to 5:29 AM | 32 (2.3%) | 0 (0.0%) |
| 5:30 AM to 5:59 AM | 175 (12.4%) | 56 (4.9%) |
| 6:00 AM to 6:29 AM | 46 (3.3%) | 51 (4.5%) |
| 6:30 AM to 6:59 AM | 36 (2.6%) | 239 (21.0%) |
| 7:00 AM to 7:29 AM | 269 (19.1%) | 146 (12.8%) |
| 7:30 AM to 7:59 AM | 261 (18.5%) | 203 (17.8%) |
| 8:00 AM to 8:29 AM | 299 (21.2%) | 124 (10.9%) |
| 8:30 AM to 8:59 AM | 20 (1.4%) | 139 (12.2%) |
| 9:00 AM to 9:59 AM | 97 (6.9%) | 42 (3.7%) |
| 10:00 AM to 10:59 AM | 19 (1.3%) | 0 (0.0%) |
| 11:00 AM to 11:59 AM | 102 (7.2%) | 0 (0.0%) |
| 12:00 PM to 3:59 PM | 15 (1.1%) | 0 (0.0%) |
| 4:00 PM to 11:59 PM | 23 (1.6%) | 137 (12.0%) |
| Total | 1,409 (100.0%) | 1,137 (100.0%) |
Housing Occupancy in Zebulon
Occupancy by Ownership in Zebulon
Of the total 2,633 dwellings in Zebulon, owner-occupied units account for 1,589 (60.4%), while renter-occupied units make up 1,044 (39.7%).
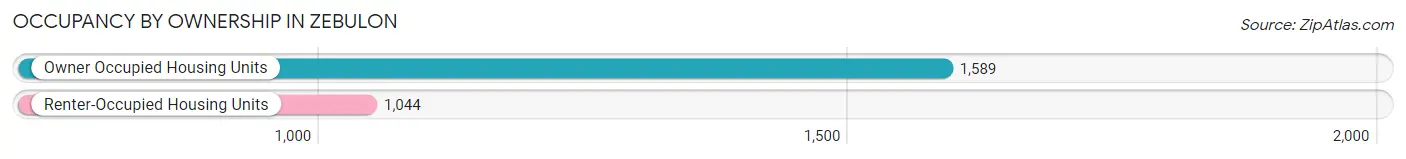
| Occupancy | # Housing Units | % Housing Units |
| Owner Occupied Housing Units | 1,589 | 60.4% |
| Renter-Occupied Housing Units | 1,044 | 39.7% |
| Total Occupied Housing Units | 2,633 | 100.0% |
Occupancy by Household Size in Zebulon
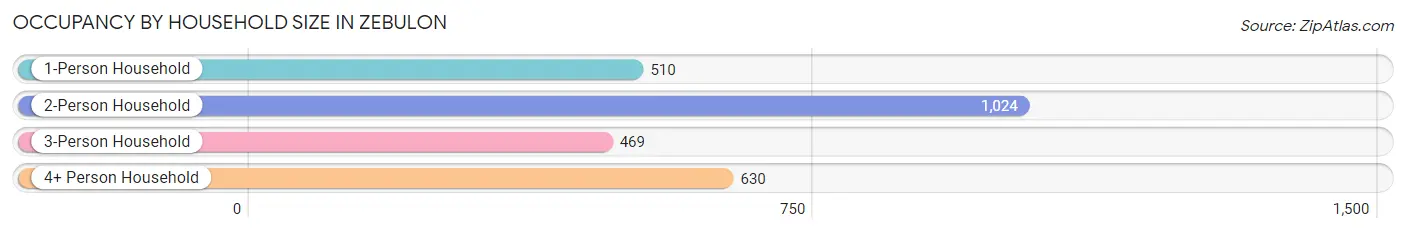
| Household Size | # Housing Units | % Housing Units |
| 1-Person Household | 510 | 19.4% |
| 2-Person Household | 1,024 | 38.9% |
| 3-Person Household | 469 | 17.8% |
| 4+ Person Household | 630 | 23.9% |
| Total Housing Units | 2,633 | 100.0% |
Occupancy by Ownership by Household Size in Zebulon
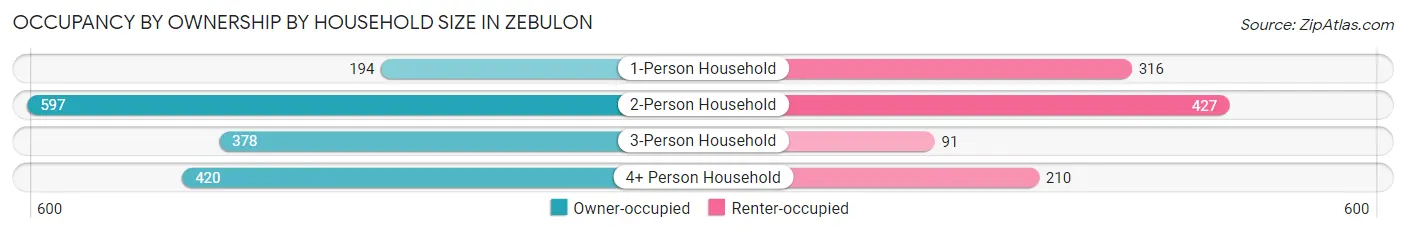
| Household Size | Owner-occupied | Renter-occupied |
| 1-Person Household | 194 (38.0%) | 316 (62.0%) |
| 2-Person Household | 597 (58.3%) | 427 (41.7%) |
| 3-Person Household | 378 (80.6%) | 91 (19.4%) |
| 4+ Person Household | 420 (66.7%) | 210 (33.3%) |
| Total Housing Units | 1,589 (60.4%) | 1,044 (39.7%) |
Occupancy by Educational Attainment in Zebulon
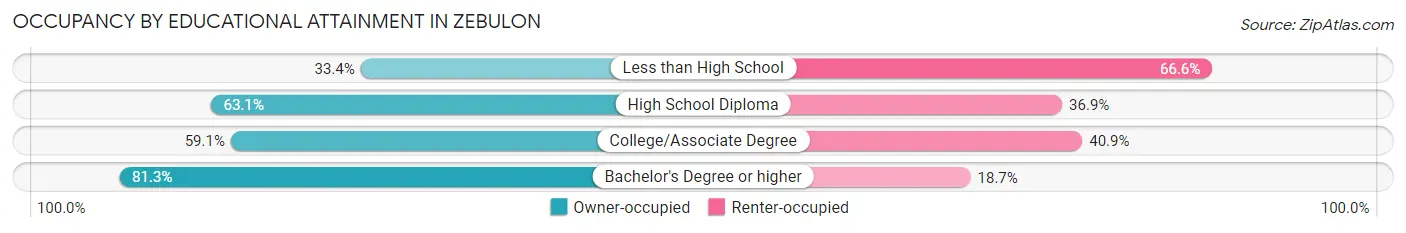
| Household Size | Owner-occupied | Renter-occupied |
| Less than High School | 168 (33.4%) | 335 (66.6%) |
| High School Diploma | 404 (63.1%) | 236 (36.9%) |
| College/Associate Degree | 518 (59.1%) | 358 (40.9%) |
| Bachelor's Degree or higher | 499 (81.3%) | 115 (18.7%) |
Occupancy by Age of Householder in Zebulon
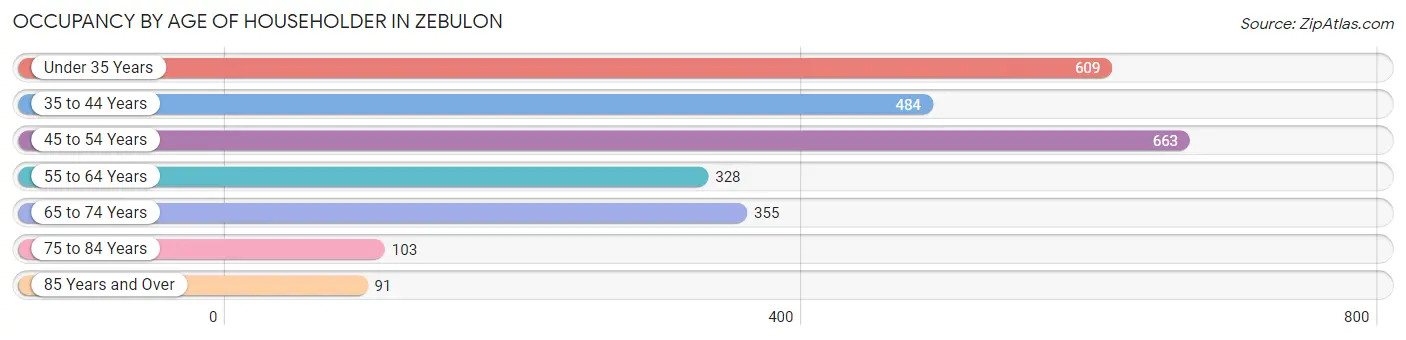
| Age Bracket | # Households | % Households |
| Under 35 Years | 609 | 23.1% |
| 35 to 44 Years | 484 | 18.4% |
| 45 to 54 Years | 663 | 25.2% |
| 55 to 64 Years | 328 | 12.5% |
| 65 to 74 Years | 355 | 13.5% |
| 75 to 84 Years | 103 | 3.9% |
| 85 Years and Over | 91 | 3.5% |
| Total | 2,633 | 100.0% |
Housing Finances in Zebulon
Median Income by Occupancy in Zebulon
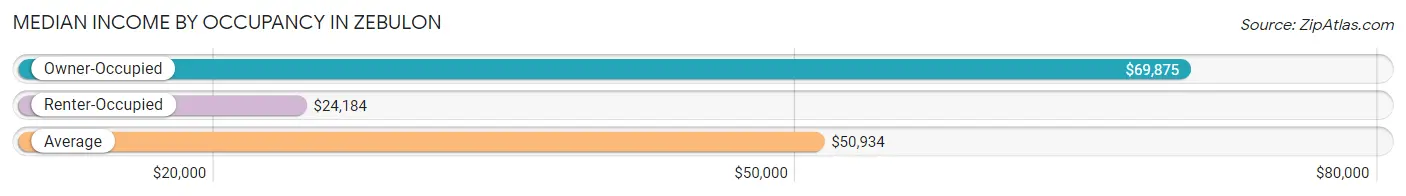
| Occupancy Type | # Households | Median Income |
| Owner-Occupied | 1,589 (60.4%) | $69,875 |
| Renter-Occupied | 1,044 (39.7%) | $24,184 |
| Average | 2,633 (100.0%) | $50,934 |
Occupancy by Householder Income Bracket in Zebulon
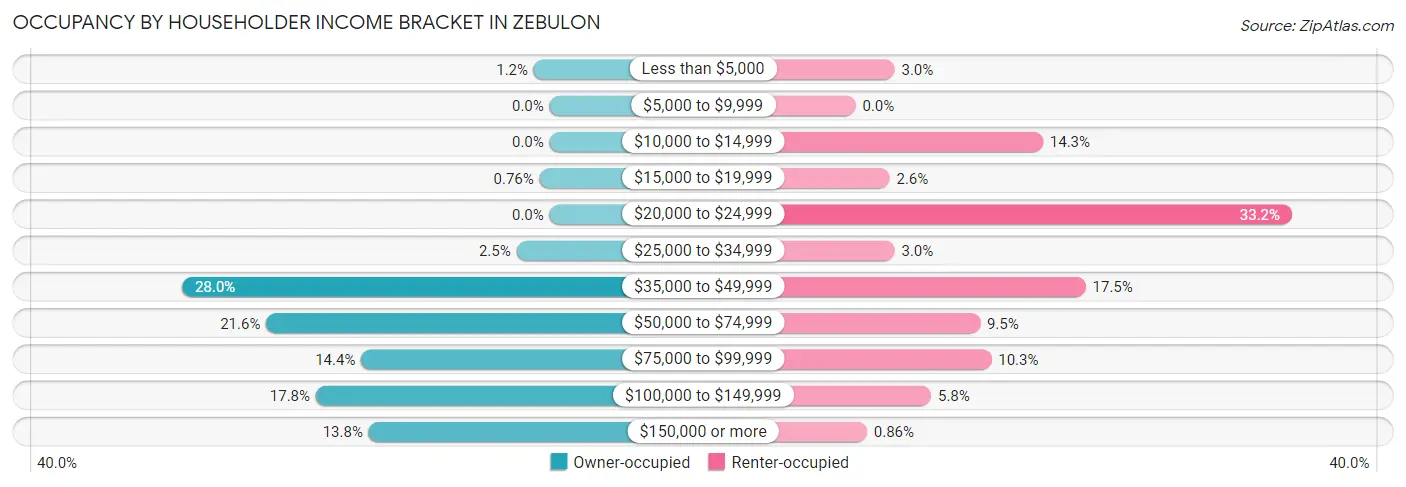
| Income Bracket | Owner-occupied | Renter-occupied |
| Less than $5,000 | 19 (1.2%) | 31 (3.0%) |
| $5,000 to $9,999 | 0 (0.0%) | 0 (0.0%) |
| $10,000 to $14,999 | 0 (0.0%) | 149 (14.3%) |
| $15,000 to $19,999 | 12 (0.8%) | 27 (2.6%) |
| $20,000 to $24,999 | 0 (0.0%) | 347 (33.2%) |
| $25,000 to $34,999 | 40 (2.5%) | 31 (3.0%) |
| $35,000 to $49,999 | 445 (28.0%) | 183 (17.5%) |
| $50,000 to $74,999 | 343 (21.6%) | 99 (9.5%) |
| $75,000 to $99,999 | 228 (14.3%) | 108 (10.3%) |
| $100,000 to $149,999 | 283 (17.8%) | 60 (5.8%) |
| $150,000 or more | 219 (13.8%) | 9 (0.9%) |
| Total | 1,589 (100.0%) | 1,044 (100.0%) |
Monthly Housing Cost Tiers in Zebulon
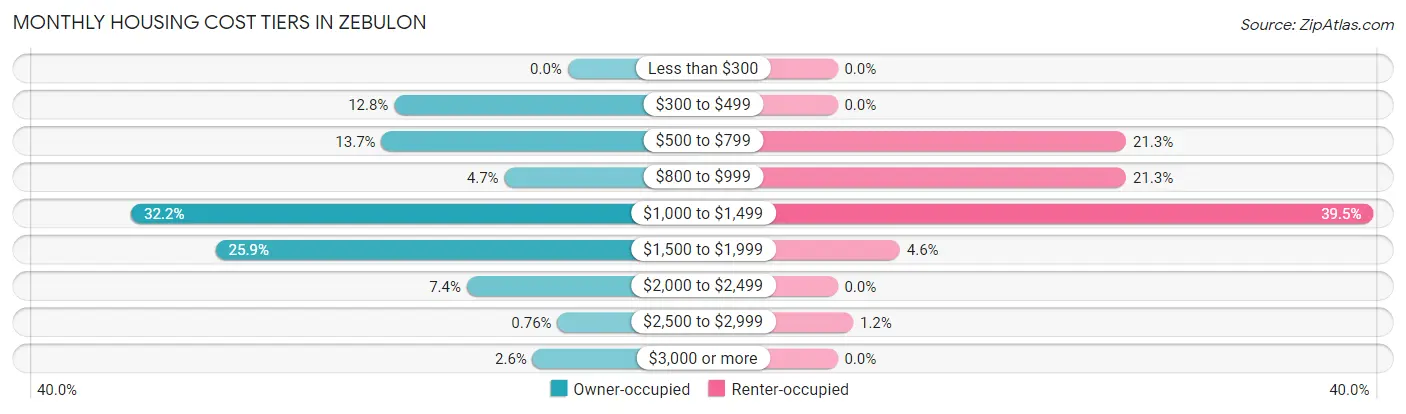
| Monthly Cost | Owner-occupied | Renter-occupied |
| Less than $300 | 0 (0.0%) | 0 (0.0%) |
| $300 to $499 | 203 (12.8%) | 0 (0.0%) |
| $500 to $799 | 218 (13.7%) | 222 (21.3%) |
| $800 to $999 | 74 (4.7%) | 222 (21.3%) |
| $1,000 to $1,499 | 511 (32.2%) | 412 (39.5%) |
| $1,500 to $1,999 | 412 (25.9%) | 48 (4.6%) |
| $2,000 to $2,499 | 118 (7.4%) | 0 (0.0%) |
| $2,500 to $2,999 | 12 (0.8%) | 12 (1.1%) |
| $3,000 or more | 41 (2.6%) | 0 (0.0%) |
| Total | 1,589 (100.0%) | 1,044 (100.0%) |
Physical Housing Characteristics in Zebulon
Housing Structures in Zebulon
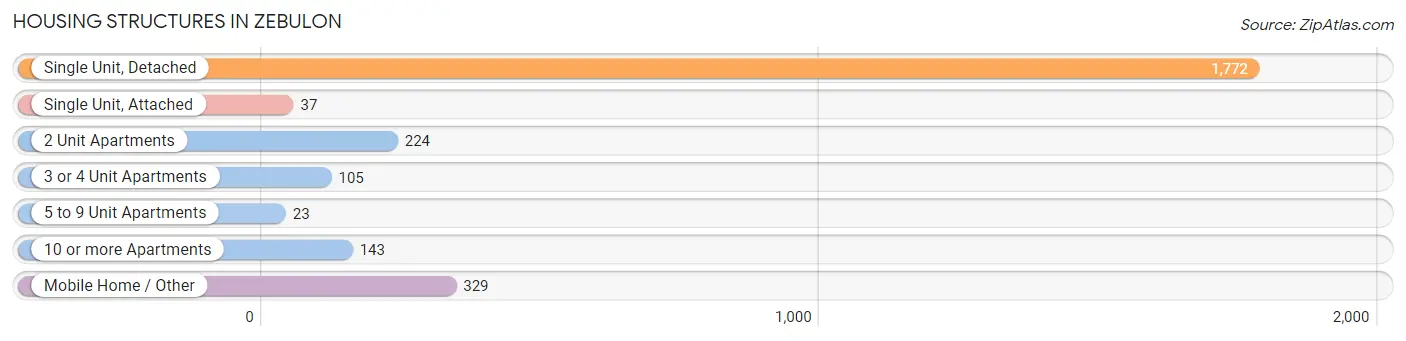
| Structure Type | # Housing Units | % Housing Units |
| Single Unit, Detached | 1,772 | 67.3% |
| Single Unit, Attached | 37 | 1.4% |
| 2 Unit Apartments | 224 | 8.5% |
| 3 or 4 Unit Apartments | 105 | 4.0% |
| 5 to 9 Unit Apartments | 23 | 0.9% |
| 10 or more Apartments | 143 | 5.4% |
| Mobile Home / Other | 329 | 12.5% |
| Total | 2,633 | 100.0% |
Housing Structures by Occupancy in Zebulon
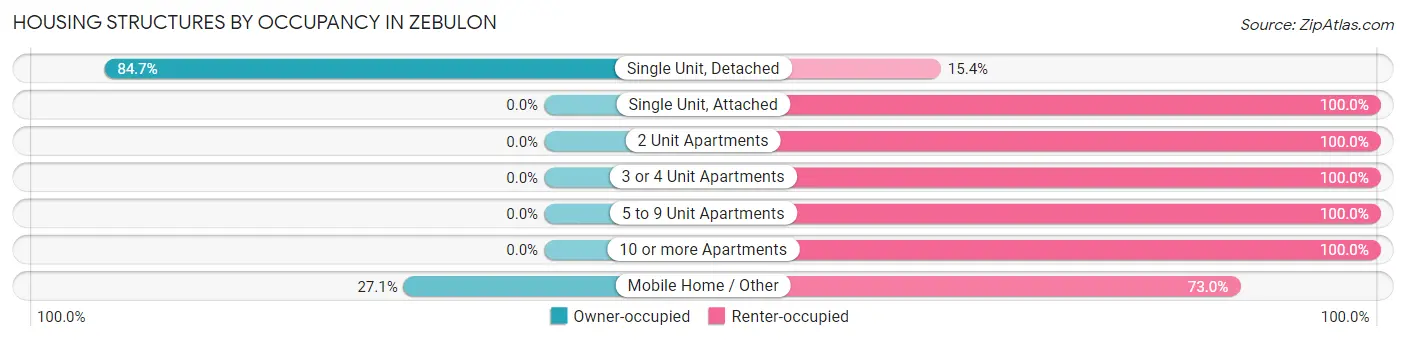
| Structure Type | Owner-occupied | Renter-occupied |
| Single Unit, Detached | 1,500 (84.7%) | 272 (15.3%) |
| Single Unit, Attached | 0 (0.0%) | 37 (100.0%) |
| 2 Unit Apartments | 0 (0.0%) | 224 (100.0%) |
| 3 or 4 Unit Apartments | 0 (0.0%) | 105 (100.0%) |
| 5 to 9 Unit Apartments | 0 (0.0%) | 23 (100.0%) |
| 10 or more Apartments | 0 (0.0%) | 143 (100.0%) |
| Mobile Home / Other | 89 (27.1%) | 240 (73.0%) |
| Total | 1,589 (60.4%) | 1,044 (39.7%) |
Housing Structures by Number of Rooms in Zebulon
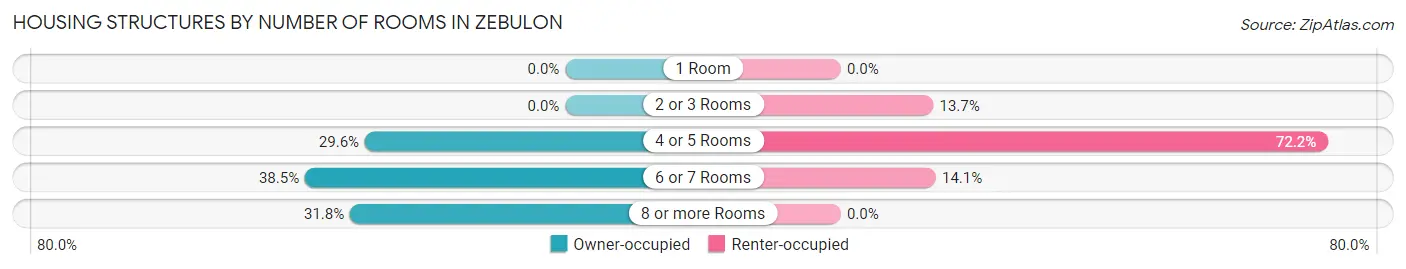
| Number of Rooms | Owner-occupied | Renter-occupied |
| 1 Room | 0 (0.0%) | 0 (0.0%) |
| 2 or 3 Rooms | 0 (0.0%) | 143 (13.7%) |
| 4 or 5 Rooms | 471 (29.6%) | 754 (72.2%) |
| 6 or 7 Rooms | 612 (38.5%) | 147 (14.1%) |
| 8 or more Rooms | 506 (31.8%) | 0 (0.0%) |
| Total | 1,589 (100.0%) | 1,044 (100.0%) |
Housing Structure by Heating Type in Zebulon
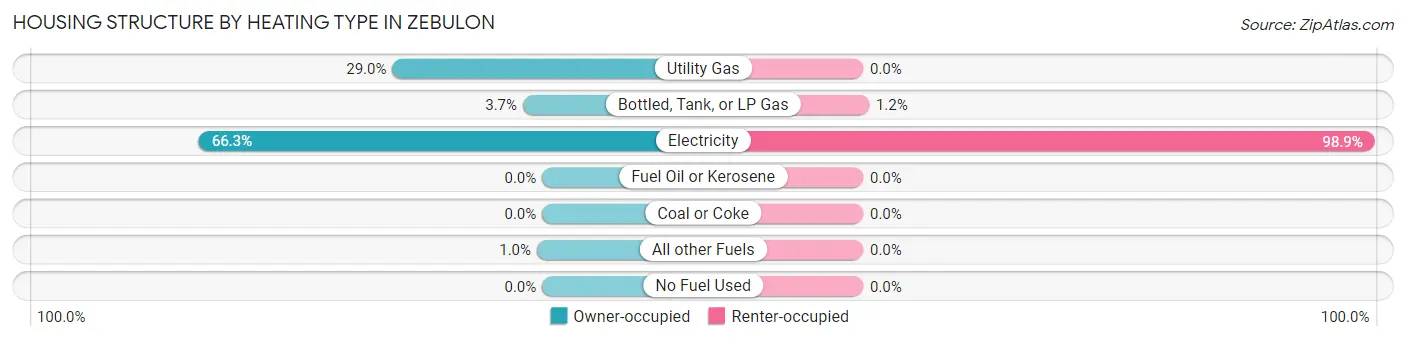
| Heating Type | Owner-occupied | Renter-occupied |
| Utility Gas | 460 (28.9%) | 0 (0.0%) |
| Bottled, Tank, or LP Gas | 59 (3.7%) | 12 (1.1%) |
| Electricity | 1,054 (66.3%) | 1,032 (98.9%) |
| Fuel Oil or Kerosene | 0 (0.0%) | 0 (0.0%) |
| Coal or Coke | 0 (0.0%) | 0 (0.0%) |
| All other Fuels | 16 (1.0%) | 0 (0.0%) |
| No Fuel Used | 0 (0.0%) | 0 (0.0%) |
| Total | 1,589 (100.0%) | 1,044 (100.0%) |
Household Vehicle Usage in Zebulon

| Vehicles per Household | Owner-occupied | Renter-occupied |
| No Vehicle | 0 (0.0%) | 173 (16.6%) |
| 1 Vehicle | 244 (15.4%) | 553 (53.0%) |
| 2 Vehicles | 613 (38.6%) | 140 (13.4%) |
| 3 or more Vehicles | 732 (46.1%) | 178 (17.1%) |
| Total | 1,589 (100.0%) | 1,044 (100.0%) |
Real Estate & Mortgages in Zebulon
Real Estate and Mortgage Overview in Zebulon
| Characteristic | Without Mortgage | With Mortgage |
| Housing Units | 481 | 1,108 |
| Median Property Value | $157,300 | $229,800 |
| Median Household Income | $59,432 | $172 |
| Monthly Housing Costs | $571 | $41 |
| Real Estate Taxes | $1,556 | $18 |
Property Value by Mortgage Status in Zebulon
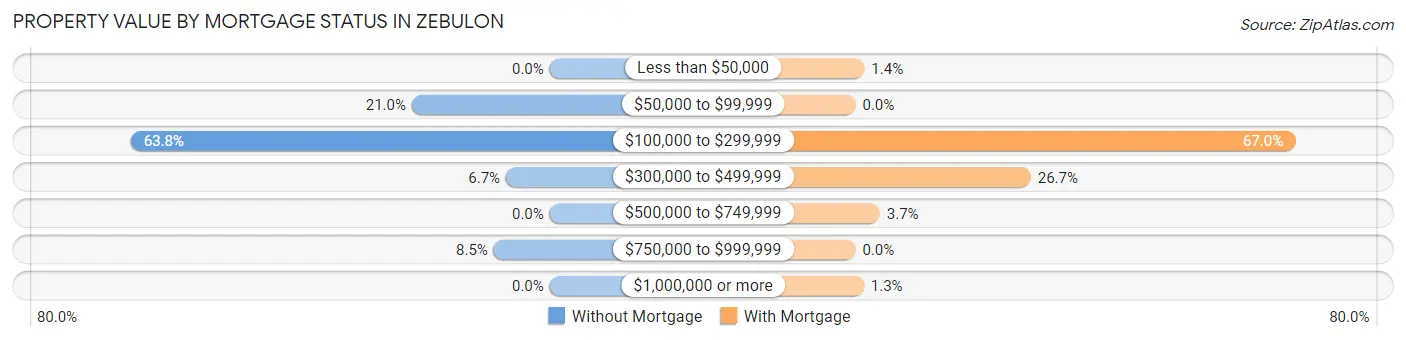
| Property Value | Without Mortgage | With Mortgage |
| Less than $50,000 | 0 (0.0%) | 15 (1.3%) |
| $50,000 to $99,999 | 101 (21.0%) | 0 (0.0%) |
| $100,000 to $299,999 | 307 (63.8%) | 742 (67.0%) |
| $300,000 to $499,999 | 32 (6.7%) | 296 (26.7%) |
| $500,000 to $749,999 | 0 (0.0%) | 41 (3.7%) |
| $750,000 to $999,999 | 41 (8.5%) | 0 (0.0%) |
| $1,000,000 or more | 0 (0.0%) | 14 (1.3%) |
| Total | 481 (100.0%) | 1,108 (100.0%) |
Household Income by Mortgage Status in Zebulon
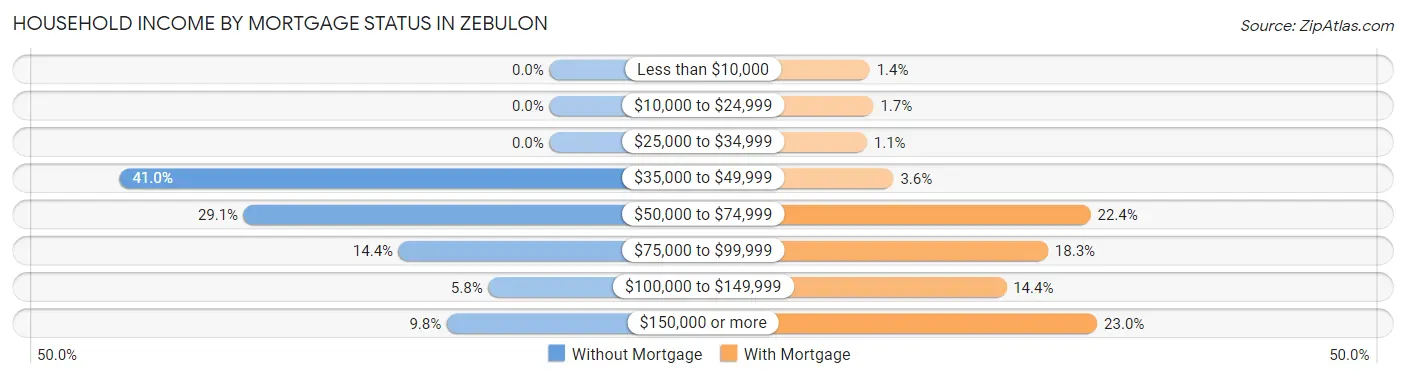
| Household Income | Without Mortgage | With Mortgage |
| Less than $10,000 | 0 (0.0%) | 15 (1.3%) |
| $10,000 to $24,999 | 0 (0.0%) | 19 (1.7%) |
| $25,000 to $34,999 | 0 (0.0%) | 12 (1.1%) |
| $35,000 to $49,999 | 197 (41.0%) | 40 (3.6%) |
| $50,000 to $74,999 | 140 (29.1%) | 248 (22.4%) |
| $75,000 to $99,999 | 69 (14.3%) | 203 (18.3%) |
| $100,000 to $149,999 | 28 (5.8%) | 159 (14.3%) |
| $150,000 or more | 47 (9.8%) | 255 (23.0%) |
| Total | 481 (100.0%) | 1,108 (100.0%) |
Property Value to Household Income Ratio in Zebulon
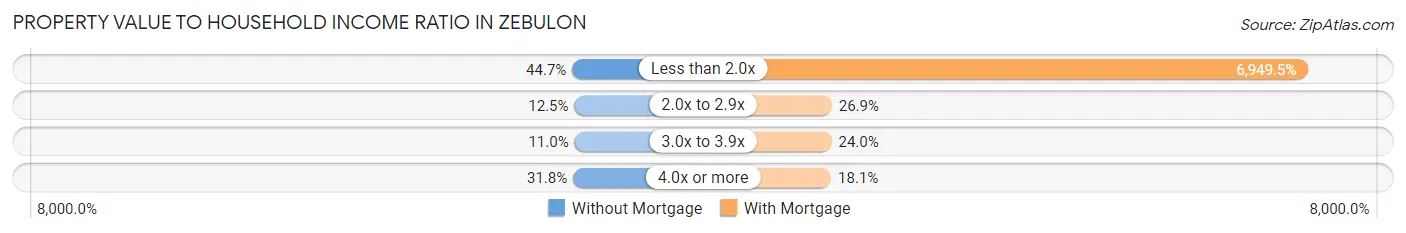
| Value-to-Income Ratio | Without Mortgage | With Mortgage |
| Less than 2.0x | 215 (44.7%) | 77,000 (6,949.5%) |
| 2.0x to 2.9x | 60 (12.5%) | 298 (26.9%) |
| 3.0x to 3.9x | 53 (11.0%) | 266 (24.0%) |
| 4.0x or more | 153 (31.8%) | 201 (18.1%) |
| Total | 481 (100.0%) | 1,108 (100.0%) |
Real Estate Taxes by Mortgage Status in Zebulon
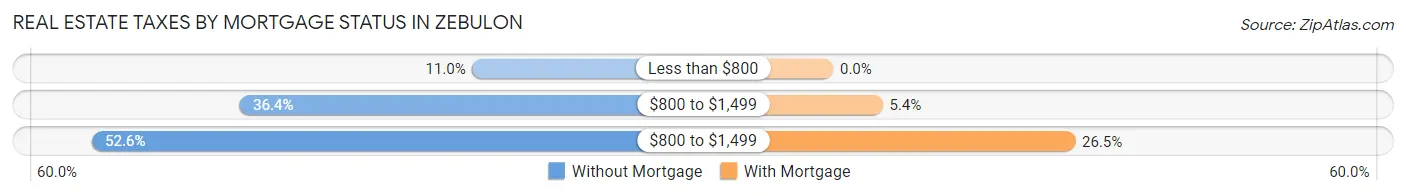
| Property Taxes | Without Mortgage | With Mortgage |
| Less than $800 | 53 (11.0%) | 0 (0.0%) |
| $800 to $1,499 | 175 (36.4%) | 60 (5.4%) |
| $800 to $1,499 | 253 (52.6%) | 294 (26.5%) |
| Total | 481 (100.0%) | 1,108 (100.0%) |
Health & Disability in Zebulon
Health Insurance Coverage by Age in Zebulon
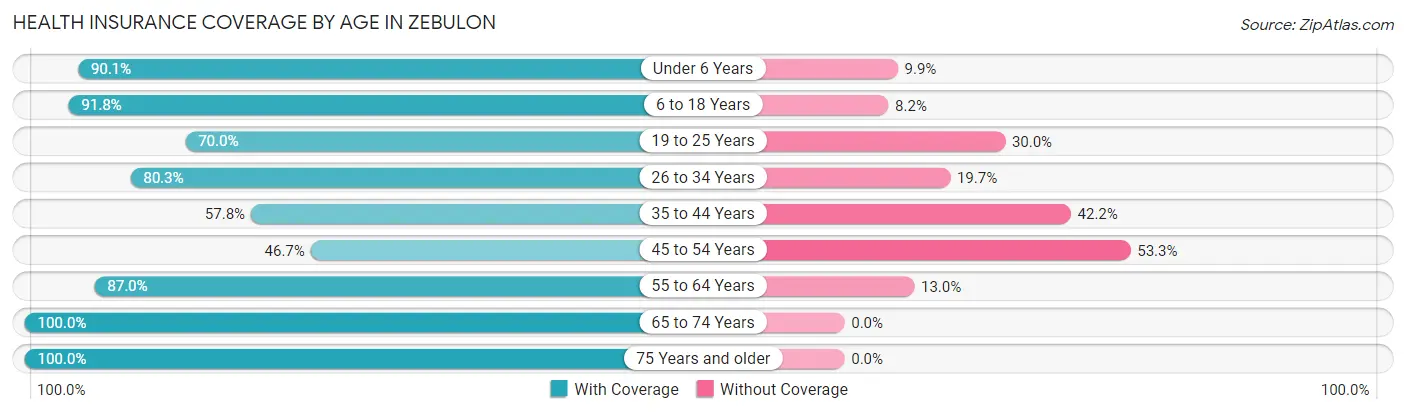
| Age Bracket | With Coverage | Without Coverage |
| Under 6 Years | 634 (90.1%) | 70 (9.9%) |
| 6 to 18 Years | 1,235 (91.8%) | 110 (8.2%) |
| 19 to 25 Years | 339 (70.0%) | 145 (30.0%) |
| 26 to 34 Years | 896 (80.3%) | 220 (19.7%) |
| 35 to 44 Years | 737 (57.8%) | 538 (42.2%) |
| 45 to 54 Years | 441 (46.7%) | 504 (53.3%) |
| 55 to 64 Years | 361 (87.0%) | 54 (13.0%) |
| 65 to 74 Years | 713 (100.0%) | 0 (0.0%) |
| 75 Years and older | 356 (100.0%) | 0 (0.0%) |
| Total | 5,712 (77.7%) | 1,641 (22.3%) |
Health Insurance Coverage by Citizenship Status in Zebulon
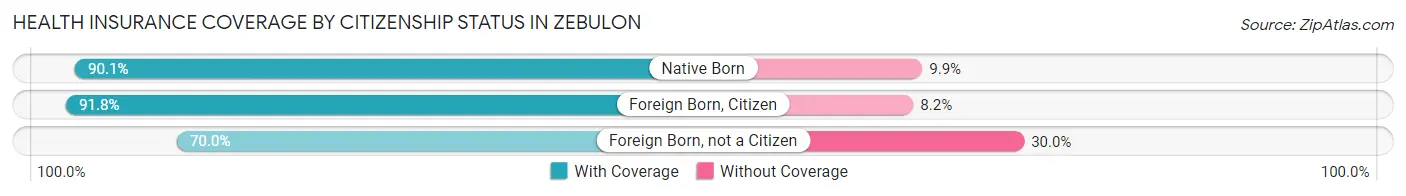
| Citizenship Status | With Coverage | Without Coverage |
| Native Born | 634 (90.1%) | 70 (9.9%) |
| Foreign Born, Citizen | 1,235 (91.8%) | 110 (8.2%) |
| Foreign Born, not a Citizen | 339 (70.0%) | 145 (30.0%) |
Health Insurance Coverage by Household Income in Zebulon
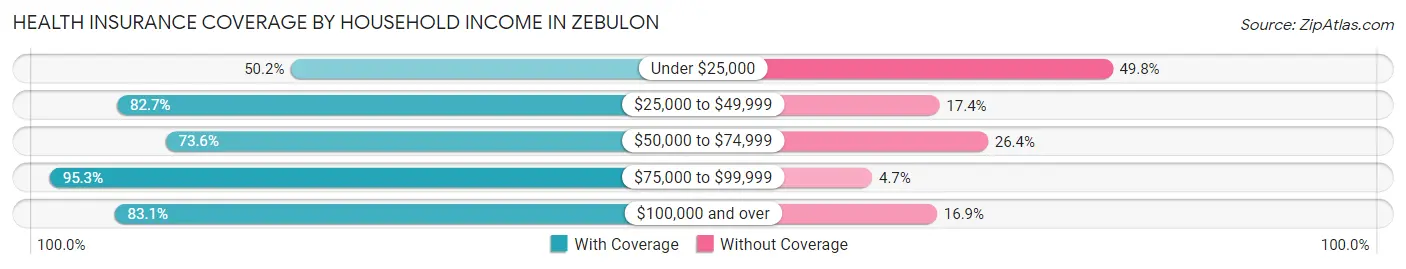
| Household Income | With Coverage | Without Coverage |
| Under $25,000 | 648 (50.2%) | 642 (49.8%) |
| $25,000 to $49,999 | 1,372 (82.7%) | 288 (17.3%) |
| $50,000 to $74,999 | 713 (73.6%) | 256 (26.4%) |
| $75,000 to $99,999 | 966 (95.3%) | 48 (4.7%) |
| $100,000 and over | 1,975 (83.1%) | 401 (16.9%) |
Public vs Private Health Insurance Coverage by Age in Zebulon
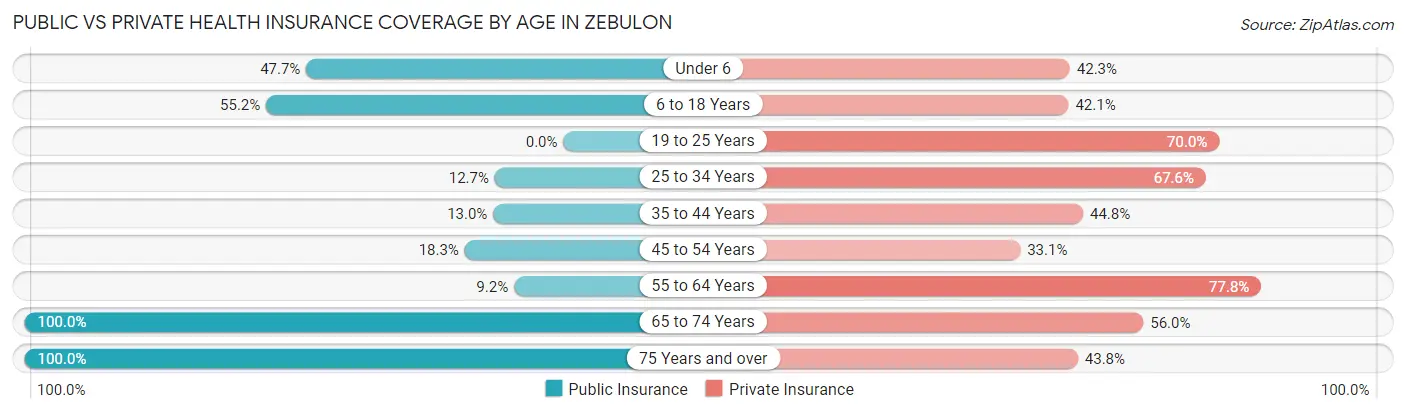
| Age Bracket | Public Insurance | Private Insurance |
| Under 6 | 336 (47.7%) | 298 (42.3%) |
| 6 to 18 Years | 742 (55.2%) | 566 (42.1%) |
| 19 to 25 Years | 0 (0.0%) | 339 (70.0%) |
| 25 to 34 Years | 142 (12.7%) | 754 (67.6%) |
| 35 to 44 Years | 166 (13.0%) | 571 (44.8%) |
| 45 to 54 Years | 173 (18.3%) | 313 (33.1%) |
| 55 to 64 Years | 38 (9.2%) | 323 (77.8%) |
| 65 to 74 Years | 713 (100.0%) | 399 (56.0%) |
| 75 Years and over | 356 (100.0%) | 156 (43.8%) |
| Total | 2,666 (36.3%) | 3,719 (50.6%) |
Disability Status by Sex by Age in Zebulon
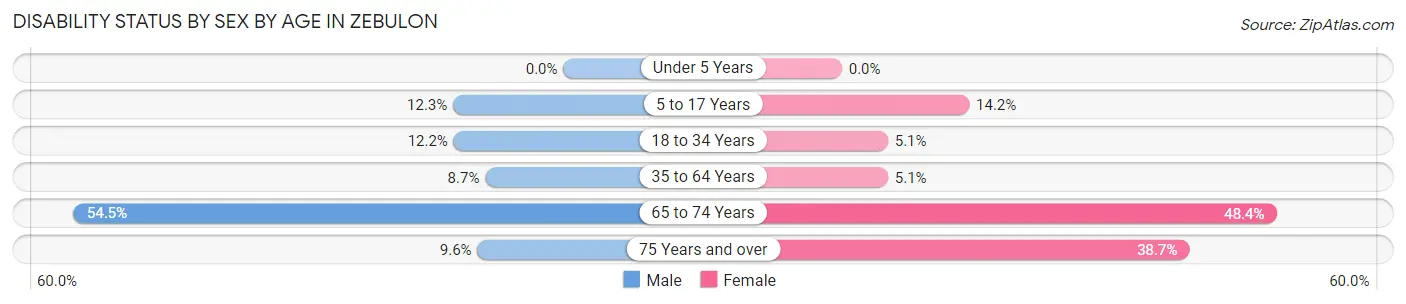
| Age Bracket | Male | Female |
| Under 5 Years | 0 (0.0%) | 0 (0.0%) |
| 5 to 17 Years | 57 (12.3%) | 133 (14.2%) |
| 18 to 34 Years | 84 (12.2%) | 57 (5.1%) |
| 35 to 64 Years | 97 (8.7%) | 78 (5.1%) |
| 65 to 74 Years | 151 (54.5%) | 211 (48.4%) |
| 75 Years and over | 18 (9.6%) | 65 (38.7%) |
Disability Class by Sex by Age in Zebulon
Disability Class: Hearing Difficulty
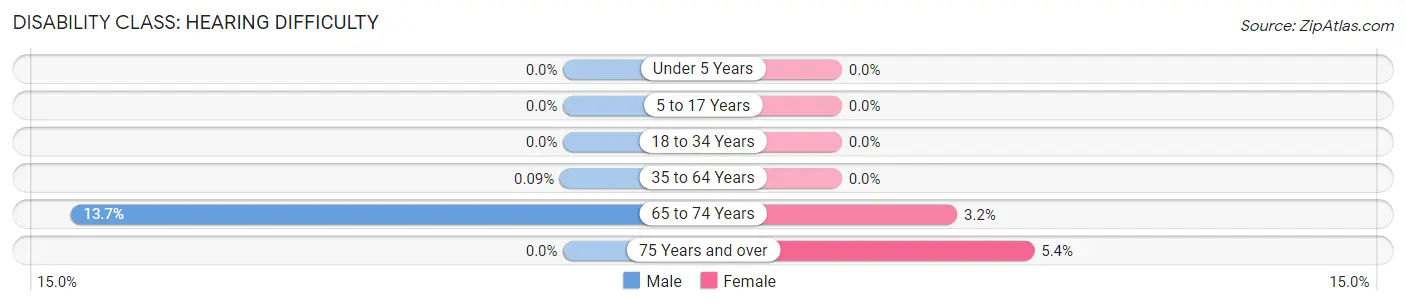
| Age Bracket | Male | Female |
| Under 5 Years | 0 (0.0%) | 0 (0.0%) |
| 5 to 17 Years | 0 (0.0%) | 0 (0.0%) |
| 18 to 34 Years | 0 (0.0%) | 0 (0.0%) |
| 35 to 64 Years | 1 (0.1%) | 0 (0.0%) |
| 65 to 74 Years | 38 (13.7%) | 14 (3.2%) |
| 75 Years and over | 0 (0.0%) | 9 (5.4%) |
Disability Class: Vision Difficulty
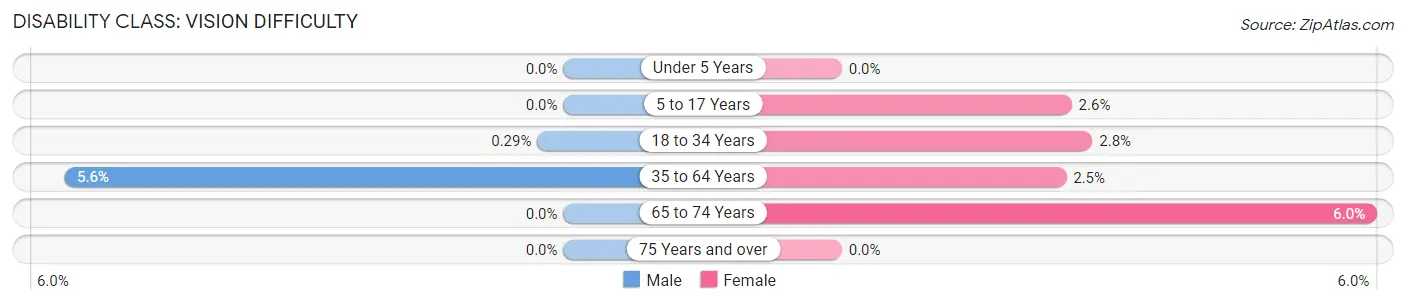
| Age Bracket | Male | Female |
| Under 5 Years | 0 (0.0%) | 0 (0.0%) |
| 5 to 17 Years | 0 (0.0%) | 24 (2.6%) |
| 18 to 34 Years | 2 (0.3%) | 31 (2.8%) |
| 35 to 64 Years | 62 (5.6%) | 38 (2.5%) |
| 65 to 74 Years | 0 (0.0%) | 26 (6.0%) |
| 75 Years and over | 0 (0.0%) | 0 (0.0%) |
Disability Class: Cognitive Difficulty
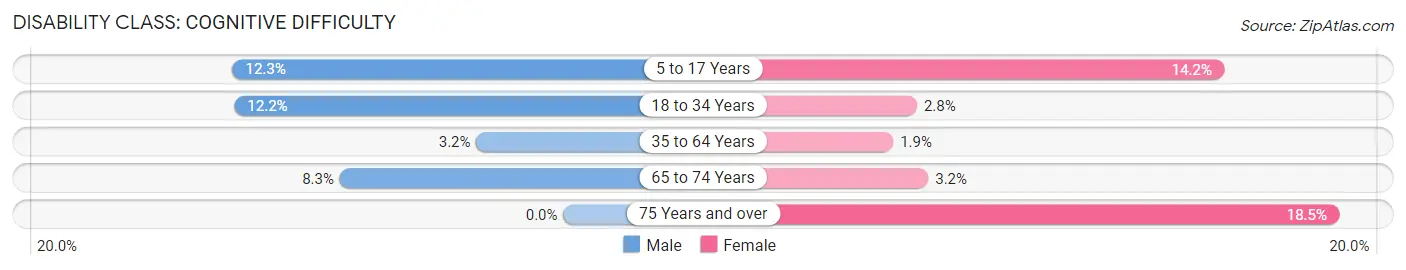
| Age Bracket | Male | Female |
| 5 to 17 Years | 57 (12.3%) | 133 (14.2%) |
| 18 to 34 Years | 84 (12.2%) | 31 (2.8%) |
| 35 to 64 Years | 36 (3.2%) | 29 (1.9%) |
| 65 to 74 Years | 23 (8.3%) | 14 (3.2%) |
| 75 Years and over | 0 (0.0%) | 31 (18.4%) |
Disability Class: Ambulatory Difficulty
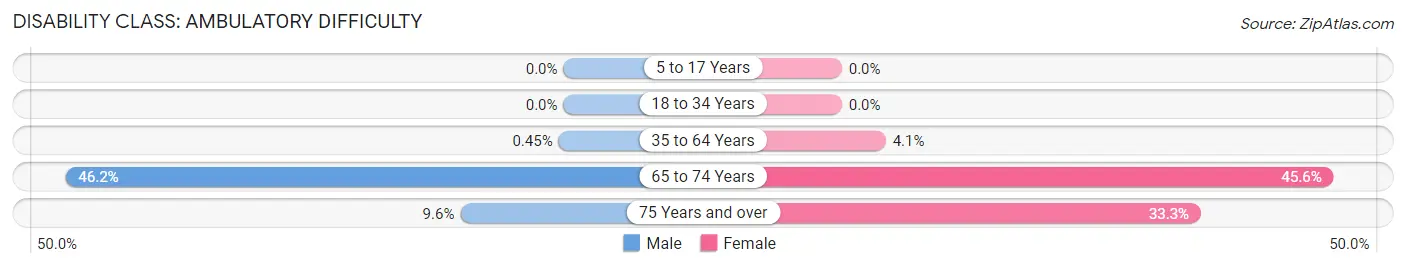
| Age Bracket | Male | Female |
| 5 to 17 Years | 0 (0.0%) | 0 (0.0%) |
| 18 to 34 Years | 0 (0.0%) | 0 (0.0%) |
| 35 to 64 Years | 5 (0.4%) | 62 (4.1%) |
| 65 to 74 Years | 128 (46.2%) | 199 (45.6%) |
| 75 Years and over | 18 (9.6%) | 56 (33.3%) |
Disability Class: Self-Care Difficulty
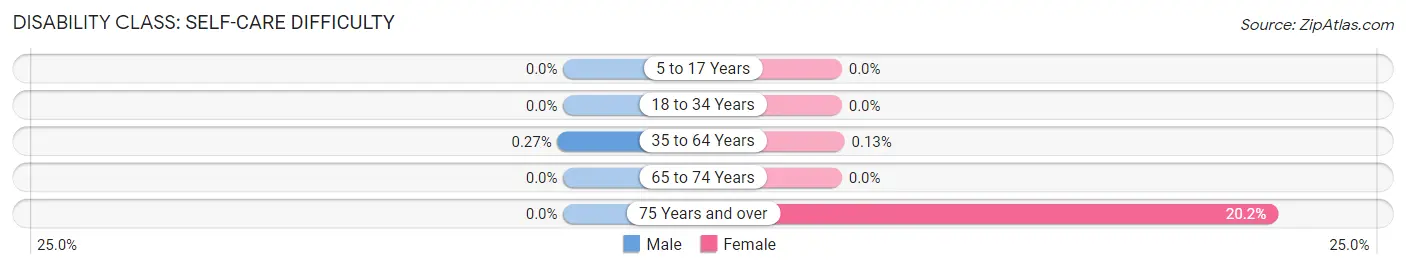
| Age Bracket | Male | Female |
| 5 to 17 Years | 0 (0.0%) | 0 (0.0%) |
| 18 to 34 Years | 0 (0.0%) | 0 (0.0%) |
| 35 to 64 Years | 3 (0.3%) | 2 (0.1%) |
| 65 to 74 Years | 0 (0.0%) | 0 (0.0%) |
| 75 Years and over | 0 (0.0%) | 34 (20.2%) |
Technology Access in Zebulon
Computing Device Access in Zebulon
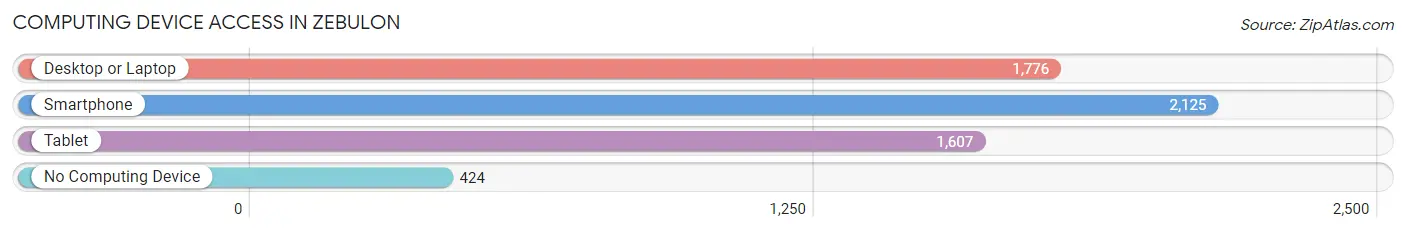
| Device Type | # Households | % Households |
| Desktop or Laptop | 1,776 | 67.4% |
| Smartphone | 2,125 | 80.7% |
| Tablet | 1,607 | 61.0% |
| No Computing Device | 424 | 16.1% |
| Total | 2,633 | 100.0% |
Internet Access in Zebulon
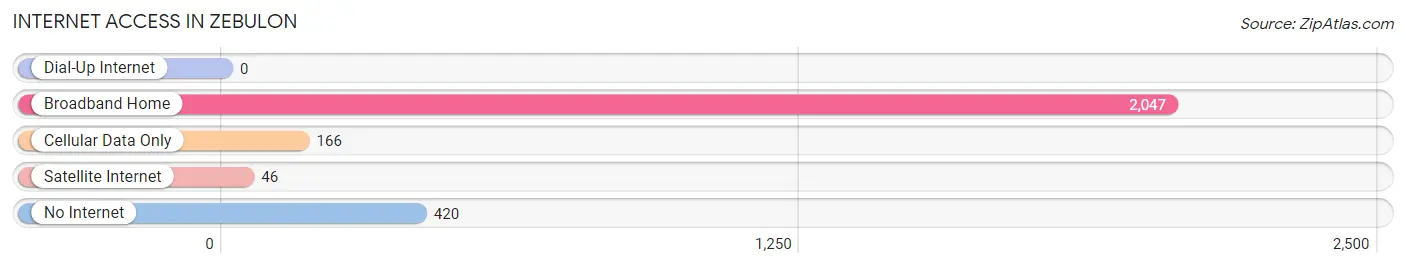
| Internet Type | # Households | % Households |
| Dial-Up Internet | 0 | 0.0% |
| Broadband Home | 2,047 | 77.7% |
| Cellular Data Only | 166 | 6.3% |
| Satellite Internet | 46 | 1.8% |
| No Internet | 420 | 16.0% |
| Total | 2,633 | 100.0% |
Zebulon Summary
Zebulon, North Carolina is a small town located in the eastern part of the state, about 20 miles east of Raleigh. It is part of Wake County and is situated along the banks of the Neuse River. The town has a population of about 4,500 people and is known for its small-town charm and friendly atmosphere.
Geography
Zebulon is located in the eastern part of North Carolina, about 20 miles east of Raleigh. It is part of Wake County and is situated along the banks of the Neuse River. The town is located in the Coastal Plain region of the state, which is characterized by flat terrain and sandy soils. The town is surrounded by farmland and is home to several small lakes and ponds.
History
Zebulon was founded in 1867 by a group of settlers from the nearby town of Wake Forest. The town was named after Zebulon B. Vance, a Confederate general and later governor of North Carolina. The town was incorporated in 1887 and has remained a small, rural community ever since.
Economy
The economy of Zebulon is largely based on agriculture and manufacturing. The town is home to several small farms, which produce a variety of crops, including corn, soybeans, and tobacco. The town is also home to several small manufacturing companies, which produce a variety of products, including furniture, textiles, and electronics.
Demographics
As of the 2010 census, the population of Zebulon was 4,433. The racial makeup of the town was 79.3% White, 15.2% African American, 0.3% Native American, 0.7% Asian, 0.1% Pacific Islander, and 4.4% from other races. The median household income was $41,945, and the median family income was $50,945.
Conclusion
Zebulon, North Carolina is a small town located in the eastern part of the state, about 20 miles east of Raleigh. It is part of Wake County and is situated along the banks of the Neuse River. The town has a population of about 4,500 people and is known for its small-town charm and friendly atmosphere. The economy of Zebulon is largely based on agriculture and manufacturing, and the town is home to several small farms and manufacturing companies. The racial makeup of the town is 79.3% White, 15.2% African American, 0.3% Native American, 0.7% Asian, 0.1% Pacific Islander, and 4.4% from other races. The median household income was $41,945, and the median family income was $50,945. Zebulon is a small town with a rich history and a bright future.
Common Questions
What is Per Capita Income in Zebulon?
Per Capita income in Zebulon is $27,562.
What is the Median Family Income in Zebulon?
Median Family Income in Zebulon is $46,832.
What is the Median Household income in Zebulon?
Median Household Income in Zebulon is $50,934.
What is Income or Wage Gap in Zebulon?
Income or Wage Gap in Zebulon is 2.5%.
Women in Zebulon earn 97.5 cents for every dollar earned by a man.
What is Inequality or Gini Index in Zebulon?
Inequality or Gini Index in Zebulon is 0.42.
What is the Total Population of Zebulon?
Total Population of Zebulon is 7,421.
What is the Total Male Population of Zebulon?
Total Male Population of Zebulon is 2,997.
What is the Total Female Population of Zebulon?
Total Female Population of Zebulon is 4,424.
What is the Ratio of Males per 100 Females in Zebulon?
There are 67.74 Males per 100 Females in Zebulon.
What is the Ratio of Females per 100 Males in Zebulon?
There are 147.61 Females per 100 Males in Zebulon.
What is the Median Population Age in Zebulon?
Median Population Age in Zebulon is 35.6 Years.
What is the Average Family Size in Zebulon
Average Family Size in Zebulon is 3.2 People.
What is the Average Household Size in Zebulon
Average Household Size in Zebulon is 2.8 People.
How Large is the Labor Force in Zebulon?
There are 3,500 People in the Labor Forcein in Zebulon.
What is the Percentage of People in the Labor Force in Zebulon?
60.4% of People are in the Labor Force in Zebulon.
What is the Unemployment Rate in Zebulon?
Unemployment Rate in Zebulon is 9.0%.