Zip Codes with the Highest Percentage of Population Employed in Legal Services & Support in Hendersonville, NC
RELATED REPORTS & OPTIONS
Legal Services & Support
Hendersonville
Compare Zip Codes
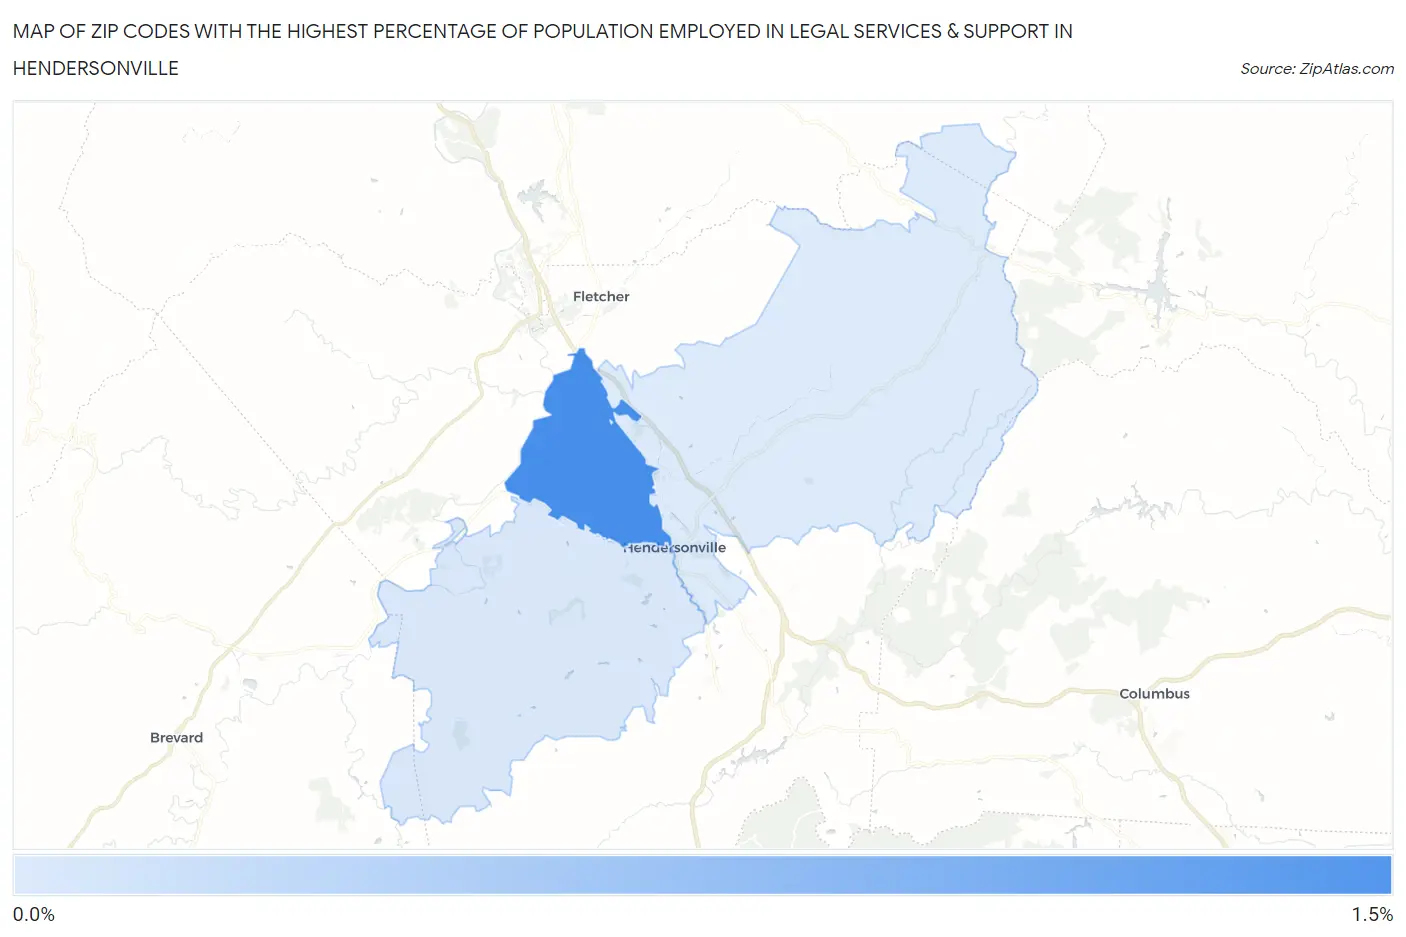
Map of Zip Codes with the Highest Percentage of Population Employed in Legal Services & Support in Hendersonville
0.31%
1.3%
Zip Codes with the Highest Percentage of Population Employed in Legal Services & Support in Hendersonville, NC
| Zip Code | % Employed | vs State | vs National | |
| 1. | 28791 | 1.3% | 0.86%(+0.386)#128 | 1.2%(+0.067)#6,204 |
| 2. | 28739 | 0.34% | 0.86%(-0.521)#373 | 1.2%(-0.841)#14,548 |
| 3. | 28792 | 0.31% | 0.86%(-0.551)#383 | 1.2%(-0.870)#14,881 |
1
Common Questions
What are the Top Zip Codes with the Highest Percentage of Population Employed in Legal Services & Support in Hendersonville, NC?
Top Zip Codes with the Highest Percentage of Population Employed in Legal Services & Support in Hendersonville, NC are:
What zip code has the Highest Percentage of Population Employed in Legal Services & Support in Hendersonville, NC?
28791 has the Highest Percentage of Population Employed in Legal Services & Support in Hendersonville, NC with 1.3%.
What is the Percentage of Population Employed in Legal Services & Support in Hendersonville, NC?
Percentage of Population Employed in Legal Services & Support in Hendersonville is 0.64%.
What is the Percentage of Population Employed in Legal Services & Support in North Carolina?
Percentage of Population Employed in Legal Services & Support in North Carolina is 0.86%.
What is the Percentage of Population Employed in Legal Services & Support in the United States?
Percentage of Population Employed in Legal Services & Support in the United States is 1.2%.