Ruth, NC Map & Demographics
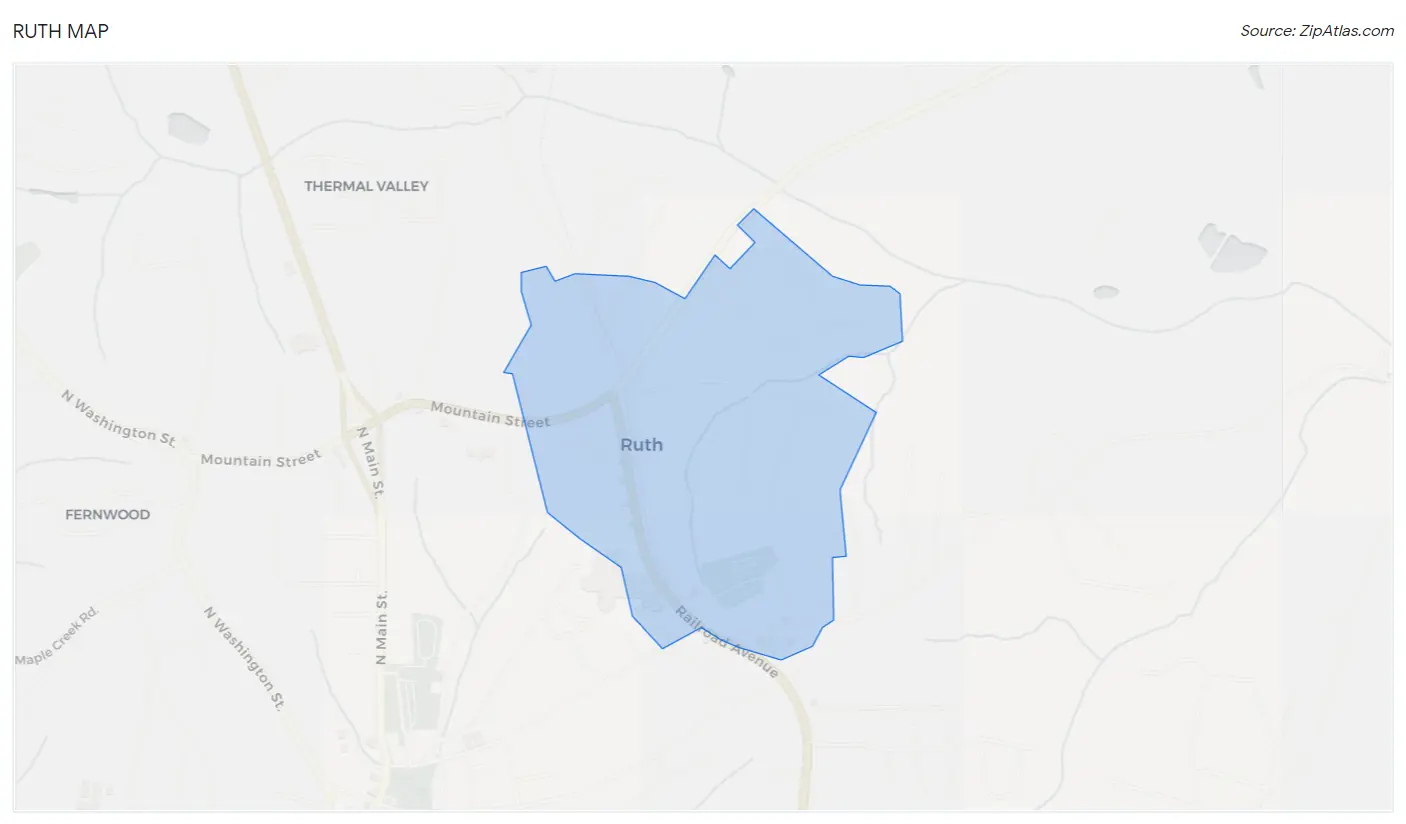
Ruth Map
Ruth Overview
$24,367
PER CAPITA INCOME
$60,179
AVG FAMILY INCOME
$56,875
AVG HOUSEHOLD INCOME
46.2%
WAGE / INCOME GAP [ % ]
53.8¢/ $1
WAGE / INCOME GAP [ $ ]
0.39
INEQUALITY / GINI INDEX
621
TOTAL POPULATION
330
MALE POPULATION
291
FEMALE POPULATION
113.40
MALES / 100 FEMALES
88.18
FEMALES / 100 MALES
41.8
MEDIAN AGE
2.7
AVG FAMILY SIZE
2.5
AVG HOUSEHOLD SIZE
261
LABOR FORCE [ PEOPLE ]
51.2%
PERCENT IN LABOR FORCE
2.3%
UNEMPLOYMENT RATE
Income in Ruth
Income Overview in Ruth
Per Capita Income in Ruth is $24,367, while median incomes of families and households are $60,179 and $56,875 respectively.
| Characteristic | Number | Measure |
| Per Capita Income | 621 | $24,367 |
| Median Family Income | 201 | $60,179 |
| Mean Family Income | 201 | $64,247 |
| Median Household Income | 247 | $56,875 |
| Mean Household Income | 247 | $61,199 |
| Income Deficit | 201 | $0 |
| Wage / Income Gap (%) | 621 | 46.17% |
| Wage / Income Gap ($) | 621 | 53.83¢ per $1 |
| Gini / Inequality Index | 621 | 0.39 |
Earnings by Sex in Ruth
Average Earnings in Ruth are $36,979, $48,250 for men and $25,972 for women, a difference of 46.2%.
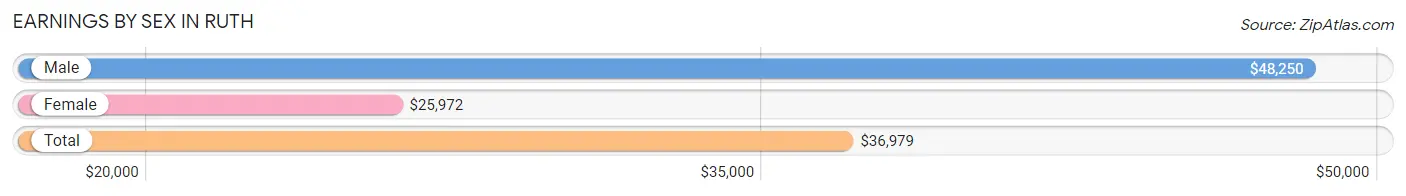
| Sex | Number | Average Earnings |
| Male | 157 (55.3%) | $48,250 |
| Female | 127 (44.7%) | $25,972 |
| Total | 284 (100.0%) | $36,979 |
Earnings by Sex by Income Bracket in Ruth
The most common earnings brackets in Ruth are $75,000 to $99,999 for men (25 | 15.9%) and $2,500 to $4,999 for women (16 | 12.6%).
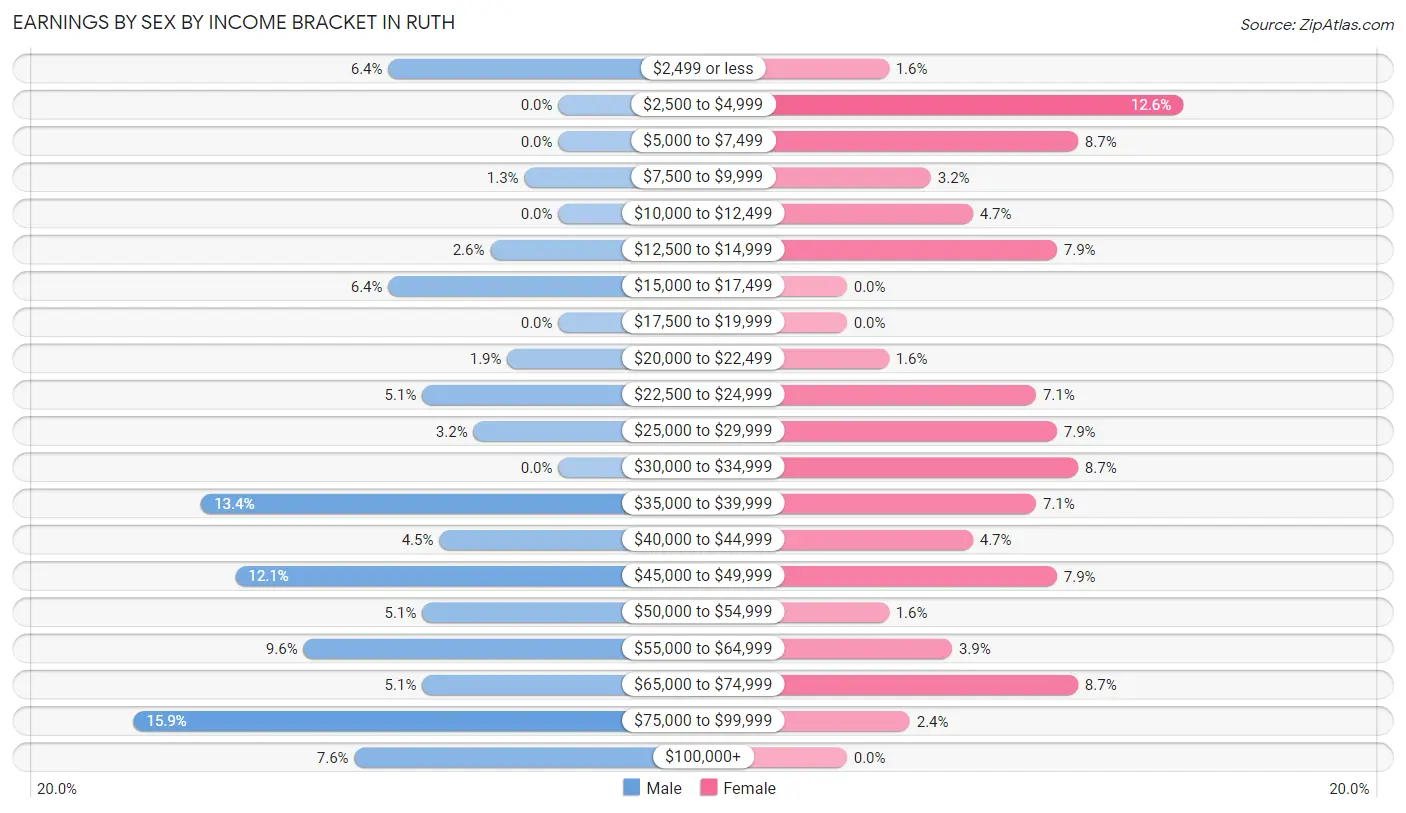
| Income | Male | Female |
| $2,499 or less | 10 (6.4%) | 2 (1.6%) |
| $2,500 to $4,999 | 0 (0.0%) | 16 (12.6%) |
| $5,000 to $7,499 | 0 (0.0%) | 11 (8.7%) |
| $7,500 to $9,999 | 2 (1.3%) | 4 (3.2%) |
| $10,000 to $12,499 | 0 (0.0%) | 6 (4.7%) |
| $12,500 to $14,999 | 4 (2.5%) | 10 (7.9%) |
| $15,000 to $17,499 | 10 (6.4%) | 0 (0.0%) |
| $17,500 to $19,999 | 0 (0.0%) | 0 (0.0%) |
| $20,000 to $22,499 | 3 (1.9%) | 2 (1.6%) |
| $22,500 to $24,999 | 8 (5.1%) | 9 (7.1%) |
| $25,000 to $29,999 | 5 (3.2%) | 10 (7.9%) |
| $30,000 to $34,999 | 0 (0.0%) | 11 (8.7%) |
| $35,000 to $39,999 | 21 (13.4%) | 9 (7.1%) |
| $40,000 to $44,999 | 7 (4.5%) | 6 (4.7%) |
| $45,000 to $49,999 | 19 (12.1%) | 10 (7.9%) |
| $50,000 to $54,999 | 8 (5.1%) | 2 (1.6%) |
| $55,000 to $64,999 | 15 (9.6%) | 5 (3.9%) |
| $65,000 to $74,999 | 8 (5.1%) | 11 (8.7%) |
| $75,000 to $99,999 | 25 (15.9%) | 3 (2.4%) |
| $100,000+ | 12 (7.6%) | 0 (0.0%) |
| Total | 157 (100.0%) | 127 (100.0%) |
Earnings by Sex by Educational Attainment in Ruth
Average earnings in Ruth are $49,667 for men and $33,182 for women, a difference of 33.2%. Men with an educational attainment of college or associate's degree enjoy the highest average annual earnings of $61,042, while those with less than high school education earn the least with $24,167. Women with an educational attainment of college or associate's degree earn the most with the average annual earnings of $34,318, while those with college or associate's degree education have the smallest earnings of $34,318.
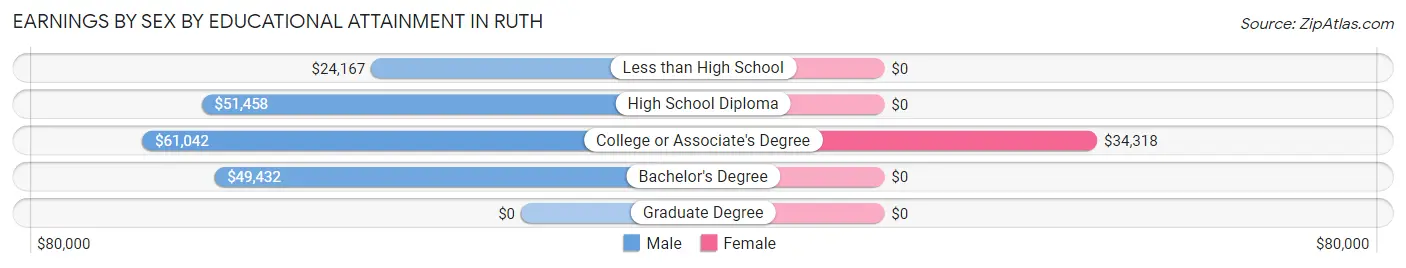
| Educational Attainment | Male Income | Female Income |
| Less than High School | $24,167 | $0 |
| High School Diploma | $51,458 | $0 |
| College or Associate's Degree | $61,042 | $34,318 |
| Bachelor's Degree | $49,432 | $0 |
| Graduate Degree | - | - |
| Total | $49,667 | $33,182 |
Family Income in Ruth
Family Income Brackets in Ruth
According to the Ruth family income data, there are 43 families falling into the $75,000 to $99,999 income range, which is the most common income bracket and makes up 21.4% of all families.
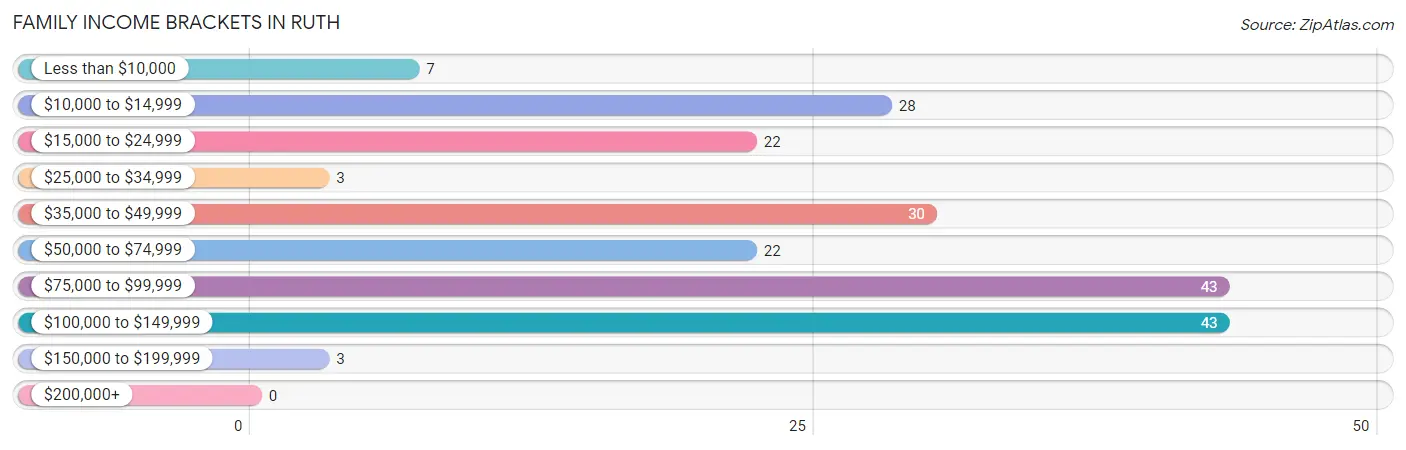
| Income Bracket | # Families | % Families |
| Less than $10,000 | 7 | 3.5% |
| $10,000 to $14,999 | 28 | 13.9% |
| $15,000 to $24,999 | 22 | 10.9% |
| $25,000 to $34,999 | 3 | 1.5% |
| $35,000 to $49,999 | 30 | 14.9% |
| $50,000 to $74,999 | 22 | 10.9% |
| $75,000 to $99,999 | 43 | 21.4% |
| $100,000 to $149,999 | 43 | 21.4% |
| $150,000 to $199,999 | 3 | 1.5% |
| $200,000+ | 0 | 0.0% |
Family Income by Famaliy Size in Ruth
3-person families (36 | 17.9%) account for the highest median family income in Ruth with $108,125 per family, while 3-person families (36 | 17.9%) have the highest median income of $36,042 per family member.
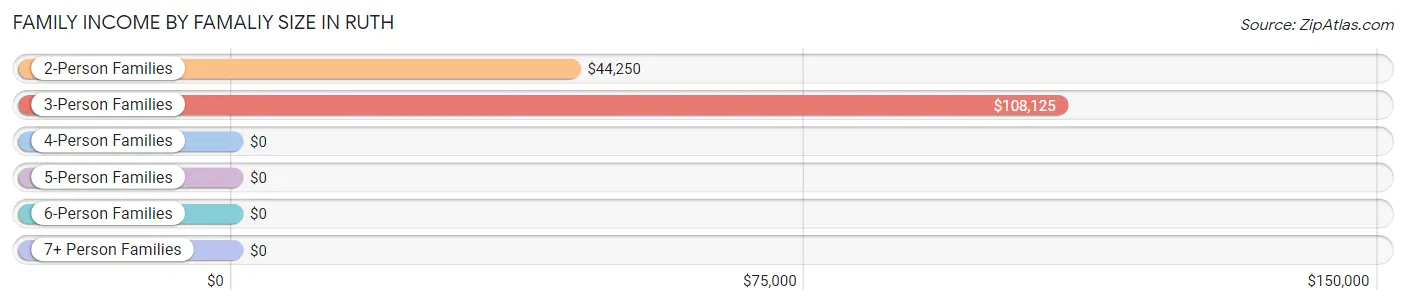
| Income Bracket | # Families | Median Income |
| 2-Person Families | 131 (65.2%) | $44,250 |
| 3-Person Families | 36 (17.9%) | $108,125 |
| 4-Person Families | 24 (11.9%) | $0 |
| 5-Person Families | 8 (4.0%) | $0 |
| 6-Person Families | 2 (1.0%) | $0 |
| 7+ Person Families | 0 (0.0%) | $0 |
| Total | 201 (100.0%) | $60,179 |
Family Income by Number of Earners in Ruth
The median family income in Ruth is $60,179, with families comprising 3+ earners (10) having the highest median family income of $135,625, while families with no earners (58) have the lowest median family income of $20,294, accounting for 5.0% and 28.9% of families, respectively.
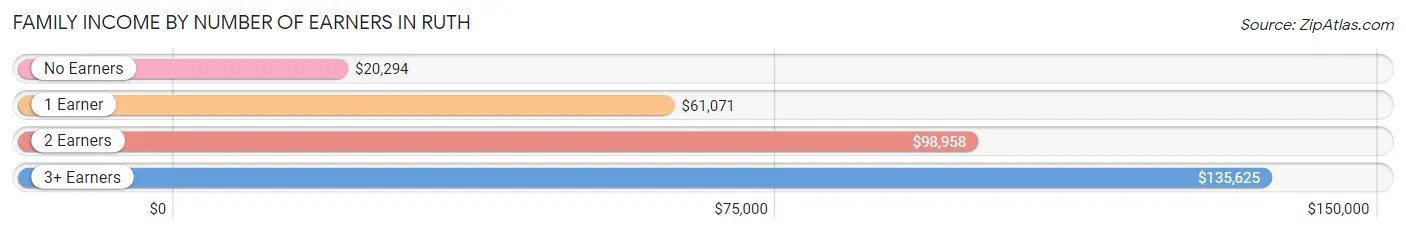
| Number of Earners | # Families | Median Income |
| No Earners | 58 (28.9%) | $20,294 |
| 1 Earner | 62 (30.8%) | $61,071 |
| 2 Earners | 71 (35.3%) | $98,958 |
| 3+ Earners | 10 (5.0%) | $135,625 |
| Total | 201 (100.0%) | $60,179 |
Household Income in Ruth
Household Income Brackets in Ruth
With 55 households falling in the category, the $75,000 to $99,999 income range is the most frequent in Ruth, accounting for 22.3% of all households.
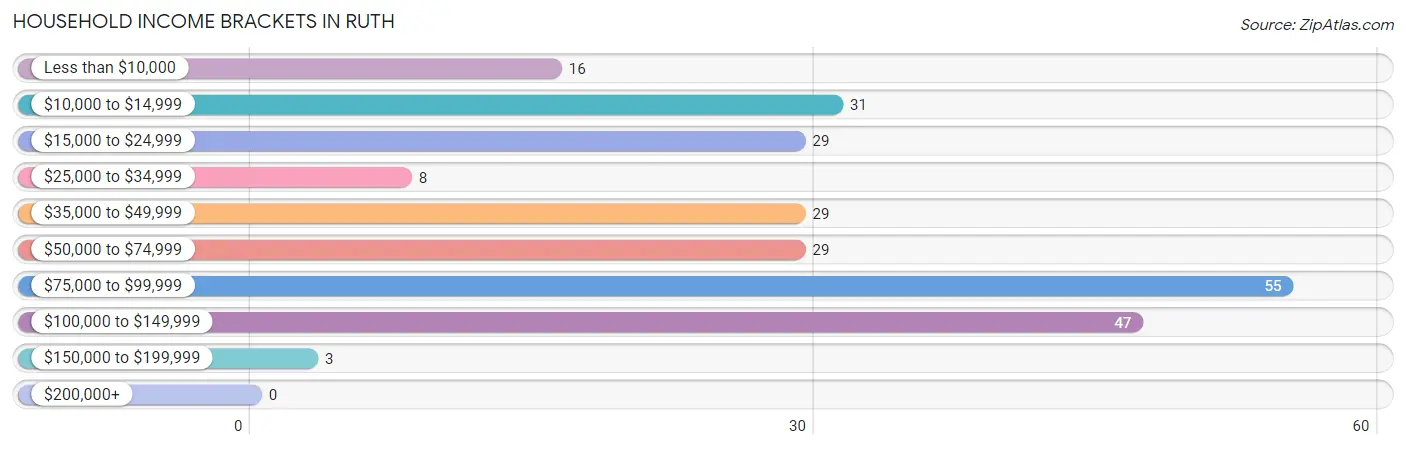
| Income Bracket | # Households | % Households |
| Less than $10,000 | 16 | 6.5% |
| $10,000 to $14,999 | 31 | 12.6% |
| $15,000 to $24,999 | 29 | 11.7% |
| $25,000 to $34,999 | 8 | 3.2% |
| $35,000 to $49,999 | 29 | 11.7% |
| $50,000 to $74,999 | 29 | 11.7% |
| $75,000 to $99,999 | 55 | 22.3% |
| $100,000 to $149,999 | 47 | 19.0% |
| $150,000 to $199,999 | 3 | 1.2% |
| $200,000+ | 0 | 0.0% |
Household Income by Householder Age in Ruth
The median household income in Ruth is $56,875, with the highest median household income of $80,357 found in the 25 to 44 years age bracket for the primary householder. A total of 76 households (30.8%) fall into this category.
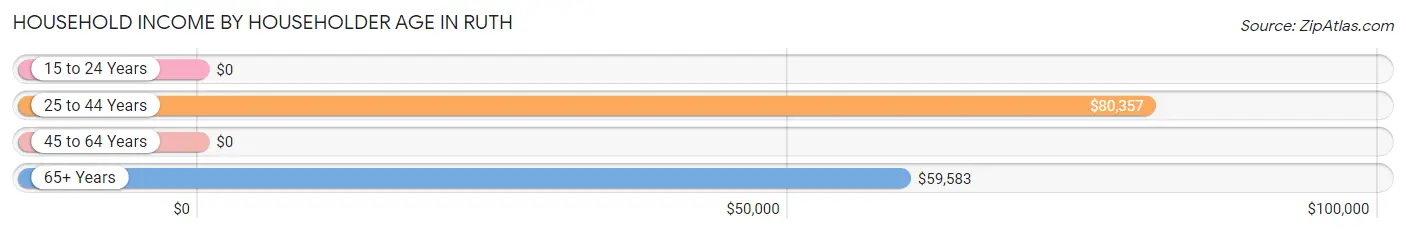
| Income Bracket | # Households | Median Income |
| 15 to 24 Years | 0 (0.0%) | $0 |
| 25 to 44 Years | 76 (30.8%) | $80,357 |
| 45 to 64 Years | 104 (42.1%) | $0 |
| 65+ Years | 67 (27.1%) | $59,583 |
| Total | 247 (100.0%) | $56,875 |
Poverty in Ruth
Income Below Poverty by Sex and Age in Ruth
With 21.7% poverty level for males and 22.3% for females among the residents of Ruth, 18 to 24 year old males and 6 to 11 year old females are the most vulnerable to poverty, with 13 males (48.1%) and 5 females (71.4%) in their respective age groups living below the poverty level.
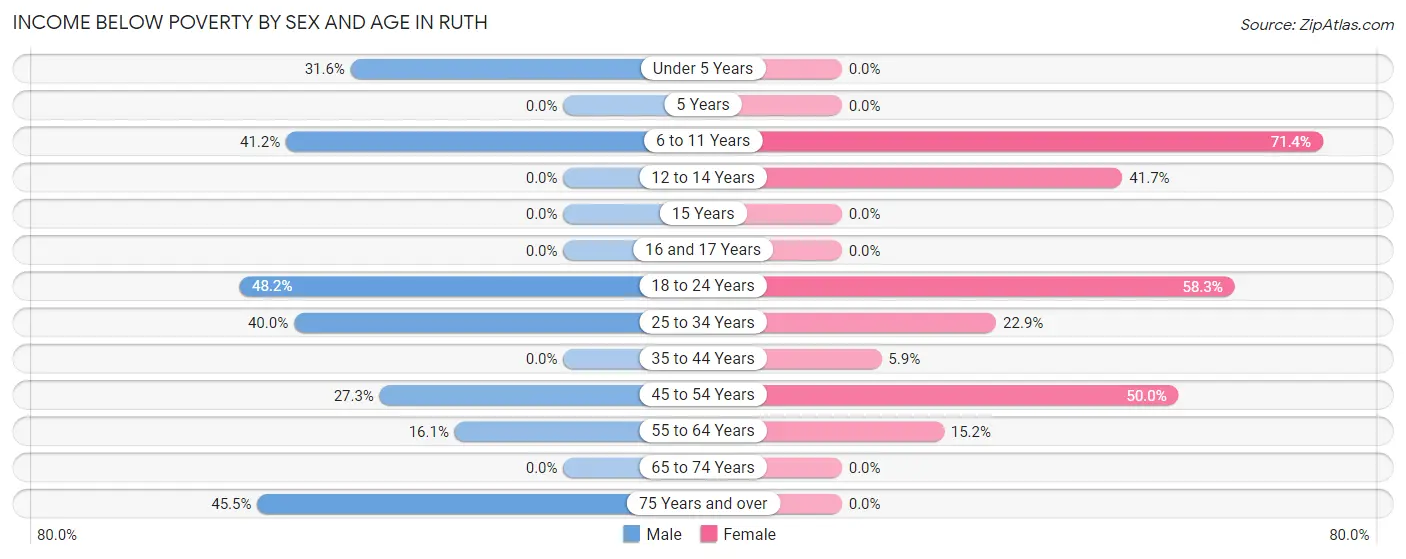
| Age Bracket | Male | Female |
| Under 5 Years | 6 (31.6%) | 0 (0.0%) |
| 5 Years | 0 (0.0%) | 0 (0.0%) |
| 6 to 11 Years | 14 (41.2%) | 5 (71.4%) |
| 12 to 14 Years | 0 (0.0%) | 5 (41.7%) |
| 15 Years | 0 (0.0%) | 0 (0.0%) |
| 16 and 17 Years | 0 (0.0%) | 0 (0.0%) |
| 18 to 24 Years | 13 (48.1%) | 7 (58.3%) |
| 25 to 34 Years | 16 (40.0%) | 11 (22.9%) |
| 35 to 44 Years | 0 (0.0%) | 1 (5.9%) |
| 45 to 54 Years | 12 (27.3%) | 26 (50.0%) |
| 55 to 64 Years | 5 (16.1%) | 10 (15.1%) |
| 65 to 74 Years | 0 (0.0%) | 0 (0.0%) |
| 75 Years and over | 5 (45.5%) | 0 (0.0%) |
| Total | 71 (21.7%) | 65 (22.3%) |
Income Above Poverty by Sex and Age in Ruth
According to the poverty statistics in Ruth, males aged 12 to 14 years and females aged under 5 years are the age groups that are most secure financially, with 100.0% of males and 100.0% of females in these age groups living above the poverty line.
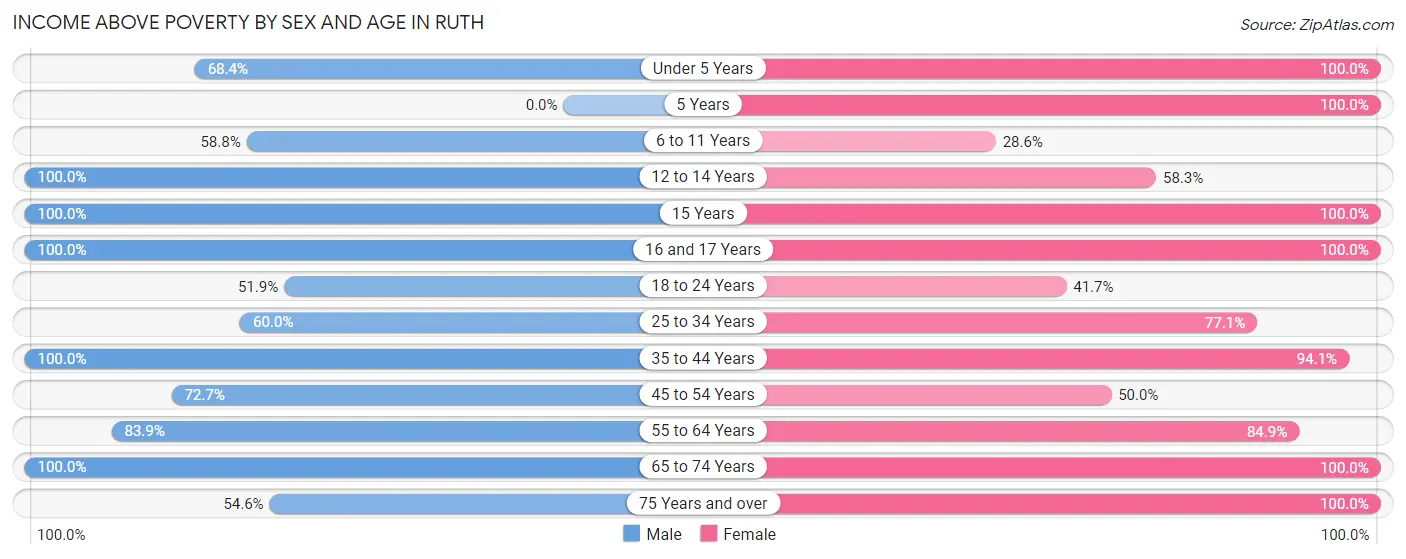
| Age Bracket | Male | Female |
| Under 5 Years | 13 (68.4%) | 5 (100.0%) |
| 5 Years | 0 (0.0%) | 5 (100.0%) |
| 6 to 11 Years | 20 (58.8%) | 2 (28.6%) |
| 12 to 14 Years | 21 (100.0%) | 7 (58.3%) |
| 15 Years | 2 (100.0%) | 3 (100.0%) |
| 16 and 17 Years | 8 (100.0%) | 12 (100.0%) |
| 18 to 24 Years | 14 (51.8%) | 5 (41.7%) |
| 25 to 34 Years | 24 (60.0%) | 37 (77.1%) |
| 35 to 44 Years | 42 (100.0%) | 16 (94.1%) |
| 45 to 54 Years | 32 (72.7%) | 26 (50.0%) |
| 55 to 64 Years | 26 (83.9%) | 56 (84.9%) |
| 65 to 74 Years | 48 (100.0%) | 29 (100.0%) |
| 75 Years and over | 6 (54.5%) | 23 (100.0%) |
| Total | 256 (78.3%) | 226 (77.7%) |
Income Below Poverty Among Married-Couple Families in Ruth
The poverty statistics for married-couple families in Ruth show that 2.8% or 3 of the total 106 families live below the poverty line. Families with no children have the highest poverty rate of 4.0%, comprising of 3 families. On the other hand, families with 1 or 2 children have the lowest poverty rate of 0.0%, which includes 0 families.
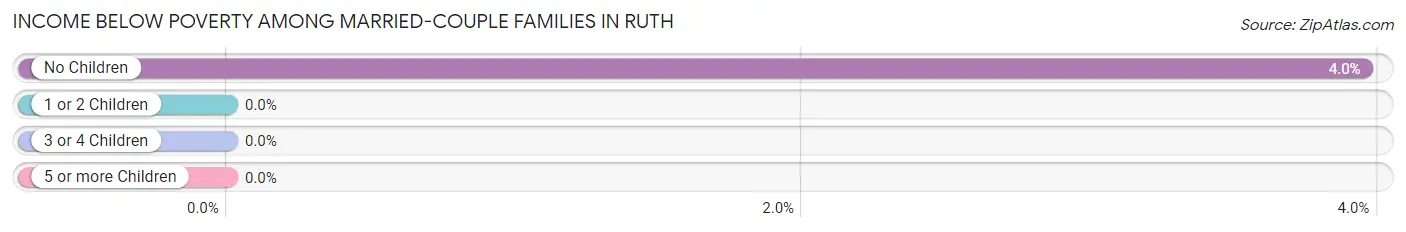
| Children | Above Poverty | Below Poverty |
| No Children | 73 (96.1%) | 3 (4.0%) |
| 1 or 2 Children | 23 (100.0%) | 0 (0.0%) |
| 3 or 4 Children | 7 (100.0%) | 0 (0.0%) |
| 5 or more Children | 0 (0.0%) | 0 (0.0%) |
| Total | 103 (97.2%) | 3 (2.8%) |
Income Below Poverty Among Single-Parent Households in Ruth
According to the poverty data in Ruth, 24.3% or 9 single-father households and 48.3% or 28 single-mother households are living below the poverty line. Among single-father households, those with 3 or 4 children have the highest poverty rate, with 4 households (100.0%) experiencing poverty. Likewise, among single-mother households, those with no children have the highest poverty rate, with 22 households (59.5%) falling below the poverty line.
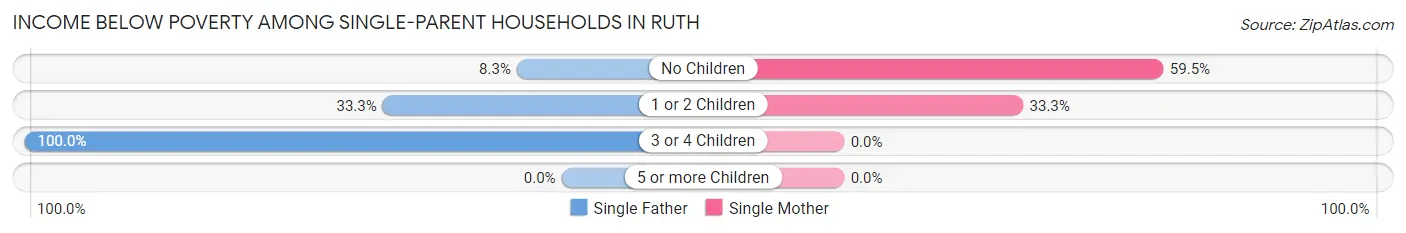
| Children | Single Father | Single Mother |
| No Children | 2 (8.3%) | 22 (59.5%) |
| 1 or 2 Children | 3 (33.3%) | 6 (33.3%) |
| 3 or 4 Children | 4 (100.0%) | 0 (0.0%) |
| 5 or more Children | 0 (0.0%) | 0 (0.0%) |
| Total | 9 (24.3%) | 28 (48.3%) |
Income Below Poverty Among Married-Couple vs Single-Parent Households in Ruth
The poverty data for Ruth shows that 3 of the married-couple family households (2.8%) and 37 of the single-parent households (39.0%) are living below the poverty level. Within the married-couple family households, those with no children have the highest poverty rate, with 3 households (4.0%) falling below the poverty line. Among the single-parent households, those with 3 or 4 children have the highest poverty rate, with 4 household (57.1%) living below poverty.
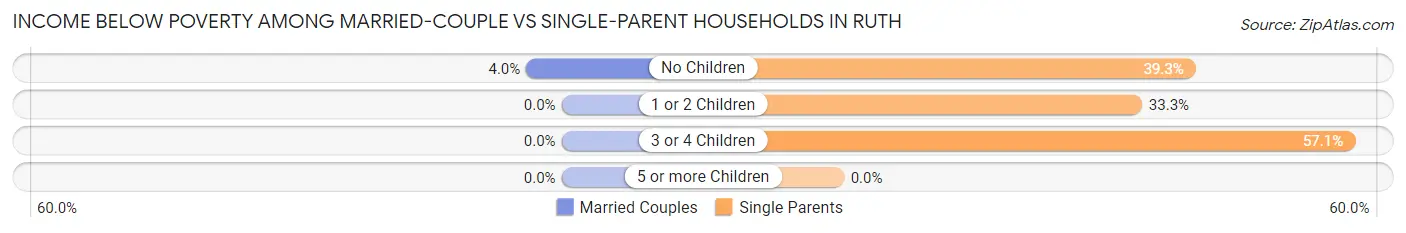
| Children | Married-Couple Families | Single-Parent Households |
| No Children | 3 (4.0%) | 24 (39.3%) |
| 1 or 2 Children | 0 (0.0%) | 9 (33.3%) |
| 3 or 4 Children | 0 (0.0%) | 4 (57.1%) |
| 5 or more Children | 0 (0.0%) | 0 (0.0%) |
| Total | 3 (2.8%) | 37 (39.0%) |
Race in Ruth
The most populous races in Ruth are White / Caucasian (514 | 82.8%), Two or more Races (85 | 13.7%), and Hispanic or Latino (72 | 11.6%).
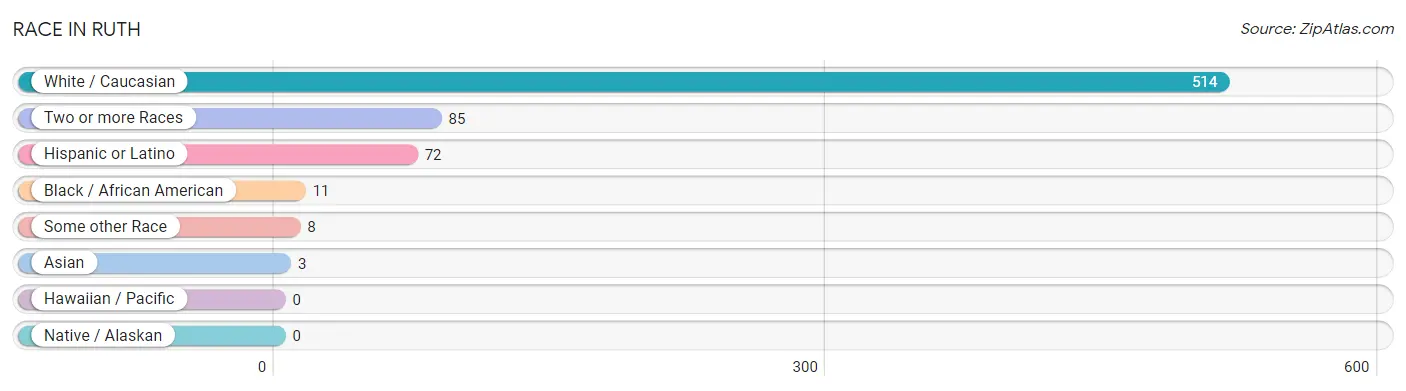
| Race | # Population | % Population |
| Asian | 3 | 0.5% |
| Black / African American | 11 | 1.8% |
| Hawaiian / Pacific | 0 | 0.0% |
| Hispanic or Latino | 72 | 11.6% |
| Native / Alaskan | 0 | 0.0% |
| White / Caucasian | 514 | 82.8% |
| Two or more Races | 85 | 13.7% |
| Some other Race | 8 | 1.3% |
| Total | 621 | 100.0% |
Ancestry in Ruth
The most populous ancestries reported in Ruth are American (87 | 14.0%), Mexican (67 | 10.8%), English (46 | 7.4%), European (37 | 6.0%), and Irish (26 | 4.2%), together accounting for 42.4% of all Ruth residents.
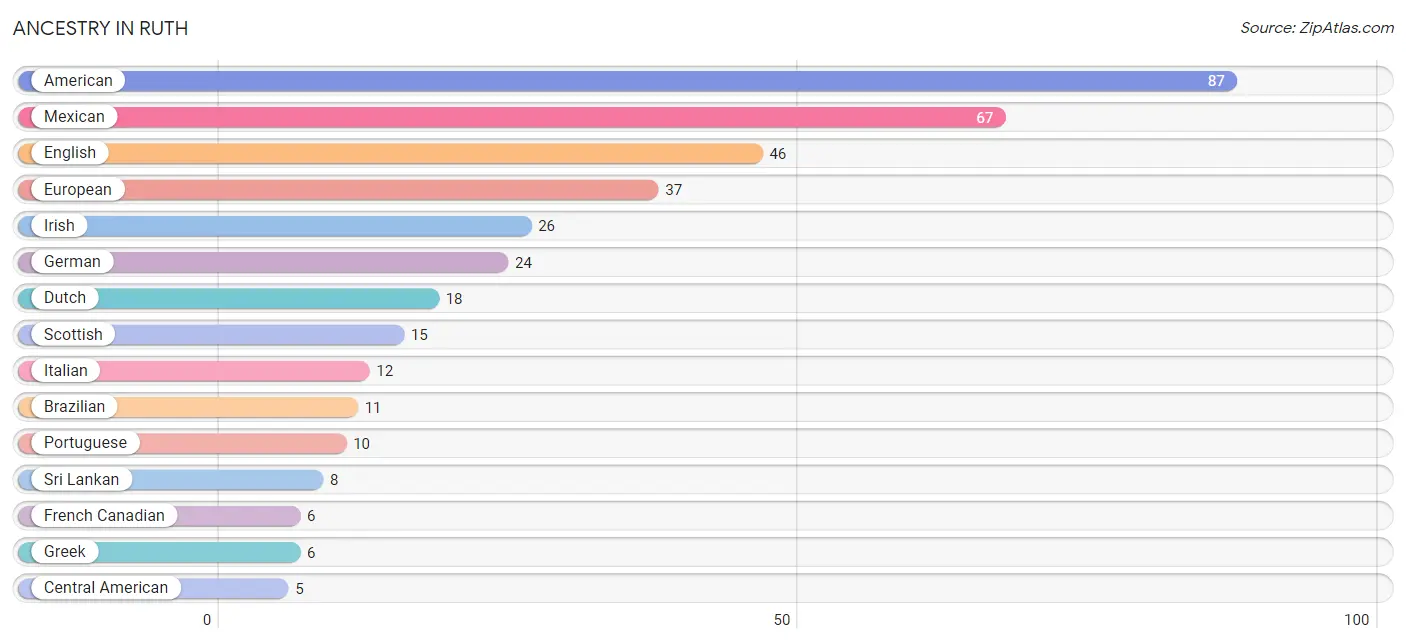
| Ancestry | # Population | % Population |
| American | 87 | 14.0% |
| Brazilian | 11 | 1.8% |
| Central American | 5 | 0.8% |
| Cherokee | 4 | 0.6% |
| Dutch | 18 | 2.9% |
| English | 46 | 7.4% |
| European | 37 | 6.0% |
| French | 3 | 0.5% |
| French Canadian | 6 | 1.0% |
| German | 24 | 3.9% |
| Greek | 6 | 1.0% |
| Guatemalan | 5 | 0.8% |
| Irish | 26 | 4.2% |
| Italian | 12 | 1.9% |
| Mexican | 67 | 10.8% |
| Navajo | 2 | 0.3% |
| Norwegian | 4 | 0.6% |
| Portuguese | 10 | 1.6% |
| Russian | 2 | 0.3% |
| Scottish | 15 | 2.4% |
| Sri Lankan | 8 | 1.3% |
| Swedish | 2 | 0.3% | View All 22 Rows |
Immigrants in Ruth
The most numerous immigrant groups reported in Ruth came from Latin America (34 | 5.5%), Central America (26 | 4.2%), Mexico (21 | 3.4%), Brazil (8 | 1.3%), and South America (8 | 1.3%), together accounting for 15.6% of all Ruth residents.
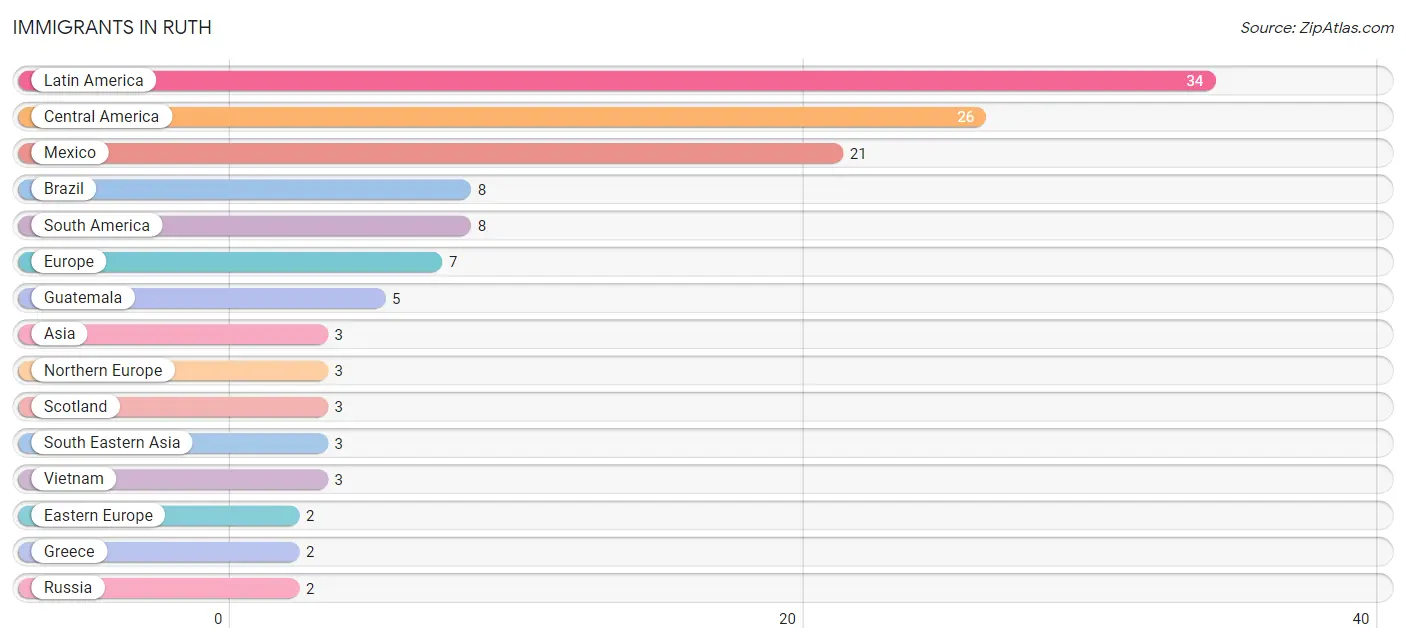
| Immigration Origin | # Population | % Population |
| Asia | 3 | 0.5% |
| Brazil | 8 | 1.3% |
| Central America | 26 | 4.2% |
| Eastern Europe | 2 | 0.3% |
| Europe | 7 | 1.1% |
| Greece | 2 | 0.3% |
| Guatemala | 5 | 0.8% |
| Latin America | 34 | 5.5% |
| Mexico | 21 | 3.4% |
| Northern Europe | 3 | 0.5% |
| Russia | 2 | 0.3% |
| Scotland | 3 | 0.5% |
| South America | 8 | 1.3% |
| South Eastern Asia | 3 | 0.5% |
| Southern Europe | 2 | 0.3% |
| Vietnam | 3 | 0.5% | View All 16 Rows |
Sex and Age in Ruth
Sex and Age in Ruth
The most populous age groups in Ruth are 65 to 69 Years (37 | 11.2%) for men and 60 to 64 Years (40 | 13.8%) for women.
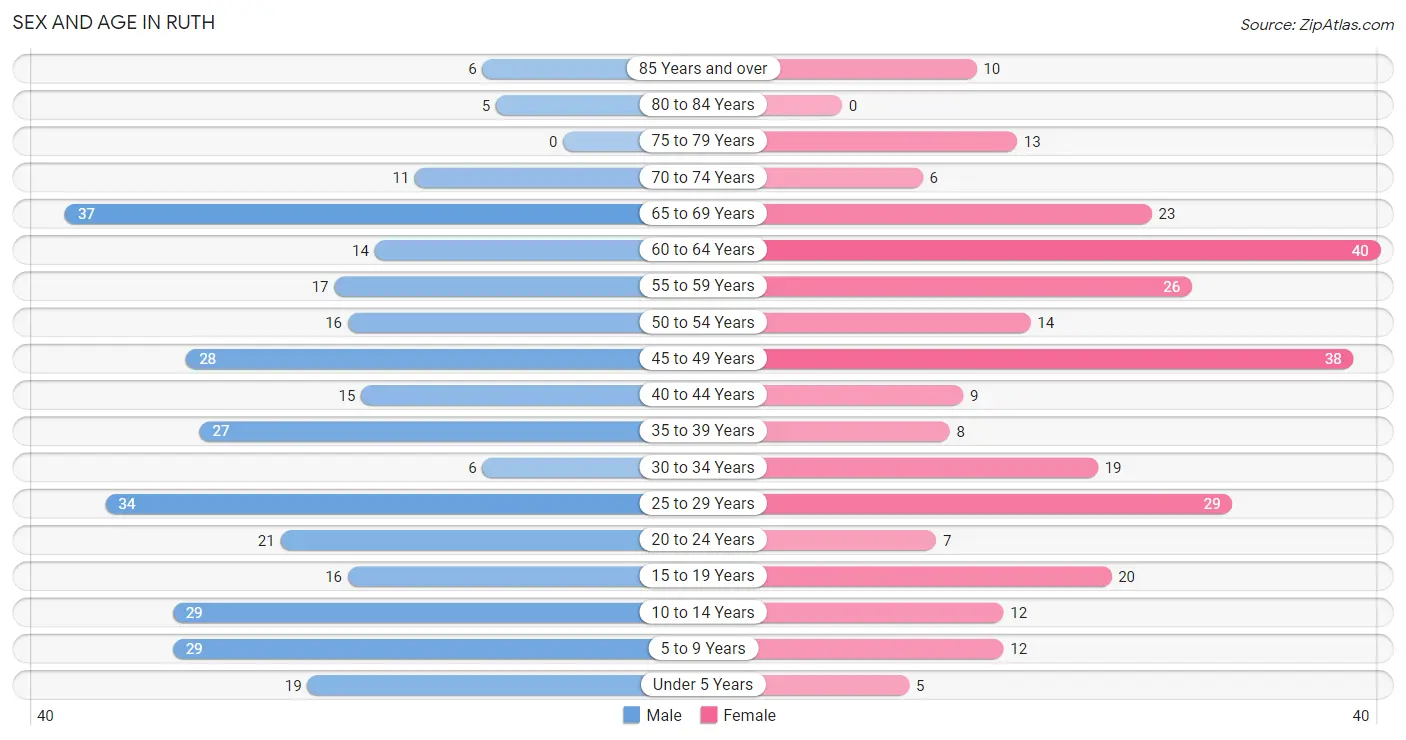
| Age Bracket | Male | Female |
| Under 5 Years | 19 (5.8%) | 5 (1.7%) |
| 5 to 9 Years | 29 (8.8%) | 12 (4.1%) |
| 10 to 14 Years | 29 (8.8%) | 12 (4.1%) |
| 15 to 19 Years | 16 (4.9%) | 20 (6.9%) |
| 20 to 24 Years | 21 (6.4%) | 7 (2.4%) |
| 25 to 29 Years | 34 (10.3%) | 29 (10.0%) |
| 30 to 34 Years | 6 (1.8%) | 19 (6.5%) |
| 35 to 39 Years | 27 (8.2%) | 8 (2.8%) |
| 40 to 44 Years | 15 (4.5%) | 9 (3.1%) |
| 45 to 49 Years | 28 (8.5%) | 38 (13.1%) |
| 50 to 54 Years | 16 (4.9%) | 14 (4.8%) |
| 55 to 59 Years | 17 (5.1%) | 26 (8.9%) |
| 60 to 64 Years | 14 (4.2%) | 40 (13.8%) |
| 65 to 69 Years | 37 (11.2%) | 23 (7.9%) |
| 70 to 74 Years | 11 (3.3%) | 6 (2.1%) |
| 75 to 79 Years | 0 (0.0%) | 13 (4.5%) |
| 80 to 84 Years | 5 (1.5%) | 0 (0.0%) |
| 85 Years and over | 6 (1.8%) | 10 (3.4%) |
| Total | 330 (100.0%) | 291 (100.0%) |
Families and Households in Ruth
Median Family Size in Ruth
The median family size in Ruth is 2.68 persons per family, with married-couple families (106 | 52.7%) accounting for the largest median family size of 2.88 persons per family. On the other hand, single female/mother families (58 | 28.9%) represent the smallest median family size with 2.38 persons per family.
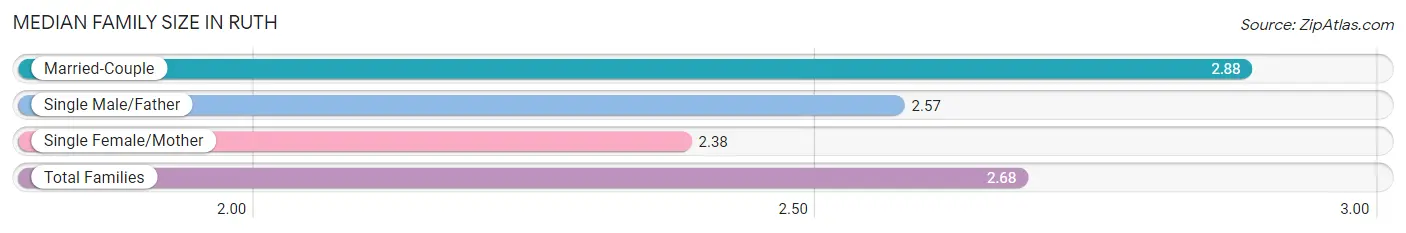
| Family Type | # Families | Family Size |
| Married-Couple | 106 (52.7%) | 2.88 |
| Single Male/Father | 37 (18.4%) | 2.57 |
| Single Female/Mother | 58 (28.9%) | 2.38 |
| Total Families | 201 (100.0%) | 2.68 |
Median Household Size in Ruth
The median household size in Ruth is 2.51 persons per household, with married-couple households (106 | 42.9%) accounting for the largest median household size of 2.88 persons per household. non-family households (46 | 18.6%) represent the smallest median household size with 1.54 persons per household.
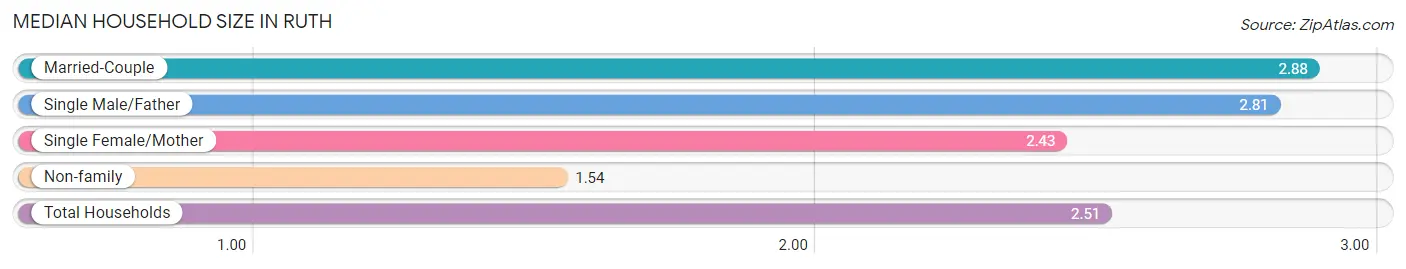
| Household Type | # Households | Household Size |
| Married-Couple | 106 (42.9%) | 2.88 |
| Single Male/Father | 37 (15.0%) | 2.81 |
| Single Female/Mother | 58 (23.5%) | 2.43 |
| Non-family | 46 (18.6%) | 1.54 |
| Total Households | 247 (100.0%) | 2.51 |
Household Size by Marriage Status in Ruth
Out of a total of 247 households in Ruth, 201 (81.4%) are family households, while 46 (18.6%) are nonfamily households. The most numerous type of family households are 2-person households, comprising 128, and the most common type of nonfamily households are 1-person households, comprising 24.
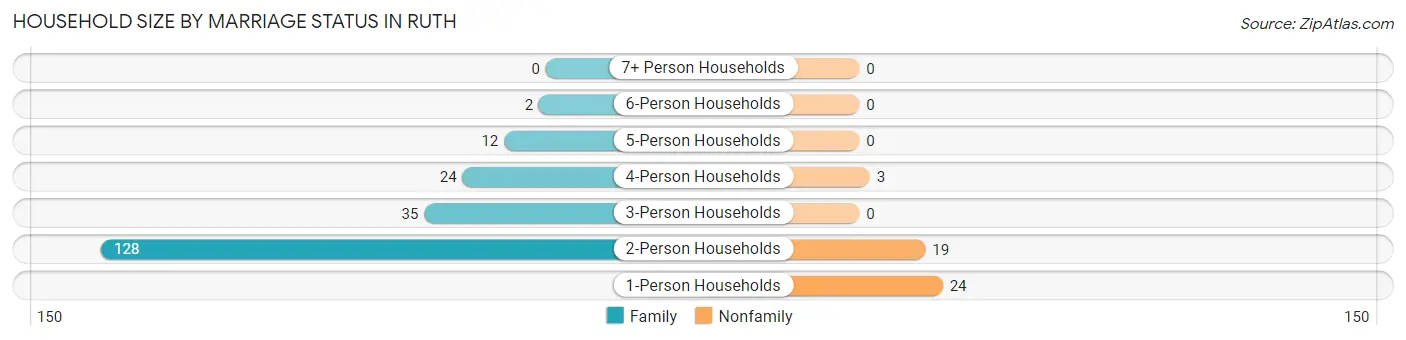
| Household Size | Family Households | Nonfamily Households |
| 1-Person Households | - | 24 (9.7%) |
| 2-Person Households | 128 (51.8%) | 19 (7.7%) |
| 3-Person Households | 35 (14.2%) | 0 (0.0%) |
| 4-Person Households | 24 (9.7%) | 3 (1.2%) |
| 5-Person Households | 12 (4.9%) | 0 (0.0%) |
| 6-Person Households | 2 (0.8%) | 0 (0.0%) |
| 7+ Person Households | 0 (0.0%) | 0 (0.0%) |
| Total | 201 (81.4%) | 46 (18.6%) |
Female Fertility in Ruth
Fertility by Age in Ruth
Average fertility rate in Ruth is 69.0 births per 1,000 women. Women in the age bracket of 20 to 34 years have the highest fertility rate with 164.0 births per 1,000 women. Women in the age bracket of 20 to 34 years acount for 100.0% of all women with births.
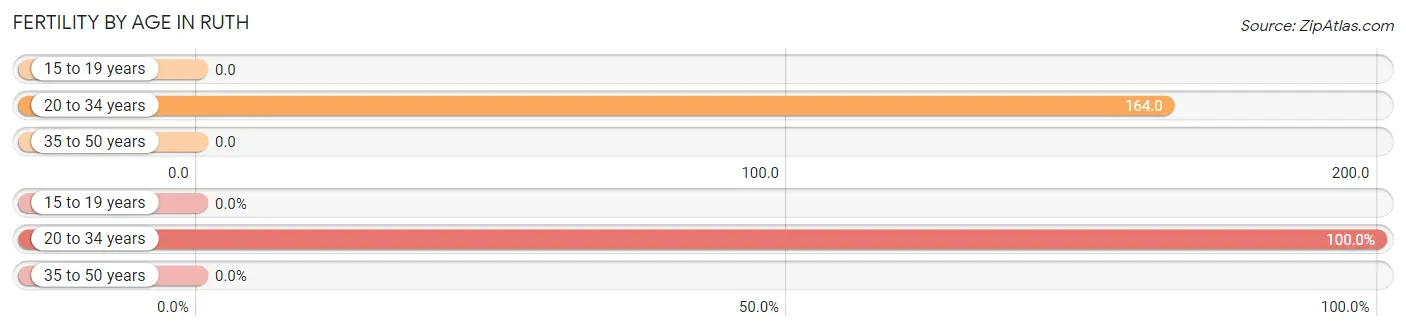
| Age Bracket | Women with Births | Births / 1,000 Women |
| 15 to 19 years | 0 (0.0%) | 0.0 |
| 20 to 34 years | 9 (100.0%) | 164.0 |
| 35 to 50 years | 0 (0.0%) | 0.0 |
| Total | 9 (100.0%) | 69.0 |
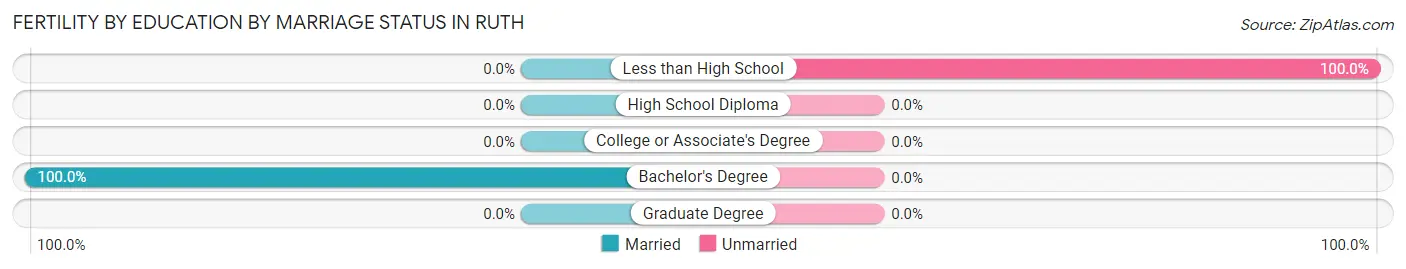
Fertility by Age by Marriage Status in Ruth
22.2% of women with births (9) in Ruth are married. The highest percentage of unmarried women with births falls into 20 to 34 years age bracket with 77.8% of them unmarried at the time of birth, while the lowest percentage of unmarried women with births belong to 20 to 34 years age bracket with 77.8% of them unmarried.
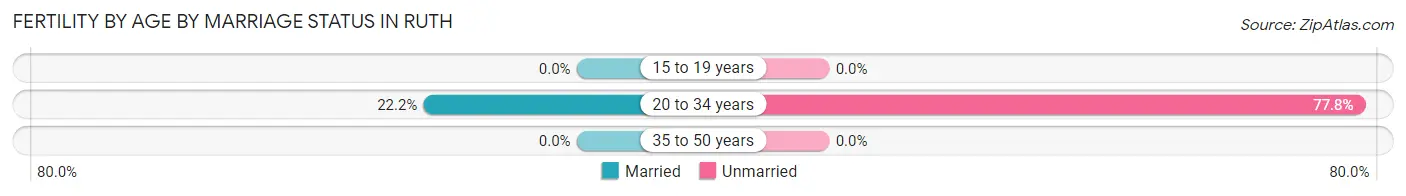
| Age Bracket | Married | Unmarried |
| 15 to 19 years | 0 (0.0%) | 0 (0.0%) |
| 20 to 34 years | 2 (22.2%) | 7 (77.8%) |
| 35 to 50 years | 0 (0.0%) | 0 (0.0%) |
| Total | 2 (22.2%) | 7 (77.8%) |
Fertility by Education in Ruth
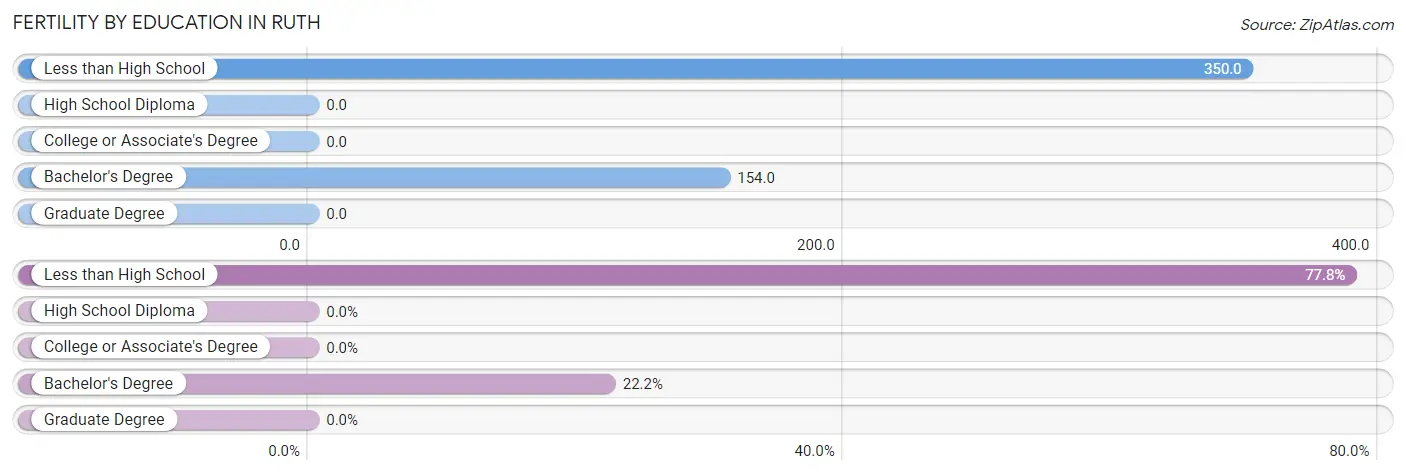
| Educational Attainment | Women with Births | Births / 1,000 Women |
| Less than High School | 7 (77.8%) | 350.0 |
| High School Diploma | 0 (0.0%) | 0.0 |
| College or Associate's Degree | 0 (0.0%) | 0.0 |
| Bachelor's Degree | 2 (22.2%) | 154.0 |
| Graduate Degree | 0 (0.0%) | 0.0 |
| Total | 9 (100.0%) | 69.0 |
Fertility by Education by Marriage Status in Ruth
77.8% of women with births in Ruth are unmarried. Women with the educational attainment of bachelor's degree are most likely to be married with 100.0% of them married at childbirth, while women with the educational attainment of less than high school are least likely to be married with 100.0% of them unmarried at childbirth.
| Educational Attainment | Married | Unmarried |
| Less than High School | 0 (0.0%) | 7 (100.0%) |
| High School Diploma | 0 (0.0%) | 0 (0.0%) |
| College or Associate's Degree | 0 (0.0%) | 0 (0.0%) |
| Bachelor's Degree | 2 (100.0%) | 0 (0.0%) |
| Graduate Degree | 0 (0.0%) | 0 (0.0%) |
| Total | 2 (22.2%) | 7 (77.8%) |
Employment Characteristics in Ruth
Employment by Class of Employer in Ruth
Among the 248 employed individuals in Ruth, private company employees (178 | 71.8%), not-for-profit organizations (37 | 14.9%), and state government employees (15 | 6.0%) make up the most common classes of employment.
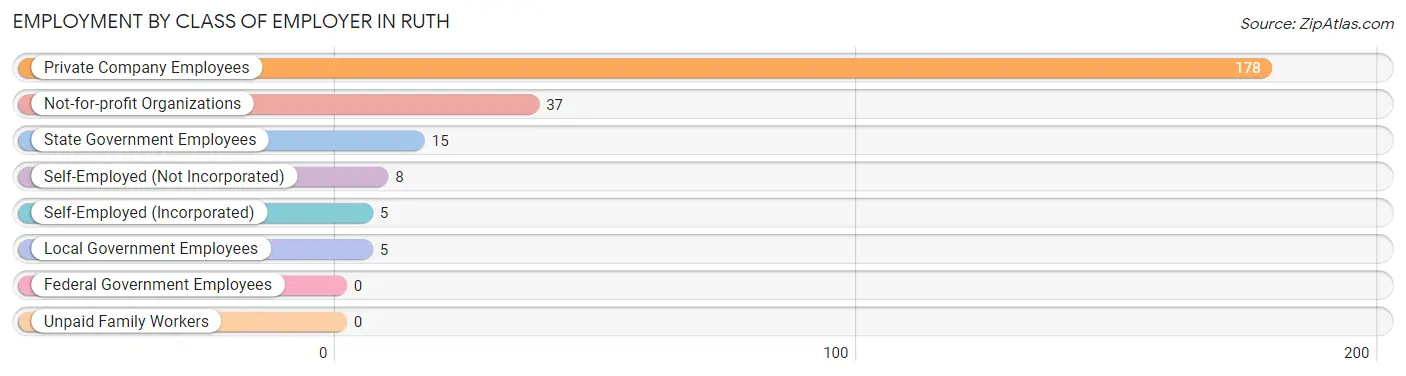
| Employer Class | # Employees | % Employees |
| Private Company Employees | 178 | 71.8% |
| Self-Employed (Incorporated) | 5 | 2.0% |
| Self-Employed (Not Incorporated) | 8 | 3.2% |
| Not-for-profit Organizations | 37 | 14.9% |
| Local Government Employees | 5 | 2.0% |
| State Government Employees | 15 | 6.0% |
| Federal Government Employees | 0 | 0.0% |
| Unpaid Family Workers | 0 | 0.0% |
| Total | 248 | 100.0% |
Employment Status by Age in Ruth
According to the labor force statistics for Ruth, out of the total population over 16 years of age (510), 51.2% or 261 individuals are in the labor force, with 2.3% or 6 of them unemployed. The age group with the highest labor force participation rate is 35 to 44 years, with 76.3% or 45 individuals in the labor force. Within the labor force, the 20 to 24 years age range has the highest percentage of unemployed individuals, with 30.0% or 3 of them being unemployed.
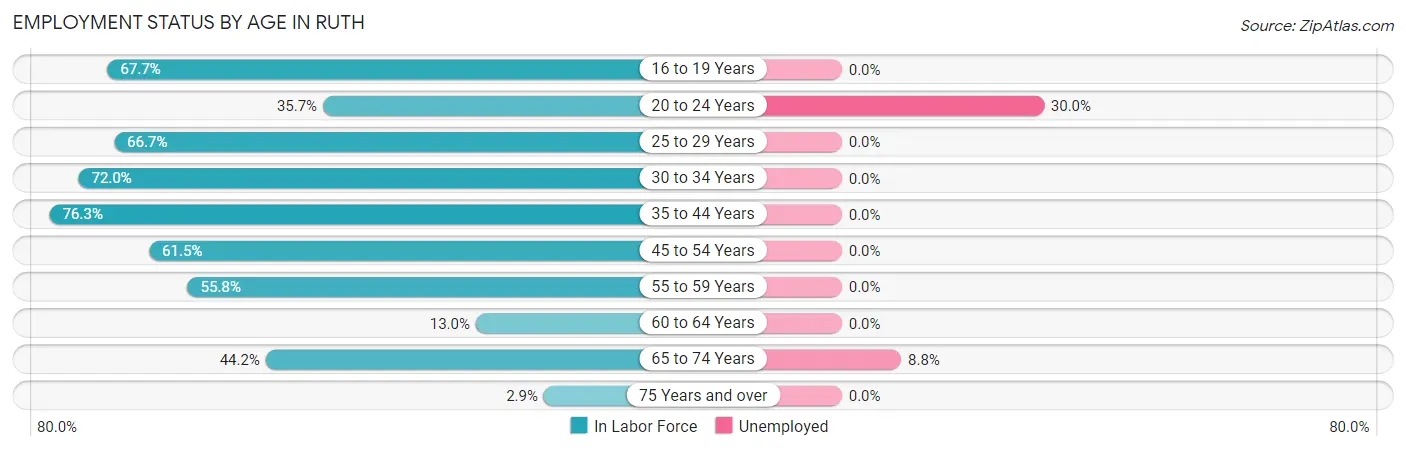
| Age Bracket | In Labor Force | Unemployed |
| 16 to 19 Years | 21 (67.7%) | 0 (0.0%) |
| 20 to 24 Years | 10 (35.7%) | 3 (30.0%) |
| 25 to 29 Years | 42 (66.7%) | 0 (0.0%) |
| 30 to 34 Years | 18 (72.0%) | 0 (0.0%) |
| 35 to 44 Years | 45 (76.3%) | 0 (0.0%) |
| 45 to 54 Years | 59 (61.5%) | 0 (0.0%) |
| 55 to 59 Years | 24 (55.8%) | 0 (0.0%) |
| 60 to 64 Years | 7 (13.0%) | 0 (0.0%) |
| 65 to 74 Years | 34 (44.2%) | 3 (8.8%) |
| 75 Years and over | 1 (2.9%) | 0 (0.0%) |
| Total | 261 (51.2%) | 6 (2.3%) |
Employment Status by Educational Attainment in Ruth
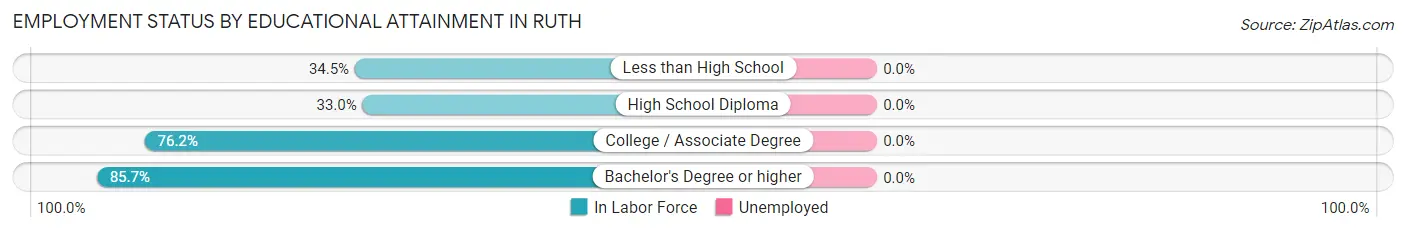
| Educational Attainment | In Labor Force | Unemployed |
| Less than High School | 20 (34.5%) | 0 (0.0%) |
| High School Diploma | 34 (33.0%) | 0 (0.0%) |
| College / Associate Degree | 99 (76.2%) | 0 (0.0%) |
| Bachelor's Degree or higher | 42 (85.7%) | 0 (0.0%) |
| Total | 195 (57.4%) | 0 (0.0%) |
Employment Occupations by Sex in Ruth
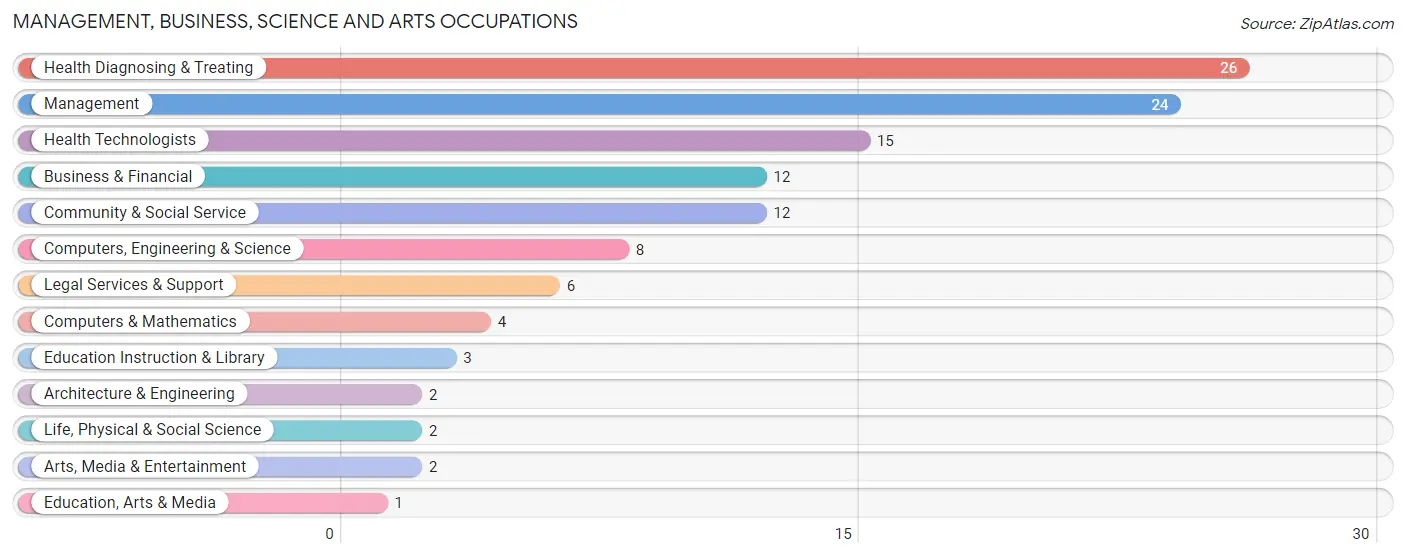
Management, Business, Science and Arts Occupations
The most common Management, Business, Science and Arts occupations in Ruth are Health Diagnosing & Treating (26 | 10.2%), Management (24 | 9.4%), Health Technologists (15 | 5.9%), Business & Financial (12 | 4.7%), and Community & Social Service (12 | 4.7%).
Management, Business, Science and Arts Occupations by Sex
Within the Management, Business, Science and Arts occupations in Ruth, the most male-oriented occupations are Computers, Engineering & Science (100.0%), Computers & Mathematics (100.0%), and Architecture & Engineering (100.0%), while the most female-oriented occupations are Legal Services & Support (100.0%), Education Instruction & Library (100.0%), and Health Diagnosing & Treating (76.9%).
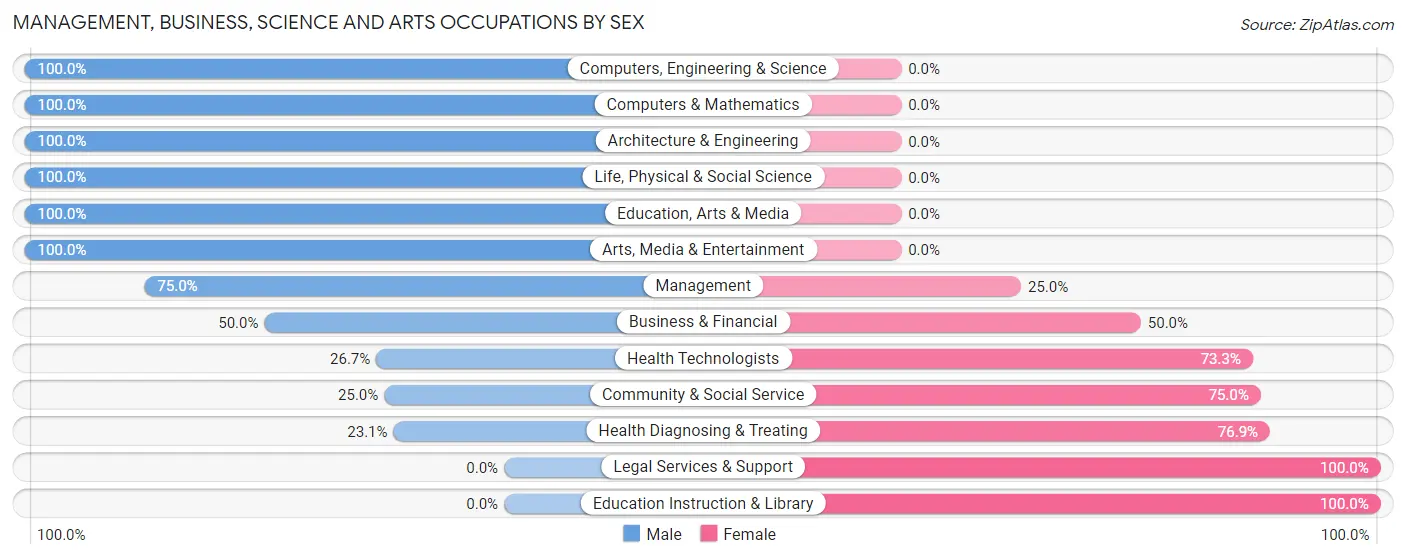
| Occupation | Male | Female |
| Management | 18 (75.0%) | 6 (25.0%) |
| Business & Financial | 6 (50.0%) | 6 (50.0%) |
| Computers, Engineering & Science | 8 (100.0%) | 0 (0.0%) |
| Computers & Mathematics | 4 (100.0%) | 0 (0.0%) |
| Architecture & Engineering | 2 (100.0%) | 0 (0.0%) |
| Life, Physical & Social Science | 2 (100.0%) | 0 (0.0%) |
| Community & Social Service | 3 (25.0%) | 9 (75.0%) |
| Education, Arts & Media | 1 (100.0%) | 0 (0.0%) |
| Legal Services & Support | 0 (0.0%) | 6 (100.0%) |
| Education Instruction & Library | 0 (0.0%) | 3 (100.0%) |
| Arts, Media & Entertainment | 2 (100.0%) | 0 (0.0%) |
| Health Diagnosing & Treating | 6 (23.1%) | 20 (76.9%) |
| Health Technologists | 4 (26.7%) | 11 (73.3%) |
| Total (Category) | 41 (50.0%) | 41 (50.0%) |
| Total (Overall) | 141 (55.3%) | 114 (44.7%) |
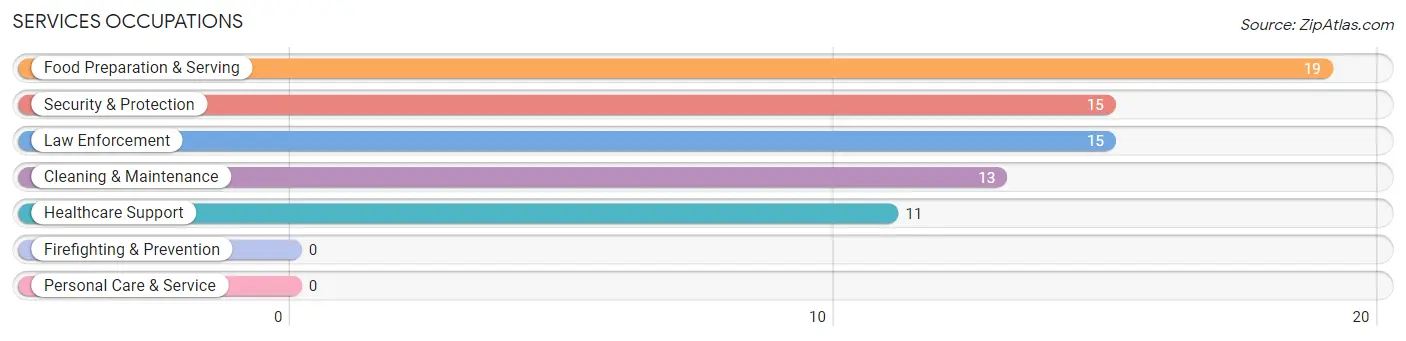
Services Occupations
The most common Services occupations in Ruth are Food Preparation & Serving (19 | 7.4%), Security & Protection (15 | 5.9%), Law Enforcement (15 | 5.9%), Cleaning & Maintenance (13 | 5.1%), and Healthcare Support (11 | 4.3%).
Services Occupations by Sex
Within the Services occupations in Ruth, the most male-oriented occupations are Security & Protection (100.0%), Law Enforcement (100.0%), and Cleaning & Maintenance (30.8%), while the most female-oriented occupations are Healthcare Support (100.0%), Food Preparation & Serving (100.0%), and Cleaning & Maintenance (69.2%).
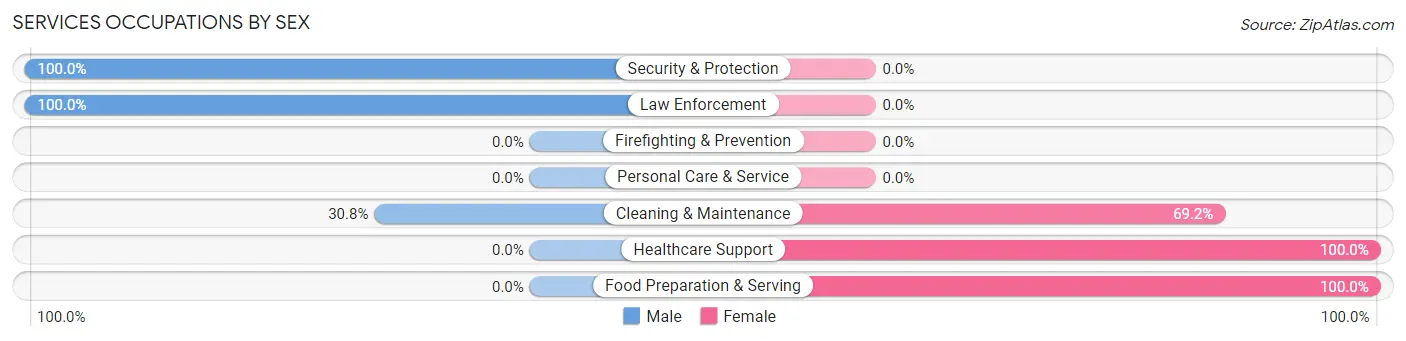
| Occupation | Male | Female |
| Healthcare Support | 0 (0.0%) | 11 (100.0%) |
| Security & Protection | 15 (100.0%) | 0 (0.0%) |
| Firefighting & Prevention | 0 (0.0%) | 0 (0.0%) |
| Law Enforcement | 15 (100.0%) | 0 (0.0%) |
| Food Preparation & Serving | 0 (0.0%) | 19 (100.0%) |
| Cleaning & Maintenance | 4 (30.8%) | 9 (69.2%) |
| Personal Care & Service | 0 (0.0%) | 0 (0.0%) |
| Total (Category) | 19 (32.8%) | 39 (67.2%) |
| Total (Overall) | 141 (55.3%) | 114 (44.7%) |
Sales and Office Occupations
The most common Sales and Office occupations in Ruth are Sales & Related (34 | 13.3%), and Office & Administration (34 | 13.3%).

Sales and Office Occupations by Sex

| Occupation | Male | Female |
| Sales & Related | 20 (58.8%) | 14 (41.2%) |
| Office & Administration | 16 (47.1%) | 18 (52.9%) |
| Total (Category) | 36 (52.9%) | 32 (47.1%) |
| Total (Overall) | 141 (55.3%) | 114 (44.7%) |
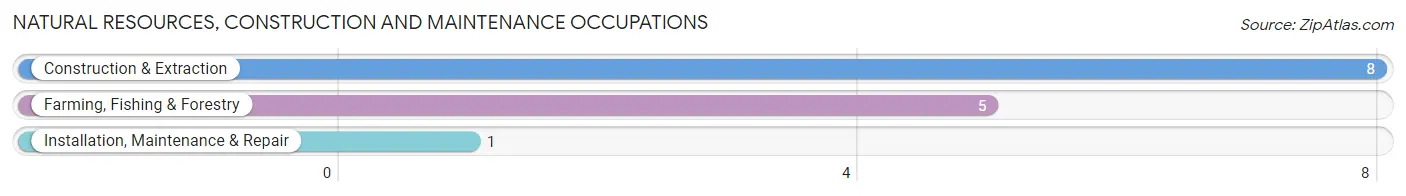
Natural Resources, Construction and Maintenance Occupations
The most common Natural Resources, Construction and Maintenance occupations in Ruth are Construction & Extraction (8 | 3.1%), Farming, Fishing & Forestry (5 | 2.0%), and Installation, Maintenance & Repair (1 | 0.4%).
Natural Resources, Construction and Maintenance Occupations by Sex
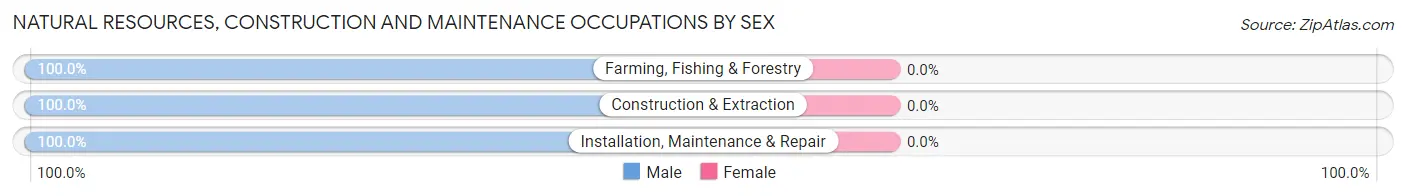
| Occupation | Male | Female |
| Farming, Fishing & Forestry | 5 (100.0%) | 0 (0.0%) |
| Construction & Extraction | 8 (100.0%) | 0 (0.0%) |
| Installation, Maintenance & Repair | 1 (100.0%) | 0 (0.0%) |
| Total (Category) | 14 (100.0%) | 0 (0.0%) |
| Total (Overall) | 141 (55.3%) | 114 (44.7%) |
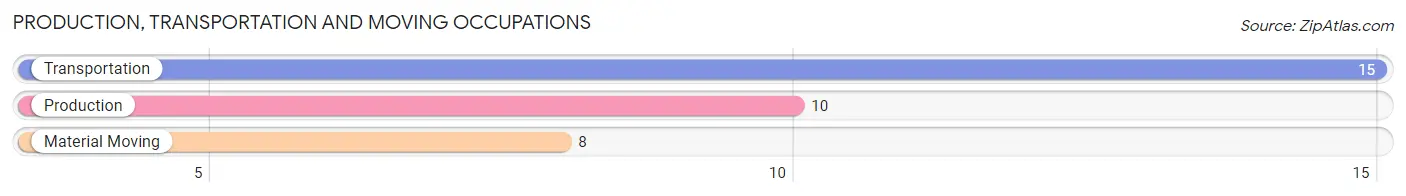
Production, Transportation and Moving Occupations
The most common Production, Transportation and Moving occupations in Ruth are Transportation (15 | 5.9%), Production (10 | 3.9%), and Material Moving (8 | 3.1%).
Production, Transportation and Moving Occupations by Sex
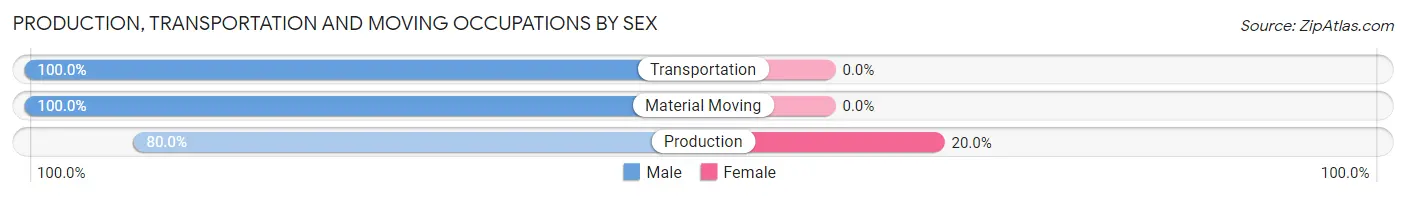
| Occupation | Male | Female |
| Production | 8 (80.0%) | 2 (20.0%) |
| Transportation | 15 (100.0%) | 0 (0.0%) |
| Material Moving | 8 (100.0%) | 0 (0.0%) |
| Total (Category) | 31 (93.9%) | 2 (6.1%) |
| Total (Overall) | 141 (55.3%) | 114 (44.7%) |
Employment Industries by Sex in Ruth
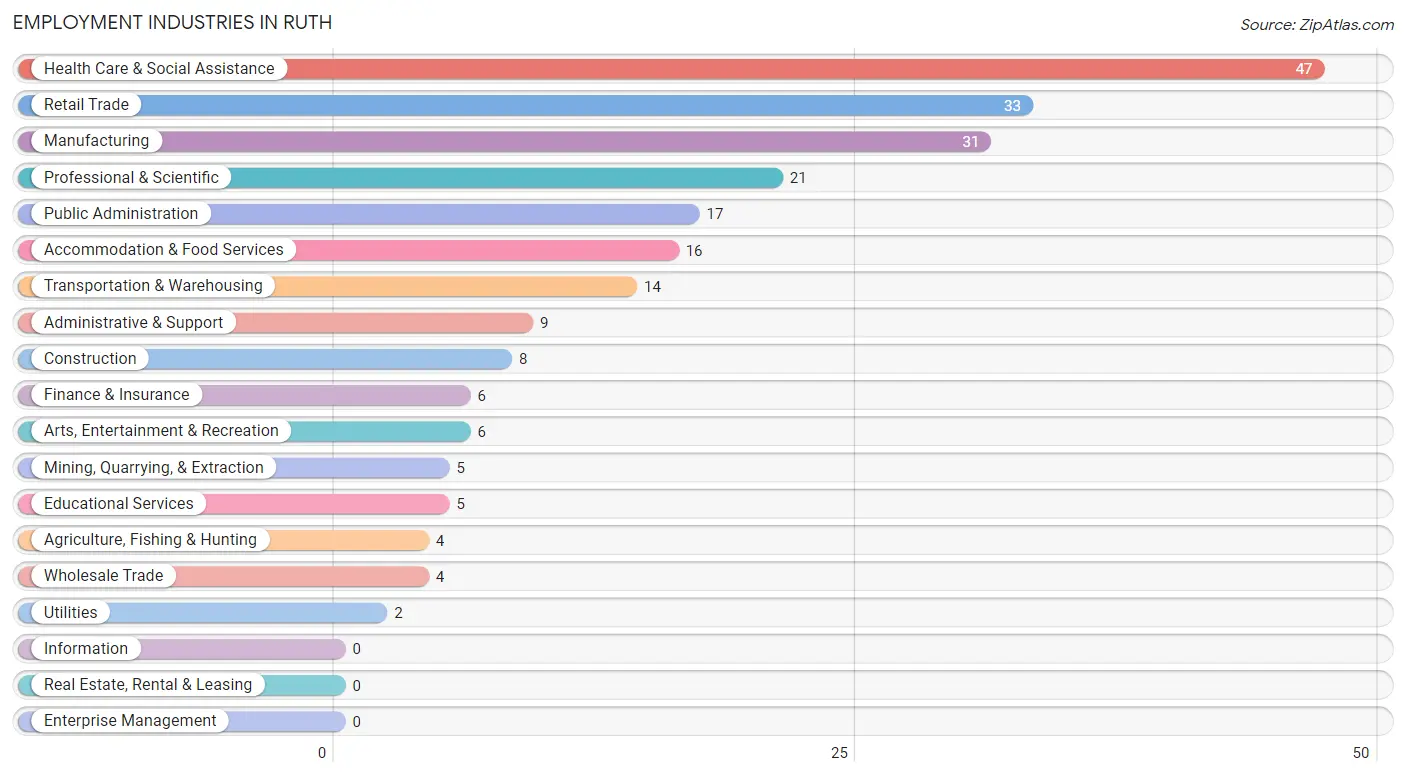
Employment Industries in Ruth
The major employment industries in Ruth include Health Care & Social Assistance (47 | 18.4%), Retail Trade (33 | 12.9%), Manufacturing (31 | 12.2%), Professional & Scientific (21 | 8.2%), and Public Administration (17 | 6.7%).
Employment Industries by Sex in Ruth
The Ruth industries that see more men than women are Mining, Quarrying, & Extraction (100.0%), Construction (100.0%), and Utilities (100.0%), whereas the industries that tend to have a higher number of women are Agriculture, Fishing & Hunting (100.0%), Accommodation & Food Services (100.0%), and Health Care & Social Assistance (63.8%).
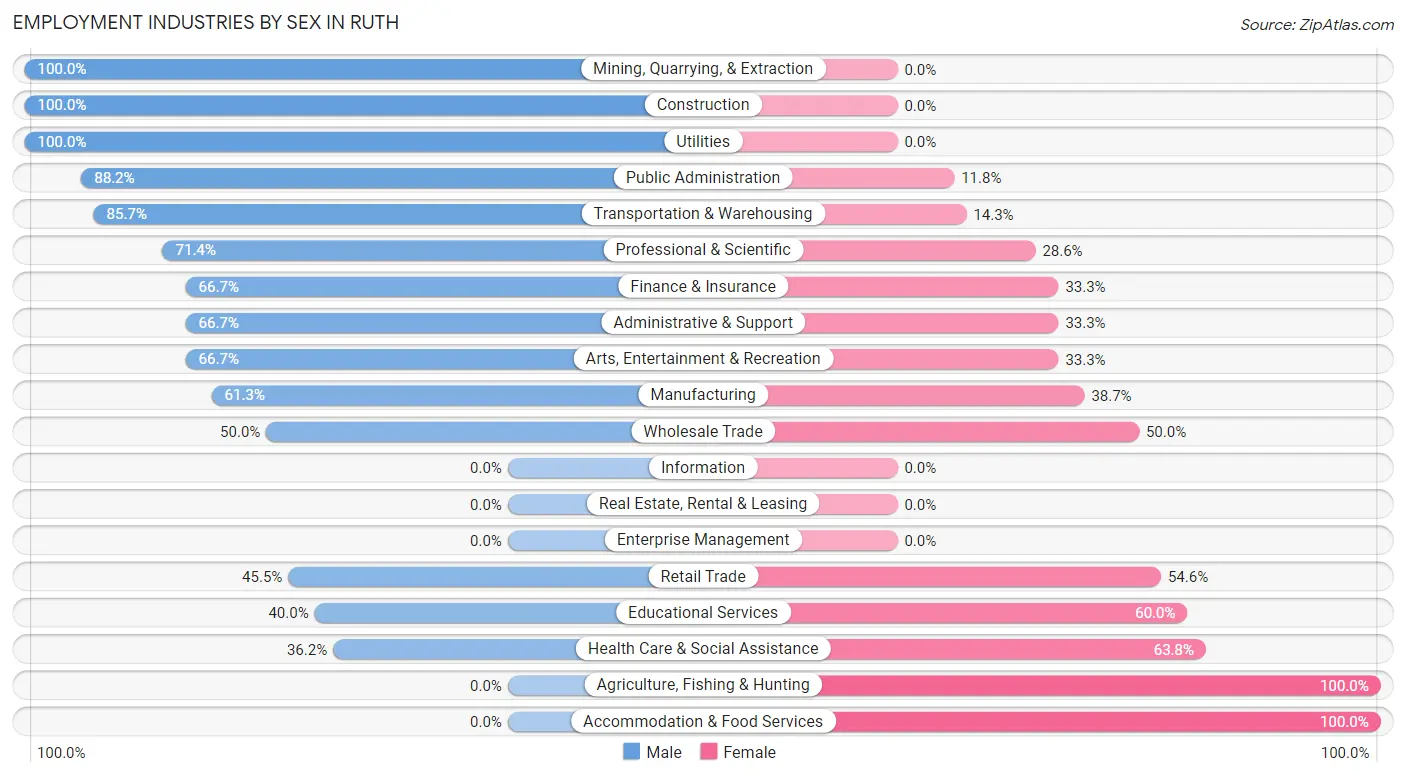
| Industry | Male | Female |
| Agriculture, Fishing & Hunting | 0 (0.0%) | 4 (100.0%) |
| Mining, Quarrying, & Extraction | 5 (100.0%) | 0 (0.0%) |
| Construction | 8 (100.0%) | 0 (0.0%) |
| Manufacturing | 19 (61.3%) | 12 (38.7%) |
| Wholesale Trade | 2 (50.0%) | 2 (50.0%) |
| Retail Trade | 15 (45.5%) | 18 (54.5%) |
| Transportation & Warehousing | 12 (85.7%) | 2 (14.3%) |
| Utilities | 2 (100.0%) | 0 (0.0%) |
| Information | 0 (0.0%) | 0 (0.0%) |
| Finance & Insurance | 4 (66.7%) | 2 (33.3%) |
| Real Estate, Rental & Leasing | 0 (0.0%) | 0 (0.0%) |
| Professional & Scientific | 15 (71.4%) | 6 (28.6%) |
| Enterprise Management | 0 (0.0%) | 0 (0.0%) |
| Administrative & Support | 6 (66.7%) | 3 (33.3%) |
| Educational Services | 2 (40.0%) | 3 (60.0%) |
| Health Care & Social Assistance | 17 (36.2%) | 30 (63.8%) |
| Arts, Entertainment & Recreation | 4 (66.7%) | 2 (33.3%) |
| Accommodation & Food Services | 0 (0.0%) | 16 (100.0%) |
| Public Administration | 15 (88.2%) | 2 (11.8%) |
| Total | 141 (55.3%) | 114 (44.7%) |
Education in Ruth
School Enrollment in Ruth
The most common levels of schooling among the 125 students in Ruth are middle school (35 | 28.0%), elementary school (26 | 20.8%), and high school (21 | 16.8%).
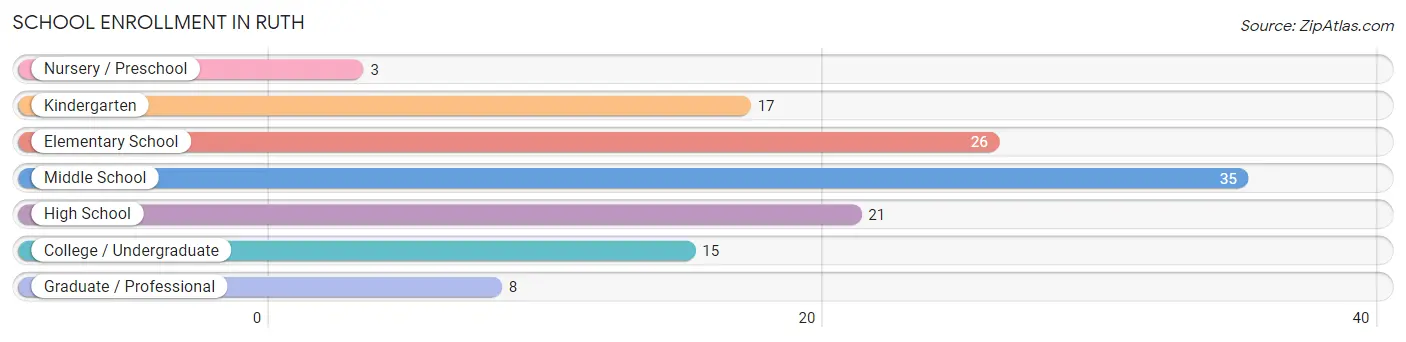
| School Level | # Students | % Students |
| Nursery / Preschool | 3 | 2.4% |
| Kindergarten | 17 | 13.6% |
| Elementary School | 26 | 20.8% |
| Middle School | 35 | 28.0% |
| High School | 21 | 16.8% |
| College / Undergraduate | 15 | 12.0% |
| Graduate / Professional | 8 | 6.4% |
| Total | 125 | 100.0% |
School Enrollment by Age by Funding Source in Ruth
Out of a total of 125 students who are enrolled in schools in Ruth, 32 (25.6%) attend a private institution, while the remaining 93 (74.4%) are enrolled in public schools. The age group of 3 to 4 year olds has the highest likelihood of being enrolled in private schools, with 3 (100.0% in the age bracket) enrolled. Conversely, the age group of 18 to 19 year olds has the lowest likelihood of being enrolled in a private school, with 5 (100.0% in the age bracket) attending a public institution.
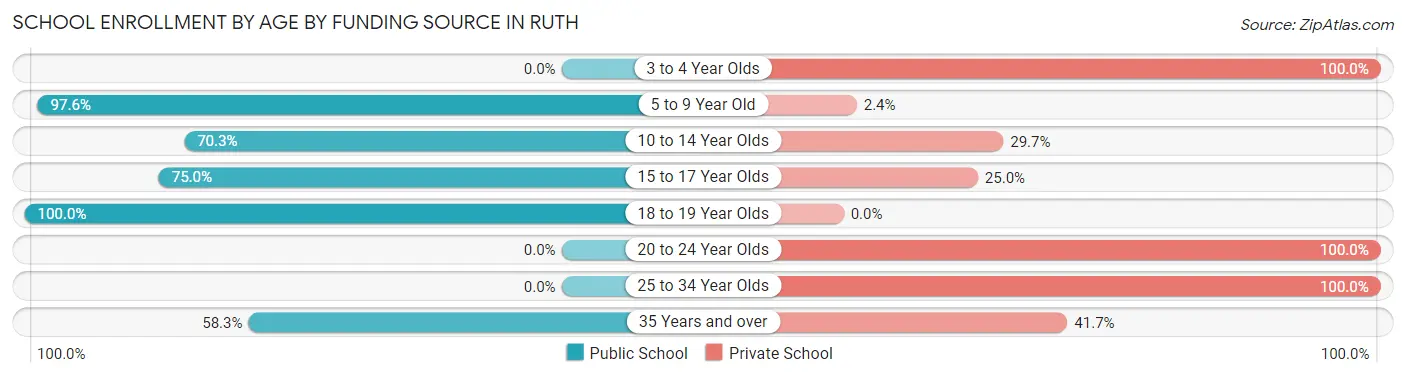
| Age Bracket | Public School | Private School |
| 3 to 4 Year Olds | 0 (0.0%) | 3 (100.0%) |
| 5 to 9 Year Old | 40 (97.6%) | 1 (2.4%) |
| 10 to 14 Year Olds | 26 (70.3%) | 11 (29.7%) |
| 15 to 17 Year Olds | 15 (75.0%) | 5 (25.0%) |
| 18 to 19 Year Olds | 5 (100.0%) | 0 (0.0%) |
| 20 to 24 Year Olds | 0 (0.0%) | 5 (100.0%) |
| 25 to 34 Year Olds | 0 (0.0%) | 2 (100.0%) |
| 35 Years and over | 7 (58.3%) | 5 (41.7%) |
| Total | 93 (74.4%) | 32 (25.6%) |
Educational Attainment by Field of Study in Ruth
Education (22 | 31.4%), computers & mathematics (11 | 15.7%), science & technology (11 | 15.7%), business (11 | 15.7%), and social sciences (5 | 7.1%) are the most common fields of study among 70 individuals in Ruth who have obtained a bachelor's degree or higher.
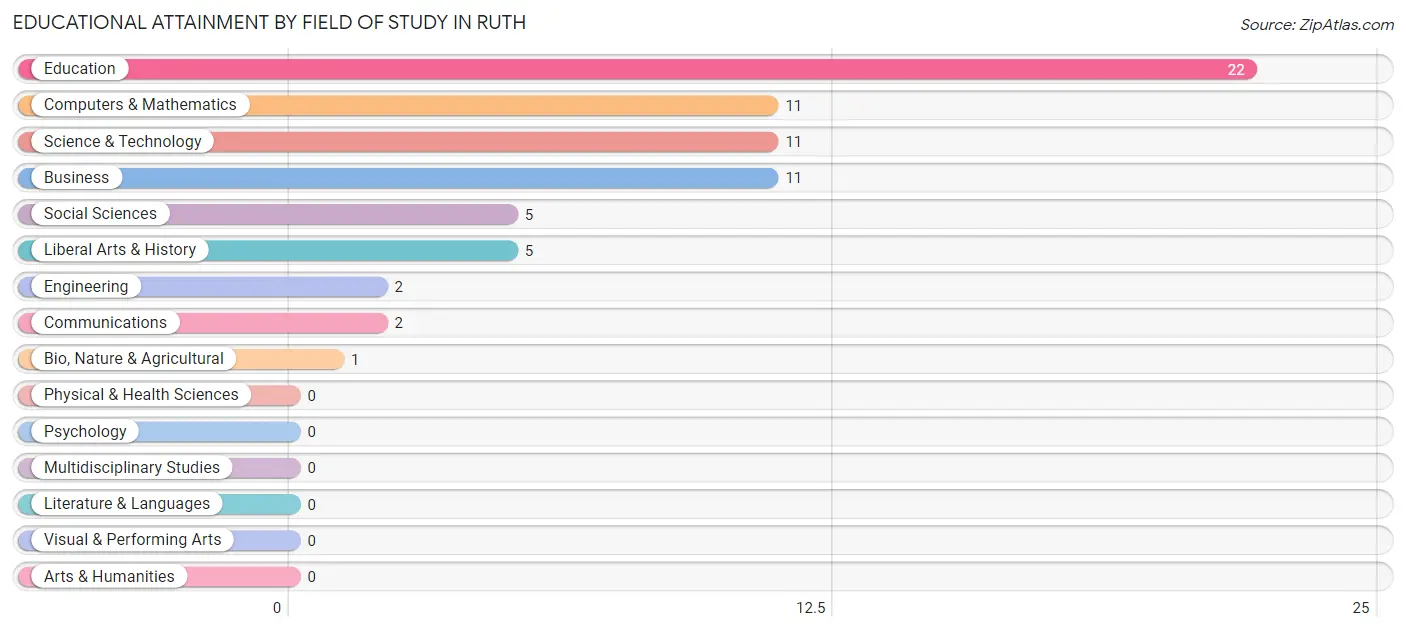
| Field of Study | # Graduates | % Graduates |
| Computers & Mathematics | 11 | 15.7% |
| Bio, Nature & Agricultural | 1 | 1.4% |
| Physical & Health Sciences | 0 | 0.0% |
| Psychology | 0 | 0.0% |
| Social Sciences | 5 | 7.1% |
| Engineering | 2 | 2.9% |
| Multidisciplinary Studies | 0 | 0.0% |
| Science & Technology | 11 | 15.7% |
| Business | 11 | 15.7% |
| Education | 22 | 31.4% |
| Literature & Languages | 0 | 0.0% |
| Liberal Arts & History | 5 | 7.1% |
| Visual & Performing Arts | 0 | 0.0% |
| Communications | 2 | 2.9% |
| Arts & Humanities | 0 | 0.0% |
| Total | 70 | 100.0% |
Transportation & Commute in Ruth
Vehicle Availability by Sex in Ruth
The most prevalent vehicle ownership categories in Ruth are males with 2 vehicles (72, accounting for 51.1%) and females with 2 vehicles (37, making up 67.3%).
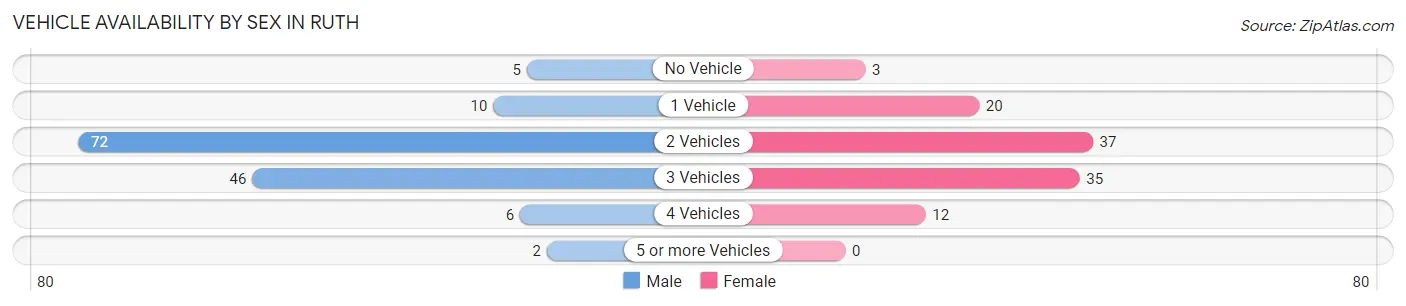
| Vehicles Available | Male | Female |
| No Vehicle | 5 (3.5%) | 3 (2.8%) |
| 1 Vehicle | 10 (7.1%) | 20 (18.7%) |
| 2 Vehicles | 72 (51.1%) | 37 (34.6%) |
| 3 Vehicles | 46 (32.6%) | 35 (32.7%) |
| 4 Vehicles | 6 (4.3%) | 12 (11.2%) |
| 5 or more Vehicles | 2 (1.4%) | 0 (0.0%) |
| Total | 141 (100.0%) | 107 (100.0%) |
Commute Time in Ruth
The most frequently occuring commute durations in Ruth are 10 to 14 minutes (74 commuters, 30.6%), 5 to 9 minutes (29 commuters, 12.0%), and 15 to 19 minutes (27 commuters, 11.2%).
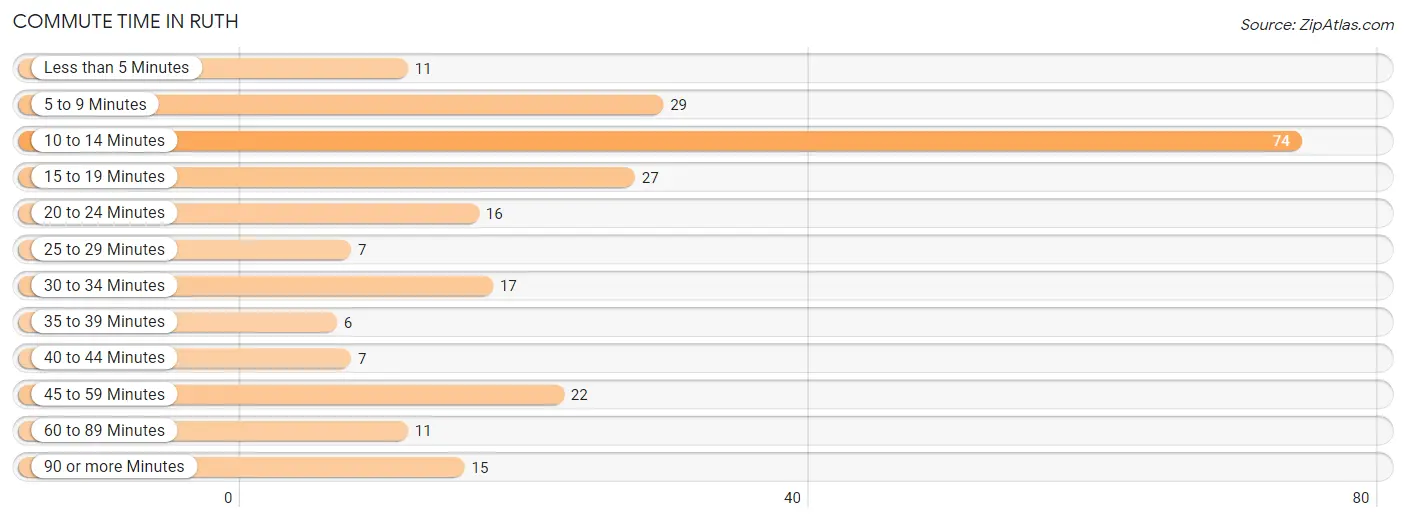
| Commute Time | # Commuters | % Commuters |
| Less than 5 Minutes | 11 | 4.5% |
| 5 to 9 Minutes | 29 | 12.0% |
| 10 to 14 Minutes | 74 | 30.6% |
| 15 to 19 Minutes | 27 | 11.2% |
| 20 to 24 Minutes | 16 | 6.6% |
| 25 to 29 Minutes | 7 | 2.9% |
| 30 to 34 Minutes | 17 | 7.0% |
| 35 to 39 Minutes | 6 | 2.5% |
| 40 to 44 Minutes | 7 | 2.9% |
| 45 to 59 Minutes | 22 | 9.1% |
| 60 to 89 Minutes | 11 | 4.5% |
| 90 or more Minutes | 15 | 6.2% |
Commute Time by Sex in Ruth
The most common commute times in Ruth are 15 to 19 minutes (25 commuters, 18.2%) for males and 10 to 14 minutes (52 commuters, 49.5%) for females.
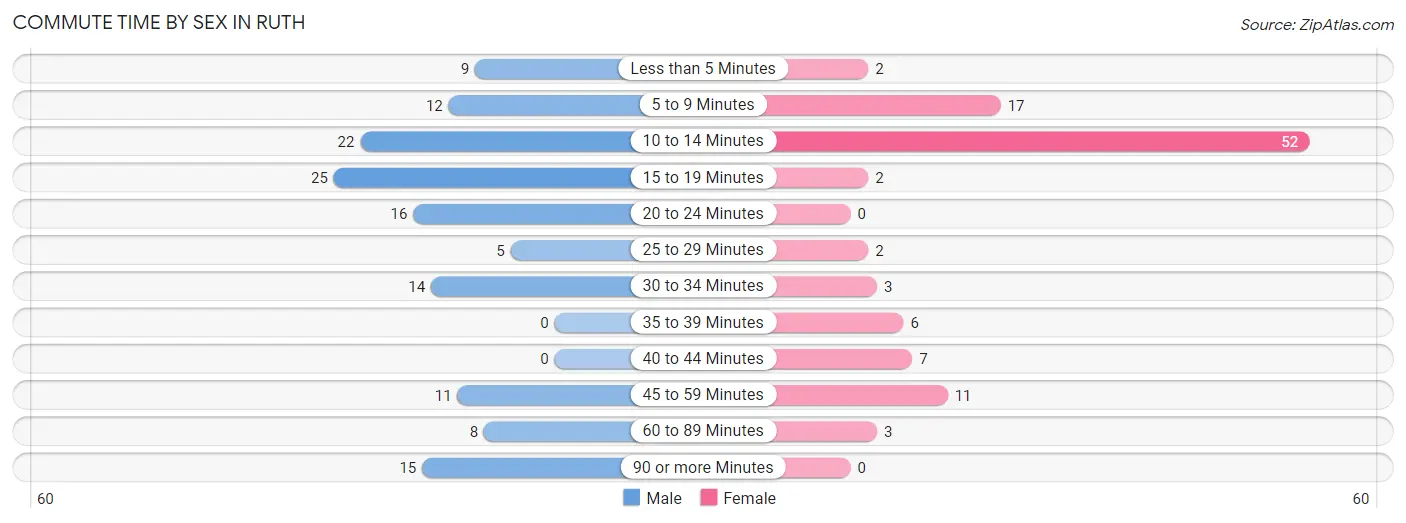
| Commute Time | Male | Female |
| Less than 5 Minutes | 9 (6.6%) | 2 (1.9%) |
| 5 to 9 Minutes | 12 (8.8%) | 17 (16.2%) |
| 10 to 14 Minutes | 22 (16.1%) | 52 (49.5%) |
| 15 to 19 Minutes | 25 (18.2%) | 2 (1.9%) |
| 20 to 24 Minutes | 16 (11.7%) | 0 (0.0%) |
| 25 to 29 Minutes | 5 (3.6%) | 2 (1.9%) |
| 30 to 34 Minutes | 14 (10.2%) | 3 (2.9%) |
| 35 to 39 Minutes | 0 (0.0%) | 6 (5.7%) |
| 40 to 44 Minutes | 0 (0.0%) | 7 (6.7%) |
| 45 to 59 Minutes | 11 (8.0%) | 11 (10.5%) |
| 60 to 89 Minutes | 8 (5.8%) | 3 (2.9%) |
| 90 or more Minutes | 15 (11.0%) | 0 (0.0%) |
Time of Departure to Work by Sex in Ruth
The most frequent times of departure to work in Ruth are 6:30 AM to 6:59 AM (24, 17.5%) for males and 6:00 AM to 6:29 AM (20, 19.1%) for females.
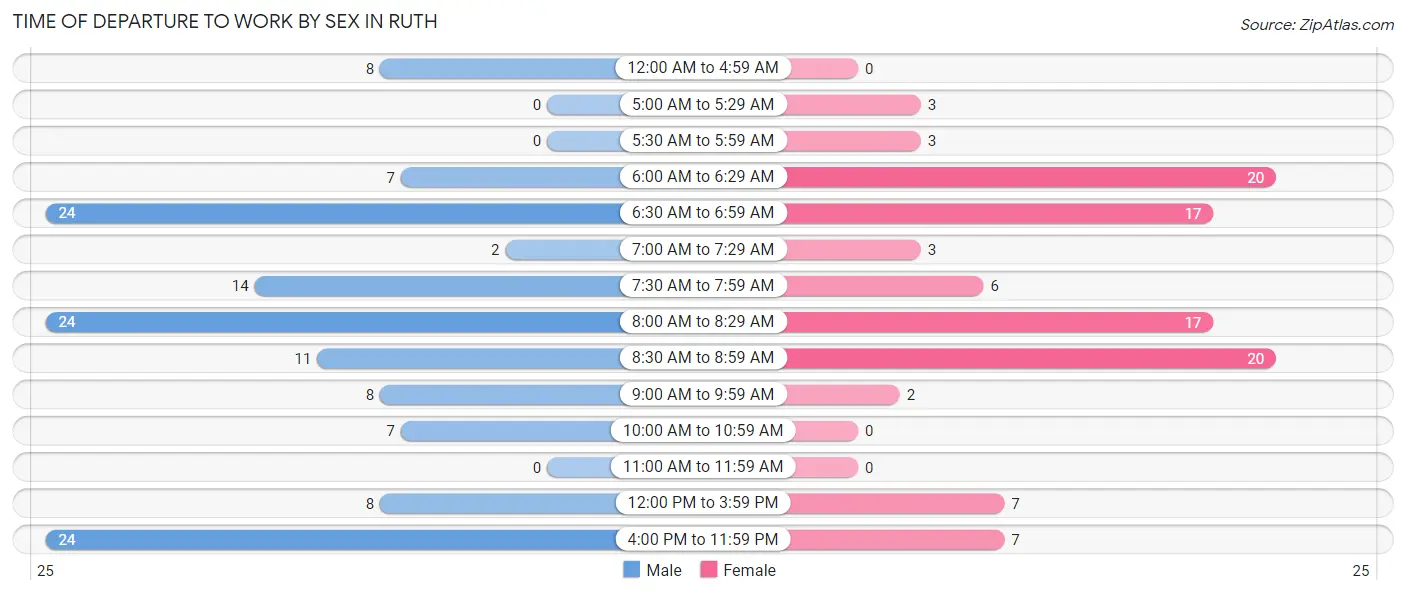
| Time of Departure | Male | Female |
| 12:00 AM to 4:59 AM | 8 (5.8%) | 0 (0.0%) |
| 5:00 AM to 5:29 AM | 0 (0.0%) | 3 (2.9%) |
| 5:30 AM to 5:59 AM | 0 (0.0%) | 3 (2.9%) |
| 6:00 AM to 6:29 AM | 7 (5.1%) | 20 (19.1%) |
| 6:30 AM to 6:59 AM | 24 (17.5%) | 17 (16.2%) |
| 7:00 AM to 7:29 AM | 2 (1.5%) | 3 (2.9%) |
| 7:30 AM to 7:59 AM | 14 (10.2%) | 6 (5.7%) |
| 8:00 AM to 8:29 AM | 24 (17.5%) | 17 (16.2%) |
| 8:30 AM to 8:59 AM | 11 (8.0%) | 20 (19.1%) |
| 9:00 AM to 9:59 AM | 8 (5.8%) | 2 (1.9%) |
| 10:00 AM to 10:59 AM | 7 (5.1%) | 0 (0.0%) |
| 11:00 AM to 11:59 AM | 0 (0.0%) | 0 (0.0%) |
| 12:00 PM to 3:59 PM | 8 (5.8%) | 7 (6.7%) |
| 4:00 PM to 11:59 PM | 24 (17.5%) | 7 (6.7%) |
| Total | 137 (100.0%) | 105 (100.0%) |
Housing Occupancy in Ruth
Occupancy by Ownership in Ruth
Of the total 247 dwellings in Ruth, owner-occupied units account for 205 (83.0%), while renter-occupied units make up 42 (17.0%).
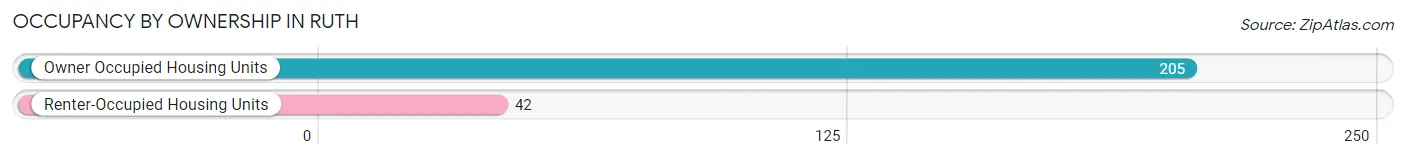
| Occupancy | # Housing Units | % Housing Units |
| Owner Occupied Housing Units | 205 | 83.0% |
| Renter-Occupied Housing Units | 42 | 17.0% |
| Total Occupied Housing Units | 247 | 100.0% |
Occupancy by Household Size in Ruth
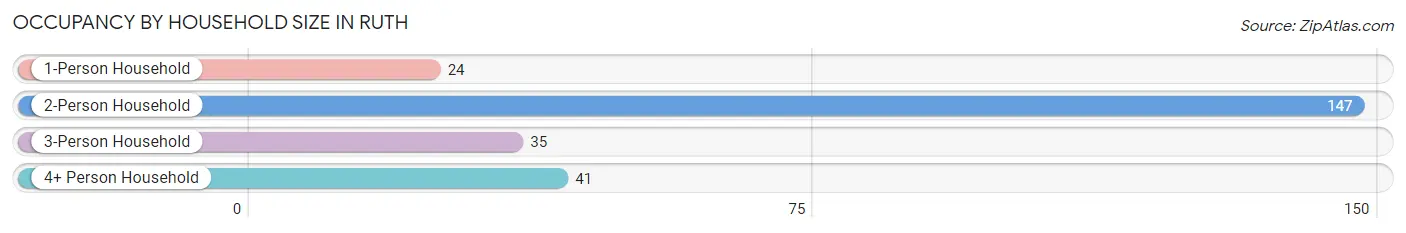
| Household Size | # Housing Units | % Housing Units |
| 1-Person Household | 24 | 9.7% |
| 2-Person Household | 147 | 59.5% |
| 3-Person Household | 35 | 14.2% |
| 4+ Person Household | 41 | 16.6% |
| Total Housing Units | 247 | 100.0% |
Occupancy by Ownership by Household Size in Ruth
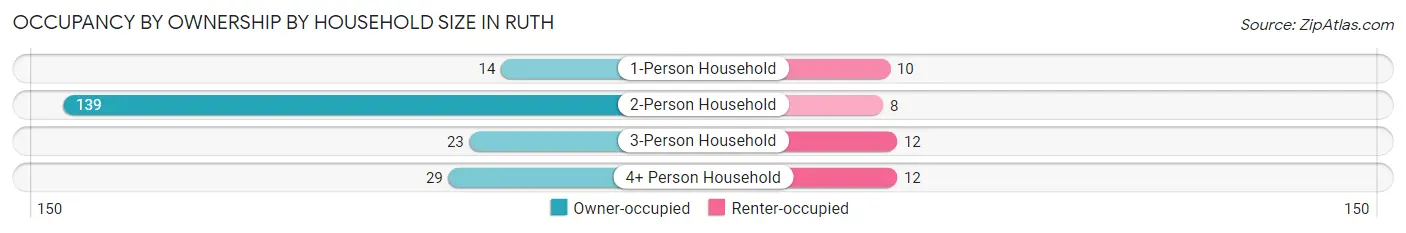
| Household Size | Owner-occupied | Renter-occupied |
| 1-Person Household | 14 (58.3%) | 10 (41.7%) |
| 2-Person Household | 139 (94.6%) | 8 (5.4%) |
| 3-Person Household | 23 (65.7%) | 12 (34.3%) |
| 4+ Person Household | 29 (70.7%) | 12 (29.3%) |
| Total Housing Units | 205 (83.0%) | 42 (17.0%) |
Occupancy by Educational Attainment in Ruth
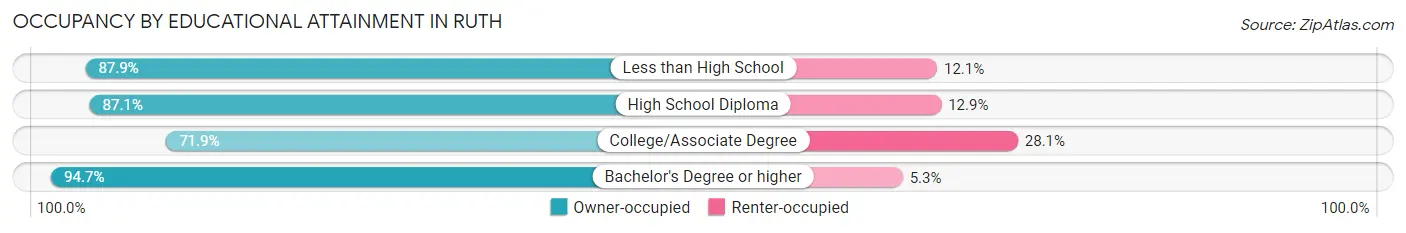
| Household Size | Owner-occupied | Renter-occupied |
| Less than High School | 51 (87.9%) | 7 (12.1%) |
| High School Diploma | 54 (87.1%) | 8 (12.9%) |
| College/Associate Degree | 64 (71.9%) | 25 (28.1%) |
| Bachelor's Degree or higher | 36 (94.7%) | 2 (5.3%) |
Occupancy by Age of Householder in Ruth
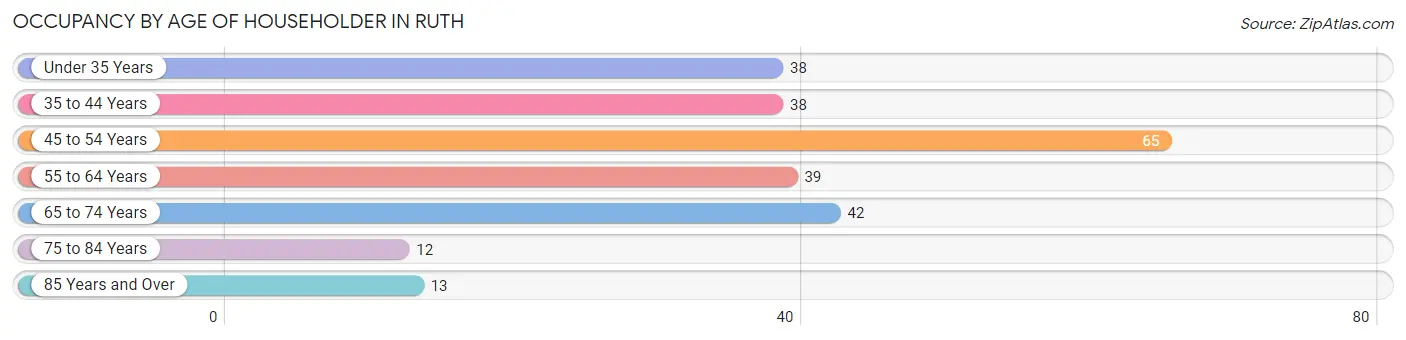
| Age Bracket | # Households | % Households |
| Under 35 Years | 38 | 15.4% |
| 35 to 44 Years | 38 | 15.4% |
| 45 to 54 Years | 65 | 26.3% |
| 55 to 64 Years | 39 | 15.8% |
| 65 to 74 Years | 42 | 17.0% |
| 75 to 84 Years | 12 | 4.9% |
| 85 Years and Over | 13 | 5.3% |
| Total | 247 | 100.0% |
Housing Finances in Ruth
Median Income by Occupancy in Ruth
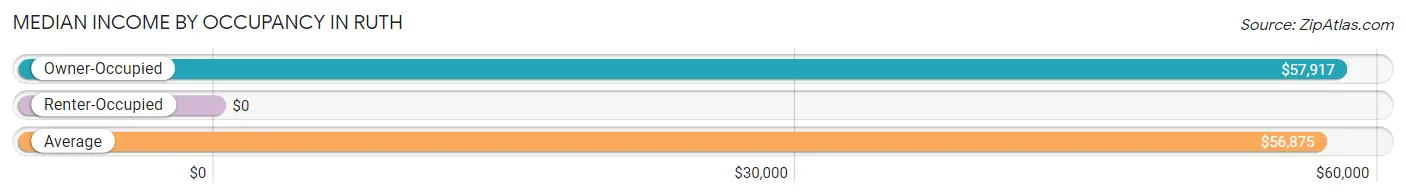
| Occupancy Type | # Households | Median Income |
| Owner-Occupied | 205 (83.0%) | $57,917 |
| Renter-Occupied | 42 (17.0%) | $0 |
| Average | 247 (100.0%) | $56,875 |
Occupancy by Householder Income Bracket in Ruth
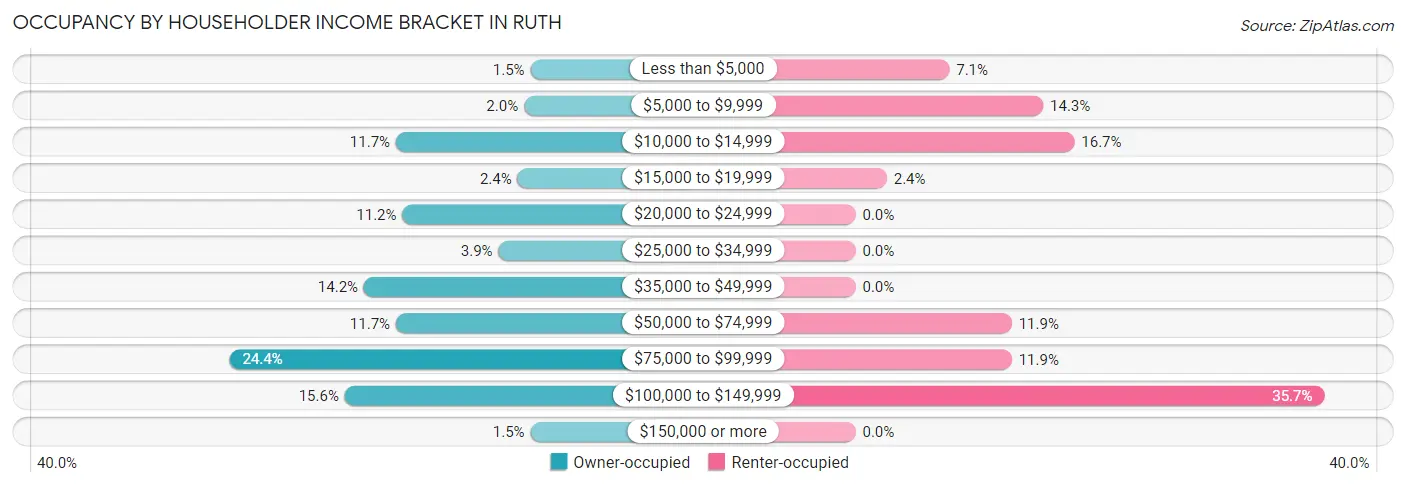
| Income Bracket | Owner-occupied | Renter-occupied |
| Less than $5,000 | 3 (1.5%) | 3 (7.1%) |
| $5,000 to $9,999 | 4 (1.9%) | 6 (14.3%) |
| $10,000 to $14,999 | 24 (11.7%) | 7 (16.7%) |
| $15,000 to $19,999 | 5 (2.4%) | 1 (2.4%) |
| $20,000 to $24,999 | 23 (11.2%) | 0 (0.0%) |
| $25,000 to $34,999 | 8 (3.9%) | 0 (0.0%) |
| $35,000 to $49,999 | 29 (14.1%) | 0 (0.0%) |
| $50,000 to $74,999 | 24 (11.7%) | 5 (11.9%) |
| $75,000 to $99,999 | 50 (24.4%) | 5 (11.9%) |
| $100,000 to $149,999 | 32 (15.6%) | 15 (35.7%) |
| $150,000 or more | 3 (1.5%) | 0 (0.0%) |
| Total | 205 (100.0%) | 42 (100.0%) |
Monthly Housing Cost Tiers in Ruth
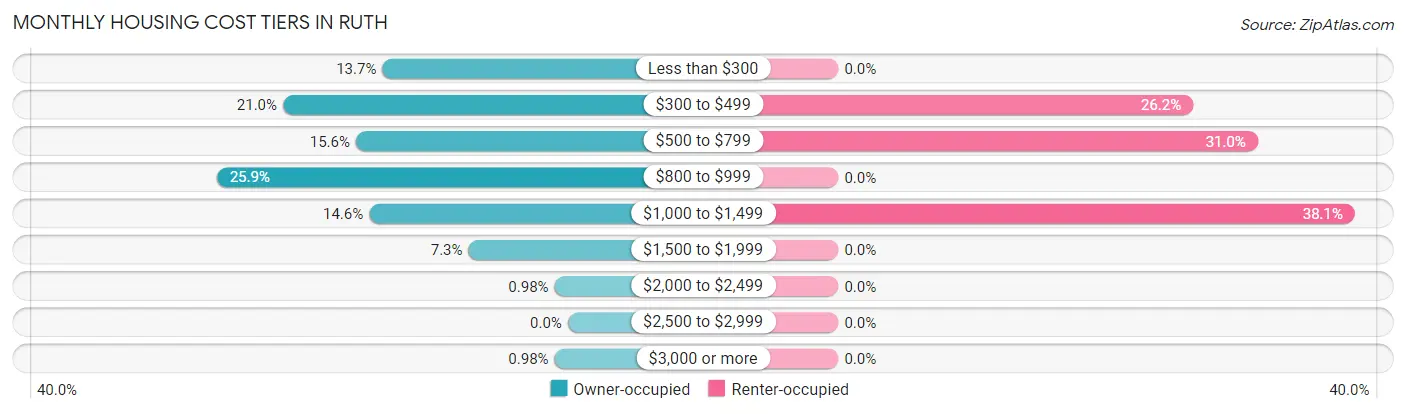
| Monthly Cost | Owner-occupied | Renter-occupied |
| Less than $300 | 28 (13.7%) | 0 (0.0%) |
| $300 to $499 | 43 (21.0%) | 11 (26.2%) |
| $500 to $799 | 32 (15.6%) | 13 (30.9%) |
| $800 to $999 | 53 (25.9%) | 0 (0.0%) |
| $1,000 to $1,499 | 30 (14.6%) | 16 (38.1%) |
| $1,500 to $1,999 | 15 (7.3%) | 0 (0.0%) |
| $2,000 to $2,499 | 2 (1.0%) | 0 (0.0%) |
| $2,500 to $2,999 | 0 (0.0%) | 0 (0.0%) |
| $3,000 or more | 2 (1.0%) | 0 (0.0%) |
| Total | 205 (100.0%) | 42 (100.0%) |
Physical Housing Characteristics in Ruth
Housing Structures in Ruth
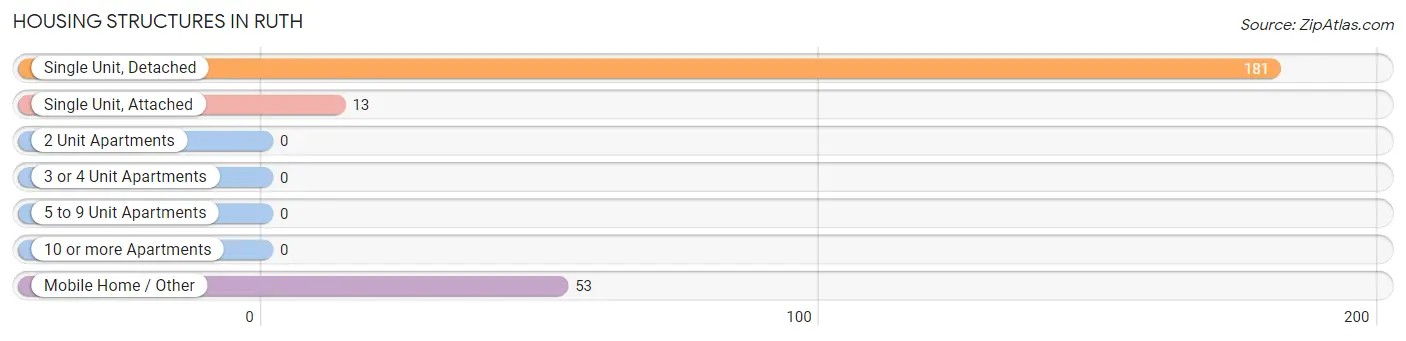
| Structure Type | # Housing Units | % Housing Units |
| Single Unit, Detached | 181 | 73.3% |
| Single Unit, Attached | 13 | 5.3% |
| 2 Unit Apartments | 0 | 0.0% |
| 3 or 4 Unit Apartments | 0 | 0.0% |
| 5 to 9 Unit Apartments | 0 | 0.0% |
| 10 or more Apartments | 0 | 0.0% |
| Mobile Home / Other | 53 | 21.5% |
| Total | 247 | 100.0% |
Housing Structures by Occupancy in Ruth
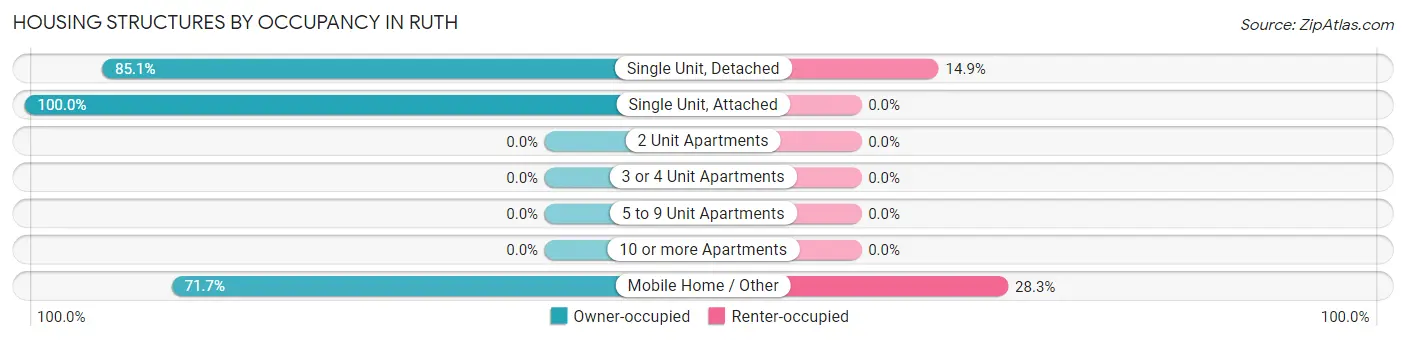
| Structure Type | Owner-occupied | Renter-occupied |
| Single Unit, Detached | 154 (85.1%) | 27 (14.9%) |
| Single Unit, Attached | 13 (100.0%) | 0 (0.0%) |
| 2 Unit Apartments | 0 (0.0%) | 0 (0.0%) |
| 3 or 4 Unit Apartments | 0 (0.0%) | 0 (0.0%) |
| 5 to 9 Unit Apartments | 0 (0.0%) | 0 (0.0%) |
| 10 or more Apartments | 0 (0.0%) | 0 (0.0%) |
| Mobile Home / Other | 38 (71.7%) | 15 (28.3%) |
| Total | 205 (83.0%) | 42 (17.0%) |
Housing Structures by Number of Rooms in Ruth
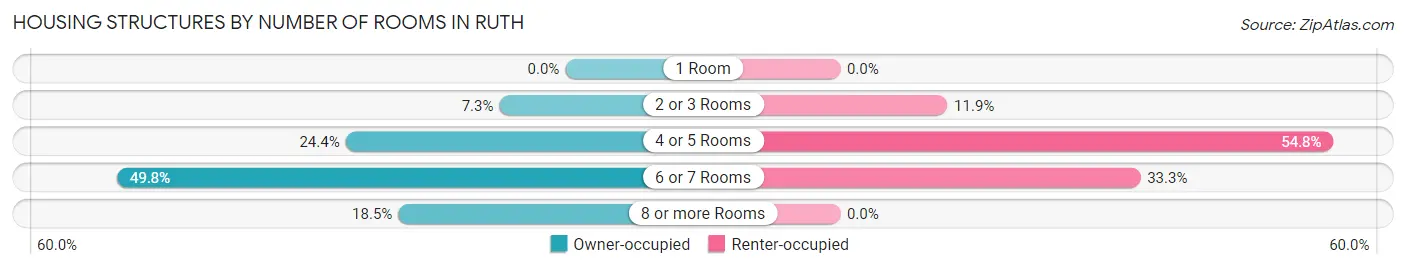
| Number of Rooms | Owner-occupied | Renter-occupied |
| 1 Room | 0 (0.0%) | 0 (0.0%) |
| 2 or 3 Rooms | 15 (7.3%) | 5 (11.9%) |
| 4 or 5 Rooms | 50 (24.4%) | 23 (54.8%) |
| 6 or 7 Rooms | 102 (49.8%) | 14 (33.3%) |
| 8 or more Rooms | 38 (18.5%) | 0 (0.0%) |
| Total | 205 (100.0%) | 42 (100.0%) |
Housing Structure by Heating Type in Ruth
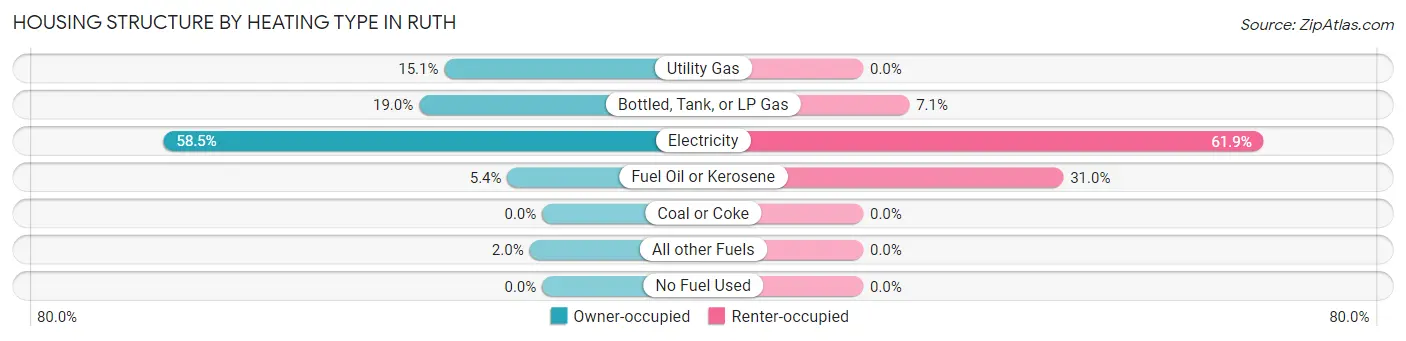
| Heating Type | Owner-occupied | Renter-occupied |
| Utility Gas | 31 (15.1%) | 0 (0.0%) |
| Bottled, Tank, or LP Gas | 39 (19.0%) | 3 (7.1%) |
| Electricity | 120 (58.5%) | 26 (61.9%) |
| Fuel Oil or Kerosene | 11 (5.4%) | 13 (30.9%) |
| Coal or Coke | 0 (0.0%) | 0 (0.0%) |
| All other Fuels | 4 (1.9%) | 0 (0.0%) |
| No Fuel Used | 0 (0.0%) | 0 (0.0%) |
| Total | 205 (100.0%) | 42 (100.0%) |
Household Vehicle Usage in Ruth
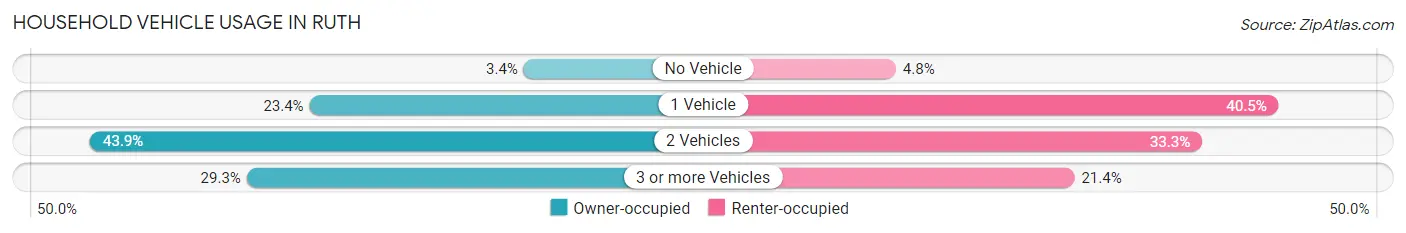
| Vehicles per Household | Owner-occupied | Renter-occupied |
| No Vehicle | 7 (3.4%) | 2 (4.8%) |
| 1 Vehicle | 48 (23.4%) | 17 (40.5%) |
| 2 Vehicles | 90 (43.9%) | 14 (33.3%) |
| 3 or more Vehicles | 60 (29.3%) | 9 (21.4%) |
| Total | 205 (100.0%) | 42 (100.0%) |
Real Estate & Mortgages in Ruth
Real Estate and Mortgage Overview in Ruth
| Characteristic | Without Mortgage | With Mortgage |
| Housing Units | 95 | 110 |
| Median Property Value | $117,000 | $122,100 |
| Median Household Income | $37,917 | $2 |
| Monthly Housing Costs | $416 | $0 |
| Real Estate Taxes | $529 | $2 |
Property Value by Mortgage Status in Ruth
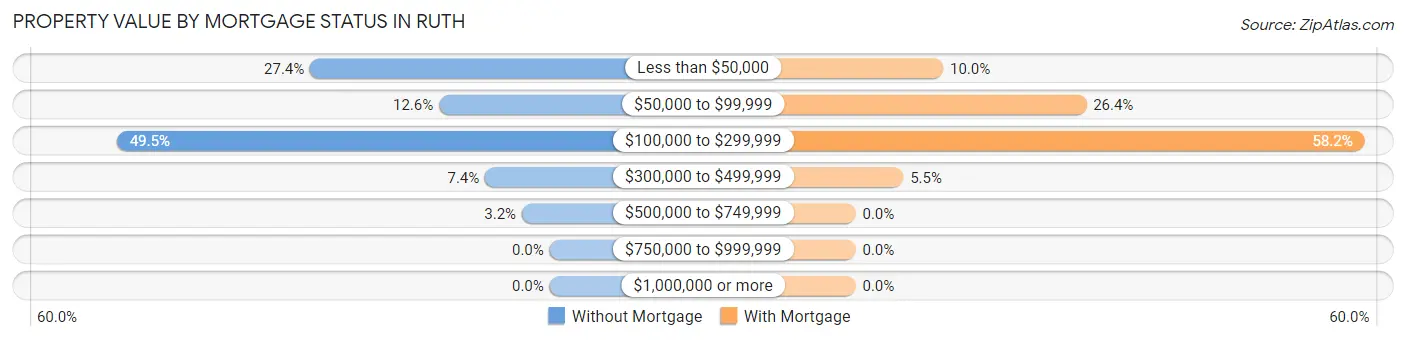
| Property Value | Without Mortgage | With Mortgage |
| Less than $50,000 | 26 (27.4%) | 11 (10.0%) |
| $50,000 to $99,999 | 12 (12.6%) | 29 (26.4%) |
| $100,000 to $299,999 | 47 (49.5%) | 64 (58.2%) |
| $300,000 to $499,999 | 7 (7.4%) | 6 (5.4%) |
| $500,000 to $749,999 | 3 (3.2%) | 0 (0.0%) |
| $750,000 to $999,999 | 0 (0.0%) | 0 (0.0%) |
| $1,000,000 or more | 0 (0.0%) | 0 (0.0%) |
| Total | 95 (100.0%) | 110 (100.0%) |
Household Income by Mortgage Status in Ruth
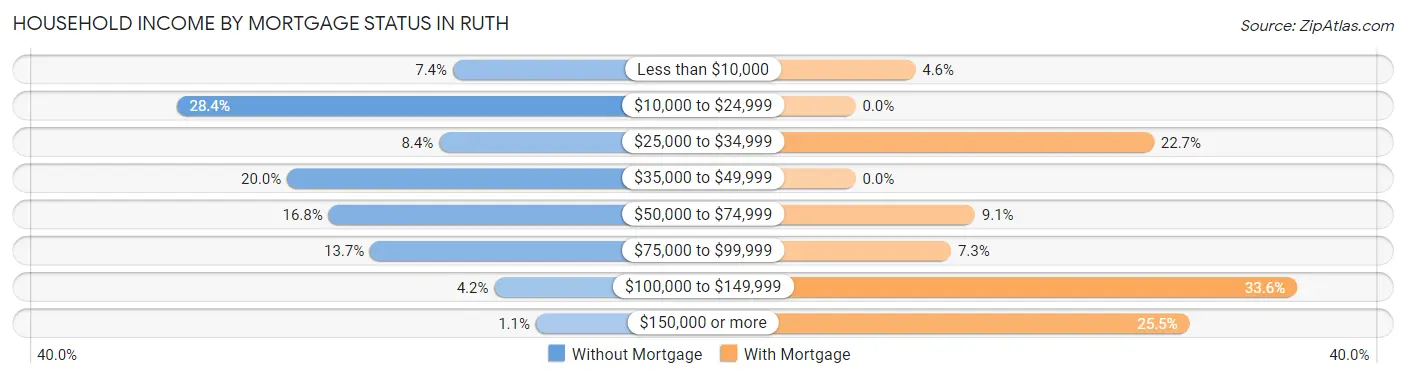
| Household Income | Without Mortgage | With Mortgage |
| Less than $10,000 | 7 (7.4%) | 5 (4.5%) |
| $10,000 to $24,999 | 27 (28.4%) | 0 (0.0%) |
| $25,000 to $34,999 | 8 (8.4%) | 25 (22.7%) |
| $35,000 to $49,999 | 19 (20.0%) | 0 (0.0%) |
| $50,000 to $74,999 | 16 (16.8%) | 10 (9.1%) |
| $75,000 to $99,999 | 13 (13.7%) | 8 (7.3%) |
| $100,000 to $149,999 | 4 (4.2%) | 37 (33.6%) |
| $150,000 or more | 1 (1.1%) | 28 (25.5%) |
| Total | 95 (100.0%) | 110 (100.0%) |
Property Value to Household Income Ratio in Ruth
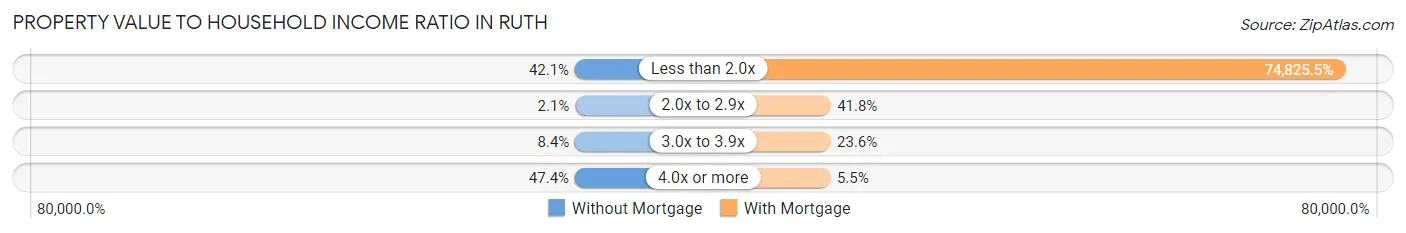
| Value-to-Income Ratio | Without Mortgage | With Mortgage |
| Less than 2.0x | 40 (42.1%) | 82,308 (74,825.5%) |
| 2.0x to 2.9x | 2 (2.1%) | 46 (41.8%) |
| 3.0x to 3.9x | 8 (8.4%) | 26 (23.6%) |
| 4.0x or more | 45 (47.4%) | 6 (5.4%) |
| Total | 95 (100.0%) | 110 (100.0%) |
Real Estate Taxes by Mortgage Status in Ruth
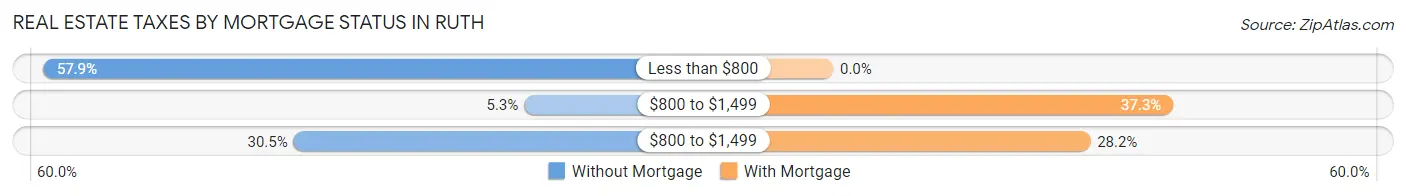
| Property Taxes | Without Mortgage | With Mortgage |
| Less than $800 | 55 (57.9%) | 0 (0.0%) |
| $800 to $1,499 | 5 (5.3%) | 41 (37.3%) |
| $800 to $1,499 | 29 (30.5%) | 31 (28.2%) |
| Total | 95 (100.0%) | 110 (100.0%) |
Health & Disability in Ruth
Health Insurance Coverage by Age in Ruth
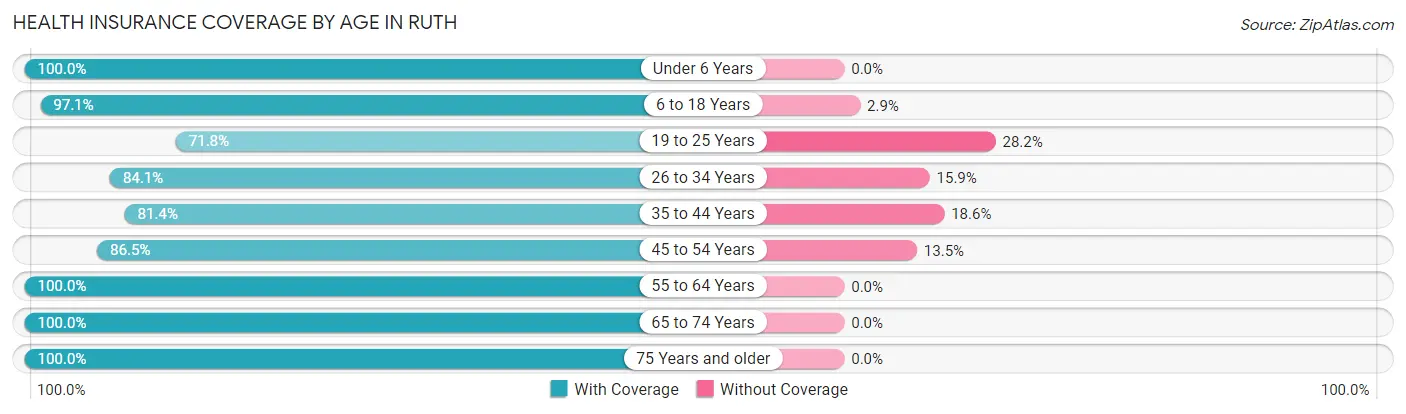
| Age Bracket | With Coverage | Without Coverage |
| Under 6 Years | 29 (100.0%) | 0 (0.0%) |
| 6 to 18 Years | 99 (97.1%) | 3 (2.9%) |
| 19 to 25 Years | 28 (71.8%) | 11 (28.2%) |
| 26 to 34 Years | 74 (84.1%) | 14 (15.9%) |
| 35 to 44 Years | 48 (81.4%) | 11 (18.6%) |
| 45 to 54 Years | 83 (86.5%) | 13 (13.5%) |
| 55 to 64 Years | 97 (100.0%) | 0 (0.0%) |
| 65 to 74 Years | 77 (100.0%) | 0 (0.0%) |
| 75 Years and older | 34 (100.0%) | 0 (0.0%) |
| Total | 569 (91.6%) | 52 (8.4%) |
Health Insurance Coverage by Citizenship Status in Ruth
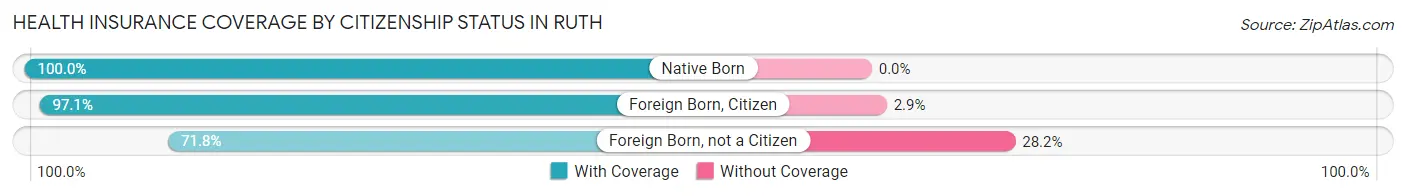
| Citizenship Status | With Coverage | Without Coverage |
| Native Born | 29 (100.0%) | 0 (0.0%) |
| Foreign Born, Citizen | 99 (97.1%) | 3 (2.9%) |
| Foreign Born, not a Citizen | 28 (71.8%) | 11 (28.2%) |
Health Insurance Coverage by Household Income in Ruth
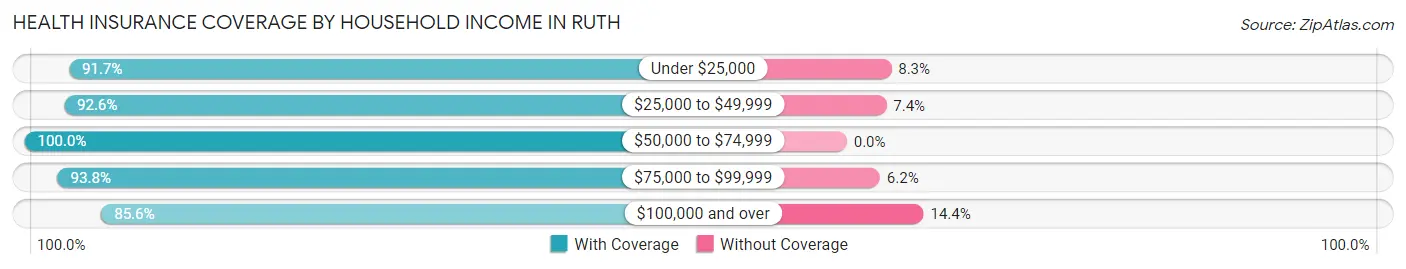
| Household Income | With Coverage | Without Coverage |
| Under $25,000 | 154 (91.7%) | 14 (8.3%) |
| $25,000 to $49,999 | 100 (92.6%) | 8 (7.4%) |
| $50,000 to $74,999 | 63 (100.0%) | 0 (0.0%) |
| $75,000 to $99,999 | 121 (93.8%) | 8 (6.2%) |
| $100,000 and over | 131 (85.6%) | 22 (14.4%) |
Public vs Private Health Insurance Coverage by Age in Ruth
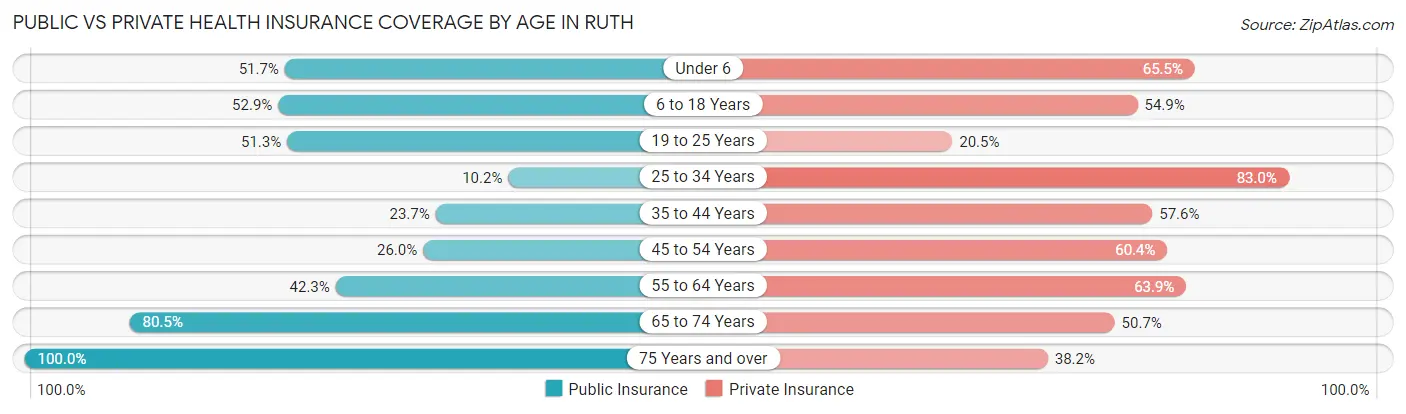
| Age Bracket | Public Insurance | Private Insurance |
| Under 6 | 15 (51.7%) | 19 (65.5%) |
| 6 to 18 Years | 54 (52.9%) | 56 (54.9%) |
| 19 to 25 Years | 20 (51.3%) | 8 (20.5%) |
| 25 to 34 Years | 9 (10.2%) | 73 (83.0%) |
| 35 to 44 Years | 14 (23.7%) | 34 (57.6%) |
| 45 to 54 Years | 25 (26.0%) | 58 (60.4%) |
| 55 to 64 Years | 41 (42.3%) | 62 (63.9%) |
| 65 to 74 Years | 62 (80.5%) | 39 (50.6%) |
| 75 Years and over | 34 (100.0%) | 13 (38.2%) |
| Total | 274 (44.1%) | 362 (58.3%) |
Disability Status by Sex by Age in Ruth
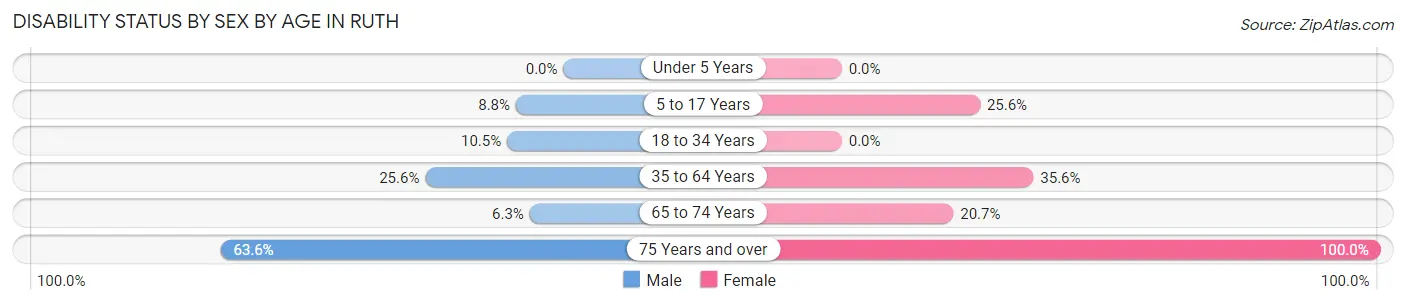
| Age Bracket | Male | Female |
| Under 5 Years | 0 (0.0%) | 0 (0.0%) |
| 5 to 17 Years | 6 (8.8%) | 10 (25.6%) |
| 18 to 34 Years | 7 (10.4%) | 0 (0.0%) |
| 35 to 64 Years | 30 (25.6%) | 48 (35.6%) |
| 65 to 74 Years | 3 (6.2%) | 6 (20.7%) |
| 75 Years and over | 7 (63.6%) | 23 (100.0%) |
Disability Class by Sex by Age in Ruth
Disability Class: Hearing Difficulty
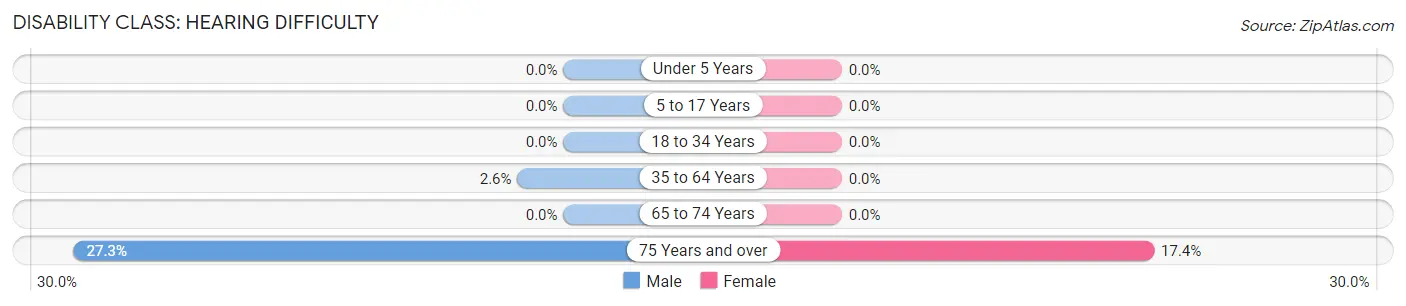
| Age Bracket | Male | Female |
| Under 5 Years | 0 (0.0%) | 0 (0.0%) |
| 5 to 17 Years | 0 (0.0%) | 0 (0.0%) |
| 18 to 34 Years | 0 (0.0%) | 0 (0.0%) |
| 35 to 64 Years | 3 (2.6%) | 0 (0.0%) |
| 65 to 74 Years | 0 (0.0%) | 0 (0.0%) |
| 75 Years and over | 3 (27.3%) | 4 (17.4%) |
Disability Class: Vision Difficulty
| Age Bracket | Male | Female |
| Under 5 Years | 0 (0.0%) | 0 (0.0%) |
| 5 to 17 Years | 0 (0.0%) | 0 (0.0%) |
| 18 to 34 Years | 0 (0.0%) | 0 (0.0%) |
| 35 to 64 Years | 15 (12.8%) | 6 (4.4%) |
| 65 to 74 Years | 0 (0.0%) | 0 (0.0%) |
| 75 Years and over | 3 (27.3%) | 7 (30.4%) |
Disability Class: Cognitive Difficulty
| Age Bracket | Male | Female |
| 5 to 17 Years | 6 (8.8%) | 10 (25.6%) |
| 18 to 34 Years | 7 (10.4%) | 0 (0.0%) |
| 35 to 64 Years | 20 (17.1%) | 28 (20.7%) |
| 65 to 74 Years | 0 (0.0%) | 0 (0.0%) |
| 75 Years and over | 0 (0.0%) | 9 (39.1%) |
Disability Class: Ambulatory Difficulty
| Age Bracket | Male | Female |
| 5 to 17 Years | 0 (0.0%) | 0 (0.0%) |
| 18 to 34 Years | 0 (0.0%) | 0 (0.0%) |
| 35 to 64 Years | 9 (7.7%) | 27 (20.0%) |
| 65 to 74 Years | 3 (6.2%) | 6 (20.7%) |
| 75 Years and over | 1 (9.1%) | 15 (65.2%) |
Disability Class: Self-Care Difficulty
| Age Bracket | Male | Female |
| 5 to 17 Years | 0 (0.0%) | 0 (0.0%) |
| 18 to 34 Years | 0 (0.0%) | 0 (0.0%) |
| 35 to 64 Years | 13 (11.1%) | 15 (11.1%) |
| 65 to 74 Years | 0 (0.0%) | 2 (6.9%) |
| 75 Years and over | 1 (9.1%) | 2 (8.7%) |
Technology Access in Ruth
Computing Device Access in Ruth
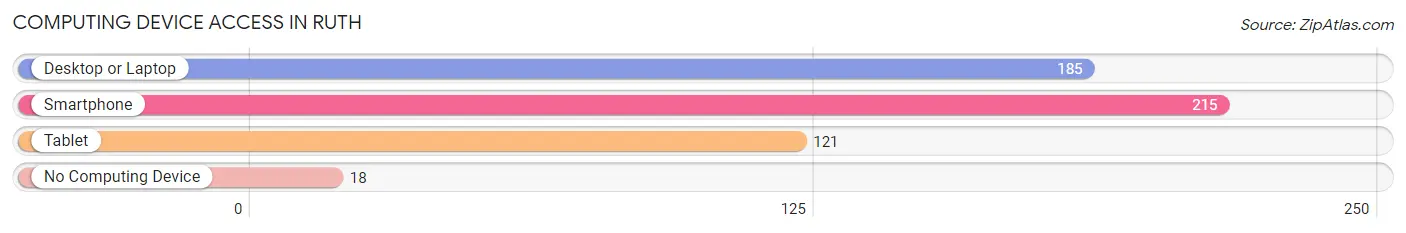
| Device Type | # Households | % Households |
| Desktop or Laptop | 185 | 74.9% |
| Smartphone | 215 | 87.0% |
| Tablet | 121 | 49.0% |
| No Computing Device | 18 | 7.3% |
| Total | 247 | 100.0% |
Internet Access in Ruth
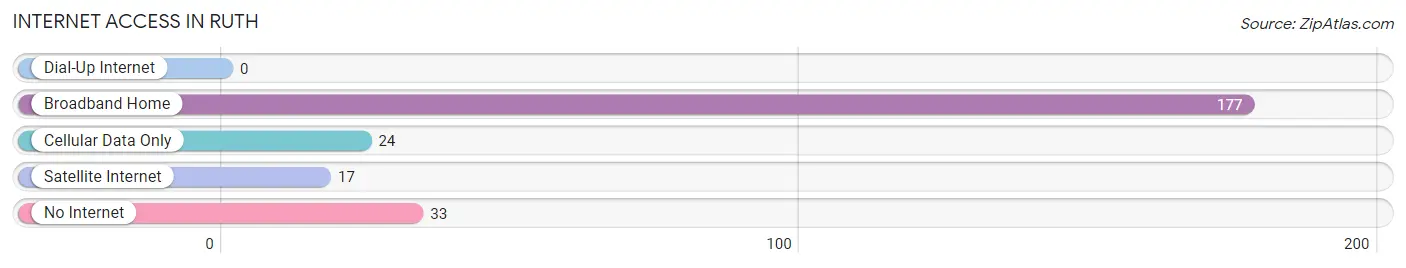
| Internet Type | # Households | % Households |
| Dial-Up Internet | 0 | 0.0% |
| Broadband Home | 177 | 71.7% |
| Cellular Data Only | 24 | 9.7% |
| Satellite Internet | 17 | 6.9% |
| No Internet | 33 | 13.4% |
| Total | 247 | 100.0% |
Ruth Summary
Ruth is a small town located in the western part of North Carolina, in the foothills of the Blue Ridge Mountains. It is situated in the Catawba County, and is part of the Hickory-Lenoir-Morganton Metropolitan Statistical Area. The town has a population of approximately 1,000 people, and is known for its rural charm and small-town atmosphere.
Geography
Ruth is located in the foothills of the Blue Ridge Mountains, and is surrounded by rolling hills and lush forests. The town is situated in the Catawba River Valley, and is bordered by the Catawba River to the east and the South Fork Catawba River to the west. The town is located at an elevation of 1,000 feet, and has a total area of 1.2 square miles.
Climate
Ruth has a humid subtropical climate, with hot, humid summers and mild winters. The average annual temperature is around 60 degrees Fahrenheit, and the average annual precipitation is around 45 inches.
Economy
Ruth’s economy is largely based on agriculture and tourism. The town is home to several small farms, and the surrounding area is known for its production of apples, peaches, and other fruits and vegetables. The town is also home to several small businesses, including restaurants, shops, and other services.
Tourism is an important part of the local economy, as the town is located near several popular attractions, including Lake Hickory, the Catawba River, and the Blue Ridge Parkway. The town is also home to several historic sites, including the Ruth Historic District, which is listed on the National Register of Historic Places.
Demographics
As of the 2010 census, the population of Ruth was 1,000 people, with a population density of 830 people per square mile. The median age of the population was 44.7 years, and the median household income was $37,500. The racial makeup of the town was 97.2% White, 0.7% African American, 0.3% Native American, 0.3% Asian, and 1.5% from other races.
Ruth is a small town with a rich history and a unique culture. The town is known for its rural charm and small-town atmosphere, and is a popular destination for tourists and locals alike. The town’s economy is largely based on agriculture and tourism, and the town is home to several small businesses and historic sites. The population of Ruth is diverse, with a median age of 44.7 years and a median household income of $37,500.
Common Questions
What is Per Capita Income in Ruth?
Per Capita income in Ruth is $24,367.
What is the Median Family Income in Ruth?
Median Family Income in Ruth is $60,179.
What is the Median Household income in Ruth?
Median Household Income in Ruth is $56,875.
What is Income or Wage Gap in Ruth?
Income or Wage Gap in Ruth is 46.2%.
Women in Ruth earn 53.8 cents for every dollar earned by a man.
What is Inequality or Gini Index in Ruth?
Inequality or Gini Index in Ruth is 0.39.
What is the Total Population of Ruth?
Total Population of Ruth is 621.
What is the Total Male Population of Ruth?
Total Male Population of Ruth is 330.
What is the Total Female Population of Ruth?
Total Female Population of Ruth is 291.
What is the Ratio of Males per 100 Females in Ruth?
There are 113.40 Males per 100 Females in Ruth.
What is the Ratio of Females per 100 Males in Ruth?
There are 88.18 Females per 100 Males in Ruth.
What is the Median Population Age in Ruth?
Median Population Age in Ruth is 41.8 Years.
What is the Average Family Size in Ruth
Average Family Size in Ruth is 2.7 People.
What is the Average Household Size in Ruth
Average Household Size in Ruth is 2.5 People.
How Large is the Labor Force in Ruth?
There are 261 People in the Labor Forcein in Ruth.
What is the Percentage of People in the Labor Force in Ruth?
51.2% of People are in the Labor Force in Ruth.
What is the Unemployment Rate in Ruth?
Unemployment Rate in Ruth is 2.3%.