Millingport, NC Map & Demographics
Millingport Map
Millingport Overview
$37,974
PER CAPITA INCOME
$91,471
AVG FAMILY INCOME
$89,000
AVG HOUSEHOLD INCOME
1.7%
WAGE / INCOME GAP [ % ]
98.3¢/ $1
WAGE / INCOME GAP [ $ ]
0.34
INEQUALITY / GINI INDEX
479
TOTAL POPULATION
238
MALE POPULATION
241
FEMALE POPULATION
98.76
MALES / 100 FEMALES
101.26
FEMALES / 100 MALES
50.9
MEDIAN AGE
2.5
AVG FAMILY SIZE
2.3
AVG HOUSEHOLD SIZE
306
LABOR FORCE [ PEOPLE ]
68.5%
PERCENT IN LABOR FORCE
Income in Millingport
Income Overview in Millingport
Per Capita Income in Millingport is $37,974, while median incomes of families and households are $91,471 and $89,000 respectively.
| Characteristic | Number | Measure |
| Per Capita Income | 479 | $37,974 |
| Median Family Income | 178 | $91,471 |
| Mean Family Income | 178 | $99,193 |
| Median Household Income | 206 | $89,000 |
| Mean Household Income | 206 | $89,411 |
| Income Deficit | 178 | $0 |
| Wage / Income Gap (%) | 479 | 1.68% |
| Wage / Income Gap ($) | 479 | 98.32¢ per $1 |
| Gini / Inequality Index | 479 | 0.34 |
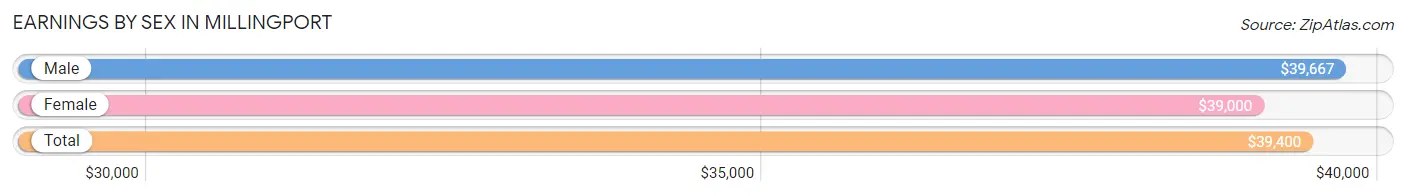
Earnings by Sex in Millingport
Average Earnings in Millingport are $39,400, $39,667 for men and $39,000 for women, a difference of 1.7%.
| Sex | Number | Average Earnings |
| Male | 150 (49.0%) | $39,667 |
| Female | 156 (51.0%) | $39,000 |
| Total | 306 (100.0%) | $39,400 |
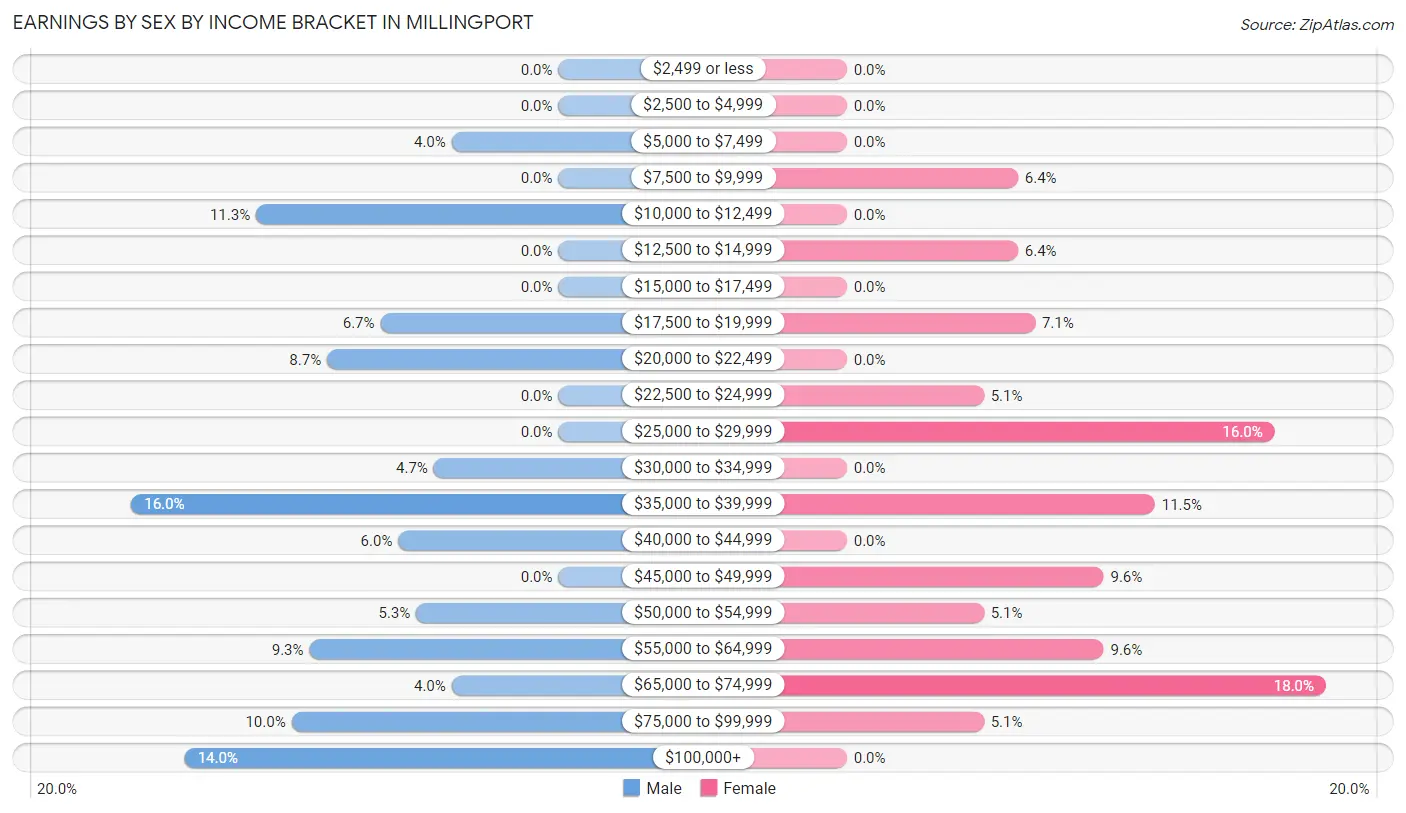
Earnings by Sex by Income Bracket in Millingport
The most common earnings brackets in Millingport are $35,000 to $39,999 for men (24 | 16.0%) and $65,000 to $74,999 for women (28 | 17.9%).
| Income | Male | Female |
| $2,499 or less | 0 (0.0%) | 0 (0.0%) |
| $2,500 to $4,999 | 0 (0.0%) | 0 (0.0%) |
| $5,000 to $7,499 | 6 (4.0%) | 0 (0.0%) |
| $7,500 to $9,999 | 0 (0.0%) | 10 (6.4%) |
| $10,000 to $12,499 | 17 (11.3%) | 0 (0.0%) |
| $12,500 to $14,999 | 0 (0.0%) | 10 (6.4%) |
| $15,000 to $17,499 | 0 (0.0%) | 0 (0.0%) |
| $17,500 to $19,999 | 10 (6.7%) | 11 (7.0%) |
| $20,000 to $22,499 | 13 (8.7%) | 0 (0.0%) |
| $22,500 to $24,999 | 0 (0.0%) | 8 (5.1%) |
| $25,000 to $29,999 | 0 (0.0%) | 25 (16.0%) |
| $30,000 to $34,999 | 7 (4.7%) | 0 (0.0%) |
| $35,000 to $39,999 | 24 (16.0%) | 18 (11.5%) |
| $40,000 to $44,999 | 9 (6.0%) | 0 (0.0%) |
| $45,000 to $49,999 | 0 (0.0%) | 15 (9.6%) |
| $50,000 to $54,999 | 8 (5.3%) | 8 (5.1%) |
| $55,000 to $64,999 | 14 (9.3%) | 15 (9.6%) |
| $65,000 to $74,999 | 6 (4.0%) | 28 (17.9%) |
| $75,000 to $99,999 | 15 (10.0%) | 8 (5.1%) |
| $100,000+ | 21 (14.0%) | 0 (0.0%) |
| Total | 150 (100.0%) | 156 (100.0%) |
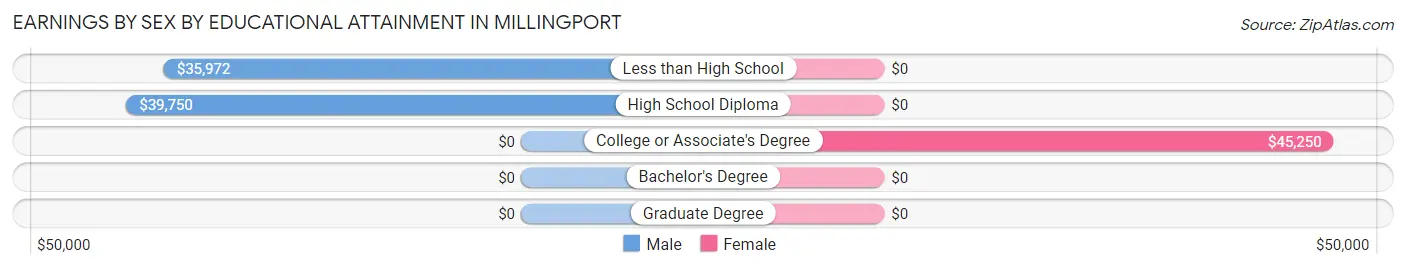
Earnings by Sex by Educational Attainment in Millingport
Average earnings in Millingport are $39,667 for men and $46,333 for women, a difference of 14.4%. Men with an educational attainment of high school diploma enjoy the highest average annual earnings of $39,750, while those with less than high school education earn the least with $35,972. Women with an educational attainment of college or associate's degree earn the most with the average annual earnings of $45,250, while those with college or associate's degree education have the smallest earnings of $45,250.
| Educational Attainment | Male Income | Female Income |
| Less than High School | $35,972 | $0 |
| High School Diploma | $39,750 | $0 |
| College or Associate's Degree | - | - |
| Bachelor's Degree | - | - |
| Graduate Degree | - | - |
| Total | $39,667 | $46,333 |
Family Income in Millingport
Family Income Brackets in Millingport
According to the Millingport family income data, there are 49 families falling into the $75,000 to $99,999 income range, which is the most common income bracket and makes up 27.5% of all families.
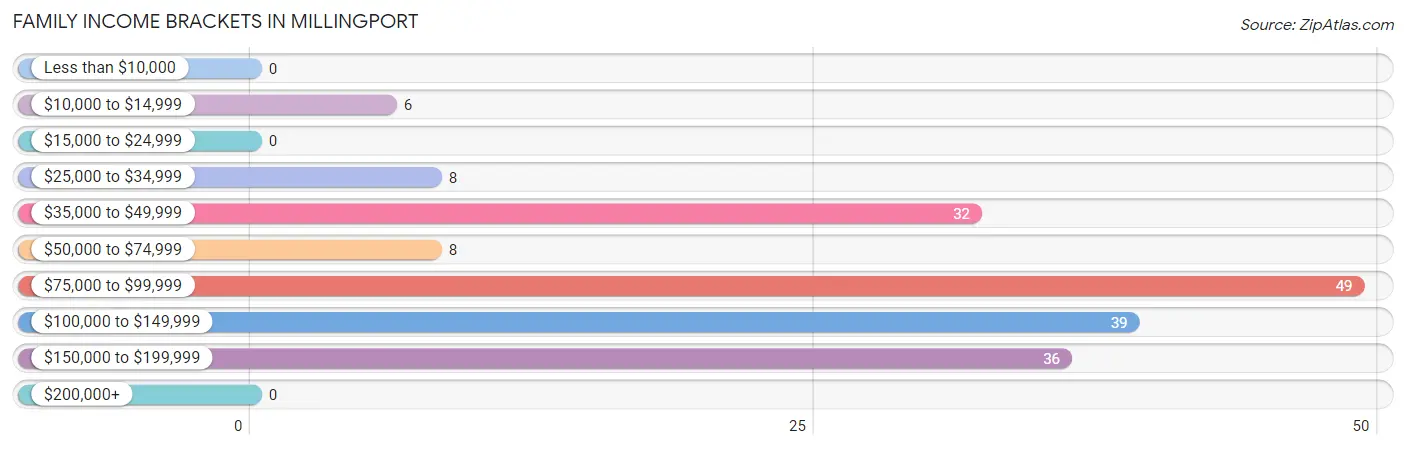
| Income Bracket | # Families | % Families |
| Less than $10,000 | 0 | 0.0% |
| $10,000 to $14,999 | 6 | 3.4% |
| $15,000 to $24,999 | 0 | 0.0% |
| $25,000 to $34,999 | 8 | 4.5% |
| $35,000 to $49,999 | 32 | 18.0% |
| $50,000 to $74,999 | 8 | 4.5% |
| $75,000 to $99,999 | 49 | 27.5% |
| $100,000 to $149,999 | 39 | 21.9% |
| $150,000 to $199,999 | 36 | 20.2% |
| $200,000+ | 0 | 0.0% |
Family Income by Famaliy Size in Millingport
2-person families (127 | 71.4%) account for the highest median family income in Millingport with $79,083 per family, while 2-person families (127 | 71.4%) have the highest median income of $39,542 per family member.
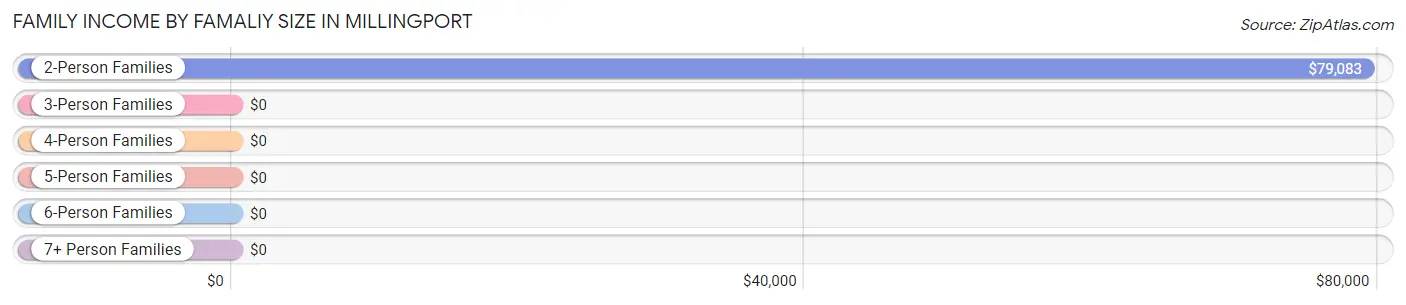
| Income Bracket | # Families | Median Income |
| 2-Person Families | 127 (71.4%) | $79,083 |
| 3-Person Families | 23 (12.9%) | $0 |
| 4-Person Families | 15 (8.4%) | $0 |
| 5-Person Families | 13 (7.3%) | $0 |
| 6-Person Families | 0 (0.0%) | $0 |
| 7+ Person Families | 0 (0.0%) | $0 |
| Total | 178 (100.0%) | $91,471 |
Family Income by Number of Earners in Millingport
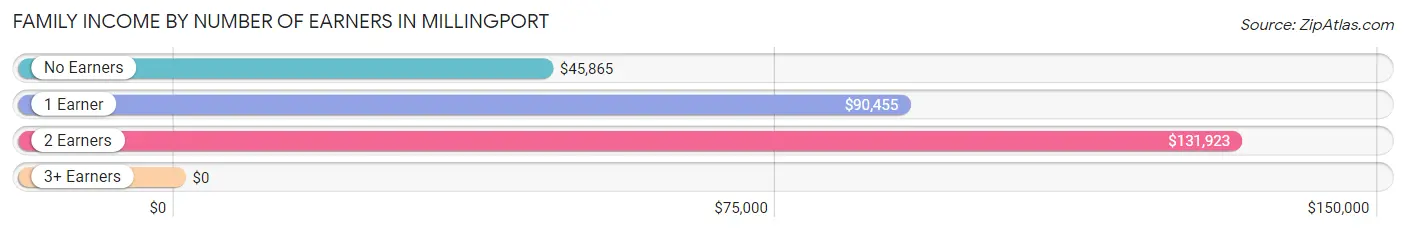
| Number of Earners | # Families | Median Income |
| No Earners | 46 (25.8%) | $45,865 |
| 1 Earner | 32 (18.0%) | $90,455 |
| 2 Earners | 62 (34.8%) | $131,923 |
| 3+ Earners | 38 (21.3%) | $0 |
| Total | 178 (100.0%) | $91,471 |
Household Income in Millingport
Household Income Brackets in Millingport
With 57 households falling in the category, the $75,000 to $99,999 income range is the most frequent in Millingport, accounting for 27.7% of all households.
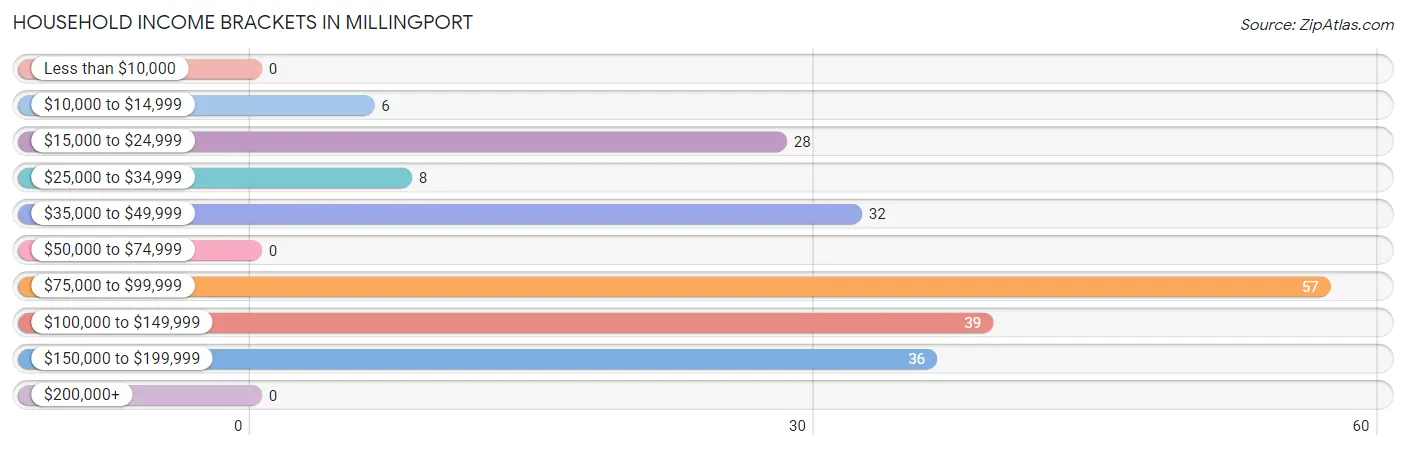
| Income Bracket | # Households | % Households |
| Less than $10,000 | 0 | 0.0% |
| $10,000 to $14,999 | 6 | 2.9% |
| $15,000 to $24,999 | 28 | 13.6% |
| $25,000 to $34,999 | 8 | 3.9% |
| $35,000 to $49,999 | 32 | 15.5% |
| $50,000 to $74,999 | 0 | 0.0% |
| $75,000 to $99,999 | 57 | 27.7% |
| $100,000 to $149,999 | 39 | 18.9% |
| $150,000 to $199,999 | 36 | 17.5% |
| $200,000+ | 0 | 0.0% |
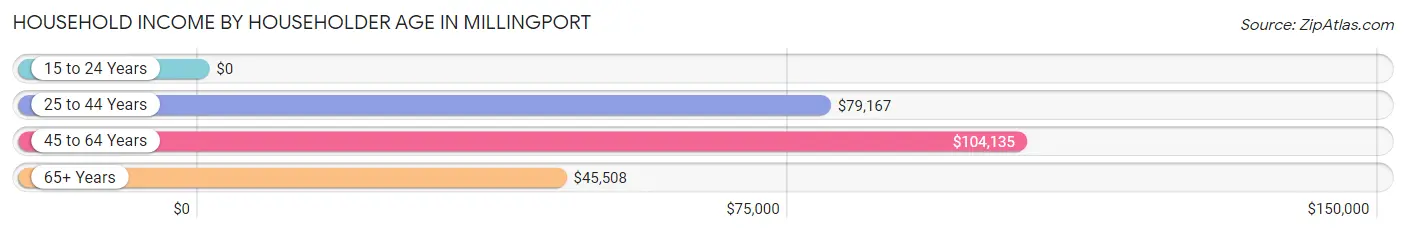
Household Income by Householder Age in Millingport
The median household income in Millingport is $89,000, with the highest median household income of $104,135 found in the 45 to 64 years age bracket for the primary householder. A total of 93 households (45.2%) fall into this category.
| Income Bracket | # Households | Median Income |
| 15 to 24 Years | 0 (0.0%) | $0 |
| 25 to 44 Years | 36 (17.5%) | $79,167 |
| 45 to 64 Years | 93 (45.2%) | $104,135 |
| 65+ Years | 77 (37.4%) | $45,508 |
| Total | 206 (100.0%) | $89,000 |
Poverty in Millingport
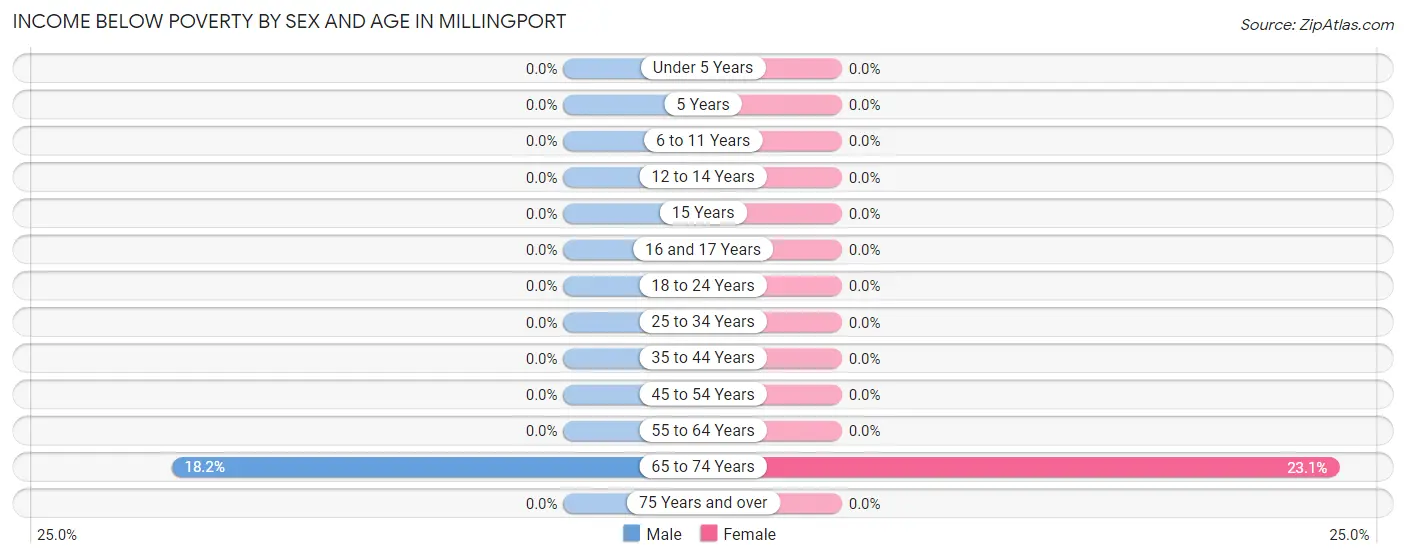
Income Below Poverty by Sex and Age in Millingport
With 2.5% poverty level for males and 2.5% for females among the residents of Millingport, 65 to 74 year old males and 65 to 74 year old females are the most vulnerable to poverty, with 6 males (18.2%) and 6 females (23.1%) in their respective age groups living below the poverty level.
| Age Bracket | Male | Female |
| Under 5 Years | 0 (0.0%) | 0 (0.0%) |
| 5 Years | 0 (0.0%) | 0 (0.0%) |
| 6 to 11 Years | 0 (0.0%) | 0 (0.0%) |
| 12 to 14 Years | 0 (0.0%) | 0 (0.0%) |
| 15 Years | 0 (0.0%) | 0 (0.0%) |
| 16 and 17 Years | 0 (0.0%) | 0 (0.0%) |
| 18 to 24 Years | 0 (0.0%) | 0 (0.0%) |
| 25 to 34 Years | 0 (0.0%) | 0 (0.0%) |
| 35 to 44 Years | 0 (0.0%) | 0 (0.0%) |
| 45 to 54 Years | 0 (0.0%) | 0 (0.0%) |
| 55 to 64 Years | 0 (0.0%) | 0 (0.0%) |
| 65 to 74 Years | 6 (18.2%) | 6 (23.1%) |
| 75 Years and over | 0 (0.0%) | 0 (0.0%) |
| Total | 6 (2.5%) | 6 (2.5%) |
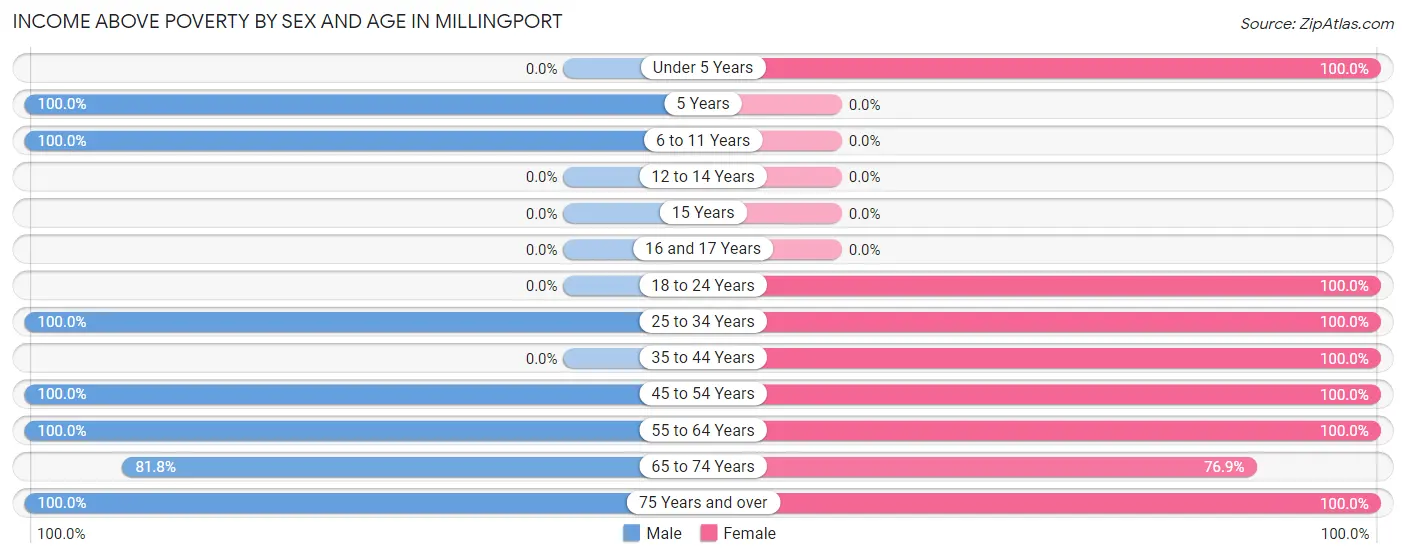
Income Above Poverty by Sex and Age in Millingport
According to the poverty statistics in Millingport, males aged 5 years and females aged under 5 years are the age groups that are most secure financially, with 100.0% of males and 100.0% of females in these age groups living above the poverty line.
| Age Bracket | Male | Female |
| Under 5 Years | 0 (0.0%) | 14 (100.0%) |
| 5 Years | 8 (100.0%) | 0 (0.0%) |
| 6 to 11 Years | 10 (100.0%) | 0 (0.0%) |
| 12 to 14 Years | 0 (0.0%) | 0 (0.0%) |
| 15 Years | 0 (0.0%) | 0 (0.0%) |
| 16 and 17 Years | 0 (0.0%) | 0 (0.0%) |
| 18 to 24 Years | 0 (0.0%) | 54 (100.0%) |
| 25 to 34 Years | 35 (100.0%) | 13 (100.0%) |
| 35 to 44 Years | 0 (0.0%) | 15 (100.0%) |
| 45 to 54 Years | 60 (100.0%) | 43 (100.0%) |
| 55 to 64 Years | 49 (100.0%) | 50 (100.0%) |
| 65 to 74 Years | 27 (81.8%) | 20 (76.9%) |
| 75 Years and over | 43 (100.0%) | 26 (100.0%) |
| Total | 232 (97.5%) | 235 (97.5%) |
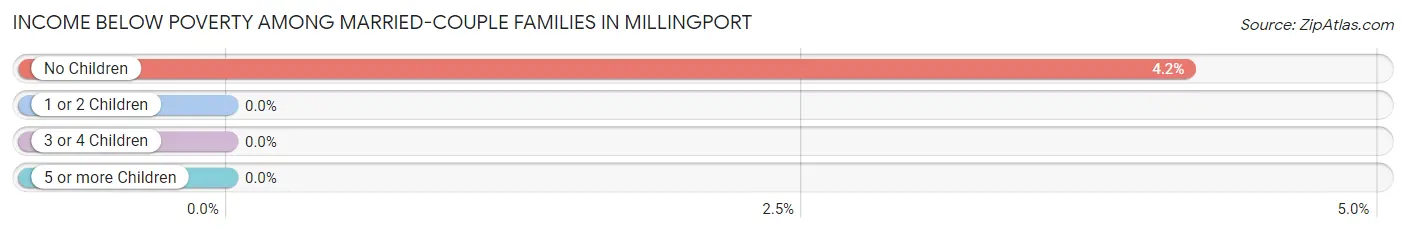
Income Below Poverty Among Married-Couple Families in Millingport
The poverty statistics for married-couple families in Millingport show that 3.5% or 6 of the total 170 families live below the poverty line. Families with no children have the highest poverty rate of 4.2%, comprising of 6 families. On the other hand, families with 1 or 2 children have the lowest poverty rate of 0.0%, which includes 0 families.
| Children | Above Poverty | Below Poverty |
| No Children | 138 (95.8%) | 6 (4.2%) |
| 1 or 2 Children | 26 (100.0%) | 0 (0.0%) |
| 3 or 4 Children | 0 (0.0%) | 0 (0.0%) |
| 5 or more Children | 0 (0.0%) | 0 (0.0%) |
| Total | 164 (96.5%) | 6 (3.5%) |
Income Below Poverty Among Single-Parent Households in Millingport
| Children | Single Father | Single Mother |
| No Children | 0 (0.0%) | 0 (0.0%) |
| 1 or 2 Children | 0 (0.0%) | 0 (0.0%) |
| 3 or 4 Children | 0 (0.0%) | 0 (0.0%) |
| 5 or more Children | 0 (0.0%) | 0 (0.0%) |
| Total | 0 (0.0%) | 0 (0.0%) |
Income Below Poverty Among Married-Couple vs Single-Parent Households in Millingport
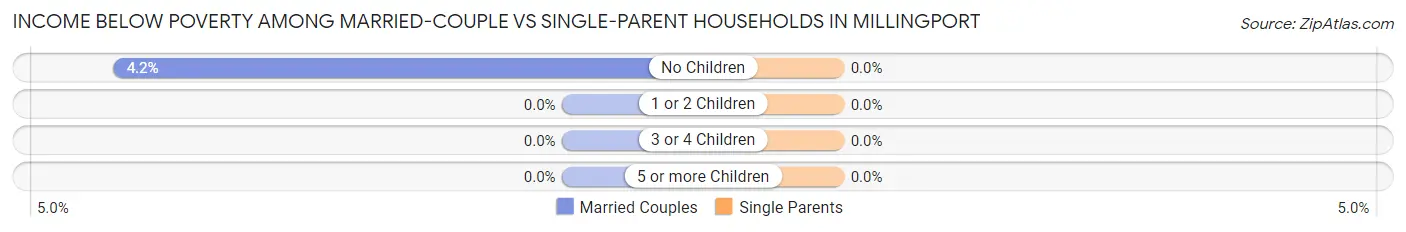
| Children | Married-Couple Families | Single-Parent Households |
| No Children | 6 (4.2%) | 0 (0.0%) |
| 1 or 2 Children | 0 (0.0%) | 0 (0.0%) |
| 3 or 4 Children | 0 (0.0%) | 0 (0.0%) |
| 5 or more Children | 0 (0.0%) | 0 (0.0%) |
| Total | 6 (3.5%) | 0 (0.0%) |
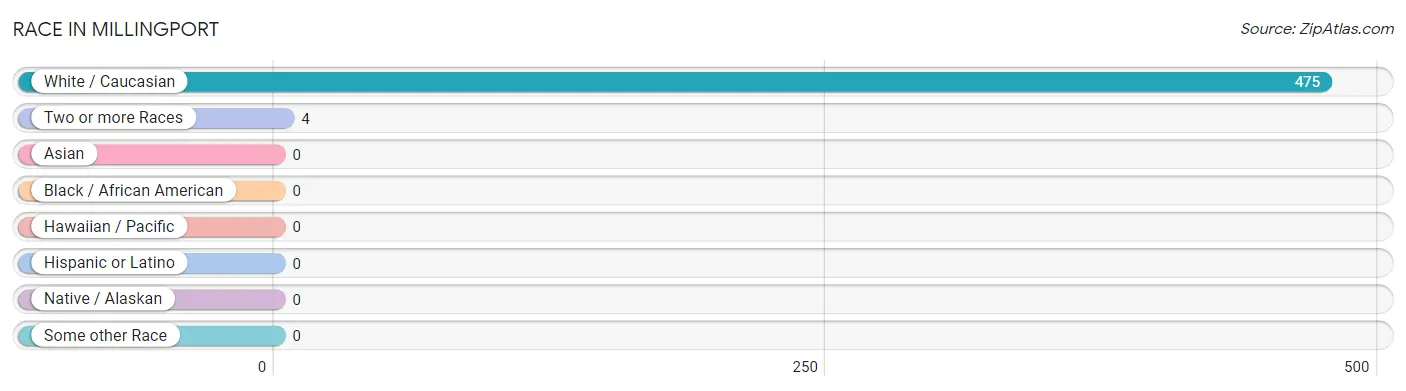
Race in Millingport
The most populous races in Millingport are White / Caucasian (475 | 99.2%), and Two or more Races (4 | 0.8%).
| Race | # Population | % Population |
| Asian | 0 | 0.0% |
| Black / African American | 0 | 0.0% |
| Hawaiian / Pacific | 0 | 0.0% |
| Hispanic or Latino | 0 | 0.0% |
| Native / Alaskan | 0 | 0.0% |
| White / Caucasian | 475 | 99.2% |
| Two or more Races | 4 | 0.8% |
| Some other Race | 0 | 0.0% |
| Total | 479 | 100.0% |
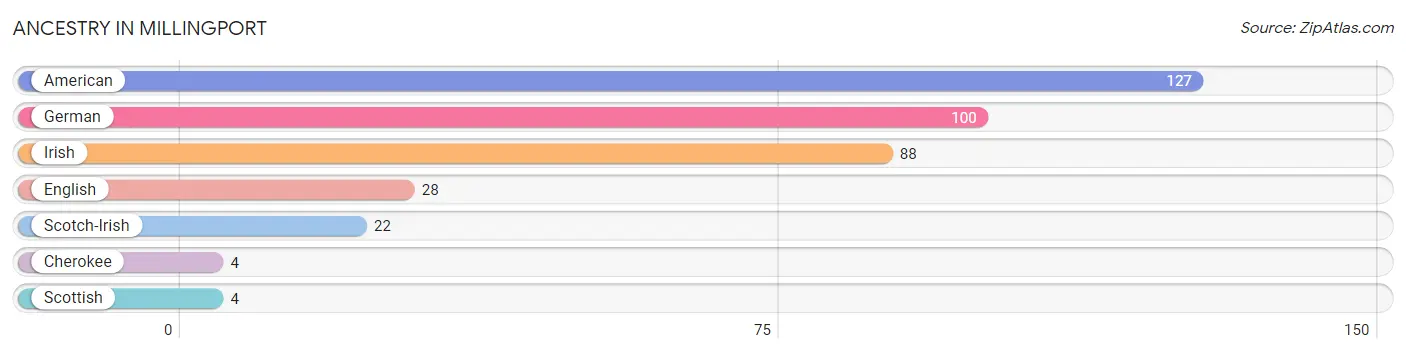
Ancestry in Millingport
The most populous ancestries reported in Millingport are American (127 | 26.5%), German (100 | 20.9%), Irish (88 | 18.4%), English (28 | 5.9%), and Scotch-Irish (22 | 4.6%), together accounting for 76.2% of all Millingport residents.
| Ancestry | # Population | % Population |
| American | 127 | 26.5% |
| Cherokee | 4 | 0.8% |
| English | 28 | 5.9% |
| German | 100 | 20.9% |
| Irish | 88 | 18.4% |
| Scotch-Irish | 22 | 4.6% |
| Scottish | 4 | 0.8% | View All 7 Rows |
Immigrants in Millingport

| Immigration Origin | # Population | % Population | View All 0 Rows |
Sex and Age in Millingport
Sex and Age in Millingport
The most populous age groups in Millingport are 60 to 64 Years (49 | 20.6%) for men and 20 to 24 Years (44 | 18.3%) for women.
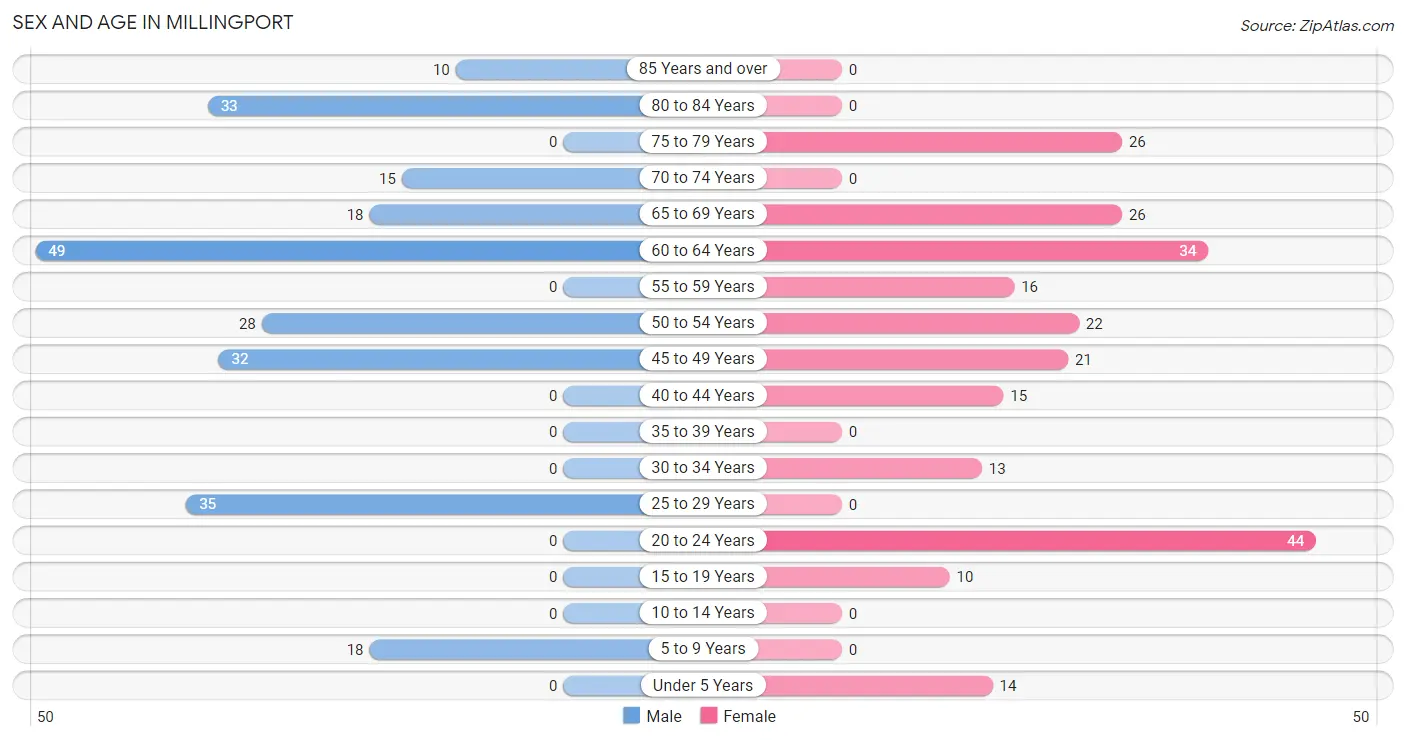
| Age Bracket | Male | Female |
| Under 5 Years | 0 (0.0%) | 14 (5.8%) |
| 5 to 9 Years | 18 (7.6%) | 0 (0.0%) |
| 10 to 14 Years | 0 (0.0%) | 0 (0.0%) |
| 15 to 19 Years | 0 (0.0%) | 10 (4.2%) |
| 20 to 24 Years | 0 (0.0%) | 44 (18.3%) |
| 25 to 29 Years | 35 (14.7%) | 0 (0.0%) |
| 30 to 34 Years | 0 (0.0%) | 13 (5.4%) |
| 35 to 39 Years | 0 (0.0%) | 0 (0.0%) |
| 40 to 44 Years | 0 (0.0%) | 15 (6.2%) |
| 45 to 49 Years | 32 (13.5%) | 21 (8.7%) |
| 50 to 54 Years | 28 (11.8%) | 22 (9.1%) |
| 55 to 59 Years | 0 (0.0%) | 16 (6.6%) |
| 60 to 64 Years | 49 (20.6%) | 34 (14.1%) |
| 65 to 69 Years | 18 (7.6%) | 26 (10.8%) |
| 70 to 74 Years | 15 (6.3%) | 0 (0.0%) |
| 75 to 79 Years | 0 (0.0%) | 26 (10.8%) |
| 80 to 84 Years | 33 (13.9%) | 0 (0.0%) |
| 85 Years and over | 10 (4.2%) | 0 (0.0%) |
| Total | 238 (100.0%) | 241 (100.0%) |
Families and Households in Millingport
Median Family Size in Millingport
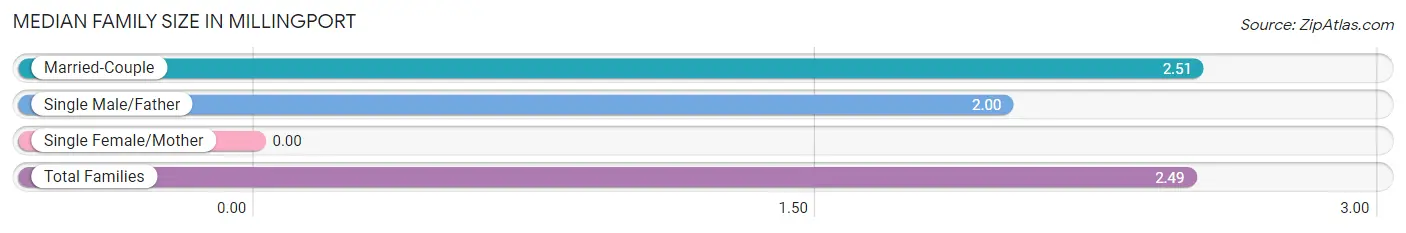
| Family Type | # Families | Family Size |
| Married-Couple | 170 (95.5%) | 2.51 |
| Single Male/Father | 8 (4.5%) | 2.00 |
| Single Female/Mother | 0 (0.0%) | - |
| Total Families | 178 (100.0%) | 2.49 |
Median Household Size in Millingport
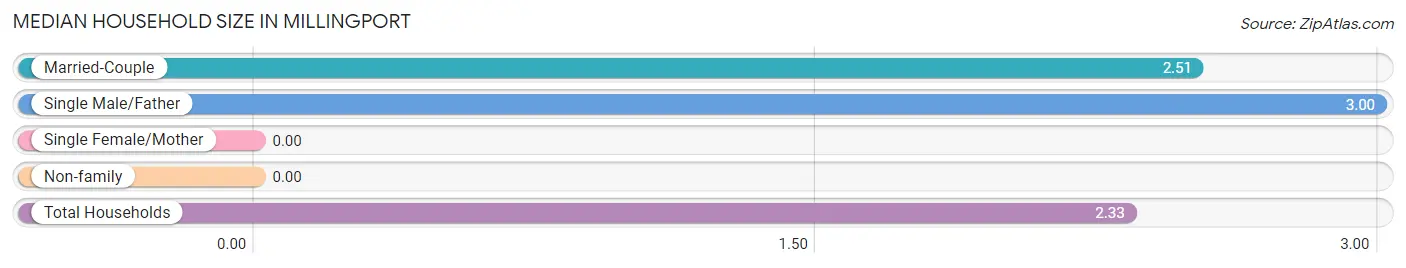
| Household Type | # Households | Household Size |
| Married-Couple | 170 (82.5%) | 2.51 |
| Single Male/Father | 8 (3.9%) | 3.00 |
| Single Female/Mother | 0 (0.0%) | - |
| Non-family | 28 (13.6%) | - |
| Total Households | 206 (100.0%) | 2.33 |
Household Size by Marriage Status in Millingport
Out of a total of 206 households in Millingport, 178 (86.4%) are family households, while 28 (13.6%) are nonfamily households. The most numerous type of family households are 2-person households, comprising 119, and the most common type of nonfamily households are 1-person households, comprising 28.
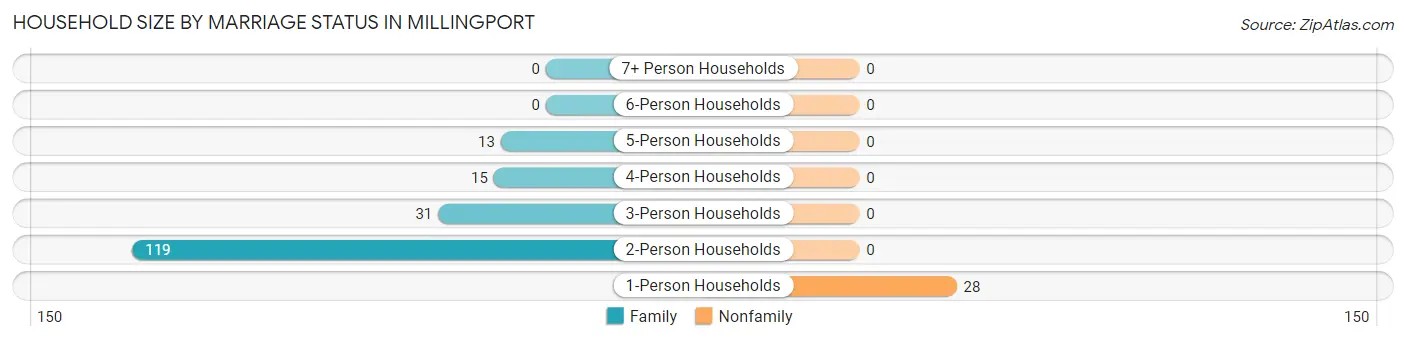
| Household Size | Family Households | Nonfamily Households |
| 1-Person Households | - | 28 (13.6%) |
| 2-Person Households | 119 (57.8%) | 0 (0.0%) |
| 3-Person Households | 31 (15.0%) | 0 (0.0%) |
| 4-Person Households | 15 (7.3%) | 0 (0.0%) |
| 5-Person Households | 13 (6.3%) | 0 (0.0%) |
| 6-Person Households | 0 (0.0%) | 0 (0.0%) |
| 7+ Person Households | 0 (0.0%) | 0 (0.0%) |
| Total | 178 (86.4%) | 28 (13.6%) |
Female Fertility in Millingport
Fertility by Age in Millingport
| Age Bracket | Women with Births | Births / 1,000 Women |
| 15 to 19 years | 0 (0.0%) | 0.0 |
| 20 to 34 years | 0 (0.0%) | 0.0 |
| 35 to 50 years | 0 (0.0%) | 0.0 |
| Total | 0 (0.0%) | 0.0 |
Fertility by Age by Marriage Status in Millingport
| Age Bracket | Married | Unmarried |
| 15 to 19 years | 0 (0.0%) | 0 (0.0%) |
| 20 to 34 years | 0 (0.0%) | 0 (0.0%) |
| 35 to 50 years | 0 (0.0%) | 0 (0.0%) |
| Total | 0 (0.0%) | 0 (0.0%) |
Fertility by Education in Millingport
| Educational Attainment | Women with Births | Births / 1,000 Women |
| Less than High School | 0 (0.0%) | 0.0 |
| High School Diploma | 0 (0.0%) | 0.0 |
| College or Associate's Degree | 0 (0.0%) | 0.0 |
| Bachelor's Degree | 0 (0.0%) | 0.0 |
| Graduate Degree | 0 (0.0%) | 0.0 |
| Total | 0 (0.0%) | 0.0 |
Fertility by Education by Marriage Status in Millingport
| Educational Attainment | Married | Unmarried |
| Less than High School | 0 (0.0%) | 0 (0.0%) |
| High School Diploma | 0 (0.0%) | 0 (0.0%) |
| College or Associate's Degree | 0 (0.0%) | 0 (0.0%) |
| Bachelor's Degree | 0 (0.0%) | 0 (0.0%) |
| Graduate Degree | 0 (0.0%) | 0 (0.0%) |
| Total | 0 (0.0%) | 0 (0.0%) |
Employment Characteristics in Millingport
Employment by Class of Employer in Millingport
Among the 306 employed individuals in Millingport, private company employees (232 | 75.8%), not-for-profit organizations (42 | 13.7%), and self-employed (not incorporated) (24 | 7.8%) make up the most common classes of employment.
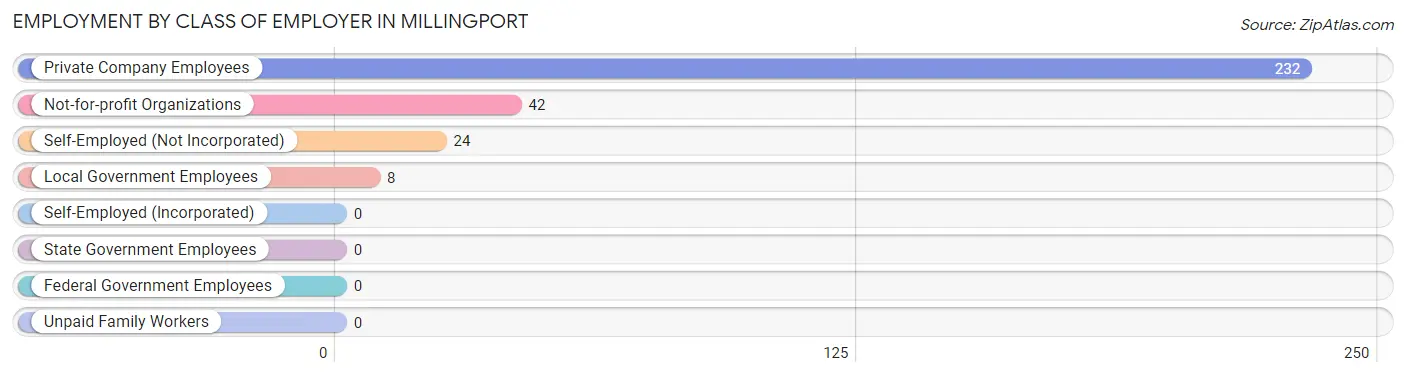
| Employer Class | # Employees | % Employees |
| Private Company Employees | 232 | 75.8% |
| Self-Employed (Incorporated) | 0 | 0.0% |
| Self-Employed (Not Incorporated) | 24 | 7.8% |
| Not-for-profit Organizations | 42 | 13.7% |
| Local Government Employees | 8 | 2.6% |
| State Government Employees | 0 | 0.0% |
| Federal Government Employees | 0 | 0.0% |
| Unpaid Family Workers | 0 | 0.0% |
| Total | 306 | 100.0% |
Employment Status by Age in Millingport
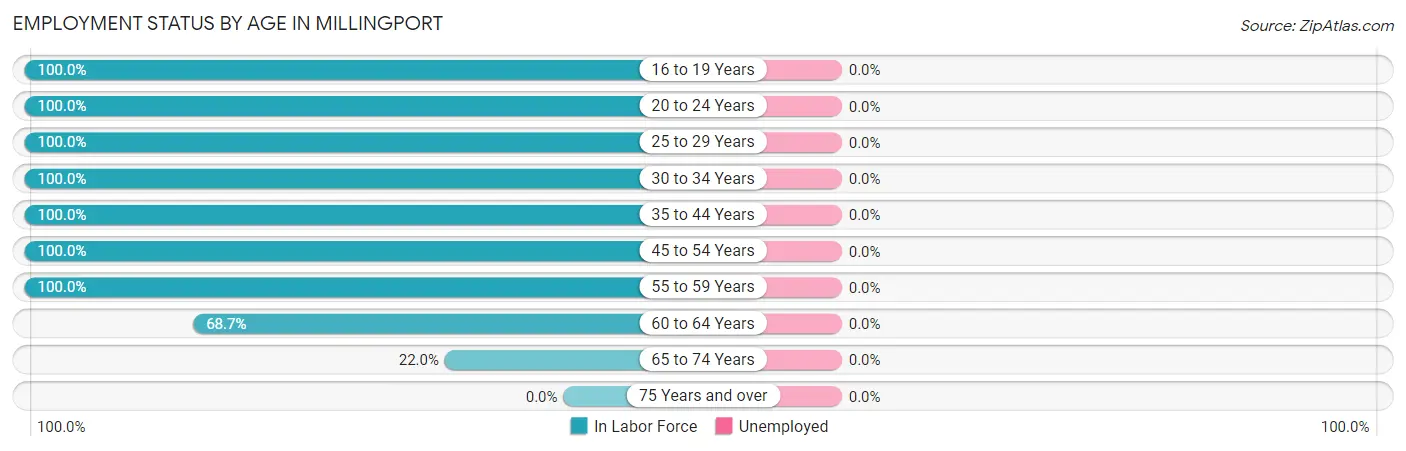
| Age Bracket | In Labor Force | Unemployed |
| 16 to 19 Years | 10 (100.0%) | 0 (0.0%) |
| 20 to 24 Years | 44 (100.0%) | 0 (0.0%) |
| 25 to 29 Years | 35 (100.0%) | 0 (0.0%) |
| 30 to 34 Years | 13 (100.0%) | 0 (0.0%) |
| 35 to 44 Years | 15 (100.0%) | 0 (0.0%) |
| 45 to 54 Years | 103 (100.0%) | 0 (0.0%) |
| 55 to 59 Years | 16 (100.0%) | 0 (0.0%) |
| 60 to 64 Years | 57 (68.7%) | 0 (0.0%) |
| 65 to 74 Years | 13 (22.0%) | 0 (0.0%) |
| 75 Years and over | 0 (0.0%) | 0 (0.0%) |
| Total | 306 (68.5%) | 0 (0.0%) |
Employment Status by Educational Attainment in Millingport
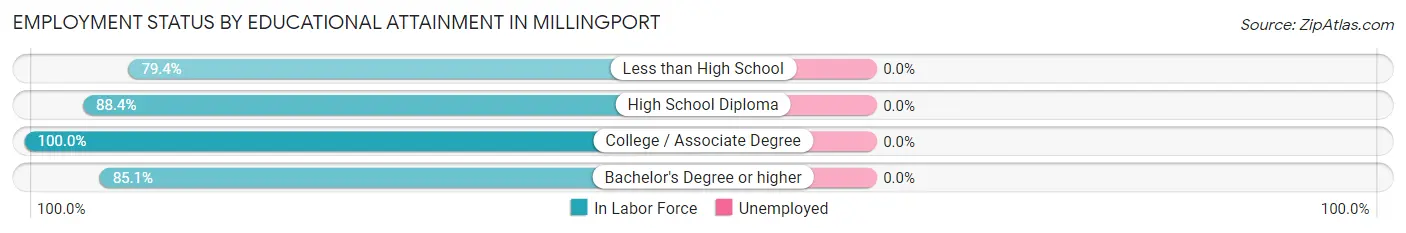
| Educational Attainment | In Labor Force | Unemployed |
| Less than High School | 27 (79.4%) | 0 (0.0%) |
| High School Diploma | 61 (88.4%) | 0 (0.0%) |
| College / Associate Degree | 88 (100.0%) | 0 (0.0%) |
| Bachelor's Degree or higher | 63 (85.1%) | 0 (0.0%) |
| Total | 239 (90.2%) | 0 (0.0%) |
Employment Occupations by Sex in Millingport
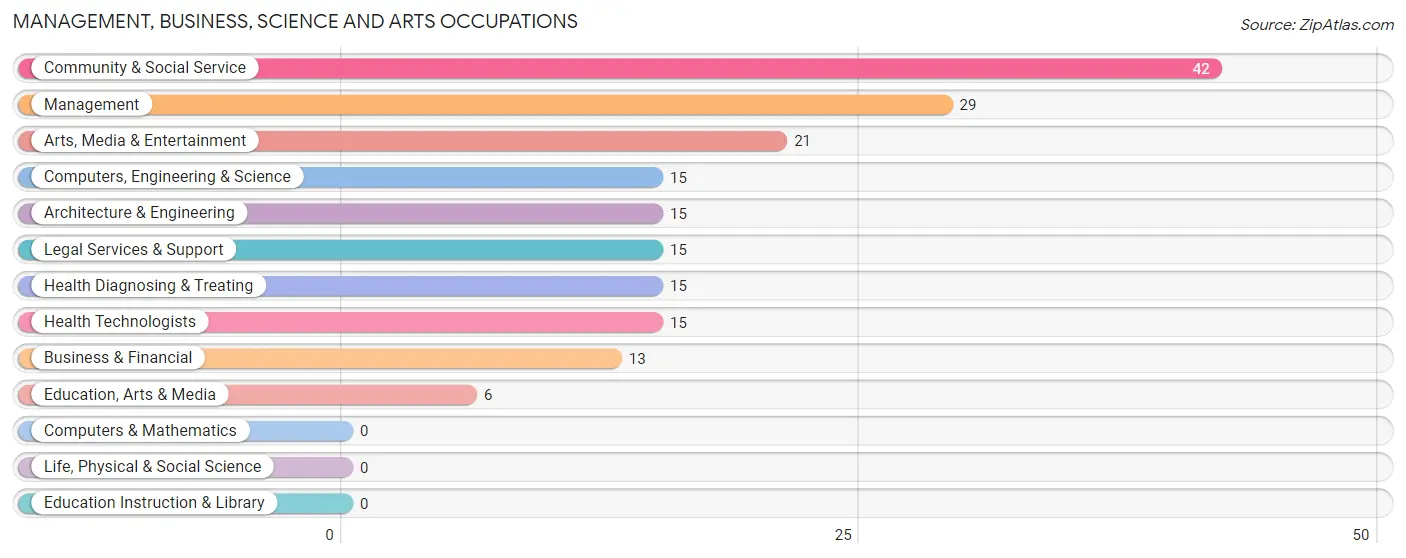
Management, Business, Science and Arts Occupations
The most common Management, Business, Science and Arts occupations in Millingport are Community & Social Service (42 | 13.7%), Management (29 | 9.5%), Arts, Media & Entertainment (21 | 6.9%), Computers, Engineering & Science (15 | 4.9%), and Architecture & Engineering (15 | 4.9%).
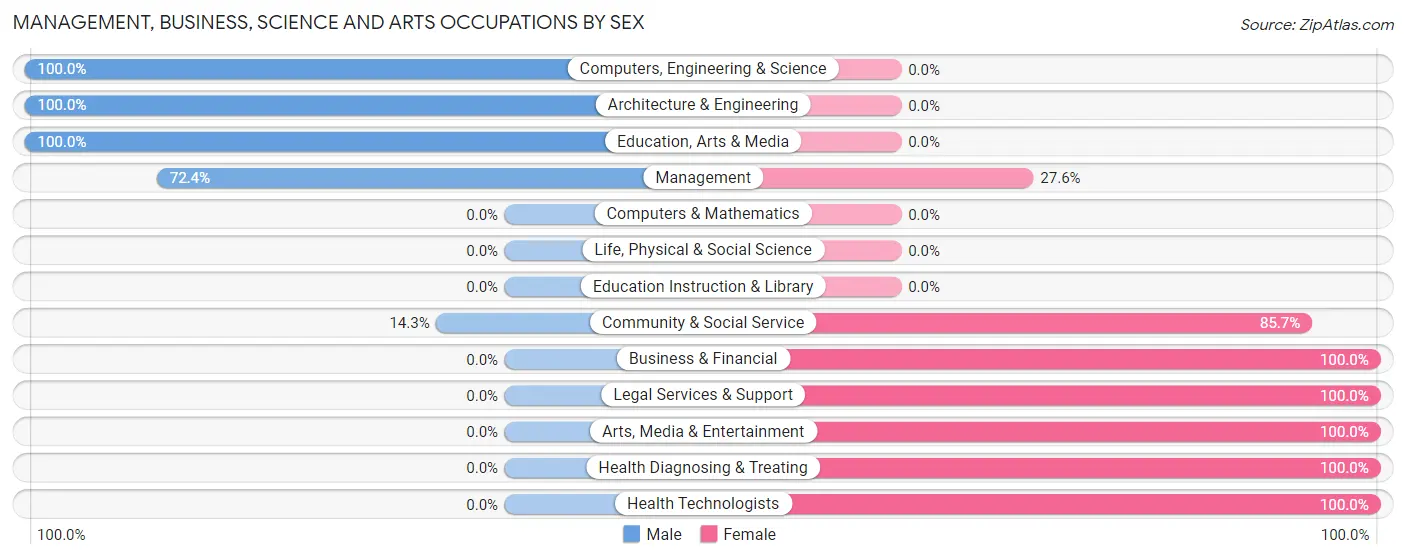
Management, Business, Science and Arts Occupations by Sex
Within the Management, Business, Science and Arts occupations in Millingport, the most male-oriented occupations are Computers, Engineering & Science (100.0%), Architecture & Engineering (100.0%), and Education, Arts & Media (100.0%), while the most female-oriented occupations are Business & Financial (100.0%), Legal Services & Support (100.0%), and Arts, Media & Entertainment (100.0%).
| Occupation | Male | Female |
| Management | 21 (72.4%) | 8 (27.6%) |
| Business & Financial | 0 (0.0%) | 13 (100.0%) |
| Computers, Engineering & Science | 15 (100.0%) | 0 (0.0%) |
| Computers & Mathematics | 0 (0.0%) | 0 (0.0%) |
| Architecture & Engineering | 15 (100.0%) | 0 (0.0%) |
| Life, Physical & Social Science | 0 (0.0%) | 0 (0.0%) |
| Community & Social Service | 6 (14.3%) | 36 (85.7%) |
| Education, Arts & Media | 6 (100.0%) | 0 (0.0%) |
| Legal Services & Support | 0 (0.0%) | 15 (100.0%) |
| Education Instruction & Library | 0 (0.0%) | 0 (0.0%) |
| Arts, Media & Entertainment | 0 (0.0%) | 21 (100.0%) |
| Health Diagnosing & Treating | 0 (0.0%) | 15 (100.0%) |
| Health Technologists | 0 (0.0%) | 15 (100.0%) |
| Total (Category) | 42 (36.8%) | 72 (63.2%) |
| Total (Overall) | 150 (49.0%) | 156 (51.0%) |
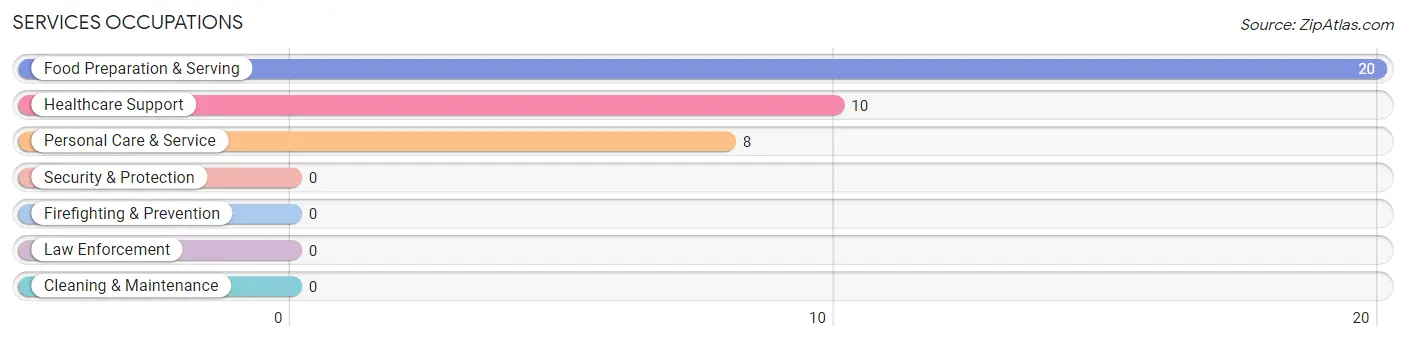
Services Occupations
The most common Services occupations in Millingport are Food Preparation & Serving (20 | 6.5%), Healthcare Support (10 | 3.3%), and Personal Care & Service (8 | 2.6%).
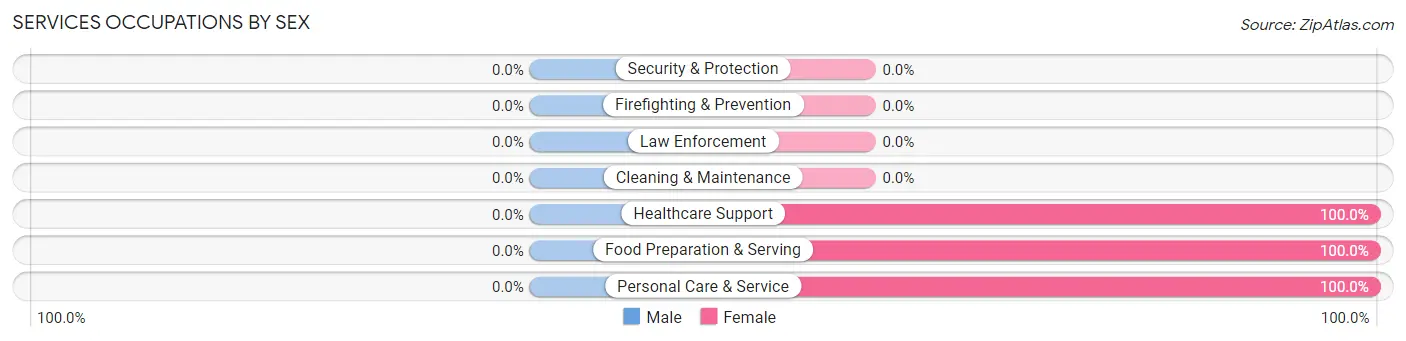
Services Occupations by Sex
| Occupation | Male | Female |
| Healthcare Support | 0 (0.0%) | 10 (100.0%) |
| Security & Protection | 0 (0.0%) | 0 (0.0%) |
| Firefighting & Prevention | 0 (0.0%) | 0 (0.0%) |
| Law Enforcement | 0 (0.0%) | 0 (0.0%) |
| Food Preparation & Serving | 0 (0.0%) | 20 (100.0%) |
| Cleaning & Maintenance | 0 (0.0%) | 0 (0.0%) |
| Personal Care & Service | 0 (0.0%) | 8 (100.0%) |
| Total (Category) | 0 (0.0%) | 38 (100.0%) |
| Total (Overall) | 150 (49.0%) | 156 (51.0%) |
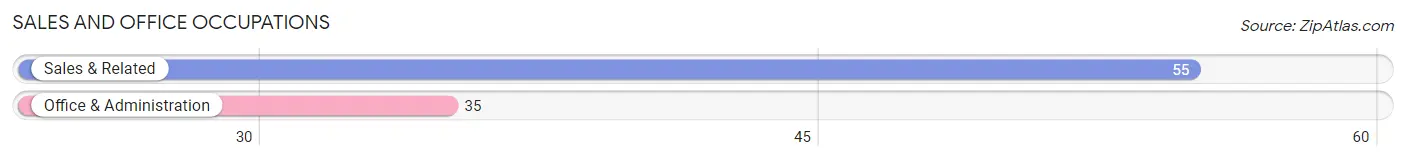
Sales and Office Occupations
The most common Sales and Office occupations in Millingport are Sales & Related (55 | 18.0%), and Office & Administration (35 | 11.4%).
Sales and Office Occupations by Sex

| Occupation | Male | Female |
| Sales & Related | 44 (80.0%) | 11 (20.0%) |
| Office & Administration | 0 (0.0%) | 35 (100.0%) |
| Total (Category) | 44 (48.9%) | 46 (51.1%) |
| Total (Overall) | 150 (49.0%) | 156 (51.0%) |
Natural Resources, Construction and Maintenance Occupations
The most common Natural Resources, Construction and Maintenance occupations in Millingport are Construction & Extraction (30 | 9.8%), and Installation, Maintenance & Repair (10 | 3.3%).
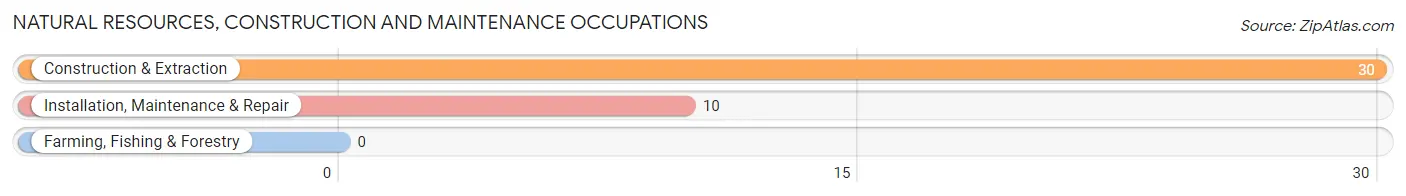
Natural Resources, Construction and Maintenance Occupations by Sex

| Occupation | Male | Female |
| Farming, Fishing & Forestry | 0 (0.0%) | 0 (0.0%) |
| Construction & Extraction | 30 (100.0%) | 0 (0.0%) |
| Installation, Maintenance & Repair | 10 (100.0%) | 0 (0.0%) |
| Total (Category) | 40 (100.0%) | 0 (0.0%) |
| Total (Overall) | 150 (49.0%) | 156 (51.0%) |
Production, Transportation and Moving Occupations
The most common Production, Transportation and Moving occupations in Millingport are Production (18 | 5.9%), and Transportation (6 | 2.0%).
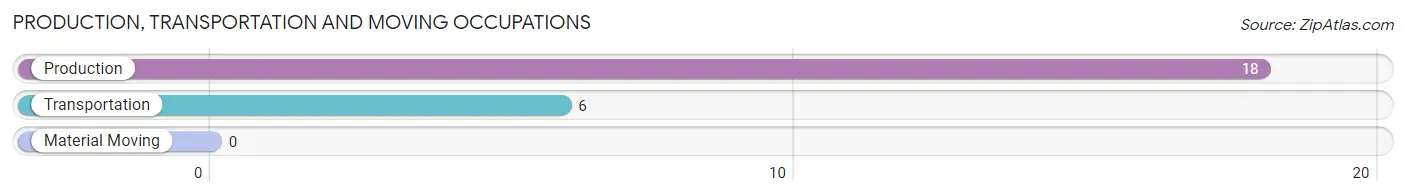
Production, Transportation and Moving Occupations by Sex
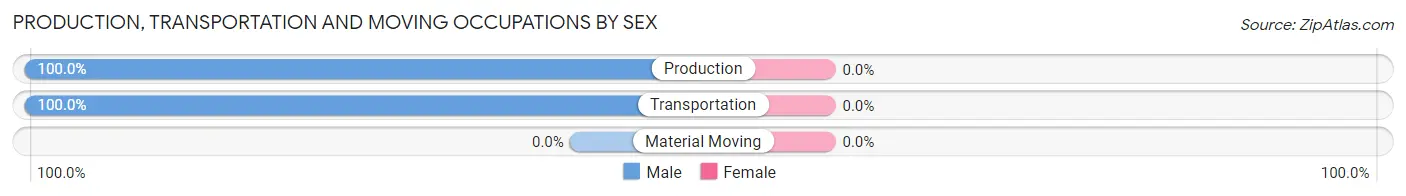
| Occupation | Male | Female |
| Production | 18 (100.0%) | 0 (0.0%) |
| Transportation | 6 (100.0%) | 0 (0.0%) |
| Material Moving | 0 (0.0%) | 0 (0.0%) |
| Total (Category) | 24 (100.0%) | 0 (0.0%) |
| Total (Overall) | 150 (49.0%) | 156 (51.0%) |
Employment Industries by Sex in Millingport
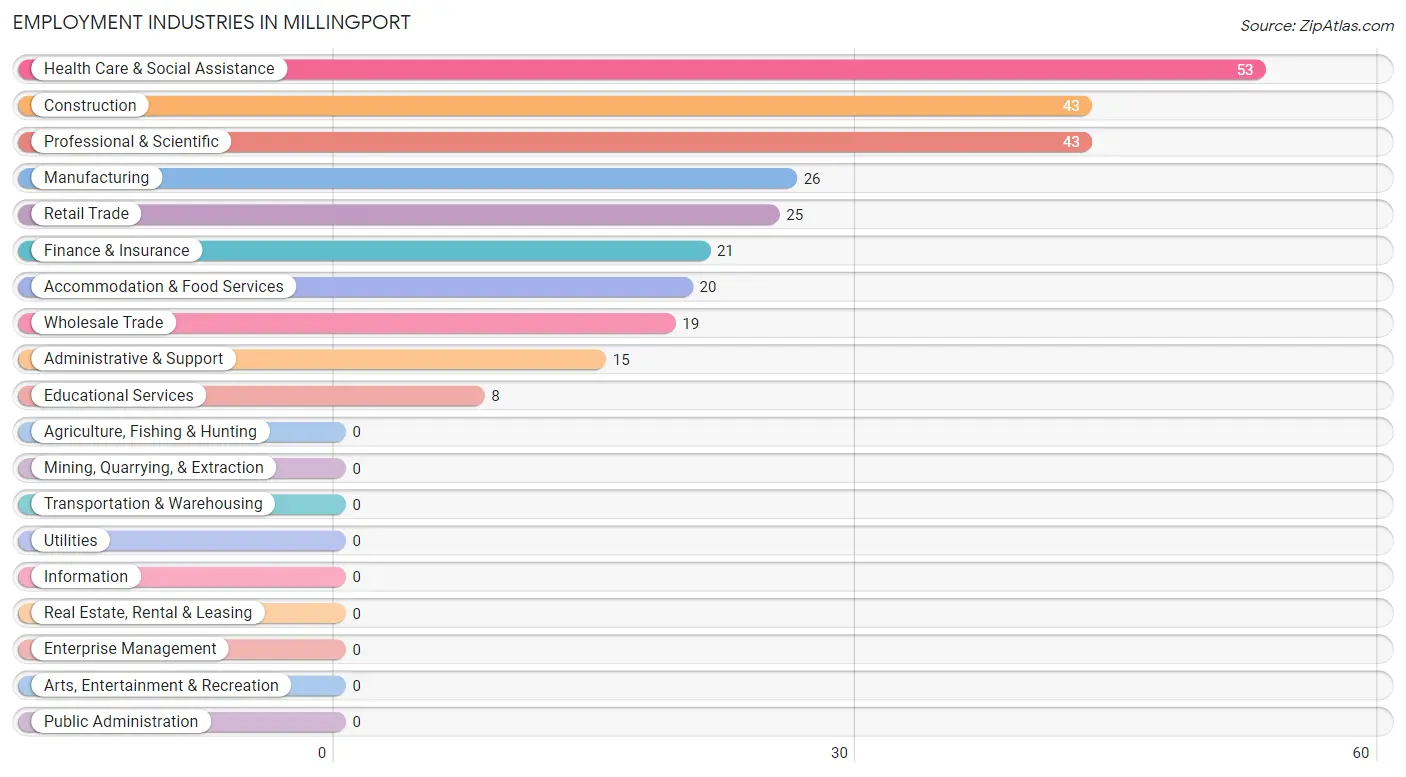
Employment Industries in Millingport
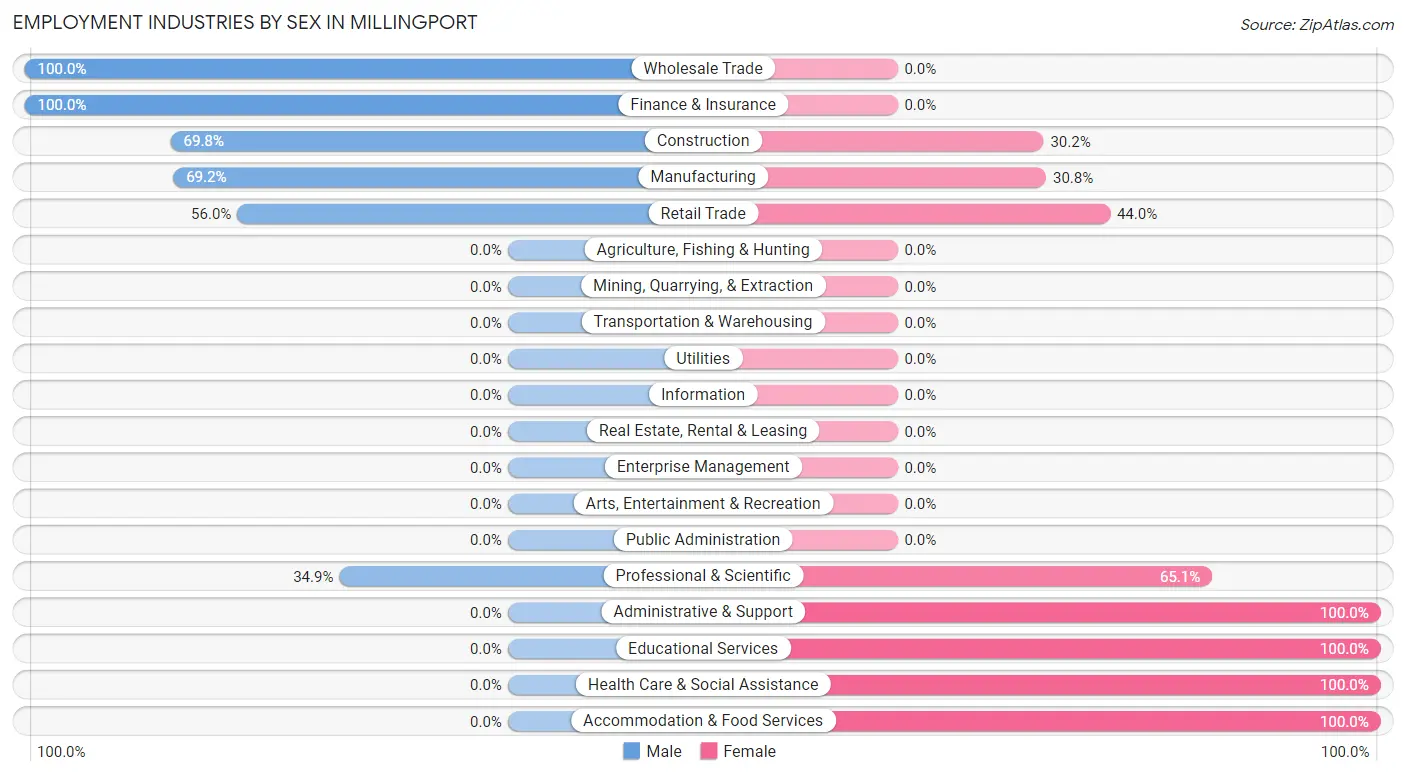
The major employment industries in Millingport include Health Care & Social Assistance (53 | 17.3%), Construction (43 | 14.1%), Professional & Scientific (43 | 14.1%), Manufacturing (26 | 8.5%), and Retail Trade (25 | 8.2%).
Employment Industries by Sex in Millingport
The Millingport industries that see more men than women are Wholesale Trade (100.0%), Finance & Insurance (100.0%), and Construction (69.8%), whereas the industries that tend to have a higher number of women are Administrative & Support (100.0%), Educational Services (100.0%), and Health Care & Social Assistance (100.0%).
| Industry | Male | Female |
| Agriculture, Fishing & Hunting | 0 (0.0%) | 0 (0.0%) |
| Mining, Quarrying, & Extraction | 0 (0.0%) | 0 (0.0%) |
| Construction | 30 (69.8%) | 13 (30.2%) |
| Manufacturing | 18 (69.2%) | 8 (30.8%) |
| Wholesale Trade | 19 (100.0%) | 0 (0.0%) |
| Retail Trade | 14 (56.0%) | 11 (44.0%) |
| Transportation & Warehousing | 0 (0.0%) | 0 (0.0%) |
| Utilities | 0 (0.0%) | 0 (0.0%) |
| Information | 0 (0.0%) | 0 (0.0%) |
| Finance & Insurance | 21 (100.0%) | 0 (0.0%) |
| Real Estate, Rental & Leasing | 0 (0.0%) | 0 (0.0%) |
| Professional & Scientific | 15 (34.9%) | 28 (65.1%) |
| Enterprise Management | 0 (0.0%) | 0 (0.0%) |
| Administrative & Support | 0 (0.0%) | 15 (100.0%) |
| Educational Services | 0 (0.0%) | 8 (100.0%) |
| Health Care & Social Assistance | 0 (0.0%) | 53 (100.0%) |
| Arts, Entertainment & Recreation | 0 (0.0%) | 0 (0.0%) |
| Accommodation & Food Services | 0 (0.0%) | 20 (100.0%) |
| Public Administration | 0 (0.0%) | 0 (0.0%) |
| Total | 150 (49.0%) | 156 (51.0%) |
Education in Millingport
School Enrollment in Millingport
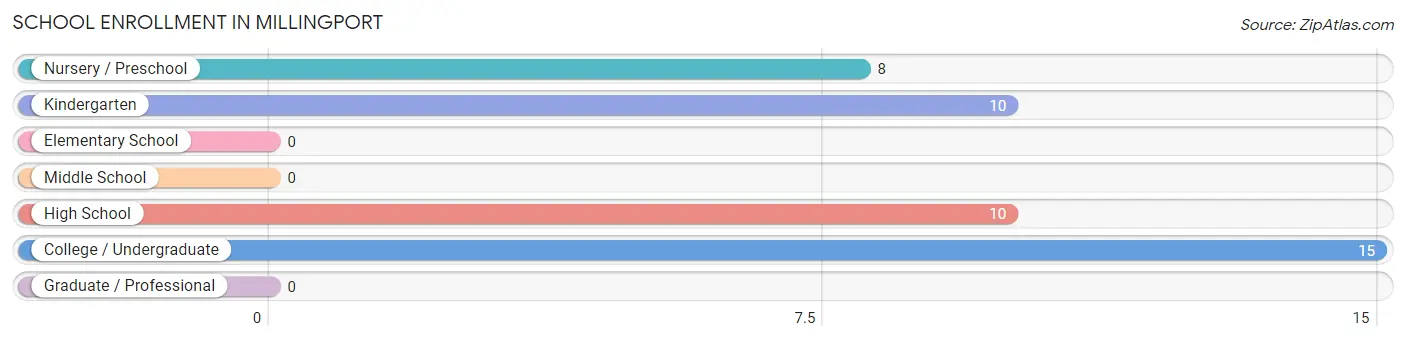
The most common levels of schooling among the 43 students in Millingport are college / undergraduate (15 | 34.9%), kindergarten (10 | 23.3%), and high school (10 | 23.3%).
| School Level | # Students | % Students |
| Nursery / Preschool | 8 | 18.6% |
| Kindergarten | 10 | 23.3% |
| Elementary School | 0 | 0.0% |
| Middle School | 0 | 0.0% |
| High School | 10 | 23.3% |
| College / Undergraduate | 15 | 34.9% |
| Graduate / Professional | 0 | 0.0% |
| Total | 43 | 100.0% |
School Enrollment by Age by Funding Source in Millingport
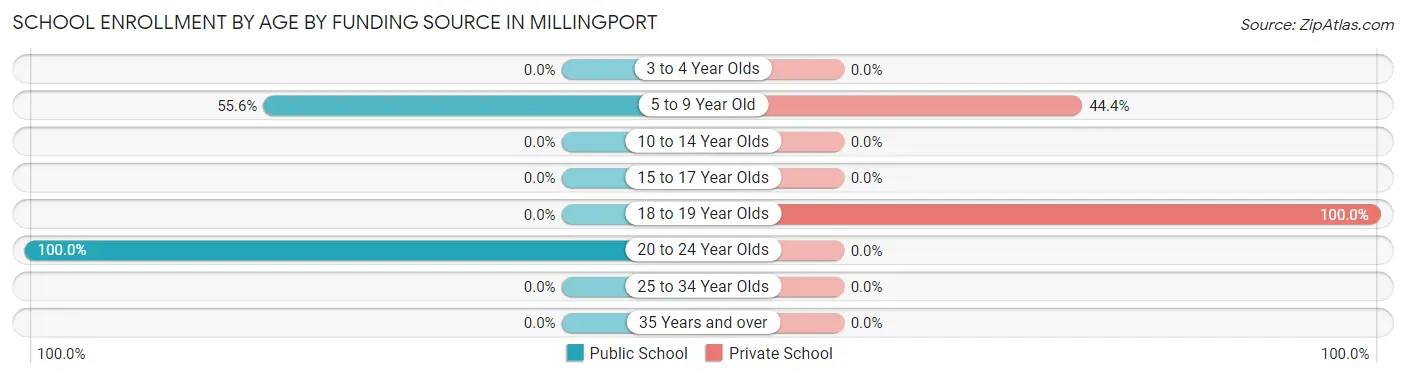
Out of a total of 43 students who are enrolled in schools in Millingport, 18 (41.9%) attend a private institution, while the remaining 25 (58.1%) are enrolled in public schools. The age group of 18 to 19 year olds has the highest likelihood of being enrolled in private schools, with 10 (100.0% in the age bracket) enrolled. Conversely, the age group of 20 to 24 year olds has the lowest likelihood of being enrolled in a private school, with 15 (100.0% in the age bracket) attending a public institution.
| Age Bracket | Public School | Private School |
| 3 to 4 Year Olds | 0 (0.0%) | 0 (0.0%) |
| 5 to 9 Year Old | 10 (55.6%) | 8 (44.4%) |
| 10 to 14 Year Olds | 0 (0.0%) | 0 (0.0%) |
| 15 to 17 Year Olds | 0 (0.0%) | 0 (0.0%) |
| 18 to 19 Year Olds | 0 (0.0%) | 10 (100.0%) |
| 20 to 24 Year Olds | 15 (100.0%) | 0 (0.0%) |
| 25 to 34 Year Olds | 0 (0.0%) | 0 (0.0%) |
| 35 Years and over | 0 (0.0%) | 0 (0.0%) |
| Total | 25 (58.1%) | 18 (41.9%) |
Educational Attainment by Field of Study in Millingport
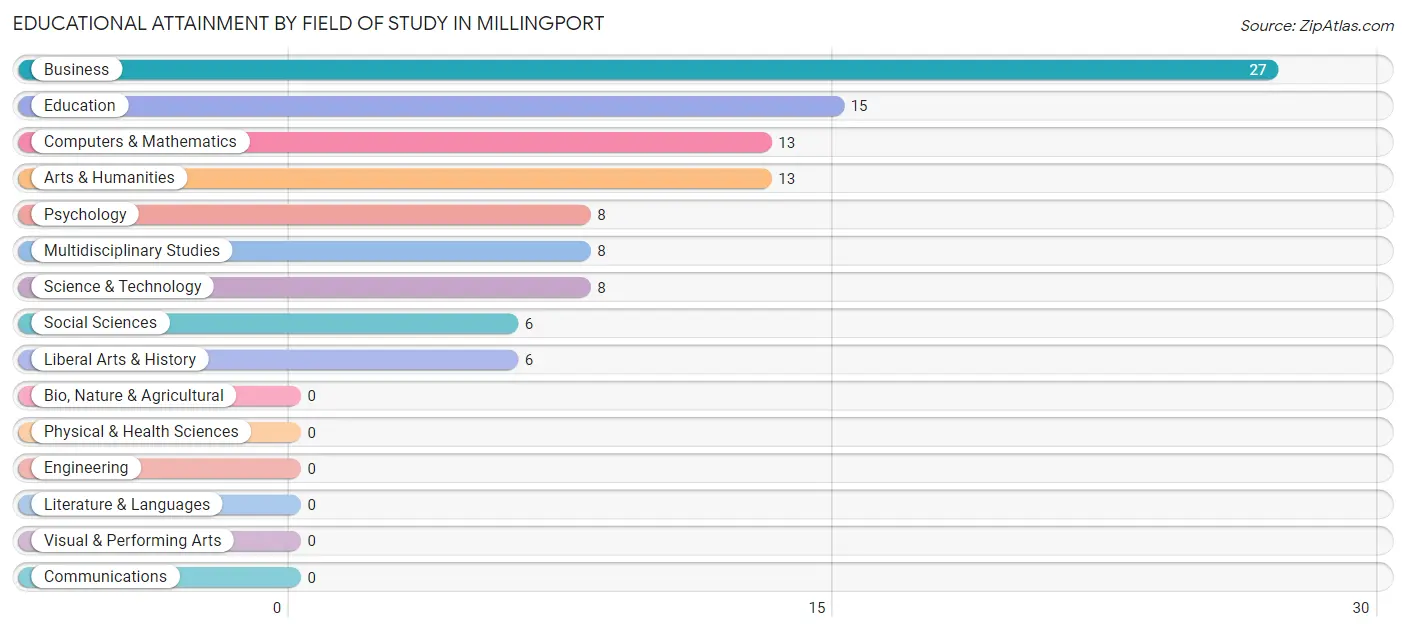
Business (27 | 26.0%), education (15 | 14.4%), computers & mathematics (13 | 12.5%), arts & humanities (13 | 12.5%), and psychology (8 | 7.7%) are the most common fields of study among 104 individuals in Millingport who have obtained a bachelor's degree or higher.
| Field of Study | # Graduates | % Graduates |
| Computers & Mathematics | 13 | 12.5% |
| Bio, Nature & Agricultural | 0 | 0.0% |
| Physical & Health Sciences | 0 | 0.0% |
| Psychology | 8 | 7.7% |
| Social Sciences | 6 | 5.8% |
| Engineering | 0 | 0.0% |
| Multidisciplinary Studies | 8 | 7.7% |
| Science & Technology | 8 | 7.7% |
| Business | 27 | 26.0% |
| Education | 15 | 14.4% |
| Literature & Languages | 0 | 0.0% |
| Liberal Arts & History | 6 | 5.8% |
| Visual & Performing Arts | 0 | 0.0% |
| Communications | 0 | 0.0% |
| Arts & Humanities | 13 | 12.5% |
| Total | 104 | 100.0% |
Transportation & Commute in Millingport
Vehicle Availability by Sex in Millingport
The most prevalent vehicle ownership categories in Millingport are males with 2 vehicles (64, accounting for 42.7%) and females with 2 vehicles (81, making up 41.0%).
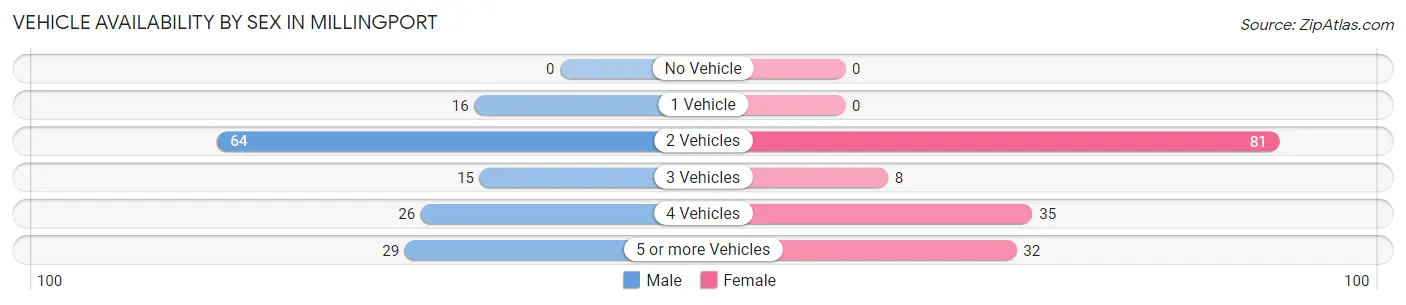
| Vehicles Available | Male | Female |
| No Vehicle | 0 (0.0%) | 0 (0.0%) |
| 1 Vehicle | 16 (10.7%) | 0 (0.0%) |
| 2 Vehicles | 64 (42.7%) | 81 (51.9%) |
| 3 Vehicles | 15 (10.0%) | 8 (5.1%) |
| 4 Vehicles | 26 (17.3%) | 35 (22.4%) |
| 5 or more Vehicles | 29 (19.3%) | 32 (20.5%) |
| Total | 150 (100.0%) | 156 (100.0%) |
Commute Time in Millingport
The most frequently occuring commute durations in Millingport are 45 to 59 minutes (61 commuters, 22.6%), 60 to 89 minutes (47 commuters, 17.4%), and 15 to 19 minutes (44 commuters, 16.3%).
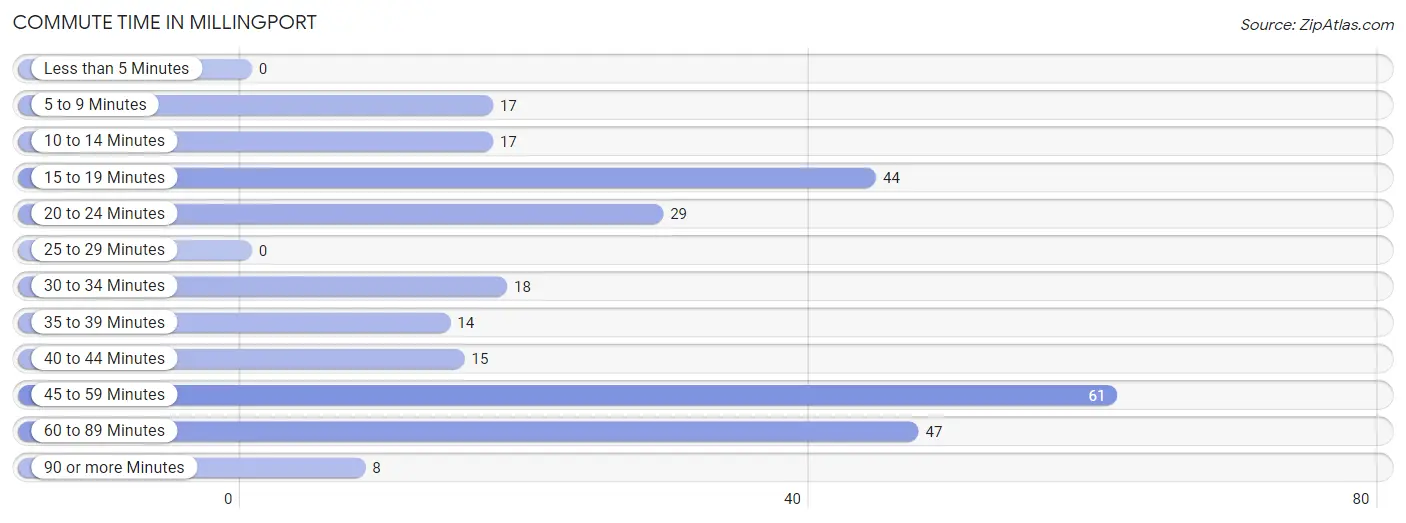
| Commute Time | # Commuters | % Commuters |
| Less than 5 Minutes | 0 | 0.0% |
| 5 to 9 Minutes | 17 | 6.3% |
| 10 to 14 Minutes | 17 | 6.3% |
| 15 to 19 Minutes | 44 | 16.3% |
| 20 to 24 Minutes | 29 | 10.7% |
| 25 to 29 Minutes | 0 | 0.0% |
| 30 to 34 Minutes | 18 | 6.7% |
| 35 to 39 Minutes | 14 | 5.2% |
| 40 to 44 Minutes | 15 | 5.6% |
| 45 to 59 Minutes | 61 | 22.6% |
| 60 to 89 Minutes | 47 | 17.4% |
| 90 or more Minutes | 8 | 3.0% |
Commute Time by Sex in Millingport
The most common commute times in Millingport are 45 to 59 minutes (37 commuters, 28.7%) for males and 60 to 89 minutes (38 commuters, 27.0%) for females.
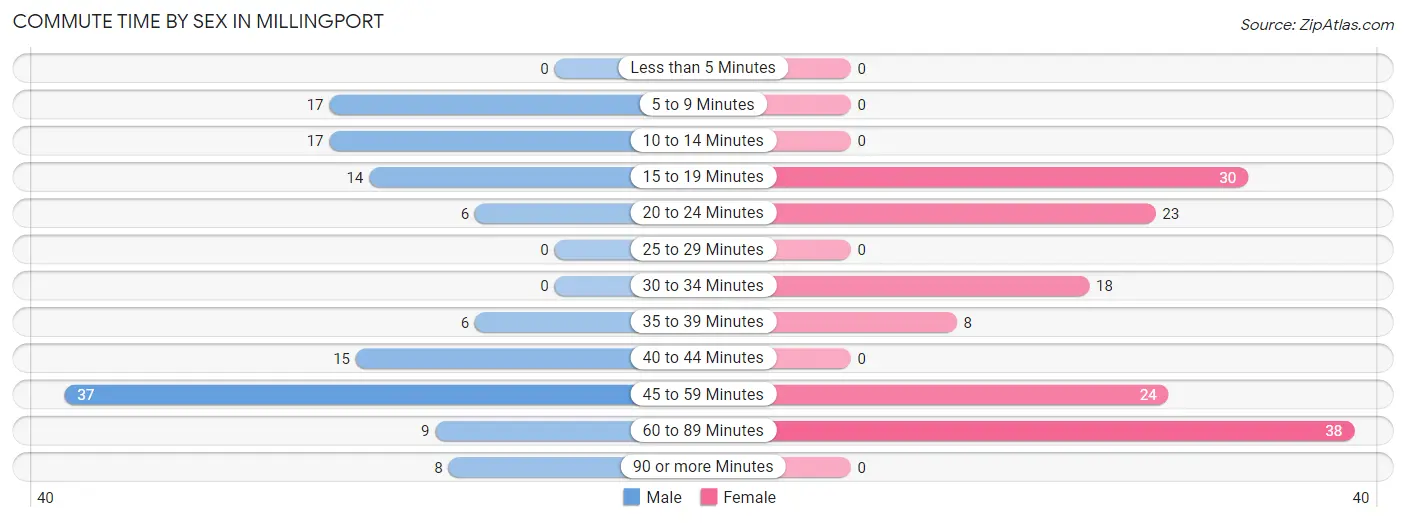
| Commute Time | Male | Female |
| Less than 5 Minutes | 0 (0.0%) | 0 (0.0%) |
| 5 to 9 Minutes | 17 (13.2%) | 0 (0.0%) |
| 10 to 14 Minutes | 17 (13.2%) | 0 (0.0%) |
| 15 to 19 Minutes | 14 (10.8%) | 30 (21.3%) |
| 20 to 24 Minutes | 6 (4.6%) | 23 (16.3%) |
| 25 to 29 Minutes | 0 (0.0%) | 0 (0.0%) |
| 30 to 34 Minutes | 0 (0.0%) | 18 (12.8%) |
| 35 to 39 Minutes | 6 (4.6%) | 8 (5.7%) |
| 40 to 44 Minutes | 15 (11.6%) | 0 (0.0%) |
| 45 to 59 Minutes | 37 (28.7%) | 24 (17.0%) |
| 60 to 89 Minutes | 9 (7.0%) | 38 (27.0%) |
| 90 or more Minutes | 8 (6.2%) | 0 (0.0%) |
Time of Departure to Work by Sex in Millingport
The most frequent times of departure to work in Millingport are 6:00 AM to 6:29 AM (31, 24.0%) for males and 7:00 AM to 7:29 AM (24, 17.0%) for females.
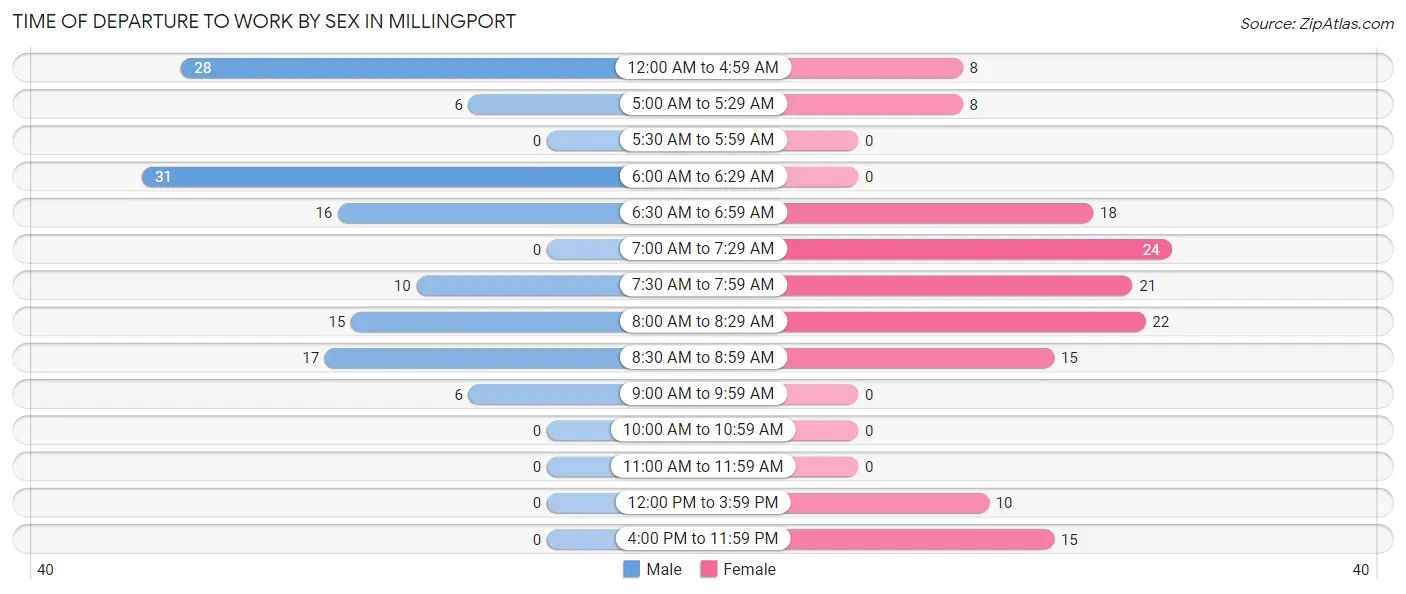
| Time of Departure | Male | Female |
| 12:00 AM to 4:59 AM | 28 (21.7%) | 8 (5.7%) |
| 5:00 AM to 5:29 AM | 6 (4.6%) | 8 (5.7%) |
| 5:30 AM to 5:59 AM | 0 (0.0%) | 0 (0.0%) |
| 6:00 AM to 6:29 AM | 31 (24.0%) | 0 (0.0%) |
| 6:30 AM to 6:59 AM | 16 (12.4%) | 18 (12.8%) |
| 7:00 AM to 7:29 AM | 0 (0.0%) | 24 (17.0%) |
| 7:30 AM to 7:59 AM | 10 (7.7%) | 21 (14.9%) |
| 8:00 AM to 8:29 AM | 15 (11.6%) | 22 (15.6%) |
| 8:30 AM to 8:59 AM | 17 (13.2%) | 15 (10.6%) |
| 9:00 AM to 9:59 AM | 6 (4.6%) | 0 (0.0%) |
| 10:00 AM to 10:59 AM | 0 (0.0%) | 0 (0.0%) |
| 11:00 AM to 11:59 AM | 0 (0.0%) | 0 (0.0%) |
| 12:00 PM to 3:59 PM | 0 (0.0%) | 10 (7.1%) |
| 4:00 PM to 11:59 PM | 0 (0.0%) | 15 (10.6%) |
| Total | 129 (100.0%) | 141 (100.0%) |
Housing Occupancy in Millingport
Occupancy by Ownership in Millingport
Of the total 206 dwellings in Millingport, owner-occupied units account for 196 (95.2%), while renter-occupied units make up 10 (4.9%).
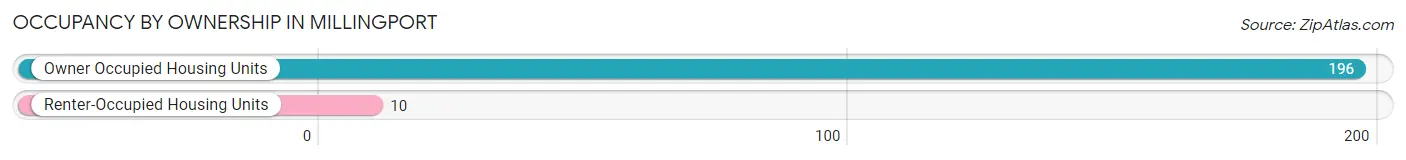
| Occupancy | # Housing Units | % Housing Units |
| Owner Occupied Housing Units | 196 | 95.2% |
| Renter-Occupied Housing Units | 10 | 4.9% |
| Total Occupied Housing Units | 206 | 100.0% |
Occupancy by Household Size in Millingport
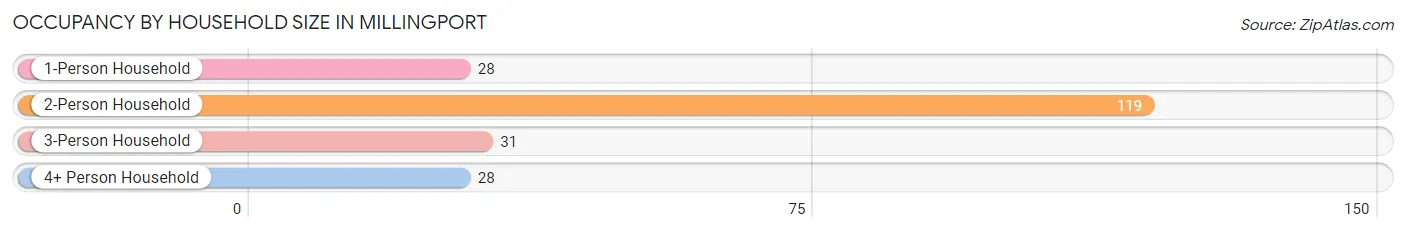
| Household Size | # Housing Units | % Housing Units |
| 1-Person Household | 28 | 13.6% |
| 2-Person Household | 119 | 57.8% |
| 3-Person Household | 31 | 15.0% |
| 4+ Person Household | 28 | 13.6% |
| Total Housing Units | 206 | 100.0% |
Occupancy by Ownership by Household Size in Millingport
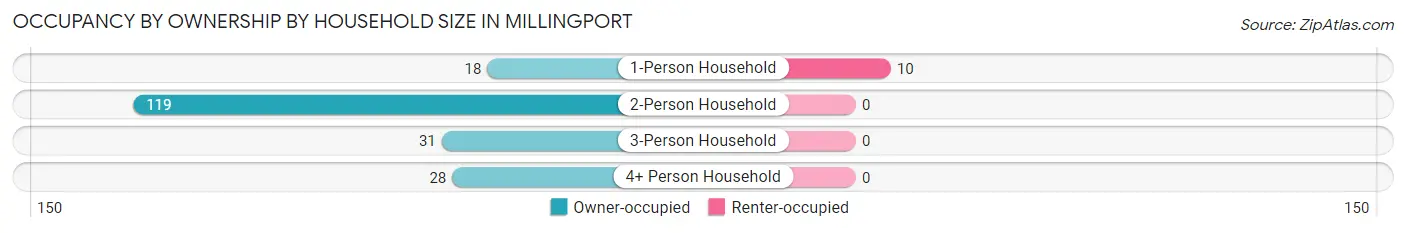
| Household Size | Owner-occupied | Renter-occupied |
| 1-Person Household | 18 (64.3%) | 10 (35.7%) |
| 2-Person Household | 119 (100.0%) | 0 (0.0%) |
| 3-Person Household | 31 (100.0%) | 0 (0.0%) |
| 4+ Person Household | 28 (100.0%) | 0 (0.0%) |
| Total Housing Units | 196 (95.2%) | 10 (4.9%) |
Occupancy by Educational Attainment in Millingport
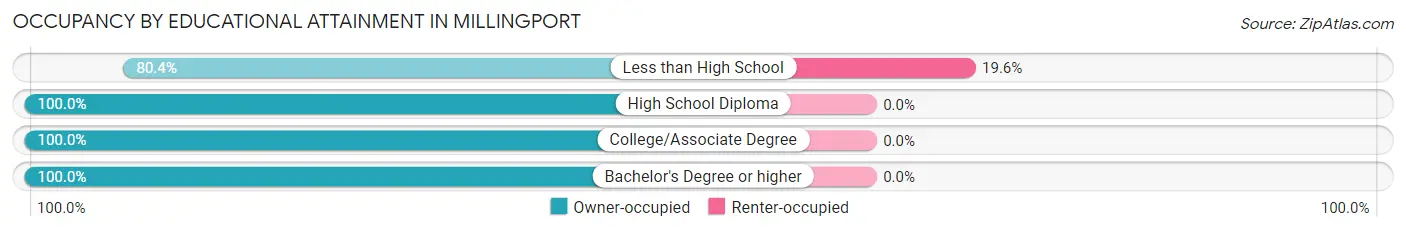
| Household Size | Owner-occupied | Renter-occupied |
| Less than High School | 41 (80.4%) | 10 (19.6%) |
| High School Diploma | 16 (100.0%) | 0 (0.0%) |
| College/Associate Degree | 76 (100.0%) | 0 (0.0%) |
| Bachelor's Degree or higher | 63 (100.0%) | 0 (0.0%) |
Occupancy by Age of Householder in Millingport
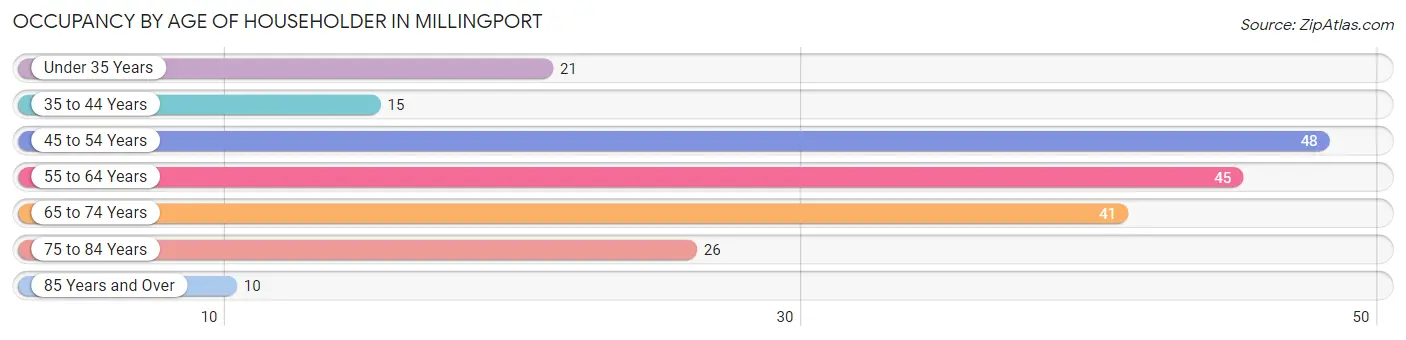
| Age Bracket | # Households | % Households |
| Under 35 Years | 21 | 10.2% |
| 35 to 44 Years | 15 | 7.3% |
| 45 to 54 Years | 48 | 23.3% |
| 55 to 64 Years | 45 | 21.8% |
| 65 to 74 Years | 41 | 19.9% |
| 75 to 84 Years | 26 | 12.6% |
| 85 Years and Over | 10 | 4.9% |
| Total | 206 | 100.0% |
Housing Finances in Millingport
Median Income by Occupancy in Millingport
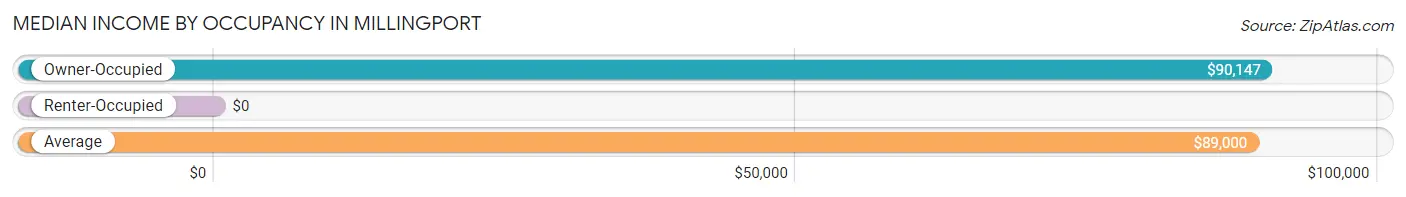
| Occupancy Type | # Households | Median Income |
| Owner-Occupied | 196 (95.2%) | $90,147 |
| Renter-Occupied | 10 (4.9%) | $0 |
| Average | 206 (100.0%) | $89,000 |
Occupancy by Householder Income Bracket in Millingport
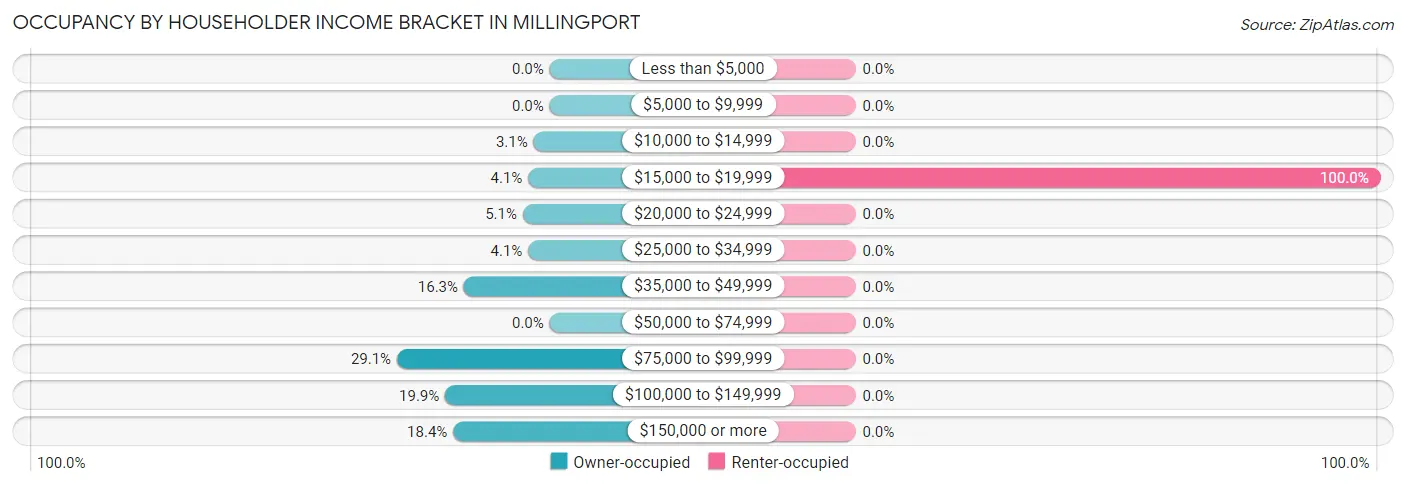
| Income Bracket | Owner-occupied | Renter-occupied |
| Less than $5,000 | 0 (0.0%) | 0 (0.0%) |
| $5,000 to $9,999 | 0 (0.0%) | 0 (0.0%) |
| $10,000 to $14,999 | 6 (3.1%) | 0 (0.0%) |
| $15,000 to $19,999 | 8 (4.1%) | 10 (100.0%) |
| $20,000 to $24,999 | 10 (5.1%) | 0 (0.0%) |
| $25,000 to $34,999 | 8 (4.1%) | 0 (0.0%) |
| $35,000 to $49,999 | 32 (16.3%) | 0 (0.0%) |
| $50,000 to $74,999 | 0 (0.0%) | 0 (0.0%) |
| $75,000 to $99,999 | 57 (29.1%) | 0 (0.0%) |
| $100,000 to $149,999 | 39 (19.9%) | 0 (0.0%) |
| $150,000 or more | 36 (18.4%) | 0 (0.0%) |
| Total | 196 (100.0%) | 10 (100.0%) |
Monthly Housing Cost Tiers in Millingport
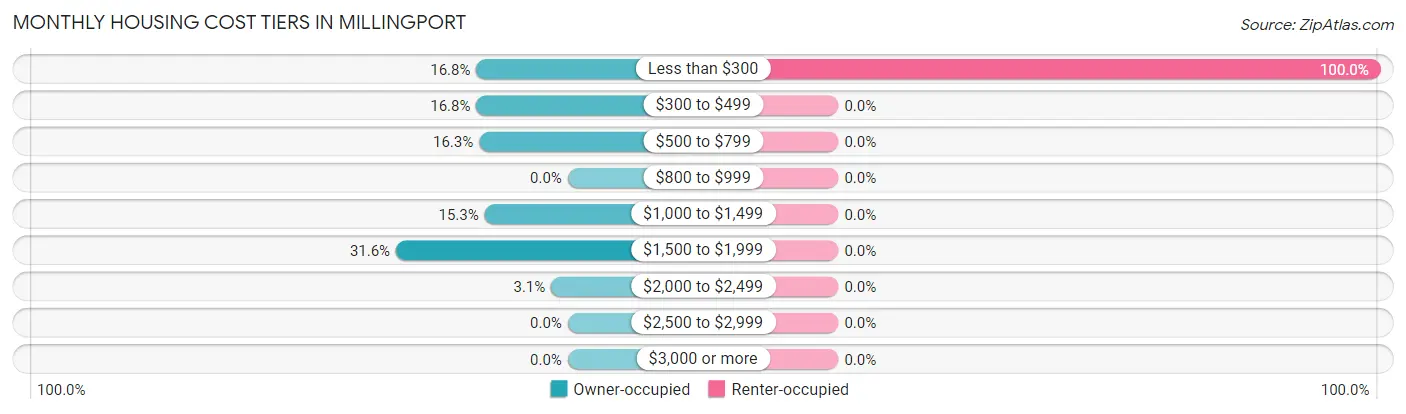
| Monthly Cost | Owner-occupied | Renter-occupied |
| Less than $300 | 33 (16.8%) | 10 (100.0%) |
| $300 to $499 | 33 (16.8%) | 0 (0.0%) |
| $500 to $799 | 32 (16.3%) | 0 (0.0%) |
| $800 to $999 | 0 (0.0%) | 0 (0.0%) |
| $1,000 to $1,499 | 30 (15.3%) | 0 (0.0%) |
| $1,500 to $1,999 | 62 (31.6%) | 0 (0.0%) |
| $2,000 to $2,499 | 6 (3.1%) | 0 (0.0%) |
| $2,500 to $2,999 | 0 (0.0%) | 0 (0.0%) |
| $3,000 or more | 0 (0.0%) | 0 (0.0%) |
| Total | 196 (100.0%) | 10 (100.0%) |
Physical Housing Characteristics in Millingport
Housing Structures in Millingport
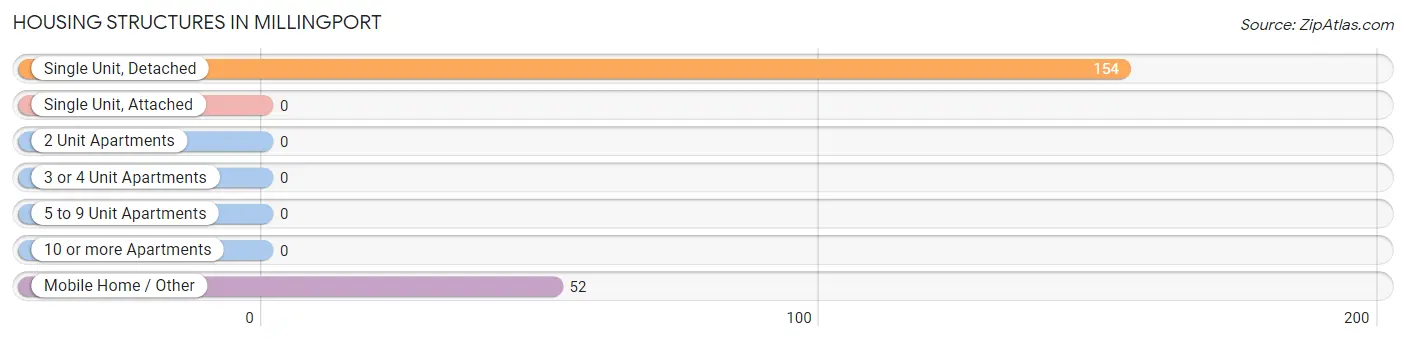
| Structure Type | # Housing Units | % Housing Units |
| Single Unit, Detached | 154 | 74.8% |
| Single Unit, Attached | 0 | 0.0% |
| 2 Unit Apartments | 0 | 0.0% |
| 3 or 4 Unit Apartments | 0 | 0.0% |
| 5 to 9 Unit Apartments | 0 | 0.0% |
| 10 or more Apartments | 0 | 0.0% |
| Mobile Home / Other | 52 | 25.2% |
| Total | 206 | 100.0% |
Housing Structures by Occupancy in Millingport
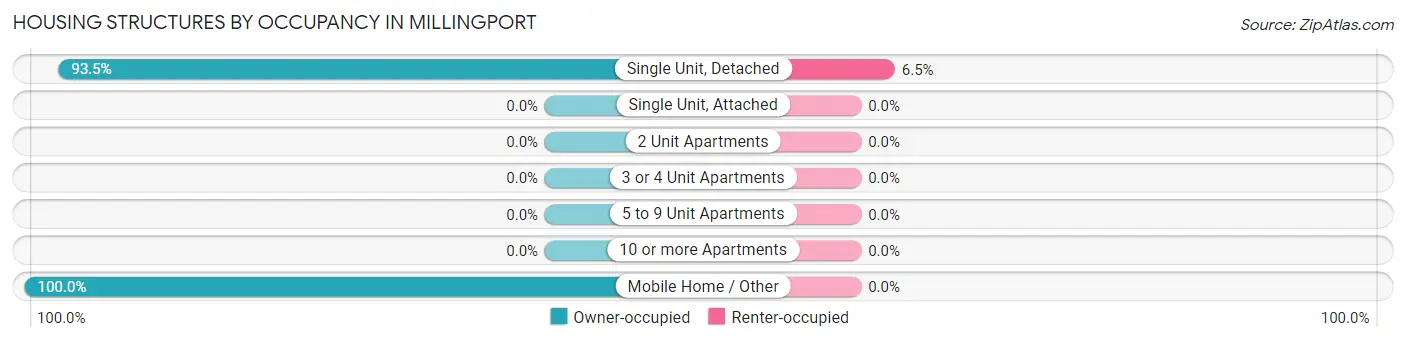
| Structure Type | Owner-occupied | Renter-occupied |
| Single Unit, Detached | 144 (93.5%) | 10 (6.5%) |
| Single Unit, Attached | 0 (0.0%) | 0 (0.0%) |
| 2 Unit Apartments | 0 (0.0%) | 0 (0.0%) |
| 3 or 4 Unit Apartments | 0 (0.0%) | 0 (0.0%) |
| 5 to 9 Unit Apartments | 0 (0.0%) | 0 (0.0%) |
| 10 or more Apartments | 0 (0.0%) | 0 (0.0%) |
| Mobile Home / Other | 52 (100.0%) | 0 (0.0%) |
| Total | 196 (95.2%) | 10 (4.9%) |
Housing Structures by Number of Rooms in Millingport
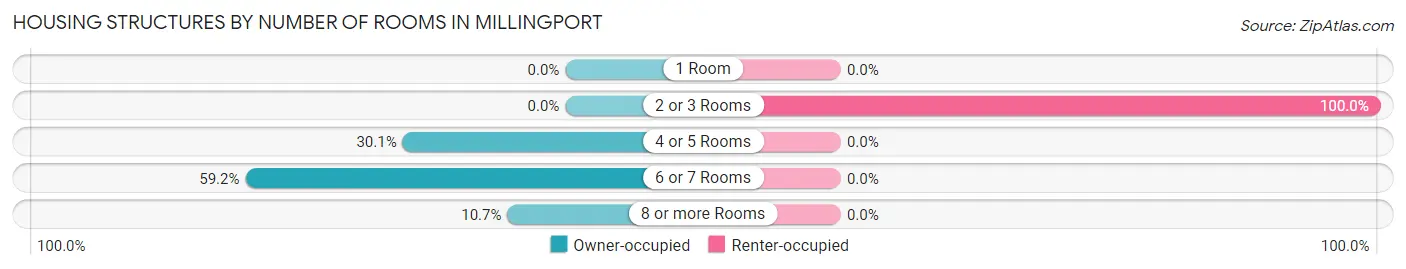
| Number of Rooms | Owner-occupied | Renter-occupied |
| 1 Room | 0 (0.0%) | 0 (0.0%) |
| 2 or 3 Rooms | 0 (0.0%) | 10 (100.0%) |
| 4 or 5 Rooms | 59 (30.1%) | 0 (0.0%) |
| 6 or 7 Rooms | 116 (59.2%) | 0 (0.0%) |
| 8 or more Rooms | 21 (10.7%) | 0 (0.0%) |
| Total | 196 (100.0%) | 10 (100.0%) |
Housing Structure by Heating Type in Millingport
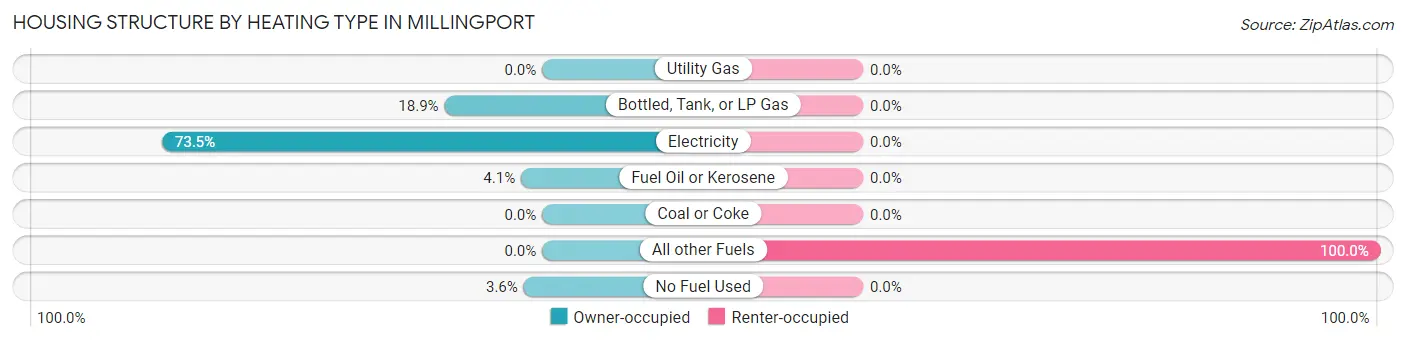
| Heating Type | Owner-occupied | Renter-occupied |
| Utility Gas | 0 (0.0%) | 0 (0.0%) |
| Bottled, Tank, or LP Gas | 37 (18.9%) | 0 (0.0%) |
| Electricity | 144 (73.5%) | 0 (0.0%) |
| Fuel Oil or Kerosene | 8 (4.1%) | 0 (0.0%) |
| Coal or Coke | 0 (0.0%) | 0 (0.0%) |
| All other Fuels | 0 (0.0%) | 10 (100.0%) |
| No Fuel Used | 7 (3.6%) | 0 (0.0%) |
| Total | 196 (100.0%) | 10 (100.0%) |
Household Vehicle Usage in Millingport
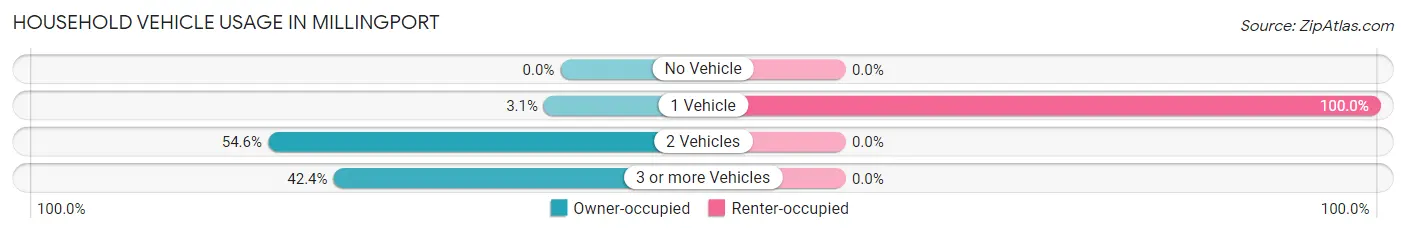
| Vehicles per Household | Owner-occupied | Renter-occupied |
| No Vehicle | 0 (0.0%) | 0 (0.0%) |
| 1 Vehicle | 6 (3.1%) | 10 (100.0%) |
| 2 Vehicles | 107 (54.6%) | 0 (0.0%) |
| 3 or more Vehicles | 83 (42.3%) | 0 (0.0%) |
| Total | 196 (100.0%) | 10 (100.0%) |
Real Estate & Mortgages in Millingport
Real Estate and Mortgage Overview in Millingport
| Characteristic | Without Mortgage | With Mortgage |
| Housing Units | 88 | 108 |
| Median Property Value | $172,600 | $150,000 |
| Median Household Income | $62,500 | $21 |
| Monthly Housing Costs | $433 | $0 |
| Real Estate Taxes | - | - |
Property Value by Mortgage Status in Millingport
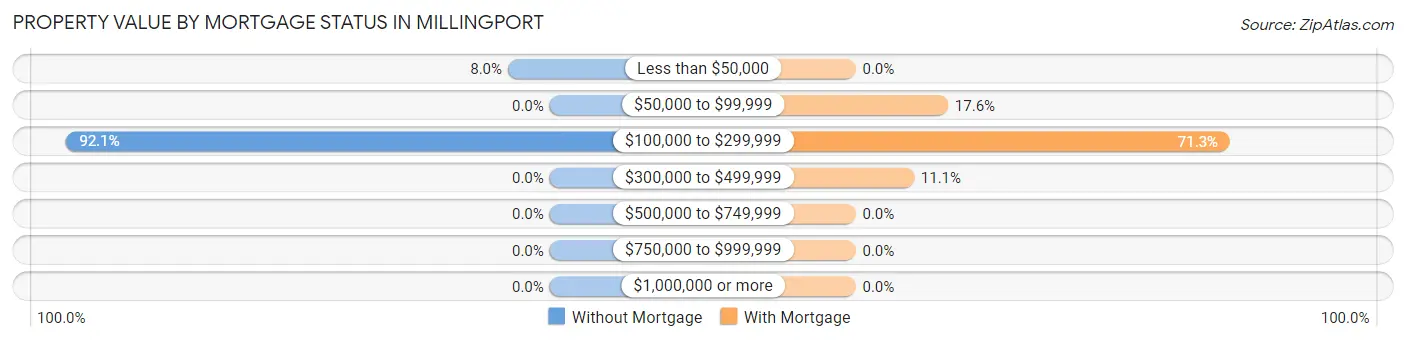
| Property Value | Without Mortgage | With Mortgage |
| Less than $50,000 | 7 (8.0%) | 0 (0.0%) |
| $50,000 to $99,999 | 0 (0.0%) | 19 (17.6%) |
| $100,000 to $299,999 | 81 (92.0%) | 77 (71.3%) |
| $300,000 to $499,999 | 0 (0.0%) | 12 (11.1%) |
| $500,000 to $749,999 | 0 (0.0%) | 0 (0.0%) |
| $750,000 to $999,999 | 0 (0.0%) | 0 (0.0%) |
| $1,000,000 or more | 0 (0.0%) | 0 (0.0%) |
| Total | 88 (100.0%) | 108 (100.0%) |
Household Income by Mortgage Status in Millingport
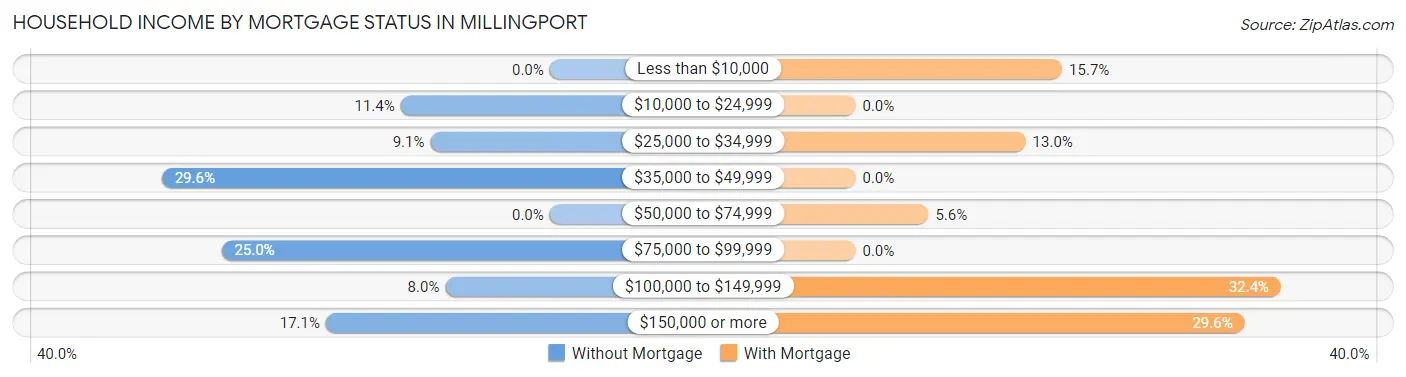
| Household Income | Without Mortgage | With Mortgage |
| Less than $10,000 | 0 (0.0%) | 17 (15.7%) |
| $10,000 to $24,999 | 10 (11.4%) | 0 (0.0%) |
| $25,000 to $34,999 | 8 (9.1%) | 14 (13.0%) |
| $35,000 to $49,999 | 26 (29.5%) | 0 (0.0%) |
| $50,000 to $74,999 | 0 (0.0%) | 6 (5.6%) |
| $75,000 to $99,999 | 22 (25.0%) | 0 (0.0%) |
| $100,000 to $149,999 | 7 (8.0%) | 35 (32.4%) |
| $150,000 or more | 15 (17.1%) | 32 (29.6%) |
| Total | 88 (100.0%) | 108 (100.0%) |
Property Value to Household Income Ratio in Millingport
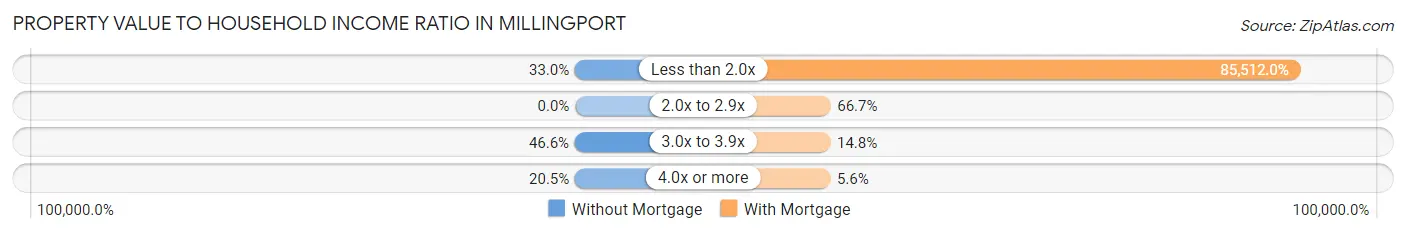
| Value-to-Income Ratio | Without Mortgage | With Mortgage |
| Less than 2.0x | 29 (33.0%) | 92,353 (85,512.0%) |
| 2.0x to 2.9x | 0 (0.0%) | 72 (66.7%) |
| 3.0x to 3.9x | 41 (46.6%) | 16 (14.8%) |
| 4.0x or more | 18 (20.4%) | 6 (5.6%) |
| Total | 88 (100.0%) | 108 (100.0%) |
Real Estate Taxes by Mortgage Status in Millingport
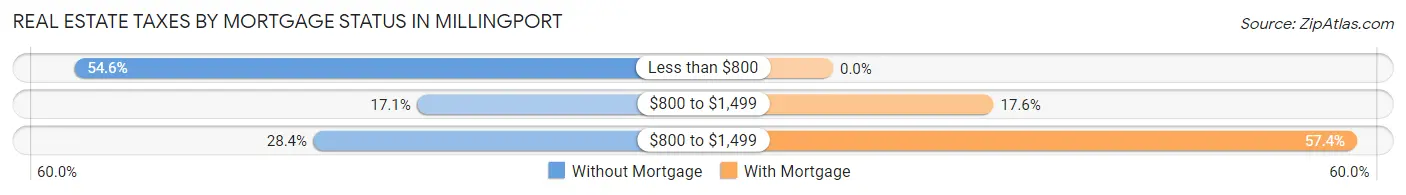
| Property Taxes | Without Mortgage | With Mortgage |
| Less than $800 | 48 (54.5%) | 0 (0.0%) |
| $800 to $1,499 | 15 (17.1%) | 19 (17.6%) |
| $800 to $1,499 | 25 (28.4%) | 62 (57.4%) |
| Total | 88 (100.0%) | 108 (100.0%) |
Health & Disability in Millingport
Health Insurance Coverage by Age in Millingport
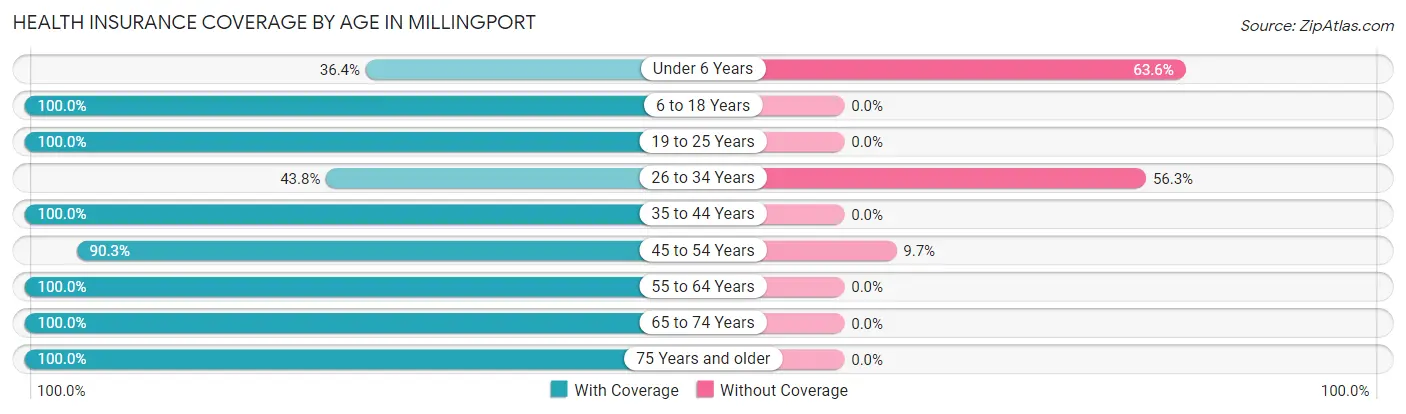
| Age Bracket | With Coverage | Without Coverage |
| Under 6 Years | 8 (36.4%) | 14 (63.6%) |
| 6 to 18 Years | 20 (100.0%) | 0 (0.0%) |
| 19 to 25 Years | 44 (100.0%) | 0 (0.0%) |
| 26 to 34 Years | 21 (43.8%) | 27 (56.2%) |
| 35 to 44 Years | 15 (100.0%) | 0 (0.0%) |
| 45 to 54 Years | 93 (90.3%) | 10 (9.7%) |
| 55 to 64 Years | 99 (100.0%) | 0 (0.0%) |
| 65 to 74 Years | 59 (100.0%) | 0 (0.0%) |
| 75 Years and older | 69 (100.0%) | 0 (0.0%) |
| Total | 428 (89.3%) | 51 (10.6%) |
Health Insurance Coverage by Citizenship Status in Millingport
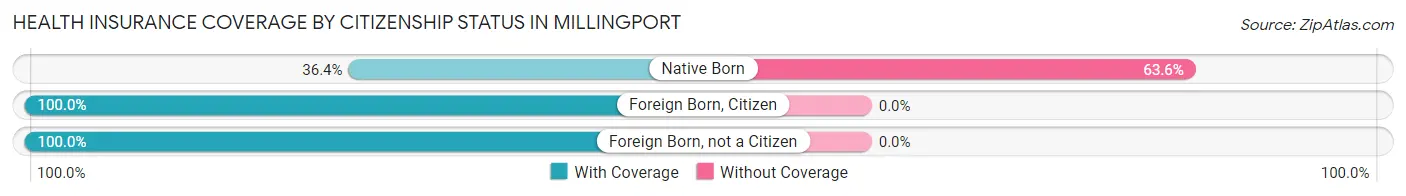
| Citizenship Status | With Coverage | Without Coverage |
| Native Born | 8 (36.4%) | 14 (63.6%) |
| Foreign Born, Citizen | 20 (100.0%) | 0 (0.0%) |
| Foreign Born, not a Citizen | 44 (100.0%) | 0 (0.0%) |
Health Insurance Coverage by Household Income in Millingport
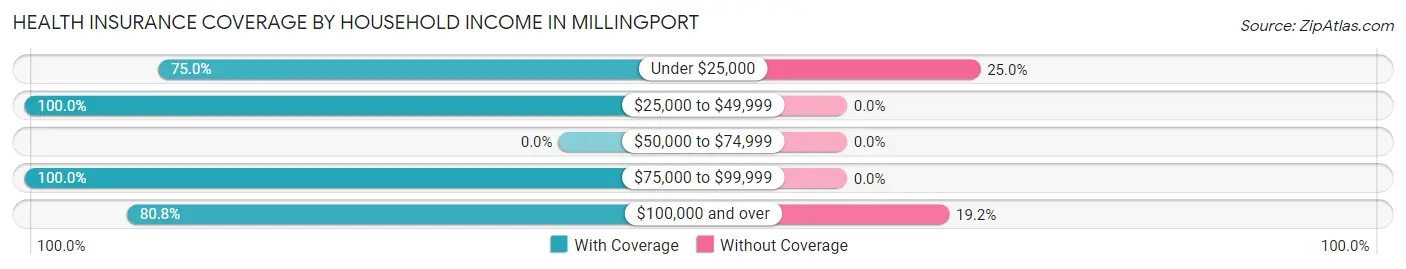
| Household Income | With Coverage | Without Coverage |
| Under $25,000 | 30 (75.0%) | 10 (25.0%) |
| $25,000 to $49,999 | 89 (100.0%) | 0 (0.0%) |
| $50,000 to $74,999 | 0 (0.0%) | 0 (0.0%) |
| $75,000 to $99,999 | 136 (100.0%) | 0 (0.0%) |
| $100,000 and over | 173 (80.8%) | 41 (19.2%) |
Public vs Private Health Insurance Coverage by Age in Millingport
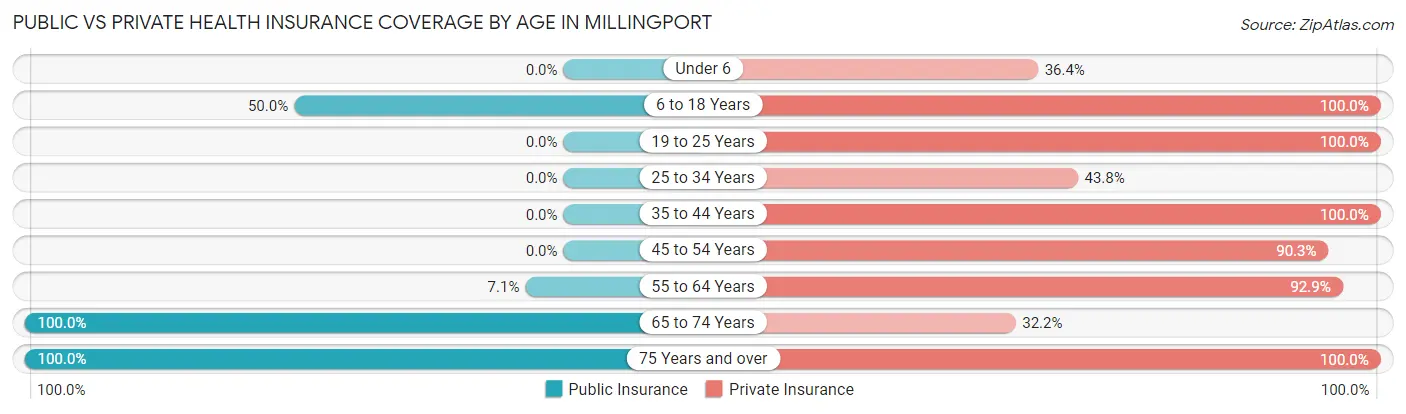
| Age Bracket | Public Insurance | Private Insurance |
| Under 6 | 0 (0.0%) | 8 (36.4%) |
| 6 to 18 Years | 10 (50.0%) | 20 (100.0%) |
| 19 to 25 Years | 0 (0.0%) | 44 (100.0%) |
| 25 to 34 Years | 0 (0.0%) | 21 (43.8%) |
| 35 to 44 Years | 0 (0.0%) | 15 (100.0%) |
| 45 to 54 Years | 0 (0.0%) | 93 (90.3%) |
| 55 to 64 Years | 7 (7.1%) | 92 (92.9%) |
| 65 to 74 Years | 59 (100.0%) | 19 (32.2%) |
| 75 Years and over | 69 (100.0%) | 69 (100.0%) |
| Total | 145 (30.3%) | 381 (79.5%) |
Disability Status by Sex by Age in Millingport
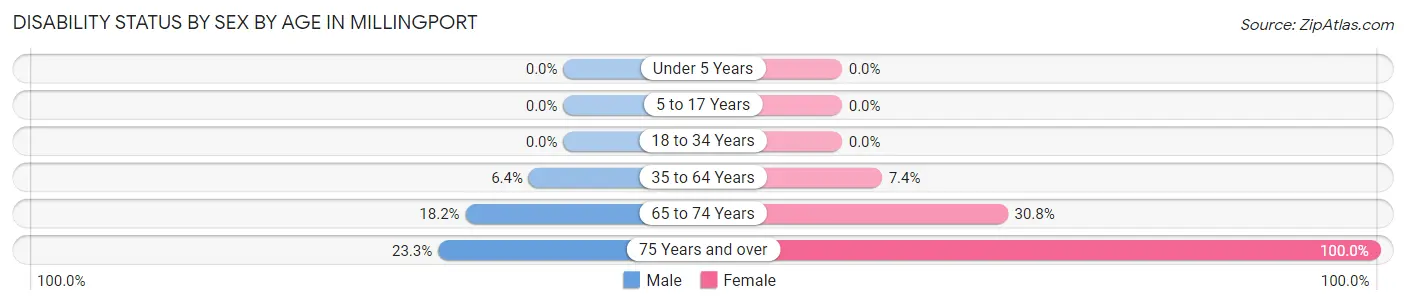
| Age Bracket | Male | Female |
| Under 5 Years | 0 (0.0%) | 0 (0.0%) |
| 5 to 17 Years | 0 (0.0%) | 0 (0.0%) |
| 18 to 34 Years | 0 (0.0%) | 0 (0.0%) |
| 35 to 64 Years | 7 (6.4%) | 8 (7.4%) |
| 65 to 74 Years | 6 (18.2%) | 8 (30.8%) |
| 75 Years and over | 10 (23.3%) | 26 (100.0%) |
Disability Class by Sex by Age in Millingport
Disability Class: Hearing Difficulty
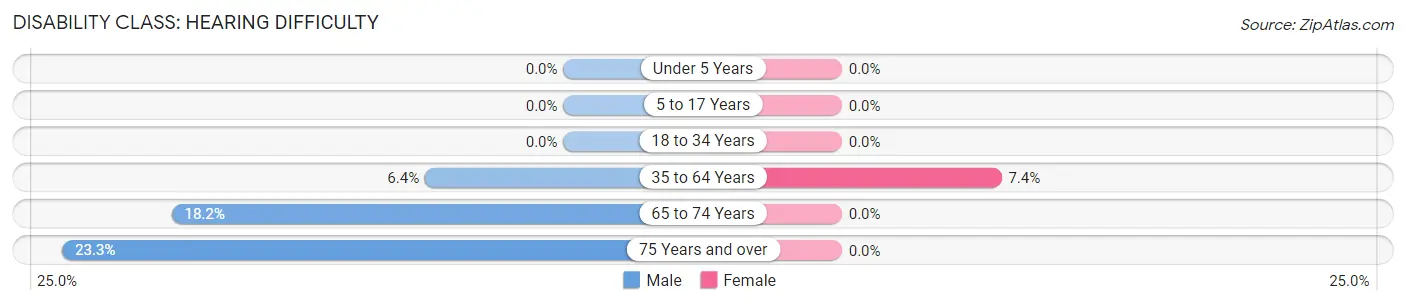
| Age Bracket | Male | Female |
| Under 5 Years | 0 (0.0%) | 0 (0.0%) |
| 5 to 17 Years | 0 (0.0%) | 0 (0.0%) |
| 18 to 34 Years | 0 (0.0%) | 0 (0.0%) |
| 35 to 64 Years | 7 (6.4%) | 8 (7.4%) |
| 65 to 74 Years | 6 (18.2%) | 0 (0.0%) |
| 75 Years and over | 10 (23.3%) | 0 (0.0%) |
Disability Class: Vision Difficulty
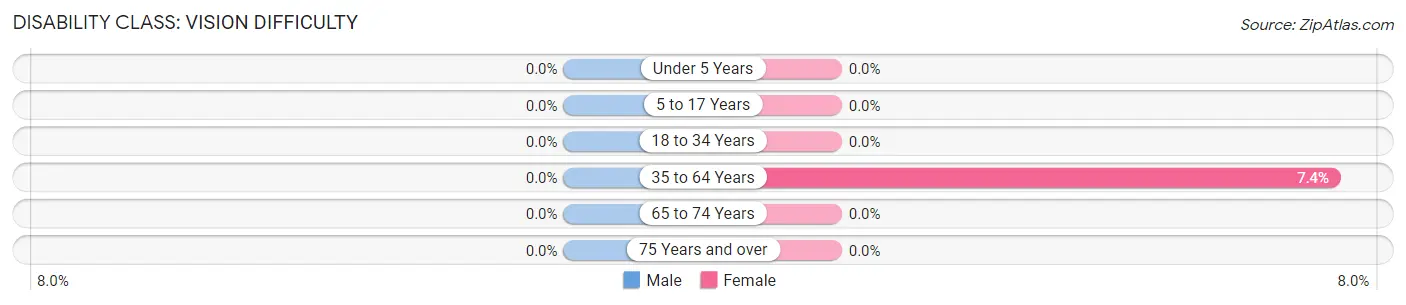
| Age Bracket | Male | Female |
| Under 5 Years | 0 (0.0%) | 0 (0.0%) |
| 5 to 17 Years | 0 (0.0%) | 0 (0.0%) |
| 18 to 34 Years | 0 (0.0%) | 0 (0.0%) |
| 35 to 64 Years | 0 (0.0%) | 8 (7.4%) |
| 65 to 74 Years | 0 (0.0%) | 0 (0.0%) |
| 75 Years and over | 0 (0.0%) | 0 (0.0%) |
Disability Class: Cognitive Difficulty
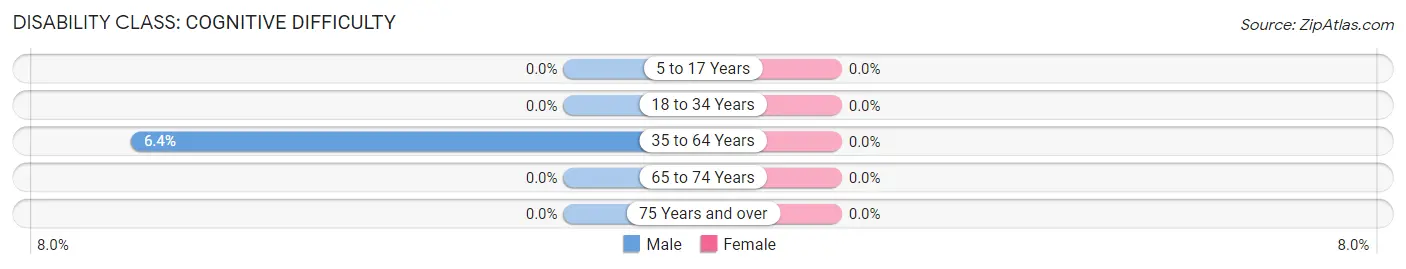
| Age Bracket | Male | Female |
| 5 to 17 Years | 0 (0.0%) | 0 (0.0%) |
| 18 to 34 Years | 0 (0.0%) | 0 (0.0%) |
| 35 to 64 Years | 7 (6.4%) | 0 (0.0%) |
| 65 to 74 Years | 0 (0.0%) | 0 (0.0%) |
| 75 Years and over | 0 (0.0%) | 0 (0.0%) |
Disability Class: Ambulatory Difficulty
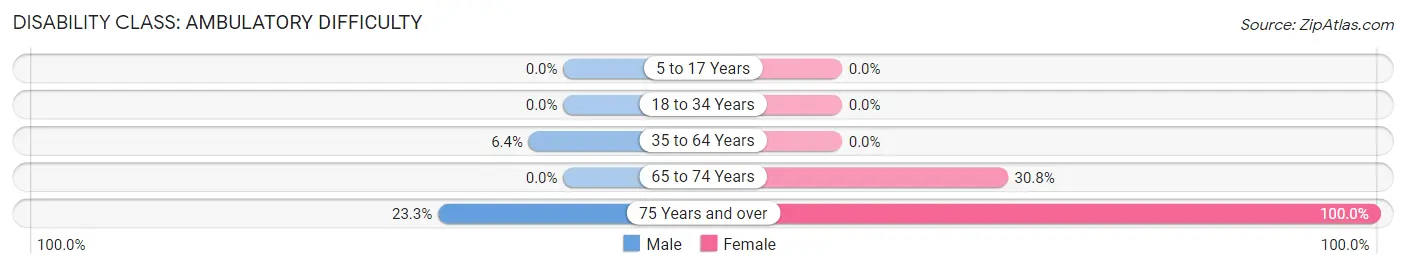
| Age Bracket | Male | Female |
| 5 to 17 Years | 0 (0.0%) | 0 (0.0%) |
| 18 to 34 Years | 0 (0.0%) | 0 (0.0%) |
| 35 to 64 Years | 7 (6.4%) | 0 (0.0%) |
| 65 to 74 Years | 0 (0.0%) | 8 (30.8%) |
| 75 Years and over | 10 (23.3%) | 26 (100.0%) |
Disability Class: Self-Care Difficulty
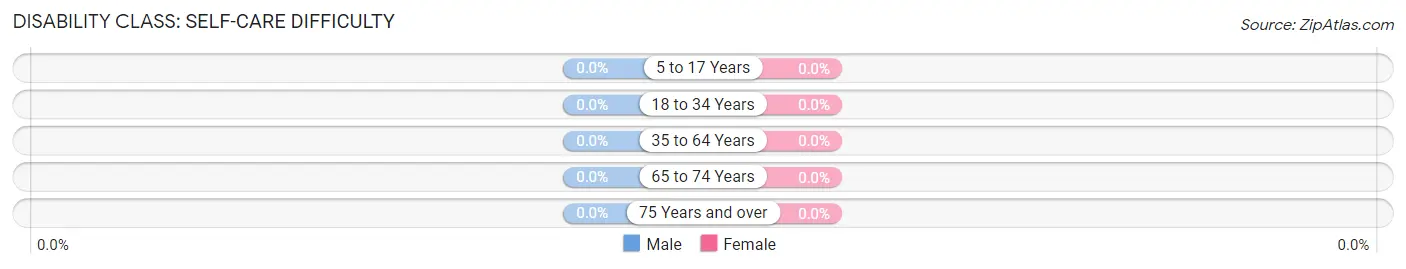
| Age Bracket | Male | Female |
| 5 to 17 Years | 0 (0.0%) | 0 (0.0%) |
| 18 to 34 Years | 0 (0.0%) | 0 (0.0%) |
| 35 to 64 Years | 0 (0.0%) | 0 (0.0%) |
| 65 to 74 Years | 0 (0.0%) | 0 (0.0%) |
| 75 Years and over | 0 (0.0%) | 0 (0.0%) |
Technology Access in Millingport
Computing Device Access in Millingport
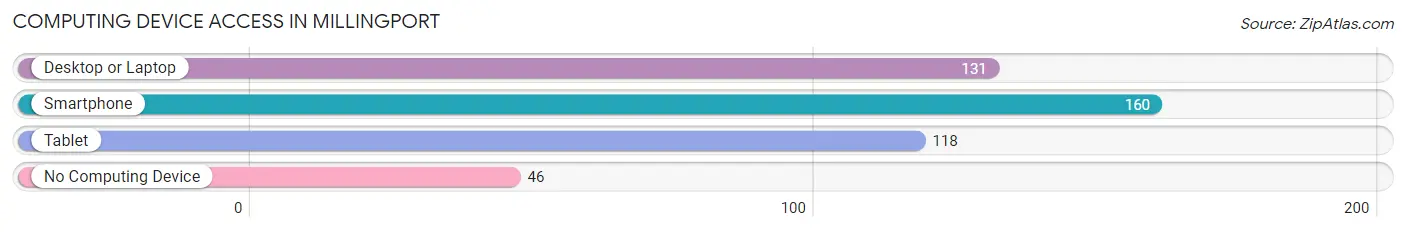
| Device Type | # Households | % Households |
| Desktop or Laptop | 131 | 63.6% |
| Smartphone | 160 | 77.7% |
| Tablet | 118 | 57.3% |
| No Computing Device | 46 | 22.3% |
| Total | 206 | 100.0% |
Internet Access in Millingport
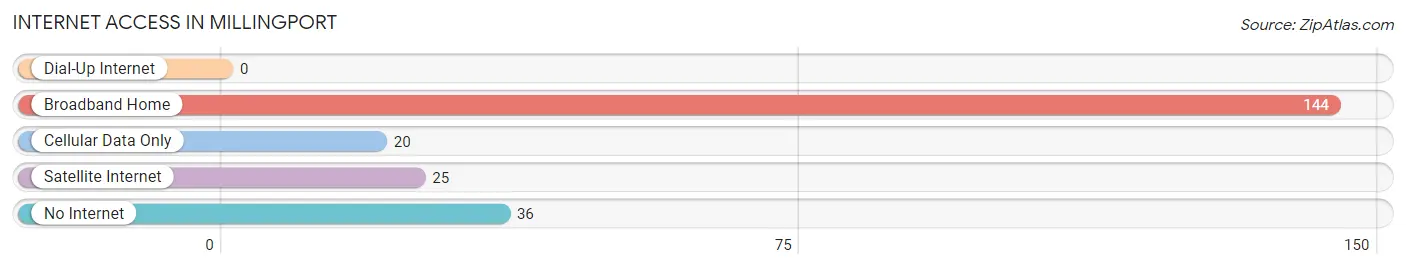
| Internet Type | # Households | % Households |
| Dial-Up Internet | 0 | 0.0% |
| Broadband Home | 144 | 69.9% |
| Cellular Data Only | 20 | 9.7% |
| Satellite Internet | 25 | 12.1% |
| No Internet | 36 | 17.5% |
| Total | 206 | 100.0% |
Millingport Summary
Millingport is a small unincorporated community located in Brunswick County, North Carolina. It is situated on the banks of the Cape Fear River, approximately 20 miles south of Wilmington. The town was founded in the late 19th century and has a population of approximately 500 people.
History
Millingport was founded in the late 19th century by a group of settlers from the nearby town of Leland. The settlers were looking for a place to build a mill, and they chose the banks of the Cape Fear River as the perfect spot. The mill was built in 1891 and was used to grind grain and produce lumber. The mill was a major source of employment for the town, and it helped to spur the growth of the community.
The town was officially incorporated in 1895 and was named after the mill. The town grew steadily over the next few decades, and by the mid-20th century, it had become a thriving community. The mill was eventually closed in the 1970s, but the town continued to thrive.
Geography
Millingport is located in Brunswick County, North Carolina. It is situated on the banks of the Cape Fear River, approximately 20 miles south of Wilmington. The town is surrounded by a variety of natural features, including the Cape Fear River, the Atlantic Ocean, and the Intracoastal Waterway. The town is also located near the Brunswick Town State Historic Site, which is a popular tourist destination.
The town has a humid subtropical climate, with hot, humid summers and mild winters. The average annual temperature is around 70 degrees Fahrenheit, and the average annual precipitation is around 50 inches.
Economy
Millingport’s economy is largely based on tourism and fishing. The town is home to several popular tourist attractions, including the Brunswick Town State Historic Site and the Cape Fear River. The town also has a thriving fishing industry, with a variety of species being caught in the local waters.
The town also has a small manufacturing sector, with several small businesses producing a variety of products. The town is also home to a number of small retail stores, restaurants, and other businesses.
Demographics
Millingport has a population of approximately 500 people. The town is predominantly white, with a small African American population. The median household income is around $35,000, and the median home value is around $150,000. The town has a low unemployment rate, and the majority of the population is employed in the tourism and fishing industries.
Common Questions
What is Per Capita Income in Millingport?
Per Capita income in Millingport is $37,974.
What is the Median Family Income in Millingport?
Median Family Income in Millingport is $91,471.
What is the Median Household income in Millingport?
Median Household Income in Millingport is $89,000.
What is Income or Wage Gap in Millingport?
Income or Wage Gap in Millingport is 1.7%.
Women in Millingport earn 98.3 cents for every dollar earned by a man.
What is Inequality or Gini Index in Millingport?
Inequality or Gini Index in Millingport is 0.34.
What is the Total Population of Millingport?
Total Population of Millingport is 479.
What is the Total Male Population of Millingport?
Total Male Population of Millingport is 238.
What is the Total Female Population of Millingport?
Total Female Population of Millingport is 241.
What is the Ratio of Males per 100 Females in Millingport?
There are 98.76 Males per 100 Females in Millingport.
What is the Ratio of Females per 100 Males in Millingport?
There are 101.26 Females per 100 Males in Millingport.
What is the Median Population Age in Millingport?
Median Population Age in Millingport is 50.9 Years.
What is the Average Family Size in Millingport
Average Family Size in Millingport is 2.5 People.
What is the Average Household Size in Millingport
Average Household Size in Millingport is 2.3 People.
How Large is the Labor Force in Millingport?
There are 306 People in the Labor Forcein in Millingport.
What is the Percentage of People in the Labor Force in Millingport?
68.5% of People are in the Labor Force in Millingport.