Wade, NC Map & Demographics
Wade Map
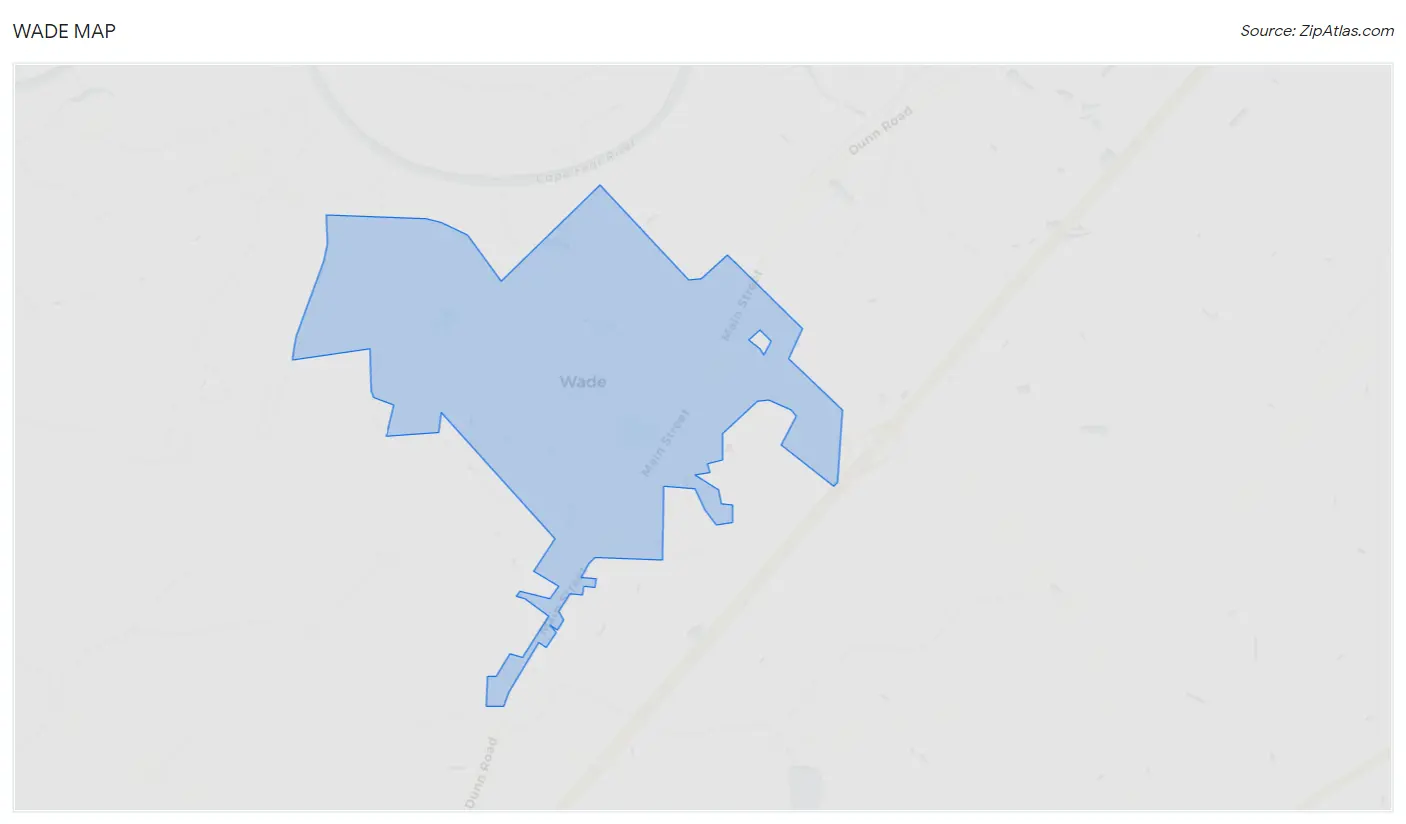
Wade Overview
$31,825
PER CAPITA INCOME
$97,083
AVG FAMILY INCOME
$62,500
AVG HOUSEHOLD INCOME
48.5%
WAGE / INCOME GAP [ % ]
51.5¢/ $1
WAGE / INCOME GAP [ $ ]
0.49
INEQUALITY / GINI INDEX
595
TOTAL POPULATION
332
MALE POPULATION
263
FEMALE POPULATION
126.24
MALES / 100 FEMALES
79.22
FEMALES / 100 MALES
39.2
MEDIAN AGE
3.2
AVG FAMILY SIZE
2.2
AVG HOUSEHOLD SIZE
258
LABOR FORCE [ PEOPLE ]
56.2%
PERCENT IN LABOR FORCE
12.9%
UNEMPLOYMENT RATE
Wade Zip Codes
Wade Area Codes
Income in Wade
Income Overview in Wade
Per Capita Income in Wade is $31,825, while median incomes of families and households are $97,083 and $62,500 respectively.
| Characteristic | Number | Measure |
| Per Capita Income | 595 | $31,825 |
| Median Family Income | 145 | $97,083 |
| Mean Family Income | 145 | $107,080 |
| Median Household Income | 266 | $62,500 |
| Mean Household Income | 266 | $70,970 |
| Income Deficit | 145 | $0 |
| Wage / Income Gap (%) | 595 | 48.54% |
| Wage / Income Gap ($) | 595 | 51.46¢ per $1 |
| Gini / Inequality Index | 595 | 0.49 |
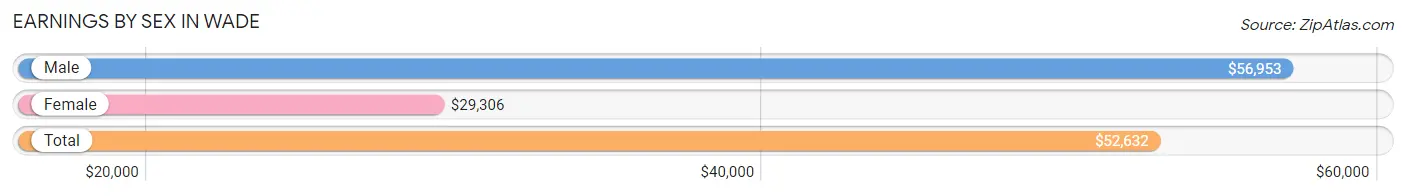
Earnings by Sex in Wade
Average Earnings in Wade are $52,632, $56,953 for men and $29,306 for women, a difference of 48.5%.
| Sex | Number | Average Earnings |
| Male | 137 (53.9%) | $56,953 |
| Female | 117 (46.1%) | $29,306 |
| Total | 254 (100.0%) | $52,632 |
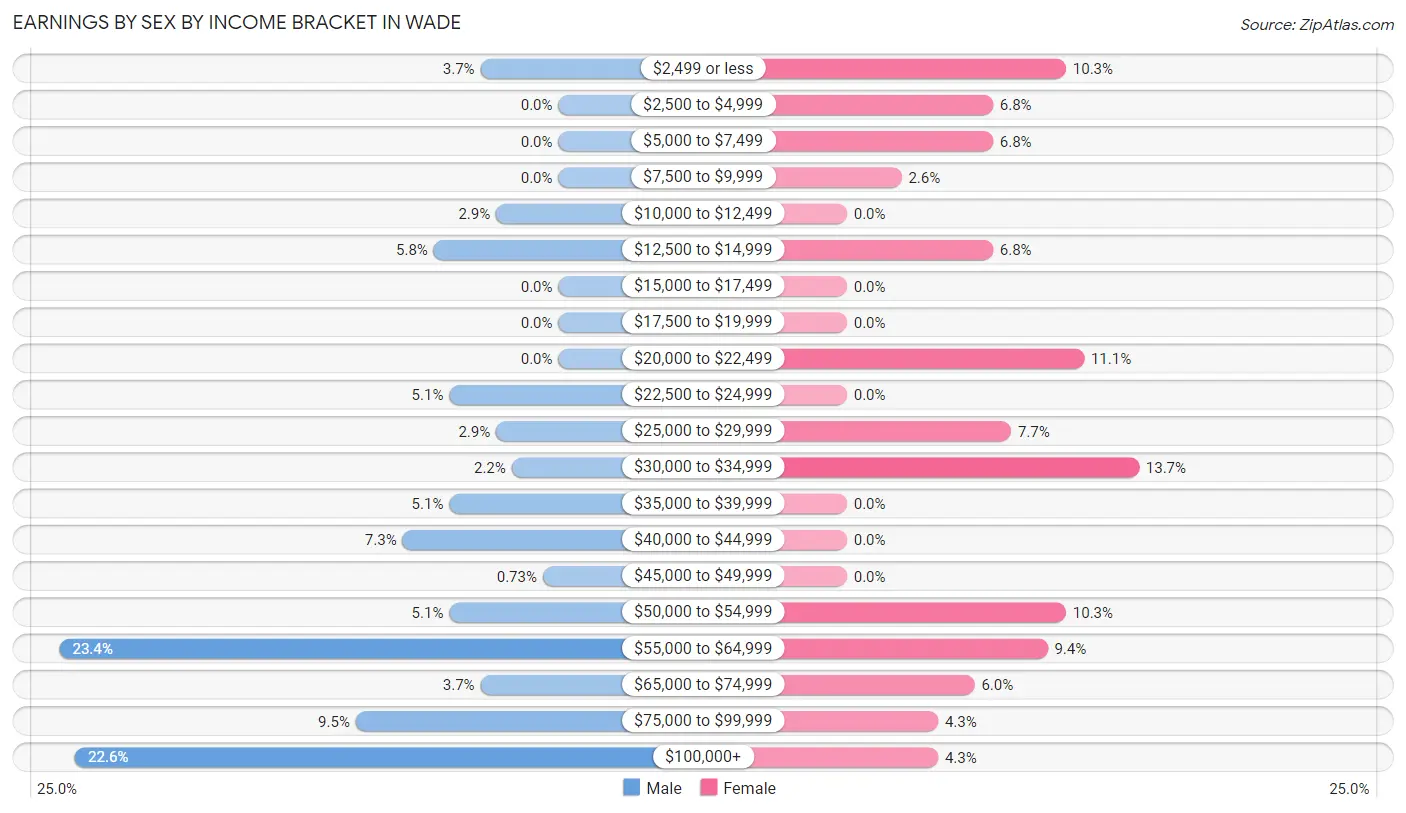
Earnings by Sex by Income Bracket in Wade
The most common earnings brackets in Wade are $55,000 to $64,999 for men (32 | 23.4%) and $30,000 to $34,999 for women (16 | 13.7%).
| Income | Male | Female |
| $2,499 or less | 5 (3.6%) | 12 (10.3%) |
| $2,500 to $4,999 | 0 (0.0%) | 8 (6.8%) |
| $5,000 to $7,499 | 0 (0.0%) | 8 (6.8%) |
| $7,500 to $9,999 | 0 (0.0%) | 3 (2.6%) |
| $10,000 to $12,499 | 4 (2.9%) | 0 (0.0%) |
| $12,500 to $14,999 | 8 (5.8%) | 8 (6.8%) |
| $15,000 to $17,499 | 0 (0.0%) | 0 (0.0%) |
| $17,500 to $19,999 | 0 (0.0%) | 0 (0.0%) |
| $20,000 to $22,499 | 0 (0.0%) | 13 (11.1%) |
| $22,500 to $24,999 | 7 (5.1%) | 0 (0.0%) |
| $25,000 to $29,999 | 4 (2.9%) | 9 (7.7%) |
| $30,000 to $34,999 | 3 (2.2%) | 16 (13.7%) |
| $35,000 to $39,999 | 7 (5.1%) | 0 (0.0%) |
| $40,000 to $44,999 | 10 (7.3%) | 0 (0.0%) |
| $45,000 to $49,999 | 1 (0.7%) | 0 (0.0%) |
| $50,000 to $54,999 | 7 (5.1%) | 12 (10.3%) |
| $55,000 to $64,999 | 32 (23.4%) | 11 (9.4%) |
| $65,000 to $74,999 | 5 (3.6%) | 7 (6.0%) |
| $75,000 to $99,999 | 13 (9.5%) | 5 (4.3%) |
| $100,000+ | 31 (22.6%) | 5 (4.3%) |
| Total | 137 (100.0%) | 117 (100.0%) |
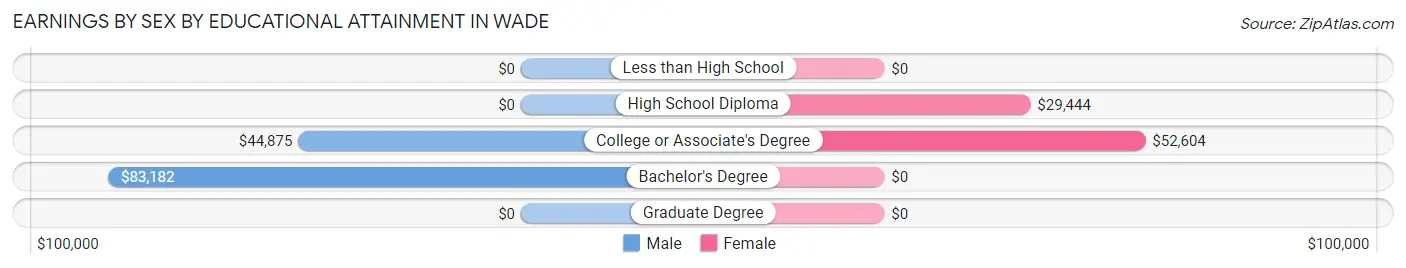
Earnings by Sex by Educational Attainment in Wade
Average earnings in Wade are $56,875 for men and $31,023 for women, a difference of 45.5%. Men with an educational attainment of bachelor's degree enjoy the highest average annual earnings of $83,182, while those with college or associate's degree education earn the least with $44,875. Women with an educational attainment of college or associate's degree earn the most with the average annual earnings of $52,604, while those with high school diploma education have the smallest earnings of $29,444.
| Educational Attainment | Male Income | Female Income |
| Less than High School | - | - |
| High School Diploma | - | - |
| College or Associate's Degree | $44,875 | $52,604 |
| Bachelor's Degree | $83,182 | $0 |
| Graduate Degree | - | - |
| Total | $56,875 | $31,023 |
Family Income in Wade
Family Income Brackets in Wade
According to the Wade family income data, there are 60 families falling into the $100,000 to $149,999 income range, which is the most common income bracket and makes up 41.4% of all families.
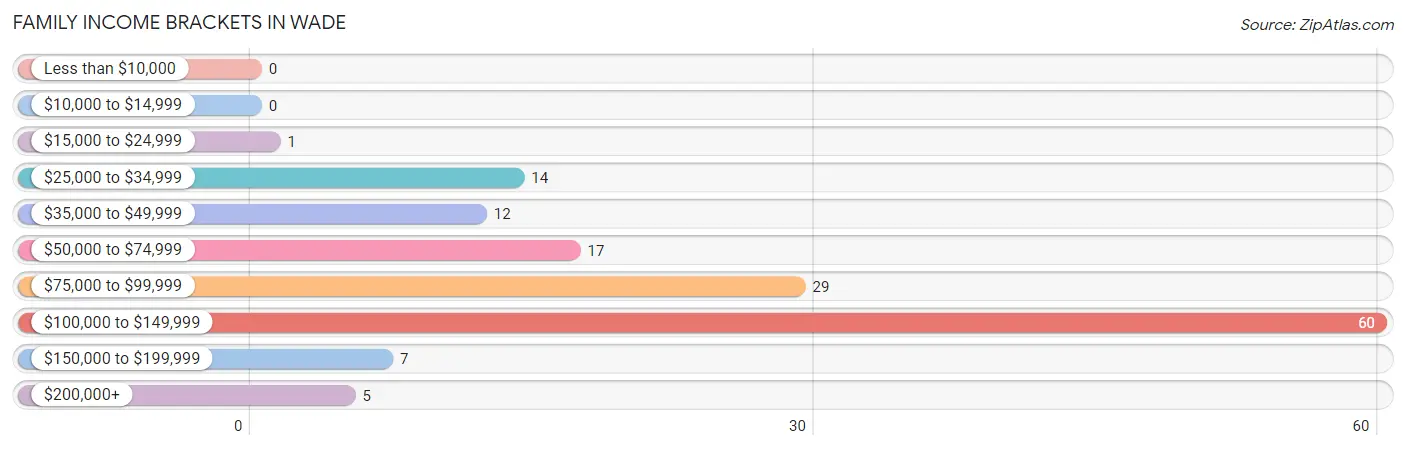
| Income Bracket | # Families | % Families |
| Less than $10,000 | 0 | 0.0% |
| $10,000 to $14,999 | 0 | 0.0% |
| $15,000 to $24,999 | 1 | 0.7% |
| $25,000 to $34,999 | 14 | 9.7% |
| $35,000 to $49,999 | 12 | 8.3% |
| $50,000 to $74,999 | 17 | 11.7% |
| $75,000 to $99,999 | 29 | 20.0% |
| $100,000 to $149,999 | 60 | 41.4% |
| $150,000 to $199,999 | 7 | 4.8% |
| $200,000+ | 5 | 3.4% |
Family Income by Famaliy Size in Wade
3-person families (38 | 26.2%) account for the highest median family income in Wade with $110,833 per family, while 2-person families (60 | 41.4%) have the highest median income of $52,750 per family member.
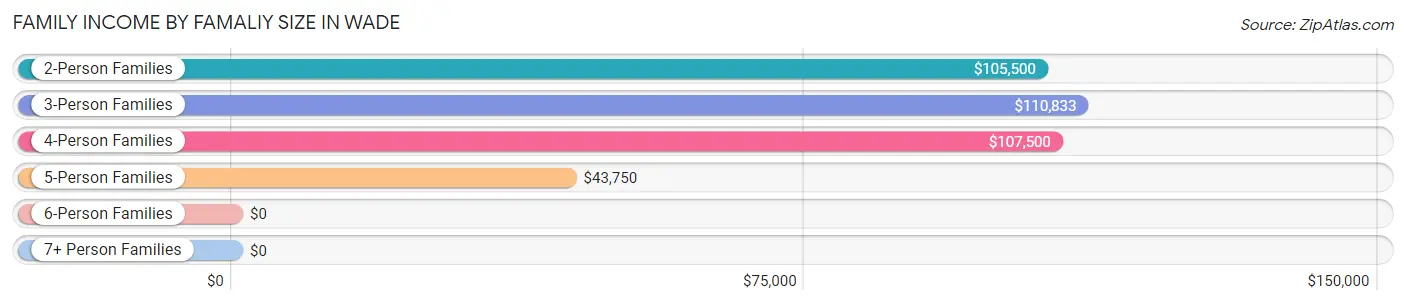
| Income Bracket | # Families | Median Income |
| 2-Person Families | 60 (41.4%) | $105,500 |
| 3-Person Families | 38 (26.2%) | $110,833 |
| 4-Person Families | 26 (17.9%) | $107,500 |
| 5-Person Families | 17 (11.7%) | $43,750 |
| 6-Person Families | 2 (1.4%) | $0 |
| 7+ Person Families | 2 (1.4%) | $0 |
| Total | 145 (100.0%) | $97,083 |
Family Income by Number of Earners in Wade
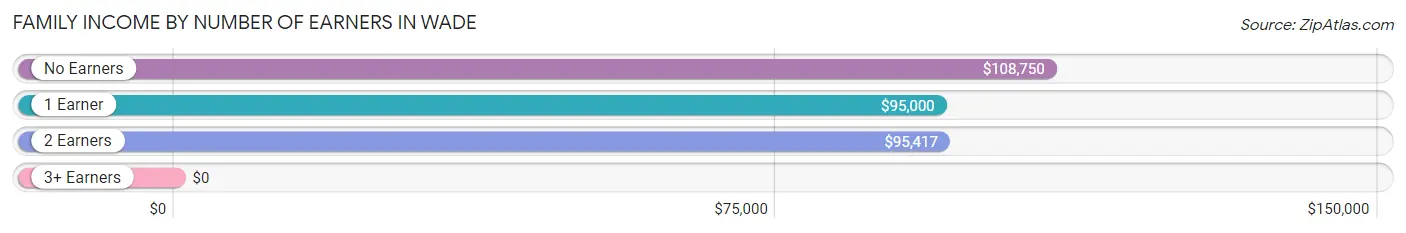
| Number of Earners | # Families | Median Income |
| No Earners | 26 (17.9%) | $108,750 |
| 1 Earner | 62 (42.8%) | $95,000 |
| 2 Earners | 53 (36.5%) | $95,417 |
| 3+ Earners | 4 (2.8%) | $0 |
| Total | 145 (100.0%) | $97,083 |
Household Income in Wade
Household Income Brackets in Wade
With 62 households falling in the category, the $100,000 to $149,999 income range is the most frequent in Wade, accounting for 23.3% of all households. In contrast, only 2 households (0.7%) fall into the $10,000 to $14,999 income bracket, making it the least populous group.
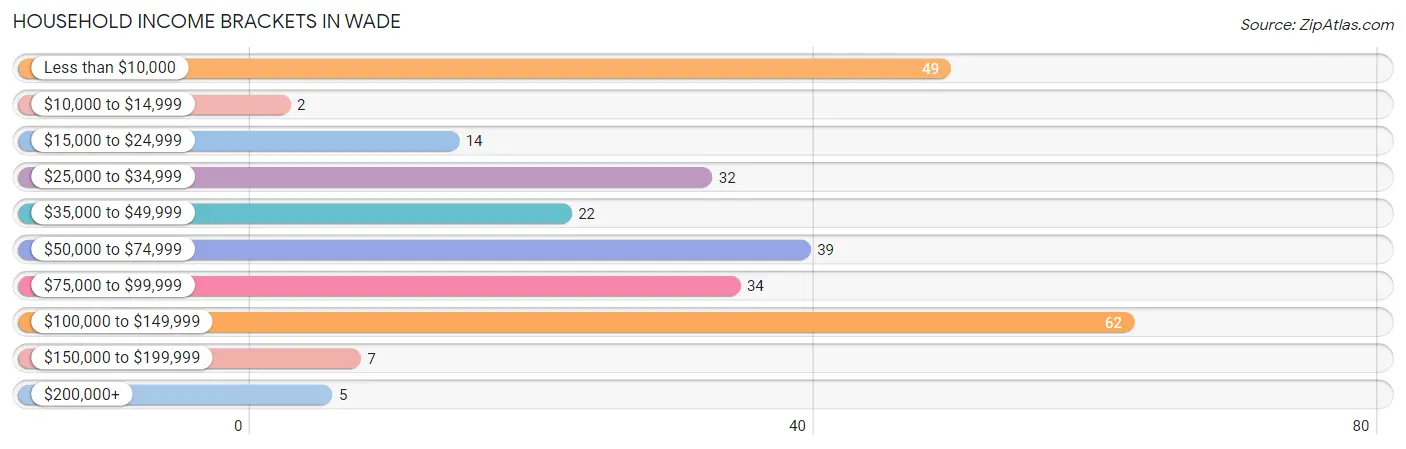
| Income Bracket | # Households | % Households |
| Less than $10,000 | 49 | 18.4% |
| $10,000 to $14,999 | 2 | 0.8% |
| $15,000 to $24,999 | 14 | 5.3% |
| $25,000 to $34,999 | 32 | 12.0% |
| $35,000 to $49,999 | 22 | 8.3% |
| $50,000 to $74,999 | 39 | 14.7% |
| $75,000 to $99,999 | 34 | 12.8% |
| $100,000 to $149,999 | 62 | 23.3% |
| $150,000 to $199,999 | 7 | 2.6% |
| $200,000+ | 5 | 1.9% |
Household Income by Householder Age in Wade
The median household income in Wade is $62,500, with the highest median household income of $83,864 found in the 25 to 44 years age bracket for the primary householder. A total of 80 households (30.1%) fall into this category. Meanwhile, the 15 to 24 years age bracket for the primary householder has the lowest median household income of $0, with 6 households (2.3%) in this group.
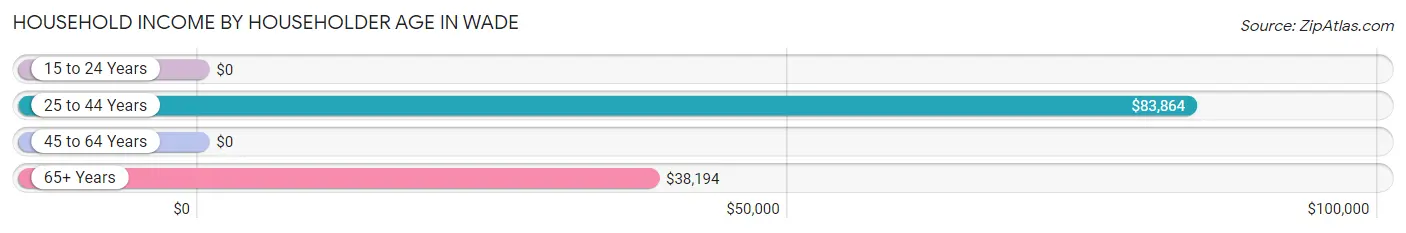
| Income Bracket | # Households | Median Income |
| 15 to 24 Years | 6 (2.3%) | $0 |
| 25 to 44 Years | 80 (30.1%) | $83,864 |
| 45 to 64 Years | 107 (40.2%) | $0 |
| 65+ Years | 73 (27.4%) | $38,194 |
| Total | 266 (100.0%) | $62,500 |
Poverty in Wade
Income Below Poverty by Sex and Age in Wade
With 14.2% poverty level for males and 16.4% for females among the residents of Wade, 55 to 64 year old males and 45 to 54 year old females are the most vulnerable to poverty, with 19 males (32.2%) and 9 females (40.9%) in their respective age groups living below the poverty level.
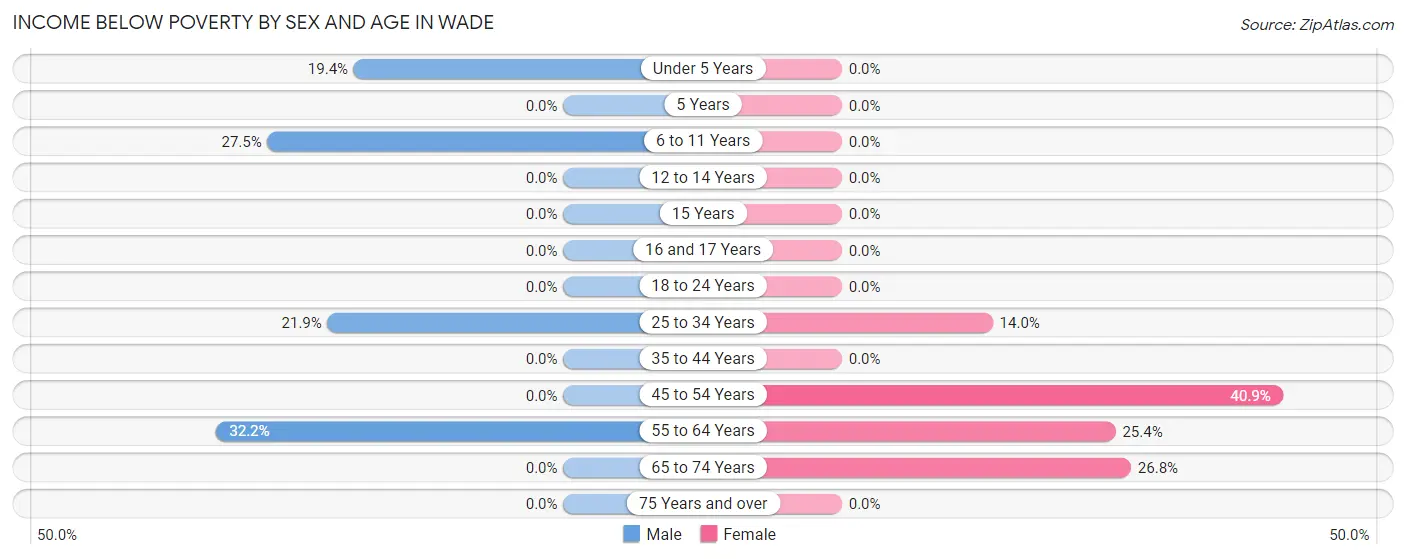
| Age Bracket | Male | Female |
| Under 5 Years | 7 (19.4%) | 0 (0.0%) |
| 5 Years | 0 (0.0%) | 0 (0.0%) |
| 6 to 11 Years | 14 (27.5%) | 0 (0.0%) |
| 12 to 14 Years | 0 (0.0%) | 0 (0.0%) |
| 15 Years | 0 (0.0%) | 0 (0.0%) |
| 16 and 17 Years | 0 (0.0%) | 0 (0.0%) |
| 18 to 24 Years | 0 (0.0%) | 0 (0.0%) |
| 25 to 34 Years | 7 (21.9%) | 7 (14.0%) |
| 35 to 44 Years | 0 (0.0%) | 0 (0.0%) |
| 45 to 54 Years | 0 (0.0%) | 9 (40.9%) |
| 55 to 64 Years | 19 (32.2%) | 16 (25.4%) |
| 65 to 74 Years | 0 (0.0%) | 11 (26.8%) |
| 75 Years and over | 0 (0.0%) | 0 (0.0%) |
| Total | 47 (14.2%) | 43 (16.4%) |
Income Above Poverty by Sex and Age in Wade
According to the poverty statistics in Wade, males aged 5 years and females aged under 5 years are the age groups that are most secure financially, with 100.0% of males and 100.0% of females in these age groups living above the poverty line.

| Age Bracket | Male | Female |
| Under 5 Years | 29 (80.6%) | 13 (100.0%) |
| 5 Years | 7 (100.0%) | 0 (0.0%) |
| 6 to 11 Years | 37 (72.6%) | 8 (100.0%) |
| 12 to 14 Years | 17 (100.0%) | 1 (100.0%) |
| 15 Years | 3 (100.0%) | 0 (0.0%) |
| 16 and 17 Years | 6 (100.0%) | 3 (100.0%) |
| 18 to 24 Years | 17 (100.0%) | 14 (100.0%) |
| 25 to 34 Years | 25 (78.1%) | 43 (86.0%) |
| 35 to 44 Years | 55 (100.0%) | 34 (100.0%) |
| 45 to 54 Years | 14 (100.0%) | 13 (59.1%) |
| 55 to 64 Years | 40 (67.8%) | 47 (74.6%) |
| 65 to 74 Years | 27 (100.0%) | 30 (73.2%) |
| 75 Years and over | 8 (100.0%) | 14 (100.0%) |
| Total | 285 (85.8%) | 220 (83.7%) |
Income Below Poverty Among Married-Couple Families in Wade
The poverty statistics for married-couple families in Wade show that 5.7% or 7 of the total 122 families live below the poverty line. Families with 3 or 4 children have the highest poverty rate of 50.0%, comprising of 7 families. On the other hand, families with no children have the lowest poverty rate of 0.0%, which includes 0 families.
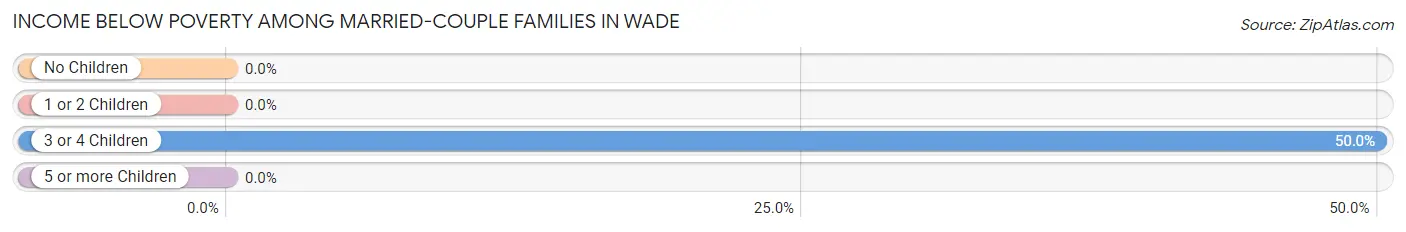
| Children | Above Poverty | Below Poverty |
| No Children | 64 (100.0%) | 0 (0.0%) |
| 1 or 2 Children | 44 (100.0%) | 0 (0.0%) |
| 3 or 4 Children | 7 (50.0%) | 7 (50.0%) |
| 5 or more Children | 0 (0.0%) | 0 (0.0%) |
| Total | 115 (94.3%) | 7 (5.7%) |
Income Below Poverty Among Single-Parent Households in Wade
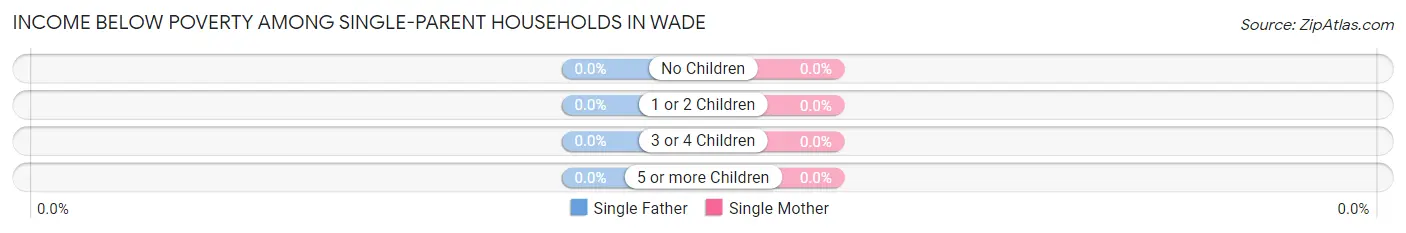
| Children | Single Father | Single Mother |
| No Children | 0 (0.0%) | 0 (0.0%) |
| 1 or 2 Children | 0 (0.0%) | 0 (0.0%) |
| 3 or 4 Children | 0 (0.0%) | 0 (0.0%) |
| 5 or more Children | 0 (0.0%) | 0 (0.0%) |
| Total | 0 (0.0%) | 0 (0.0%) |
Income Below Poverty Among Married-Couple vs Single-Parent Households in Wade
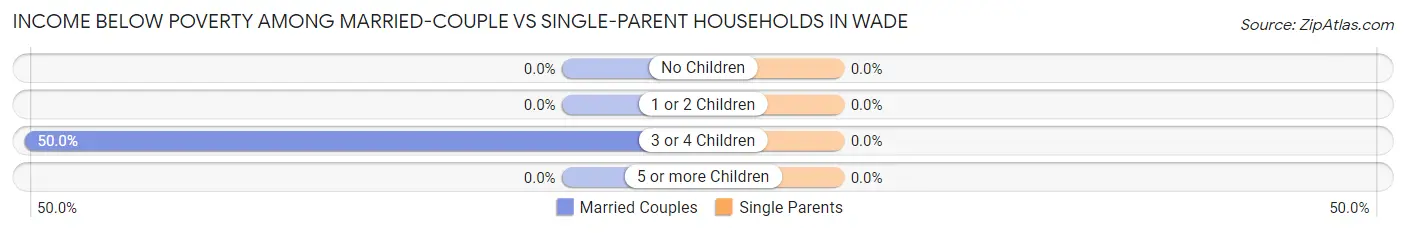
| Children | Married-Couple Families | Single-Parent Households |
| No Children | 0 (0.0%) | 0 (0.0%) |
| 1 or 2 Children | 0 (0.0%) | 0 (0.0%) |
| 3 or 4 Children | 7 (50.0%) | 0 (0.0%) |
| 5 or more Children | 0 (0.0%) | 0 (0.0%) |
| Total | 7 (5.7%) | 0 (0.0%) |
Race in Wade
The most populous races in Wade are White / Caucasian (468 | 78.7%), Black / African American (91 | 15.3%), and Two or more Races (30 | 5.0%).
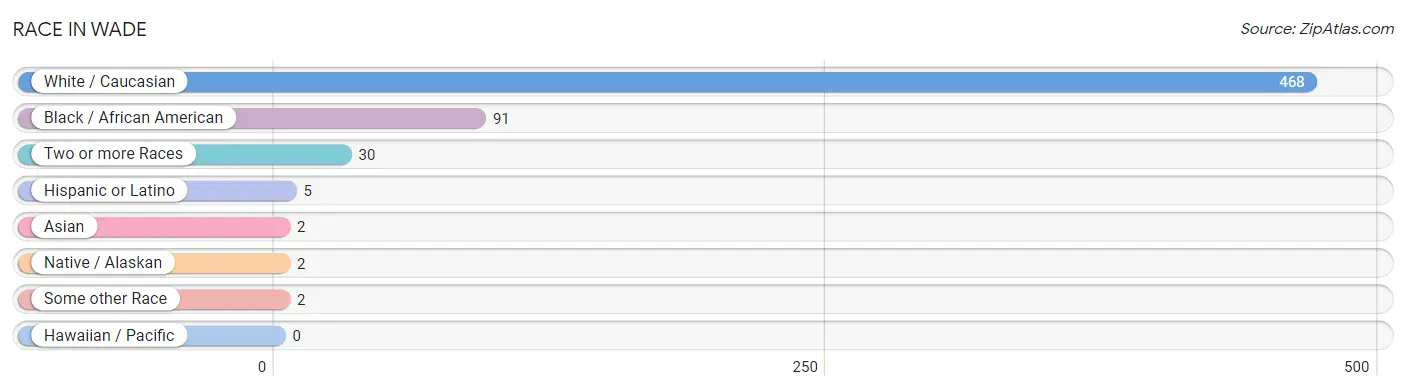
| Race | # Population | % Population |
| Asian | 2 | 0.3% |
| Black / African American | 91 | 15.3% |
| Hawaiian / Pacific | 0 | 0.0% |
| Hispanic or Latino | 5 | 0.8% |
| Native / Alaskan | 2 | 0.3% |
| White / Caucasian | 468 | 78.7% |
| Two or more Races | 30 | 5.0% |
| Some other Race | 2 | 0.3% |
| Total | 595 | 100.0% |
Ancestry in Wade
The most populous ancestries reported in Wade are German (81 | 13.6%), American (62 | 10.4%), English (61 | 10.2%), Irish (58 | 9.8%), and Slavic (33 | 5.6%), together accounting for 49.6% of all Wade residents.
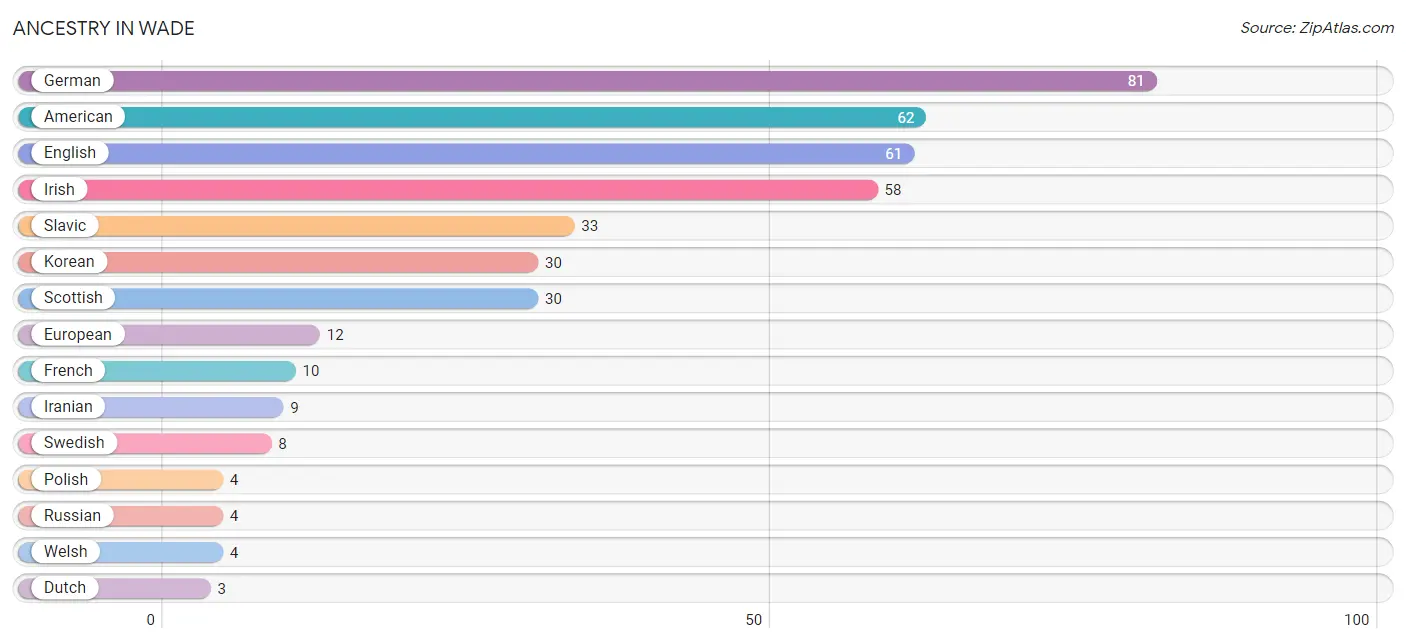
| Ancestry | # Population | % Population |
| American | 62 | 10.4% |
| Central American | 2 | 0.3% |
| Cherokee | 1 | 0.2% |
| Dutch | 3 | 0.5% |
| English | 61 | 10.2% |
| European | 12 | 2.0% |
| French | 10 | 1.7% |
| German | 81 | 13.6% |
| Iranian | 9 | 1.5% |
| Irish | 58 | 9.8% |
| Korean | 30 | 5.0% |
| Lumbee | 1 | 0.2% |
| Pakistani | 2 | 0.3% |
| Panamanian | 2 | 0.3% |
| Polish | 4 | 0.7% |
| Russian | 4 | 0.7% |
| Scottish | 30 | 5.0% |
| Slavic | 33 | 5.6% |
| Swedish | 8 | 1.3% |
| Welsh | 4 | 0.7% | View All 20 Rows |
Immigrants in Wade
The most numerous immigrant groups reported in Wade came from Central America (5 | 0.8%), Latin America (5 | 0.8%), Honduras (3 | 0.5%), Asia (2 | 0.3%), and Panama (2 | 0.3%), together accounting for 2.9% of all Wade residents.
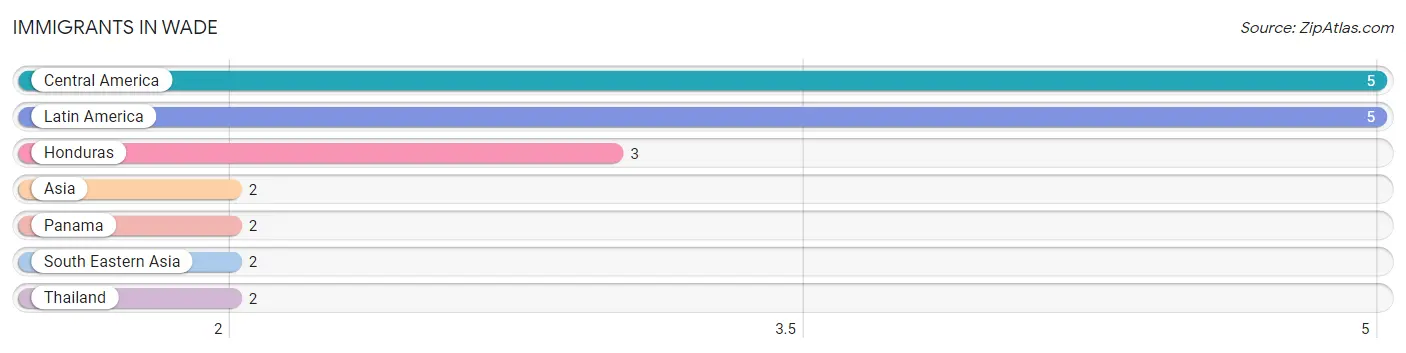
| Immigration Origin | # Population | % Population |
| Asia | 2 | 0.3% |
| Central America | 5 | 0.8% |
| Honduras | 3 | 0.5% |
| Latin America | 5 | 0.8% |
| Panama | 2 | 0.3% |
| South Eastern Asia | 2 | 0.3% |
| Thailand | 2 | 0.3% | View All 7 Rows |
Sex and Age in Wade
Sex and Age in Wade
The most populous age groups in Wade are 5 to 9 Years (47 | 14.2%) for men and 30 to 34 Years (37 | 14.1%) for women.
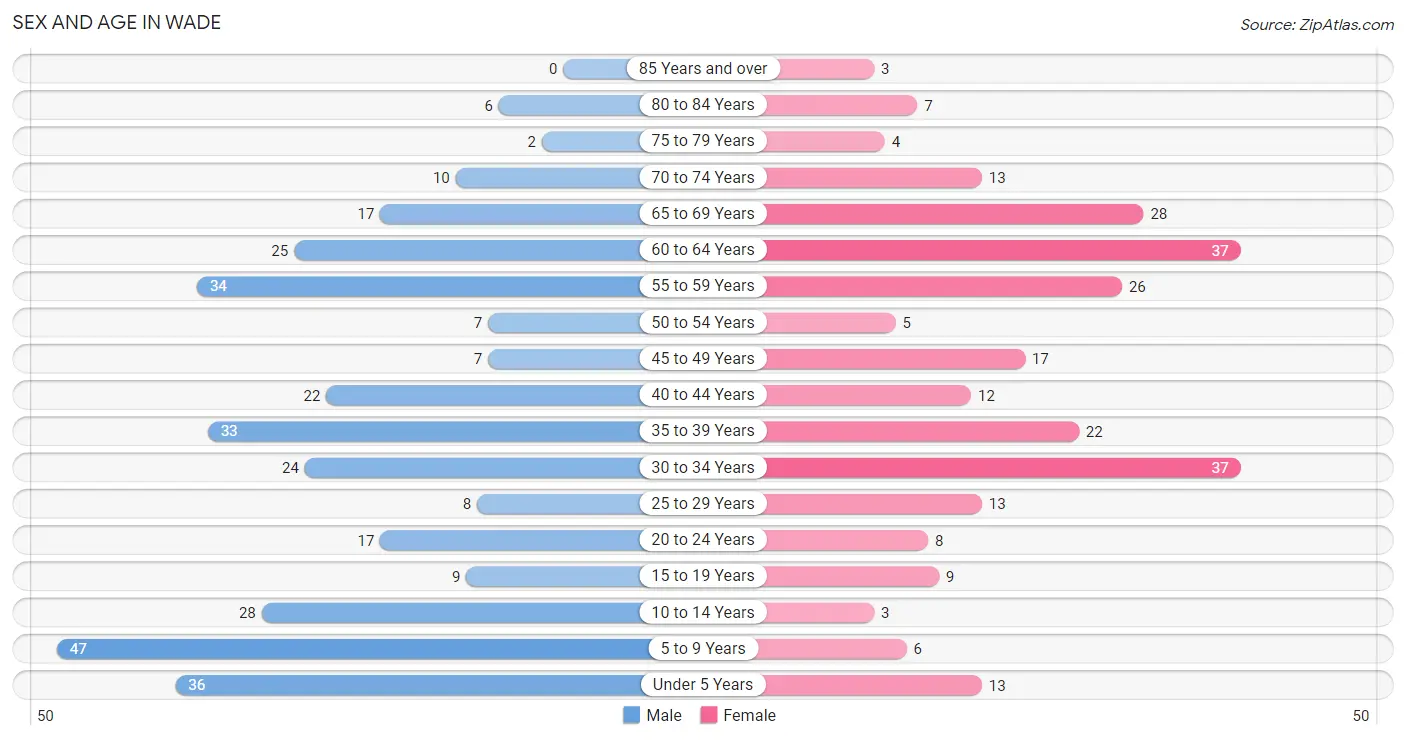
| Age Bracket | Male | Female |
| Under 5 Years | 36 (10.8%) | 13 (4.9%) |
| 5 to 9 Years | 47 (14.2%) | 6 (2.3%) |
| 10 to 14 Years | 28 (8.4%) | 3 (1.1%) |
| 15 to 19 Years | 9 (2.7%) | 9 (3.4%) |
| 20 to 24 Years | 17 (5.1%) | 8 (3.0%) |
| 25 to 29 Years | 8 (2.4%) | 13 (4.9%) |
| 30 to 34 Years | 24 (7.2%) | 37 (14.1%) |
| 35 to 39 Years | 33 (9.9%) | 22 (8.4%) |
| 40 to 44 Years | 22 (6.6%) | 12 (4.6%) |
| 45 to 49 Years | 7 (2.1%) | 17 (6.5%) |
| 50 to 54 Years | 7 (2.1%) | 5 (1.9%) |
| 55 to 59 Years | 34 (10.2%) | 26 (9.9%) |
| 60 to 64 Years | 25 (7.5%) | 37 (14.1%) |
| 65 to 69 Years | 17 (5.1%) | 28 (10.6%) |
| 70 to 74 Years | 10 (3.0%) | 13 (4.9%) |
| 75 to 79 Years | 2 (0.6%) | 4 (1.5%) |
| 80 to 84 Years | 6 (1.8%) | 7 (2.7%) |
| 85 Years and over | 0 (0.0%) | 3 (1.1%) |
| Total | 332 (100.0%) | 263 (100.0%) |
Families and Households in Wade
Median Family Size in Wade
The median family size in Wade is 3.19 persons per family, with single female/mother families (16 | 11.0%) accounting for the largest median family size of 3.44 persons per family. On the other hand, single male/father families (7 | 4.8%) represent the smallest median family size with 2.57 persons per family.
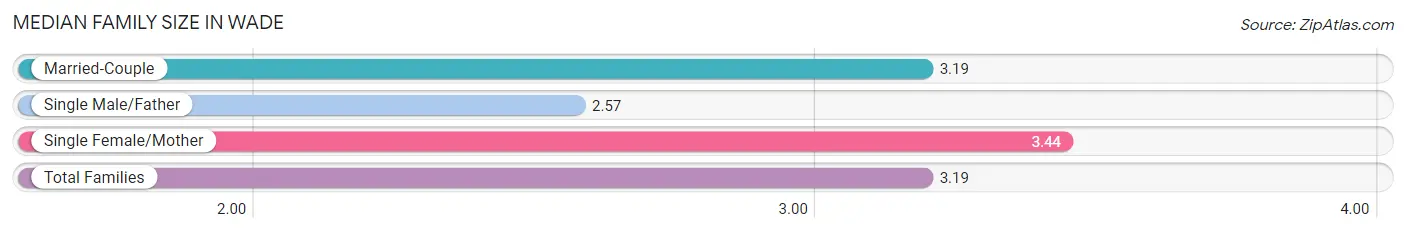
| Family Type | # Families | Family Size |
| Married-Couple | 122 (84.1%) | 3.19 |
| Single Male/Father | 7 (4.8%) | 2.57 |
| Single Female/Mother | 16 (11.0%) | 3.44 |
| Total Families | 145 (100.0%) | 3.19 |
Median Household Size in Wade
The median household size in Wade is 2.24 persons per household, with single female/mother households (16 | 6.0%) accounting for the largest median household size of 3.5 persons per household. non-family households (121 | 45.5%) represent the smallest median household size with 1.06 persons per household.
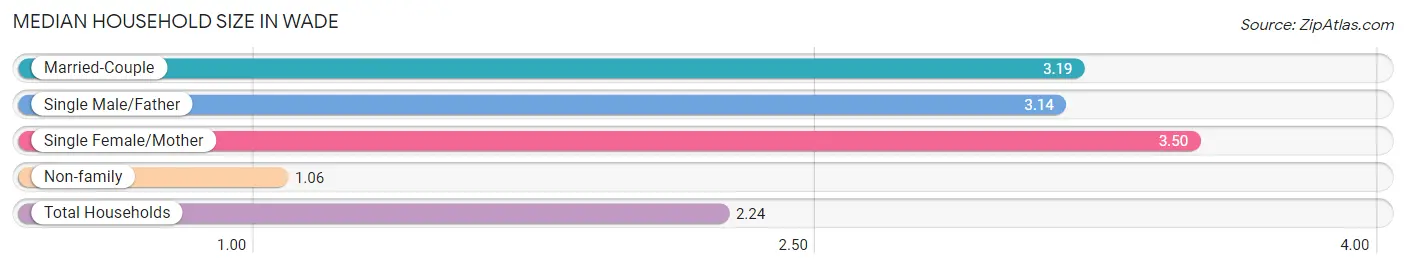
| Household Type | # Households | Household Size |
| Married-Couple | 122 (45.9%) | 3.19 |
| Single Male/Father | 7 (2.6%) | 3.14 |
| Single Female/Mother | 16 (6.0%) | 3.50 |
| Non-family | 121 (45.5%) | 1.06 |
| Total Households | 266 (100.0%) | 2.24 |
Household Size by Marriage Status in Wade
Out of a total of 266 households in Wade, 145 (54.5%) are family households, while 121 (45.5%) are nonfamily households. The most numerous type of family households are 2-person households, comprising 55, and the most common type of nonfamily households are 1-person households, comprising 113.
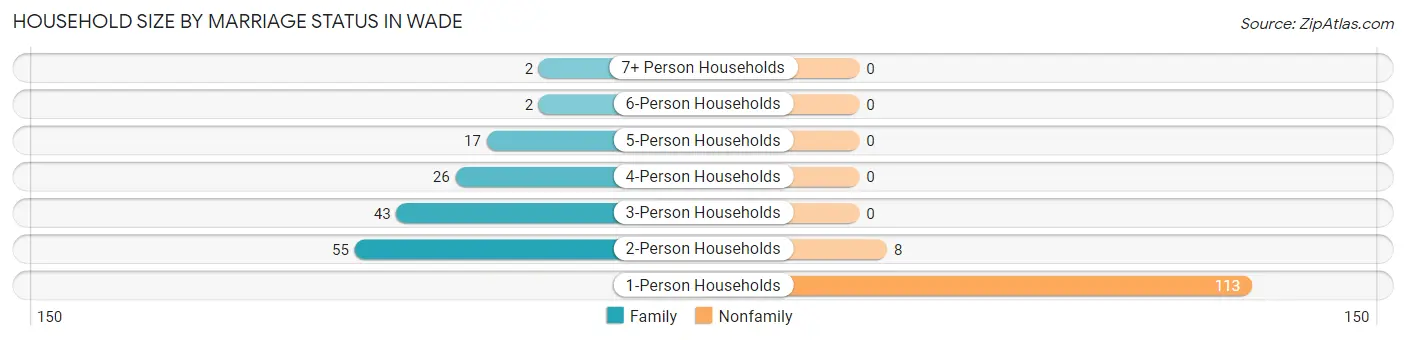
| Household Size | Family Households | Nonfamily Households |
| 1-Person Households | - | 113 (42.5%) |
| 2-Person Households | 55 (20.7%) | 8 (3.0%) |
| 3-Person Households | 43 (16.2%) | 0 (0.0%) |
| 4-Person Households | 26 (9.8%) | 0 (0.0%) |
| 5-Person Households | 17 (6.4%) | 0 (0.0%) |
| 6-Person Households | 2 (0.7%) | 0 (0.0%) |
| 7+ Person Households | 2 (0.7%) | 0 (0.0%) |
| Total | 145 (54.5%) | 121 (45.5%) |
Female Fertility in Wade
Fertility by Age in Wade
Average fertility rate in Wade is 42.0 births per 1,000 women. Women in the age bracket of 20 to 34 years have the highest fertility rate with 52.0 births per 1,000 women. Women in the age bracket of 20 to 34 years acount for 60.0% of all women with births.
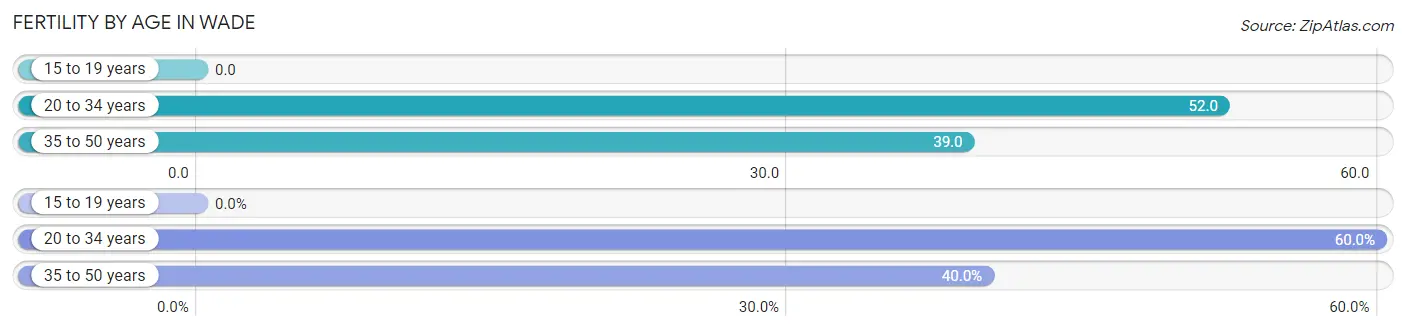
| Age Bracket | Women with Births | Births / 1,000 Women |
| 15 to 19 years | 0 (0.0%) | 0.0 |
| 20 to 34 years | 3 (60.0%) | 52.0 |
| 35 to 50 years | 2 (40.0%) | 39.0 |
| Total | 5 (100.0%) | 42.0 |
Fertility by Age by Marriage Status in Wade
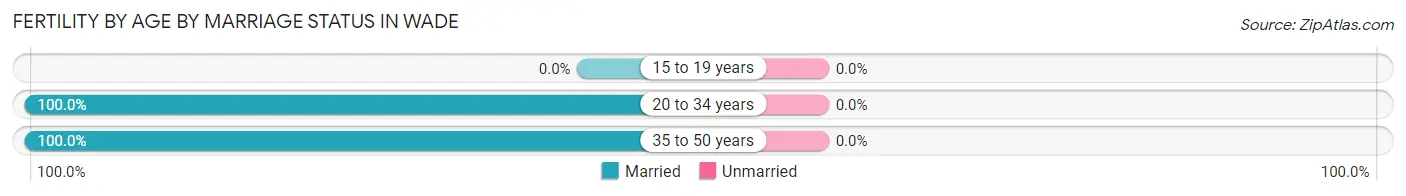
| Age Bracket | Married | Unmarried |
| 15 to 19 years | 0 (0.0%) | 0 (0.0%) |
| 20 to 34 years | 3 (100.0%) | 0 (0.0%) |
| 35 to 50 years | 2 (100.0%) | 0 (0.0%) |
| Total | 5 (100.0%) | 0 (0.0%) |
Fertility by Education in Wade
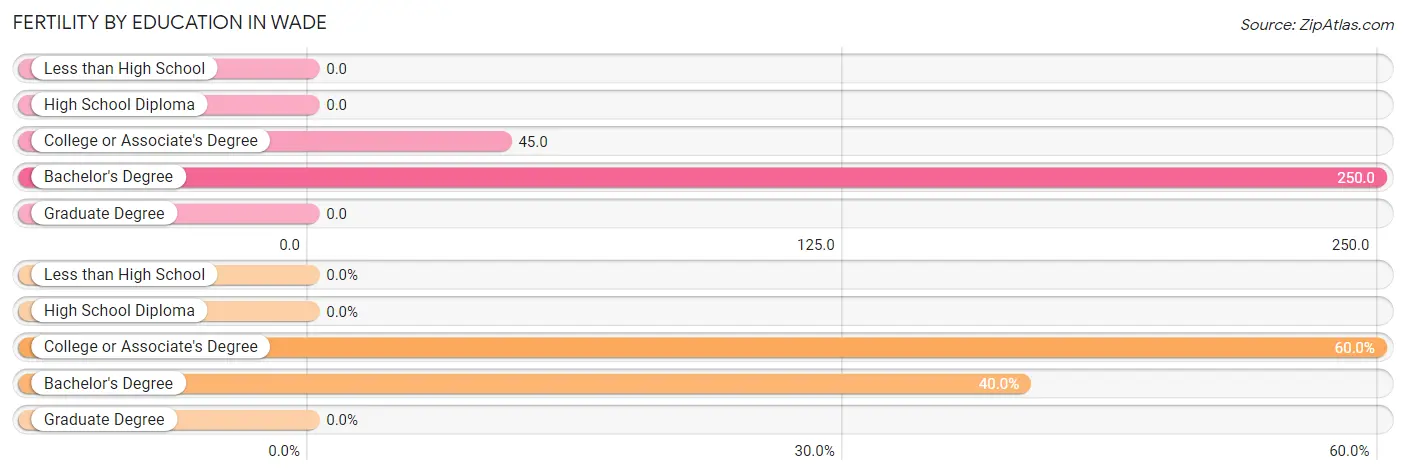
| Educational Attainment | Women with Births | Births / 1,000 Women |
| Less than High School | 0 (0.0%) | 0.0 |
| High School Diploma | 0 (0.0%) | 0.0 |
| College or Associate's Degree | 3 (60.0%) | 45.0 |
| Bachelor's Degree | 2 (40.0%) | 250.0 |
| Graduate Degree | 0 (0.0%) | 0.0 |
| Total | 5 (100.0%) | 42.0 |
Fertility by Education by Marriage Status in Wade
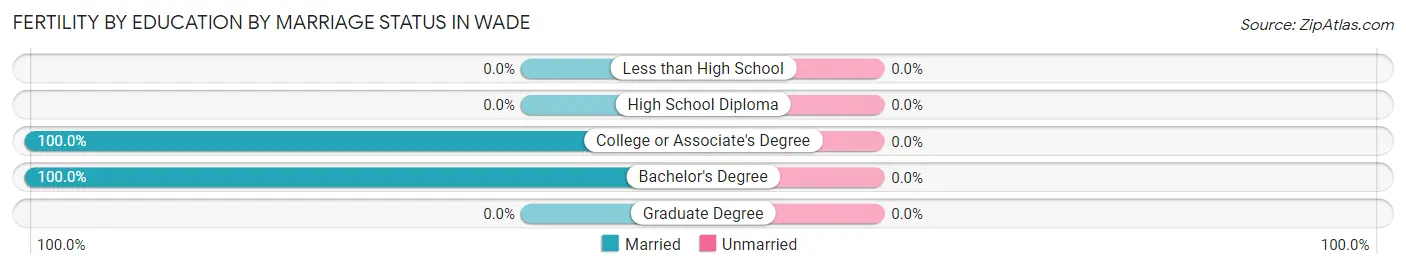
| Educational Attainment | Married | Unmarried |
| Less than High School | 0 (0.0%) | 0 (0.0%) |
| High School Diploma | 0 (0.0%) | 0 (0.0%) |
| College or Associate's Degree | 3 (100.0%) | 0 (0.0%) |
| Bachelor's Degree | 2 (100.0%) | 0 (0.0%) |
| Graduate Degree | 0 (0.0%) | 0 (0.0%) |
| Total | 5 (100.0%) | 0 (0.0%) |
Employment Characteristics in Wade
Employment by Class of Employer in Wade
Among the 225 employed individuals in Wade, private company employees (130 | 57.8%), federal government employees (41 | 18.2%), and self-employed (not incorporated) (20 | 8.9%) make up the most common classes of employment.
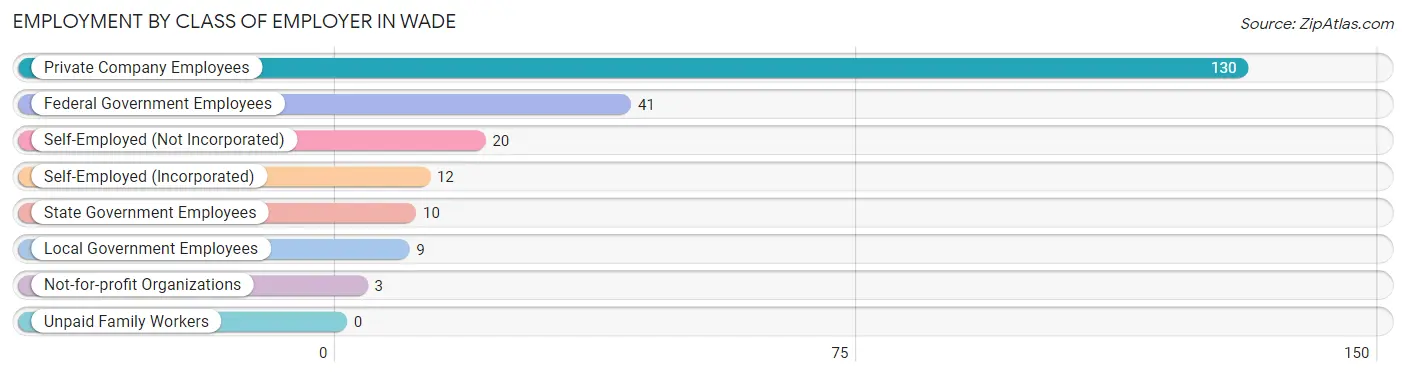
| Employer Class | # Employees | % Employees |
| Private Company Employees | 130 | 57.8% |
| Self-Employed (Incorporated) | 12 | 5.3% |
| Self-Employed (Not Incorporated) | 20 | 8.9% |
| Not-for-profit Organizations | 3 | 1.3% |
| Local Government Employees | 9 | 4.0% |
| State Government Employees | 10 | 4.4% |
| Federal Government Employees | 41 | 18.2% |
| Unpaid Family Workers | 0 | 0.0% |
| Total | 225 | 100.0% |
Employment Status by Age in Wade
According to the labor force statistics for Wade, out of the total population over 16 years of age (459), 56.2% or 258 individuals are in the labor force, with 12.9% or 33 of them unemployed. The age group with the highest labor force participation rate is 45 to 54 years, with 94.4% or 34 individuals in the labor force. Within the labor force, the 20 to 24 years age range has the highest percentage of unemployed individuals, with 38.1% or 8 of them being unemployed.
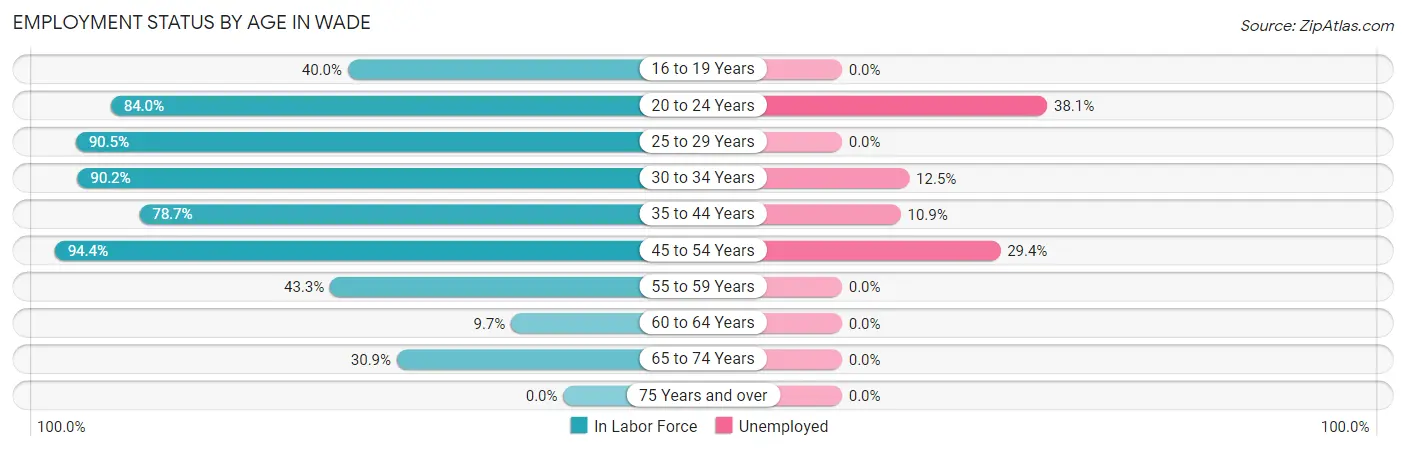
| Age Bracket | In Labor Force | Unemployed |
| 16 to 19 Years | 6 (40.0%) | 0 (0.0%) |
| 20 to 24 Years | 21 (84.0%) | 8 (38.1%) |
| 25 to 29 Years | 19 (90.5%) | 0 (0.0%) |
| 30 to 34 Years | 55 (90.2%) | 7 (12.5%) |
| 35 to 44 Years | 70 (78.7%) | 8 (10.9%) |
| 45 to 54 Years | 34 (94.4%) | 10 (29.4%) |
| 55 to 59 Years | 26 (43.3%) | 0 (0.0%) |
| 60 to 64 Years | 6 (9.7%) | 0 (0.0%) |
| 65 to 74 Years | 21 (30.9%) | 0 (0.0%) |
| 75 Years and over | 0 (0.0%) | 0 (0.0%) |
| Total | 258 (56.2%) | 33 (12.9%) |
Employment Status by Educational Attainment in Wade
According to labor force statistics for Wade, 63.8% of individuals (210) out of the total population between 25 and 64 years of age (329) are in the labor force, with 12.0% or 25 of them being unemployed. The group with the highest labor force participation rate are those with the educational attainment of bachelor's degree or higher, with 82.4% or 61 individuals in the labor force. Within the labor force, individuals with college / associate degree education have the highest percentage of unemployment, with 15.7% or 16 of them being unemployed.
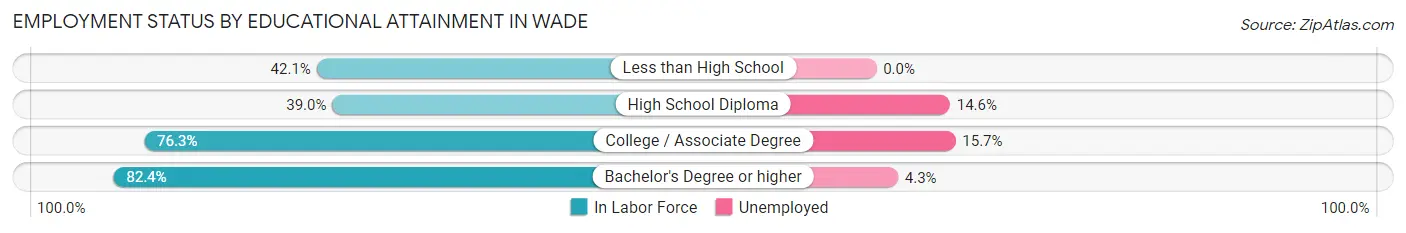
| Educational Attainment | In Labor Force | Unemployed |
| Less than High School | 8 (42.1%) | 0 (0.0%) |
| High School Diploma | 41 (39.0%) | 15 (14.6%) |
| College / Associate Degree | 100 (76.3%) | 21 (15.7%) |
| Bachelor's Degree or higher | 61 (82.4%) | 3 (4.3%) |
| Total | 210 (63.8%) | 39 (12.0%) |
Employment Occupations by Sex in Wade
Management, Business, Science and Arts Occupations
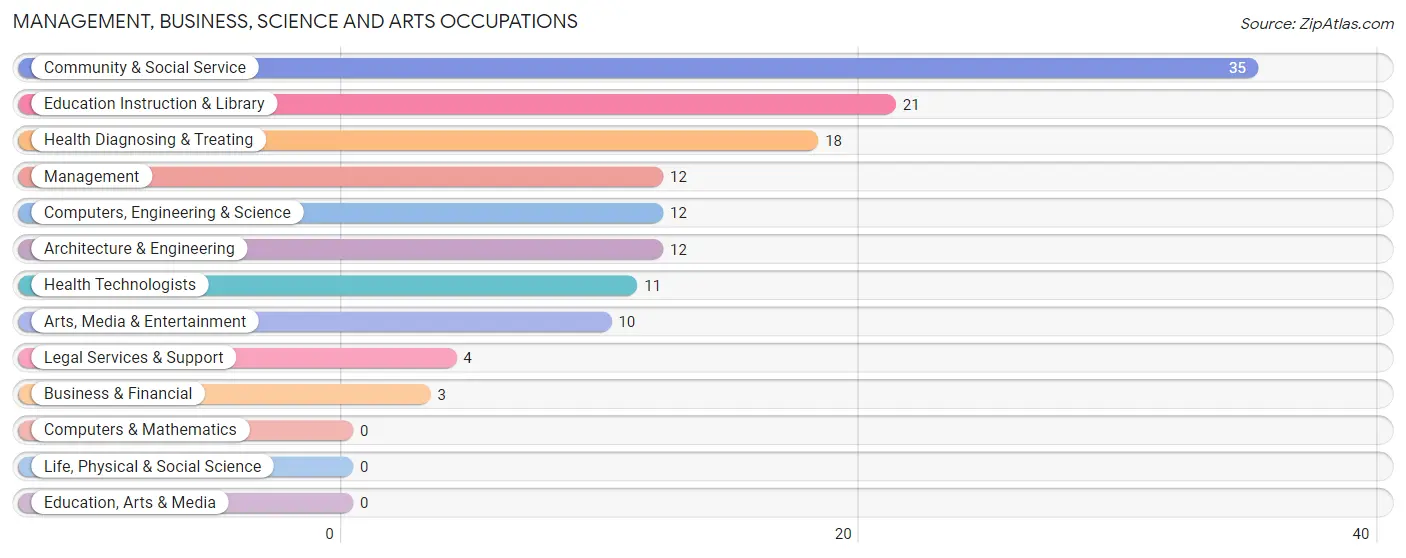
The most common Management, Business, Science and Arts occupations in Wade are Community & Social Service (35 | 17.3%), Education Instruction & Library (21 | 10.4%), Health Diagnosing & Treating (18 | 8.9%), Management (12 | 5.9%), and Computers, Engineering & Science (12 | 5.9%).
Management, Business, Science and Arts Occupations by Sex
Within the Management, Business, Science and Arts occupations in Wade, the most male-oriented occupations are Business & Financial (100.0%), Computers, Engineering & Science (100.0%), and Architecture & Engineering (100.0%), while the most female-oriented occupations are Legal Services & Support (100.0%), Health Diagnosing & Treating (83.3%), and Health Technologists (72.7%).
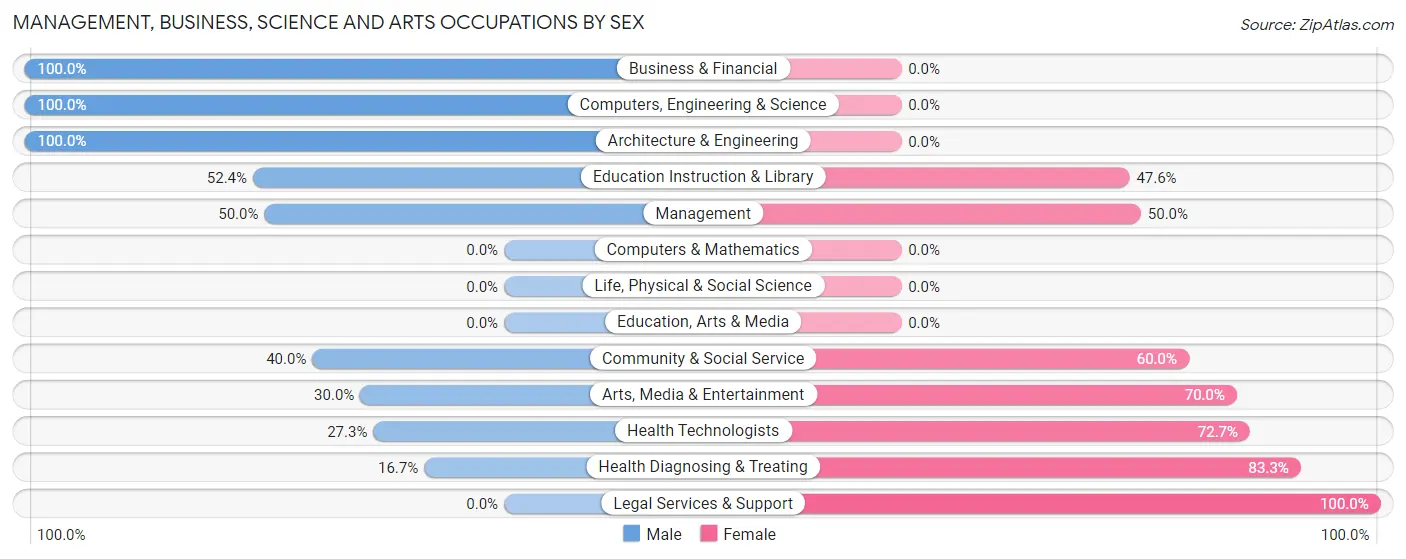
| Occupation | Male | Female |
| Management | 6 (50.0%) | 6 (50.0%) |
| Business & Financial | 3 (100.0%) | 0 (0.0%) |
| Computers, Engineering & Science | 12 (100.0%) | 0 (0.0%) |
| Computers & Mathematics | 0 (0.0%) | 0 (0.0%) |
| Architecture & Engineering | 12 (100.0%) | 0 (0.0%) |
| Life, Physical & Social Science | 0 (0.0%) | 0 (0.0%) |
| Community & Social Service | 14 (40.0%) | 21 (60.0%) |
| Education, Arts & Media | 0 (0.0%) | 0 (0.0%) |
| Legal Services & Support | 0 (0.0%) | 4 (100.0%) |
| Education Instruction & Library | 11 (52.4%) | 10 (47.6%) |
| Arts, Media & Entertainment | 3 (30.0%) | 7 (70.0%) |
| Health Diagnosing & Treating | 3 (16.7%) | 15 (83.3%) |
| Health Technologists | 3 (27.3%) | 8 (72.7%) |
| Total (Category) | 38 (47.5%) | 42 (52.5%) |
| Total (Overall) | 111 (54.9%) | 91 (45.1%) |
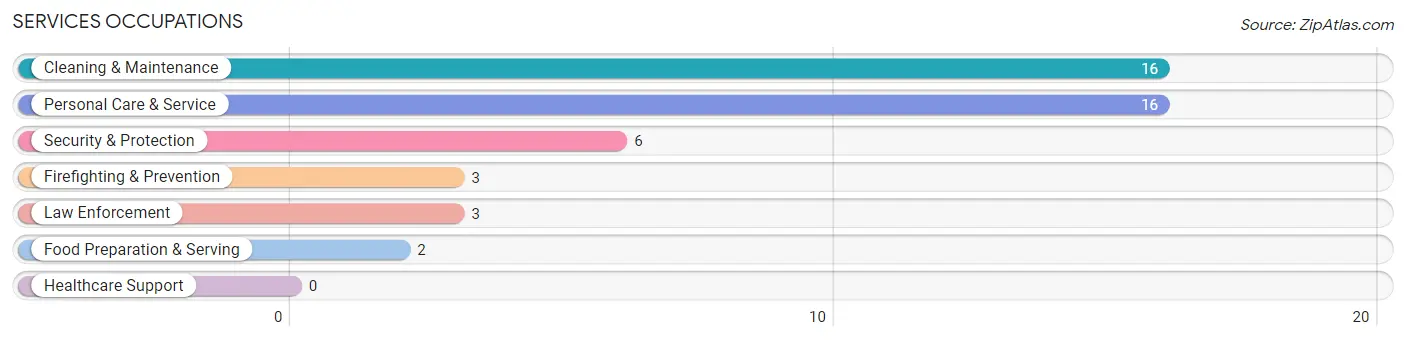
Services Occupations
The most common Services occupations in Wade are Cleaning & Maintenance (16 | 7.9%), Personal Care & Service (16 | 7.9%), Security & Protection (6 | 3.0%), Firefighting & Prevention (3 | 1.5%), and Law Enforcement (3 | 1.5%).
Services Occupations by Sex
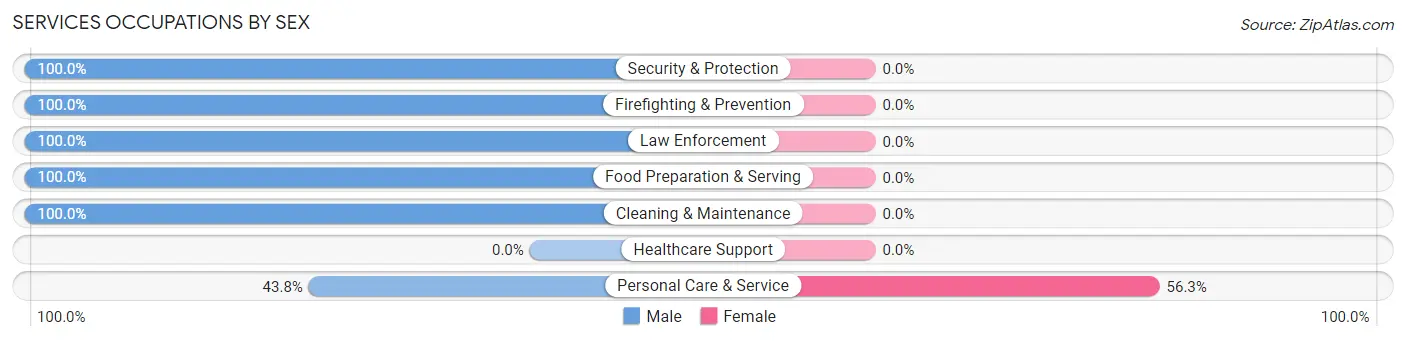
| Occupation | Male | Female |
| Healthcare Support | 0 (0.0%) | 0 (0.0%) |
| Security & Protection | 6 (100.0%) | 0 (0.0%) |
| Firefighting & Prevention | 3 (100.0%) | 0 (0.0%) |
| Law Enforcement | 3 (100.0%) | 0 (0.0%) |
| Food Preparation & Serving | 2 (100.0%) | 0 (0.0%) |
| Cleaning & Maintenance | 16 (100.0%) | 0 (0.0%) |
| Personal Care & Service | 7 (43.8%) | 9 (56.2%) |
| Total (Category) | 31 (77.5%) | 9 (22.5%) |
| Total (Overall) | 111 (54.9%) | 91 (45.1%) |
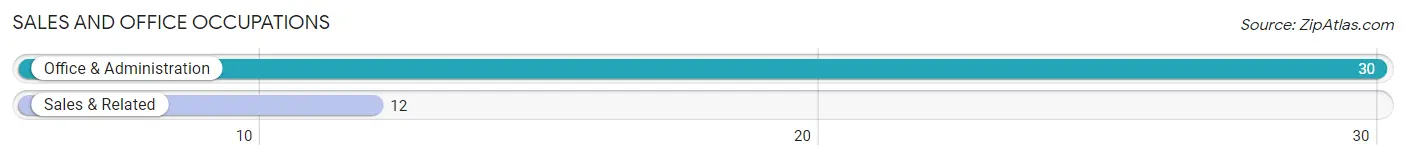
Sales and Office Occupations
The most common Sales and Office occupations in Wade are Office & Administration (30 | 14.8%), and Sales & Related (12 | 5.9%).
Sales and Office Occupations by Sex

| Occupation | Male | Female |
| Sales & Related | 0 (0.0%) | 12 (100.0%) |
| Office & Administration | 7 (23.3%) | 23 (76.7%) |
| Total (Category) | 7 (16.7%) | 35 (83.3%) |
| Total (Overall) | 111 (54.9%) | 91 (45.1%) |
Natural Resources, Construction and Maintenance Occupations
The most common Natural Resources, Construction and Maintenance occupations in Wade are Construction & Extraction (17 | 8.4%), and Installation, Maintenance & Repair (6 | 3.0%).
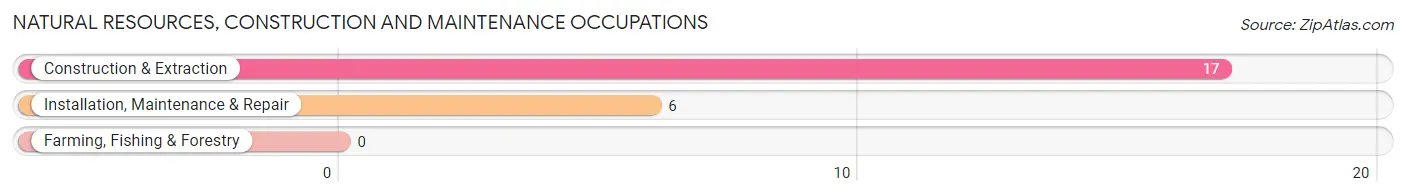
Natural Resources, Construction and Maintenance Occupations by Sex

| Occupation | Male | Female |
| Farming, Fishing & Forestry | 0 (0.0%) | 0 (0.0%) |
| Construction & Extraction | 17 (100.0%) | 0 (0.0%) |
| Installation, Maintenance & Repair | 6 (100.0%) | 0 (0.0%) |
| Total (Category) | 23 (100.0%) | 0 (0.0%) |
| Total (Overall) | 111 (54.9%) | 91 (45.1%) |
Production, Transportation and Moving Occupations
The most common Production, Transportation and Moving occupations in Wade are Production (10 | 5.0%), Transportation (6 | 3.0%), and Material Moving (1 | 0.5%).
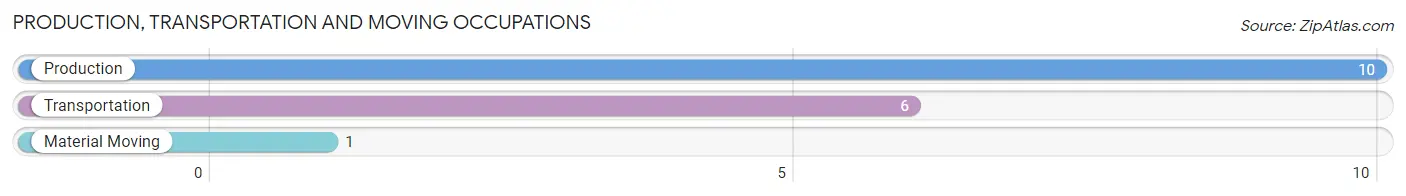
Production, Transportation and Moving Occupations by Sex

| Occupation | Male | Female |
| Production | 5 (50.0%) | 5 (50.0%) |
| Transportation | 6 (100.0%) | 0 (0.0%) |
| Material Moving | 1 (100.0%) | 0 (0.0%) |
| Total (Category) | 12 (70.6%) | 5 (29.4%) |
| Total (Overall) | 111 (54.9%) | 91 (45.1%) |
Employment Industries by Sex in Wade
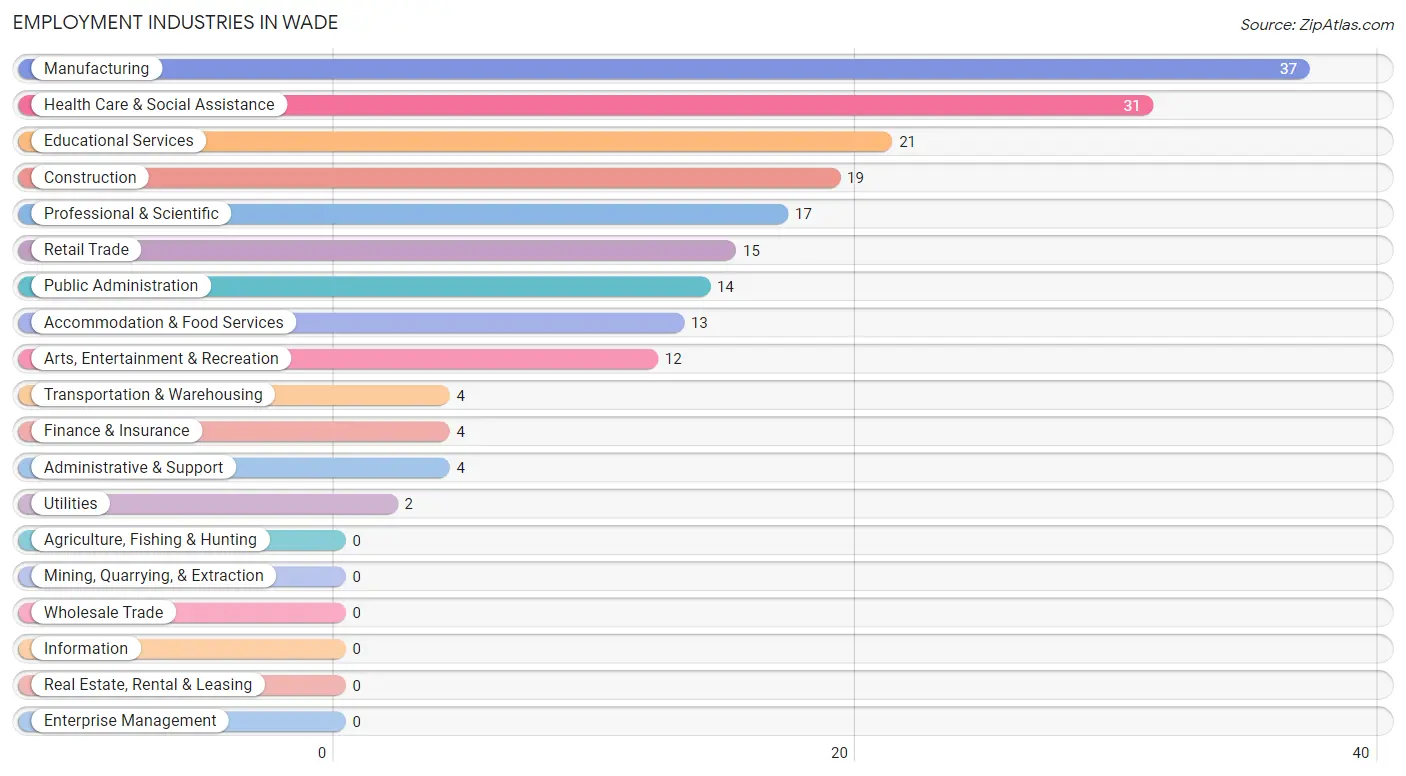
Employment Industries in Wade
The major employment industries in Wade include Manufacturing (37 | 18.3%), Health Care & Social Assistance (31 | 15.3%), Educational Services (21 | 10.4%), Construction (19 | 9.4%), and Professional & Scientific (17 | 8.4%).
Employment Industries by Sex in Wade
The Wade industries that see more men than women are Construction (100.0%), Utilities (100.0%), and Administrative & Support (100.0%), whereas the industries that tend to have a higher number of women are Transportation & Warehousing (100.0%), Health Care & Social Assistance (90.3%), and Retail Trade (60.0%).
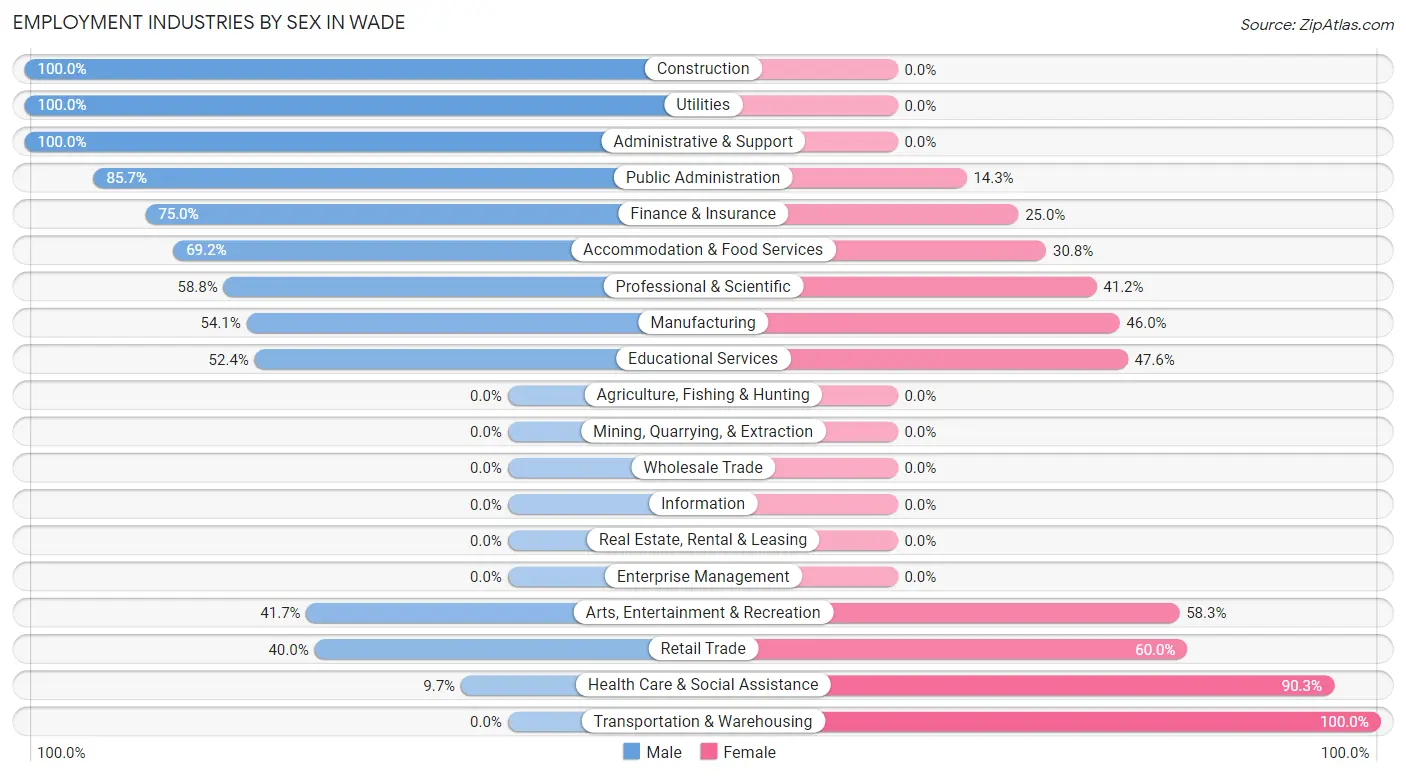
| Industry | Male | Female |
| Agriculture, Fishing & Hunting | 0 (0.0%) | 0 (0.0%) |
| Mining, Quarrying, & Extraction | 0 (0.0%) | 0 (0.0%) |
| Construction | 19 (100.0%) | 0 (0.0%) |
| Manufacturing | 20 (54.0%) | 17 (46.0%) |
| Wholesale Trade | 0 (0.0%) | 0 (0.0%) |
| Retail Trade | 6 (40.0%) | 9 (60.0%) |
| Transportation & Warehousing | 0 (0.0%) | 4 (100.0%) |
| Utilities | 2 (100.0%) | 0 (0.0%) |
| Information | 0 (0.0%) | 0 (0.0%) |
| Finance & Insurance | 3 (75.0%) | 1 (25.0%) |
| Real Estate, Rental & Leasing | 0 (0.0%) | 0 (0.0%) |
| Professional & Scientific | 10 (58.8%) | 7 (41.2%) |
| Enterprise Management | 0 (0.0%) | 0 (0.0%) |
| Administrative & Support | 4 (100.0%) | 0 (0.0%) |
| Educational Services | 11 (52.4%) | 10 (47.6%) |
| Health Care & Social Assistance | 3 (9.7%) | 28 (90.3%) |
| Arts, Entertainment & Recreation | 5 (41.7%) | 7 (58.3%) |
| Accommodation & Food Services | 9 (69.2%) | 4 (30.8%) |
| Public Administration | 12 (85.7%) | 2 (14.3%) |
| Total | 111 (54.9%) | 91 (45.1%) |
Education in Wade
School Enrollment in Wade
The most common levels of schooling among the 147 students in Wade are elementary school (42 | 28.6%), college / undergraduate (32 | 21.8%), and high school (23 | 15.7%).
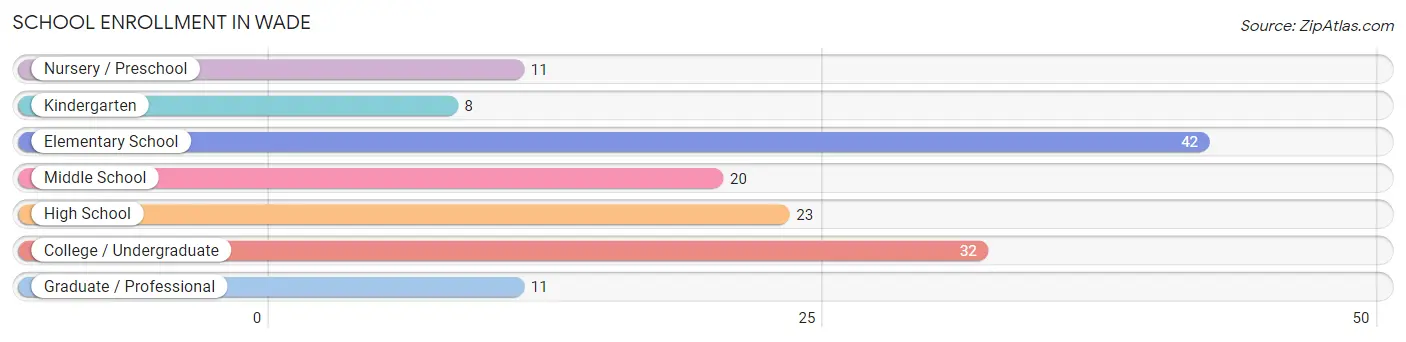
| School Level | # Students | % Students |
| Nursery / Preschool | 11 | 7.5% |
| Kindergarten | 8 | 5.4% |
| Elementary School | 42 | 28.6% |
| Middle School | 20 | 13.6% |
| High School | 23 | 15.7% |
| College / Undergraduate | 32 | 21.8% |
| Graduate / Professional | 11 | 7.5% |
| Total | 147 | 100.0% |
School Enrollment by Age by Funding Source in Wade
Out of a total of 147 students who are enrolled in schools in Wade, 33 (22.4%) attend a private institution, while the remaining 114 (77.6%) are enrolled in public schools. The age group of 3 to 4 year olds has the highest likelihood of being enrolled in private schools, with 6 (66.7% in the age bracket) enrolled. Conversely, the age group of 10 to 14 year olds has the lowest likelihood of being enrolled in a private school, with 31 (100.0% in the age bracket) attending a public institution.
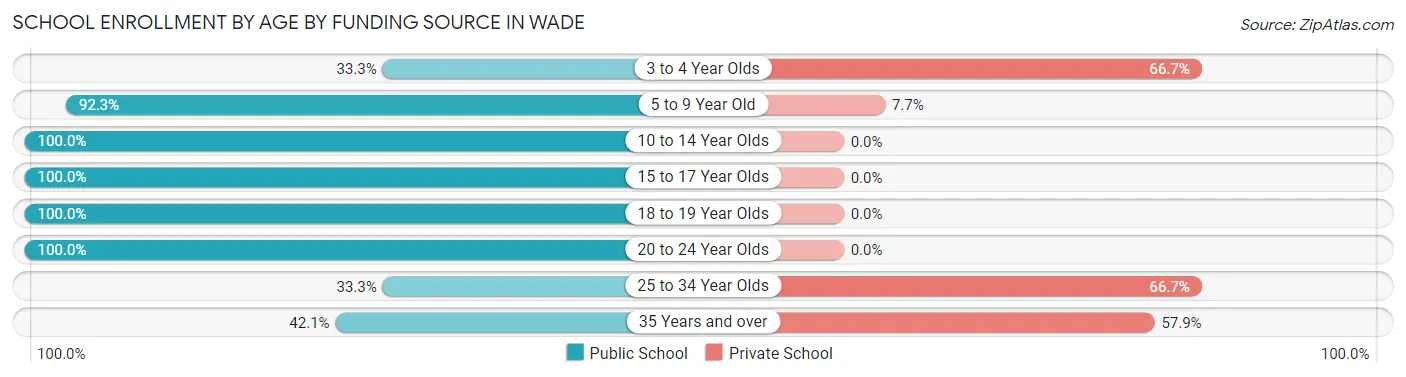
| Age Bracket | Public School | Private School |
| 3 to 4 Year Olds | 3 (33.3%) | 6 (66.7%) |
| 5 to 9 Year Old | 48 (92.3%) | 4 (7.7%) |
| 10 to 14 Year Olds | 31 (100.0%) | 0 (0.0%) |
| 15 to 17 Year Olds | 12 (100.0%) | 0 (0.0%) |
| 18 to 19 Year Olds | 2 (100.0%) | 0 (0.0%) |
| 20 to 24 Year Olds | 4 (100.0%) | 0 (0.0%) |
| 25 to 34 Year Olds | 6 (33.3%) | 12 (66.7%) |
| 35 Years and over | 8 (42.1%) | 11 (57.9%) |
| Total | 114 (77.6%) | 33 (22.4%) |
Educational Attainment by Field of Study in Wade
Business (22 | 27.2%), education (21 | 25.9%), arts & humanities (21 | 25.9%), social sciences (8 | 9.9%), and science & technology (3 | 3.7%) are the most common fields of study among 81 individuals in Wade who have obtained a bachelor's degree or higher.
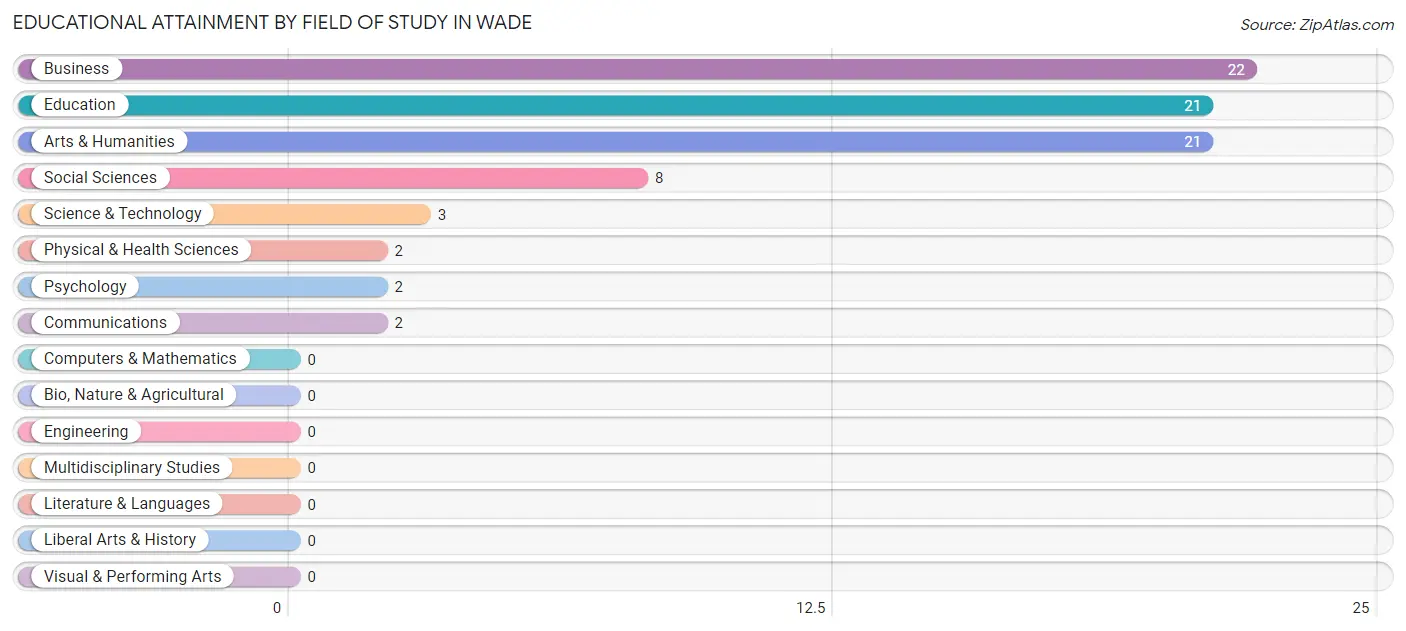
| Field of Study | # Graduates | % Graduates |
| Computers & Mathematics | 0 | 0.0% |
| Bio, Nature & Agricultural | 0 | 0.0% |
| Physical & Health Sciences | 2 | 2.5% |
| Psychology | 2 | 2.5% |
| Social Sciences | 8 | 9.9% |
| Engineering | 0 | 0.0% |
| Multidisciplinary Studies | 0 | 0.0% |
| Science & Technology | 3 | 3.7% |
| Business | 22 | 27.2% |
| Education | 21 | 25.9% |
| Literature & Languages | 0 | 0.0% |
| Liberal Arts & History | 0 | 0.0% |
| Visual & Performing Arts | 0 | 0.0% |
| Communications | 2 | 2.5% |
| Arts & Humanities | 21 | 25.9% |
| Total | 81 | 100.0% |
Transportation & Commute in Wade
Vehicle Availability by Sex in Wade
The most prevalent vehicle ownership categories in Wade are males with 3 vehicles (56, accounting for 42.1%) and females with 3 vehicles (30, making up 60.9%).
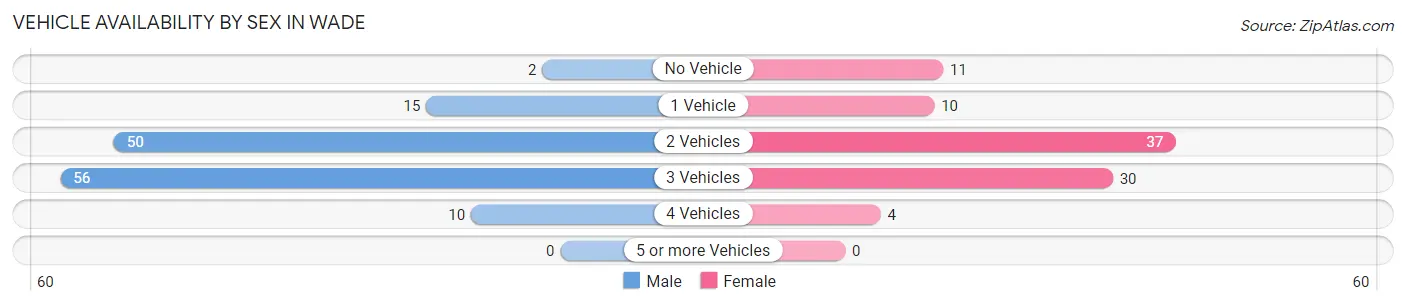
| Vehicles Available | Male | Female |
| No Vehicle | 2 (1.5%) | 11 (12.0%) |
| 1 Vehicle | 15 (11.3%) | 10 (10.9%) |
| 2 Vehicles | 50 (37.6%) | 37 (40.2%) |
| 3 Vehicles | 56 (42.1%) | 30 (32.6%) |
| 4 Vehicles | 10 (7.5%) | 4 (4.3%) |
| 5 or more Vehicles | 0 (0.0%) | 0 (0.0%) |
| Total | 133 (100.0%) | 92 (100.0%) |
Commute Time in Wade
The most frequently occuring commute durations in Wade are 20 to 24 minutes (57 commuters, 27.4%), 25 to 29 minutes (39 commuters, 18.8%), and 30 to 34 minutes (30 commuters, 14.4%).
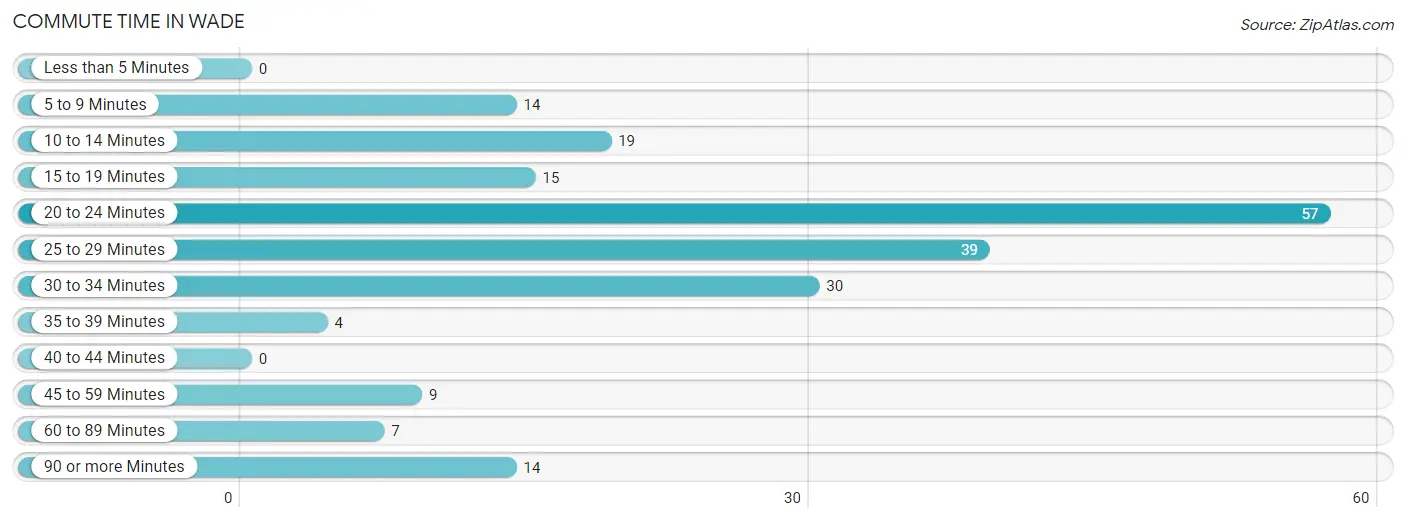
| Commute Time | # Commuters | % Commuters |
| Less than 5 Minutes | 0 | 0.0% |
| 5 to 9 Minutes | 14 | 6.7% |
| 10 to 14 Minutes | 19 | 9.1% |
| 15 to 19 Minutes | 15 | 7.2% |
| 20 to 24 Minutes | 57 | 27.4% |
| 25 to 29 Minutes | 39 | 18.8% |
| 30 to 34 Minutes | 30 | 14.4% |
| 35 to 39 Minutes | 4 | 1.9% |
| 40 to 44 Minutes | 0 | 0.0% |
| 45 to 59 Minutes | 9 | 4.3% |
| 60 to 89 Minutes | 7 | 3.4% |
| 90 or more Minutes | 14 | 6.7% |
Commute Time by Sex in Wade
The most common commute times in Wade are 20 to 24 minutes (36 commuters, 28.8%) for males and 20 to 24 minutes (21 commuters, 25.3%) for females.
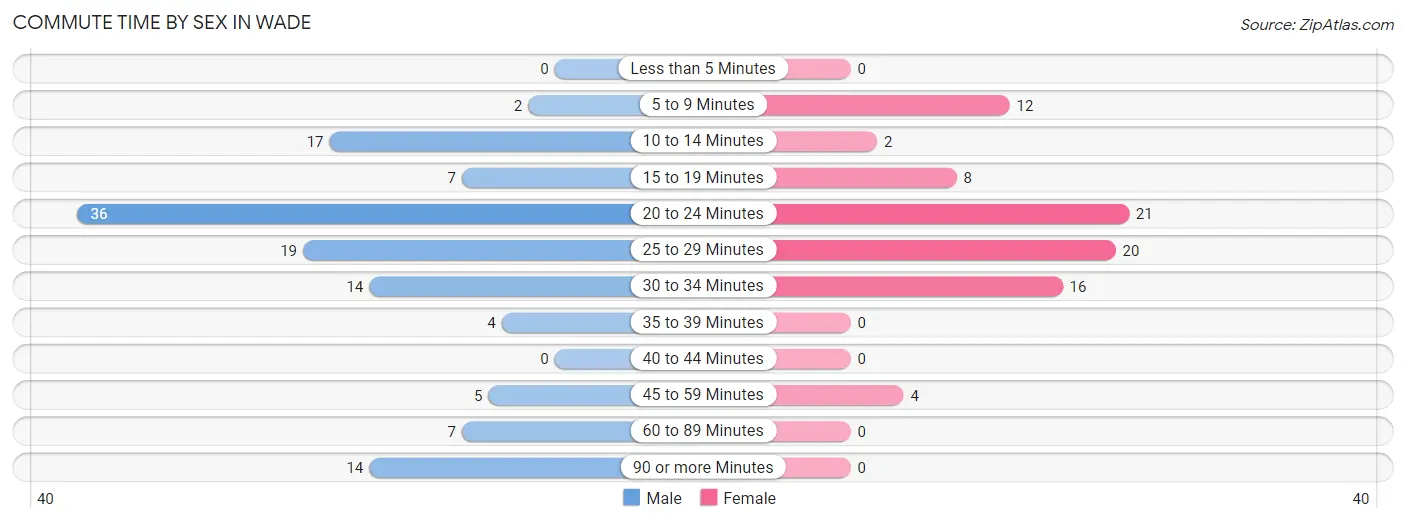
| Commute Time | Male | Female |
| Less than 5 Minutes | 0 (0.0%) | 0 (0.0%) |
| 5 to 9 Minutes | 2 (1.6%) | 12 (14.5%) |
| 10 to 14 Minutes | 17 (13.6%) | 2 (2.4%) |
| 15 to 19 Minutes | 7 (5.6%) | 8 (9.6%) |
| 20 to 24 Minutes | 36 (28.8%) | 21 (25.3%) |
| 25 to 29 Minutes | 19 (15.2%) | 20 (24.1%) |
| 30 to 34 Minutes | 14 (11.2%) | 16 (19.3%) |
| 35 to 39 Minutes | 4 (3.2%) | 0 (0.0%) |
| 40 to 44 Minutes | 0 (0.0%) | 0 (0.0%) |
| 45 to 59 Minutes | 5 (4.0%) | 4 (4.8%) |
| 60 to 89 Minutes | 7 (5.6%) | 0 (0.0%) |
| 90 or more Minutes | 14 (11.2%) | 0 (0.0%) |
Time of Departure to Work by Sex in Wade
The most frequent times of departure to work in Wade are 6:30 AM to 6:59 AM (28, 22.4%) for males and 7:00 AM to 7:29 AM (18, 21.7%) for females.
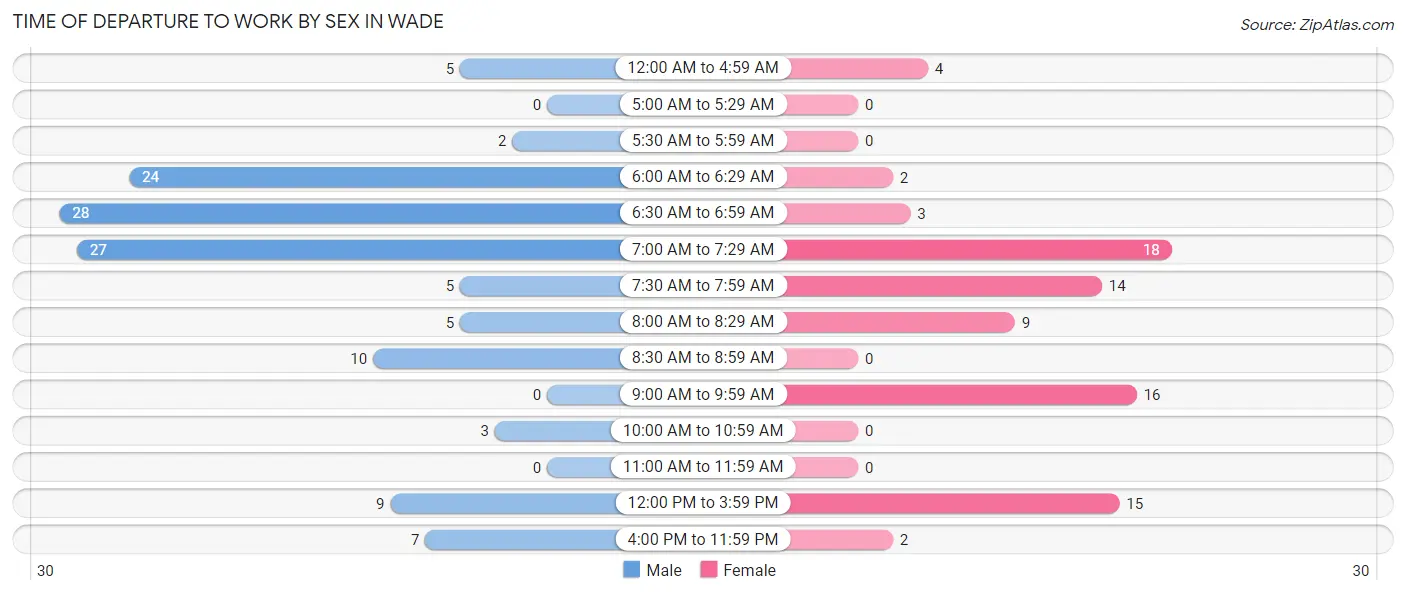
| Time of Departure | Male | Female |
| 12:00 AM to 4:59 AM | 5 (4.0%) | 4 (4.8%) |
| 5:00 AM to 5:29 AM | 0 (0.0%) | 0 (0.0%) |
| 5:30 AM to 5:59 AM | 2 (1.6%) | 0 (0.0%) |
| 6:00 AM to 6:29 AM | 24 (19.2%) | 2 (2.4%) |
| 6:30 AM to 6:59 AM | 28 (22.4%) | 3 (3.6%) |
| 7:00 AM to 7:29 AM | 27 (21.6%) | 18 (21.7%) |
| 7:30 AM to 7:59 AM | 5 (4.0%) | 14 (16.9%) |
| 8:00 AM to 8:29 AM | 5 (4.0%) | 9 (10.8%) |
| 8:30 AM to 8:59 AM | 10 (8.0%) | 0 (0.0%) |
| 9:00 AM to 9:59 AM | 0 (0.0%) | 16 (19.3%) |
| 10:00 AM to 10:59 AM | 3 (2.4%) | 0 (0.0%) |
| 11:00 AM to 11:59 AM | 0 (0.0%) | 0 (0.0%) |
| 12:00 PM to 3:59 PM | 9 (7.2%) | 15 (18.1%) |
| 4:00 PM to 11:59 PM | 7 (5.6%) | 2 (2.4%) |
| Total | 125 (100.0%) | 83 (100.0%) |
Housing Occupancy in Wade
Occupancy by Ownership in Wade
Of the total 266 dwellings in Wade, owner-occupied units account for 170 (63.9%), while renter-occupied units make up 96 (36.1%).
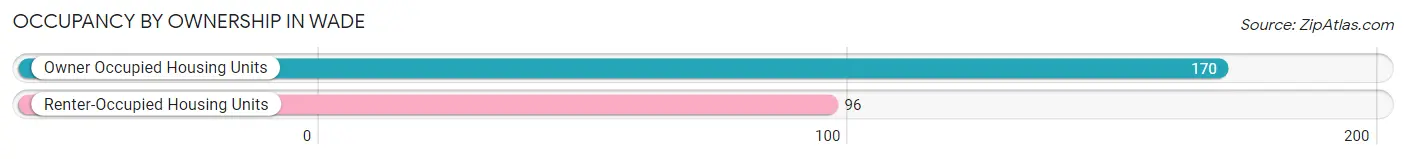
| Occupancy | # Housing Units | % Housing Units |
| Owner Occupied Housing Units | 170 | 63.9% |
| Renter-Occupied Housing Units | 96 | 36.1% |
| Total Occupied Housing Units | 266 | 100.0% |
Occupancy by Household Size in Wade
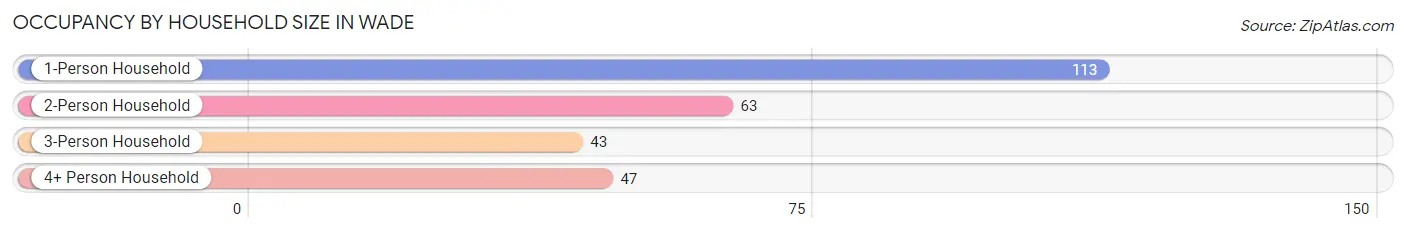
| Household Size | # Housing Units | % Housing Units |
| 1-Person Household | 113 | 42.5% |
| 2-Person Household | 63 | 23.7% |
| 3-Person Household | 43 | 16.2% |
| 4+ Person Household | 47 | 17.7% |
| Total Housing Units | 266 | 100.0% |
Occupancy by Ownership by Household Size in Wade
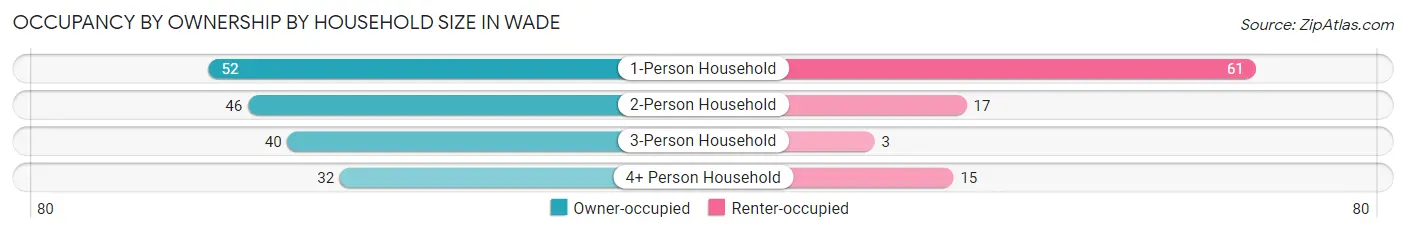
| Household Size | Owner-occupied | Renter-occupied |
| 1-Person Household | 52 (46.0%) | 61 (54.0%) |
| 2-Person Household | 46 (73.0%) | 17 (27.0%) |
| 3-Person Household | 40 (93.0%) | 3 (7.0%) |
| 4+ Person Household | 32 (68.1%) | 15 (31.9%) |
| Total Housing Units | 170 (63.9%) | 96 (36.1%) |
Occupancy by Educational Attainment in Wade
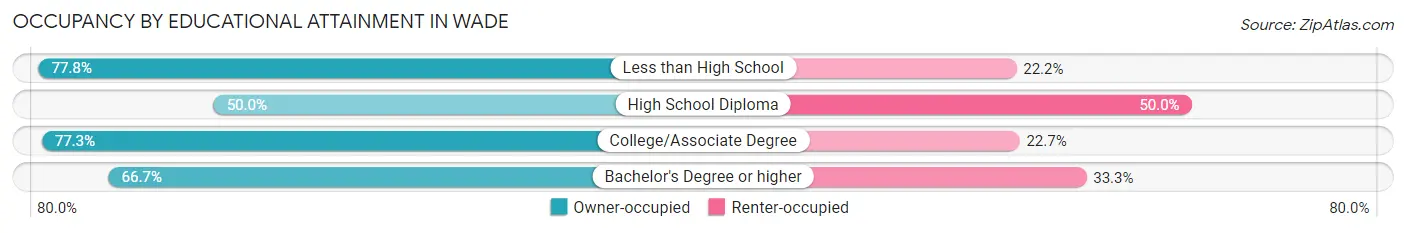
| Household Size | Owner-occupied | Renter-occupied |
| Less than High School | 14 (77.8%) | 4 (22.2%) |
| High School Diploma | 56 (50.0%) | 56 (50.0%) |
| College/Associate Degree | 68 (77.3%) | 20 (22.7%) |
| Bachelor's Degree or higher | 32 (66.7%) | 16 (33.3%) |
Occupancy by Age of Householder in Wade
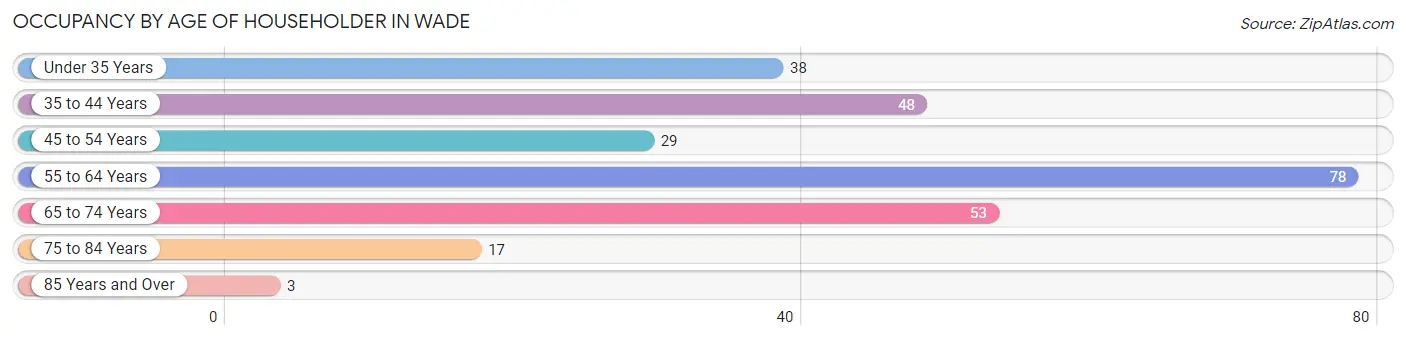
| Age Bracket | # Households | % Households |
| Under 35 Years | 38 | 14.3% |
| 35 to 44 Years | 48 | 18.0% |
| 45 to 54 Years | 29 | 10.9% |
| 55 to 64 Years | 78 | 29.3% |
| 65 to 74 Years | 53 | 19.9% |
| 75 to 84 Years | 17 | 6.4% |
| 85 Years and Over | 3 | 1.1% |
| Total | 266 | 100.0% |
Housing Finances in Wade
Median Income by Occupancy in Wade
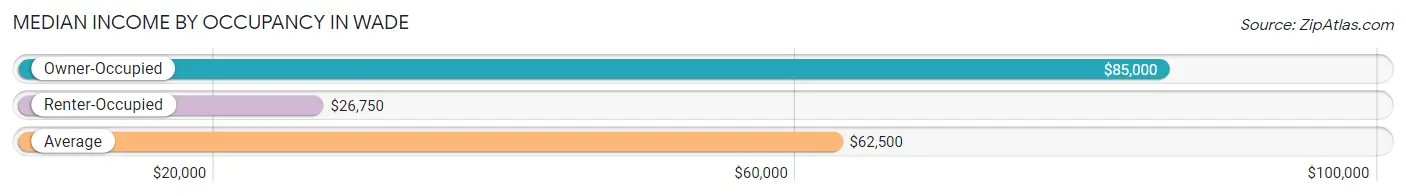
| Occupancy Type | # Households | Median Income |
| Owner-Occupied | 170 (63.9%) | $85,000 |
| Renter-Occupied | 96 (36.1%) | $26,750 |
| Average | 266 (100.0%) | $62,500 |
Occupancy by Householder Income Bracket in Wade
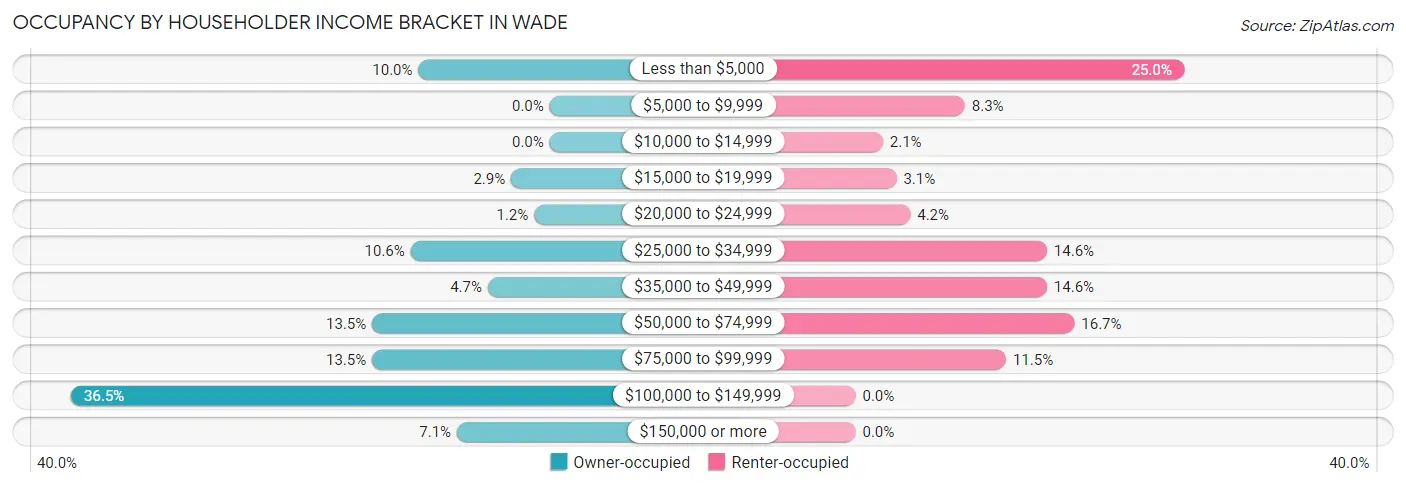
| Income Bracket | Owner-occupied | Renter-occupied |
| Less than $5,000 | 17 (10.0%) | 24 (25.0%) |
| $5,000 to $9,999 | 0 (0.0%) | 8 (8.3%) |
| $10,000 to $14,999 | 0 (0.0%) | 2 (2.1%) |
| $15,000 to $19,999 | 5 (2.9%) | 3 (3.1%) |
| $20,000 to $24,999 | 2 (1.2%) | 4 (4.2%) |
| $25,000 to $34,999 | 18 (10.6%) | 14 (14.6%) |
| $35,000 to $49,999 | 8 (4.7%) | 14 (14.6%) |
| $50,000 to $74,999 | 23 (13.5%) | 16 (16.7%) |
| $75,000 to $99,999 | 23 (13.5%) | 11 (11.5%) |
| $100,000 to $149,999 | 62 (36.5%) | 0 (0.0%) |
| $150,000 or more | 12 (7.1%) | 0 (0.0%) |
| Total | 170 (100.0%) | 96 (100.0%) |
Monthly Housing Cost Tiers in Wade
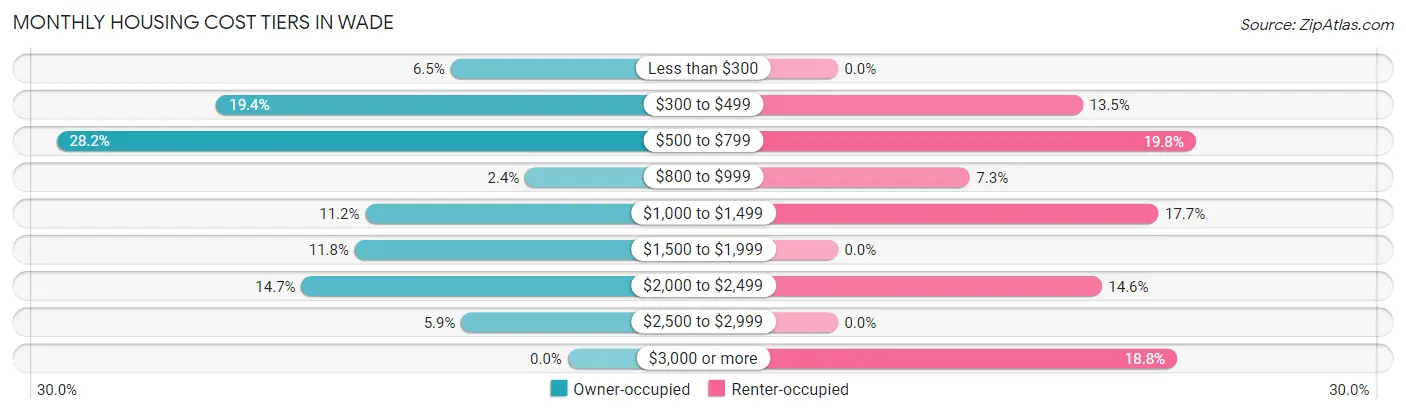
| Monthly Cost | Owner-occupied | Renter-occupied |
| Less than $300 | 11 (6.5%) | 0 (0.0%) |
| $300 to $499 | 33 (19.4%) | 13 (13.5%) |
| $500 to $799 | 48 (28.2%) | 19 (19.8%) |
| $800 to $999 | 4 (2.4%) | 7 (7.3%) |
| $1,000 to $1,499 | 19 (11.2%) | 17 (17.7%) |
| $1,500 to $1,999 | 20 (11.8%) | 0 (0.0%) |
| $2,000 to $2,499 | 25 (14.7%) | 14 (14.6%) |
| $2,500 to $2,999 | 10 (5.9%) | 0 (0.0%) |
| $3,000 or more | 0 (0.0%) | 18 (18.8%) |
| Total | 170 (100.0%) | 96 (100.0%) |
Physical Housing Characteristics in Wade
Housing Structures in Wade
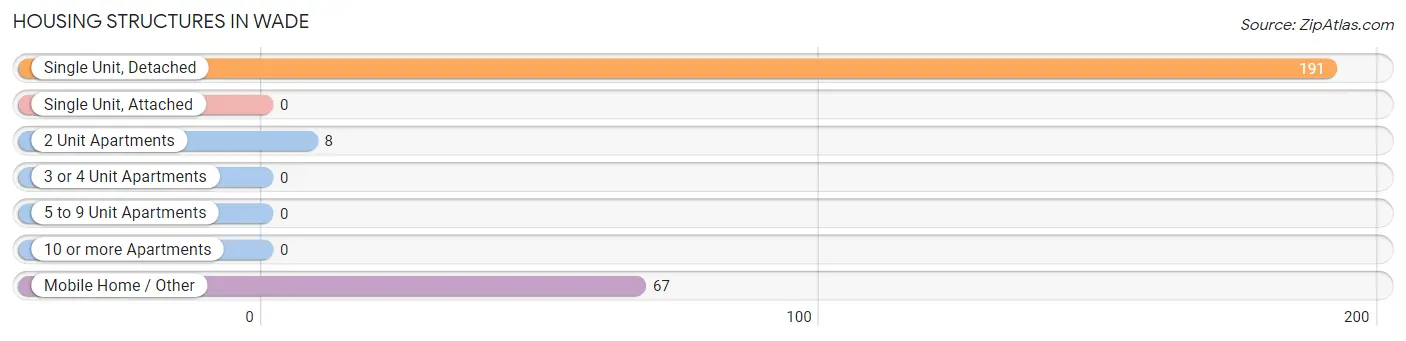
| Structure Type | # Housing Units | % Housing Units |
| Single Unit, Detached | 191 | 71.8% |
| Single Unit, Attached | 0 | 0.0% |
| 2 Unit Apartments | 8 | 3.0% |
| 3 or 4 Unit Apartments | 0 | 0.0% |
| 5 to 9 Unit Apartments | 0 | 0.0% |
| 10 or more Apartments | 0 | 0.0% |
| Mobile Home / Other | 67 | 25.2% |
| Total | 266 | 100.0% |
Housing Structures by Occupancy in Wade
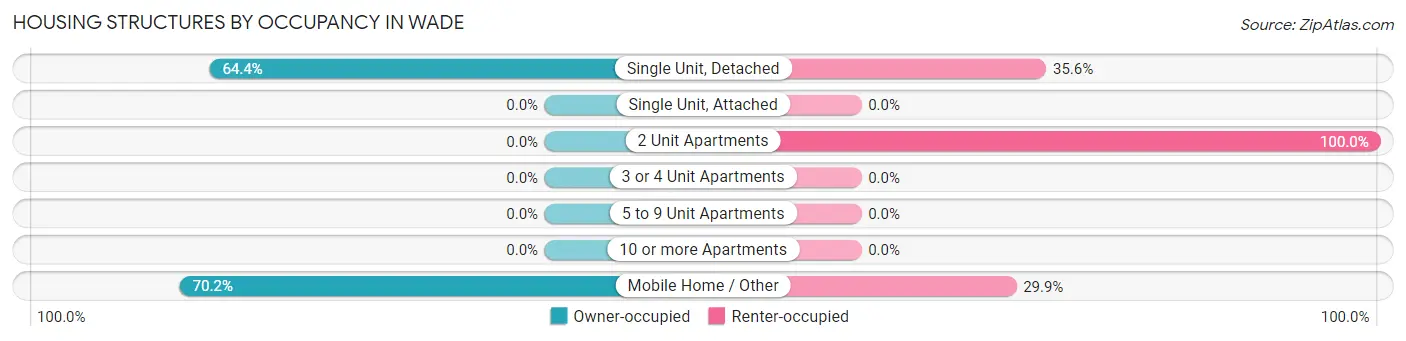
| Structure Type | Owner-occupied | Renter-occupied |
| Single Unit, Detached | 123 (64.4%) | 68 (35.6%) |
| Single Unit, Attached | 0 (0.0%) | 0 (0.0%) |
| 2 Unit Apartments | 0 (0.0%) | 8 (100.0%) |
| 3 or 4 Unit Apartments | 0 (0.0%) | 0 (0.0%) |
| 5 to 9 Unit Apartments | 0 (0.0%) | 0 (0.0%) |
| 10 or more Apartments | 0 (0.0%) | 0 (0.0%) |
| Mobile Home / Other | 47 (70.2%) | 20 (29.8%) |
| Total | 170 (63.9%) | 96 (36.1%) |
Housing Structures by Number of Rooms in Wade
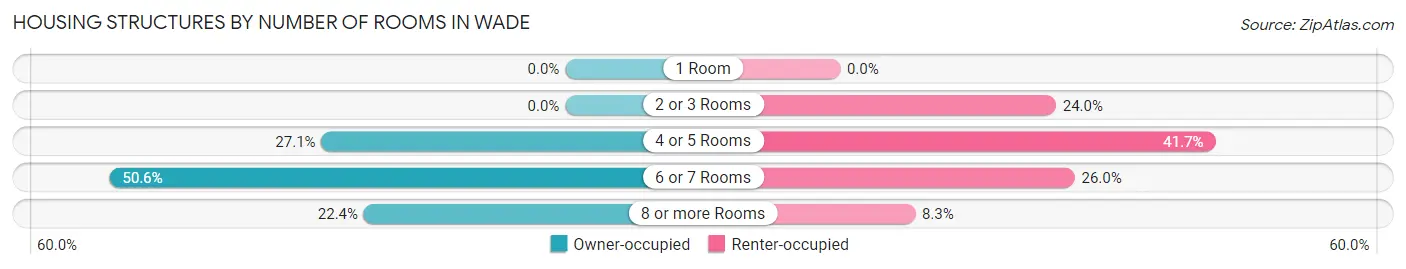
| Number of Rooms | Owner-occupied | Renter-occupied |
| 1 Room | 0 (0.0%) | 0 (0.0%) |
| 2 or 3 Rooms | 0 (0.0%) | 23 (24.0%) |
| 4 or 5 Rooms | 46 (27.1%) | 40 (41.7%) |
| 6 or 7 Rooms | 86 (50.6%) | 25 (26.0%) |
| 8 or more Rooms | 38 (22.4%) | 8 (8.3%) |
| Total | 170 (100.0%) | 96 (100.0%) |
Housing Structure by Heating Type in Wade
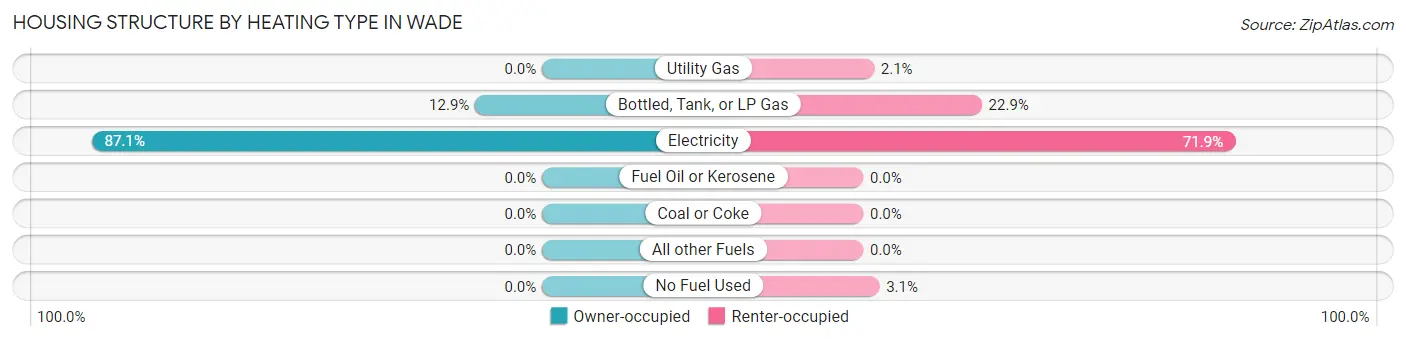
| Heating Type | Owner-occupied | Renter-occupied |
| Utility Gas | 0 (0.0%) | 2 (2.1%) |
| Bottled, Tank, or LP Gas | 22 (12.9%) | 22 (22.9%) |
| Electricity | 148 (87.1%) | 69 (71.9%) |
| Fuel Oil or Kerosene | 0 (0.0%) | 0 (0.0%) |
| Coal or Coke | 0 (0.0%) | 0 (0.0%) |
| All other Fuels | 0 (0.0%) | 0 (0.0%) |
| No Fuel Used | 0 (0.0%) | 3 (3.1%) |
| Total | 170 (100.0%) | 96 (100.0%) |
Household Vehicle Usage in Wade
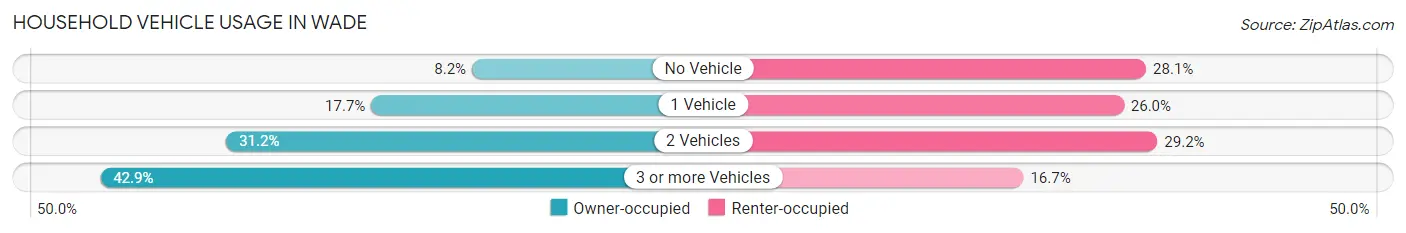
| Vehicles per Household | Owner-occupied | Renter-occupied |
| No Vehicle | 14 (8.2%) | 27 (28.1%) |
| 1 Vehicle | 30 (17.6%) | 25 (26.0%) |
| 2 Vehicles | 53 (31.2%) | 28 (29.2%) |
| 3 or more Vehicles | 73 (42.9%) | 16 (16.7%) |
| Total | 170 (100.0%) | 96 (100.0%) |
Real Estate & Mortgages in Wade
Real Estate and Mortgage Overview in Wade
| Characteristic | Without Mortgage | With Mortgage |
| Housing Units | 84 | 86 |
| Median Property Value | $95,800 | $258,700 |
| Median Household Income | $53,214 | $11 |
| Monthly Housing Costs | $491 | $0 |
| Real Estate Taxes | $1,338 | $0 |
Property Value by Mortgage Status in Wade
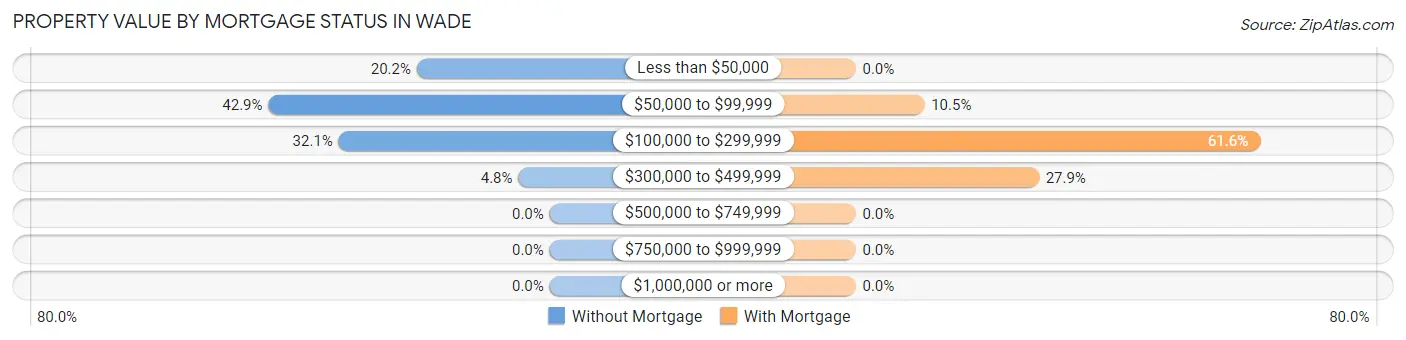
| Property Value | Without Mortgage | With Mortgage |
| Less than $50,000 | 17 (20.2%) | 0 (0.0%) |
| $50,000 to $99,999 | 36 (42.9%) | 9 (10.5%) |
| $100,000 to $299,999 | 27 (32.1%) | 53 (61.6%) |
| $300,000 to $499,999 | 4 (4.8%) | 24 (27.9%) |
| $500,000 to $749,999 | 0 (0.0%) | 0 (0.0%) |
| $750,000 to $999,999 | 0 (0.0%) | 0 (0.0%) |
| $1,000,000 or more | 0 (0.0%) | 0 (0.0%) |
| Total | 84 (100.0%) | 86 (100.0%) |
Household Income by Mortgage Status in Wade
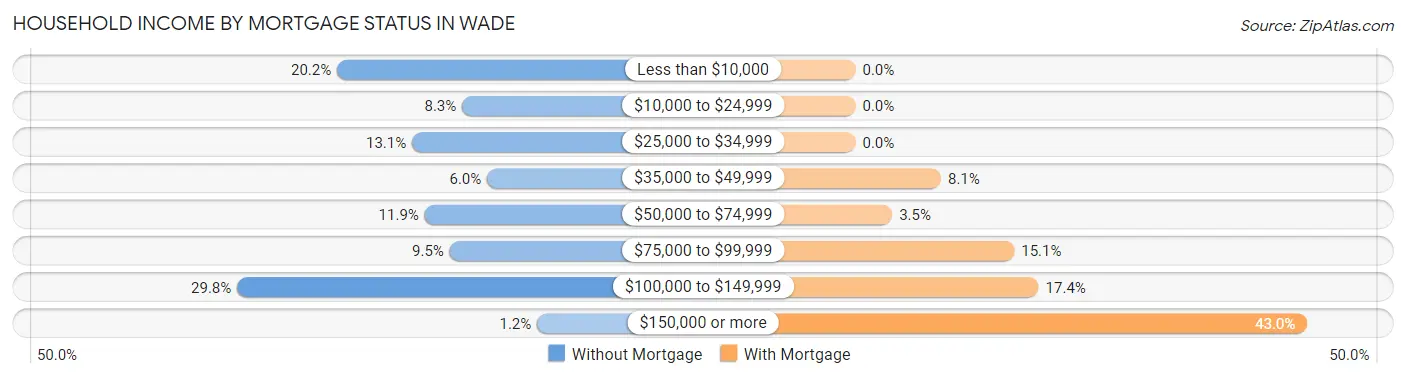
| Household Income | Without Mortgage | With Mortgage |
| Less than $10,000 | 17 (20.2%) | 0 (0.0%) |
| $10,000 to $24,999 | 7 (8.3%) | 0 (0.0%) |
| $25,000 to $34,999 | 11 (13.1%) | 0 (0.0%) |
| $35,000 to $49,999 | 5 (5.9%) | 7 (8.1%) |
| $50,000 to $74,999 | 10 (11.9%) | 3 (3.5%) |
| $75,000 to $99,999 | 8 (9.5%) | 13 (15.1%) |
| $100,000 to $149,999 | 25 (29.8%) | 15 (17.4%) |
| $150,000 or more | 1 (1.2%) | 37 (43.0%) |
| Total | 84 (100.0%) | 86 (100.0%) |
Property Value to Household Income Ratio in Wade
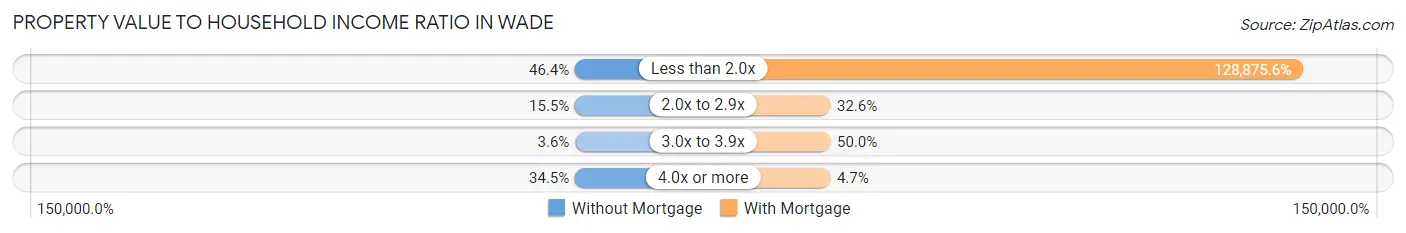
| Value-to-Income Ratio | Without Mortgage | With Mortgage |
| Less than 2.0x | 39 (46.4%) | 110,833 (128,875.6%) |
| 2.0x to 2.9x | 13 (15.5%) | 28 (32.6%) |
| 3.0x to 3.9x | 3 (3.6%) | 43 (50.0%) |
| 4.0x or more | 29 (34.5%) | 4 (4.6%) |
| Total | 84 (100.0%) | 86 (100.0%) |
Real Estate Taxes by Mortgage Status in Wade
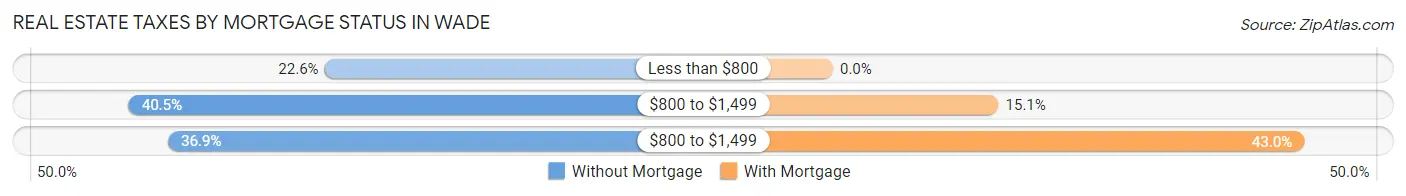
| Property Taxes | Without Mortgage | With Mortgage |
| Less than $800 | 19 (22.6%) | 0 (0.0%) |
| $800 to $1,499 | 34 (40.5%) | 13 (15.1%) |
| $800 to $1,499 | 31 (36.9%) | 37 (43.0%) |
| Total | 84 (100.0%) | 86 (100.0%) |
Health & Disability in Wade
Health Insurance Coverage by Age in Wade
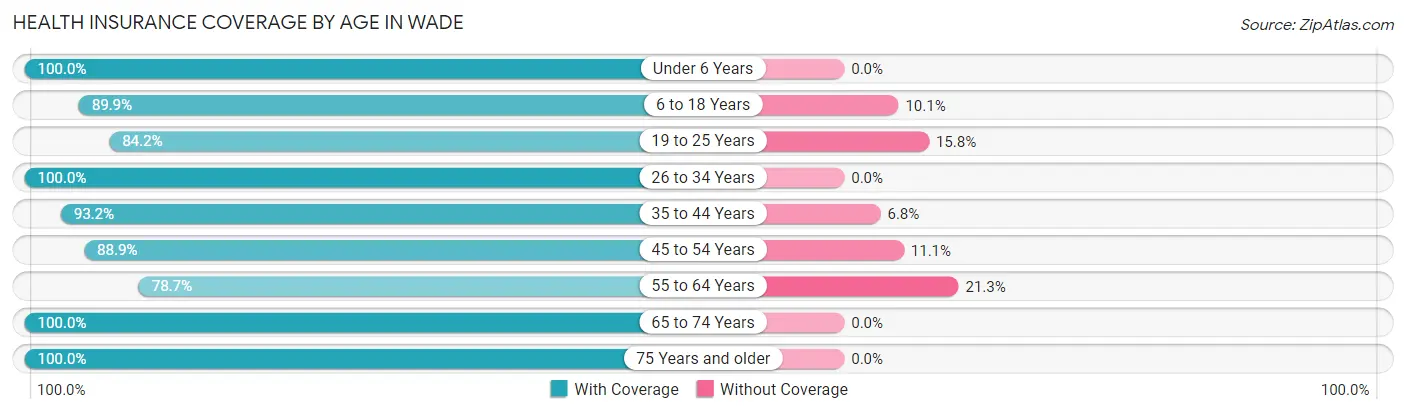
| Age Bracket | With Coverage | Without Coverage |
| Under 6 Years | 56 (100.0%) | 0 (0.0%) |
| 6 to 18 Years | 80 (89.9%) | 9 (10.1%) |
| 19 to 25 Years | 32 (84.2%) | 6 (15.8%) |
| 26 to 34 Years | 64 (100.0%) | 0 (0.0%) |
| 35 to 44 Years | 69 (93.2%) | 5 (6.8%) |
| 45 to 54 Years | 32 (88.9%) | 4 (11.1%) |
| 55 to 64 Years | 96 (78.7%) | 26 (21.3%) |
| 65 to 74 Years | 68 (100.0%) | 0 (0.0%) |
| 75 Years and older | 22 (100.0%) | 0 (0.0%) |
| Total | 519 (91.2%) | 50 (8.8%) |
Health Insurance Coverage by Citizenship Status in Wade

| Citizenship Status | With Coverage | Without Coverage |
| Native Born | 56 (100.0%) | 0 (0.0%) |
| Foreign Born, Citizen | 80 (89.9%) | 9 (10.1%) |
| Foreign Born, not a Citizen | 32 (84.2%) | 6 (15.8%) |
Health Insurance Coverage by Household Income in Wade
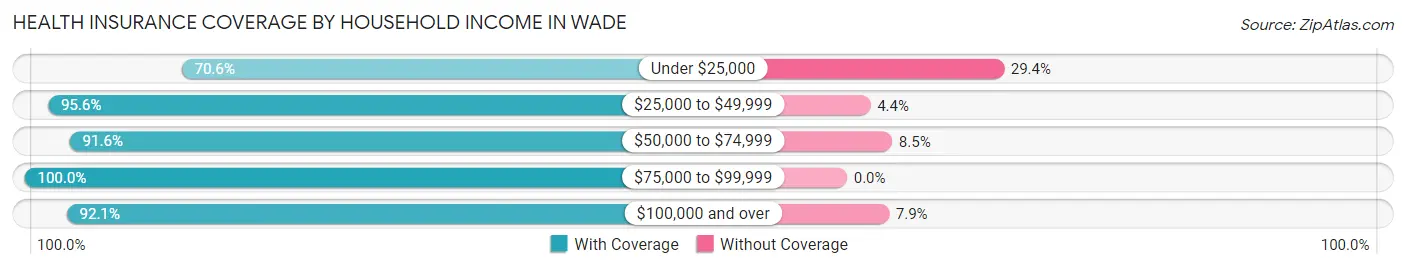
| Household Income | With Coverage | Without Coverage |
| Under $25,000 | 48 (70.6%) | 20 (29.4%) |
| $25,000 to $49,999 | 109 (95.6%) | 5 (4.4%) |
| $50,000 to $74,999 | 65 (91.5%) | 6 (8.5%) |
| $75,000 to $99,999 | 75 (100.0%) | 0 (0.0%) |
| $100,000 and over | 222 (92.1%) | 19 (7.9%) |
Public vs Private Health Insurance Coverage by Age in Wade
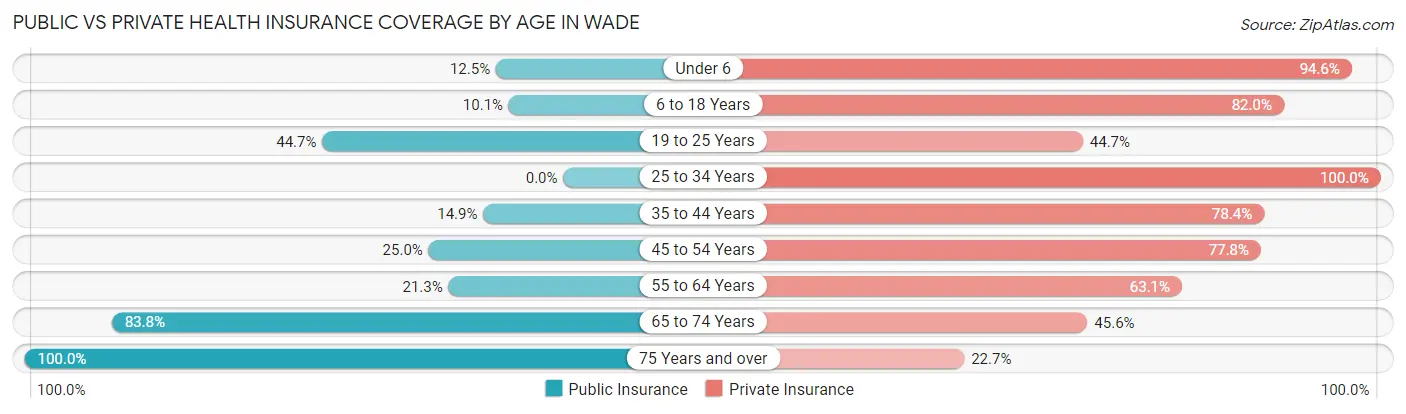
| Age Bracket | Public Insurance | Private Insurance |
| Under 6 | 7 (12.5%) | 53 (94.6%) |
| 6 to 18 Years | 9 (10.1%) | 73 (82.0%) |
| 19 to 25 Years | 17 (44.7%) | 17 (44.7%) |
| 25 to 34 Years | 0 (0.0%) | 64 (100.0%) |
| 35 to 44 Years | 11 (14.9%) | 58 (78.4%) |
| 45 to 54 Years | 9 (25.0%) | 28 (77.8%) |
| 55 to 64 Years | 26 (21.3%) | 77 (63.1%) |
| 65 to 74 Years | 57 (83.8%) | 31 (45.6%) |
| 75 Years and over | 22 (100.0%) | 5 (22.7%) |
| Total | 158 (27.8%) | 406 (71.4%) |
Disability Status by Sex by Age in Wade
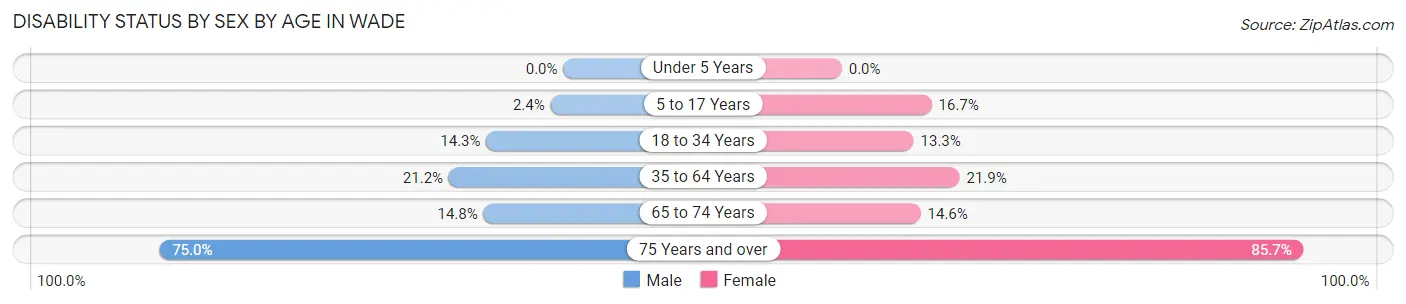
| Age Bracket | Male | Female |
| Under 5 Years | 0 (0.0%) | 0 (0.0%) |
| 5 to 17 Years | 2 (2.4%) | 2 (16.7%) |
| 18 to 34 Years | 6 (14.3%) | 8 (13.3%) |
| 35 to 64 Years | 24 (21.2%) | 26 (21.8%) |
| 65 to 74 Years | 4 (14.8%) | 6 (14.6%) |
| 75 Years and over | 6 (75.0%) | 12 (85.7%) |
Disability Class by Sex by Age in Wade
Disability Class: Hearing Difficulty
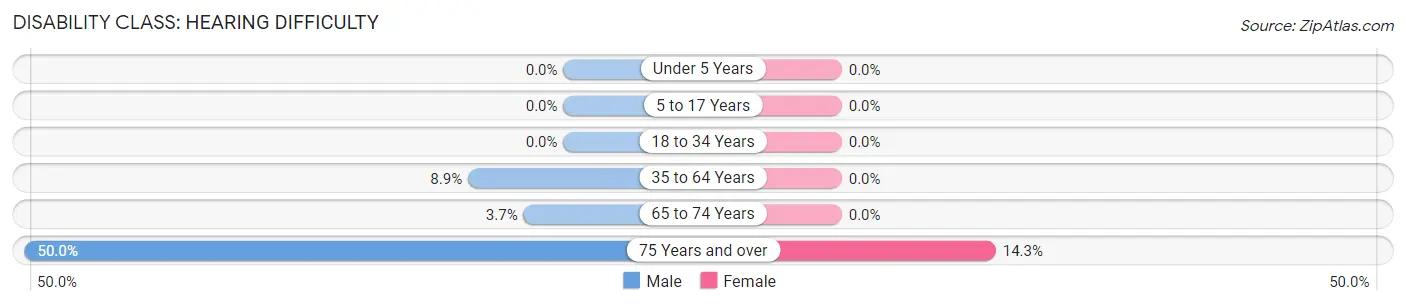
| Age Bracket | Male | Female |
| Under 5 Years | 0 (0.0%) | 0 (0.0%) |
| 5 to 17 Years | 0 (0.0%) | 0 (0.0%) |
| 18 to 34 Years | 0 (0.0%) | 0 (0.0%) |
| 35 to 64 Years | 10 (8.8%) | 0 (0.0%) |
| 65 to 74 Years | 1 (3.7%) | 0 (0.0%) |
| 75 Years and over | 4 (50.0%) | 2 (14.3%) |
Disability Class: Vision Difficulty
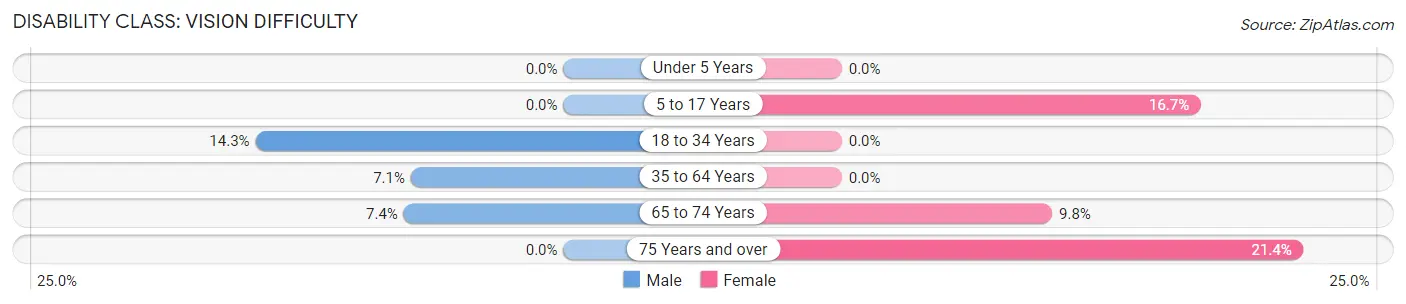
| Age Bracket | Male | Female |
| Under 5 Years | 0 (0.0%) | 0 (0.0%) |
| 5 to 17 Years | 0 (0.0%) | 2 (16.7%) |
| 18 to 34 Years | 6 (14.3%) | 0 (0.0%) |
| 35 to 64 Years | 8 (7.1%) | 0 (0.0%) |
| 65 to 74 Years | 2 (7.4%) | 4 (9.8%) |
| 75 Years and over | 0 (0.0%) | 3 (21.4%) |
Disability Class: Cognitive Difficulty
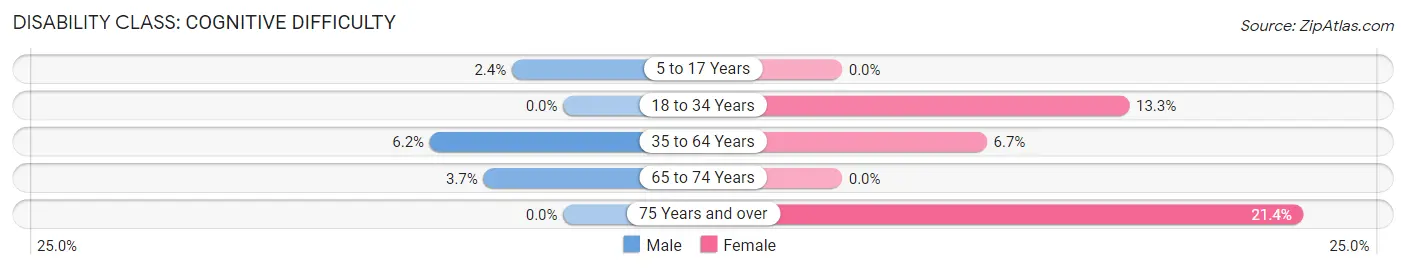
| Age Bracket | Male | Female |
| 5 to 17 Years | 2 (2.4%) | 0 (0.0%) |
| 18 to 34 Years | 0 (0.0%) | 8 (13.3%) |
| 35 to 64 Years | 7 (6.2%) | 8 (6.7%) |
| 65 to 74 Years | 1 (3.7%) | 0 (0.0%) |
| 75 Years and over | 0 (0.0%) | 3 (21.4%) |
Disability Class: Ambulatory Difficulty
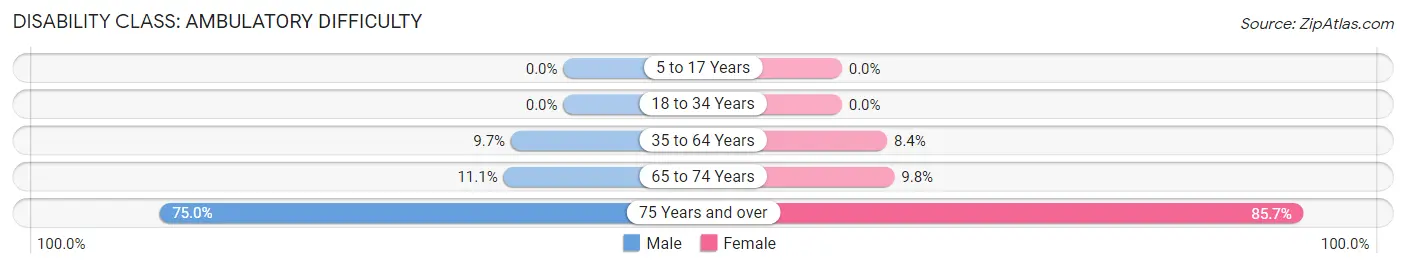
| Age Bracket | Male | Female |
| 5 to 17 Years | 0 (0.0%) | 0 (0.0%) |
| 18 to 34 Years | 0 (0.0%) | 0 (0.0%) |
| 35 to 64 Years | 11 (9.7%) | 10 (8.4%) |
| 65 to 74 Years | 3 (11.1%) | 4 (9.8%) |
| 75 Years and over | 6 (75.0%) | 12 (85.7%) |
Disability Class: Self-Care Difficulty
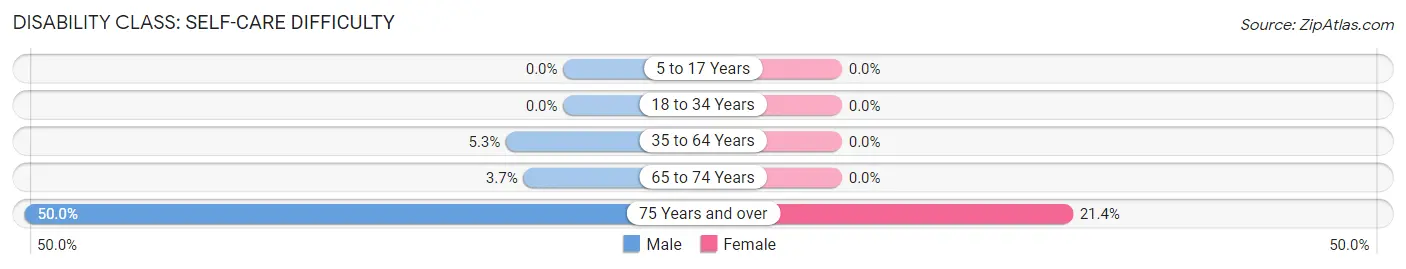
| Age Bracket | Male | Female |
| 5 to 17 Years | 0 (0.0%) | 0 (0.0%) |
| 18 to 34 Years | 0 (0.0%) | 0 (0.0%) |
| 35 to 64 Years | 6 (5.3%) | 0 (0.0%) |
| 65 to 74 Years | 1 (3.7%) | 0 (0.0%) |
| 75 Years and over | 4 (50.0%) | 3 (21.4%) |
Technology Access in Wade
Computing Device Access in Wade
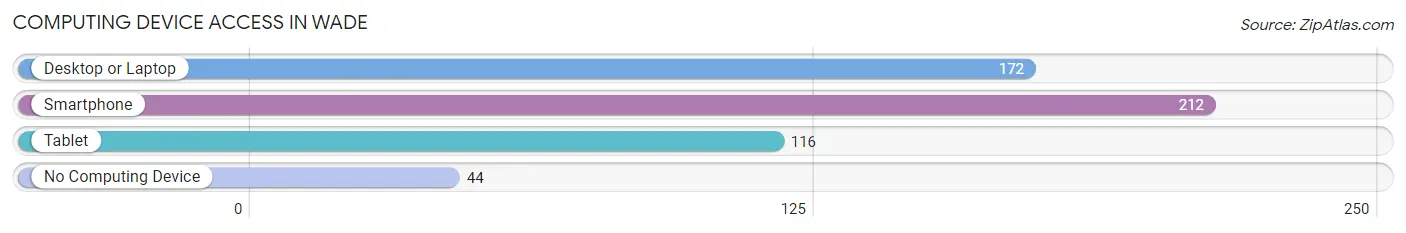
| Device Type | # Households | % Households |
| Desktop or Laptop | 172 | 64.7% |
| Smartphone | 212 | 79.7% |
| Tablet | 116 | 43.6% |
| No Computing Device | 44 | 16.5% |
| Total | 266 | 100.0% |
Internet Access in Wade
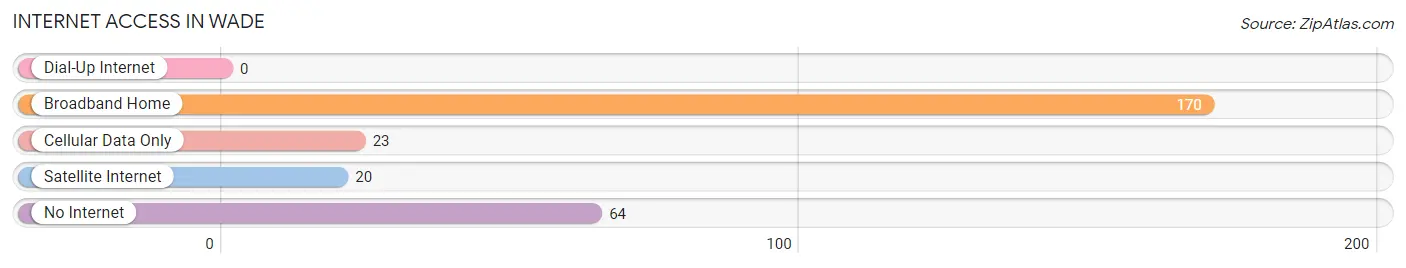
| Internet Type | # Households | % Households |
| Dial-Up Internet | 0 | 0.0% |
| Broadband Home | 170 | 63.9% |
| Cellular Data Only | 23 | 8.6% |
| Satellite Internet | 20 | 7.5% |
| No Internet | 64 | 24.1% |
| Total | 266 | 100.0% |
Wade Summary
NC History
North Carolina is one of the original 13 colonies and was the first state to declare its independence from Britain in 1776. The state was named after King Charles I of England, who granted the land to the eight Lords Proprietors in 1663. The state was initially divided into eight counties, but eventually grew to 100 counties. North Carolina was one of the original states to ratify the United States Constitution in 1789.
North Carolina was a major player in the American Revolution. The state was home to several key battles, including the Battle of Moore’s Creek Bridge and the Battle of Kings Mountain. North Carolina was also the site of the first successful powered flight, which took place in Kitty Hawk in 1903.
North Carolina was a major center of the Civil War. The state was home to several major battles, including the Battle of Bentonville and the Battle of Fort Fisher. The state was also the site of the last major Confederate surrender, which took place at Bennett Place in Durham.
Geography
North Carolina is located in the southeastern United States, bordered by South Carolina, Georgia, Tennessee, and Virginia. The state is divided into three distinct regions: the Coastal Plain, the Piedmont, and the Appalachian Mountains. The Coastal Plain is a flat, low-lying region that is home to the state’s major cities, including Charlotte, Raleigh, and Wilmington. The Piedmont is a hilly region that is home to the state’s capital, Raleigh. The Appalachian Mountains are the highest region in the state and are home to the Great Smoky Mountains National Park.
Economy
North Carolina’s economy is largely based on agriculture, manufacturing, and services. The state is a major producer of tobacco, cotton, and soybeans. It is also a major producer of furniture, textiles, and electronics. The state is home to several major corporations, including Bank of America, Duke Energy, and Lowe’s.
North Carolina is also a major tourist destination. The state is home to several popular attractions, including the Blue Ridge Parkway, the Great Smoky Mountains National Park, and the Outer Banks.
Demographics
As of 2020, North Carolina had an estimated population of 10.5 million people. The state is home to a diverse population, with the largest ethnic groups being White (68.5%), African American (21.5%), and Hispanic (8.7%). The state’s largest cities are Charlotte (859,000), Raleigh (464,000), and Greensboro (285,000). The state’s median household income is $53,000, and the median home value is $180,000.
Common Questions
What is Per Capita Income in Wade?
Per Capita income in Wade is $31,825.
What is the Median Family Income in Wade?
Median Family Income in Wade is $97,083.
What is the Median Household income in Wade?
Median Household Income in Wade is $62,500.
What is Income or Wage Gap in Wade?
Income or Wage Gap in Wade is 48.5%.
Women in Wade earn 51.5 cents for every dollar earned by a man.
What is Inequality or Gini Index in Wade?
Inequality or Gini Index in Wade is 0.49.
What is the Total Population of Wade?
Total Population of Wade is 595.
What is the Total Male Population of Wade?
Total Male Population of Wade is 332.
What is the Total Female Population of Wade?
Total Female Population of Wade is 263.
What is the Ratio of Males per 100 Females in Wade?
There are 126.24 Males per 100 Females in Wade.
What is the Ratio of Females per 100 Males in Wade?
There are 79.22 Females per 100 Males in Wade.
What is the Median Population Age in Wade?
Median Population Age in Wade is 39.2 Years.
What is the Average Family Size in Wade
Average Family Size in Wade is 3.2 People.
What is the Average Household Size in Wade
Average Household Size in Wade is 2.2 People.
How Large is the Labor Force in Wade?
There are 258 People in the Labor Forcein in Wade.
What is the Percentage of People in the Labor Force in Wade?
56.2% of People are in the Labor Force in Wade.
What is the Unemployment Rate in Wade?
Unemployment Rate in Wade is 12.9%.