Pikeville, NC Map & Demographics
Pikeville Map
Pikeville Overview
$28,298
PER CAPITA INCOME
$72,604
AVG FAMILY INCOME
$65,417
AVG HOUSEHOLD INCOME
27.1%
WAGE / INCOME GAP [ % ]
72.9¢/ $1
WAGE / INCOME GAP [ $ ]
0.35
INEQUALITY / GINI INDEX
679
TOTAL POPULATION
351
MALE POPULATION
328
FEMALE POPULATION
107.01
MALES / 100 FEMALES
93.45
FEMALES / 100 MALES
39.0
MEDIAN AGE
2.7
AVG FAMILY SIZE
2.4
AVG HOUSEHOLD SIZE
410
LABOR FORCE [ PEOPLE ]
75.4%
PERCENT IN LABOR FORCE
Pikeville Zip Codes
Pikeville Area Codes
Income in Pikeville
Income Overview in Pikeville
Per Capita Income in Pikeville is $28,298, while median incomes of families and households are $72,604 and $65,417 respectively.
| Characteristic | Number | Measure |
| Per Capita Income | 679 | $28,298 |
| Median Family Income | 231 | $72,604 |
| Mean Family Income | 231 | $72,998 |
| Median Household Income | 282 | $65,417 |
| Mean Household Income | 282 | $64,783 |
| Income Deficit | 231 | $0 |
| Wage / Income Gap (%) | 679 | 27.08% |
| Wage / Income Gap ($) | 679 | 72.92¢ per $1 |
| Gini / Inequality Index | 679 | 0.35 |
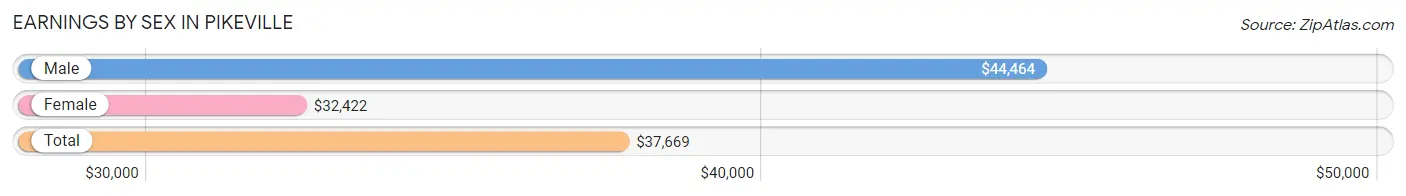
Earnings by Sex in Pikeville
Average Earnings in Pikeville are $37,669, $44,464 for men and $32,422 for women, a difference of 27.1%.
| Sex | Number | Average Earnings |
| Male | 236 (55.3%) | $44,464 |
| Female | 191 (44.7%) | $32,422 |
| Total | 427 (100.0%) | $37,669 |
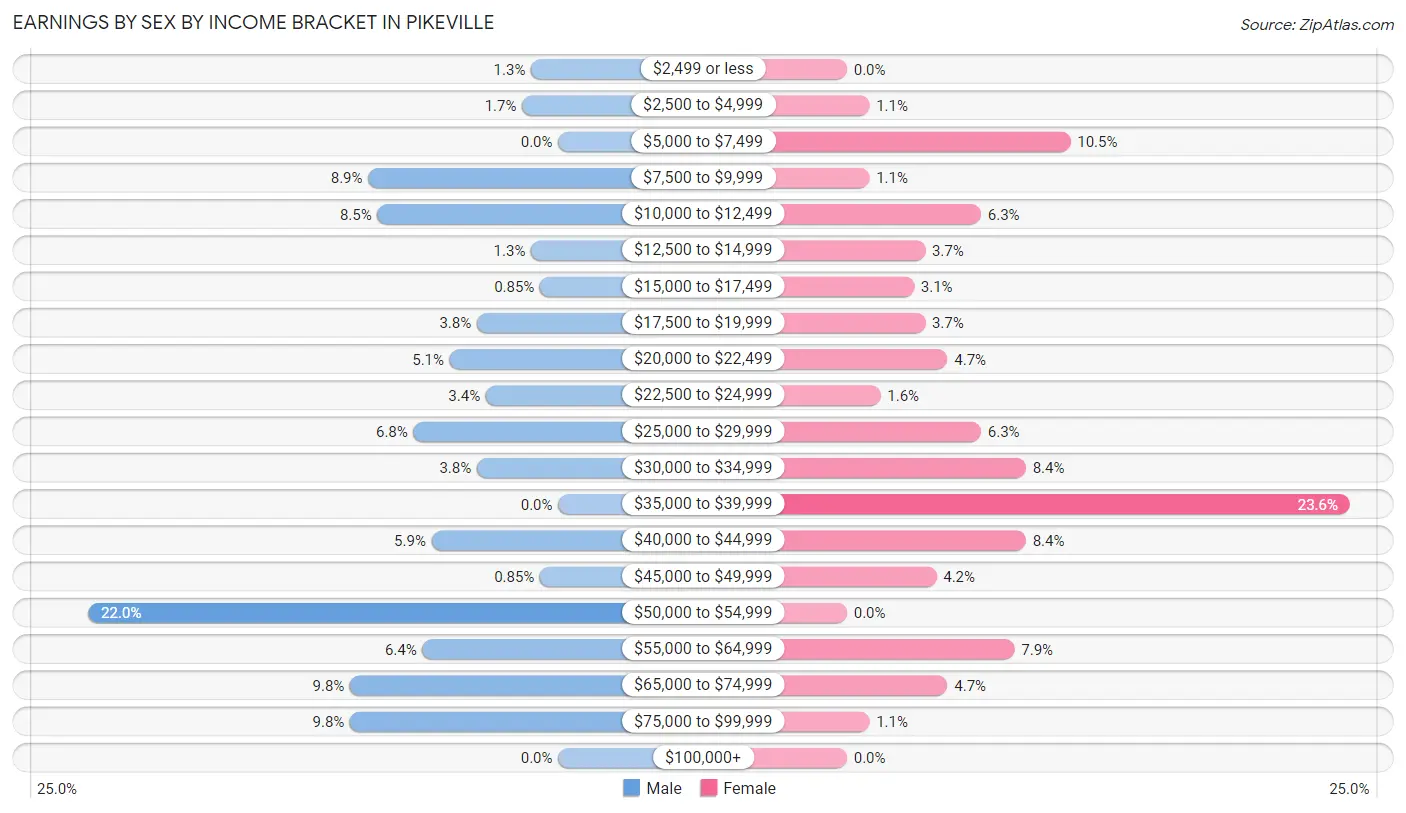
Earnings by Sex by Income Bracket in Pikeville
The most common earnings brackets in Pikeville are $50,000 to $54,999 for men (52 | 22.0%) and $35,000 to $39,999 for women (45 | 23.6%).
| Income | Male | Female |
| $2,499 or less | 3 (1.3%) | 0 (0.0%) |
| $2,500 to $4,999 | 4 (1.7%) | 2 (1.1%) |
| $5,000 to $7,499 | 0 (0.0%) | 20 (10.5%) |
| $7,500 to $9,999 | 21 (8.9%) | 2 (1.1%) |
| $10,000 to $12,499 | 20 (8.5%) | 12 (6.3%) |
| $12,500 to $14,999 | 3 (1.3%) | 7 (3.7%) |
| $15,000 to $17,499 | 2 (0.9%) | 6 (3.1%) |
| $17,500 to $19,999 | 9 (3.8%) | 7 (3.7%) |
| $20,000 to $22,499 | 12 (5.1%) | 9 (4.7%) |
| $22,500 to $24,999 | 8 (3.4%) | 3 (1.6%) |
| $25,000 to $29,999 | 16 (6.8%) | 12 (6.3%) |
| $30,000 to $34,999 | 9 (3.8%) | 16 (8.4%) |
| $35,000 to $39,999 | 0 (0.0%) | 45 (23.6%) |
| $40,000 to $44,999 | 14 (5.9%) | 16 (8.4%) |
| $45,000 to $49,999 | 2 (0.9%) | 8 (4.2%) |
| $50,000 to $54,999 | 52 (22.0%) | 0 (0.0%) |
| $55,000 to $64,999 | 15 (6.4%) | 15 (7.9%) |
| $65,000 to $74,999 | 23 (9.8%) | 9 (4.7%) |
| $75,000 to $99,999 | 23 (9.8%) | 2 (1.1%) |
| $100,000+ | 0 (0.0%) | 0 (0.0%) |
| Total | 236 (100.0%) | 191 (100.0%) |
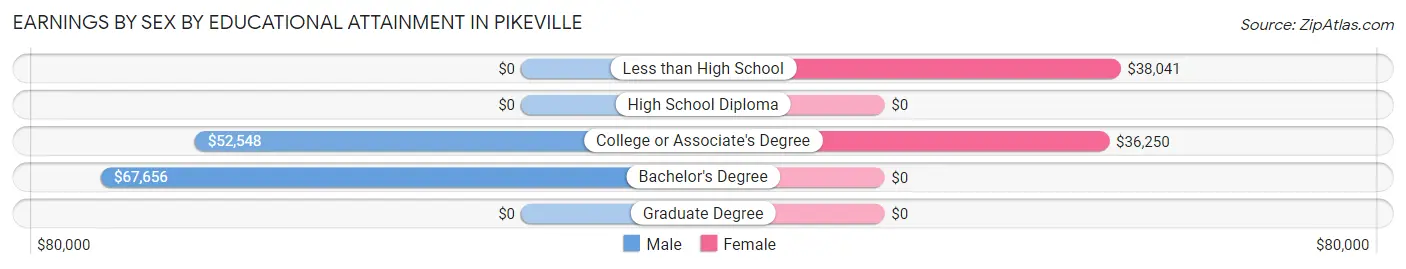
Earnings by Sex by Educational Attainment in Pikeville
Average earnings in Pikeville are $51,477 for men and $37,669 for women, a difference of 26.8%. Men with an educational attainment of bachelor's degree enjoy the highest average annual earnings of $67,656, while those with college or associate's degree education earn the least with $52,548. Women with an educational attainment of less than high school earn the most with the average annual earnings of $38,041, while those with college or associate's degree education have the smallest earnings of $36,250.
| Educational Attainment | Male Income | Female Income |
| Less than High School | - | - |
| High School Diploma | - | - |
| College or Associate's Degree | $52,548 | $36,250 |
| Bachelor's Degree | $67,656 | $0 |
| Graduate Degree | - | - |
| Total | $51,477 | $37,669 |
Family Income in Pikeville
Family Income Brackets in Pikeville
According to the Pikeville family income data, there are 72 families falling into the $50,000 to $74,999 income range, which is the most common income bracket and makes up 31.2% of all families.
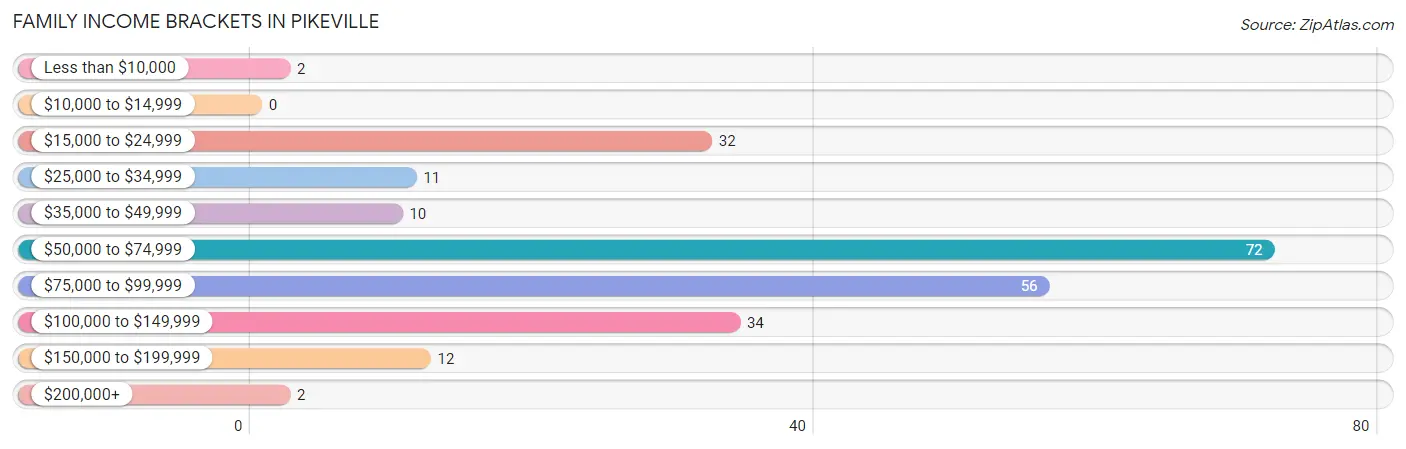
| Income Bracket | # Families | % Families |
| Less than $10,000 | 2 | 0.9% |
| $10,000 to $14,999 | 0 | 0.0% |
| $15,000 to $24,999 | 32 | 13.9% |
| $25,000 to $34,999 | 11 | 4.8% |
| $35,000 to $49,999 | 10 | 4.3% |
| $50,000 to $74,999 | 72 | 31.2% |
| $75,000 to $99,999 | 56 | 24.2% |
| $100,000 to $149,999 | 34 | 14.7% |
| $150,000 to $199,999 | 12 | 5.2% |
| $200,000+ | 2 | 0.9% |
Family Income by Famaliy Size in Pikeville
4-person families (18 | 7.8%) account for the highest median family income in Pikeville with $130,000 per family, while 4-person families (18 | 7.8%) have the highest median income of $32,500 per family member.
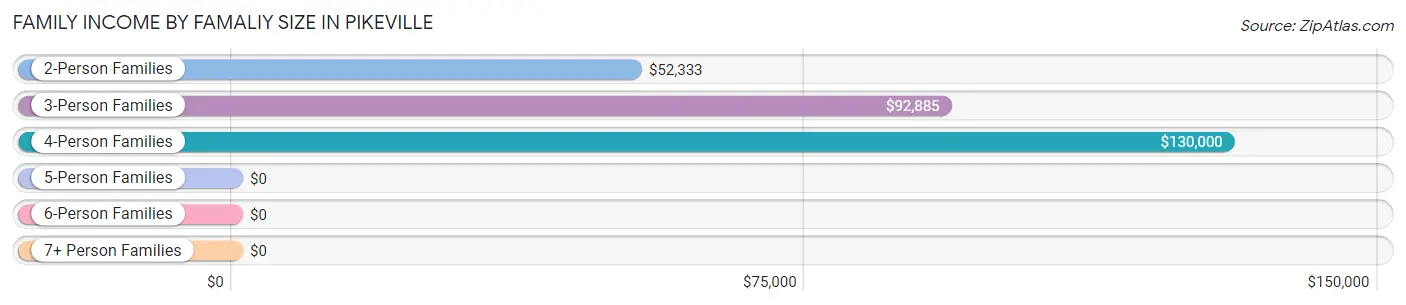
| Income Bracket | # Families | Median Income |
| 2-Person Families | 120 (51.9%) | $52,333 |
| 3-Person Families | 66 (28.6%) | $92,885 |
| 4-Person Families | 18 (7.8%) | $130,000 |
| 5-Person Families | 14 (6.1%) | $0 |
| 6-Person Families | 13 (5.6%) | $0 |
| 7+ Person Families | 0 (0.0%) | $0 |
| Total | 231 (100.0%) | $72,604 |
Family Income by Number of Earners in Pikeville
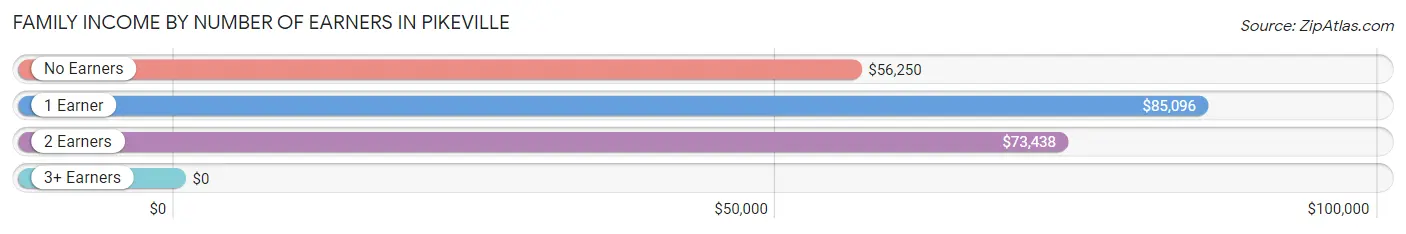
| Number of Earners | # Families | Median Income |
| No Earners | 35 (15.1%) | $56,250 |
| 1 Earner | 49 (21.2%) | $85,096 |
| 2 Earners | 135 (58.4%) | $73,438 |
| 3+ Earners | 12 (5.2%) | $0 |
| Total | 231 (100.0%) | $72,604 |
Household Income in Pikeville
Household Income Brackets in Pikeville
With 75 households falling in the category, the $50,000 to $74,999 income range is the most frequent in Pikeville, accounting for 26.6% of all households. In contrast, only 2 households (0.7%) fall into the $200,000+ income bracket, making it the least populous group.
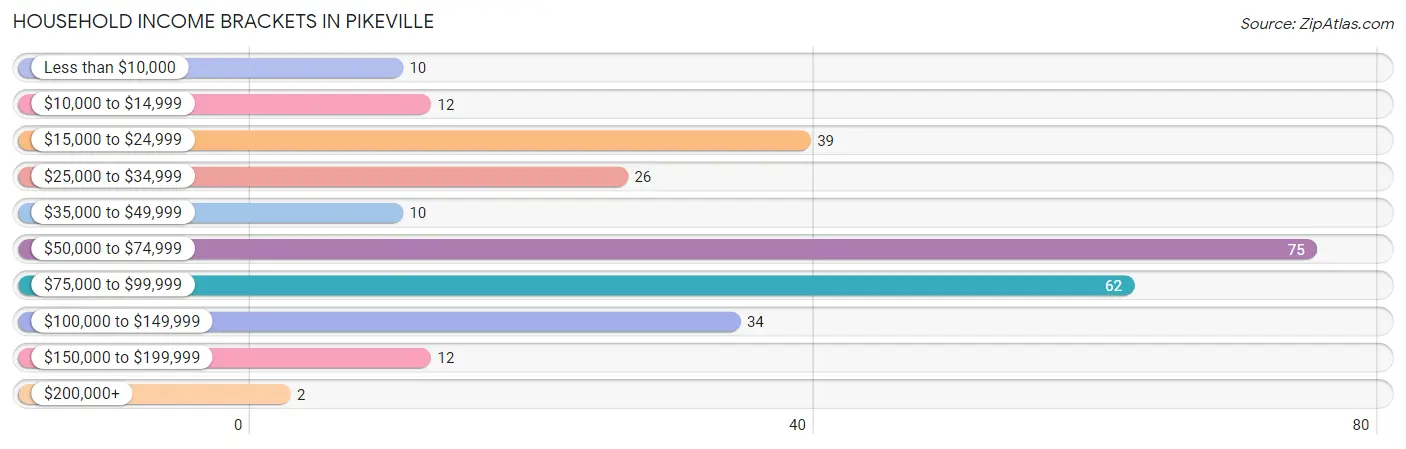
| Income Bracket | # Households | % Households |
| Less than $10,000 | 10 | 3.5% |
| $10,000 to $14,999 | 12 | 4.3% |
| $15,000 to $24,999 | 39 | 13.8% |
| $25,000 to $34,999 | 26 | 9.2% |
| $35,000 to $49,999 | 10 | 3.5% |
| $50,000 to $74,999 | 75 | 26.6% |
| $75,000 to $99,999 | 62 | 22.0% |
| $100,000 to $149,999 | 34 | 12.1% |
| $150,000 to $199,999 | 12 | 4.3% |
| $200,000+ | 2 | 0.7% |
Household Income by Householder Age in Pikeville
The median household income in Pikeville is $65,417, with the highest median household income of $73,854 found in the 25 to 44 years age bracket for the primary householder. A total of 73 households (25.9%) fall into this category. Meanwhile, the 15 to 24 years age bracket for the primary householder has the lowest median household income of $0, with 17 households (6.0%) in this group.
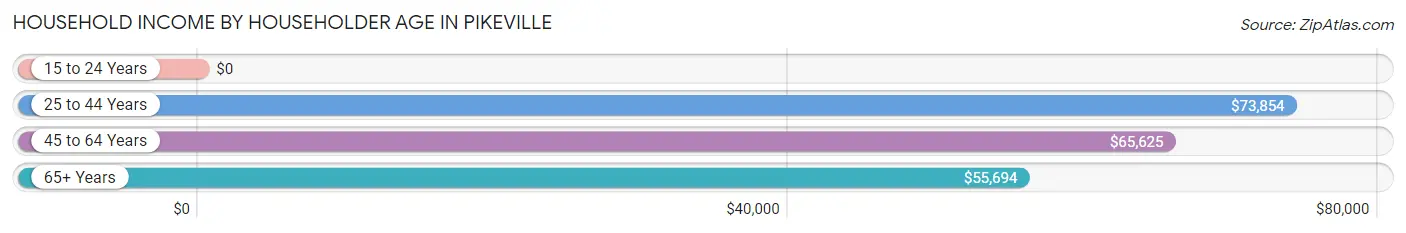
| Income Bracket | # Households | Median Income |
| 15 to 24 Years | 17 (6.0%) | $0 |
| 25 to 44 Years | 73 (25.9%) | $73,854 |
| 45 to 64 Years | 143 (50.7%) | $65,625 |
| 65+ Years | 49 (17.4%) | $55,694 |
| Total | 282 (100.0%) | $65,417 |
Poverty in Pikeville
Income Below Poverty by Sex and Age in Pikeville
With 9.7% poverty level for males and 21.3% for females among the residents of Pikeville, 6 to 11 year old males and 15 year old females are the most vulnerable to poverty, with 7 males (28.0%) and 3 females (100.0%) in their respective age groups living below the poverty level.
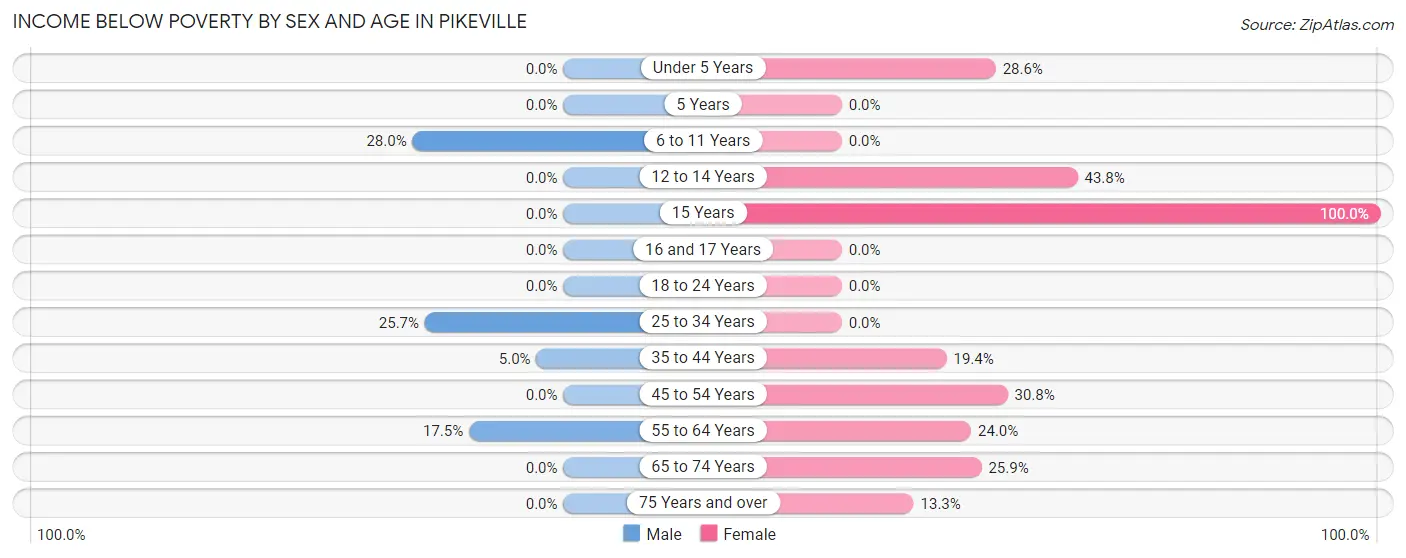
| Age Bracket | Male | Female |
| Under 5 Years | 0 (0.0%) | 6 (28.6%) |
| 5 Years | 0 (0.0%) | 0 (0.0%) |
| 6 to 11 Years | 7 (28.0%) | 0 (0.0%) |
| 12 to 14 Years | 0 (0.0%) | 7 (43.8%) |
| 15 Years | 0 (0.0%) | 3 (100.0%) |
| 16 and 17 Years | 0 (0.0%) | 0 (0.0%) |
| 18 to 24 Years | 0 (0.0%) | 0 (0.0%) |
| 25 to 34 Years | 18 (25.7%) | 0 (0.0%) |
| 35 to 44 Years | 2 (5.0%) | 7 (19.4%) |
| 45 to 54 Years | 0 (0.0%) | 32 (30.8%) |
| 55 to 64 Years | 7 (17.5%) | 6 (24.0%) |
| 65 to 74 Years | 0 (0.0%) | 7 (25.9%) |
| 75 Years and over | 0 (0.0%) | 2 (13.3%) |
| Total | 34 (9.7%) | 70 (21.3%) |
Income Above Poverty by Sex and Age in Pikeville
According to the poverty statistics in Pikeville, males aged under 5 years and females aged 5 years are the age groups that are most secure financially, with 100.0% of males and 100.0% of females in these age groups living above the poverty line.
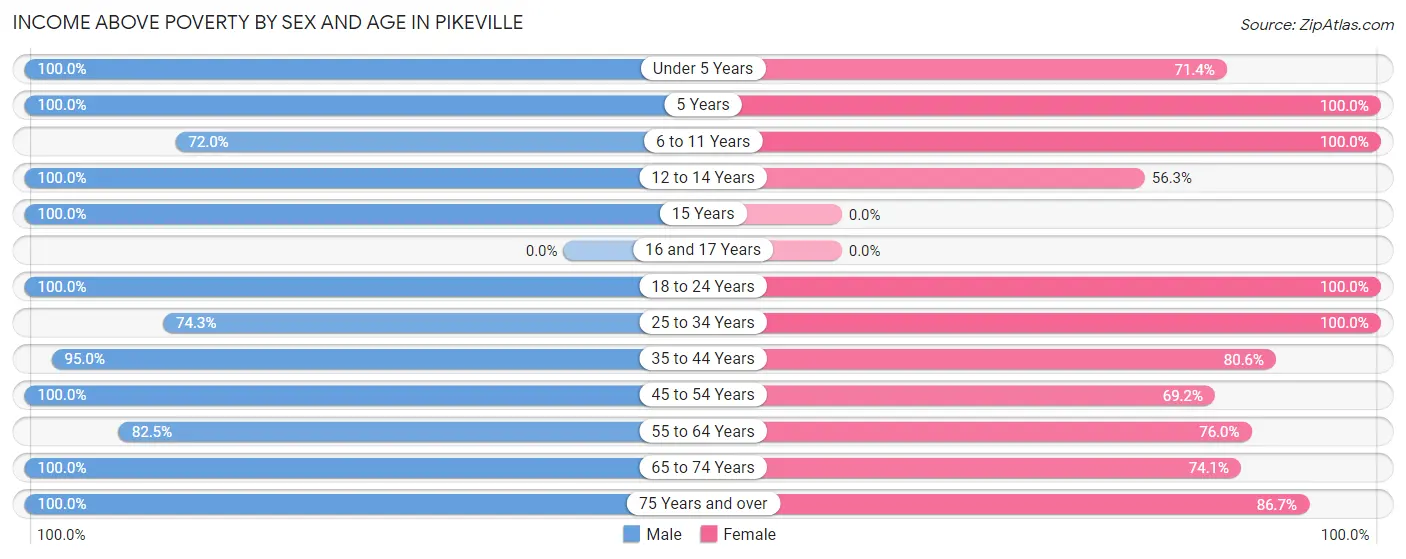
| Age Bracket | Male | Female |
| Under 5 Years | 12 (100.0%) | 15 (71.4%) |
| 5 Years | 2 (100.0%) | 6 (100.0%) |
| 6 to 11 Years | 18 (72.0%) | 34 (100.0%) |
| 12 to 14 Years | 8 (100.0%) | 9 (56.2%) |
| 15 Years | 8 (100.0%) | 0 (0.0%) |
| 16 and 17 Years | 0 (0.0%) | 0 (0.0%) |
| 18 to 24 Years | 68 (100.0%) | 24 (100.0%) |
| 25 to 34 Years | 52 (74.3%) | 17 (100.0%) |
| 35 to 44 Years | 38 (95.0%) | 29 (80.6%) |
| 45 to 54 Years | 42 (100.0%) | 72 (69.2%) |
| 55 to 64 Years | 33 (82.5%) | 19 (76.0%) |
| 65 to 74 Years | 17 (100.0%) | 20 (74.1%) |
| 75 Years and over | 19 (100.0%) | 13 (86.7%) |
| Total | 317 (90.3%) | 258 (78.7%) |
Income Below Poverty Among Married-Couple Families in Pikeville
The poverty statistics for married-couple families in Pikeville show that 6.3% or 9 of the total 143 families live below the poverty line. Families with no children have the highest poverty rate of 10.9%, comprising of 7 families. On the other hand, families with 3 or 4 children have the lowest poverty rate of 0.0%, which includes 0 families.
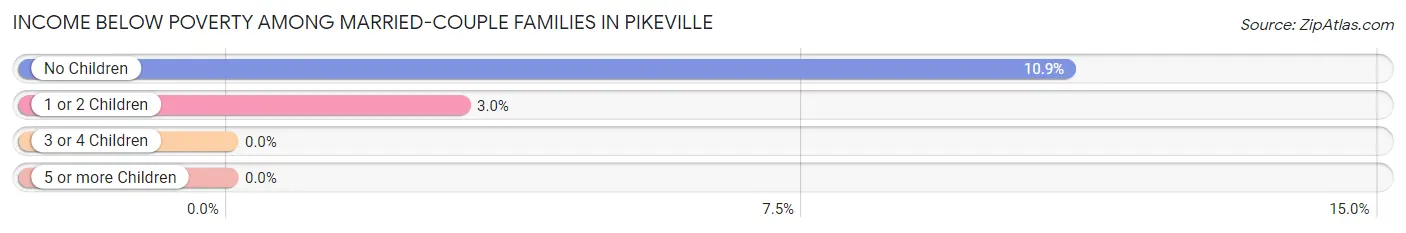
| Children | Above Poverty | Below Poverty |
| No Children | 57 (89.1%) | 7 (10.9%) |
| 1 or 2 Children | 64 (97.0%) | 2 (3.0%) |
| 3 or 4 Children | 13 (100.0%) | 0 (0.0%) |
| 5 or more Children | 0 (0.0%) | 0 (0.0%) |
| Total | 134 (93.7%) | 9 (6.3%) |
Income Below Poverty Among Single-Parent Households in Pikeville
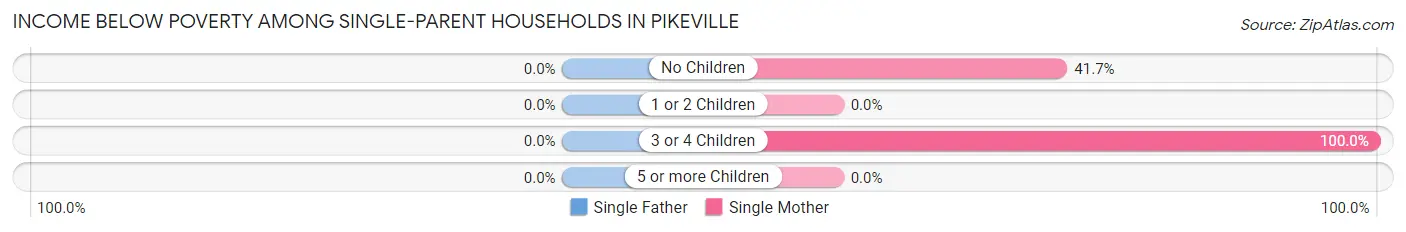
| Children | Single Father | Single Mother |
| No Children | 0 (0.0%) | 20 (41.7%) |
| 1 or 2 Children | 0 (0.0%) | 0 (0.0%) |
| 3 or 4 Children | 0 (0.0%) | 5 (100.0%) |
| 5 or more Children | 0 (0.0%) | 0 (0.0%) |
| Total | 0 (0.0%) | 25 (47.2%) |
Income Below Poverty Among Married-Couple vs Single-Parent Households in Pikeville
The poverty data for Pikeville shows that 9 of the married-couple family households (6.3%) and 25 of the single-parent households (28.4%) are living below the poverty level. Within the married-couple family households, those with no children have the highest poverty rate, with 7 households (10.9%) falling below the poverty line. Among the single-parent households, those with 3 or 4 children have the highest poverty rate, with 5 household (100.0%) living below poverty.
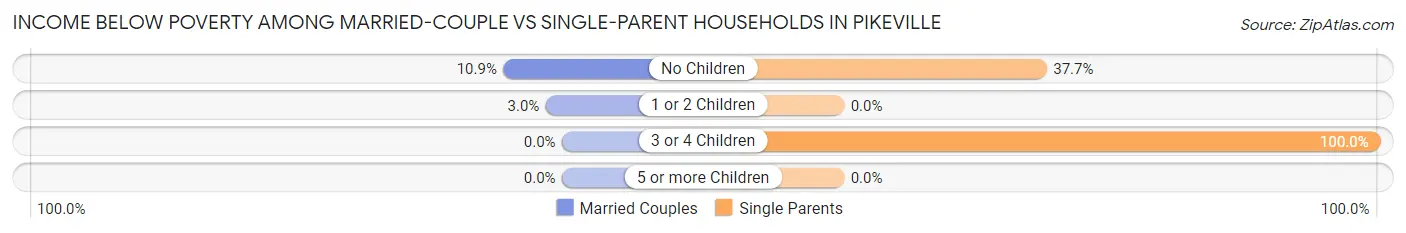
| Children | Married-Couple Families | Single-Parent Households |
| No Children | 7 (10.9%) | 20 (37.7%) |
| 1 or 2 Children | 2 (3.0%) | 0 (0.0%) |
| 3 or 4 Children | 0 (0.0%) | 5 (100.0%) |
| 5 or more Children | 0 (0.0%) | 0 (0.0%) |
| Total | 9 (6.3%) | 25 (28.4%) |
Race in Pikeville
The most populous races in Pikeville are White / Caucasian (521 | 76.7%), Black / African American (134 | 19.7%), and Hispanic or Latino (33 | 4.9%).
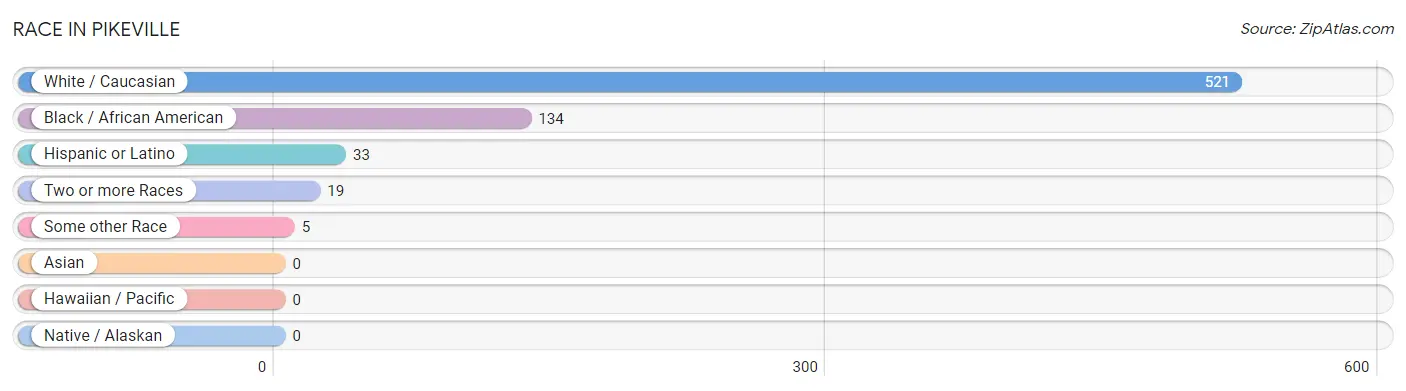
| Race | # Population | % Population |
| Asian | 0 | 0.0% |
| Black / African American | 134 | 19.7% |
| Hawaiian / Pacific | 0 | 0.0% |
| Hispanic or Latino | 33 | 4.9% |
| Native / Alaskan | 0 | 0.0% |
| White / Caucasian | 521 | 76.7% |
| Two or more Races | 19 | 2.8% |
| Some other Race | 5 | 0.7% |
| Total | 679 | 100.0% |
Ancestry in Pikeville
The most populous ancestries reported in Pikeville are English (148 | 21.8%), American (125 | 18.4%), European (54 | 8.0%), Irish (51 | 7.5%), and German (39 | 5.7%), together accounting for 61.4% of all Pikeville residents.
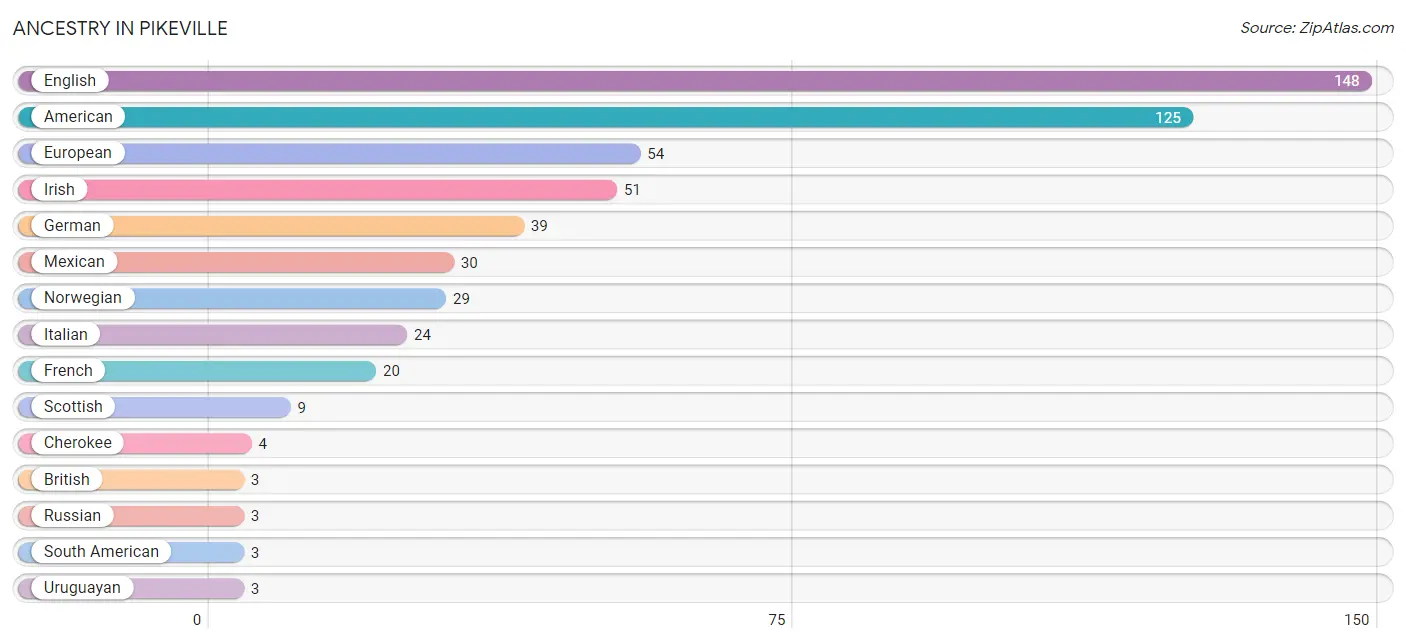
| Ancestry | # Population | % Population |
| American | 125 | 18.4% |
| British | 3 | 0.4% |
| Cherokee | 4 | 0.6% |
| English | 148 | 21.8% |
| European | 54 | 8.0% |
| French | 20 | 2.9% |
| German | 39 | 5.7% |
| Irish | 51 | 7.5% |
| Italian | 24 | 3.5% |
| Mexican | 30 | 4.4% |
| Norwegian | 29 | 4.3% |
| Russian | 3 | 0.4% |
| Scandinavian | 2 | 0.3% |
| Scottish | 9 | 1.3% |
| South American | 3 | 0.4% |
| Uruguayan | 3 | 0.4% | View All 16 Rows |
Immigrants in Pikeville
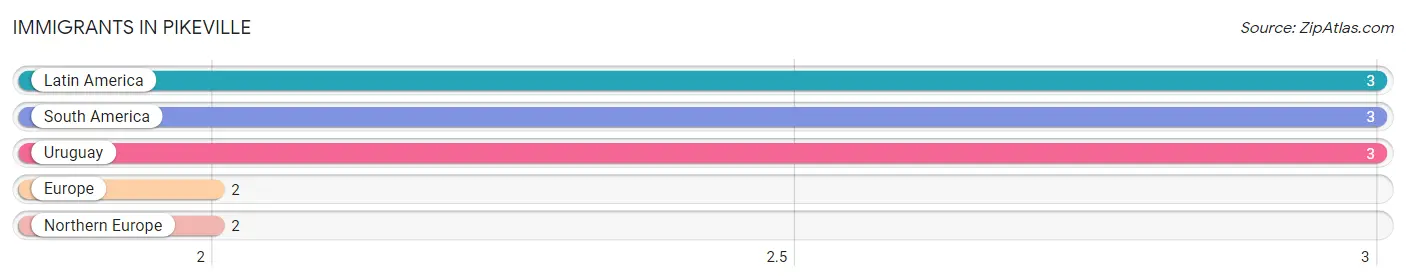
The most numerous immigrant groups reported in Pikeville came from Latin America (3 | 0.4%), South America (3 | 0.4%), Uruguay (3 | 0.4%), Europe (2 | 0.3%), and Northern Europe (2 | 0.3%), together accounting for 1.9% of all Pikeville residents.
| Immigration Origin | # Population | % Population |
| Europe | 2 | 0.3% |
| Latin America | 3 | 0.4% |
| Northern Europe | 2 | 0.3% |
| South America | 3 | 0.4% |
| Uruguay | 3 | 0.4% | View All 5 Rows |
Sex and Age in Pikeville
Sex and Age in Pikeville
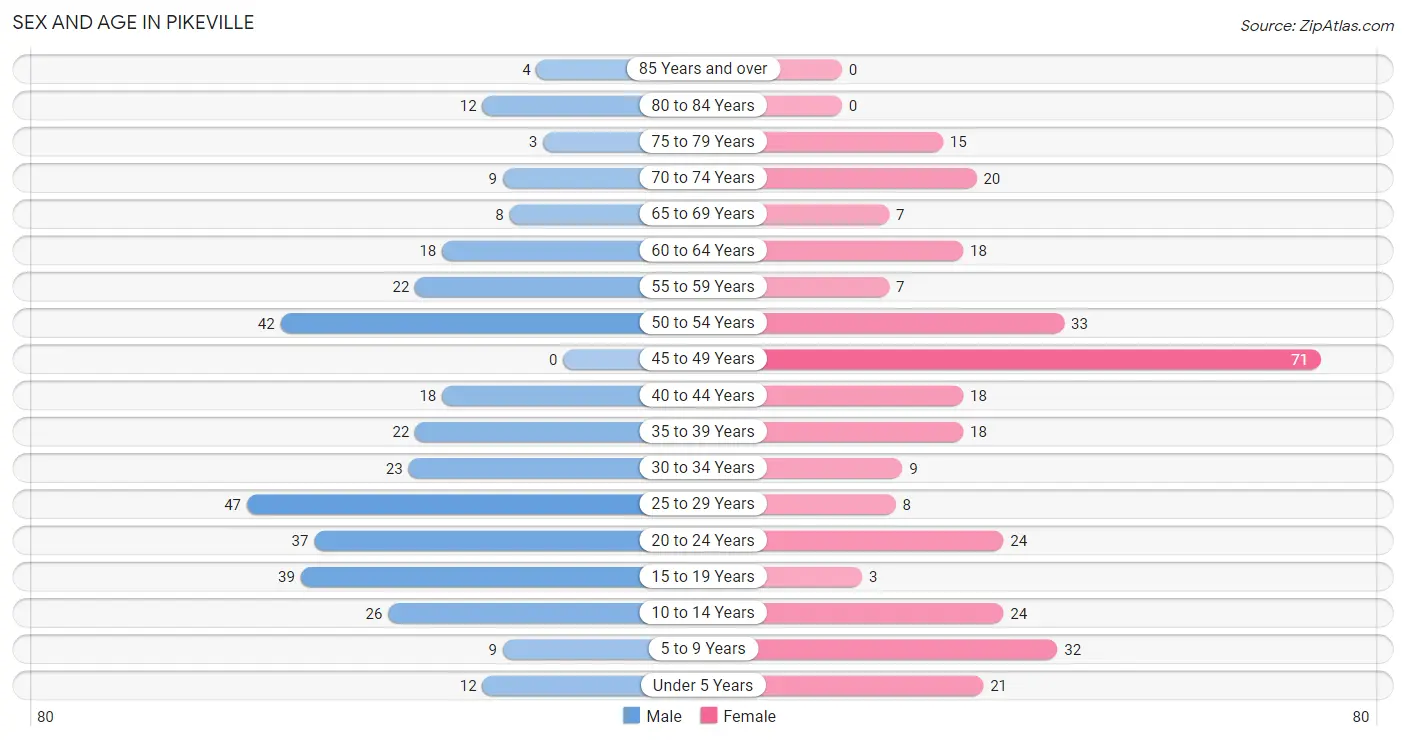
The most populous age groups in Pikeville are 25 to 29 Years (47 | 13.4%) for men and 45 to 49 Years (71 | 21.6%) for women.
| Age Bracket | Male | Female |
| Under 5 Years | 12 (3.4%) | 21 (6.4%) |
| 5 to 9 Years | 9 (2.6%) | 32 (9.8%) |
| 10 to 14 Years | 26 (7.4%) | 24 (7.3%) |
| 15 to 19 Years | 39 (11.1%) | 3 (0.9%) |
| 20 to 24 Years | 37 (10.5%) | 24 (7.3%) |
| 25 to 29 Years | 47 (13.4%) | 8 (2.4%) |
| 30 to 34 Years | 23 (6.6%) | 9 (2.7%) |
| 35 to 39 Years | 22 (6.3%) | 18 (5.5%) |
| 40 to 44 Years | 18 (5.1%) | 18 (5.5%) |
| 45 to 49 Years | 0 (0.0%) | 71 (21.6%) |
| 50 to 54 Years | 42 (12.0%) | 33 (10.1%) |
| 55 to 59 Years | 22 (6.3%) | 7 (2.1%) |
| 60 to 64 Years | 18 (5.1%) | 18 (5.5%) |
| 65 to 69 Years | 8 (2.3%) | 7 (2.1%) |
| 70 to 74 Years | 9 (2.6%) | 20 (6.1%) |
| 75 to 79 Years | 3 (0.9%) | 15 (4.6%) |
| 80 to 84 Years | 12 (3.4%) | 0 (0.0%) |
| 85 Years and over | 4 (1.1%) | 0 (0.0%) |
| Total | 351 (100.0%) | 328 (100.0%) |
Families and Households in Pikeville
Median Family Size in Pikeville
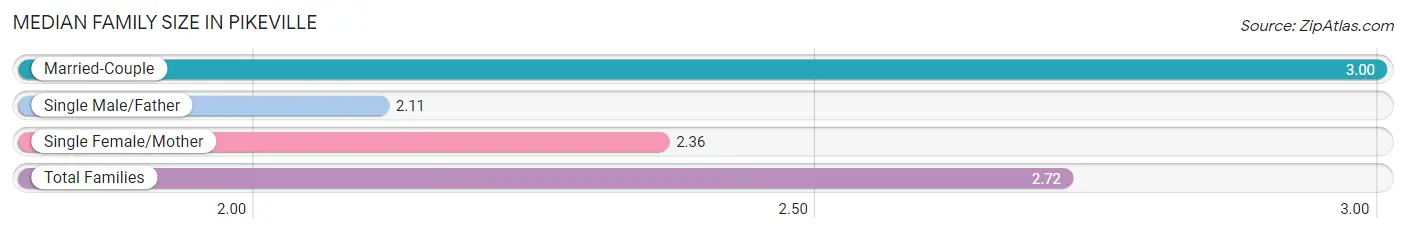
The median family size in Pikeville is 2.72 persons per family, with married-couple families (143 | 61.9%) accounting for the largest median family size of 3 persons per family. On the other hand, single male/father families (35 | 15.1%) represent the smallest median family size with 2.11 persons per family.
| Family Type | # Families | Family Size |
| Married-Couple | 143 (61.9%) | 3.00 |
| Single Male/Father | 35 (15.1%) | 2.11 |
| Single Female/Mother | 53 (22.9%) | 2.36 |
| Total Families | 231 (100.0%) | 2.72 |
Median Household Size in Pikeville
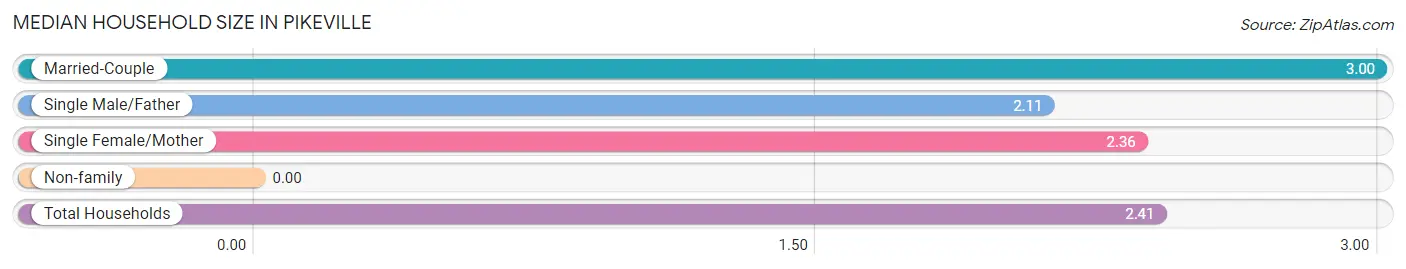
| Household Type | # Households | Household Size |
| Married-Couple | 143 (50.7%) | 3.00 |
| Single Male/Father | 35 (12.4%) | 2.11 |
| Single Female/Mother | 53 (18.8%) | 2.36 |
| Non-family | 51 (18.1%) | - |
| Total Households | 282 (100.0%) | 2.41 |
Household Size by Marriage Status in Pikeville
Out of a total of 282 households in Pikeville, 231 (81.9%) are family households, while 51 (18.1%) are nonfamily households. The most numerous type of family households are 2-person households, comprising 120, and the most common type of nonfamily households are 1-person households, comprising 51.
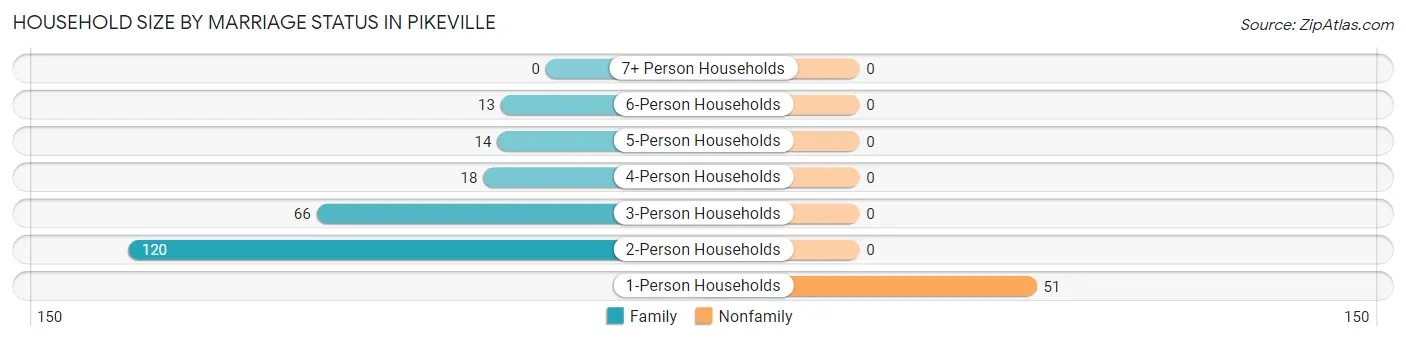
| Household Size | Family Households | Nonfamily Households |
| 1-Person Households | - | 51 (18.1%) |
| 2-Person Households | 120 (42.5%) | 0 (0.0%) |
| 3-Person Households | 66 (23.4%) | 0 (0.0%) |
| 4-Person Households | 18 (6.4%) | 0 (0.0%) |
| 5-Person Households | 14 (5.0%) | 0 (0.0%) |
| 6-Person Households | 13 (4.6%) | 0 (0.0%) |
| 7+ Person Households | 0 (0.0%) | 0 (0.0%) |
| Total | 231 (81.9%) | 51 (18.1%) |
Female Fertility in Pikeville
Fertility by Age in Pikeville
Average fertility rate in Pikeville is 86.0 births per 1,000 women. Women in the age bracket of 20 to 34 years have the highest fertility rate with 195.0 births per 1,000 women. Women in the age bracket of 20 to 34 years acount for 61.5% of all women with births.
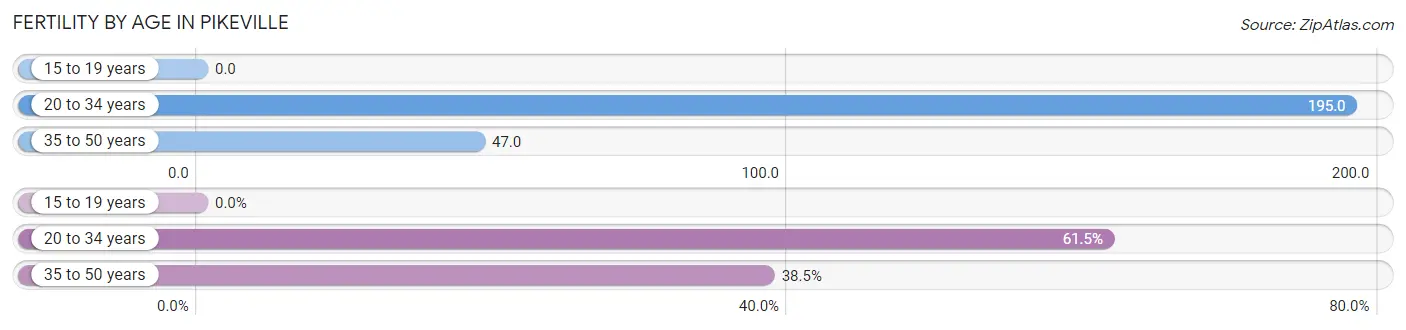
| Age Bracket | Women with Births | Births / 1,000 Women |
| 15 to 19 years | 0 (0.0%) | 0.0 |
| 20 to 34 years | 8 (61.5%) | 195.0 |
| 35 to 50 years | 5 (38.5%) | 47.0 |
| Total | 13 (100.0%) | 86.0 |
Fertility by Age by Marriage Status in Pikeville
61.5% of women with births (13) in Pikeville are married. The highest percentage of unmarried women with births falls into 35 to 50 years age bracket with 100.0% of them unmarried at the time of birth, while the lowest percentage of unmarried women with births belong to 20 to 34 years age bracket with 0.0% of them unmarried.
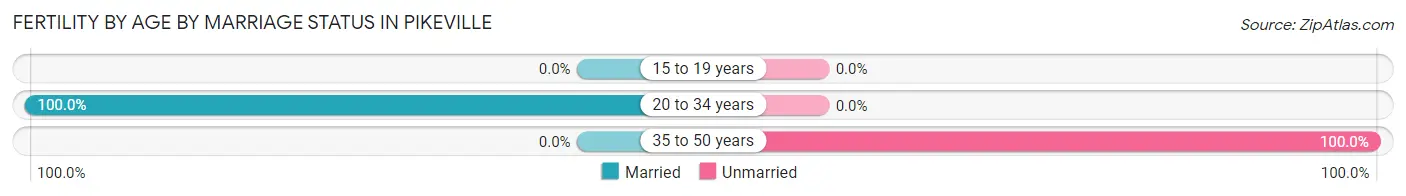
| Age Bracket | Married | Unmarried |
| 15 to 19 years | 0 (0.0%) | 0 (0.0%) |
| 20 to 34 years | 8 (100.0%) | 0 (0.0%) |
| 35 to 50 years | 0 (0.0%) | 5 (100.0%) |
| Total | 8 (61.5%) | 5 (38.5%) |
Fertility by Education in Pikeville
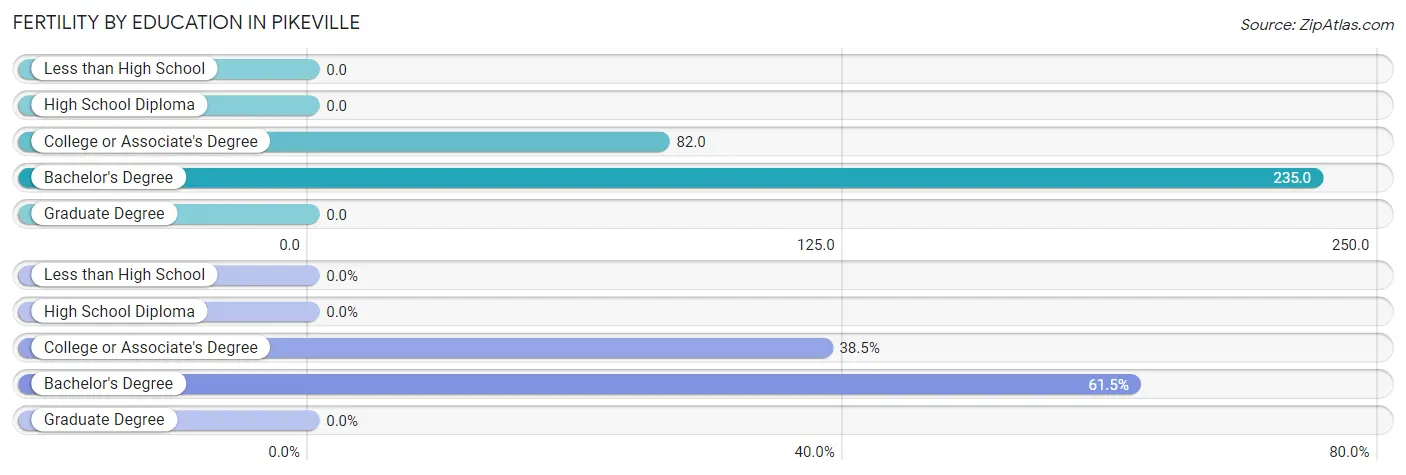
| Educational Attainment | Women with Births | Births / 1,000 Women |
| Less than High School | 0 (0.0%) | 0.0 |
| High School Diploma | 0 (0.0%) | 0.0 |
| College or Associate's Degree | 5 (38.5%) | 82.0 |
| Bachelor's Degree | 8 (61.5%) | 235.0 |
| Graduate Degree | 0 (0.0%) | 0.0 |
| Total | 13 (100.0%) | 86.0 |
Fertility by Education by Marriage Status in Pikeville
38.5% of women with births in Pikeville are unmarried. Women with the educational attainment of bachelor's degree are most likely to be married with 100.0% of them married at childbirth, while women with the educational attainment of college or associate's degree are least likely to be married with 100.0% of them unmarried at childbirth.
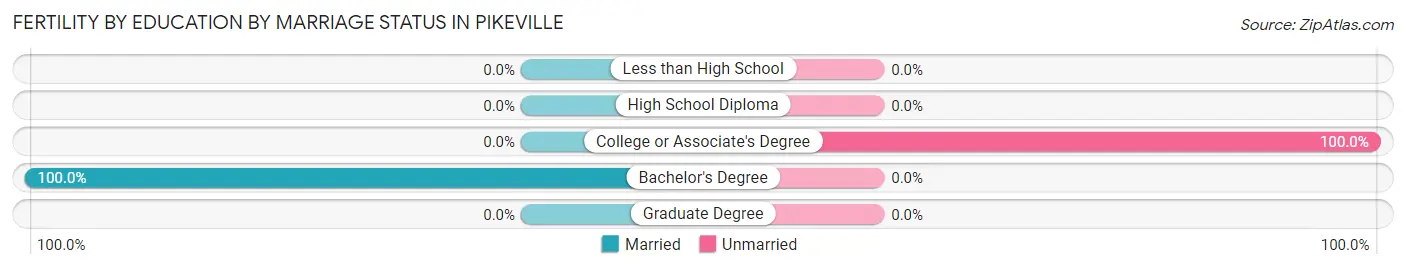
| Educational Attainment | Married | Unmarried |
| Less than High School | 0 (0.0%) | 0 (0.0%) |
| High School Diploma | 0 (0.0%) | 0 (0.0%) |
| College or Associate's Degree | 0 (0.0%) | 5 (100.0%) |
| Bachelor's Degree | 8 (100.0%) | 0 (0.0%) |
| Graduate Degree | 0 (0.0%) | 0 (0.0%) |
| Total | 8 (61.5%) | 5 (38.5%) |
Employment Characteristics in Pikeville
Employment by Class of Employer in Pikeville
Among the 365 employed individuals in Pikeville, private company employees (192 | 52.6%), state government employees (71 | 19.5%), and federal government employees (44 | 12.0%) make up the most common classes of employment.
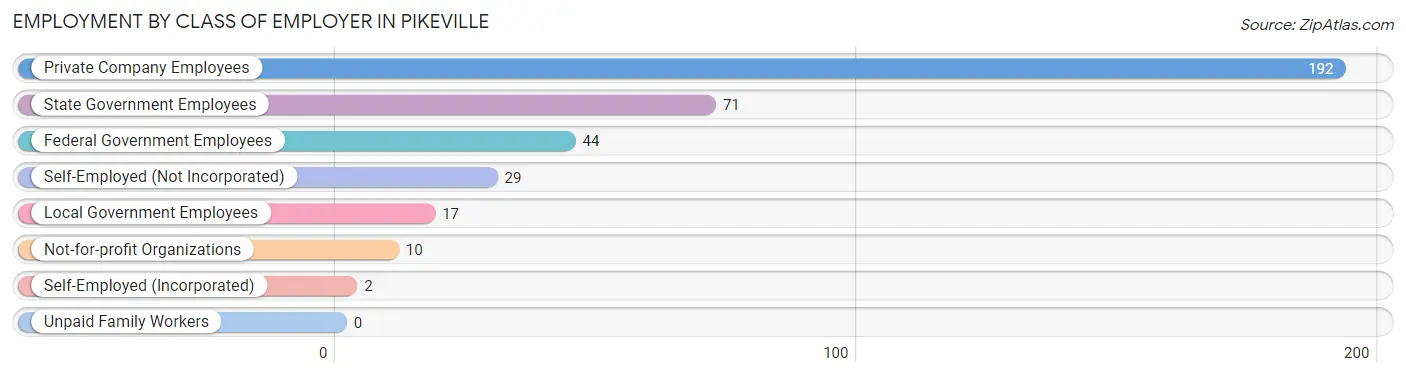
| Employer Class | # Employees | % Employees |
| Private Company Employees | 192 | 52.6% |
| Self-Employed (Incorporated) | 2 | 0.5% |
| Self-Employed (Not Incorporated) | 29 | 8.0% |
| Not-for-profit Organizations | 10 | 2.7% |
| Local Government Employees | 17 | 4.7% |
| State Government Employees | 71 | 19.5% |
| Federal Government Employees | 44 | 12.0% |
| Unpaid Family Workers | 0 | 0.0% |
| Total | 365 | 100.0% |
Employment Status by Age in Pikeville
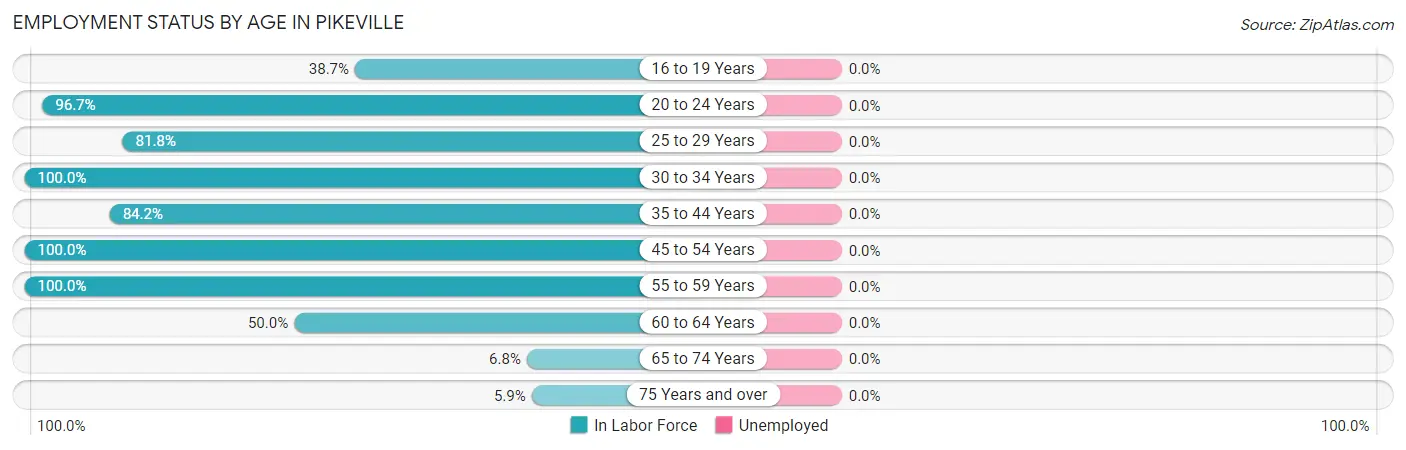
| Age Bracket | In Labor Force | Unemployed |
| 16 to 19 Years | 12 (38.7%) | 0 (0.0%) |
| 20 to 24 Years | 59 (96.7%) | 0 (0.0%) |
| 25 to 29 Years | 45 (81.8%) | 0 (0.0%) |
| 30 to 34 Years | 32 (100.0%) | 0 (0.0%) |
| 35 to 44 Years | 64 (84.2%) | 0 (0.0%) |
| 45 to 54 Years | 146 (100.0%) | 0 (0.0%) |
| 55 to 59 Years | 29 (100.0%) | 0 (0.0%) |
| 60 to 64 Years | 18 (50.0%) | 0 (0.0%) |
| 65 to 74 Years | 3 (6.8%) | 0 (0.0%) |
| 75 Years and over | 2 (5.9%) | 0 (0.0%) |
| Total | 410 (75.4%) | 0 (0.0%) |
Employment Status by Educational Attainment in Pikeville
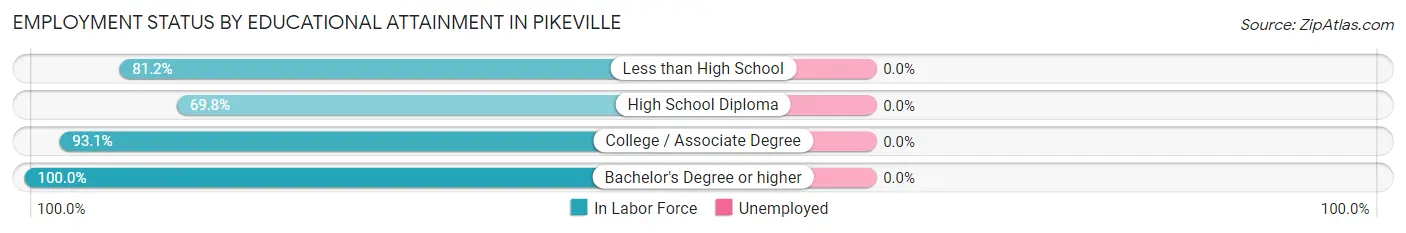
| Educational Attainment | In Labor Force | Unemployed |
| Less than High School | 56 (81.2%) | 0 (0.0%) |
| High School Diploma | 37 (69.8%) | 0 (0.0%) |
| College / Associate Degree | 148 (93.1%) | 0 (0.0%) |
| Bachelor's Degree or higher | 93 (100.0%) | 0 (0.0%) |
| Total | 334 (89.3%) | 0 (0.0%) |
Employment Occupations by Sex in Pikeville
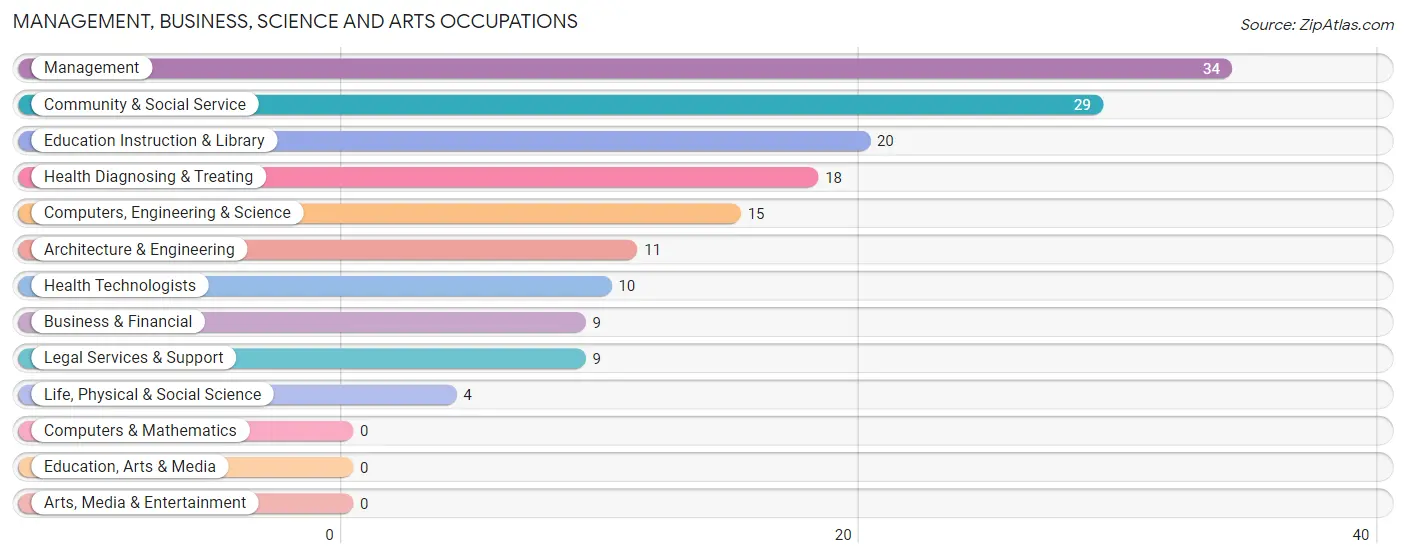
Management, Business, Science and Arts Occupations
The most common Management, Business, Science and Arts occupations in Pikeville are Management (34 | 8.5%), Community & Social Service (29 | 7.2%), Education Instruction & Library (20 | 5.0%), Health Diagnosing & Treating (18 | 4.5%), and Computers, Engineering & Science (15 | 3.7%).
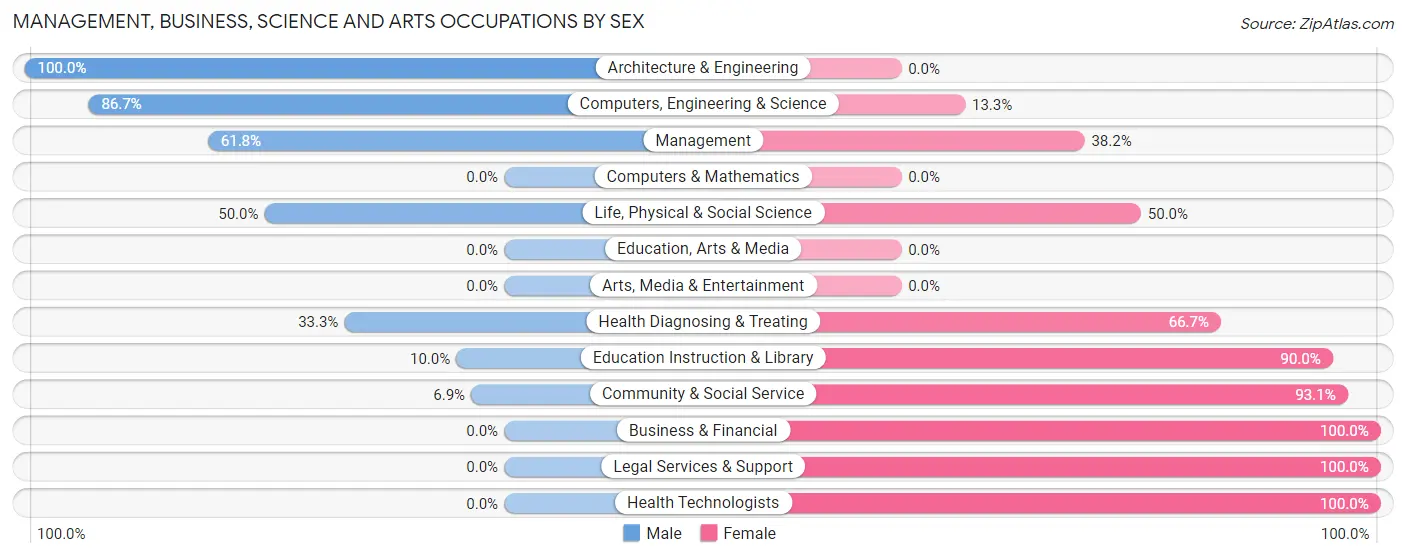
Management, Business, Science and Arts Occupations by Sex
Within the Management, Business, Science and Arts occupations in Pikeville, the most male-oriented occupations are Architecture & Engineering (100.0%), Computers, Engineering & Science (86.7%), and Management (61.8%), while the most female-oriented occupations are Business & Financial (100.0%), Legal Services & Support (100.0%), and Health Technologists (100.0%).
| Occupation | Male | Female |
| Management | 21 (61.8%) | 13 (38.2%) |
| Business & Financial | 0 (0.0%) | 9 (100.0%) |
| Computers, Engineering & Science | 13 (86.7%) | 2 (13.3%) |
| Computers & Mathematics | 0 (0.0%) | 0 (0.0%) |
| Architecture & Engineering | 11 (100.0%) | 0 (0.0%) |
| Life, Physical & Social Science | 2 (50.0%) | 2 (50.0%) |
| Community & Social Service | 2 (6.9%) | 27 (93.1%) |
| Education, Arts & Media | 0 (0.0%) | 0 (0.0%) |
| Legal Services & Support | 0 (0.0%) | 9 (100.0%) |
| Education Instruction & Library | 2 (10.0%) | 18 (90.0%) |
| Arts, Media & Entertainment | 0 (0.0%) | 0 (0.0%) |
| Health Diagnosing & Treating | 6 (33.3%) | 12 (66.7%) |
| Health Technologists | 0 (0.0%) | 10 (100.0%) |
| Total (Category) | 42 (40.0%) | 63 (60.0%) |
| Total (Overall) | 213 (53.1%) | 188 (46.9%) |
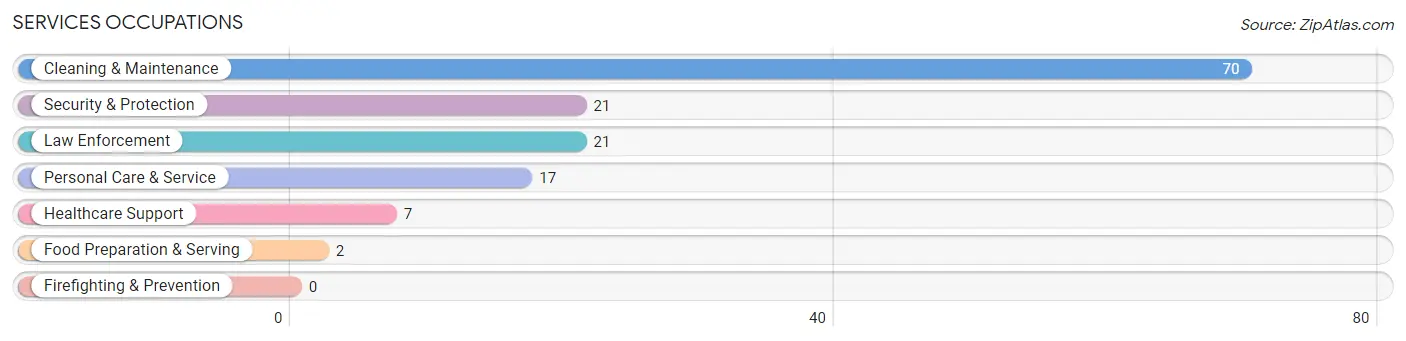
Services Occupations
The most common Services occupations in Pikeville are Cleaning & Maintenance (70 | 17.5%), Security & Protection (21 | 5.2%), Law Enforcement (21 | 5.2%), Personal Care & Service (17 | 4.2%), and Healthcare Support (7 | 1.8%).
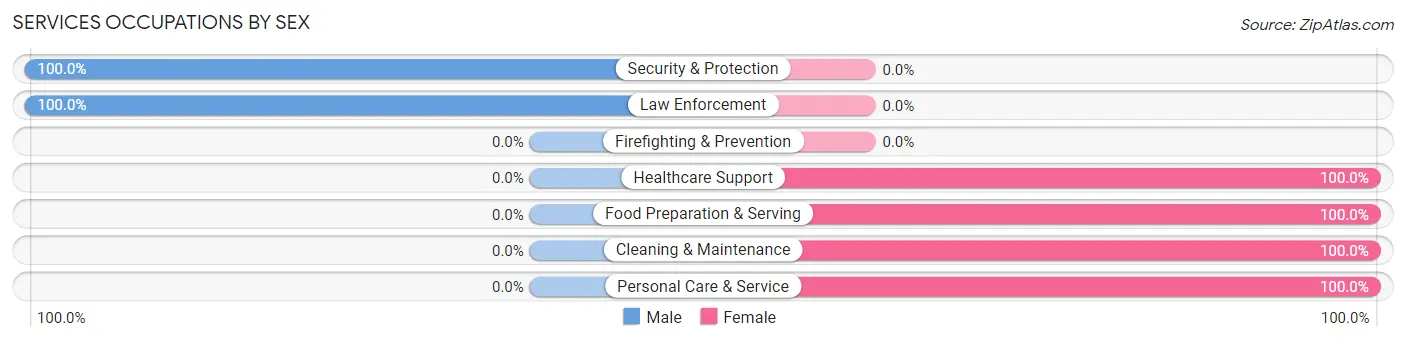
Services Occupations by Sex
Within the Services occupations in Pikeville, the most male-oriented occupations are Security & Protection (100.0%), and Law Enforcement (100.0%), while the most female-oriented occupations are Healthcare Support (100.0%), Food Preparation & Serving (100.0%), and Cleaning & Maintenance (100.0%).
| Occupation | Male | Female |
| Healthcare Support | 0 (0.0%) | 7 (100.0%) |
| Security & Protection | 21 (100.0%) | 0 (0.0%) |
| Firefighting & Prevention | 0 (0.0%) | 0 (0.0%) |
| Law Enforcement | 21 (100.0%) | 0 (0.0%) |
| Food Preparation & Serving | 0 (0.0%) | 2 (100.0%) |
| Cleaning & Maintenance | 0 (0.0%) | 70 (100.0%) |
| Personal Care & Service | 0 (0.0%) | 17 (100.0%) |
| Total (Category) | 21 (17.9%) | 96 (82.1%) |
| Total (Overall) | 213 (53.1%) | 188 (46.9%) |
Sales and Office Occupations
The most common Sales and Office occupations in Pikeville are Sales & Related (30 | 7.5%), and Office & Administration (28 | 7.0%).

Sales and Office Occupations by Sex
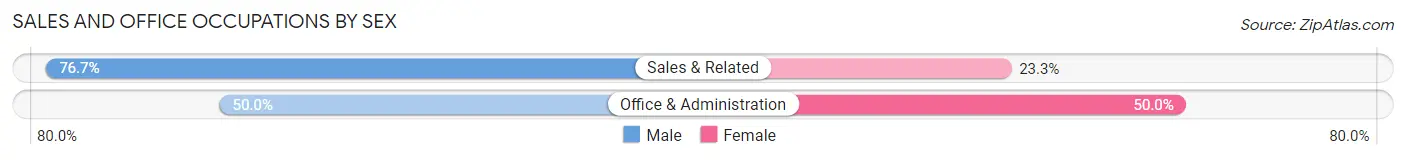
| Occupation | Male | Female |
| Sales & Related | 23 (76.7%) | 7 (23.3%) |
| Office & Administration | 14 (50.0%) | 14 (50.0%) |
| Total (Category) | 37 (63.8%) | 21 (36.2%) |
| Total (Overall) | 213 (53.1%) | 188 (46.9%) |
Natural Resources, Construction and Maintenance Occupations
The most common Natural Resources, Construction and Maintenance occupations in Pikeville are Construction & Extraction (42 | 10.5%), and Installation, Maintenance & Repair (42 | 10.5%).

Natural Resources, Construction and Maintenance Occupations by Sex

| Occupation | Male | Female |
| Farming, Fishing & Forestry | 0 (0.0%) | 0 (0.0%) |
| Construction & Extraction | 42 (100.0%) | 0 (0.0%) |
| Installation, Maintenance & Repair | 42 (100.0%) | 0 (0.0%) |
| Total (Category) | 84 (100.0%) | 0 (0.0%) |
| Total (Overall) | 213 (53.1%) | 188 (46.9%) |
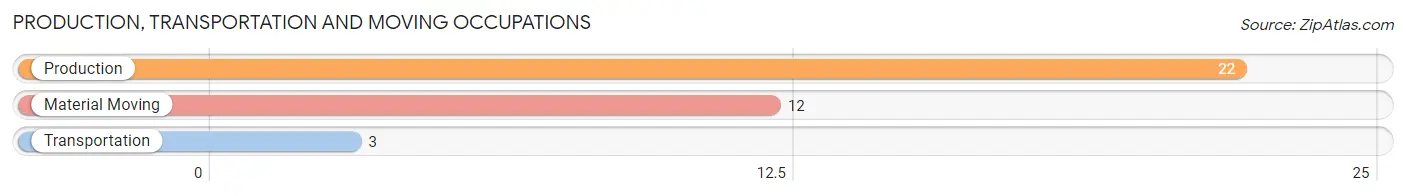
Production, Transportation and Moving Occupations
The most common Production, Transportation and Moving occupations in Pikeville are Production (22 | 5.5%), Material Moving (12 | 3.0%), and Transportation (3 | 0.7%).
Production, Transportation and Moving Occupations by Sex
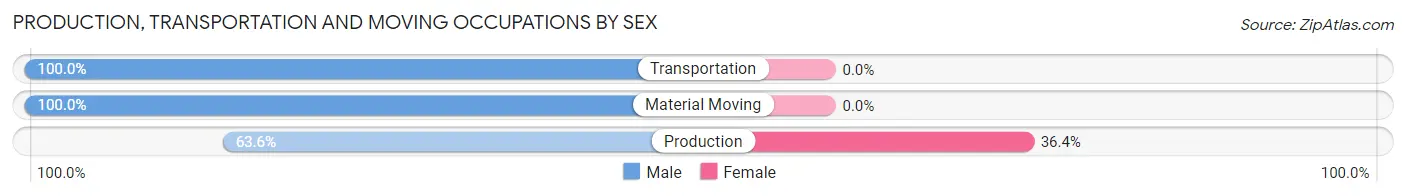
| Occupation | Male | Female |
| Production | 14 (63.6%) | 8 (36.4%) |
| Transportation | 3 (100.0%) | 0 (0.0%) |
| Material Moving | 12 (100.0%) | 0 (0.0%) |
| Total (Category) | 29 (78.4%) | 8 (21.6%) |
| Total (Overall) | 213 (53.1%) | 188 (46.9%) |
Employment Industries by Sex in Pikeville
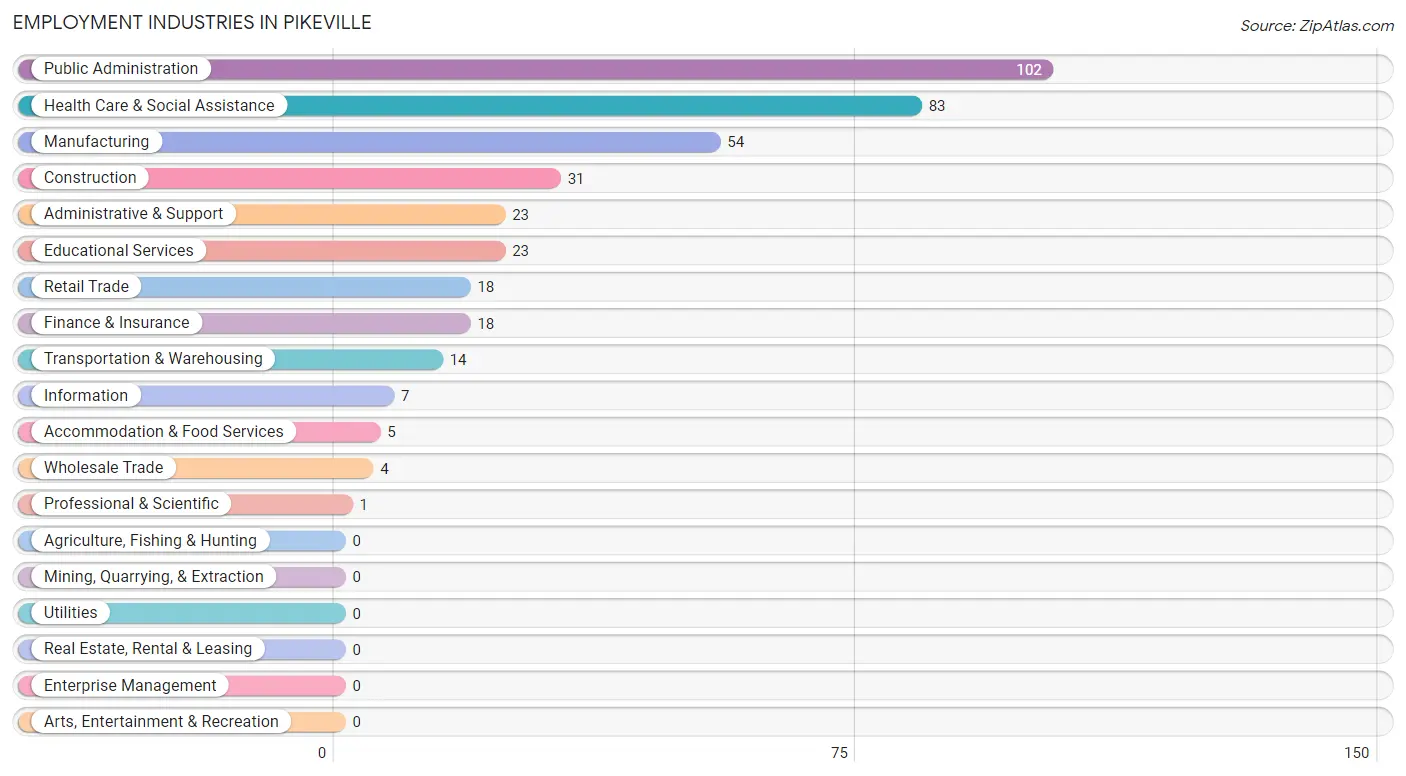
Employment Industries in Pikeville
The major employment industries in Pikeville include Public Administration (102 | 25.4%), Health Care & Social Assistance (83 | 20.7%), Manufacturing (54 | 13.5%), Construction (31 | 7.7%), and Administrative & Support (23 | 5.7%).
Employment Industries by Sex in Pikeville
The Pikeville industries that see more men than women are Construction (100.0%), Wholesale Trade (100.0%), and Transportation & Warehousing (100.0%), whereas the industries that tend to have a higher number of women are Professional & Scientific (100.0%), Administrative & Support (100.0%), and Health Care & Social Assistance (100.0%).
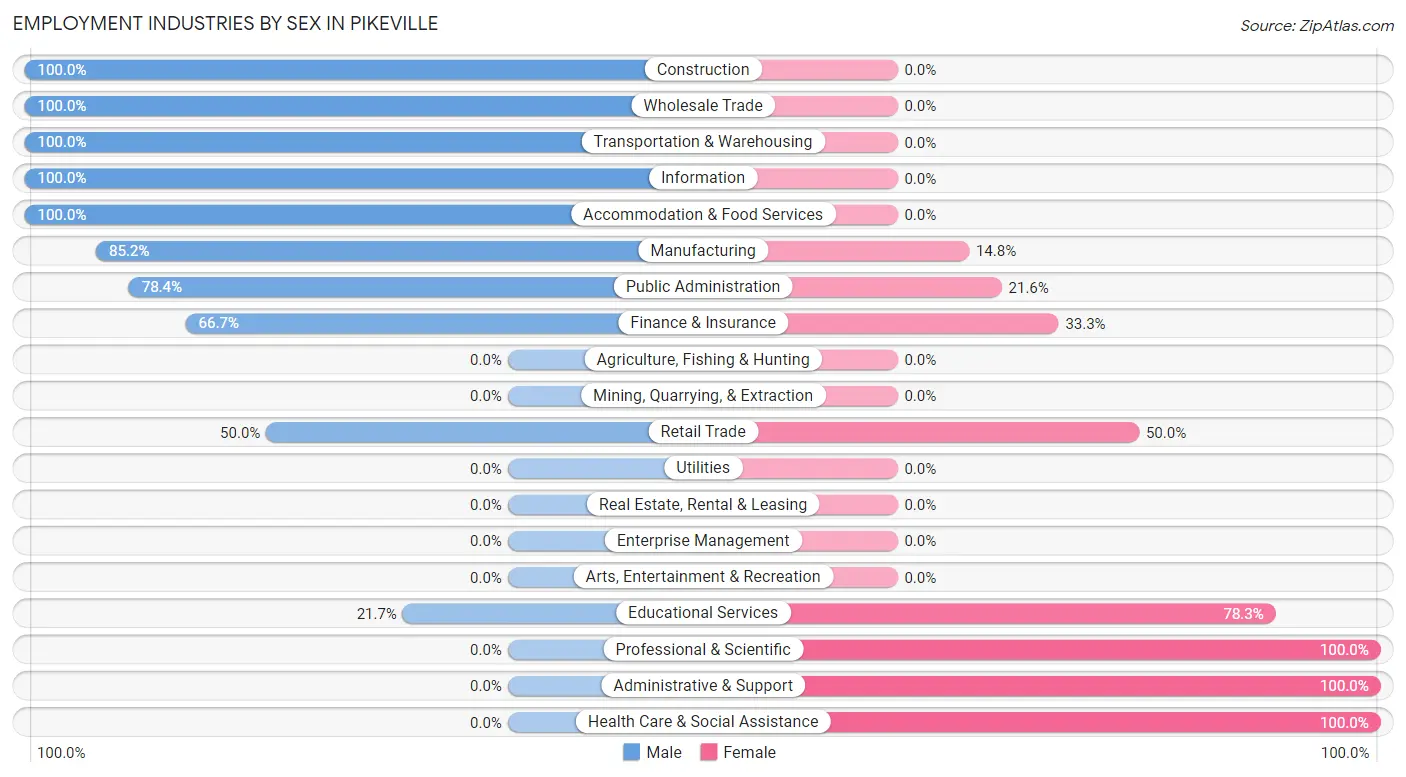
| Industry | Male | Female |
| Agriculture, Fishing & Hunting | 0 (0.0%) | 0 (0.0%) |
| Mining, Quarrying, & Extraction | 0 (0.0%) | 0 (0.0%) |
| Construction | 31 (100.0%) | 0 (0.0%) |
| Manufacturing | 46 (85.2%) | 8 (14.8%) |
| Wholesale Trade | 4 (100.0%) | 0 (0.0%) |
| Retail Trade | 9 (50.0%) | 9 (50.0%) |
| Transportation & Warehousing | 14 (100.0%) | 0 (0.0%) |
| Utilities | 0 (0.0%) | 0 (0.0%) |
| Information | 7 (100.0%) | 0 (0.0%) |
| Finance & Insurance | 12 (66.7%) | 6 (33.3%) |
| Real Estate, Rental & Leasing | 0 (0.0%) | 0 (0.0%) |
| Professional & Scientific | 0 (0.0%) | 1 (100.0%) |
| Enterprise Management | 0 (0.0%) | 0 (0.0%) |
| Administrative & Support | 0 (0.0%) | 23 (100.0%) |
| Educational Services | 5 (21.7%) | 18 (78.3%) |
| Health Care & Social Assistance | 0 (0.0%) | 83 (100.0%) |
| Arts, Entertainment & Recreation | 0 (0.0%) | 0 (0.0%) |
| Accommodation & Food Services | 5 (100.0%) | 0 (0.0%) |
| Public Administration | 80 (78.4%) | 22 (21.6%) |
| Total | 213 (53.1%) | 188 (46.9%) |
Education in Pikeville
School Enrollment in Pikeville
The most common levels of schooling among the 172 students in Pikeville are college / undergraduate (55 | 32.0%), middle school (53 | 30.8%), and elementary school (33 | 19.2%).
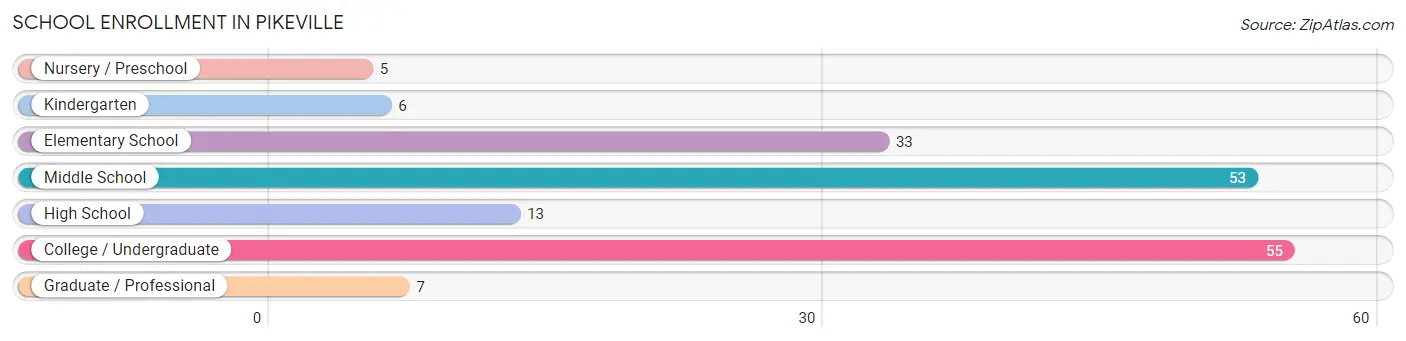
| School Level | # Students | % Students |
| Nursery / Preschool | 5 | 2.9% |
| Kindergarten | 6 | 3.5% |
| Elementary School | 33 | 19.2% |
| Middle School | 53 | 30.8% |
| High School | 13 | 7.6% |
| College / Undergraduate | 55 | 32.0% |
| Graduate / Professional | 7 | 4.1% |
| Total | 172 | 100.0% |
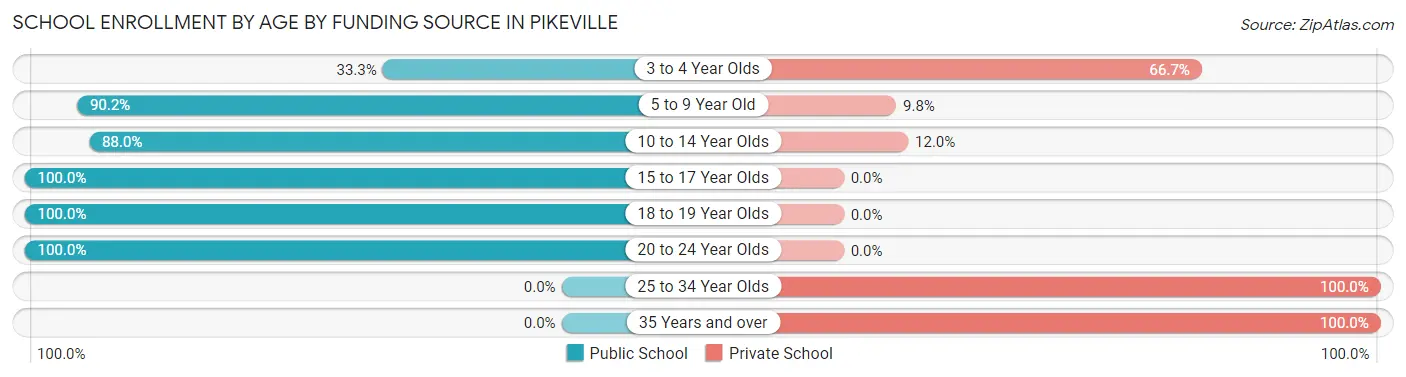
School Enrollment by Age by Funding Source in Pikeville
Out of a total of 172 students who are enrolled in schools in Pikeville, 44 (25.6%) attend a private institution, while the remaining 128 (74.4%) are enrolled in public schools. The age group of 25 to 34 year olds has the highest likelihood of being enrolled in private schools, with 9 (100.0% in the age bracket) enrolled. Conversely, the age group of 15 to 17 year olds has the lowest likelihood of being enrolled in a private school, with 11 (100.0% in the age bracket) attending a public institution.
| Age Bracket | Public School | Private School |
| 3 to 4 Year Olds | 1 (33.3%) | 2 (66.7%) |
| 5 to 9 Year Old | 37 (90.2%) | 4 (9.8%) |
| 10 to 14 Year Olds | 44 (88.0%) | 6 (12.0%) |
| 15 to 17 Year Olds | 11 (100.0%) | 0 (0.0%) |
| 18 to 19 Year Olds | 16 (100.0%) | 0 (0.0%) |
| 20 to 24 Year Olds | 19 (100.0%) | 0 (0.0%) |
| 25 to 34 Year Olds | 0 (0.0%) | 9 (100.0%) |
| 35 Years and over | 0 (0.0%) | 23 (100.0%) |
| Total | 128 (74.4%) | 44 (25.6%) |
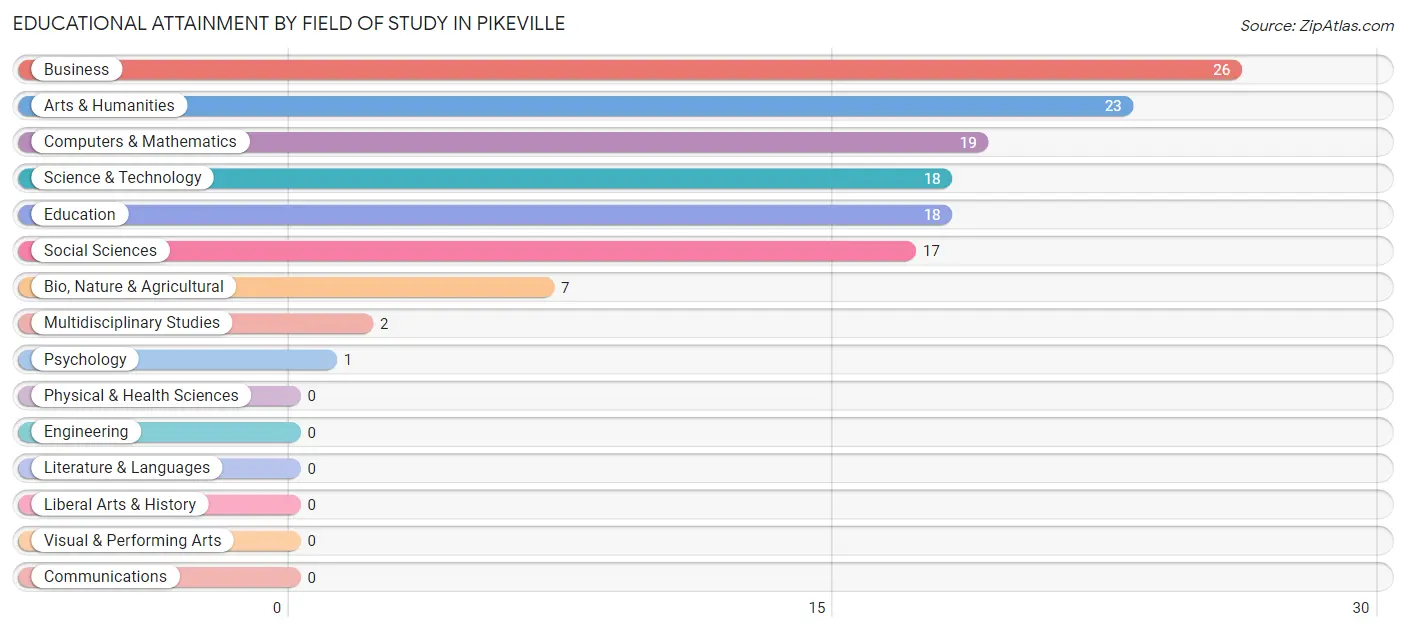
Educational Attainment by Field of Study in Pikeville
Business (26 | 19.9%), arts & humanities (23 | 17.6%), computers & mathematics (19 | 14.5%), science & technology (18 | 13.7%), and education (18 | 13.7%) are the most common fields of study among 131 individuals in Pikeville who have obtained a bachelor's degree or higher.
| Field of Study | # Graduates | % Graduates |
| Computers & Mathematics | 19 | 14.5% |
| Bio, Nature & Agricultural | 7 | 5.3% |
| Physical & Health Sciences | 0 | 0.0% |
| Psychology | 1 | 0.8% |
| Social Sciences | 17 | 13.0% |
| Engineering | 0 | 0.0% |
| Multidisciplinary Studies | 2 | 1.5% |
| Science & Technology | 18 | 13.7% |
| Business | 26 | 19.9% |
| Education | 18 | 13.7% |
| Literature & Languages | 0 | 0.0% |
| Liberal Arts & History | 0 | 0.0% |
| Visual & Performing Arts | 0 | 0.0% |
| Communications | 0 | 0.0% |
| Arts & Humanities | 23 | 17.6% |
| Total | 131 | 100.0% |
Transportation & Commute in Pikeville
Vehicle Availability by Sex in Pikeville
The most prevalent vehicle ownership categories in Pikeville are males with 2 vehicles (97, accounting for 52.4%) and females with 2 vehicles (97, making up 53.9%).
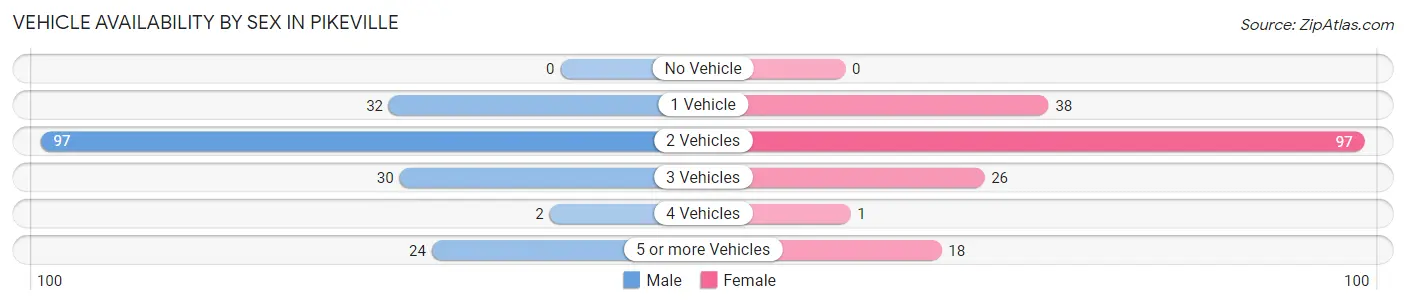
| Vehicles Available | Male | Female |
| No Vehicle | 0 (0.0%) | 0 (0.0%) |
| 1 Vehicle | 32 (17.3%) | 38 (21.1%) |
| 2 Vehicles | 97 (52.4%) | 97 (53.9%) |
| 3 Vehicles | 30 (16.2%) | 26 (14.4%) |
| 4 Vehicles | 2 (1.1%) | 1 (0.6%) |
| 5 or more Vehicles | 24 (13.0%) | 18 (10.0%) |
| Total | 185 (100.0%) | 180 (100.0%) |
Commute Time in Pikeville
The most frequently occuring commute durations in Pikeville are 30 to 34 minutes (62 commuters, 17.1%), 15 to 19 minutes (58 commuters, 16.0%), and 10 to 14 minutes (57 commuters, 15.7%).
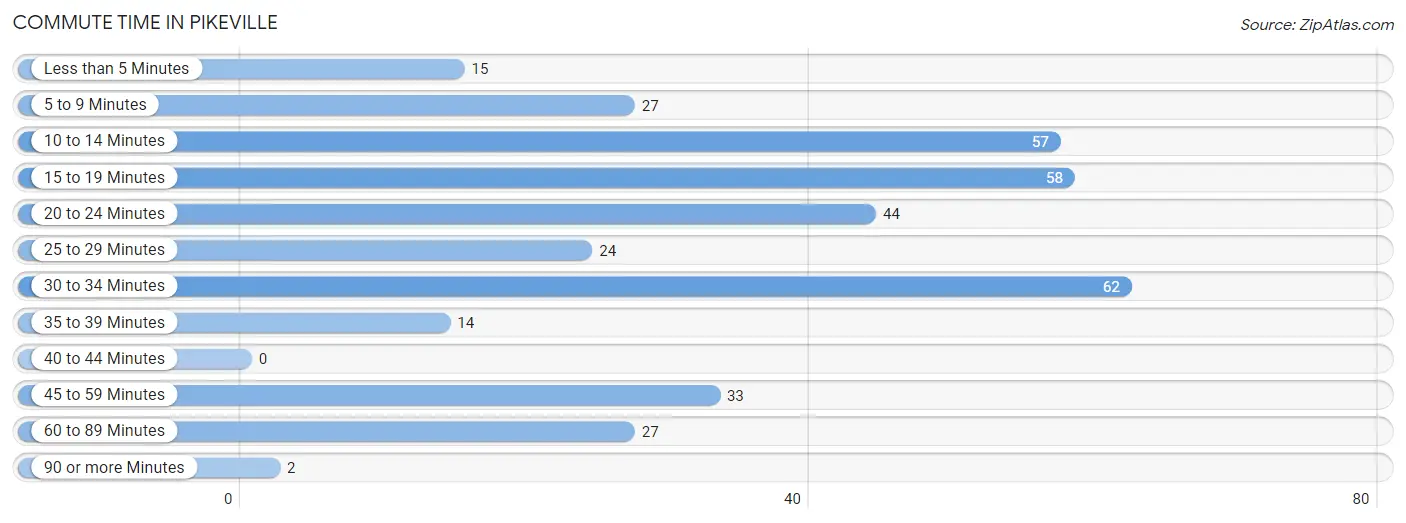
| Commute Time | # Commuters | % Commuters |
| Less than 5 Minutes | 15 | 4.1% |
| 5 to 9 Minutes | 27 | 7.4% |
| 10 to 14 Minutes | 57 | 15.7% |
| 15 to 19 Minutes | 58 | 16.0% |
| 20 to 24 Minutes | 44 | 12.1% |
| 25 to 29 Minutes | 24 | 6.6% |
| 30 to 34 Minutes | 62 | 17.1% |
| 35 to 39 Minutes | 14 | 3.9% |
| 40 to 44 Minutes | 0 | 0.0% |
| 45 to 59 Minutes | 33 | 9.1% |
| 60 to 89 Minutes | 27 | 7.4% |
| 90 or more Minutes | 2 | 0.5% |
Commute Time by Sex in Pikeville
The most common commute times in Pikeville are 20 to 24 minutes (37 commuters, 20.0%) for males and 10 to 14 minutes (39 commuters, 21.9%) for females.
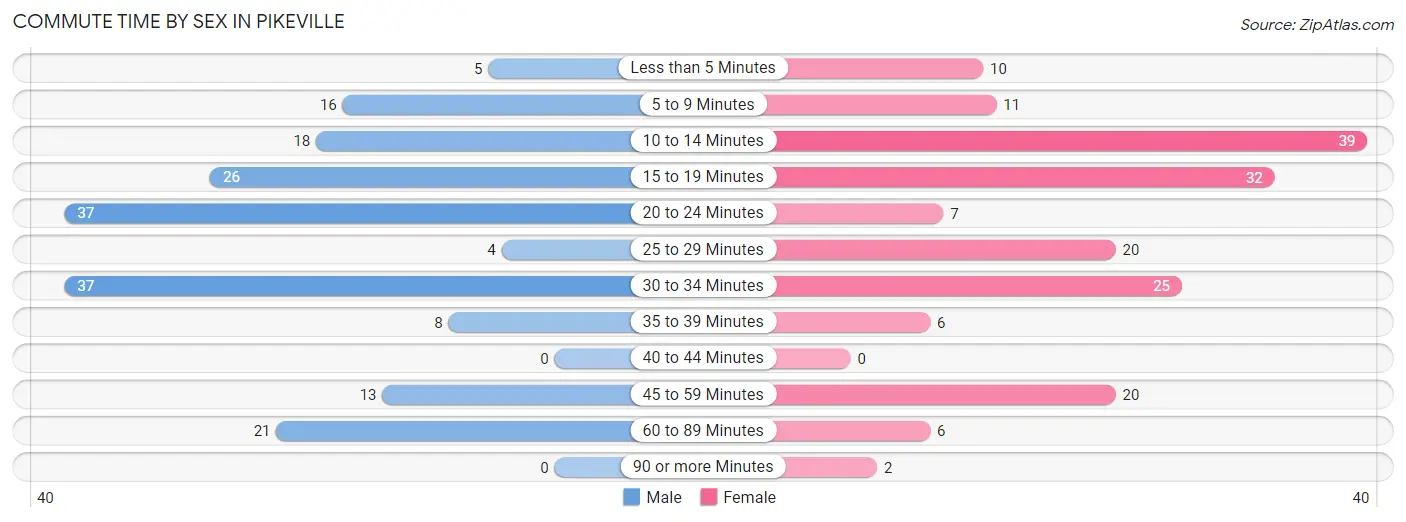
| Commute Time | Male | Female |
| Less than 5 Minutes | 5 (2.7%) | 10 (5.6%) |
| 5 to 9 Minutes | 16 (8.6%) | 11 (6.2%) |
| 10 to 14 Minutes | 18 (9.7%) | 39 (21.9%) |
| 15 to 19 Minutes | 26 (14.1%) | 32 (18.0%) |
| 20 to 24 Minutes | 37 (20.0%) | 7 (3.9%) |
| 25 to 29 Minutes | 4 (2.2%) | 20 (11.2%) |
| 30 to 34 Minutes | 37 (20.0%) | 25 (14.0%) |
| 35 to 39 Minutes | 8 (4.3%) | 6 (3.4%) |
| 40 to 44 Minutes | 0 (0.0%) | 0 (0.0%) |
| 45 to 59 Minutes | 13 (7.0%) | 20 (11.2%) |
| 60 to 89 Minutes | 21 (11.4%) | 6 (3.4%) |
| 90 or more Minutes | 0 (0.0%) | 2 (1.1%) |
Time of Departure to Work by Sex in Pikeville
The most frequent times of departure to work in Pikeville are 6:00 AM to 6:29 AM (39, 21.1%) for males and 6:00 AM to 6:29 AM (42, 23.6%) for females.
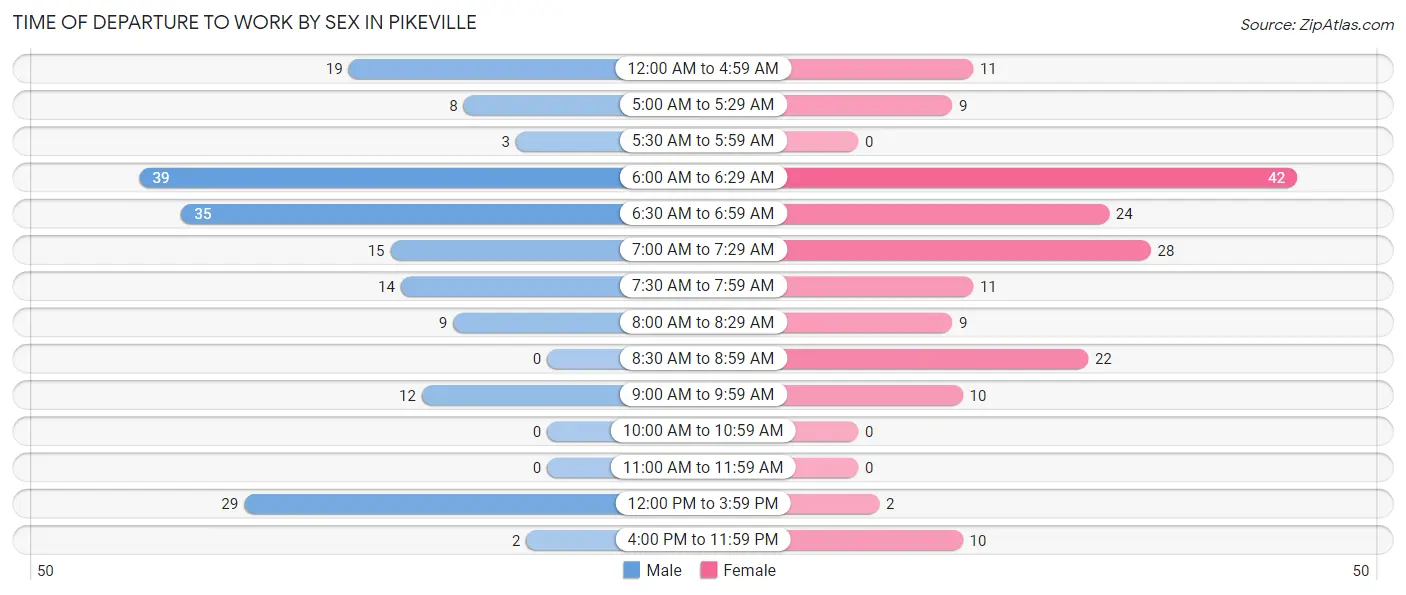
| Time of Departure | Male | Female |
| 12:00 AM to 4:59 AM | 19 (10.3%) | 11 (6.2%) |
| 5:00 AM to 5:29 AM | 8 (4.3%) | 9 (5.1%) |
| 5:30 AM to 5:59 AM | 3 (1.6%) | 0 (0.0%) |
| 6:00 AM to 6:29 AM | 39 (21.1%) | 42 (23.6%) |
| 6:30 AM to 6:59 AM | 35 (18.9%) | 24 (13.5%) |
| 7:00 AM to 7:29 AM | 15 (8.1%) | 28 (15.7%) |
| 7:30 AM to 7:59 AM | 14 (7.6%) | 11 (6.2%) |
| 8:00 AM to 8:29 AM | 9 (4.9%) | 9 (5.1%) |
| 8:30 AM to 8:59 AM | 0 (0.0%) | 22 (12.4%) |
| 9:00 AM to 9:59 AM | 12 (6.5%) | 10 (5.6%) |
| 10:00 AM to 10:59 AM | 0 (0.0%) | 0 (0.0%) |
| 11:00 AM to 11:59 AM | 0 (0.0%) | 0 (0.0%) |
| 12:00 PM to 3:59 PM | 29 (15.7%) | 2 (1.1%) |
| 4:00 PM to 11:59 PM | 2 (1.1%) | 10 (5.6%) |
| Total | 185 (100.0%) | 178 (100.0%) |
Housing Occupancy in Pikeville
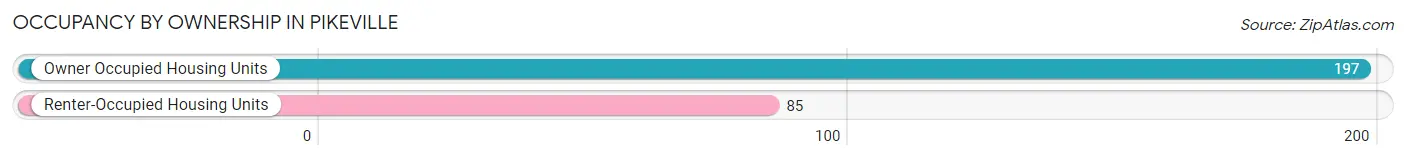
Occupancy by Ownership in Pikeville
Of the total 282 dwellings in Pikeville, owner-occupied units account for 197 (69.9%), while renter-occupied units make up 85 (30.1%).
| Occupancy | # Housing Units | % Housing Units |
| Owner Occupied Housing Units | 197 | 69.9% |
| Renter-Occupied Housing Units | 85 | 30.1% |
| Total Occupied Housing Units | 282 | 100.0% |
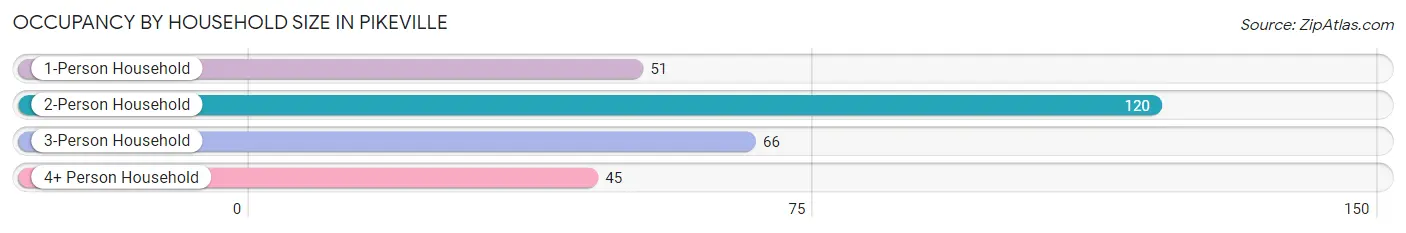
Occupancy by Household Size in Pikeville
| Household Size | # Housing Units | % Housing Units |
| 1-Person Household | 51 | 18.1% |
| 2-Person Household | 120 | 42.5% |
| 3-Person Household | 66 | 23.4% |
| 4+ Person Household | 45 | 16.0% |
| Total Housing Units | 282 | 100.0% |
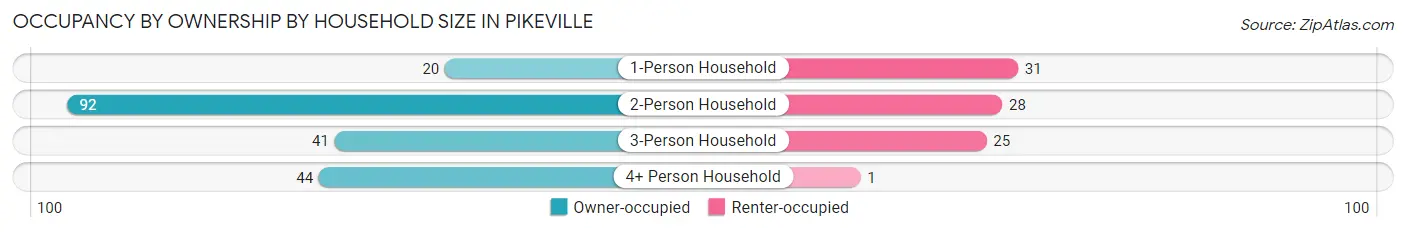
Occupancy by Ownership by Household Size in Pikeville
| Household Size | Owner-occupied | Renter-occupied |
| 1-Person Household | 20 (39.2%) | 31 (60.8%) |
| 2-Person Household | 92 (76.7%) | 28 (23.3%) |
| 3-Person Household | 41 (62.1%) | 25 (37.9%) |
| 4+ Person Household | 44 (97.8%) | 1 (2.2%) |
| Total Housing Units | 197 (69.9%) | 85 (30.1%) |
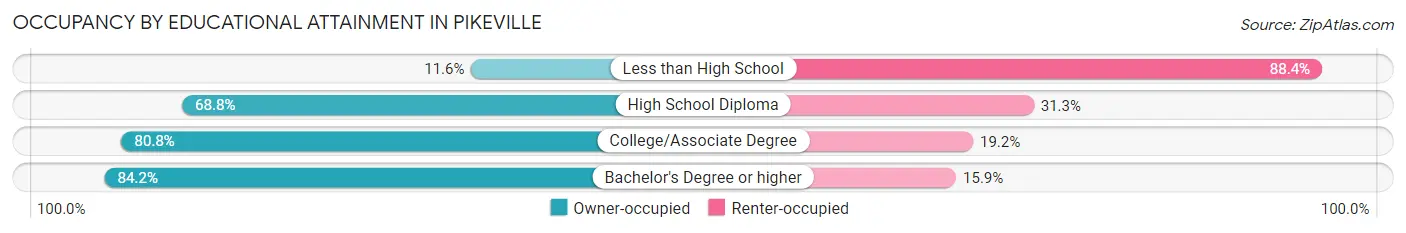
Occupancy by Educational Attainment in Pikeville
| Household Size | Owner-occupied | Renter-occupied |
| Less than High School | 5 (11.6%) | 38 (88.4%) |
| High School Diploma | 22 (68.8%) | 10 (31.2%) |
| College/Associate Degree | 101 (80.8%) | 24 (19.2%) |
| Bachelor's Degree or higher | 69 (84.2%) | 13 (15.9%) |
Occupancy by Age of Householder in Pikeville
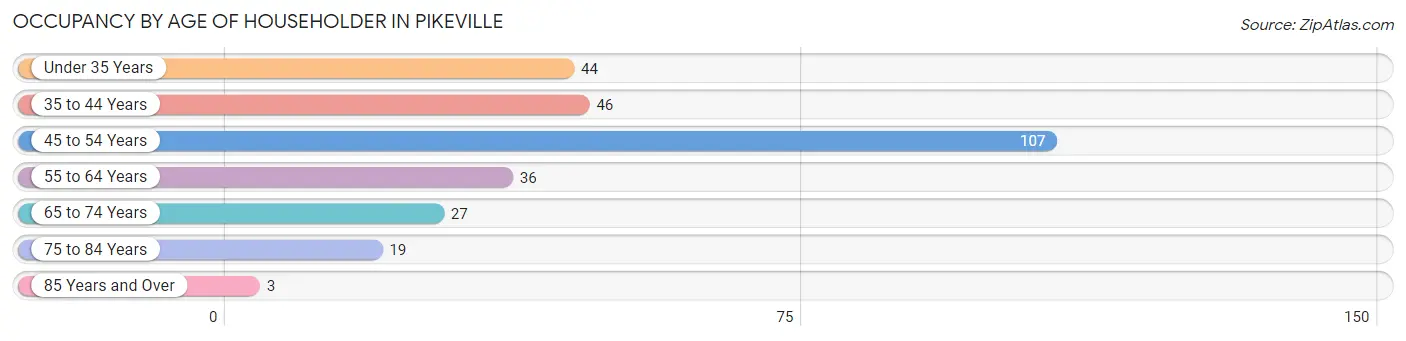
| Age Bracket | # Households | % Households |
| Under 35 Years | 44 | 15.6% |
| 35 to 44 Years | 46 | 16.3% |
| 45 to 54 Years | 107 | 37.9% |
| 55 to 64 Years | 36 | 12.8% |
| 65 to 74 Years | 27 | 9.6% |
| 75 to 84 Years | 19 | 6.7% |
| 85 Years and Over | 3 | 1.1% |
| Total | 282 | 100.0% |
Housing Finances in Pikeville
Median Income by Occupancy in Pikeville
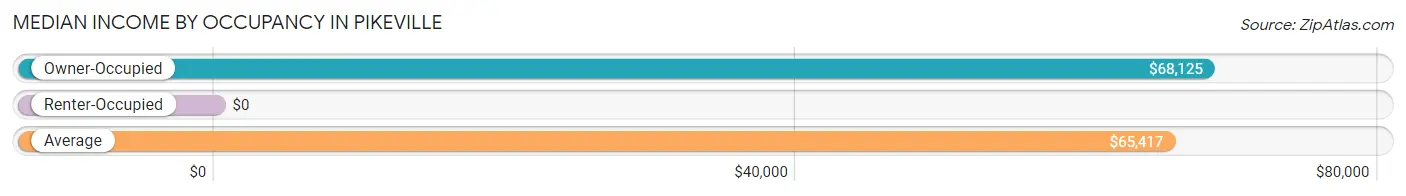
| Occupancy Type | # Households | Median Income |
| Owner-Occupied | 197 (69.9%) | $68,125 |
| Renter-Occupied | 85 (30.1%) | $0 |
| Average | 282 (100.0%) | $65,417 |
Occupancy by Householder Income Bracket in Pikeville
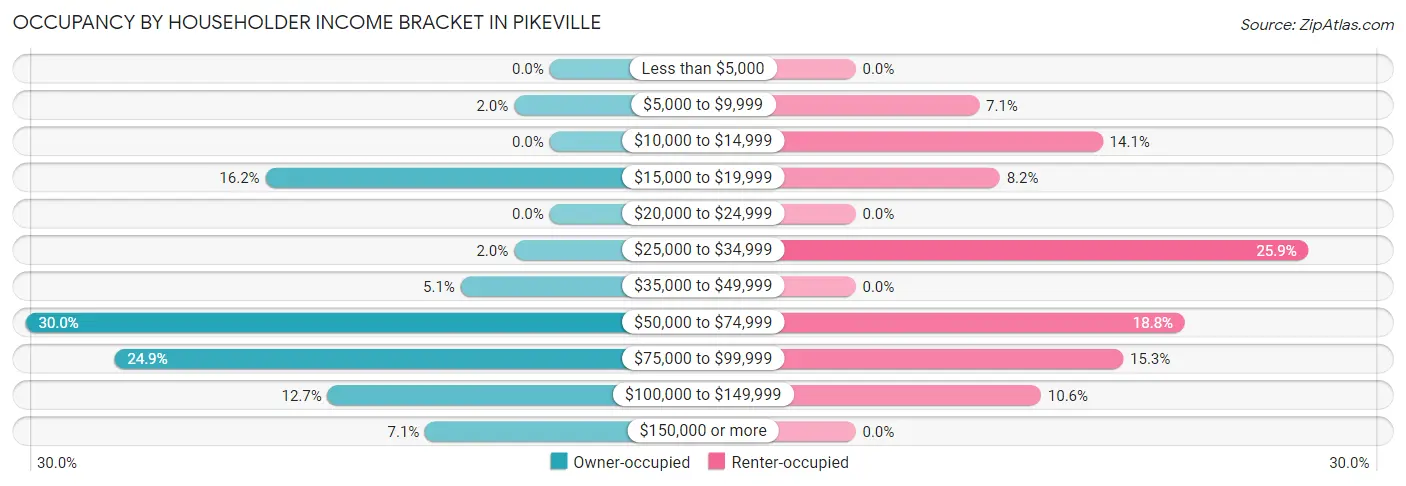
| Income Bracket | Owner-occupied | Renter-occupied |
| Less than $5,000 | 0 (0.0%) | 0 (0.0%) |
| $5,000 to $9,999 | 4 (2.0%) | 6 (7.1%) |
| $10,000 to $14,999 | 0 (0.0%) | 12 (14.1%) |
| $15,000 to $19,999 | 32 (16.2%) | 7 (8.2%) |
| $20,000 to $24,999 | 0 (0.0%) | 0 (0.0%) |
| $25,000 to $34,999 | 4 (2.0%) | 22 (25.9%) |
| $35,000 to $49,999 | 10 (5.1%) | 0 (0.0%) |
| $50,000 to $74,999 | 59 (29.9%) | 16 (18.8%) |
| $75,000 to $99,999 | 49 (24.9%) | 13 (15.3%) |
| $100,000 to $149,999 | 25 (12.7%) | 9 (10.6%) |
| $150,000 or more | 14 (7.1%) | 0 (0.0%) |
| Total | 197 (100.0%) | 85 (100.0%) |
Monthly Housing Cost Tiers in Pikeville
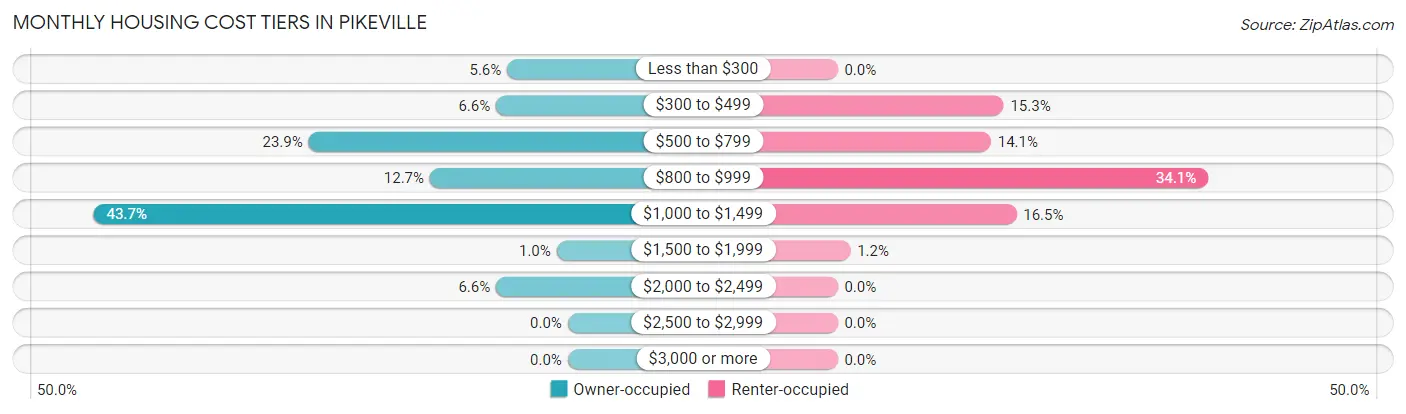
| Monthly Cost | Owner-occupied | Renter-occupied |
| Less than $300 | 11 (5.6%) | 0 (0.0%) |
| $300 to $499 | 13 (6.6%) | 13 (15.3%) |
| $500 to $799 | 47 (23.9%) | 12 (14.1%) |
| $800 to $999 | 25 (12.7%) | 29 (34.1%) |
| $1,000 to $1,499 | 86 (43.6%) | 14 (16.5%) |
| $1,500 to $1,999 | 2 (1.0%) | 1 (1.2%) |
| $2,000 to $2,499 | 13 (6.6%) | 0 (0.0%) |
| $2,500 to $2,999 | 0 (0.0%) | 0 (0.0%) |
| $3,000 or more | 0 (0.0%) | 0 (0.0%) |
| Total | 197 (100.0%) | 85 (100.0%) |
Physical Housing Characteristics in Pikeville
Housing Structures in Pikeville
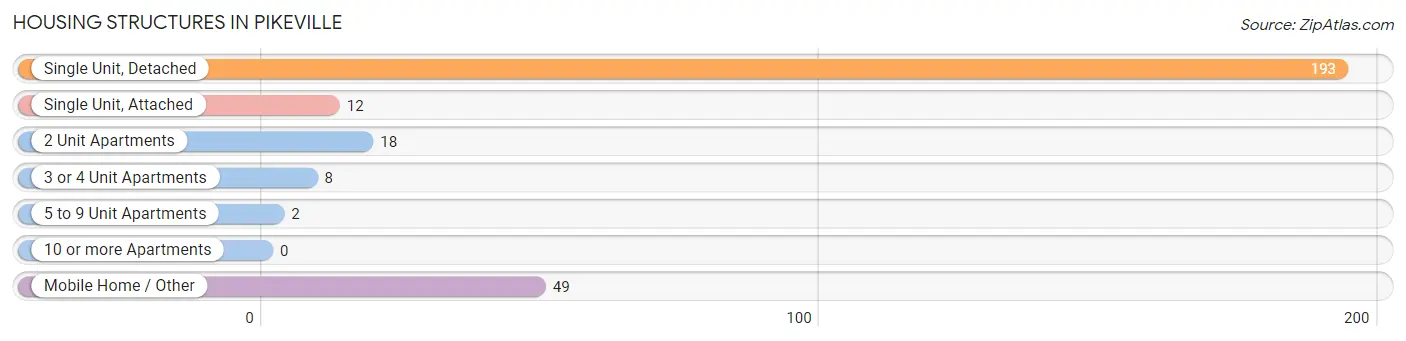
| Structure Type | # Housing Units | % Housing Units |
| Single Unit, Detached | 193 | 68.4% |
| Single Unit, Attached | 12 | 4.3% |
| 2 Unit Apartments | 18 | 6.4% |
| 3 or 4 Unit Apartments | 8 | 2.8% |
| 5 to 9 Unit Apartments | 2 | 0.7% |
| 10 or more Apartments | 0 | 0.0% |
| Mobile Home / Other | 49 | 17.4% |
| Total | 282 | 100.0% |
Housing Structures by Occupancy in Pikeville
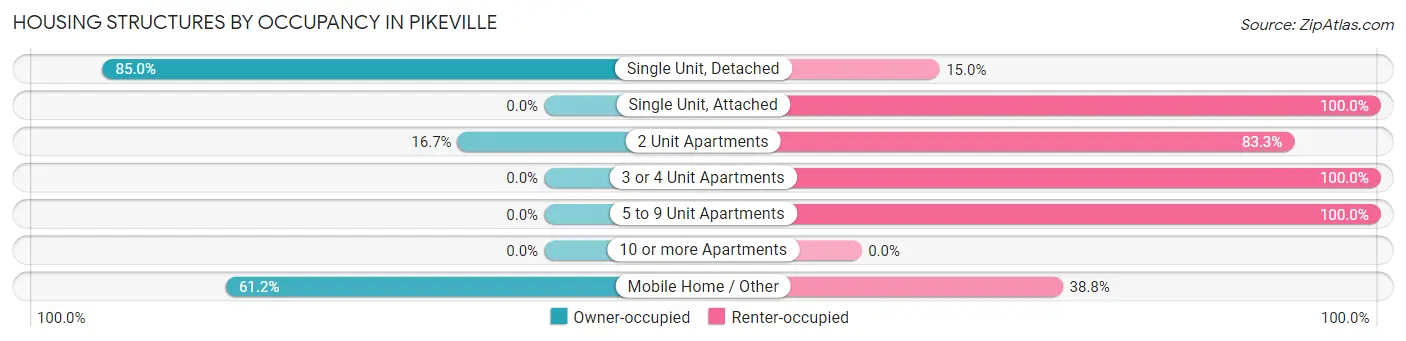
| Structure Type | Owner-occupied | Renter-occupied |
| Single Unit, Detached | 164 (85.0%) | 29 (15.0%) |
| Single Unit, Attached | 0 (0.0%) | 12 (100.0%) |
| 2 Unit Apartments | 3 (16.7%) | 15 (83.3%) |
| 3 or 4 Unit Apartments | 0 (0.0%) | 8 (100.0%) |
| 5 to 9 Unit Apartments | 0 (0.0%) | 2 (100.0%) |
| 10 or more Apartments | 0 (0.0%) | 0 (0.0%) |
| Mobile Home / Other | 30 (61.2%) | 19 (38.8%) |
| Total | 197 (69.9%) | 85 (30.1%) |
Housing Structures by Number of Rooms in Pikeville
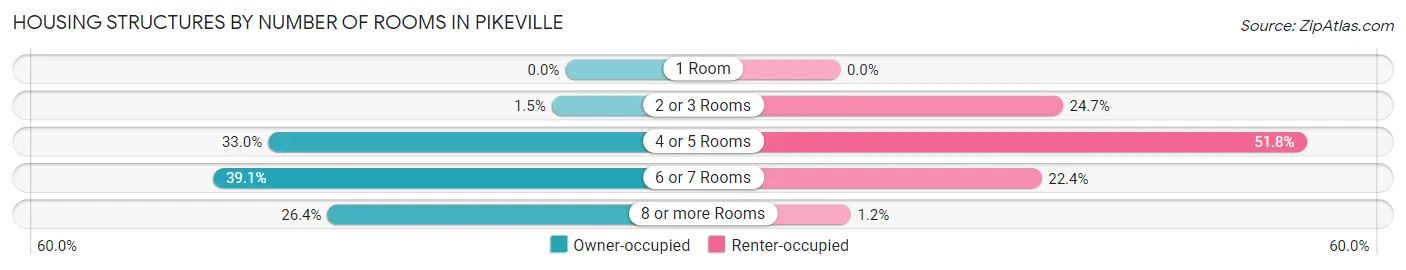
| Number of Rooms | Owner-occupied | Renter-occupied |
| 1 Room | 0 (0.0%) | 0 (0.0%) |
| 2 or 3 Rooms | 3 (1.5%) | 21 (24.7%) |
| 4 or 5 Rooms | 65 (33.0%) | 44 (51.8%) |
| 6 or 7 Rooms | 77 (39.1%) | 19 (22.4%) |
| 8 or more Rooms | 52 (26.4%) | 1 (1.2%) |
| Total | 197 (100.0%) | 85 (100.0%) |
Housing Structure by Heating Type in Pikeville
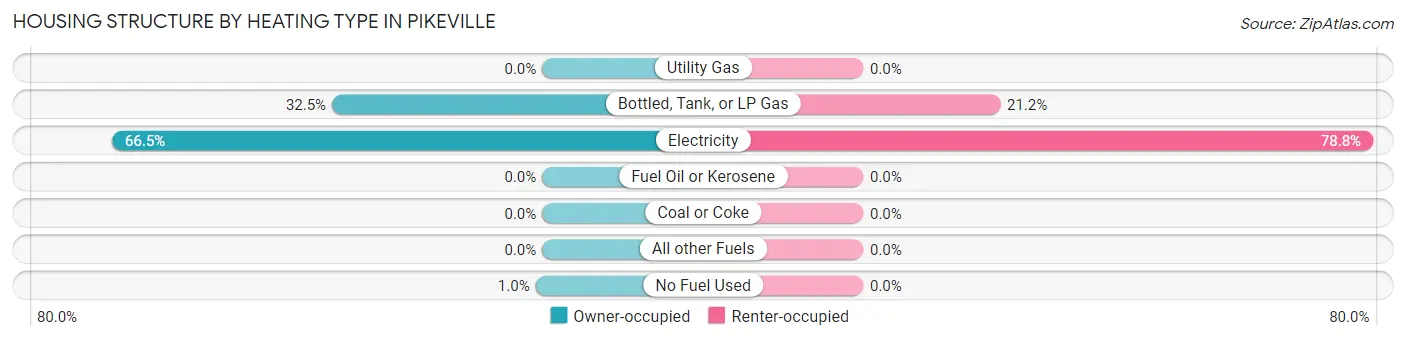
| Heating Type | Owner-occupied | Renter-occupied |
| Utility Gas | 0 (0.0%) | 0 (0.0%) |
| Bottled, Tank, or LP Gas | 64 (32.5%) | 18 (21.2%) |
| Electricity | 131 (66.5%) | 67 (78.8%) |
| Fuel Oil or Kerosene | 0 (0.0%) | 0 (0.0%) |
| Coal or Coke | 0 (0.0%) | 0 (0.0%) |
| All other Fuels | 0 (0.0%) | 0 (0.0%) |
| No Fuel Used | 2 (1.0%) | 0 (0.0%) |
| Total | 197 (100.0%) | 85 (100.0%) |
Household Vehicle Usage in Pikeville
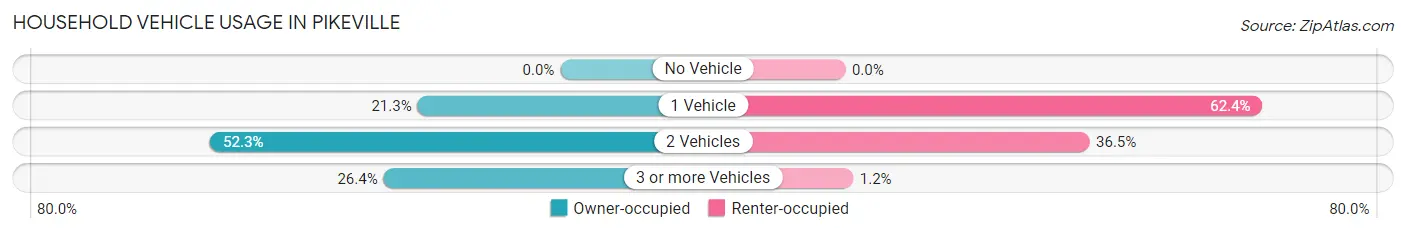
| Vehicles per Household | Owner-occupied | Renter-occupied |
| No Vehicle | 0 (0.0%) | 0 (0.0%) |
| 1 Vehicle | 42 (21.3%) | 53 (62.4%) |
| 2 Vehicles | 103 (52.3%) | 31 (36.5%) |
| 3 or more Vehicles | 52 (26.4%) | 1 (1.2%) |
| Total | 197 (100.0%) | 85 (100.0%) |
Real Estate & Mortgages in Pikeville
Real Estate and Mortgage Overview in Pikeville
| Characteristic | Without Mortgage | With Mortgage |
| Housing Units | 65 | 132 |
| Median Property Value | - | - |
| Median Household Income | $38,625 | $11 |
| Monthly Housing Costs | $553 | $0 |
| Real Estate Taxes | - | - |
Property Value by Mortgage Status in Pikeville
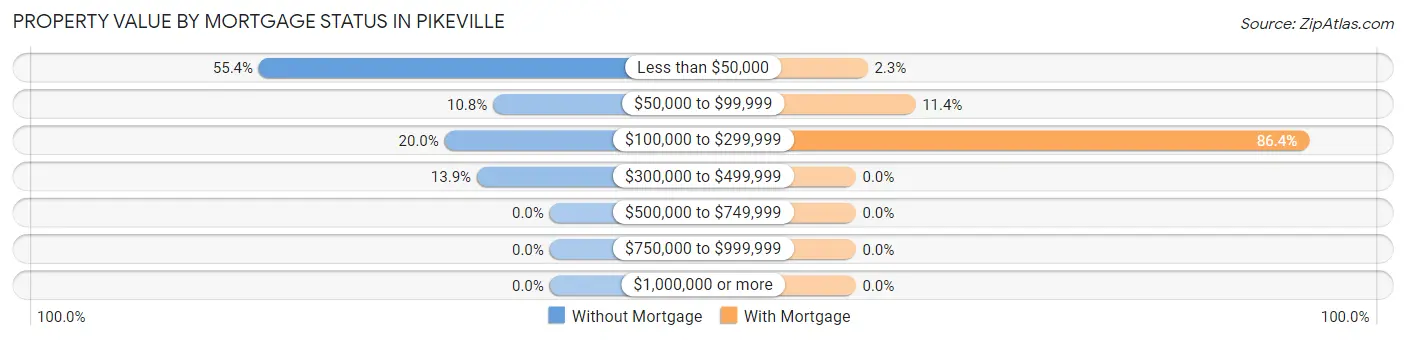
| Property Value | Without Mortgage | With Mortgage |
| Less than $50,000 | 36 (55.4%) | 3 (2.3%) |
| $50,000 to $99,999 | 7 (10.8%) | 15 (11.4%) |
| $100,000 to $299,999 | 13 (20.0%) | 114 (86.4%) |
| $300,000 to $499,999 | 9 (13.9%) | 0 (0.0%) |
| $500,000 to $749,999 | 0 (0.0%) | 0 (0.0%) |
| $750,000 to $999,999 | 0 (0.0%) | 0 (0.0%) |
| $1,000,000 or more | 0 (0.0%) | 0 (0.0%) |
| Total | 65 (100.0%) | 132 (100.0%) |
Household Income by Mortgage Status in Pikeville
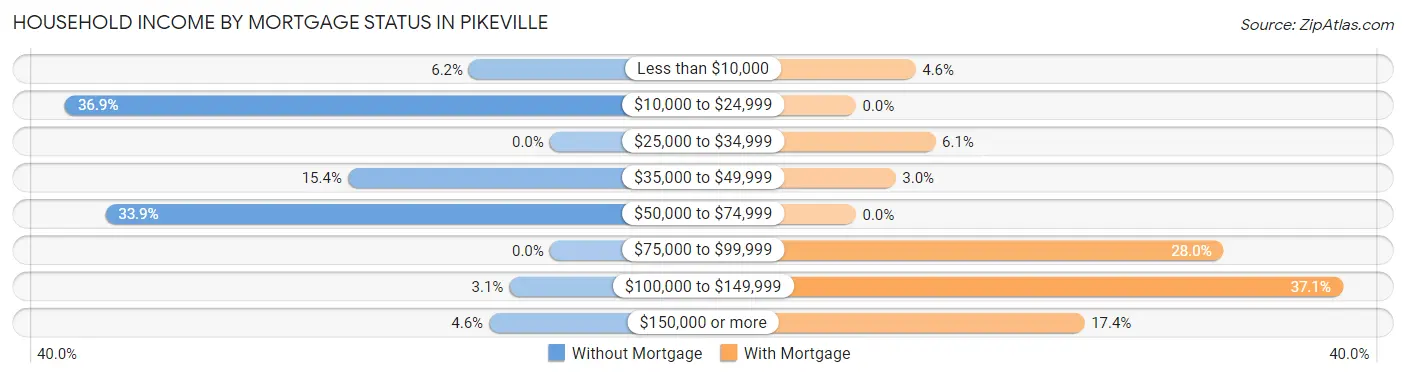
| Household Income | Without Mortgage | With Mortgage |
| Less than $10,000 | 4 (6.1%) | 6 (4.5%) |
| $10,000 to $24,999 | 24 (36.9%) | 0 (0.0%) |
| $25,000 to $34,999 | 0 (0.0%) | 8 (6.1%) |
| $35,000 to $49,999 | 10 (15.4%) | 4 (3.0%) |
| $50,000 to $74,999 | 22 (33.9%) | 0 (0.0%) |
| $75,000 to $99,999 | 0 (0.0%) | 37 (28.0%) |
| $100,000 to $149,999 | 2 (3.1%) | 49 (37.1%) |
| $150,000 or more | 3 (4.6%) | 23 (17.4%) |
| Total | 65 (100.0%) | 132 (100.0%) |
Property Value to Household Income Ratio in Pikeville
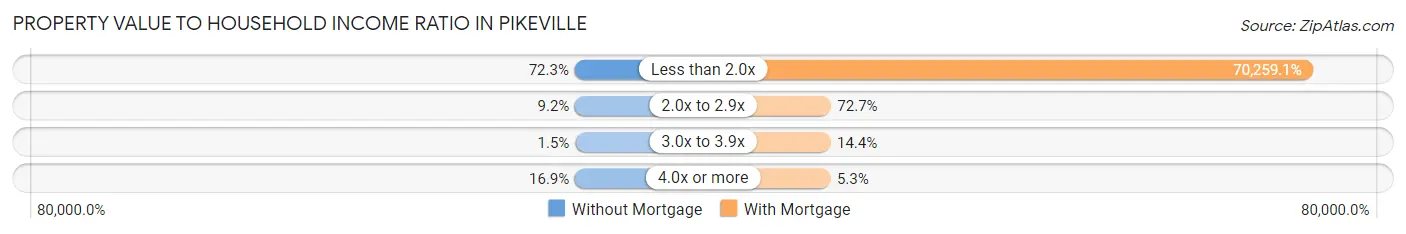
| Value-to-Income Ratio | Without Mortgage | With Mortgage |
| Less than 2.0x | 47 (72.3%) | 92,742 (70,259.1%) |
| 2.0x to 2.9x | 6 (9.2%) | 96 (72.7%) |
| 3.0x to 3.9x | 1 (1.5%) | 19 (14.4%) |
| 4.0x or more | 11 (16.9%) | 7 (5.3%) |
| Total | 65 (100.0%) | 132 (100.0%) |
Real Estate Taxes by Mortgage Status in Pikeville
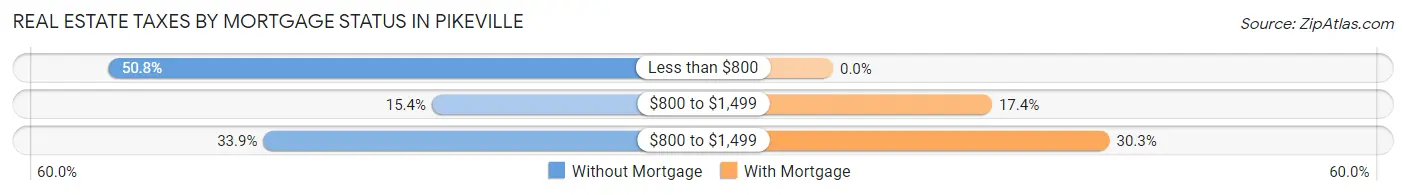
| Property Taxes | Without Mortgage | With Mortgage |
| Less than $800 | 33 (50.8%) | 0 (0.0%) |
| $800 to $1,499 | 10 (15.4%) | 23 (17.4%) |
| $800 to $1,499 | 22 (33.9%) | 40 (30.3%) |
| Total | 65 (100.0%) | 132 (100.0%) |
Health & Disability in Pikeville
Health Insurance Coverage by Age in Pikeville
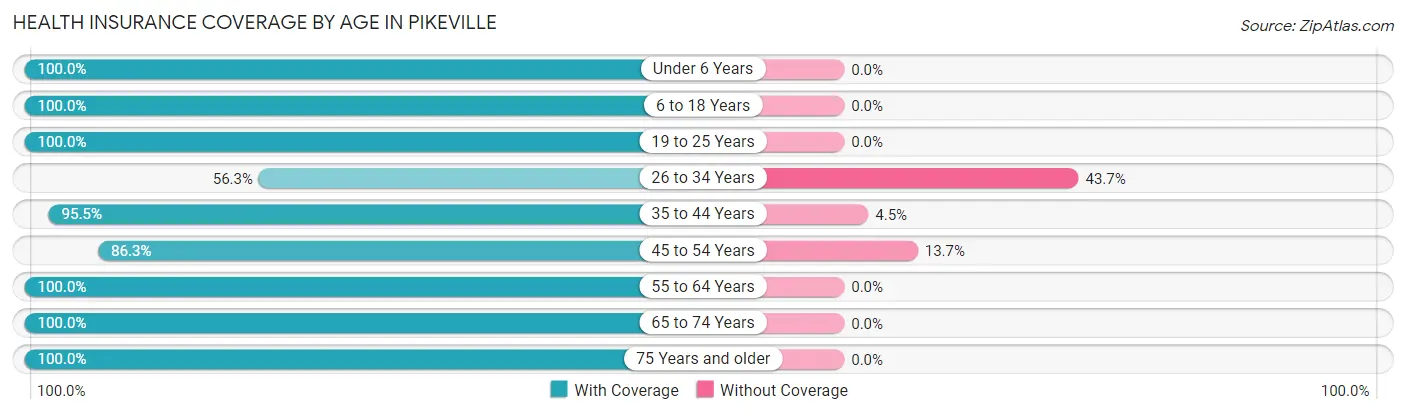
| Age Bracket | With Coverage | Without Coverage |
| Under 6 Years | 41 (100.0%) | 0 (0.0%) |
| 6 to 18 Years | 103 (100.0%) | 0 (0.0%) |
| 19 to 25 Years | 83 (100.0%) | 0 (0.0%) |
| 26 to 34 Years | 49 (56.3%) | 38 (43.7%) |
| 35 to 44 Years | 64 (95.5%) | 3 (4.5%) |
| 45 to 54 Years | 126 (86.3%) | 20 (13.7%) |
| 55 to 64 Years | 65 (100.0%) | 0 (0.0%) |
| 65 to 74 Years | 44 (100.0%) | 0 (0.0%) |
| 75 Years and older | 34 (100.0%) | 0 (0.0%) |
| Total | 609 (90.9%) | 61 (9.1%) |
Health Insurance Coverage by Citizenship Status in Pikeville
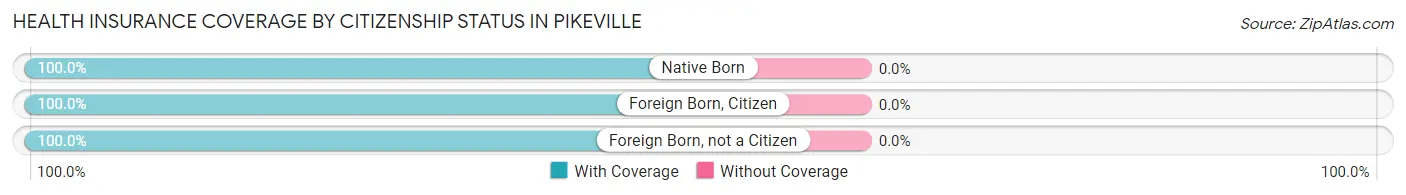
| Citizenship Status | With Coverage | Without Coverage |
| Native Born | 41 (100.0%) | 0 (0.0%) |
| Foreign Born, Citizen | 103 (100.0%) | 0 (0.0%) |
| Foreign Born, not a Citizen | 83 (100.0%) | 0 (0.0%) |
Health Insurance Coverage by Household Income in Pikeville
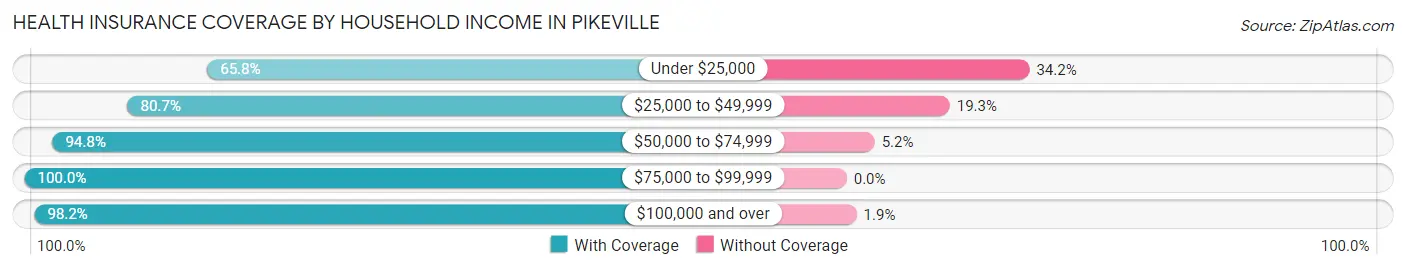
| Household Income | With Coverage | Without Coverage |
| Under $25,000 | 73 (65.8%) | 38 (34.2%) |
| $25,000 to $49,999 | 46 (80.7%) | 11 (19.3%) |
| $50,000 to $74,999 | 163 (94.8%) | 9 (5.2%) |
| $75,000 to $99,999 | 168 (100.0%) | 0 (0.0%) |
| $100,000 and over | 159 (98.2%) | 3 (1.8%) |
Public vs Private Health Insurance Coverage by Age in Pikeville
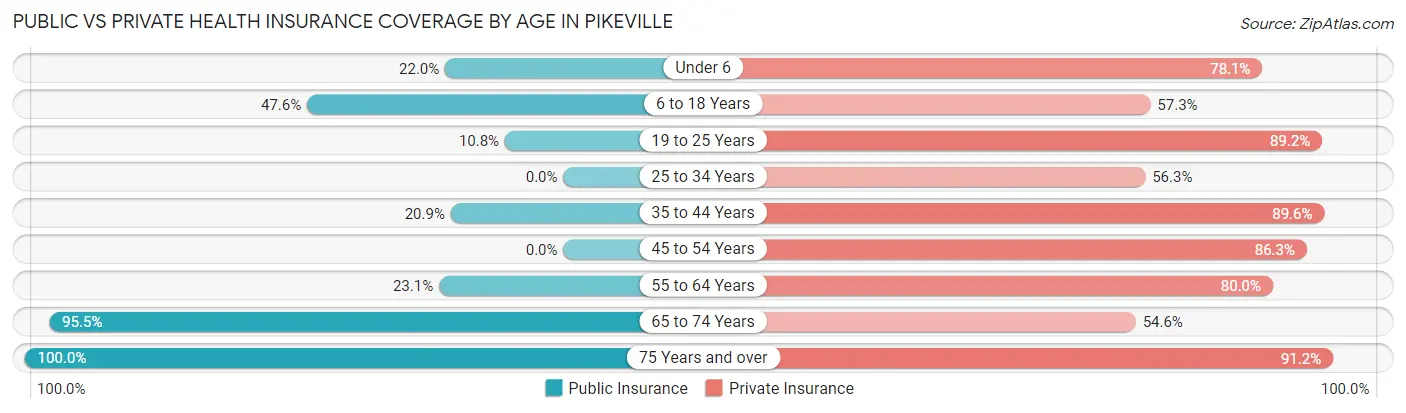
| Age Bracket | Public Insurance | Private Insurance |
| Under 6 | 9 (22.0%) | 32 (78.0%) |
| 6 to 18 Years | 49 (47.6%) | 59 (57.3%) |
| 19 to 25 Years | 9 (10.8%) | 74 (89.2%) |
| 25 to 34 Years | 0 (0.0%) | 49 (56.3%) |
| 35 to 44 Years | 14 (20.9%) | 60 (89.5%) |
| 45 to 54 Years | 0 (0.0%) | 126 (86.3%) |
| 55 to 64 Years | 15 (23.1%) | 52 (80.0%) |
| 65 to 74 Years | 42 (95.5%) | 24 (54.5%) |
| 75 Years and over | 34 (100.0%) | 31 (91.2%) |
| Total | 172 (25.7%) | 507 (75.7%) |
Disability Status by Sex by Age in Pikeville
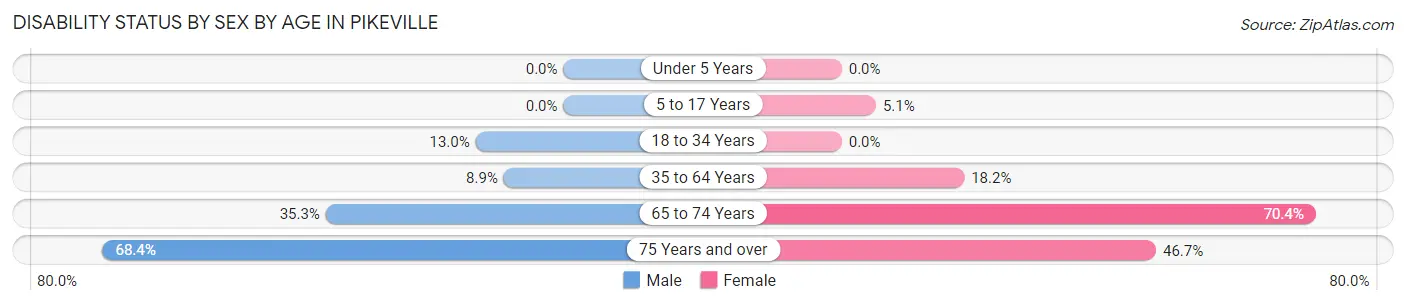
| Age Bracket | Male | Female |
| Under 5 Years | 0 (0.0%) | 0 (0.0%) |
| 5 to 17 Years | 0 (0.0%) | 3 (5.1%) |
| 18 to 34 Years | 18 (13.0%) | 0 (0.0%) |
| 35 to 64 Years | 10 (8.8%) | 30 (18.2%) |
| 65 to 74 Years | 6 (35.3%) | 19 (70.4%) |
| 75 Years and over | 13 (68.4%) | 7 (46.7%) |
Disability Class by Sex by Age in Pikeville
Disability Class: Hearing Difficulty
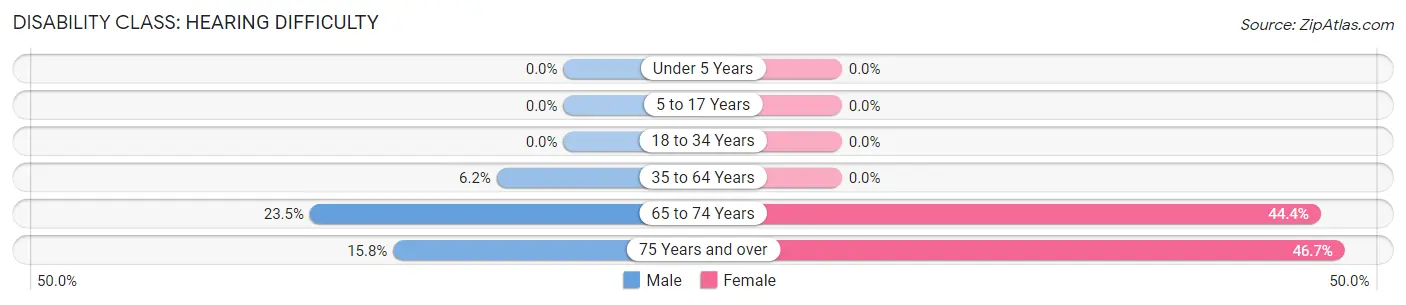
| Age Bracket | Male | Female |
| Under 5 Years | 0 (0.0%) | 0 (0.0%) |
| 5 to 17 Years | 0 (0.0%) | 0 (0.0%) |
| 18 to 34 Years | 0 (0.0%) | 0 (0.0%) |
| 35 to 64 Years | 7 (6.2%) | 0 (0.0%) |
| 65 to 74 Years | 4 (23.5%) | 12 (44.4%) |
| 75 Years and over | 3 (15.8%) | 7 (46.7%) |
Disability Class: Vision Difficulty
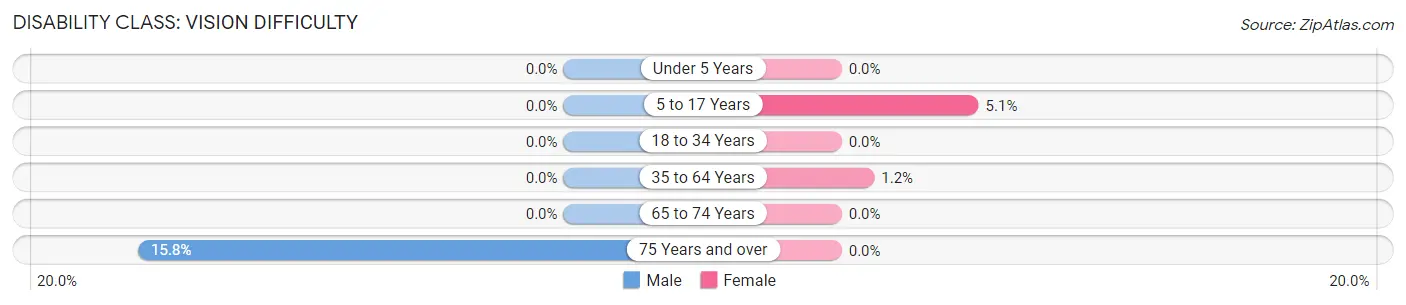
| Age Bracket | Male | Female |
| Under 5 Years | 0 (0.0%) | 0 (0.0%) |
| 5 to 17 Years | 0 (0.0%) | 3 (5.1%) |
| 18 to 34 Years | 0 (0.0%) | 0 (0.0%) |
| 35 to 64 Years | 0 (0.0%) | 2 (1.2%) |
| 65 to 74 Years | 0 (0.0%) | 0 (0.0%) |
| 75 Years and over | 3 (15.8%) | 0 (0.0%) |
Disability Class: Cognitive Difficulty
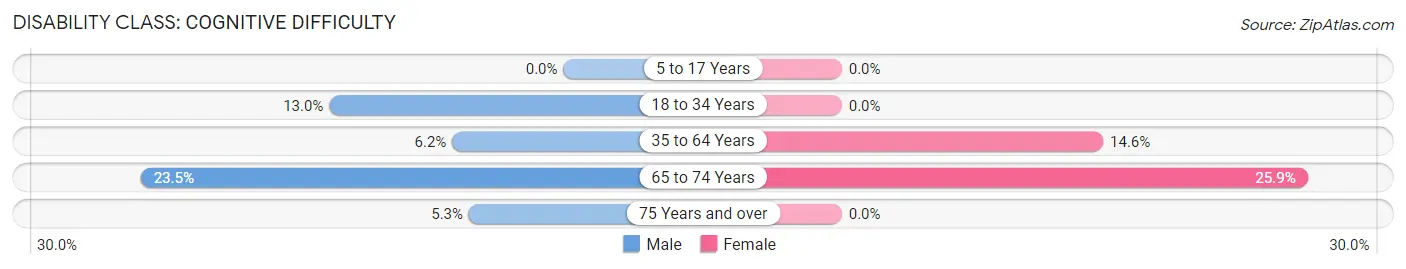
| Age Bracket | Male | Female |
| 5 to 17 Years | 0 (0.0%) | 0 (0.0%) |
| 18 to 34 Years | 18 (13.0%) | 0 (0.0%) |
| 35 to 64 Years | 7 (6.2%) | 24 (14.5%) |
| 65 to 74 Years | 4 (23.5%) | 7 (25.9%) |
| 75 Years and over | 1 (5.3%) | 0 (0.0%) |
Disability Class: Ambulatory Difficulty
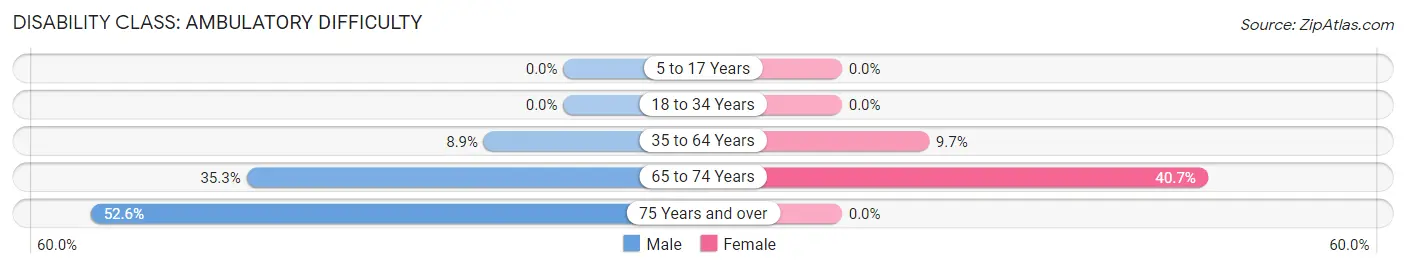
| Age Bracket | Male | Female |
| 5 to 17 Years | 0 (0.0%) | 0 (0.0%) |
| 18 to 34 Years | 0 (0.0%) | 0 (0.0%) |
| 35 to 64 Years | 10 (8.8%) | 16 (9.7%) |
| 65 to 74 Years | 6 (35.3%) | 11 (40.7%) |
| 75 Years and over | 10 (52.6%) | 0 (0.0%) |
Disability Class: Self-Care Difficulty
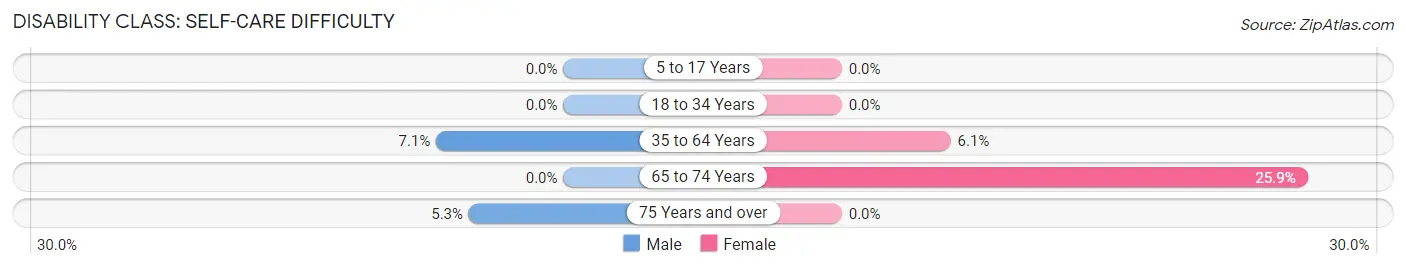
| Age Bracket | Male | Female |
| 5 to 17 Years | 0 (0.0%) | 0 (0.0%) |
| 18 to 34 Years | 0 (0.0%) | 0 (0.0%) |
| 35 to 64 Years | 8 (7.1%) | 10 (6.1%) |
| 65 to 74 Years | 0 (0.0%) | 7 (25.9%) |
| 75 Years and over | 1 (5.3%) | 0 (0.0%) |
Technology Access in Pikeville
Computing Device Access in Pikeville
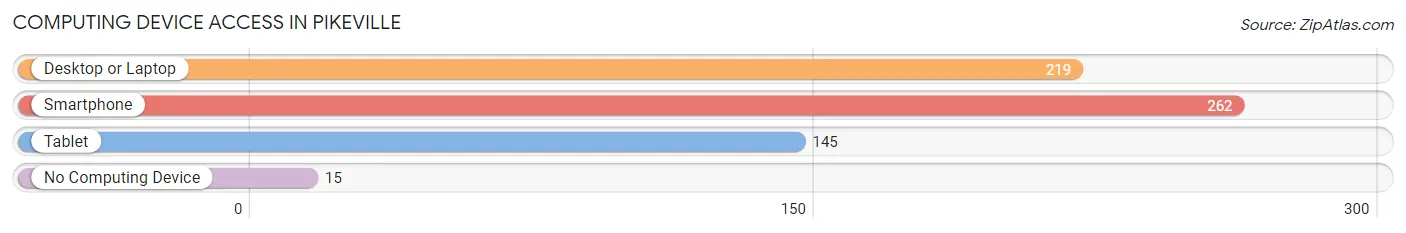
| Device Type | # Households | % Households |
| Desktop or Laptop | 219 | 77.7% |
| Smartphone | 262 | 92.9% |
| Tablet | 145 | 51.4% |
| No Computing Device | 15 | 5.3% |
| Total | 282 | 100.0% |
Internet Access in Pikeville
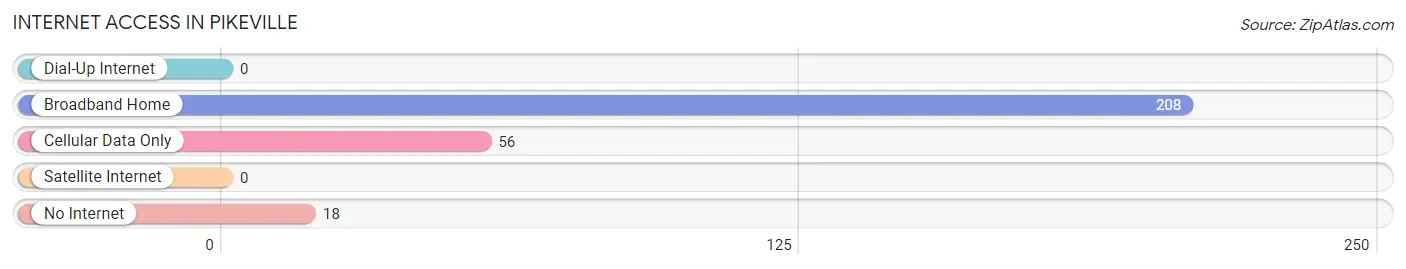
| Internet Type | # Households | % Households |
| Dial-Up Internet | 0 | 0.0% |
| Broadband Home | 208 | 73.8% |
| Cellular Data Only | 56 | 19.9% |
| Satellite Internet | 0 | 0.0% |
| No Internet | 18 | 6.4% |
| Total | 282 | 100.0% |
Pikeville Summary
Pikeville is a small town located in Wayne County, North Carolina. It is situated in the eastern part of the state, about 25 miles east of Goldsboro and about 50 miles south of Raleigh. The town was founded in 1820 and has a population of approximately 1,500 people.
Geography
Pikeville is located in the Coastal Plain region of North Carolina. The town is situated on the Neuse River, which is a major tributary of the Pamlico Sound. The town is surrounded by rolling hills and is located in a rural area. The town is located in the Neuse River Basin, which is a major source of water for the region. The town is also located near the Neuse River State Park, which is a popular destination for outdoor activities.
Climate
Pikeville has a humid subtropical climate, with hot and humid summers and mild winters. The average temperature in the summer is around 80 degrees Fahrenheit, while the average temperature in the winter is around 50 degrees Fahrenheit. The town receives an average of 48 inches of rain per year, with most of the precipitation occurring in the summer months.
Demographics
As of the 2010 census, Pikeville had a population of 1,521 people. The racial makeup of the town was 79.3% White, 17.2% African American, 0.3% Native American, 0.7% Asian, 0.1% Pacific Islander, and 2.4% from other races. The median household income was $30,938, and the median family income was $37,813.
Economy
Pikeville’s economy is largely based on agriculture and manufacturing. The town is home to several small businesses, including a lumber mill, a furniture factory, and a poultry processing plant. The town is also home to several farms, which produce a variety of crops, including corn, soybeans, and tobacco.
History
Pikeville was founded in 1820 by a group of settlers from Virginia. The town was named after General Zebulon Pike, who was a Revolutionary War hero. The town was originally a farming community, but it soon became a center for manufacturing and industry. In the late 19th century, the town was home to several factories, including a cotton mill, a furniture factory, and a lumber mill.
In the early 20th century, the town experienced a period of growth and prosperity. The town was home to several banks, stores, and other businesses. However, the Great Depression of the 1930s caused a decline in the town’s economy. The town experienced a resurgence in the 1950s and 1960s, when several new businesses opened in the area.
Today, Pikeville is a small, rural town with a population of approximately 1,500 people. The town is home to several small businesses, including a lumber mill, a furniture factory, and a poultry processing plant. The town is also home to several farms, which produce a variety of crops, including corn, soybeans, and tobacco.
Common Questions
What is Per Capita Income in Pikeville?
Per Capita income in Pikeville is $28,298.
What is the Median Family Income in Pikeville?
Median Family Income in Pikeville is $72,604.
What is the Median Household income in Pikeville?
Median Household Income in Pikeville is $65,417.
What is Income or Wage Gap in Pikeville?
Income or Wage Gap in Pikeville is 27.1%.
Women in Pikeville earn 72.9 cents for every dollar earned by a man.
What is Inequality or Gini Index in Pikeville?
Inequality or Gini Index in Pikeville is 0.35.
What is the Total Population of Pikeville?
Total Population of Pikeville is 679.
What is the Total Male Population of Pikeville?
Total Male Population of Pikeville is 351.
What is the Total Female Population of Pikeville?
Total Female Population of Pikeville is 328.
What is the Ratio of Males per 100 Females in Pikeville?
There are 107.01 Males per 100 Females in Pikeville.
What is the Ratio of Females per 100 Males in Pikeville?
There are 93.45 Females per 100 Males in Pikeville.
What is the Median Population Age in Pikeville?
Median Population Age in Pikeville is 39.0 Years.
What is the Average Family Size in Pikeville
Average Family Size in Pikeville is 2.7 People.
What is the Average Household Size in Pikeville
Average Household Size in Pikeville is 2.4 People.
How Large is the Labor Force in Pikeville?
There are 410 People in the Labor Forcein in Pikeville.
What is the Percentage of People in the Labor Force in Pikeville?
75.4% of People are in the Labor Force in Pikeville.