Stonewall, NC Map & Demographics
Stonewall Map
Stonewall Overview
$37,921
PER CAPITA INCOME
63.8%
WAGE / INCOME GAP [ % ]
36.2¢/ $1
WAGE / INCOME GAP [ $ ]
0.54
INEQUALITY / GINI INDEX
229
TOTAL POPULATION
127
MALE POPULATION
102
FEMALE POPULATION
124.51
MALES / 100 FEMALES
80.31
FEMALES / 100 MALES
49.9
MEDIAN AGE
2.5
AVG FAMILY SIZE
1.6
AVG HOUSEHOLD SIZE
123
LABOR FORCE [ PEOPLE ]
58.3%
PERCENT IN LABOR FORCE
40.7%
UNEMPLOYMENT RATE
Stonewall Area Codes
Income in Stonewall
Income Overview in Stonewall
| Characteristic | Number | Measure |
| Per Capita Income | 229 | $37,921 |
| Median Family Income | 50 | $0 |
| Mean Family Income | 50 | $128,972 |
| Median Household Income | 142 | $0 |
| Mean Household Income | 142 | $63,501 |
| Income Deficit | 50 | $0 |
| Wage / Income Gap (%) | 229 | 63.80% |
| Wage / Income Gap ($) | 229 | 36.20¢ per $1 |
| Gini / Inequality Index | 229 | 0.54 |
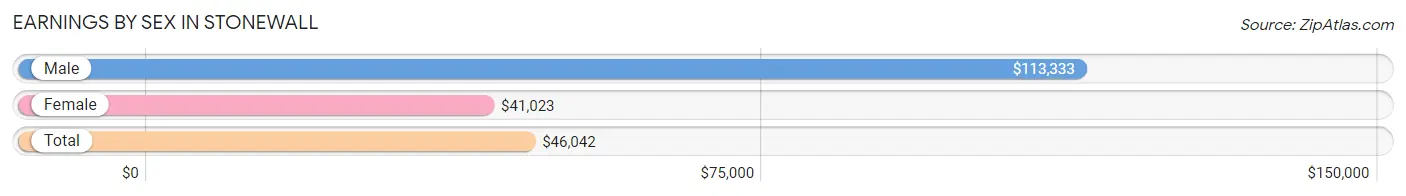
Earnings by Sex in Stonewall
Average Earnings in Stonewall are $46,042, $113,333 for men and $41,023 for women, a difference of 63.8%.
| Sex | Number | Average Earnings |
| Male | 26 (33.8%) | $113,333 |
| Female | 51 (66.2%) | $41,023 |
| Total | 77 (100.0%) | $46,042 |
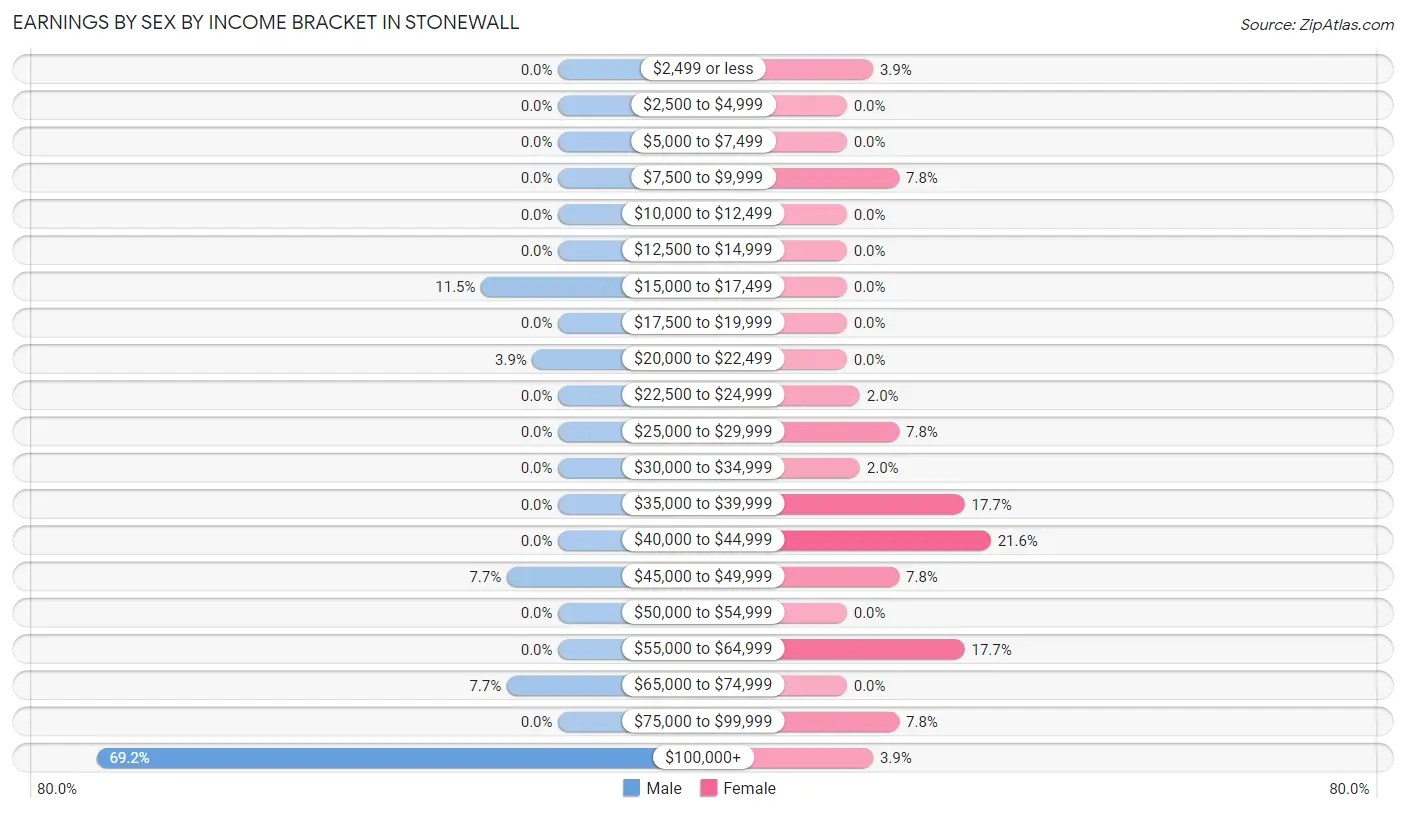
Earnings by Sex by Income Bracket in Stonewall
The most common earnings brackets in Stonewall are $100,000+ for men (18 | 69.2%) and $40,000 to $44,999 for women (11 | 21.6%).
| Income | Male | Female |
| $2,499 or less | 0 (0.0%) | 2 (3.9%) |
| $2,500 to $4,999 | 0 (0.0%) | 0 (0.0%) |
| $5,000 to $7,499 | 0 (0.0%) | 0 (0.0%) |
| $7,500 to $9,999 | 0 (0.0%) | 4 (7.8%) |
| $10,000 to $12,499 | 0 (0.0%) | 0 (0.0%) |
| $12,500 to $14,999 | 0 (0.0%) | 0 (0.0%) |
| $15,000 to $17,499 | 3 (11.5%) | 0 (0.0%) |
| $17,500 to $19,999 | 0 (0.0%) | 0 (0.0%) |
| $20,000 to $22,499 | 1 (3.8%) | 0 (0.0%) |
| $22,500 to $24,999 | 0 (0.0%) | 1 (2.0%) |
| $25,000 to $29,999 | 0 (0.0%) | 4 (7.8%) |
| $30,000 to $34,999 | 0 (0.0%) | 1 (2.0%) |
| $35,000 to $39,999 | 0 (0.0%) | 9 (17.6%) |
| $40,000 to $44,999 | 0 (0.0%) | 11 (21.6%) |
| $45,000 to $49,999 | 2 (7.7%) | 4 (7.8%) |
| $50,000 to $54,999 | 0 (0.0%) | 0 (0.0%) |
| $55,000 to $64,999 | 0 (0.0%) | 9 (17.6%) |
| $65,000 to $74,999 | 2 (7.7%) | 0 (0.0%) |
| $75,000 to $99,999 | 0 (0.0%) | 4 (7.8%) |
| $100,000+ | 18 (69.2%) | 2 (3.9%) |
| Total | 26 (100.0%) | 51 (100.0%) |
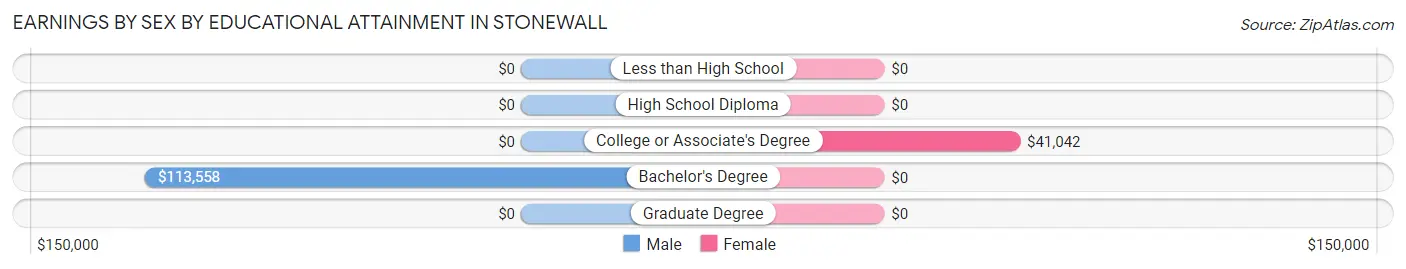
Earnings by Sex by Educational Attainment in Stonewall
Average earnings in Stonewall are $113,333 for men and $41,477 for women, a difference of 63.4%. Men with an educational attainment of bachelor's degree enjoy the highest average annual earnings of $113,558, while those with bachelor's degree education earn the least with $113,558. Women with an educational attainment of college or associate's degree earn the most with the average annual earnings of $41,042, while those with college or associate's degree education have the smallest earnings of $41,042.
| Educational Attainment | Male Income | Female Income |
| Less than High School | - | - |
| High School Diploma | - | - |
| College or Associate's Degree | - | - |
| Bachelor's Degree | $113,558 | $0 |
| Graduate Degree | - | - |
| Total | $113,333 | $41,477 |
Family Income in Stonewall
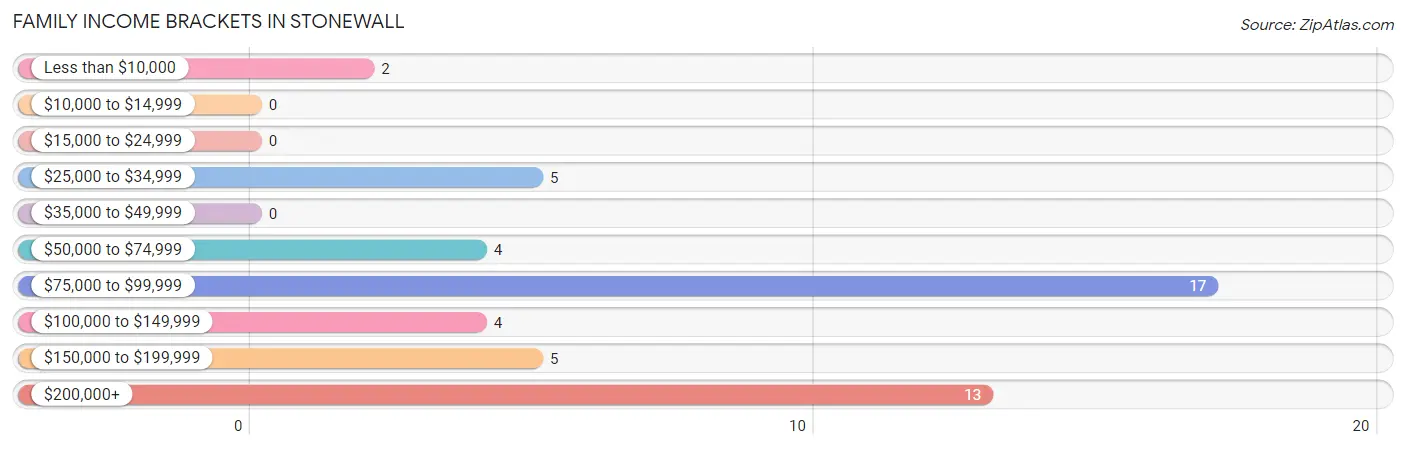
Family Income Brackets in Stonewall
According to the Stonewall family income data, there are 17 families falling into the $75,000 to $99,999 income range, which is the most common income bracket and makes up 34.0% of all families.
| Income Bracket | # Families | % Families |
| Less than $10,000 | 2 | 4.0% |
| $10,000 to $14,999 | 0 | 0.0% |
| $15,000 to $24,999 | 0 | 0.0% |
| $25,000 to $34,999 | 5 | 10.0% |
| $35,000 to $49,999 | 0 | 0.0% |
| $50,000 to $74,999 | 4 | 8.0% |
| $75,000 to $99,999 | 17 | 34.0% |
| $100,000 to $149,999 | 4 | 8.0% |
| $150,000 to $199,999 | 5 | 10.0% |
| $200,000+ | 13 | 26.0% |
Family Income by Famaliy Size in Stonewall
| Income Bracket | # Families | Median Income |
| 2-Person Families | 36 (72.0%) | $0 |
| 3-Person Families | 10 (20.0%) | $0 |
| 4-Person Families | 2 (4.0%) | $0 |
| 5-Person Families | 2 (4.0%) | $0 |
| 6-Person Families | 0 (0.0%) | $0 |
| 7+ Person Families | 0 (0.0%) | $0 |
| Total | 50 (100.0%) | $0 |
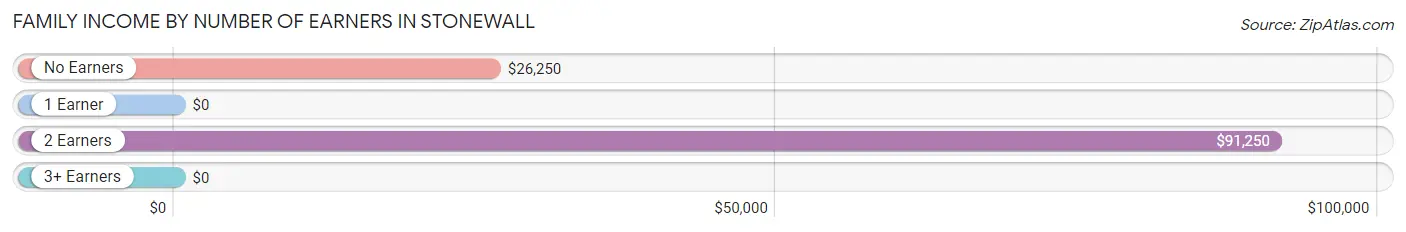
Family Income by Number of Earners in Stonewall
| Number of Earners | # Families | Median Income |
| No Earners | 9 (18.0%) | $26,250 |
| 1 Earner | 24 (48.0%) | $0 |
| 2 Earners | 15 (30.0%) | $91,250 |
| 3+ Earners | 2 (4.0%) | $0 |
| Total | 50 (100.0%) | $0 |
Household Income in Stonewall
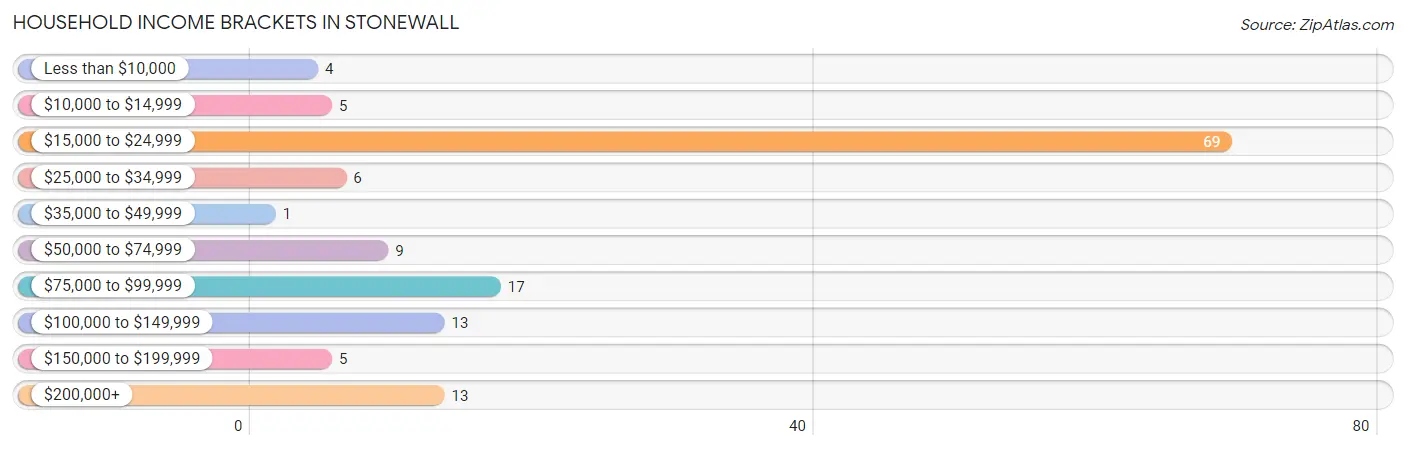
Household Income Brackets in Stonewall
With 69 households falling in the category, the $15,000 to $24,999 income range is the most frequent in Stonewall, accounting for 48.6% of all households. In contrast, only 1 households (0.7%) fall into the $35,000 to $49,999 income bracket, making it the least populous group.
| Income Bracket | # Households | % Households |
| Less than $10,000 | 4 | 2.8% |
| $10,000 to $14,999 | 5 | 3.5% |
| $15,000 to $24,999 | 69 | 48.6% |
| $25,000 to $34,999 | 6 | 4.2% |
| $35,000 to $49,999 | 1 | 0.7% |
| $50,000 to $74,999 | 9 | 6.3% |
| $75,000 to $99,999 | 17 | 12.0% |
| $100,000 to $149,999 | 13 | 9.2% |
| $150,000 to $199,999 | 5 | 3.5% |
| $200,000+ | 13 | 9.2% |
Household Income by Householder Age in Stonewall
The median household income in Stonewall is $0, with the highest median household income of $146,250 found in the 25 to 44 years age bracket for the primary householder. A total of 6 households (4.2%) fall into this category. Meanwhile, the 15 to 24 years age bracket for the primary householder has the lowest median household income of $0, with 1 households (0.7%) in this group.
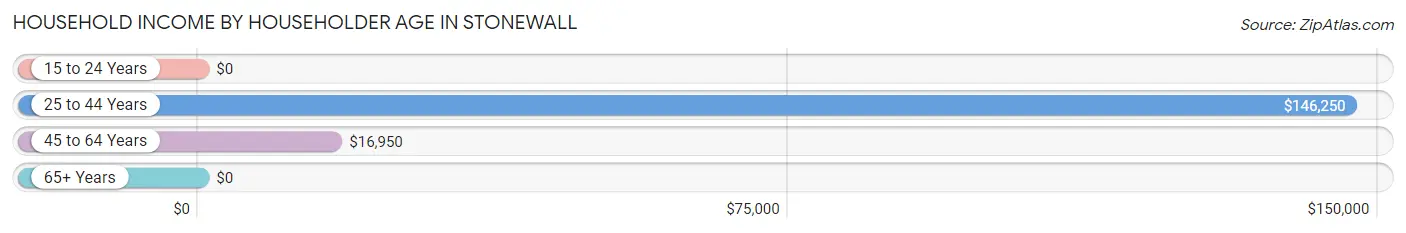
| Income Bracket | # Households | Median Income |
| 15 to 24 Years | 1 (0.7%) | $0 |
| 25 to 44 Years | 6 (4.2%) | $146,250 |
| 45 to 64 Years | 86 (60.6%) | $16,950 |
| 65+ Years | 49 (34.5%) | $0 |
| Total | 142 (100.0%) | $0 |
Poverty in Stonewall
Income Below Poverty by Sex and Age in Stonewall
With 13.4% poverty level for males and 3.9% for females among the residents of Stonewall, 16 and 17 year old males and 35 to 44 year old females are the most vulnerable to poverty, with 6 males (100.0%) and 2 females (50.0%) in their respective age groups living below the poverty level.
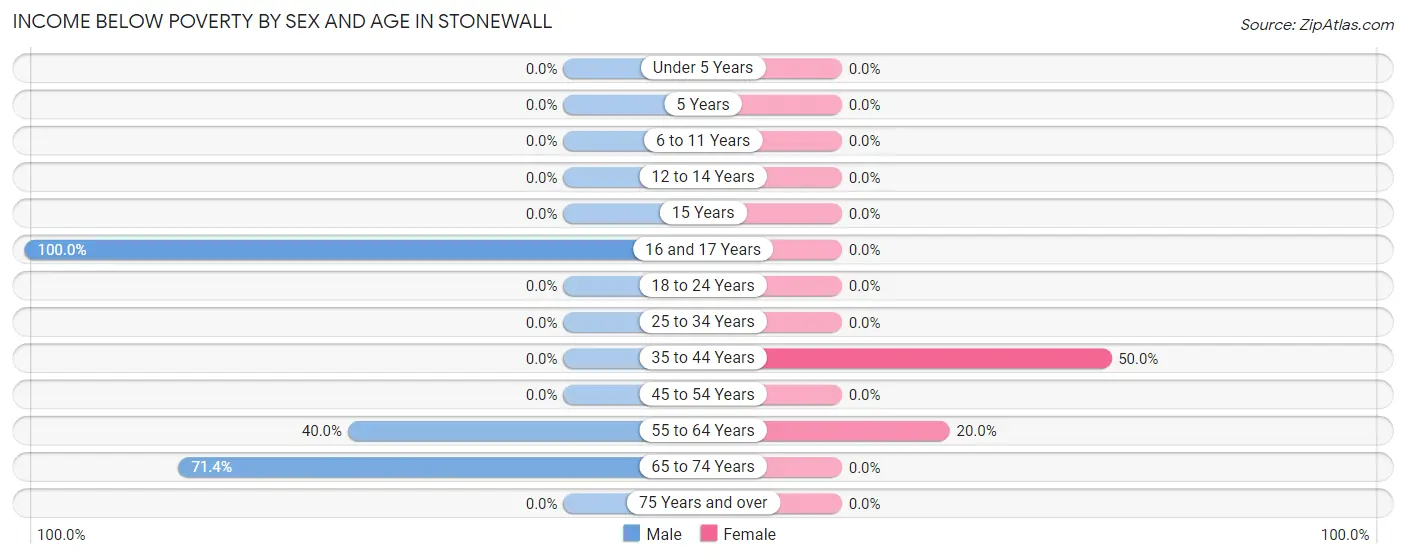
| Age Bracket | Male | Female |
| Under 5 Years | 0 (0.0%) | 0 (0.0%) |
| 5 Years | 0 (0.0%) | 0 (0.0%) |
| 6 to 11 Years | 0 (0.0%) | 0 (0.0%) |
| 12 to 14 Years | 0 (0.0%) | 0 (0.0%) |
| 15 Years | 0 (0.0%) | 0 (0.0%) |
| 16 and 17 Years | 6 (100.0%) | 0 (0.0%) |
| 18 to 24 Years | 0 (0.0%) | 0 (0.0%) |
| 25 to 34 Years | 0 (0.0%) | 0 (0.0%) |
| 35 to 44 Years | 0 (0.0%) | 2 (50.0%) |
| 45 to 54 Years | 0 (0.0%) | 0 (0.0%) |
| 55 to 64 Years | 6 (40.0%) | 2 (20.0%) |
| 65 to 74 Years | 5 (71.4%) | 0 (0.0%) |
| 75 Years and over | 0 (0.0%) | 0 (0.0%) |
| Total | 17 (13.4%) | 4 (3.9%) |
Income Above Poverty by Sex and Age in Stonewall
According to the poverty statistics in Stonewall, males aged 6 to 11 years and females aged under 5 years are the age groups that are most secure financially, with 100.0% of males and 100.0% of females in these age groups living above the poverty line.
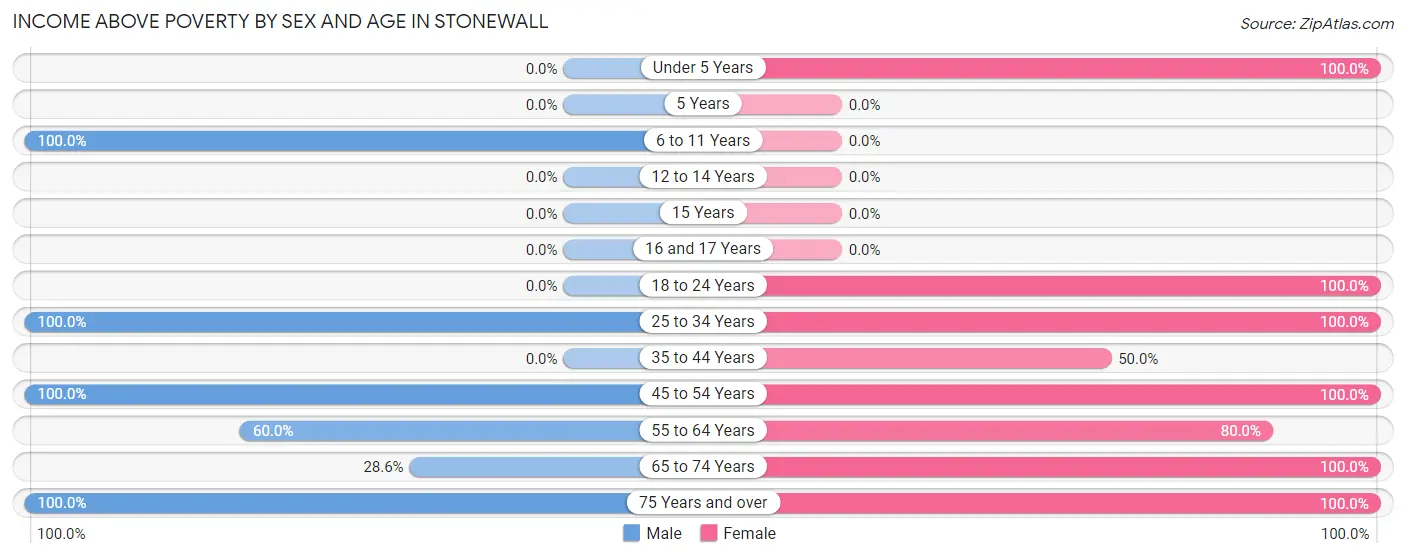
| Age Bracket | Male | Female |
| Under 5 Years | 0 (0.0%) | 9 (100.0%) |
| 5 Years | 0 (0.0%) | 0 (0.0%) |
| 6 to 11 Years | 9 (100.0%) | 0 (0.0%) |
| 12 to 14 Years | 0 (0.0%) | 0 (0.0%) |
| 15 Years | 0 (0.0%) | 0 (0.0%) |
| 16 and 17 Years | 0 (0.0%) | 0 (0.0%) |
| 18 to 24 Years | 0 (0.0%) | 6 (100.0%) |
| 25 to 34 Years | 7 (100.0%) | 15 (100.0%) |
| 35 to 44 Years | 0 (0.0%) | 2 (50.0%) |
| 45 to 54 Years | 54 (100.0%) | 23 (100.0%) |
| 55 to 64 Years | 9 (60.0%) | 8 (80.0%) |
| 65 to 74 Years | 2 (28.6%) | 18 (100.0%) |
| 75 Years and over | 29 (100.0%) | 17 (100.0%) |
| Total | 110 (86.6%) | 98 (96.1%) |
Income Below Poverty Among Married-Couple Families in Stonewall
The poverty statistics for married-couple families in Stonewall show that 6.2% or 2 of the total 32 families live below the poverty line. Families with 1 or 2 children have the highest poverty rate of 28.6%, comprising of 2 families. On the other hand, families with no children have the lowest poverty rate of 0.0%, which includes 0 families.
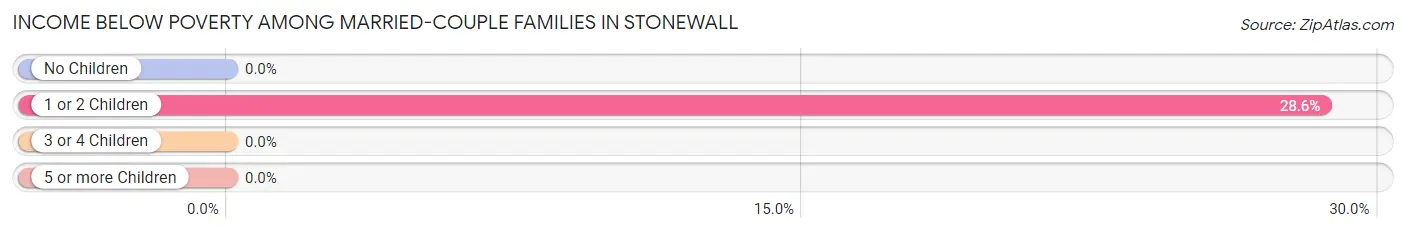
| Children | Above Poverty | Below Poverty |
| No Children | 25 (100.0%) | 0 (0.0%) |
| 1 or 2 Children | 5 (71.4%) | 2 (28.6%) |
| 3 or 4 Children | 0 (0.0%) | 0 (0.0%) |
| 5 or more Children | 0 (0.0%) | 0 (0.0%) |
| Total | 30 (93.8%) | 2 (6.2%) |
Income Below Poverty Among Single-Parent Households in Stonewall
| Children | Single Father | Single Mother |
| No Children | 0 (0.0%) | 0 (0.0%) |
| 1 or 2 Children | 0 (0.0%) | 0 (0.0%) |
| 3 or 4 Children | 0 (0.0%) | 0 (0.0%) |
| 5 or more Children | 0 (0.0%) | 0 (0.0%) |
| Total | 0 (0.0%) | 0 (0.0%) |
Income Below Poverty Among Married-Couple vs Single-Parent Households in Stonewall
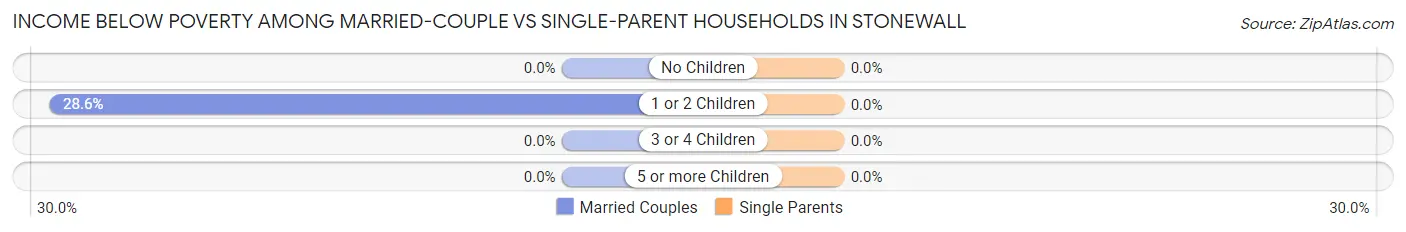
| Children | Married-Couple Families | Single-Parent Households |
| No Children | 0 (0.0%) | 0 (0.0%) |
| 1 or 2 Children | 2 (28.6%) | 0 (0.0%) |
| 3 or 4 Children | 0 (0.0%) | 0 (0.0%) |
| 5 or more Children | 0 (0.0%) | 0 (0.0%) |
| Total | 2 (6.2%) | 0 (0.0%) |
Race in Stonewall
The most populous races in Stonewall are White / Caucasian (190 | 83.0%), Two or more Races (16 | 7.0%), and Black / African American (14 | 6.1%).
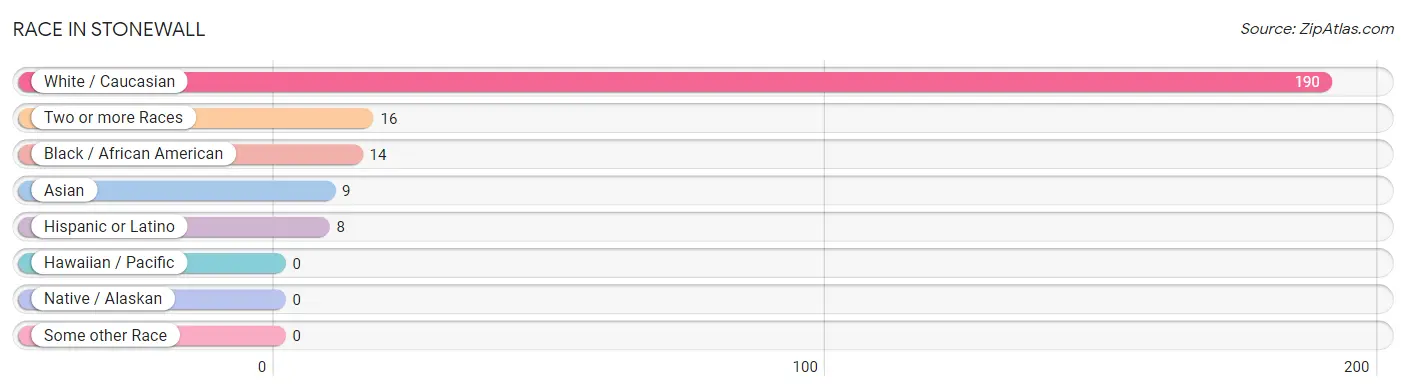
| Race | # Population | % Population |
| Asian | 9 | 3.9% |
| Black / African American | 14 | 6.1% |
| Hawaiian / Pacific | 0 | 0.0% |
| Hispanic or Latino | 8 | 3.5% |
| Native / Alaskan | 0 | 0.0% |
| White / Caucasian | 190 | 83.0% |
| Two or more Races | 16 | 7.0% |
| Some other Race | 0 | 0.0% |
| Total | 229 | 100.0% |
Ancestry in Stonewall
The most populous ancestries reported in Stonewall are English (125 | 54.6%), Irish (51 | 22.3%), German (9 | 3.9%), Mexican (8 | 3.5%), and American (5 | 2.2%), together accounting for 86.5% of all Stonewall residents.
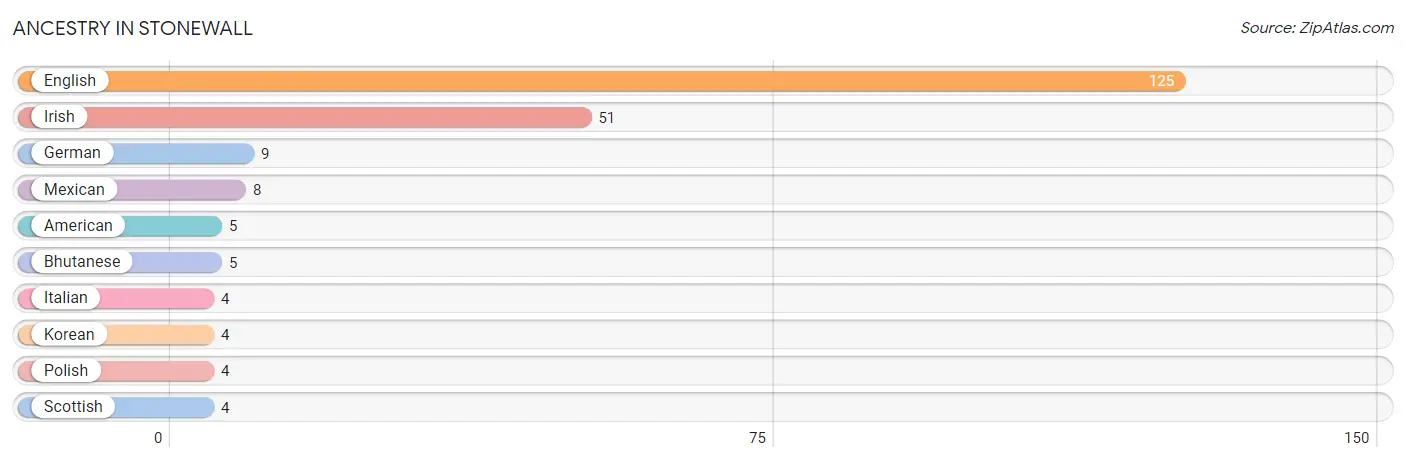
| Ancestry | # Population | % Population |
| American | 5 | 2.2% |
| Bhutanese | 5 | 2.2% |
| English | 125 | 54.6% |
| German | 9 | 3.9% |
| Irish | 51 | 22.3% |
| Italian | 4 | 1.8% |
| Korean | 4 | 1.8% |
| Mexican | 8 | 3.5% |
| Polish | 4 | 1.8% |
| Scottish | 4 | 1.8% | View All 10 Rows |
Immigrants in Stonewall
The most numerous immigrant groups reported in Stonewall came from Central America (8 | 3.5%), Latin America (8 | 3.5%), Mexico (8 | 3.5%), Asia (5 | 2.2%), and Eastern Asia (5 | 2.2%), together accounting for 14.8% of all Stonewall residents.
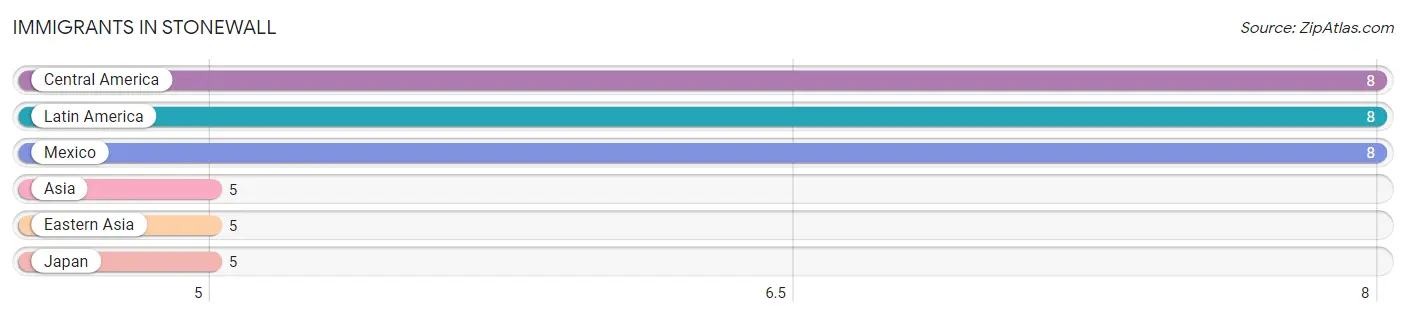
| Immigration Origin | # Population | % Population |
| Asia | 5 | 2.2% |
| Central America | 8 | 3.5% |
| Eastern Asia | 5 | 2.2% |
| Japan | 5 | 2.2% |
| Latin America | 8 | 3.5% |
| Mexico | 8 | 3.5% | View All 6 Rows |
Sex and Age in Stonewall
Sex and Age in Stonewall
The most populous age groups in Stonewall are 45 to 49 Years (50 | 39.4%) for men and 70 to 74 Years (18 | 17.6%) for women.
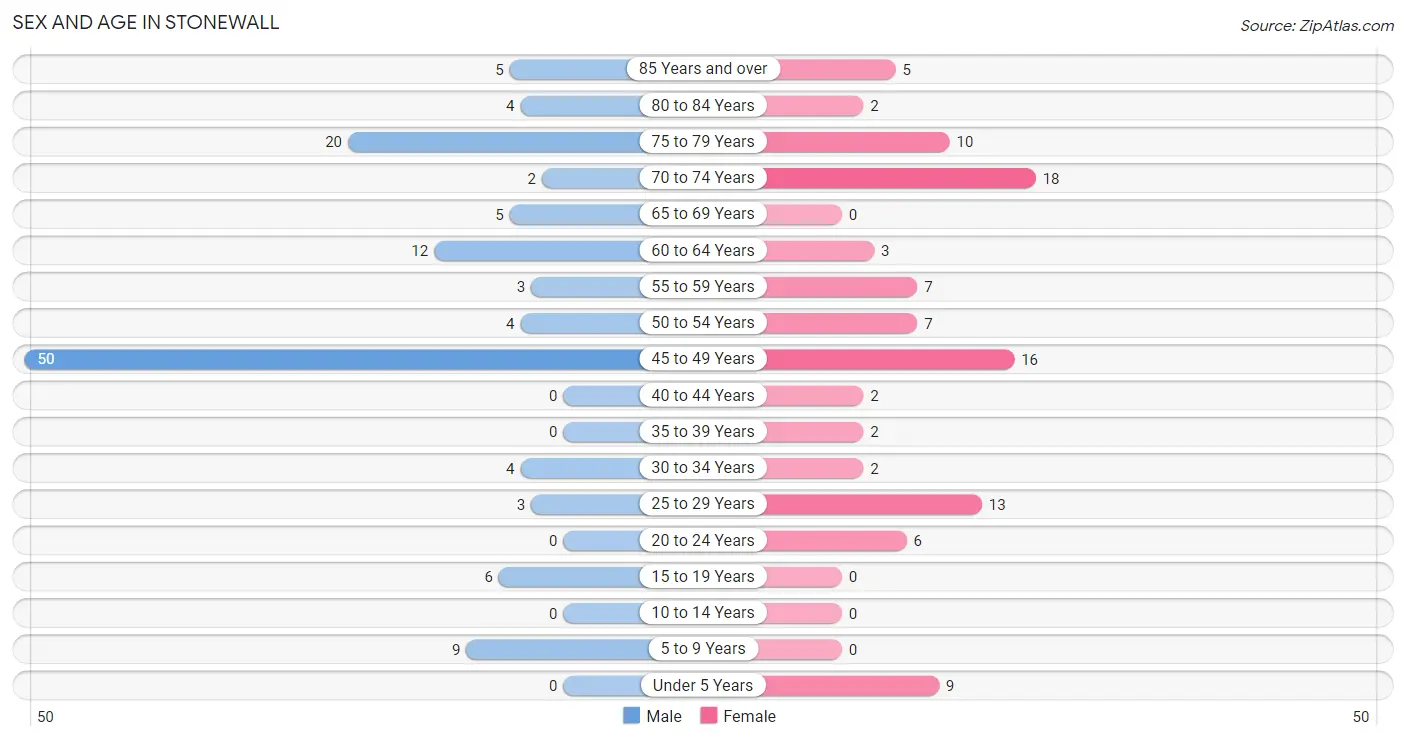
| Age Bracket | Male | Female |
| Under 5 Years | 0 (0.0%) | 9 (8.8%) |
| 5 to 9 Years | 9 (7.1%) | 0 (0.0%) |
| 10 to 14 Years | 0 (0.0%) | 0 (0.0%) |
| 15 to 19 Years | 6 (4.7%) | 0 (0.0%) |
| 20 to 24 Years | 0 (0.0%) | 6 (5.9%) |
| 25 to 29 Years | 3 (2.4%) | 13 (12.8%) |
| 30 to 34 Years | 4 (3.2%) | 2 (2.0%) |
| 35 to 39 Years | 0 (0.0%) | 2 (2.0%) |
| 40 to 44 Years | 0 (0.0%) | 2 (2.0%) |
| 45 to 49 Years | 50 (39.4%) | 16 (15.7%) |
| 50 to 54 Years | 4 (3.2%) | 7 (6.9%) |
| 55 to 59 Years | 3 (2.4%) | 7 (6.9%) |
| 60 to 64 Years | 12 (9.5%) | 3 (2.9%) |
| 65 to 69 Years | 5 (3.9%) | 0 (0.0%) |
| 70 to 74 Years | 2 (1.6%) | 18 (17.6%) |
| 75 to 79 Years | 20 (15.8%) | 10 (9.8%) |
| 80 to 84 Years | 4 (3.2%) | 2 (2.0%) |
| 85 Years and over | 5 (3.9%) | 5 (4.9%) |
| Total | 127 (100.0%) | 102 (100.0%) |
Families and Households in Stonewall
Median Family Size in Stonewall
The median family size in Stonewall is 2.48 persons per family, with single male/father families (5 | 10.0%) accounting for the largest median family size of 4.2 persons per family. On the other hand, single female/mother families (13 | 26.0%) represent the smallest median family size with 2.15 persons per family.
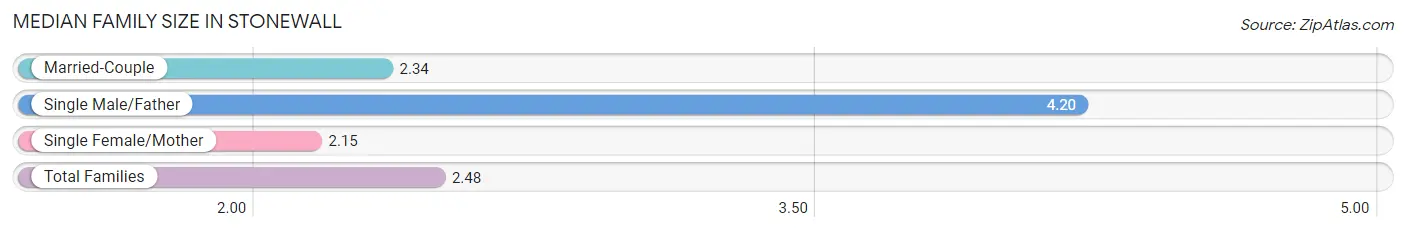
| Family Type | # Families | Family Size |
| Married-Couple | 32 (64.0%) | 2.34 |
| Single Male/Father | 5 (10.0%) | 4.20 |
| Single Female/Mother | 13 (26.0%) | 2.15 |
| Total Families | 50 (100.0%) | 2.48 |
Median Household Size in Stonewall
The median household size in Stonewall is 1.61 persons per household, with single male/father households (5 | 3.5%) accounting for the largest median household size of 4.2 persons per household. non-family households (92 | 64.8%) represent the smallest median household size with 1.10 persons per household.
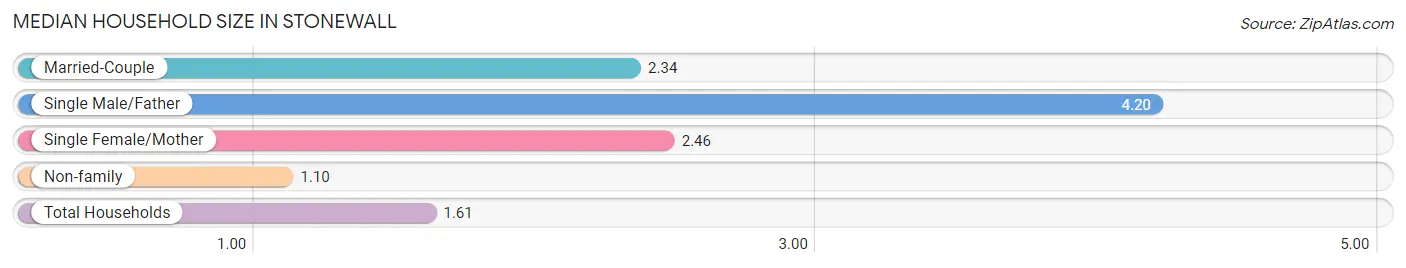
| Household Type | # Households | Household Size |
| Married-Couple | 32 (22.5%) | 2.34 |
| Single Male/Father | 5 (3.5%) | 4.20 |
| Single Female/Mother | 13 (9.1%) | 2.46 |
| Non-family | 92 (64.8%) | 1.10 |
| Total Households | 142 (100.0%) | 1.61 |
Household Size by Marriage Status in Stonewall
Out of a total of 142 households in Stonewall, 50 (35.2%) are family households, while 92 (64.8%) are nonfamily households. The most numerous type of family households are 2-person households, comprising 32, and the most common type of nonfamily households are 1-person households, comprising 83.
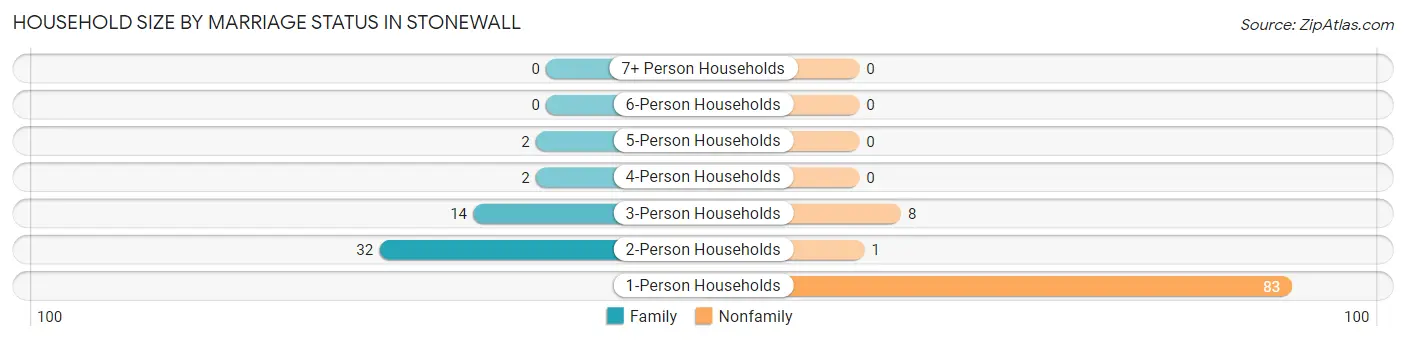
| Household Size | Family Households | Nonfamily Households |
| 1-Person Households | - | 83 (58.5%) |
| 2-Person Households | 32 (22.5%) | 1 (0.7%) |
| 3-Person Households | 14 (9.9%) | 8 (5.6%) |
| 4-Person Households | 2 (1.4%) | 0 (0.0%) |
| 5-Person Households | 2 (1.4%) | 0 (0.0%) |
| 6-Person Households | 0 (0.0%) | 0 (0.0%) |
| 7+ Person Households | 0 (0.0%) | 0 (0.0%) |
| Total | 50 (35.2%) | 92 (64.8%) |
Female Fertility in Stonewall
Fertility by Age in Stonewall
Average fertility rate in Stonewall is 122.0 births per 1,000 women. Women in the age bracket of 20 to 34 years have the highest fertility rate with 238.0 births per 1,000 women. Women in the age bracket of 20 to 34 years acount for 100.0% of all women with births.
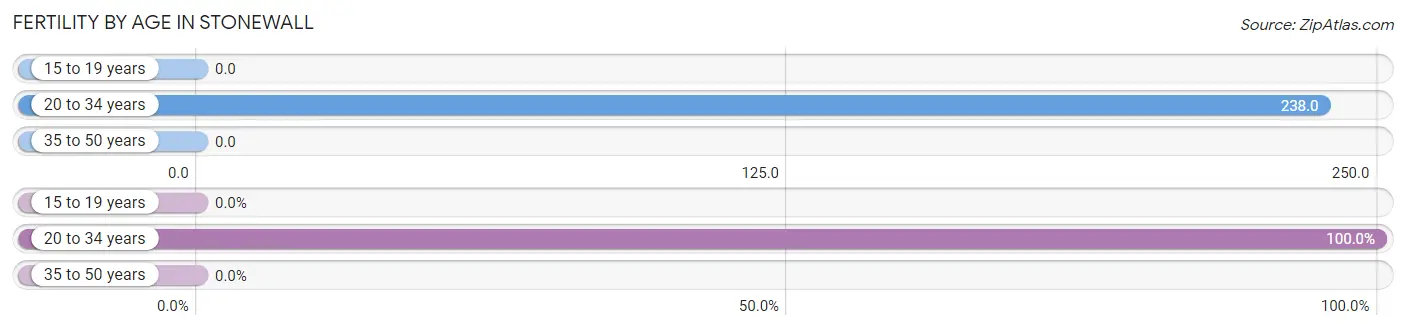
| Age Bracket | Women with Births | Births / 1,000 Women |
| 15 to 19 years | 0 (0.0%) | 0.0 |
| 20 to 34 years | 5 (100.0%) | 238.0 |
| 35 to 50 years | 0 (0.0%) | 0.0 |
| Total | 5 (100.0%) | 122.0 |
Fertility by Age by Marriage Status in Stonewall
80.0% of women with births (5) in Stonewall are married. The highest percentage of unmarried women with births falls into 20 to 34 years age bracket with 20.0% of them unmarried at the time of birth, while the lowest percentage of unmarried women with births belong to 20 to 34 years age bracket with 20.0% of them unmarried.
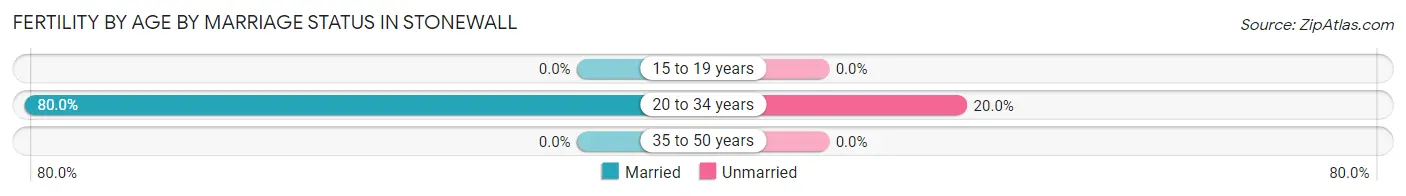
| Age Bracket | Married | Unmarried |
| 15 to 19 years | 0 (0.0%) | 0 (0.0%) |
| 20 to 34 years | 4 (80.0%) | 1 (20.0%) |
| 35 to 50 years | 0 (0.0%) | 0 (0.0%) |
| Total | 4 (80.0%) | 1 (20.0%) |
Fertility by Education in Stonewall
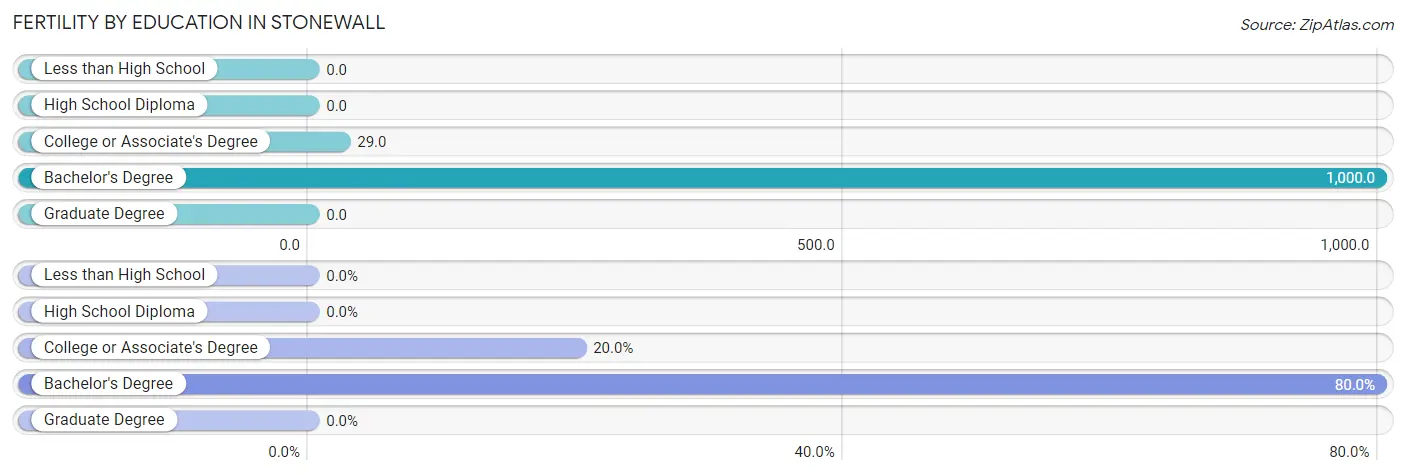
| Educational Attainment | Women with Births | Births / 1,000 Women |
| Less than High School | 0 (0.0%) | 0.0 |
| High School Diploma | 0 (0.0%) | 0.0 |
| College or Associate's Degree | 1 (20.0%) | 29.0 |
| Bachelor's Degree | 4 (80.0%) | 1,000.0 |
| Graduate Degree | 0 (0.0%) | 0.0 |
| Total | 5 (100.0%) | 122.0 |
Fertility by Education by Marriage Status in Stonewall
20.0% of women with births in Stonewall are unmarried. Women with the educational attainment of college or associate's degree are most likely to be married with 100.0% of them married at childbirth, while women with the educational attainment of bachelor's degree are least likely to be married with 25.0% of them unmarried at childbirth.
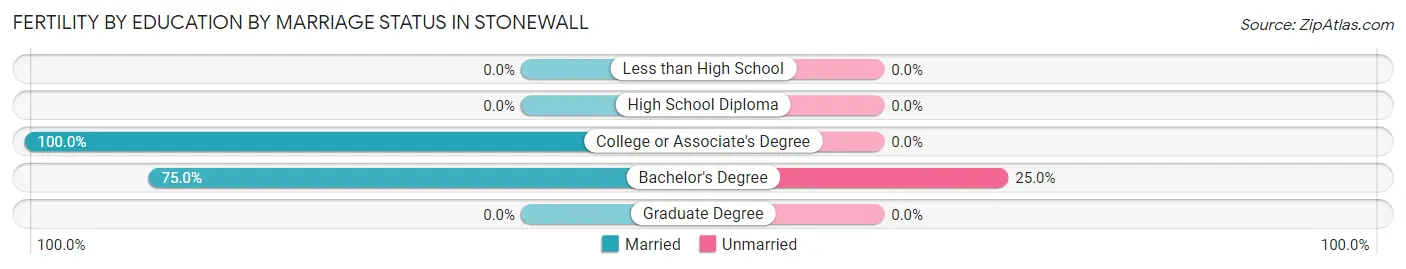
| Educational Attainment | Married | Unmarried |
| Less than High School | 0 (0.0%) | 0 (0.0%) |
| High School Diploma | 0 (0.0%) | 0 (0.0%) |
| College or Associate's Degree | 1 (100.0%) | 0 (0.0%) |
| Bachelor's Degree | 3 (75.0%) | 1 (25.0%) |
| Graduate Degree | 0 (0.0%) | 0 (0.0%) |
| Total | 4 (80.0%) | 1 (20.0%) |
Employment Characteristics in Stonewall
Employment by Class of Employer in Stonewall
Among the 71 employed individuals in Stonewall, private company employees (44 | 62.0%), state government employees (12 | 16.9%), and self-employed (incorporated) (11 | 15.5%) make up the most common classes of employment.
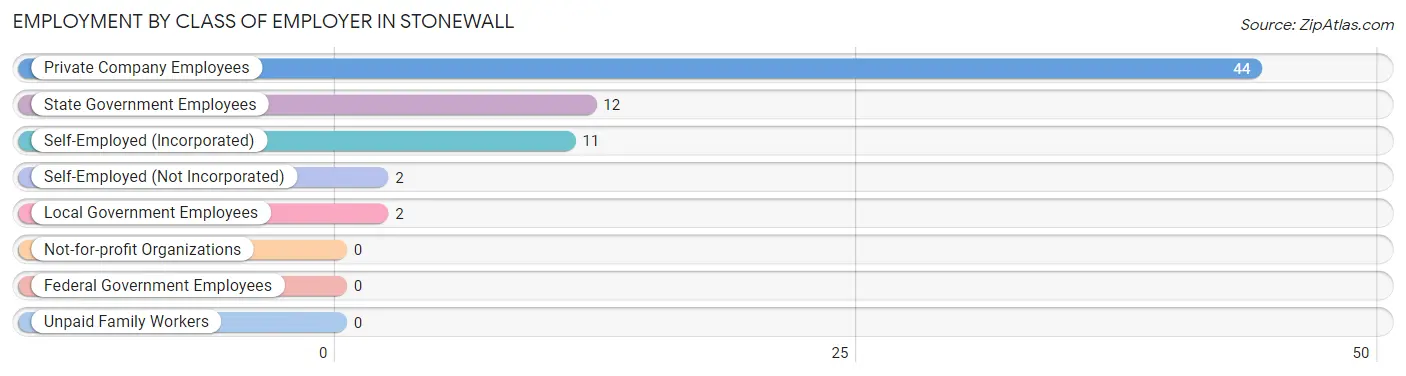
| Employer Class | # Employees | % Employees |
| Private Company Employees | 44 | 62.0% |
| Self-Employed (Incorporated) | 11 | 15.5% |
| Self-Employed (Not Incorporated) | 2 | 2.8% |
| Not-for-profit Organizations | 0 | 0.0% |
| Local Government Employees | 2 | 2.8% |
| State Government Employees | 12 | 16.9% |
| Federal Government Employees | 0 | 0.0% |
| Unpaid Family Workers | 0 | 0.0% |
| Total | 71 | 100.0% |
Employment Status by Age in Stonewall
According to the labor force statistics for Stonewall, out of the total population over 16 years of age (211), 58.3% or 123 individuals are in the labor force, with 40.7% or 50 of them unemployed. The age group with the highest labor force participation rate is 45 to 54 years, with 97.4% or 75 individuals in the labor force. Within the labor force, the 45 to 54 years age range has the highest percentage of unemployed individuals, with 66.7% or 50 of them being unemployed.
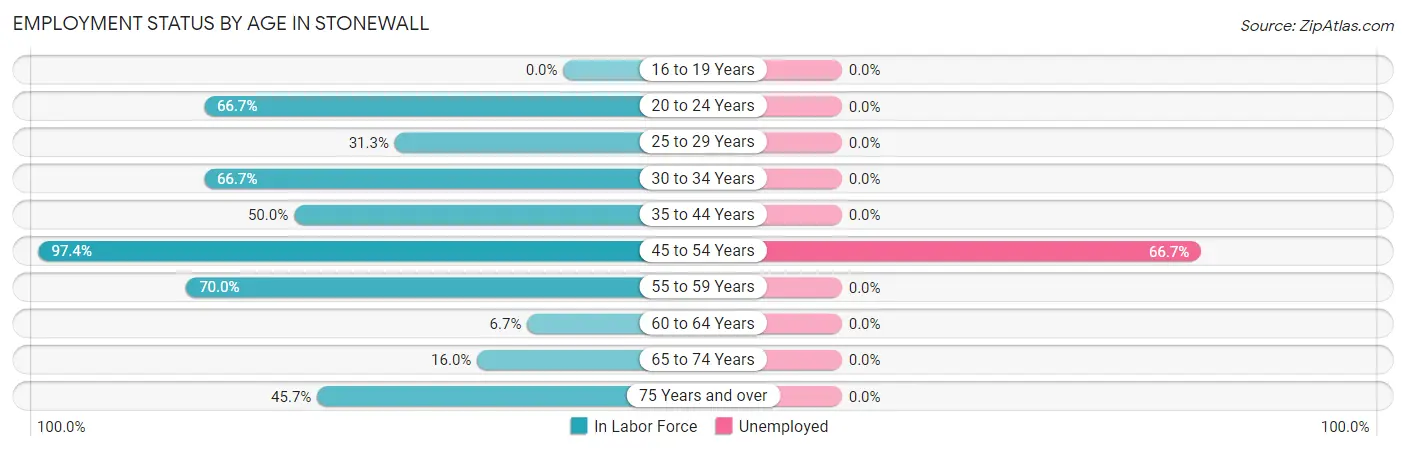
| Age Bracket | In Labor Force | Unemployed |
| 16 to 19 Years | 0 (0.0%) | 0 (0.0%) |
| 20 to 24 Years | 4 (66.7%) | 0 (0.0%) |
| 25 to 29 Years | 5 (31.3%) | 0 (0.0%) |
| 30 to 34 Years | 4 (66.7%) | 0 (0.0%) |
| 35 to 44 Years | 2 (50.0%) | 0 (0.0%) |
| 45 to 54 Years | 75 (97.4%) | 50 (66.7%) |
| 55 to 59 Years | 7 (70.0%) | 0 (0.0%) |
| 60 to 64 Years | 1 (6.7%) | 0 (0.0%) |
| 65 to 74 Years | 4 (16.0%) | 0 (0.0%) |
| 75 Years and over | 21 (45.7%) | 0 (0.0%) |
| Total | 123 (58.3%) | 50 (40.7%) |
Employment Status by Educational Attainment in Stonewall
According to labor force statistics for Stonewall, 73.4% of individuals (94) out of the total population between 25 and 64 years of age (128) are in the labor force, with 53.2% or 50 of them being unemployed. The group with the highest labor force participation rate are those with the educational attainment of bachelor's degree or higher, with 100.0% or 7 individuals in the labor force. Within the labor force, individuals with college / associate degree education have the highest percentage of unemployment, with 61.7% or 50 of them being unemployed.
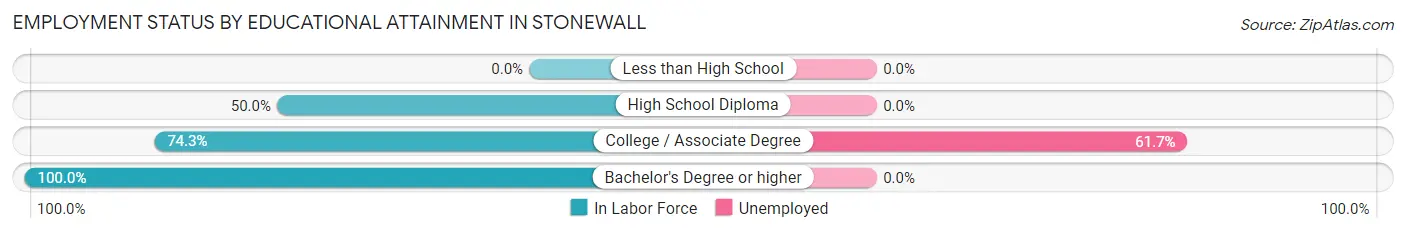
| Educational Attainment | In Labor Force | Unemployed |
| Less than High School | 0 (0.0%) | 0 (0.0%) |
| High School Diploma | 6 (50.0%) | 0 (0.0%) |
| College / Associate Degree | 81 (74.3%) | 67 (61.7%) |
| Bachelor's Degree or higher | 7 (100.0%) | 0 (0.0%) |
| Total | 94 (73.4%) | 68 (53.2%) |
Employment Occupations by Sex in Stonewall
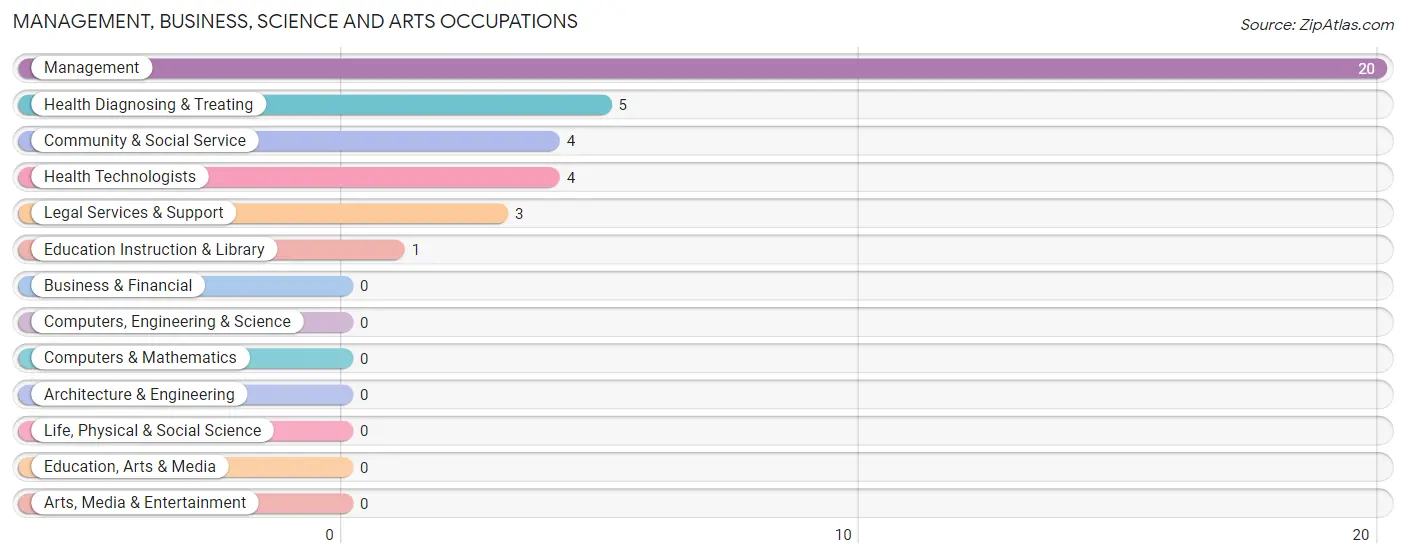
Management, Business, Science and Arts Occupations
The most common Management, Business, Science and Arts occupations in Stonewall are Management (20 | 27.4%), Health Diagnosing & Treating (5 | 6.9%), Community & Social Service (4 | 5.5%), Health Technologists (4 | 5.5%), and Legal Services & Support (3 | 4.1%).
Management, Business, Science and Arts Occupations by Sex
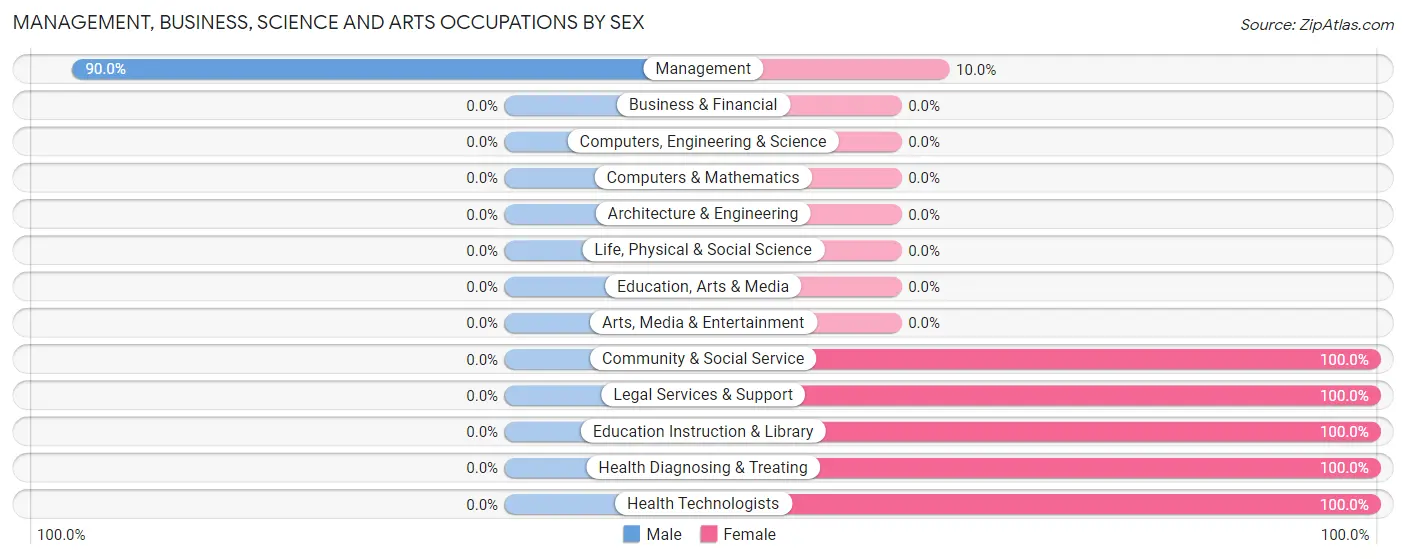
| Occupation | Male | Female |
| Management | 18 (90.0%) | 2 (10.0%) |
| Business & Financial | 0 (0.0%) | 0 (0.0%) |
| Computers, Engineering & Science | 0 (0.0%) | 0 (0.0%) |
| Computers & Mathematics | 0 (0.0%) | 0 (0.0%) |
| Architecture & Engineering | 0 (0.0%) | 0 (0.0%) |
| Life, Physical & Social Science | 0 (0.0%) | 0 (0.0%) |
| Community & Social Service | 0 (0.0%) | 4 (100.0%) |
| Education, Arts & Media | 0 (0.0%) | 0 (0.0%) |
| Legal Services & Support | 0 (0.0%) | 3 (100.0%) |
| Education Instruction & Library | 0 (0.0%) | 1 (100.0%) |
| Arts, Media & Entertainment | 0 (0.0%) | 0 (0.0%) |
| Health Diagnosing & Treating | 0 (0.0%) | 5 (100.0%) |
| Health Technologists | 0 (0.0%) | 4 (100.0%) |
| Total (Category) | 18 (62.1%) | 11 (37.9%) |
| Total (Overall) | 26 (35.6%) | 47 (64.4%) |
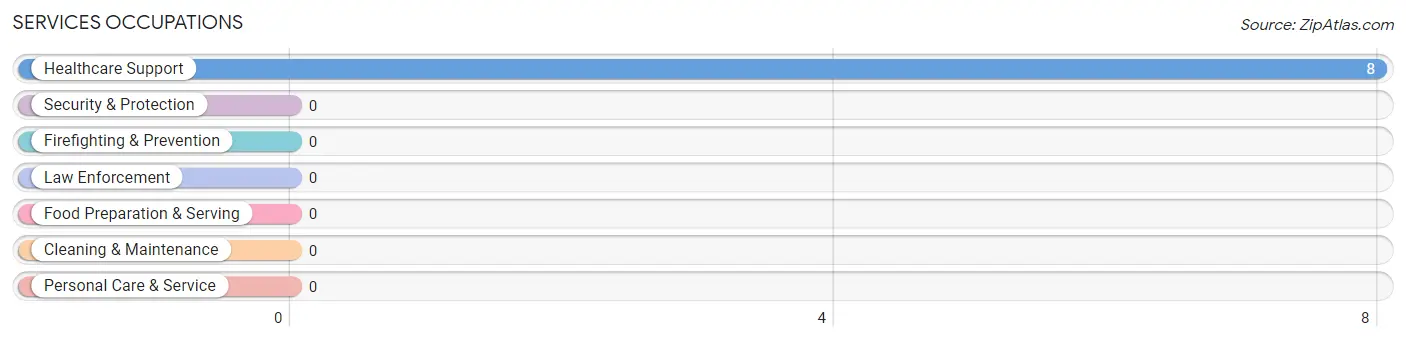
Services Occupations
The most common Services occupations in Stonewall are , and Healthcare Support (8 | 11.0%).
Services Occupations by Sex
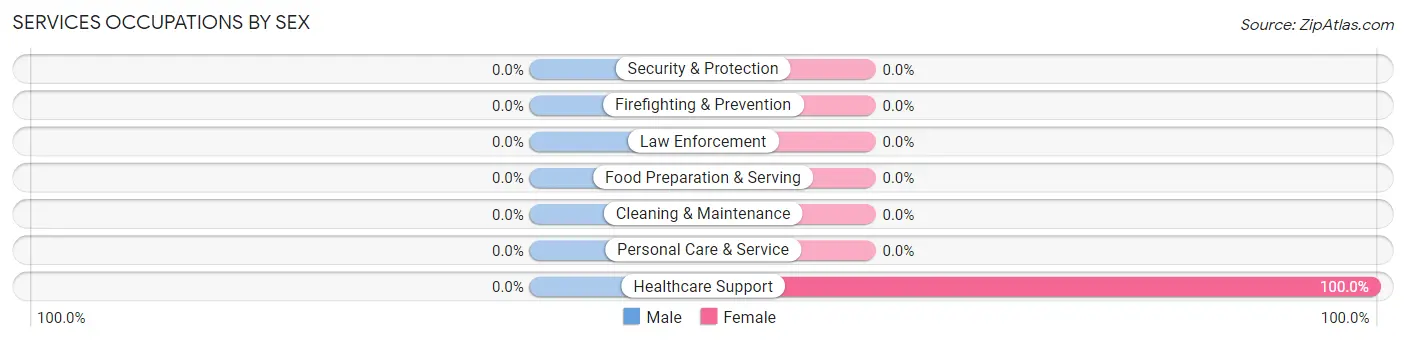
| Occupation | Male | Female |
| Healthcare Support | 0 (0.0%) | 8 (100.0%) |
| Security & Protection | 0 (0.0%) | 0 (0.0%) |
| Firefighting & Prevention | 0 (0.0%) | 0 (0.0%) |
| Law Enforcement | 0 (0.0%) | 0 (0.0%) |
| Food Preparation & Serving | 0 (0.0%) | 0 (0.0%) |
| Cleaning & Maintenance | 0 (0.0%) | 0 (0.0%) |
| Personal Care & Service | 0 (0.0%) | 0 (0.0%) |
| Total (Category) | 0 (0.0%) | 8 (100.0%) |
| Total (Overall) | 26 (35.6%) | 47 (64.4%) |
Sales and Office Occupations
The most common Sales and Office occupations in Stonewall are Office & Administration (19 | 26.0%), and Sales & Related (9 | 12.3%).
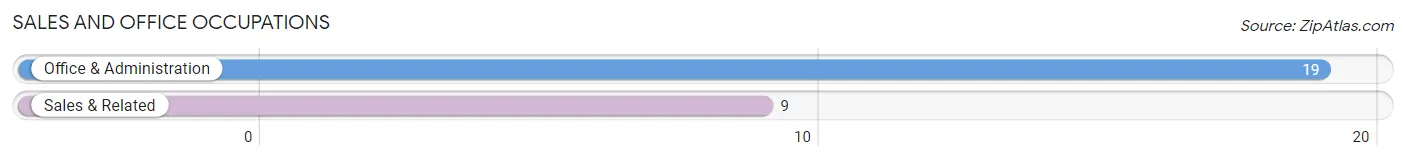
Sales and Office Occupations by Sex
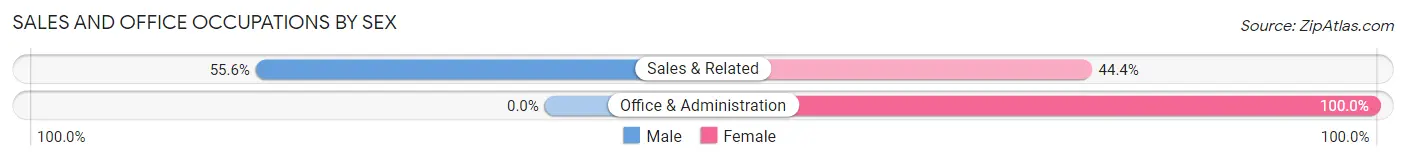
| Occupation | Male | Female |
| Sales & Related | 5 (55.6%) | 4 (44.4%) |
| Office & Administration | 0 (0.0%) | 19 (100.0%) |
| Total (Category) | 5 (17.9%) | 23 (82.1%) |
| Total (Overall) | 26 (35.6%) | 47 (64.4%) |
Natural Resources, Construction and Maintenance Occupations
The most common Natural Resources, Construction and Maintenance occupations in Stonewall are Construction & Extraction (2 | 2.7%), and Farming, Fishing & Forestry (1 | 1.4%).
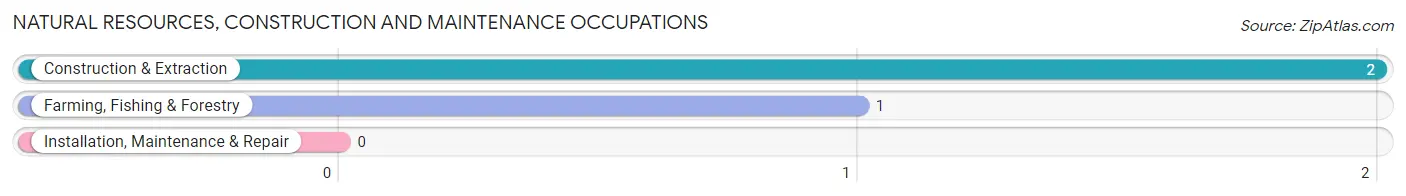
Natural Resources, Construction and Maintenance Occupations by Sex
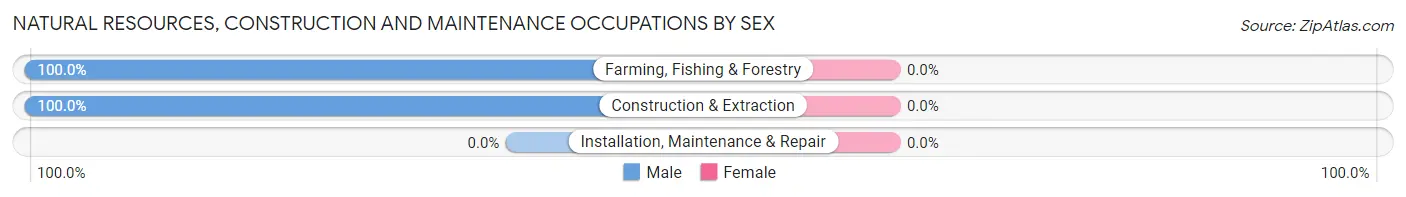
| Occupation | Male | Female |
| Farming, Fishing & Forestry | 1 (100.0%) | 0 (0.0%) |
| Construction & Extraction | 2 (100.0%) | 0 (0.0%) |
| Installation, Maintenance & Repair | 0 (0.0%) | 0 (0.0%) |
| Total (Category) | 3 (100.0%) | 0 (0.0%) |
| Total (Overall) | 26 (35.6%) | 47 (64.4%) |
Production, Transportation and Moving Occupations
The most common Production, Transportation and Moving occupations in Stonewall are , and Production (5 | 6.9%).
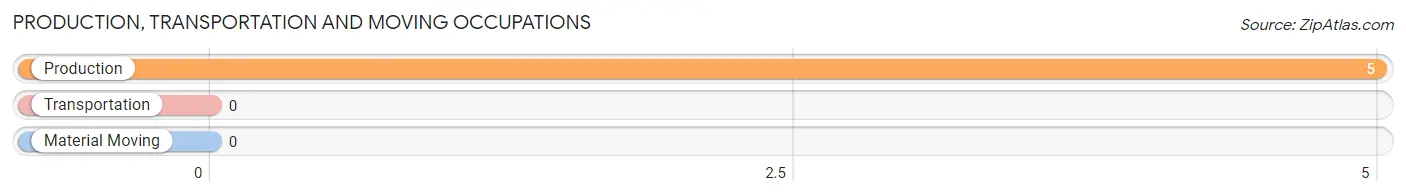
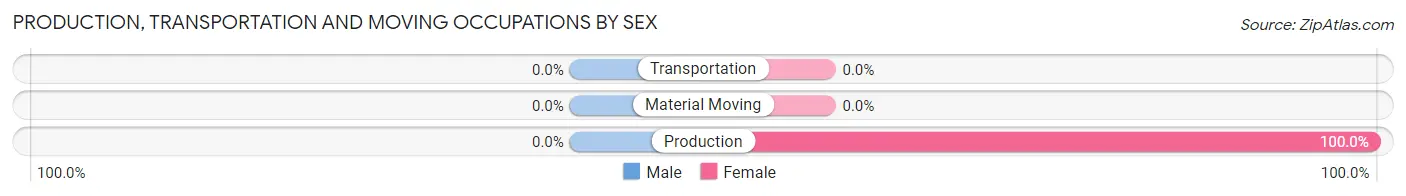
Production, Transportation and Moving Occupations by Sex
| Occupation | Male | Female |
| Production | 0 (0.0%) | 5 (100.0%) |
| Transportation | 0 (0.0%) | 0 (0.0%) |
| Material Moving | 0 (0.0%) | 0 (0.0%) |
| Total (Category) | 0 (0.0%) | 5 (100.0%) |
| Total (Overall) | 26 (35.6%) | 47 (64.4%) |
Employment Industries by Sex in Stonewall
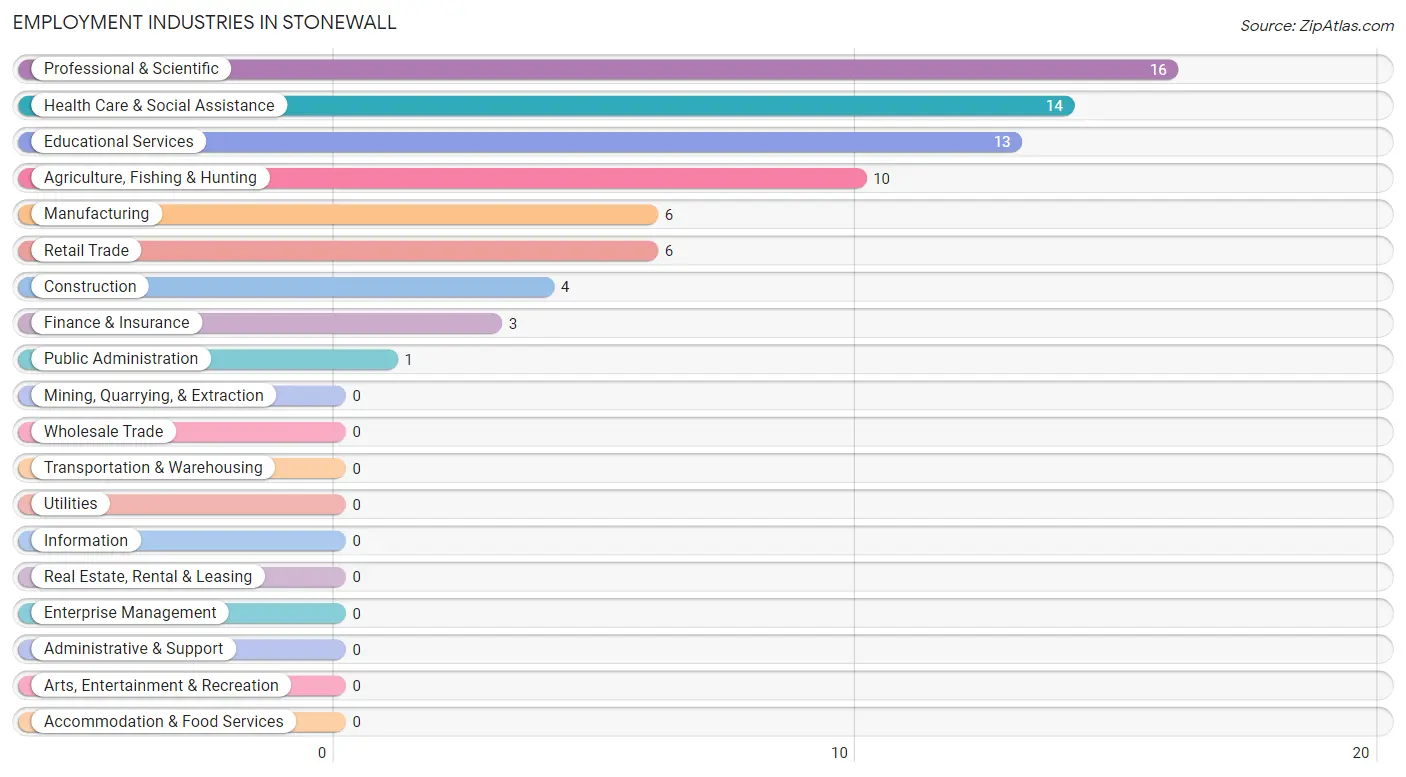
Employment Industries in Stonewall
The major employment industries in Stonewall include Professional & Scientific (16 | 21.9%), Health Care & Social Assistance (14 | 19.2%), Educational Services (13 | 17.8%), Agriculture, Fishing & Hunting (10 | 13.7%), and Manufacturing (6 | 8.2%).
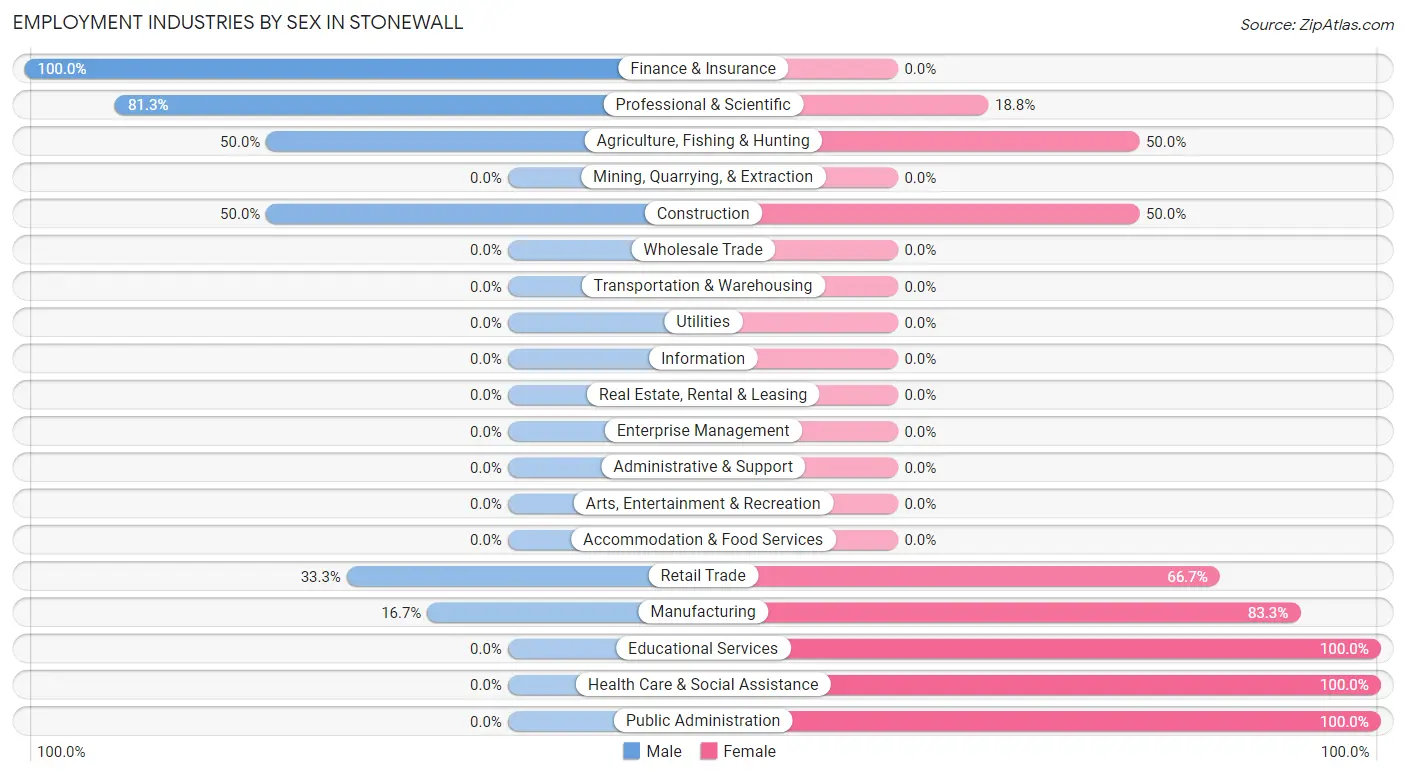
Employment Industries by Sex in Stonewall
The Stonewall industries that see more men than women are Finance & Insurance (100.0%), Professional & Scientific (81.2%), and Agriculture, Fishing & Hunting (50.0%), whereas the industries that tend to have a higher number of women are Educational Services (100.0%), Health Care & Social Assistance (100.0%), and Public Administration (100.0%).
| Industry | Male | Female |
| Agriculture, Fishing & Hunting | 5 (50.0%) | 5 (50.0%) |
| Mining, Quarrying, & Extraction | 0 (0.0%) | 0 (0.0%) |
| Construction | 2 (50.0%) | 2 (50.0%) |
| Manufacturing | 1 (16.7%) | 5 (83.3%) |
| Wholesale Trade | 0 (0.0%) | 0 (0.0%) |
| Retail Trade | 2 (33.3%) | 4 (66.7%) |
| Transportation & Warehousing | 0 (0.0%) | 0 (0.0%) |
| Utilities | 0 (0.0%) | 0 (0.0%) |
| Information | 0 (0.0%) | 0 (0.0%) |
| Finance & Insurance | 3 (100.0%) | 0 (0.0%) |
| Real Estate, Rental & Leasing | 0 (0.0%) | 0 (0.0%) |
| Professional & Scientific | 13 (81.2%) | 3 (18.8%) |
| Enterprise Management | 0 (0.0%) | 0 (0.0%) |
| Administrative & Support | 0 (0.0%) | 0 (0.0%) |
| Educational Services | 0 (0.0%) | 13 (100.0%) |
| Health Care & Social Assistance | 0 (0.0%) | 14 (100.0%) |
| Arts, Entertainment & Recreation | 0 (0.0%) | 0 (0.0%) |
| Accommodation & Food Services | 0 (0.0%) | 0 (0.0%) |
| Public Administration | 0 (0.0%) | 1 (100.0%) |
| Total | 26 (35.6%) | 47 (64.4%) |
Education in Stonewall
School Enrollment in Stonewall
The most common levels of schooling among the 18 students in Stonewall are elementary school (9 | 50.0%), high school (6 | 33.3%), and college / undergraduate (2 | 11.1%).
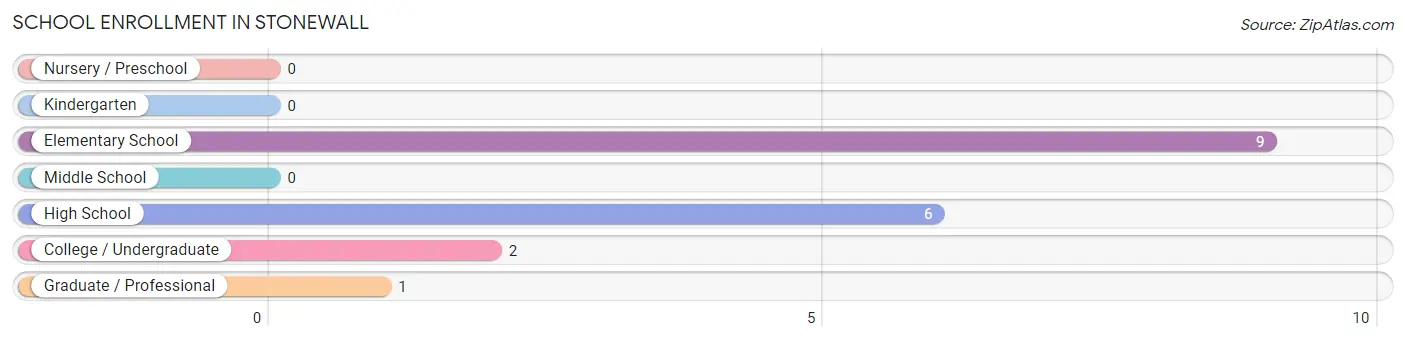
| School Level | # Students | % Students |
| Nursery / Preschool | 0 | 0.0% |
| Kindergarten | 0 | 0.0% |
| Elementary School | 9 | 50.0% |
| Middle School | 0 | 0.0% |
| High School | 6 | 33.3% |
| College / Undergraduate | 2 | 11.1% |
| Graduate / Professional | 1 | 5.6% |
| Total | 18 | 100.0% |
School Enrollment by Age by Funding Source in Stonewall
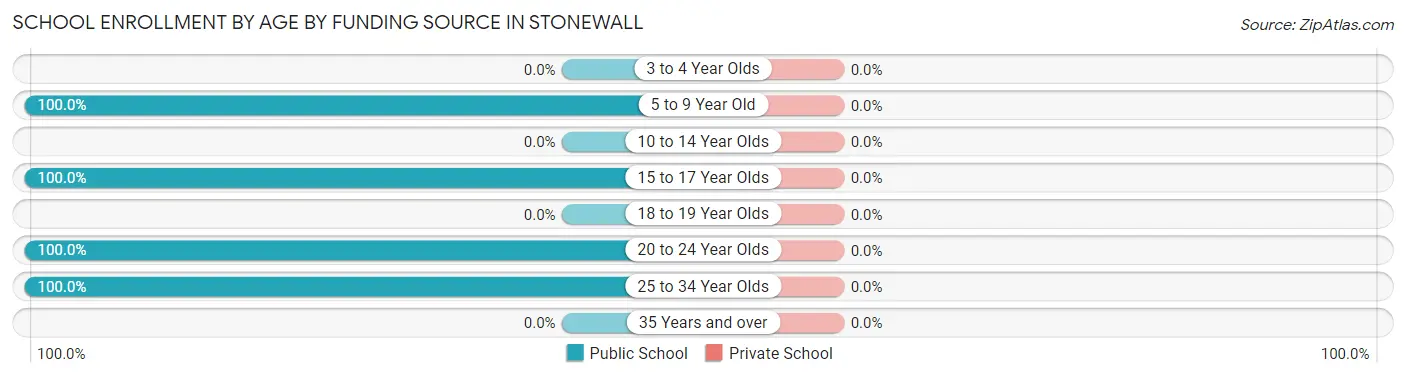
| Age Bracket | Public School | Private School |
| 3 to 4 Year Olds | 0 (0.0%) | 0 (0.0%) |
| 5 to 9 Year Old | 9 (100.0%) | 0 (0.0%) |
| 10 to 14 Year Olds | 0 (0.0%) | 0 (0.0%) |
| 15 to 17 Year Olds | 6 (100.0%) | 0 (0.0%) |
| 18 to 19 Year Olds | 0 (0.0%) | 0 (0.0%) |
| 20 to 24 Year Olds | 2 (100.0%) | 0 (0.0%) |
| 25 to 34 Year Olds | 1 (100.0%) | 0 (0.0%) |
| 35 Years and over | 0 (0.0%) | 0 (0.0%) |
| Total | 18 (100.0%) | 0 (0.0%) |
Educational Attainment by Field of Study in Stonewall
Engineering (14 | 63.6%), science & technology (4 | 18.2%), education (3 | 13.6%), and social sciences (1 | 4.5%) are the most common fields of study among 22 individuals in Stonewall who have obtained a bachelor's degree or higher.
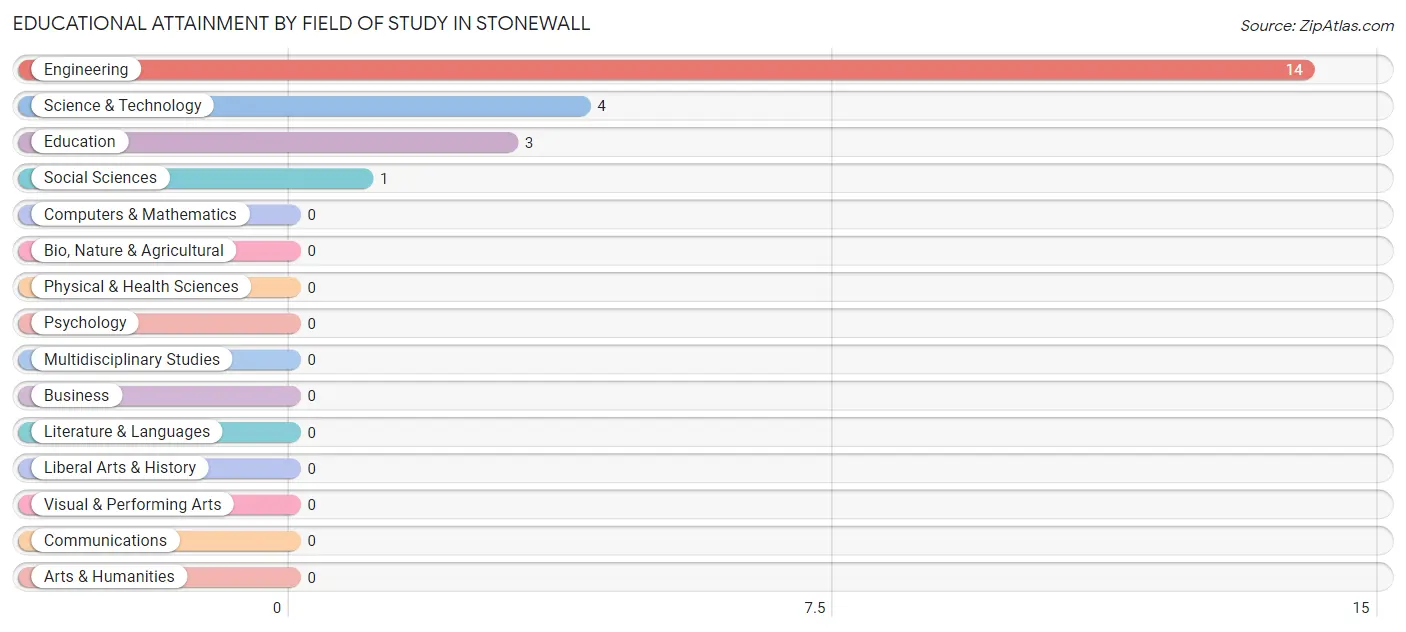
| Field of Study | # Graduates | % Graduates |
| Computers & Mathematics | 0 | 0.0% |
| Bio, Nature & Agricultural | 0 | 0.0% |
| Physical & Health Sciences | 0 | 0.0% |
| Psychology | 0 | 0.0% |
| Social Sciences | 1 | 4.5% |
| Engineering | 14 | 63.6% |
| Multidisciplinary Studies | 0 | 0.0% |
| Science & Technology | 4 | 18.2% |
| Business | 0 | 0.0% |
| Education | 3 | 13.6% |
| Literature & Languages | 0 | 0.0% |
| Liberal Arts & History | 0 | 0.0% |
| Visual & Performing Arts | 0 | 0.0% |
| Communications | 0 | 0.0% |
| Arts & Humanities | 0 | 0.0% |
| Total | 22 | 100.0% |
Transportation & Commute in Stonewall
Vehicle Availability by Sex in Stonewall
The most prevalent vehicle ownership categories in Stonewall are males with 4 vehicles (13, accounting for 50.0%) and females with 4 vehicles (0, making up 28.9%).
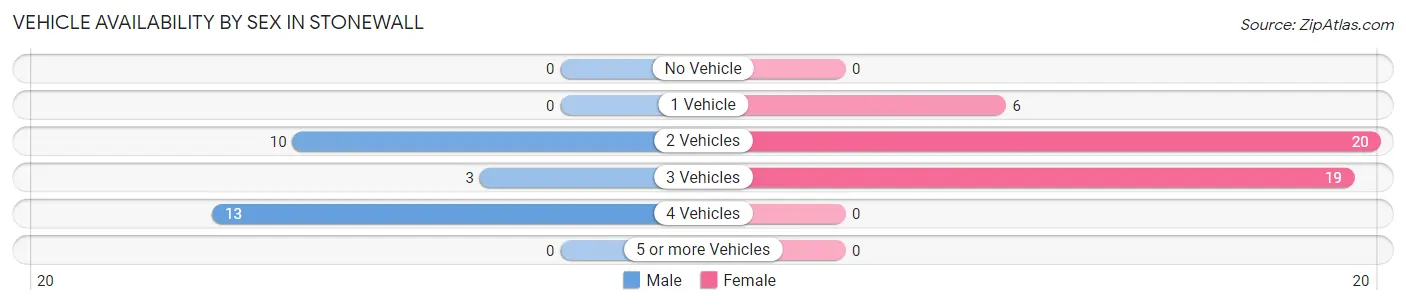
| Vehicles Available | Male | Female |
| No Vehicle | 0 (0.0%) | 0 (0.0%) |
| 1 Vehicle | 0 (0.0%) | 6 (13.3%) |
| 2 Vehicles | 10 (38.5%) | 20 (44.4%) |
| 3 Vehicles | 3 (11.5%) | 19 (42.2%) |
| 4 Vehicles | 13 (50.0%) | 0 (0.0%) |
| 5 or more Vehicles | 0 (0.0%) | 0 (0.0%) |
| Total | 26 (100.0%) | 45 (100.0%) |
Commute Time in Stonewall
The most frequently occuring commute durations in Stonewall are 30 to 34 minutes (21 commuters, 42.0%), 5 to 9 minutes (11 commuters, 22.0%), and 10 to 14 minutes (8 commuters, 16.0%).
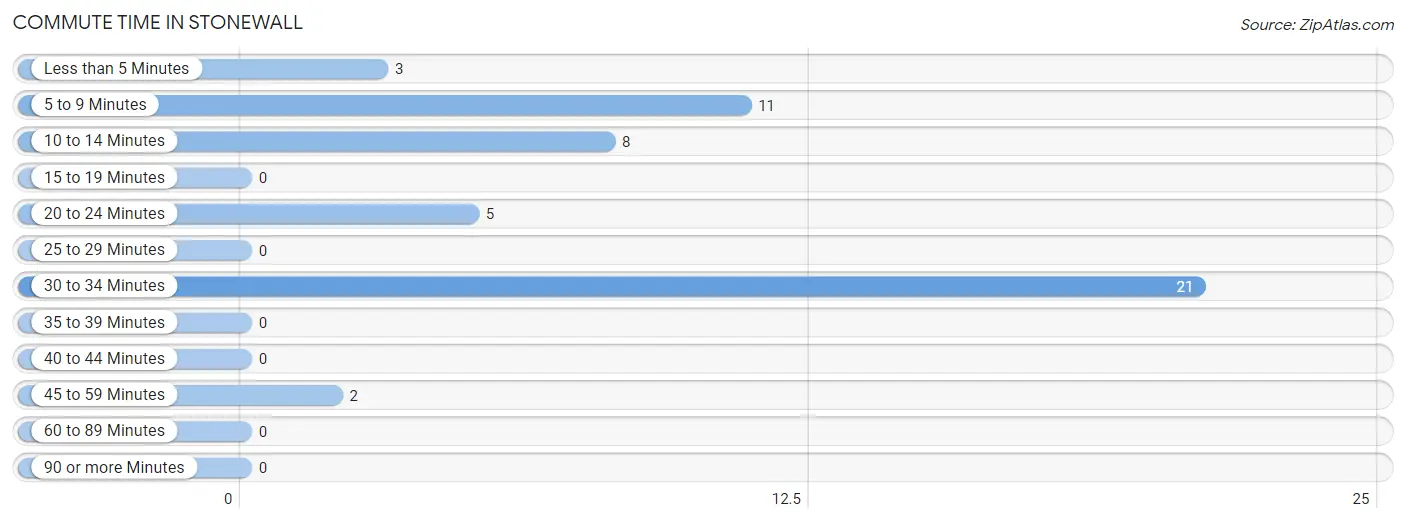
| Commute Time | # Commuters | % Commuters |
| Less than 5 Minutes | 3 | 6.0% |
| 5 to 9 Minutes | 11 | 22.0% |
| 10 to 14 Minutes | 8 | 16.0% |
| 15 to 19 Minutes | 0 | 0.0% |
| 20 to 24 Minutes | 5 | 10.0% |
| 25 to 29 Minutes | 0 | 0.0% |
| 30 to 34 Minutes | 21 | 42.0% |
| 35 to 39 Minutes | 0 | 0.0% |
| 40 to 44 Minutes | 0 | 0.0% |
| 45 to 59 Minutes | 2 | 4.0% |
| 60 to 89 Minutes | 0 | 0.0% |
| 90 or more Minutes | 0 | 0.0% |
Commute Time by Sex in Stonewall
The most common commute times in Stonewall are 5 to 9 minutes (5 commuters, 50.0%) for males and 30 to 34 minutes (20 commuters, 50.0%) for females.
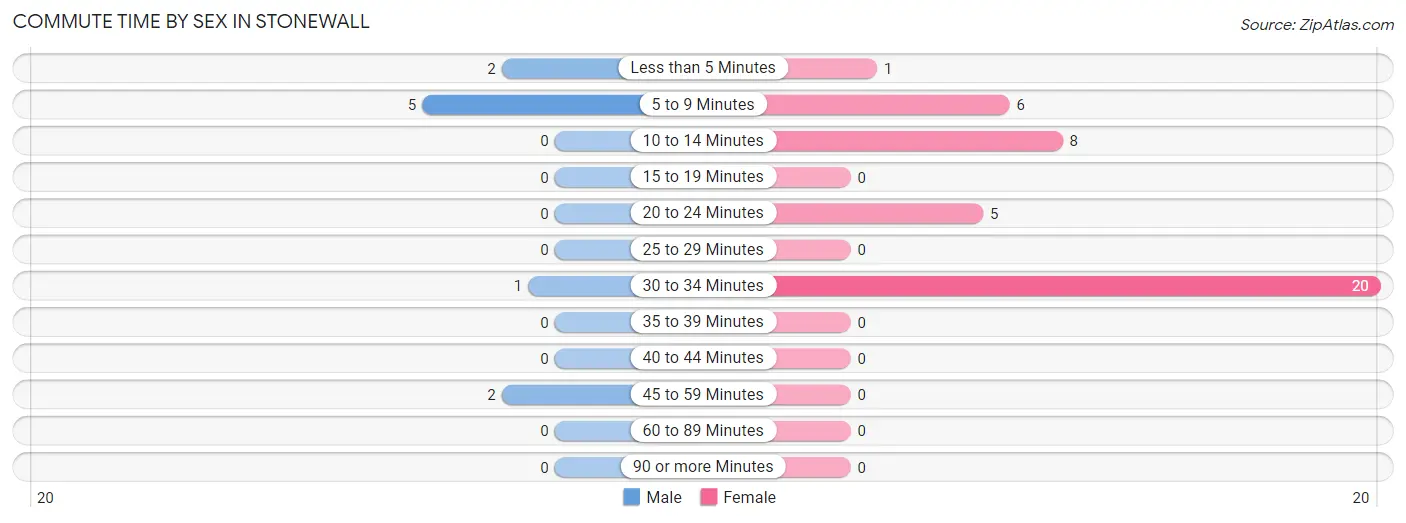
| Commute Time | Male | Female |
| Less than 5 Minutes | 2 (20.0%) | 1 (2.5%) |
| 5 to 9 Minutes | 5 (50.0%) | 6 (15.0%) |
| 10 to 14 Minutes | 0 (0.0%) | 8 (20.0%) |
| 15 to 19 Minutes | 0 (0.0%) | 0 (0.0%) |
| 20 to 24 Minutes | 0 (0.0%) | 5 (12.5%) |
| 25 to 29 Minutes | 0 (0.0%) | 0 (0.0%) |
| 30 to 34 Minutes | 1 (10.0%) | 20 (50.0%) |
| 35 to 39 Minutes | 0 (0.0%) | 0 (0.0%) |
| 40 to 44 Minutes | 0 (0.0%) | 0 (0.0%) |
| 45 to 59 Minutes | 2 (20.0%) | 0 (0.0%) |
| 60 to 89 Minutes | 0 (0.0%) | 0 (0.0%) |
| 90 or more Minutes | 0 (0.0%) | 0 (0.0%) |
Time of Departure to Work by Sex in Stonewall
The most frequent times of departure to work in Stonewall are 7:00 AM to 7:29 AM (3, 30.0%) for males and 7:30 AM to 7:59 AM (18, 45.0%) for females.
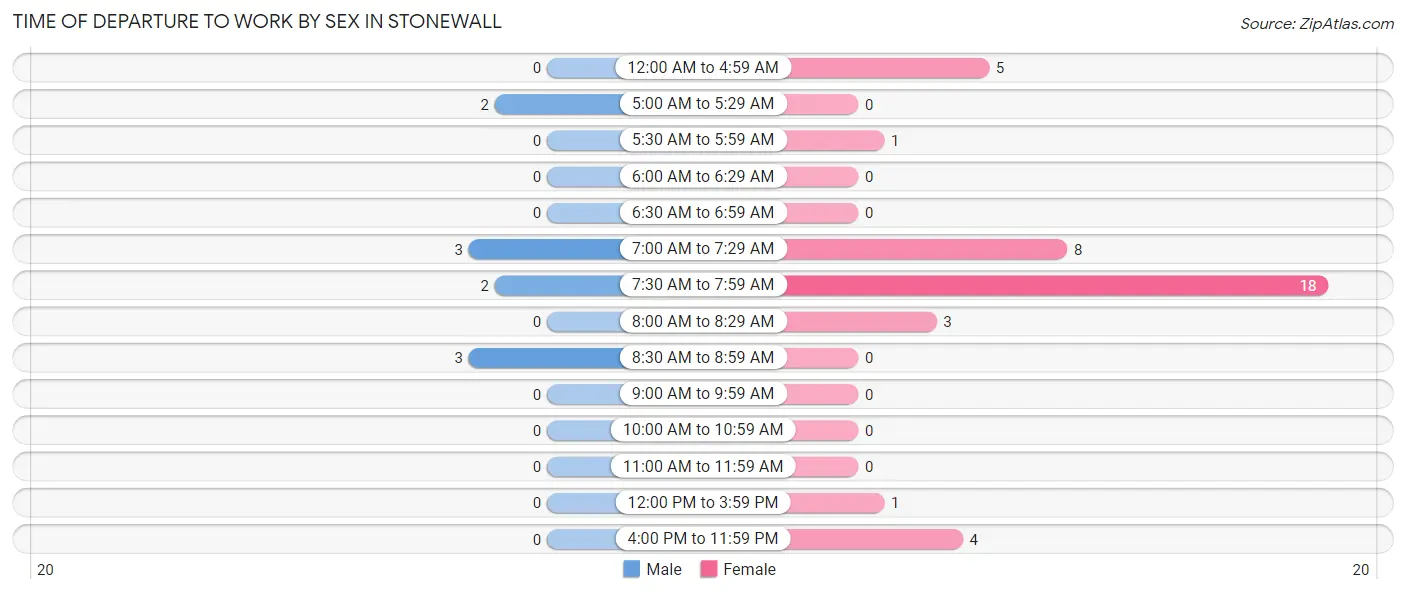
| Time of Departure | Male | Female |
| 12:00 AM to 4:59 AM | 0 (0.0%) | 5 (12.5%) |
| 5:00 AM to 5:29 AM | 2 (20.0%) | 0 (0.0%) |
| 5:30 AM to 5:59 AM | 0 (0.0%) | 1 (2.5%) |
| 6:00 AM to 6:29 AM | 0 (0.0%) | 0 (0.0%) |
| 6:30 AM to 6:59 AM | 0 (0.0%) | 0 (0.0%) |
| 7:00 AM to 7:29 AM | 3 (30.0%) | 8 (20.0%) |
| 7:30 AM to 7:59 AM | 2 (20.0%) | 18 (45.0%) |
| 8:00 AM to 8:29 AM | 0 (0.0%) | 3 (7.5%) |
| 8:30 AM to 8:59 AM | 3 (30.0%) | 0 (0.0%) |
| 9:00 AM to 9:59 AM | 0 (0.0%) | 0 (0.0%) |
| 10:00 AM to 10:59 AM | 0 (0.0%) | 0 (0.0%) |
| 11:00 AM to 11:59 AM | 0 (0.0%) | 0 (0.0%) |
| 12:00 PM to 3:59 PM | 0 (0.0%) | 1 (2.5%) |
| 4:00 PM to 11:59 PM | 0 (0.0%) | 4 (10.0%) |
| Total | 10 (100.0%) | 40 (100.0%) |
Housing Occupancy in Stonewall
Occupancy by Ownership in Stonewall
Of the total 142 dwellings in Stonewall, owner-occupied units account for 75 (52.8%), while renter-occupied units make up 67 (47.2%).
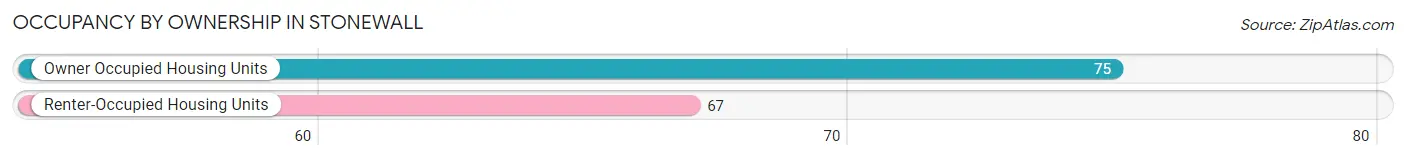
| Occupancy | # Housing Units | % Housing Units |
| Owner Occupied Housing Units | 75 | 52.8% |
| Renter-Occupied Housing Units | 67 | 47.2% |
| Total Occupied Housing Units | 142 | 100.0% |
Occupancy by Household Size in Stonewall
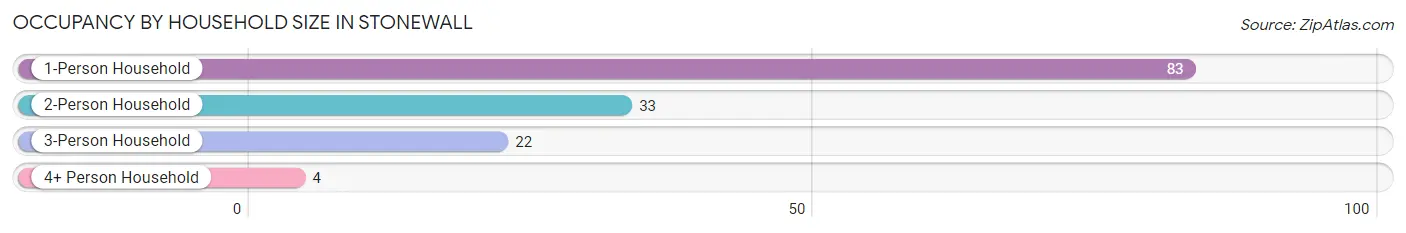
| Household Size | # Housing Units | % Housing Units |
| 1-Person Household | 83 | 58.5% |
| 2-Person Household | 33 | 23.2% |
| 3-Person Household | 22 | 15.5% |
| 4+ Person Household | 4 | 2.8% |
| Total Housing Units | 142 | 100.0% |
Occupancy by Ownership by Household Size in Stonewall
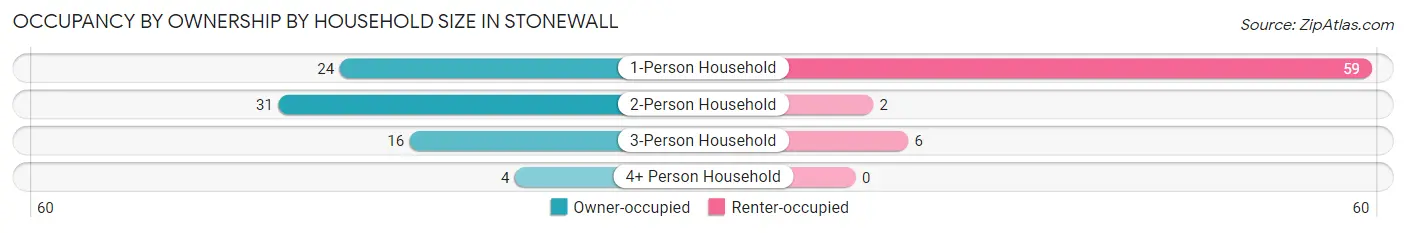
| Household Size | Owner-occupied | Renter-occupied |
| 1-Person Household | 24 (28.9%) | 59 (71.1%) |
| 2-Person Household | 31 (93.9%) | 2 (6.1%) |
| 3-Person Household | 16 (72.7%) | 6 (27.3%) |
| 4+ Person Household | 4 (100.0%) | 0 (0.0%) |
| Total Housing Units | 75 (52.8%) | 67 (47.2%) |
Occupancy by Educational Attainment in Stonewall
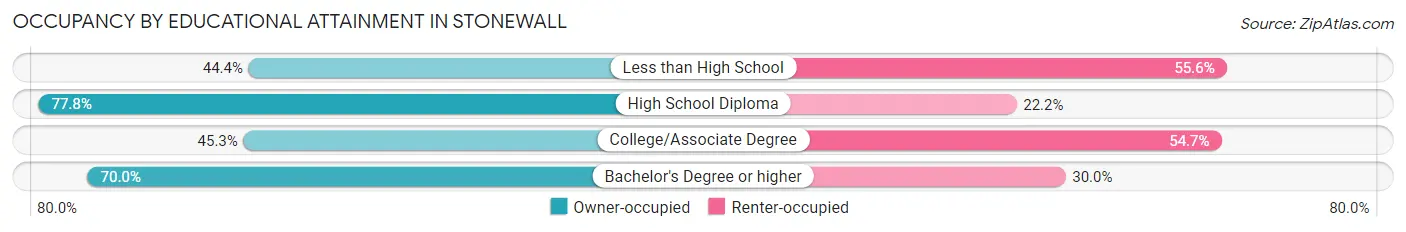
| Household Size | Owner-occupied | Renter-occupied |
| Less than High School | 4 (44.4%) | 5 (55.6%) |
| High School Diploma | 14 (77.8%) | 4 (22.2%) |
| College/Associate Degree | 43 (45.3%) | 52 (54.7%) |
| Bachelor's Degree or higher | 14 (70.0%) | 6 (30.0%) |
Occupancy by Age of Householder in Stonewall
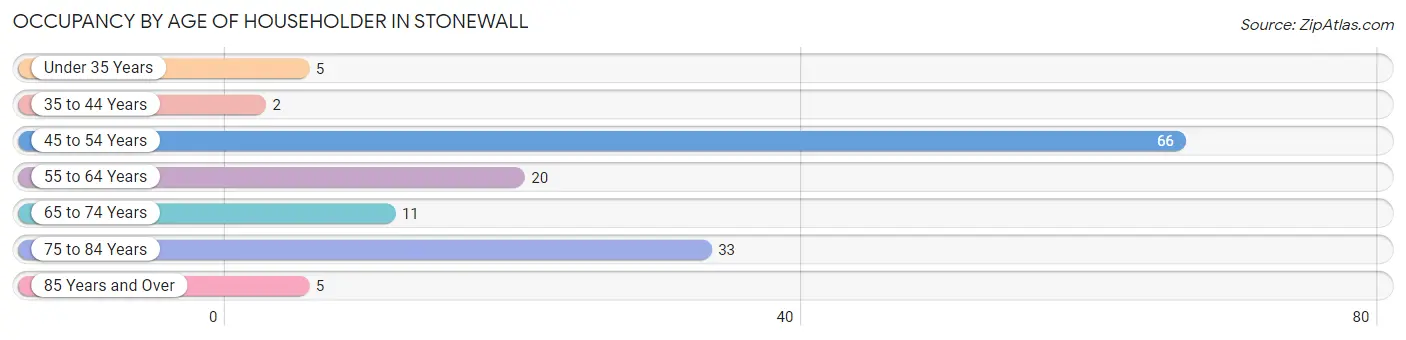
| Age Bracket | # Households | % Households |
| Under 35 Years | 5 | 3.5% |
| 35 to 44 Years | 2 | 1.4% |
| 45 to 54 Years | 66 | 46.5% |
| 55 to 64 Years | 20 | 14.1% |
| 65 to 74 Years | 11 | 7.7% |
| 75 to 84 Years | 33 | 23.2% |
| 85 Years and Over | 5 | 3.5% |
| Total | 142 | 100.0% |
Housing Finances in Stonewall
Median Income by Occupancy in Stonewall
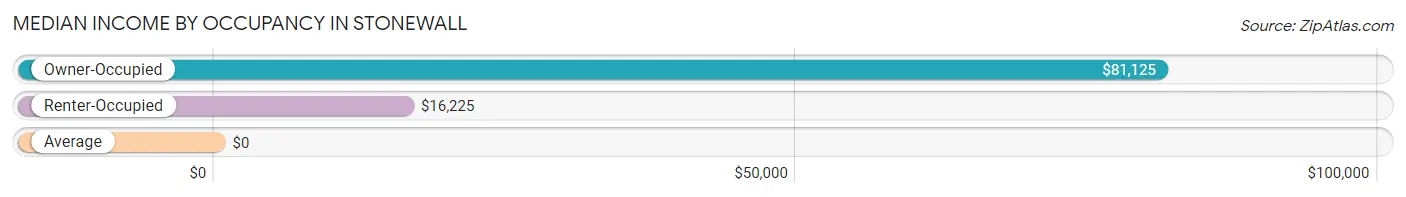
| Occupancy Type | # Households | Median Income |
| Owner-Occupied | 75 (52.8%) | $81,125 |
| Renter-Occupied | 67 (47.2%) | $16,225 |
| Average | 142 (100.0%) | $0 |
Occupancy by Householder Income Bracket in Stonewall
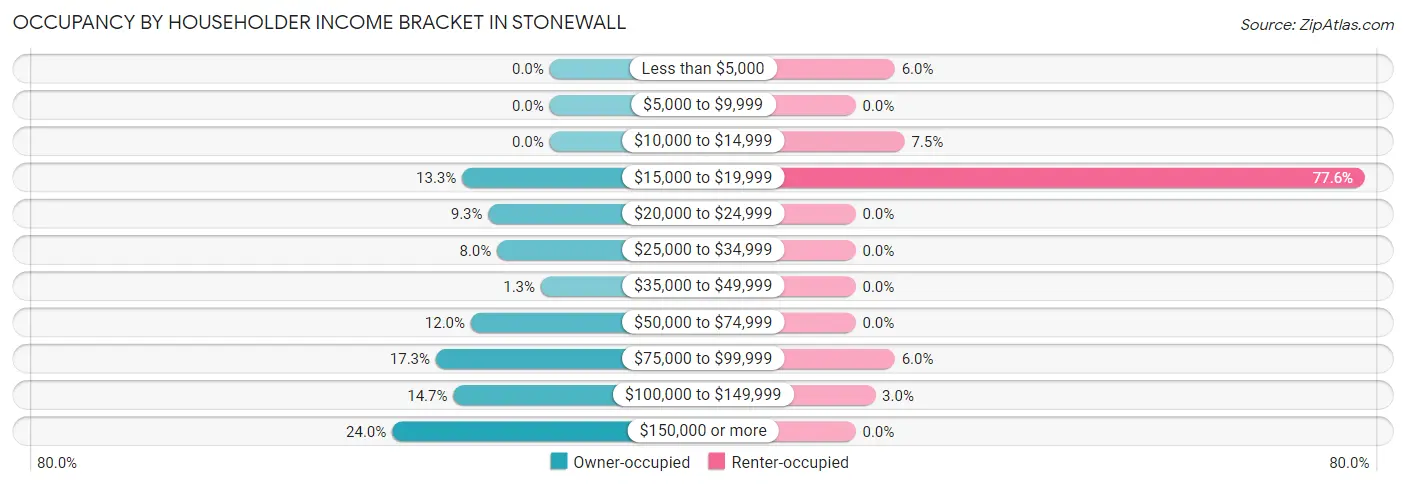
| Income Bracket | Owner-occupied | Renter-occupied |
| Less than $5,000 | 0 (0.0%) | 4 (6.0%) |
| $5,000 to $9,999 | 0 (0.0%) | 0 (0.0%) |
| $10,000 to $14,999 | 0 (0.0%) | 5 (7.5%) |
| $15,000 to $19,999 | 10 (13.3%) | 52 (77.6%) |
| $20,000 to $24,999 | 7 (9.3%) | 0 (0.0%) |
| $25,000 to $34,999 | 6 (8.0%) | 0 (0.0%) |
| $35,000 to $49,999 | 1 (1.3%) | 0 (0.0%) |
| $50,000 to $74,999 | 9 (12.0%) | 0 (0.0%) |
| $75,000 to $99,999 | 13 (17.3%) | 4 (6.0%) |
| $100,000 to $149,999 | 11 (14.7%) | 2 (3.0%) |
| $150,000 or more | 18 (24.0%) | 0 (0.0%) |
| Total | 75 (100.0%) | 67 (100.0%) |
Monthly Housing Cost Tiers in Stonewall
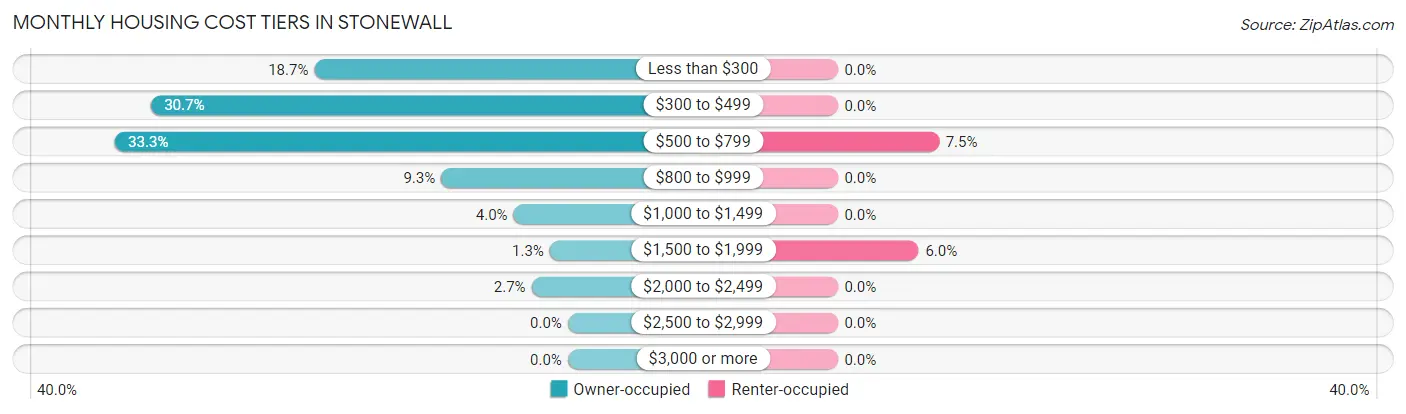
| Monthly Cost | Owner-occupied | Renter-occupied |
| Less than $300 | 14 (18.7%) | 0 (0.0%) |
| $300 to $499 | 23 (30.7%) | 0 (0.0%) |
| $500 to $799 | 25 (33.3%) | 5 (7.5%) |
| $800 to $999 | 7 (9.3%) | 0 (0.0%) |
| $1,000 to $1,499 | 3 (4.0%) | 0 (0.0%) |
| $1,500 to $1,999 | 1 (1.3%) | 4 (6.0%) |
| $2,000 to $2,499 | 2 (2.7%) | 0 (0.0%) |
| $2,500 to $2,999 | 0 (0.0%) | 0 (0.0%) |
| $3,000 or more | 0 (0.0%) | 0 (0.0%) |
| Total | 75 (100.0%) | 67 (100.0%) |
Physical Housing Characteristics in Stonewall
Housing Structures in Stonewall
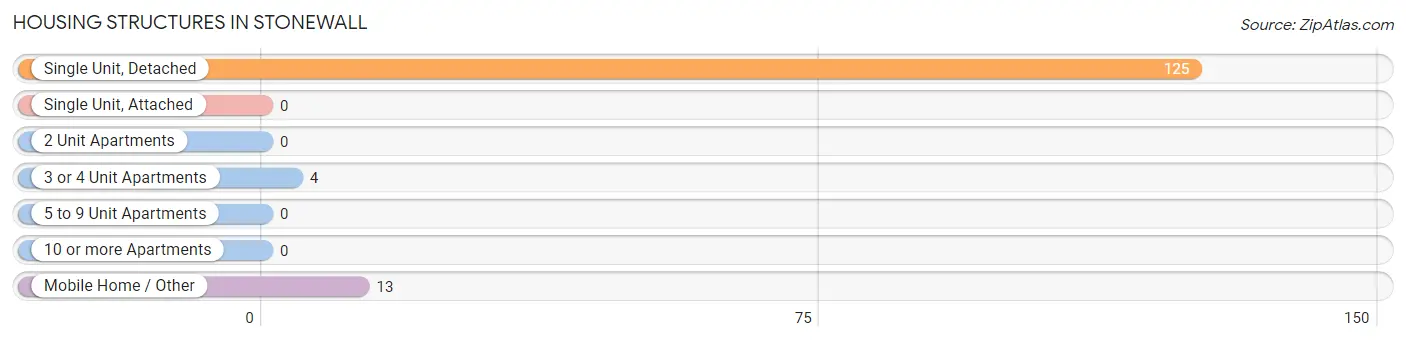
| Structure Type | # Housing Units | % Housing Units |
| Single Unit, Detached | 125 | 88.0% |
| Single Unit, Attached | 0 | 0.0% |
| 2 Unit Apartments | 0 | 0.0% |
| 3 or 4 Unit Apartments | 4 | 2.8% |
| 5 to 9 Unit Apartments | 0 | 0.0% |
| 10 or more Apartments | 0 | 0.0% |
| Mobile Home / Other | 13 | 9.1% |
| Total | 142 | 100.0% |
Housing Structures by Occupancy in Stonewall
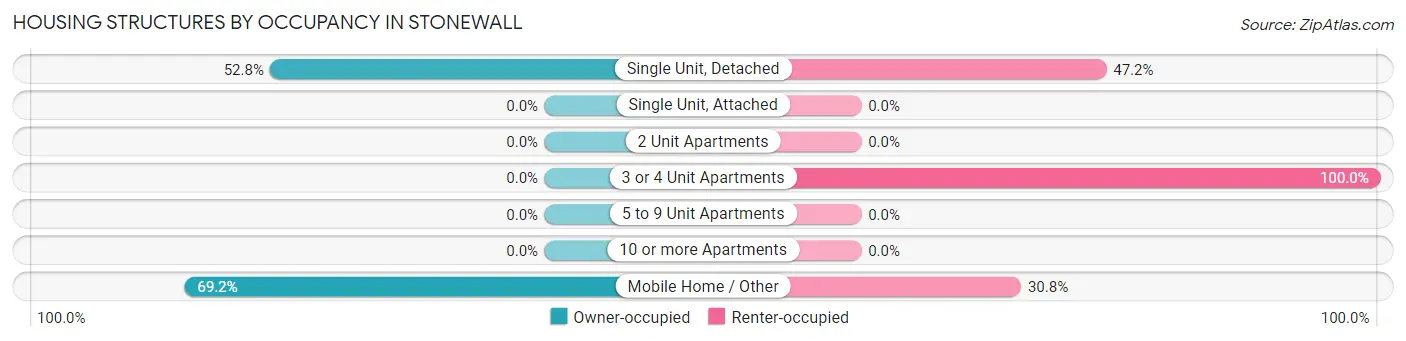
| Structure Type | Owner-occupied | Renter-occupied |
| Single Unit, Detached | 66 (52.8%) | 59 (47.2%) |
| Single Unit, Attached | 0 (0.0%) | 0 (0.0%) |
| 2 Unit Apartments | 0 (0.0%) | 0 (0.0%) |
| 3 or 4 Unit Apartments | 0 (0.0%) | 4 (100.0%) |
| 5 to 9 Unit Apartments | 0 (0.0%) | 0 (0.0%) |
| 10 or more Apartments | 0 (0.0%) | 0 (0.0%) |
| Mobile Home / Other | 9 (69.2%) | 4 (30.8%) |
| Total | 75 (52.8%) | 67 (47.2%) |
Housing Structures by Number of Rooms in Stonewall
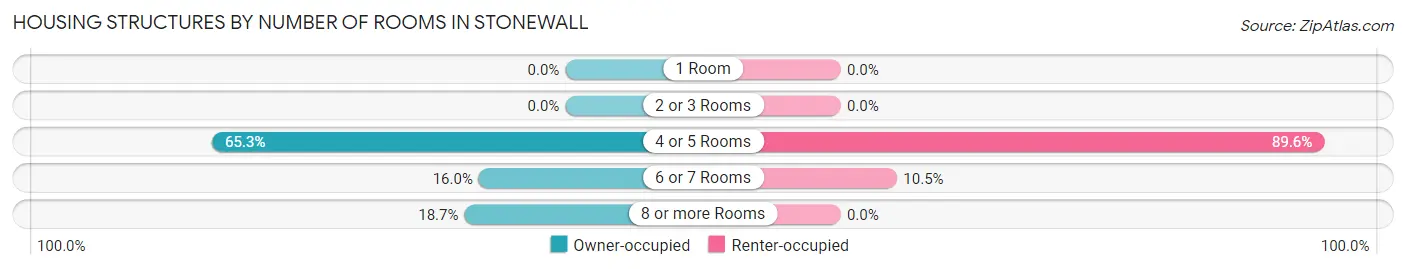
| Number of Rooms | Owner-occupied | Renter-occupied |
| 1 Room | 0 (0.0%) | 0 (0.0%) |
| 2 or 3 Rooms | 0 (0.0%) | 0 (0.0%) |
| 4 or 5 Rooms | 49 (65.3%) | 60 (89.5%) |
| 6 or 7 Rooms | 12 (16.0%) | 7 (10.4%) |
| 8 or more Rooms | 14 (18.7%) | 0 (0.0%) |
| Total | 75 (100.0%) | 67 (100.0%) |
Housing Structure by Heating Type in Stonewall
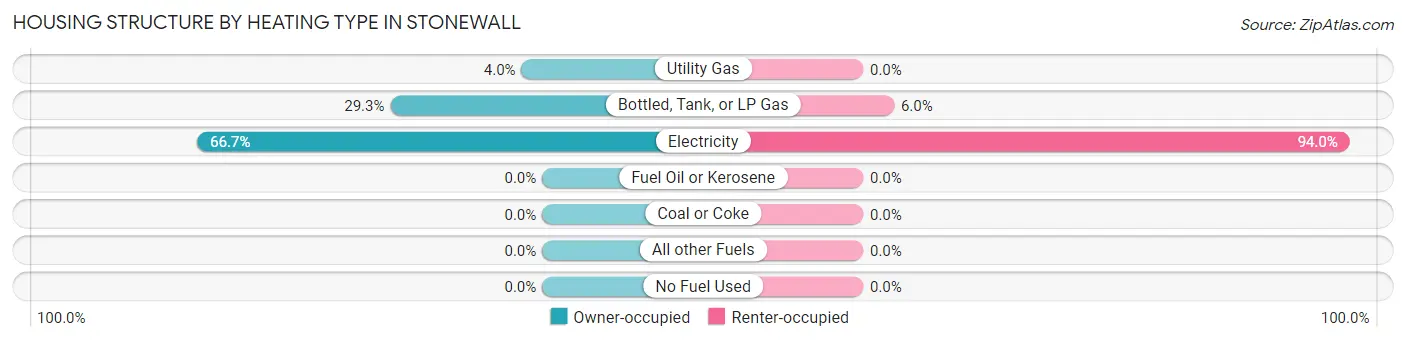
| Heating Type | Owner-occupied | Renter-occupied |
| Utility Gas | 3 (4.0%) | 0 (0.0%) |
| Bottled, Tank, or LP Gas | 22 (29.3%) | 4 (6.0%) |
| Electricity | 50 (66.7%) | 63 (94.0%) |
| Fuel Oil or Kerosene | 0 (0.0%) | 0 (0.0%) |
| Coal or Coke | 0 (0.0%) | 0 (0.0%) |
| All other Fuels | 0 (0.0%) | 0 (0.0%) |
| No Fuel Used | 0 (0.0%) | 0 (0.0%) |
| Total | 75 (100.0%) | 67 (100.0%) |
Household Vehicle Usage in Stonewall
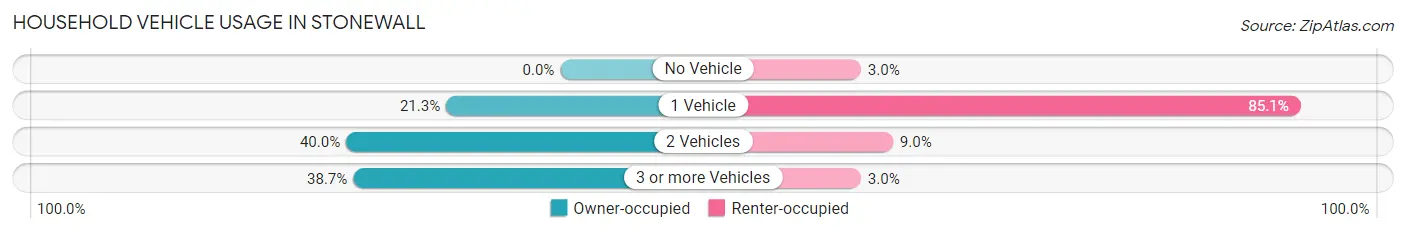
| Vehicles per Household | Owner-occupied | Renter-occupied |
| No Vehicle | 0 (0.0%) | 2 (3.0%) |
| 1 Vehicle | 16 (21.3%) | 57 (85.1%) |
| 2 Vehicles | 30 (40.0%) | 6 (9.0%) |
| 3 or more Vehicles | 29 (38.7%) | 2 (3.0%) |
| Total | 75 (100.0%) | 67 (100.0%) |
Real Estate & Mortgages in Stonewall
Real Estate and Mortgage Overview in Stonewall
| Characteristic | Without Mortgage | With Mortgage |
| Housing Units | 54 | 21 |
| Median Property Value | - | - |
| Median Household Income | $73,750 | $2 |
| Monthly Housing Costs | $444 | $0 |
| Real Estate Taxes | $591 | $0 |
Property Value by Mortgage Status in Stonewall
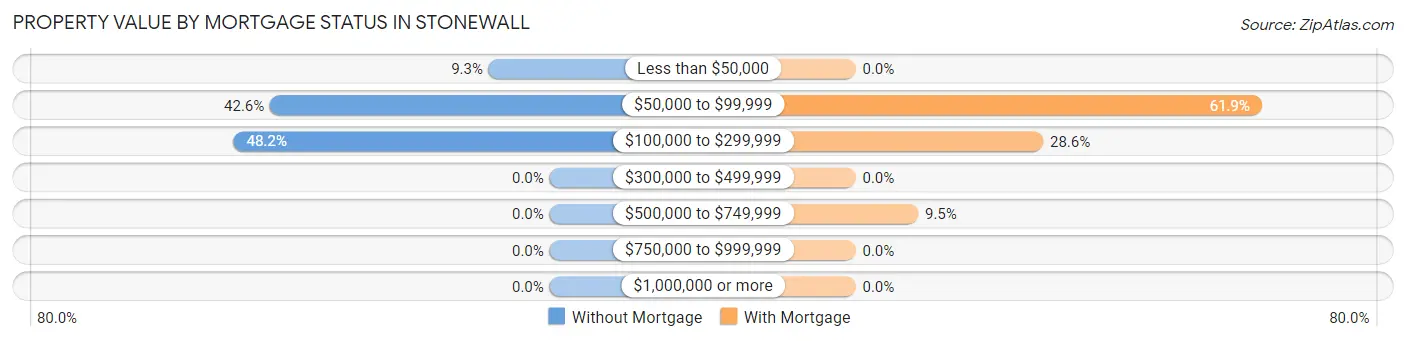
| Property Value | Without Mortgage | With Mortgage |
| Less than $50,000 | 5 (9.3%) | 0 (0.0%) |
| $50,000 to $99,999 | 23 (42.6%) | 13 (61.9%) |
| $100,000 to $299,999 | 26 (48.1%) | 6 (28.6%) |
| $300,000 to $499,999 | 0 (0.0%) | 0 (0.0%) |
| $500,000 to $749,999 | 0 (0.0%) | 2 (9.5%) |
| $750,000 to $999,999 | 0 (0.0%) | 0 (0.0%) |
| $1,000,000 or more | 0 (0.0%) | 0 (0.0%) |
| Total | 54 (100.0%) | 21 (100.0%) |
Household Income by Mortgage Status in Stonewall
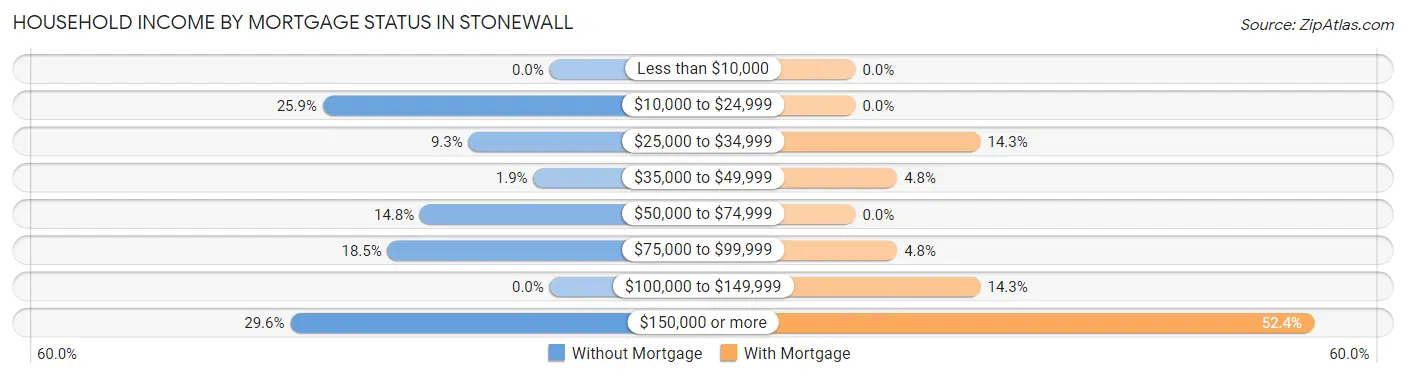
| Household Income | Without Mortgage | With Mortgage |
| Less than $10,000 | 0 (0.0%) | 0 (0.0%) |
| $10,000 to $24,999 | 14 (25.9%) | 0 (0.0%) |
| $25,000 to $34,999 | 5 (9.3%) | 3 (14.3%) |
| $35,000 to $49,999 | 1 (1.8%) | 1 (4.8%) |
| $50,000 to $74,999 | 8 (14.8%) | 0 (0.0%) |
| $75,000 to $99,999 | 10 (18.5%) | 1 (4.8%) |
| $100,000 to $149,999 | 0 (0.0%) | 3 (14.3%) |
| $150,000 or more | 16 (29.6%) | 11 (52.4%) |
| Total | 54 (100.0%) | 21 (100.0%) |
Property Value to Household Income Ratio in Stonewall
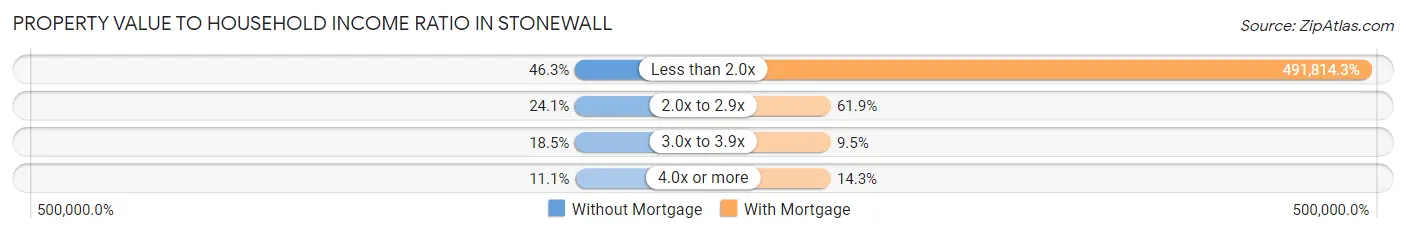
| Value-to-Income Ratio | Without Mortgage | With Mortgage |
| Less than 2.0x | 25 (46.3%) | 103,281 (491,814.3%) |
| 2.0x to 2.9x | 13 (24.1%) | 13 (61.9%) |
| 3.0x to 3.9x | 10 (18.5%) | 2 (9.5%) |
| 4.0x or more | 6 (11.1%) | 3 (14.3%) |
| Total | 54 (100.0%) | 21 (100.0%) |
Real Estate Taxes by Mortgage Status in Stonewall
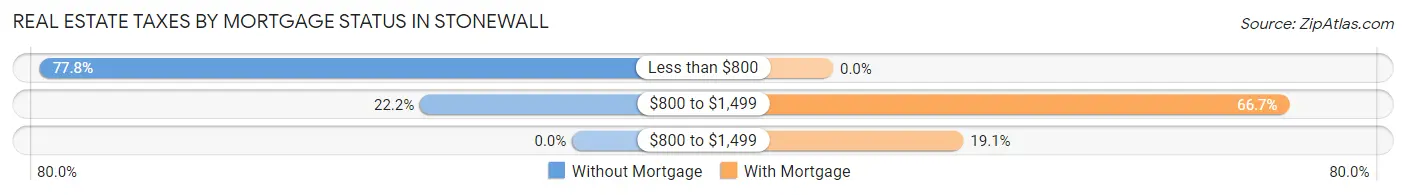
| Property Taxes | Without Mortgage | With Mortgage |
| Less than $800 | 42 (77.8%) | 0 (0.0%) |
| $800 to $1,499 | 12 (22.2%) | 14 (66.7%) |
| $800 to $1,499 | 0 (0.0%) | 4 (19.1%) |
| Total | 54 (100.0%) | 21 (100.0%) |
Health & Disability in Stonewall
Health Insurance Coverage by Age in Stonewall
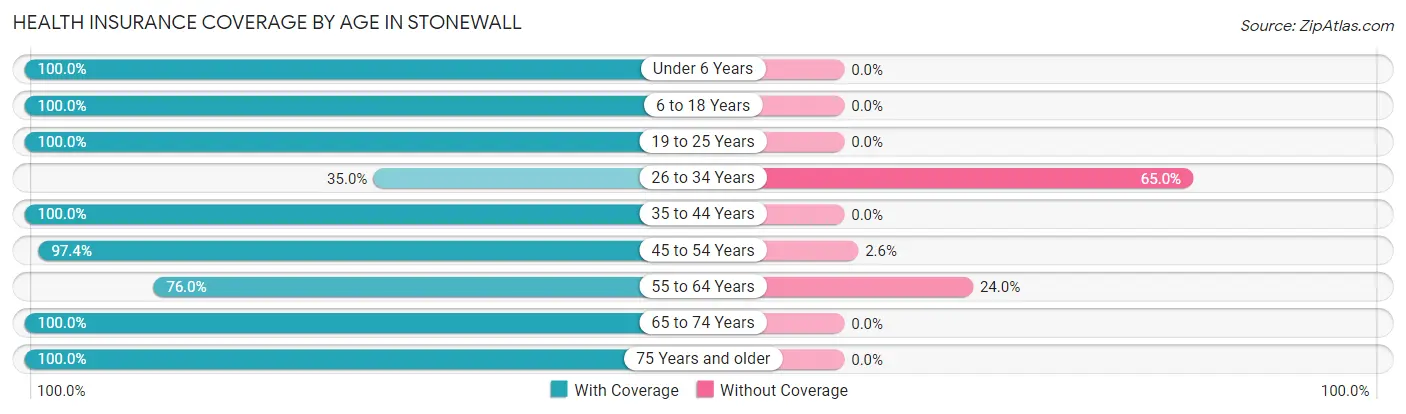
| Age Bracket | With Coverage | Without Coverage |
| Under 6 Years | 9 (100.0%) | 0 (0.0%) |
| 6 to 18 Years | 15 (100.0%) | 0 (0.0%) |
| 19 to 25 Years | 8 (100.0%) | 0 (0.0%) |
| 26 to 34 Years | 7 (35.0%) | 13 (65.0%) |
| 35 to 44 Years | 4 (100.0%) | 0 (0.0%) |
| 45 to 54 Years | 75 (97.4%) | 2 (2.6%) |
| 55 to 64 Years | 19 (76.0%) | 6 (24.0%) |
| 65 to 74 Years | 25 (100.0%) | 0 (0.0%) |
| 75 Years and older | 46 (100.0%) | 0 (0.0%) |
| Total | 208 (90.8%) | 21 (9.2%) |
Health Insurance Coverage by Citizenship Status in Stonewall
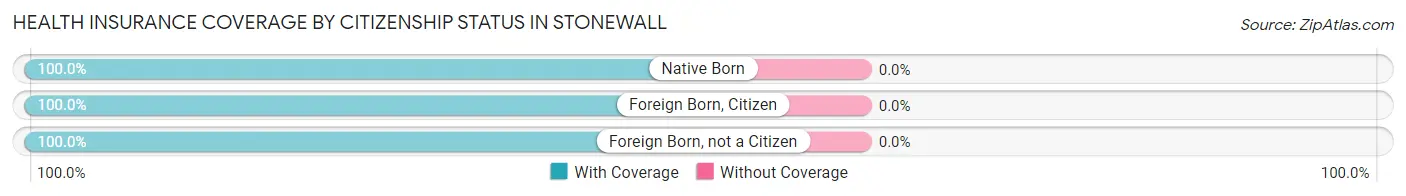
| Citizenship Status | With Coverage | Without Coverage |
| Native Born | 9 (100.0%) | 0 (0.0%) |
| Foreign Born, Citizen | 15 (100.0%) | 0 (0.0%) |
| Foreign Born, not a Citizen | 8 (100.0%) | 0 (0.0%) |
Health Insurance Coverage by Household Income in Stonewall
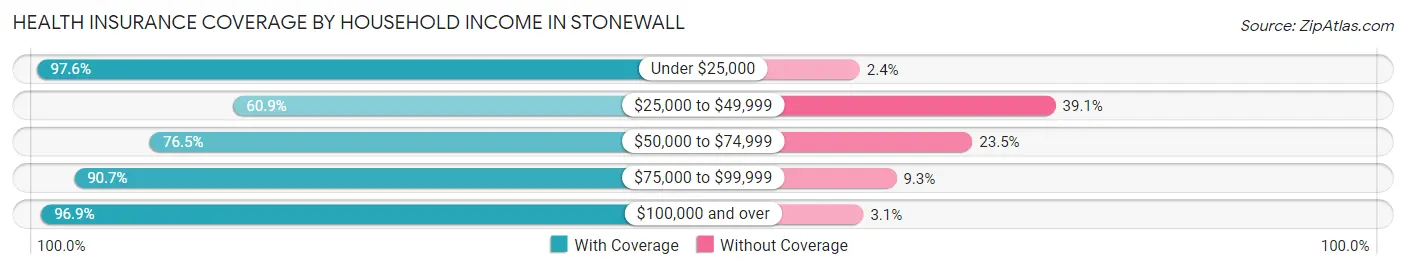
| Household Income | With Coverage | Without Coverage |
| Under $25,000 | 80 (97.6%) | 2 (2.4%) |
| $25,000 to $49,999 | 14 (60.9%) | 9 (39.1%) |
| $50,000 to $74,999 | 13 (76.5%) | 4 (23.5%) |
| $75,000 to $99,999 | 39 (90.7%) | 4 (9.3%) |
| $100,000 and over | 62 (96.9%) | 2 (3.1%) |
Public vs Private Health Insurance Coverage by Age in Stonewall
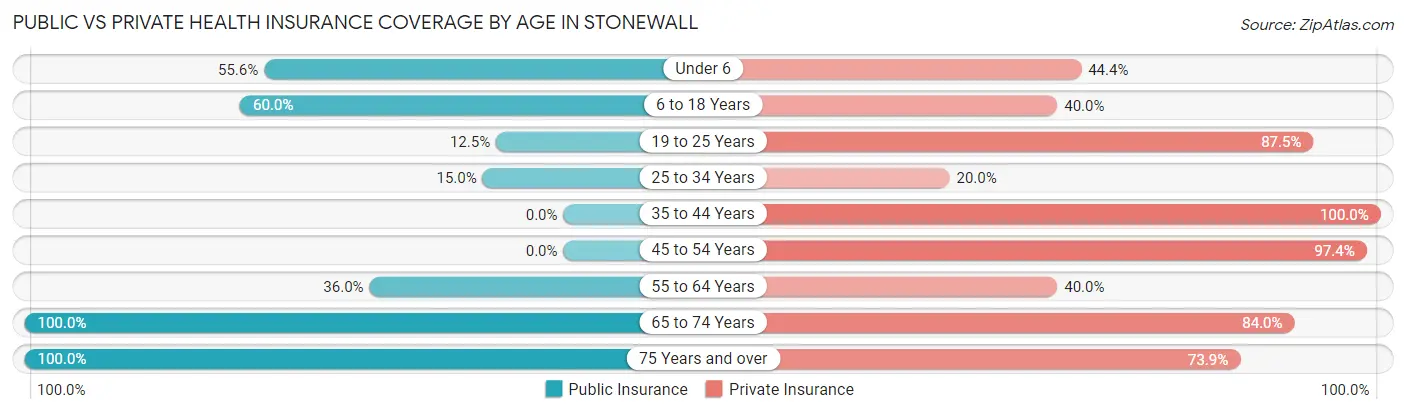
| Age Bracket | Public Insurance | Private Insurance |
| Under 6 | 5 (55.6%) | 4 (44.4%) |
| 6 to 18 Years | 9 (60.0%) | 6 (40.0%) |
| 19 to 25 Years | 1 (12.5%) | 7 (87.5%) |
| 25 to 34 Years | 3 (15.0%) | 4 (20.0%) |
| 35 to 44 Years | 0 (0.0%) | 4 (100.0%) |
| 45 to 54 Years | 0 (0.0%) | 75 (97.4%) |
| 55 to 64 Years | 9 (36.0%) | 10 (40.0%) |
| 65 to 74 Years | 25 (100.0%) | 21 (84.0%) |
| 75 Years and over | 46 (100.0%) | 34 (73.9%) |
| Total | 98 (42.8%) | 165 (72.1%) |
Disability Status by Sex by Age in Stonewall
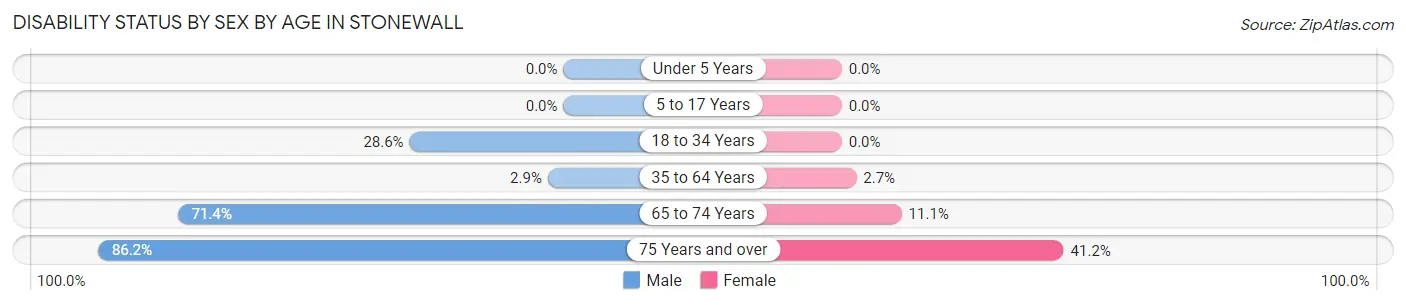
| Age Bracket | Male | Female |
| Under 5 Years | 0 (0.0%) | 0 (0.0%) |
| 5 to 17 Years | 0 (0.0%) | 0 (0.0%) |
| 18 to 34 Years | 2 (28.6%) | 0 (0.0%) |
| 35 to 64 Years | 2 (2.9%) | 1 (2.7%) |
| 65 to 74 Years | 5 (71.4%) | 2 (11.1%) |
| 75 Years and over | 25 (86.2%) | 7 (41.2%) |
Disability Class by Sex by Age in Stonewall
Disability Class: Hearing Difficulty
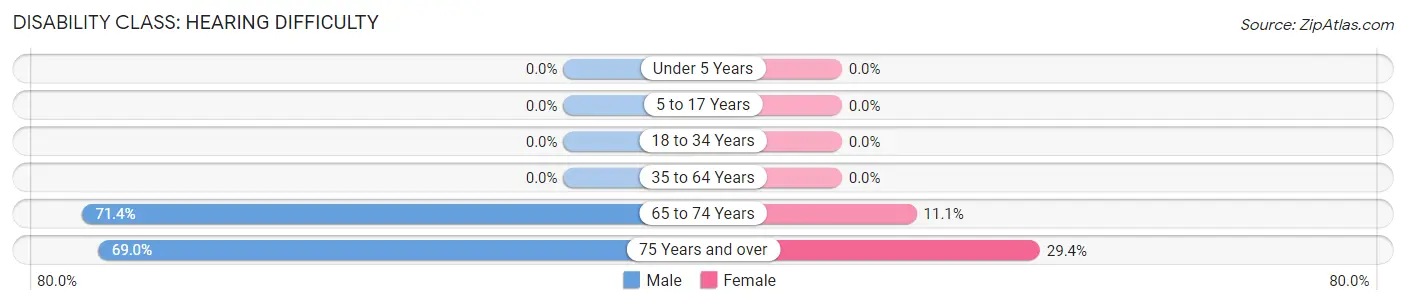
| Age Bracket | Male | Female |
| Under 5 Years | 0 (0.0%) | 0 (0.0%) |
| 5 to 17 Years | 0 (0.0%) | 0 (0.0%) |
| 18 to 34 Years | 0 (0.0%) | 0 (0.0%) |
| 35 to 64 Years | 0 (0.0%) | 0 (0.0%) |
| 65 to 74 Years | 5 (71.4%) | 2 (11.1%) |
| 75 Years and over | 20 (69.0%) | 5 (29.4%) |
Disability Class: Vision Difficulty
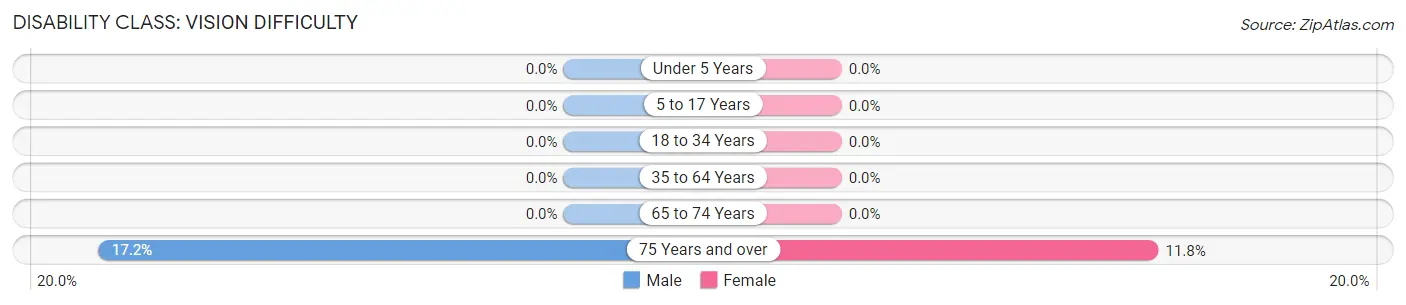
| Age Bracket | Male | Female |
| Under 5 Years | 0 (0.0%) | 0 (0.0%) |
| 5 to 17 Years | 0 (0.0%) | 0 (0.0%) |
| 18 to 34 Years | 0 (0.0%) | 0 (0.0%) |
| 35 to 64 Years | 0 (0.0%) | 0 (0.0%) |
| 65 to 74 Years | 0 (0.0%) | 0 (0.0%) |
| 75 Years and over | 5 (17.2%) | 2 (11.8%) |
Disability Class: Cognitive Difficulty
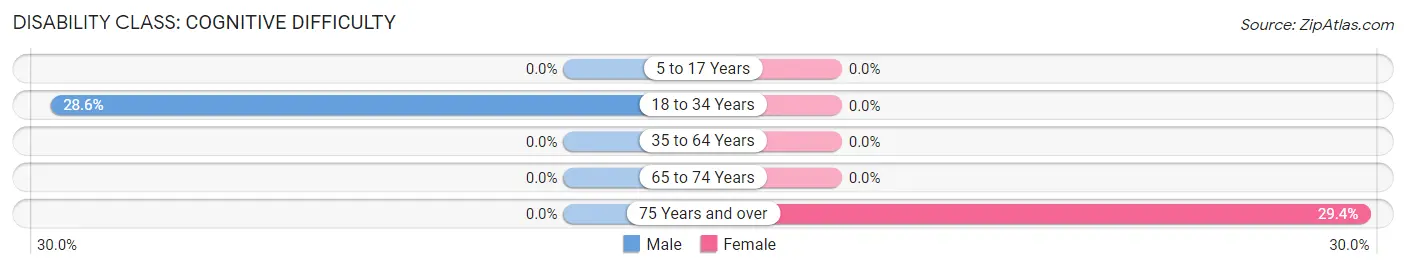
| Age Bracket | Male | Female |
| 5 to 17 Years | 0 (0.0%) | 0 (0.0%) |
| 18 to 34 Years | 2 (28.6%) | 0 (0.0%) |
| 35 to 64 Years | 0 (0.0%) | 0 (0.0%) |
| 65 to 74 Years | 0 (0.0%) | 0 (0.0%) |
| 75 Years and over | 0 (0.0%) | 5 (29.4%) |
Disability Class: Ambulatory Difficulty
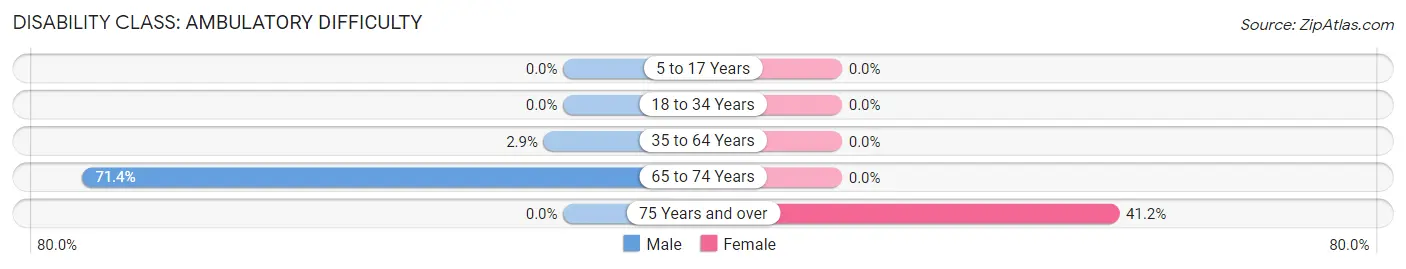
| Age Bracket | Male | Female |
| 5 to 17 Years | 0 (0.0%) | 0 (0.0%) |
| 18 to 34 Years | 0 (0.0%) | 0 (0.0%) |
| 35 to 64 Years | 2 (2.9%) | 0 (0.0%) |
| 65 to 74 Years | 5 (71.4%) | 0 (0.0%) |
| 75 Years and over | 0 (0.0%) | 7 (41.2%) |
Disability Class: Self-Care Difficulty
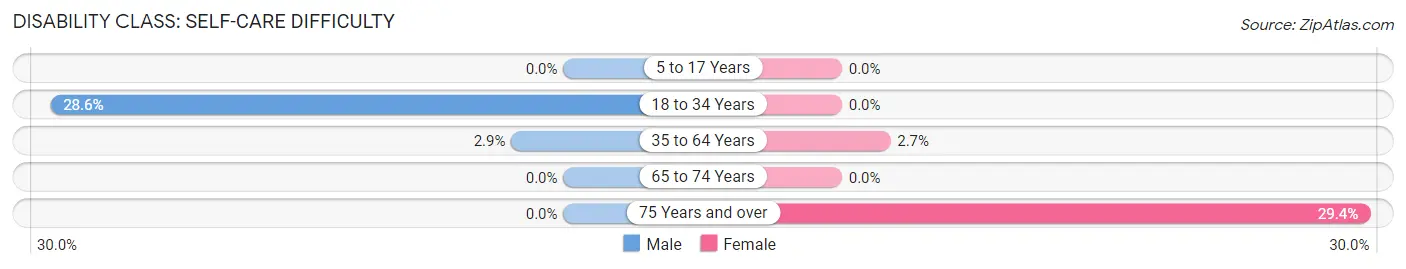
| Age Bracket | Male | Female |
| 5 to 17 Years | 0 (0.0%) | 0 (0.0%) |
| 18 to 34 Years | 2 (28.6%) | 0 (0.0%) |
| 35 to 64 Years | 2 (2.9%) | 1 (2.7%) |
| 65 to 74 Years | 0 (0.0%) | 0 (0.0%) |
| 75 Years and over | 0 (0.0%) | 5 (29.4%) |
Technology Access in Stonewall
Computing Device Access in Stonewall
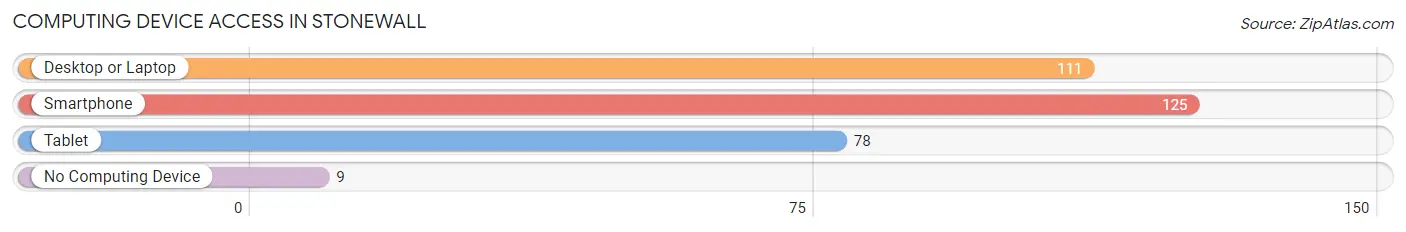
| Device Type | # Households | % Households |
| Desktop or Laptop | 111 | 78.2% |
| Smartphone | 125 | 88.0% |
| Tablet | 78 | 54.9% |
| No Computing Device | 9 | 6.3% |
| Total | 142 | 100.0% |
Internet Access in Stonewall
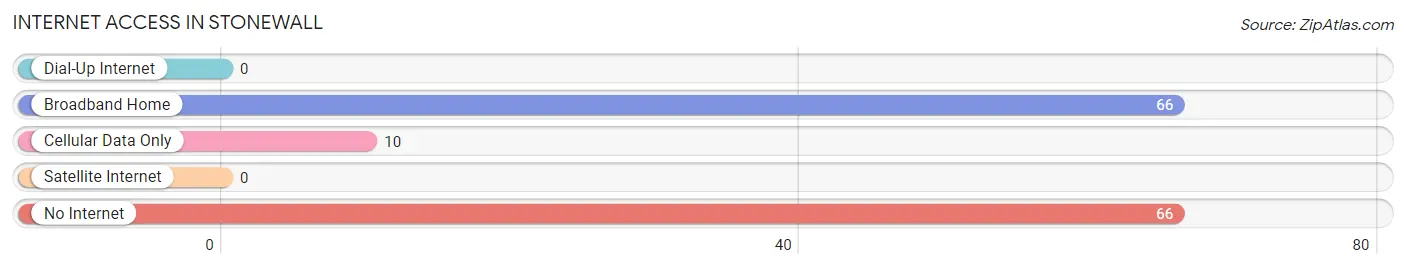
| Internet Type | # Households | % Households |
| Dial-Up Internet | 0 | 0.0% |
| Broadband Home | 66 | 46.5% |
| Cellular Data Only | 10 | 7.0% |
| Satellite Internet | 0 | 0.0% |
| No Internet | 66 | 46.5% |
| Total | 142 | 100.0% |
Stonewall Summary
Stonewall, North Carolina is a small town located in the foothills of the Blue Ridge Mountains in Wilkes County. The town was founded in 1845 and named after the nearby Stonewall Jackson Monument. The town is located on the banks of the Yadkin River and is home to a population of approximately 1,000 people.
Geography
Stonewall is located in the foothills of the Blue Ridge Mountains in Wilkes County, North Carolina. The town is situated on the banks of the Yadkin River and is surrounded by rolling hills and lush forests. The town is located approximately 30 miles north of Winston-Salem and is accessible via US Highway 421.
Climate
Stonewall has a humid subtropical climate with hot, humid summers and mild winters. The average annual temperature is around 60 degrees Fahrenheit. The average annual precipitation is around 45 inches.
Demographics
As of the 2010 census, the population of Stonewall was 1,000 people. The racial makeup of the town was 97.2% White, 0.7% African American, 0.3% Native American, 0.2% Asian, 0.1% Pacific Islander, 0.7% from other races, and 0.9% from two or more races. Hispanic or Latino of any race were 1.7% of the population.
Economy
Stonewall’s economy is largely based on agriculture and tourism. The town is home to several farms and orchards, as well as a number of wineries and vineyards. The town is also home to several small businesses, including restaurants, shops, and galleries.
Tourism is an important part of the local economy. The town is home to several historic sites, including the Stonewall Jackson Monument, the Wilkes County Courthouse, and the Wilkes County Museum. The town is also home to several outdoor recreation areas, including the Yadkin River Greenway and the Stone Mountain State Park.
History
Stonewall was founded in 1845 and named after the nearby Stonewall Jackson Monument. The town was originally a small farming community, but it began to grow in the late 19th century when the railroad was built through the area. The town was incorporated in 1891 and has remained relatively unchanged since then.
In the early 20th century, Stonewall was a popular tourist destination, with visitors coming to see the Stonewall Jackson Monument and the nearby Stone Mountain State Park. The town was also home to several mills and factories, which provided employment for many of the town’s residents.
In the late 20th century, Stonewall began to decline as the mills and factories closed and the population began to decline. However, in recent years, the town has seen a resurgence in tourism and the local economy has begun to recover.
Conclusion
Stonewall, North Carolina is a small town located in the foothills of the Blue Ridge Mountains in Wilkes County. The town was founded in 1845 and is home to a population of approximately 1,000 people. The town’s economy is largely based on agriculture and tourism, and the town is home to several historic sites and outdoor recreation areas. In recent years, the town has seen a resurgence in tourism and the local economy has begun to recover.
Common Questions
What is Per Capita Income in Stonewall?
Per Capita income in Stonewall is $37,921.
What is Income or Wage Gap in Stonewall?
Income or Wage Gap in Stonewall is 63.8%.
Women in Stonewall earn 36.2 cents for every dollar earned by a man.
What is Inequality or Gini Index in Stonewall?
Inequality or Gini Index in Stonewall is 0.54.
What is the Total Population of Stonewall?
Total Population of Stonewall is 229.
What is the Total Male Population of Stonewall?
Total Male Population of Stonewall is 127.
What is the Total Female Population of Stonewall?
Total Female Population of Stonewall is 102.
What is the Ratio of Males per 100 Females in Stonewall?
There are 124.51 Males per 100 Females in Stonewall.
What is the Ratio of Females per 100 Males in Stonewall?
There are 80.31 Females per 100 Males in Stonewall.
What is the Median Population Age in Stonewall?
Median Population Age in Stonewall is 49.9 Years.
What is the Average Family Size in Stonewall
Average Family Size in Stonewall is 2.5 People.
What is the Average Household Size in Stonewall
Average Household Size in Stonewall is 1.6 People.
How Large is the Labor Force in Stonewall?
There are 123 People in the Labor Forcein in Stonewall.
What is the Percentage of People in the Labor Force in Stonewall?
58.3% of People are in the Labor Force in Stonewall.
What is the Unemployment Rate in Stonewall?
Unemployment Rate in Stonewall is 40.7%.