Zip Codes with the Highest Percentage of Population Employed in Health Diagnosing & Treating in Kannapolis, NC
RELATED REPORTS & OPTIONS
Health Diagnosing & Treating
Kannapolis
Compare Zip Codes
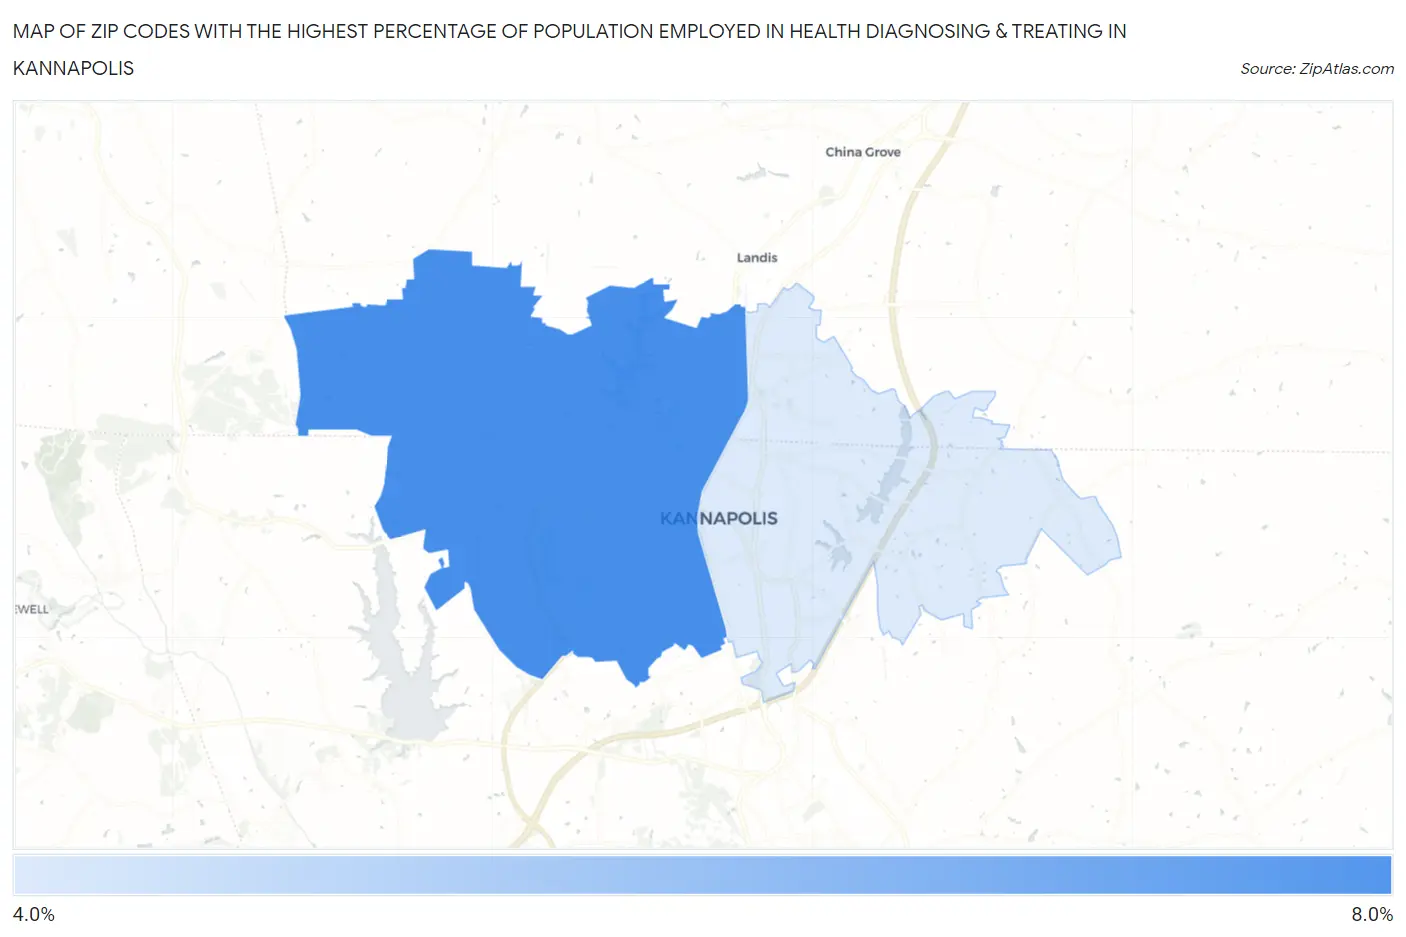
Map of Zip Codes with the Highest Percentage of Population Employed in Health Diagnosing & Treating in Kannapolis
4.5%
7.2%
Zip Codes with the Highest Percentage of Population Employed in Health Diagnosing & Treating in Kannapolis, NC
| Zip Code | % Employed | vs State | vs National | |
| 1. | 28081 | 7.2% | 6.4%(+0.815)#246 | 6.2%(+0.992)#9,604 |
| 2. | 28083 | 4.5% | 6.4%(-1.89)#517 | 6.2%(-1.71)#19,513 |
1
Common Questions
What are the Top Zip Codes with the Highest Percentage of Population Employed in Health Diagnosing & Treating in Kannapolis, NC?
Top Zip Codes with the Highest Percentage of Population Employed in Health Diagnosing & Treating in Kannapolis, NC are:
What zip code has the Highest Percentage of Population Employed in Health Diagnosing & Treating in Kannapolis, NC?
28081 has the Highest Percentage of Population Employed in Health Diagnosing & Treating in Kannapolis, NC with 7.2%.
What is the Percentage of Population Employed in Health Diagnosing & Treating in Kannapolis, NC?
Percentage of Population Employed in Health Diagnosing & Treating in Kannapolis is 6.5%.
What is the Percentage of Population Employed in Health Diagnosing & Treating in North Carolina?
Percentage of Population Employed in Health Diagnosing & Treating in North Carolina is 6.4%.
What is the Percentage of Population Employed in Health Diagnosing & Treating in the United States?
Percentage of Population Employed in Health Diagnosing & Treating in the United States is 6.2%.