Zip Codes with the Highest Percentage of Population Employed in Health Diagnosing & Treating in Hendersonville, NC
RELATED REPORTS & OPTIONS
Health Diagnosing & Treating
Hendersonville
Compare Zip Codes
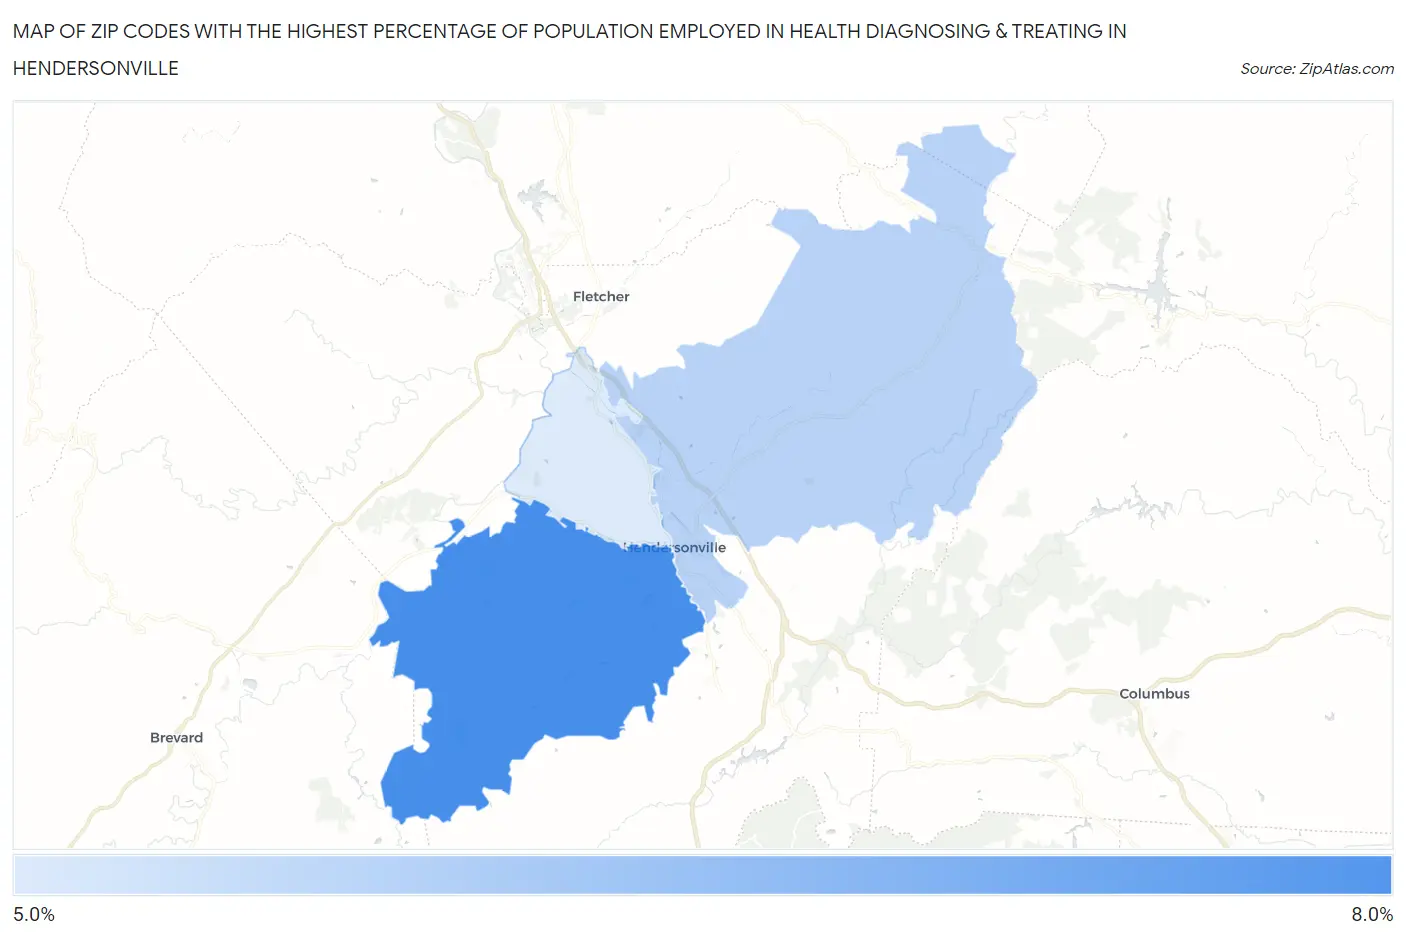
Map of Zip Codes with the Highest Percentage of Population Employed in Health Diagnosing & Treating in Hendersonville
5.7%
6.8%
Zip Codes with the Highest Percentage of Population Employed in Health Diagnosing & Treating in Hendersonville, NC
| Zip Code | % Employed | vs State | vs National | |
| 1. | 28739 | 6.8% | 6.4%(+0.420)#285 | 6.2%(+0.596)#10,874 |
| 2. | 28792 | 6.0% | 6.4%(-0.431)#364 | 6.2%(-0.255)#13,906 |
| 3. | 28791 | 5.7% | 6.4%(-0.707)#402 | 6.2%(-0.530)#14,925 |
1
Common Questions
What are the Top Zip Codes with the Highest Percentage of Population Employed in Health Diagnosing & Treating in Hendersonville, NC?
Top Zip Codes with the Highest Percentage of Population Employed in Health Diagnosing & Treating in Hendersonville, NC are:
What zip code has the Highest Percentage of Population Employed in Health Diagnosing & Treating in Hendersonville, NC?
28739 has the Highest Percentage of Population Employed in Health Diagnosing & Treating in Hendersonville, NC with 6.8%.
What is the Percentage of Population Employed in Health Diagnosing & Treating in Hendersonville, NC?
Percentage of Population Employed in Health Diagnosing & Treating in Hendersonville is 5.7%.
What is the Percentage of Population Employed in Health Diagnosing & Treating in North Carolina?
Percentage of Population Employed in Health Diagnosing & Treating in North Carolina is 6.4%.
What is the Percentage of Population Employed in Health Diagnosing & Treating in the United States?
Percentage of Population Employed in Health Diagnosing & Treating in the United States is 6.2%.