Zip Codes with the Highest Percentage of Population Employed in Health Diagnosing & Treating in Kinston, NC
RELATED REPORTS & OPTIONS
Health Diagnosing & Treating
Kinston
Compare Zip Codes
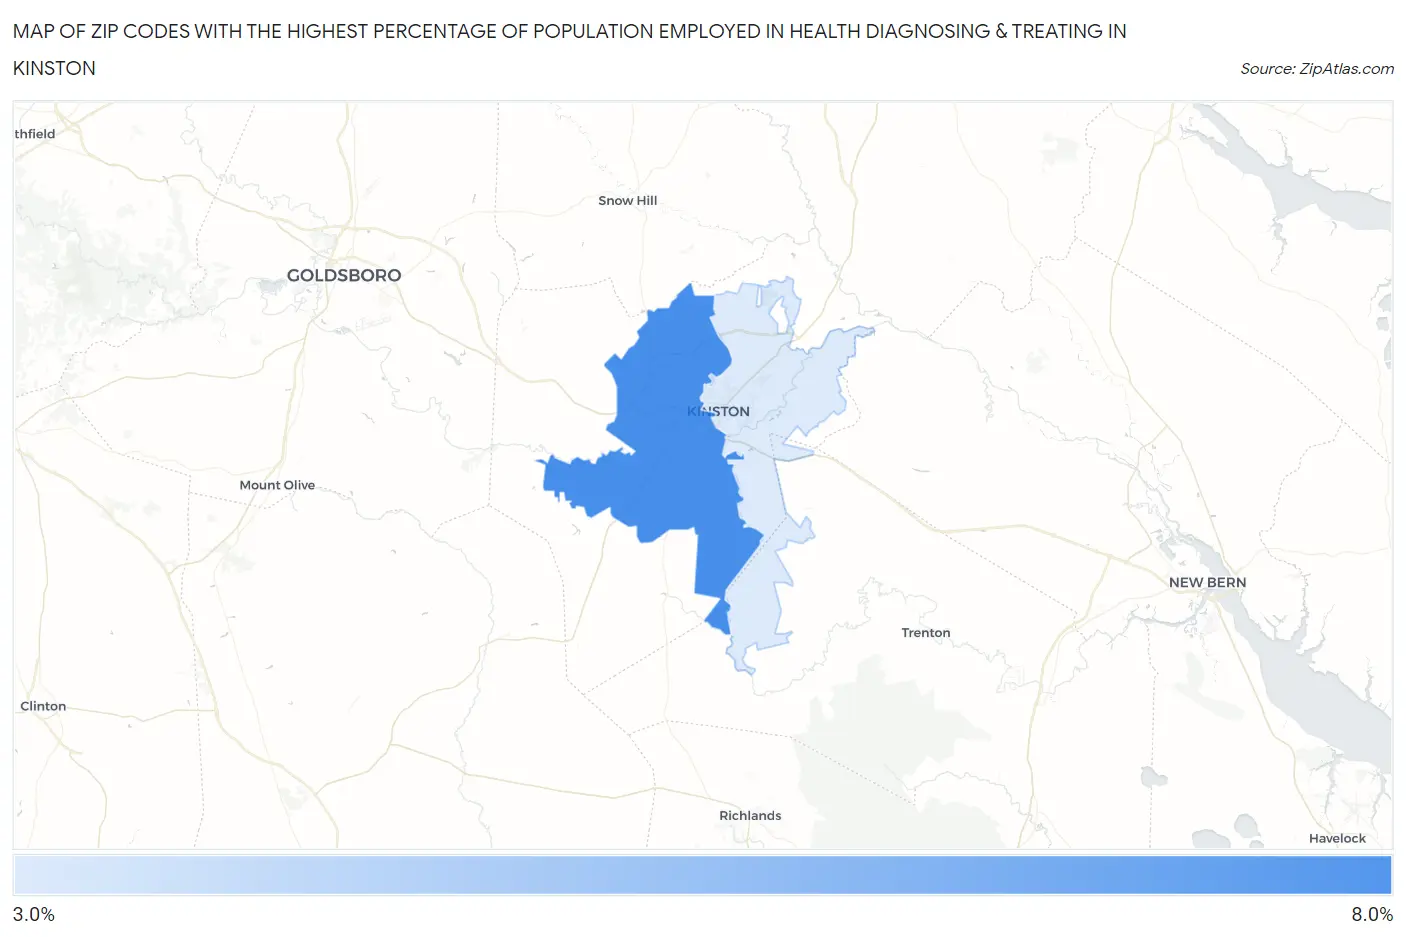
Map of Zip Codes with the Highest Percentage of Population Employed in Health Diagnosing & Treating in Kinston
3.9%
7.7%
Zip Codes with the Highest Percentage of Population Employed in Health Diagnosing & Treating in Kinston, NC
| Zip Code | % Employed | vs State | vs National | |
| 1. | 28504 | 7.7% | 6.4%(+1.28)#211 | 6.2%(+1.45)#8,243 |
| 2. | 28501 | 3.9% | 6.4%(-2.52)#578 | 6.2%(-2.34)#21,676 |
1
Common Questions
What are the Top Zip Codes with the Highest Percentage of Population Employed in Health Diagnosing & Treating in Kinston, NC?
Top Zip Codes with the Highest Percentage of Population Employed in Health Diagnosing & Treating in Kinston, NC are:
What zip code has the Highest Percentage of Population Employed in Health Diagnosing & Treating in Kinston, NC?
28504 has the Highest Percentage of Population Employed in Health Diagnosing & Treating in Kinston, NC with 7.7%.
What is the Percentage of Population Employed in Health Diagnosing & Treating in Kinston, NC?
Percentage of Population Employed in Health Diagnosing & Treating in Kinston is 5.3%.
What is the Percentage of Population Employed in Health Diagnosing & Treating in North Carolina?
Percentage of Population Employed in Health Diagnosing & Treating in North Carolina is 6.4%.
What is the Percentage of Population Employed in Health Diagnosing & Treating in the United States?
Percentage of Population Employed in Health Diagnosing & Treating in the United States is 6.2%.