River Bend, NC Map & Demographics
River Bend Map
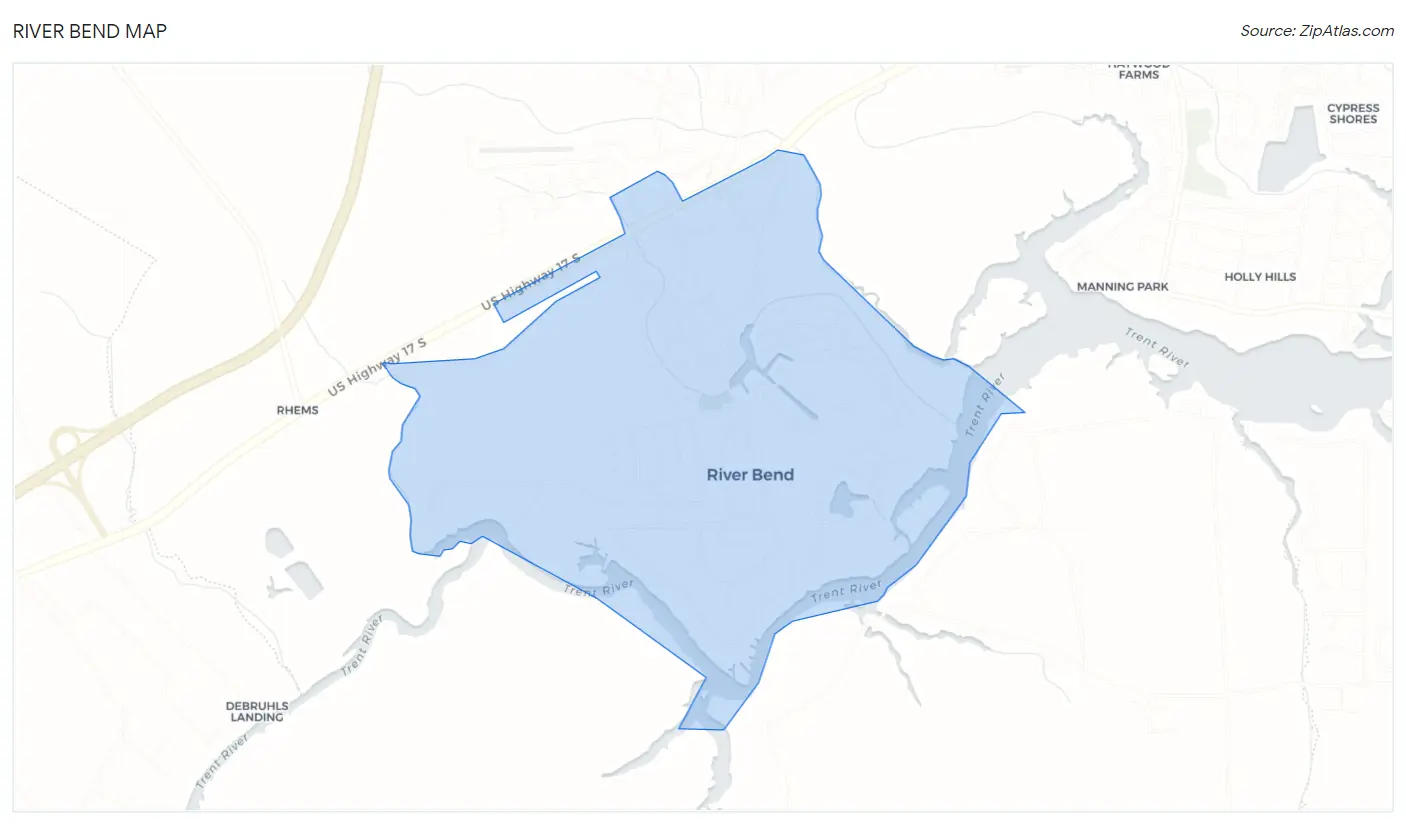
River Bend Overview
$39,150
PER CAPITA INCOME
$100,417
AVG FAMILY INCOME
$74,375
AVG HOUSEHOLD INCOME
29.2%
WAGE / INCOME GAP [ % ]
70.8¢/ $1
WAGE / INCOME GAP [ $ ]
0.35
INEQUALITY / GINI INDEX
2,914
TOTAL POPULATION
1,313
MALE POPULATION
1,601
FEMALE POPULATION
82.01
MALES / 100 FEMALES
121.93
FEMALES / 100 MALES
51.0
MEDIAN AGE
2.5
AVG FAMILY SIZE
2.1
AVG HOUSEHOLD SIZE
1,163
LABOR FORCE [ PEOPLE ]
43.1%
PERCENT IN LABOR FORCE
1.2%
UNEMPLOYMENT RATE
Income in River Bend
Income Overview in River Bend
Per Capita Income in River Bend is $39,150, while median incomes of families and households are $100,417 and $74,375 respectively.
| Characteristic | Number | Measure |
| Per Capita Income | 2,914 | $39,150 |
| Median Family Income | 880 | $100,417 |
| Mean Family Income | 880 | $97,561 |
| Median Household Income | 1,322 | $74,375 |
| Mean Household Income | 1,322 | $84,122 |
| Income Deficit | 880 | $0 |
| Wage / Income Gap (%) | 2,914 | 29.19% |
| Wage / Income Gap ($) | 2,914 | 70.81¢ per $1 |
| Gini / Inequality Index | 2,914 | 0.35 |
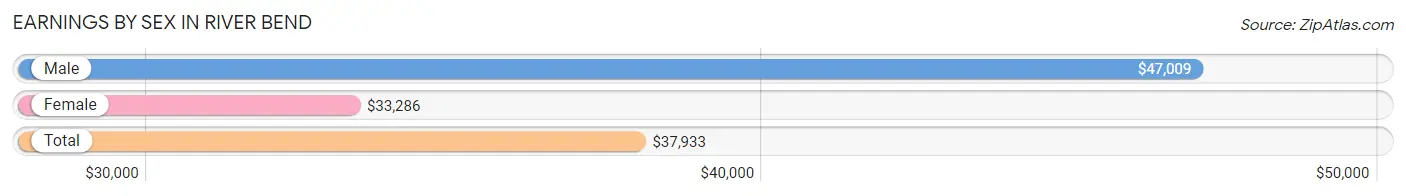
Earnings by Sex in River Bend
Average Earnings in River Bend are $37,933, $47,009 for men and $33,286 for women, a difference of 29.2%.
| Sex | Number | Average Earnings |
| Male | 479 (40.2%) | $47,009 |
| Female | 712 (59.8%) | $33,286 |
| Total | 1,191 (100.0%) | $37,933 |
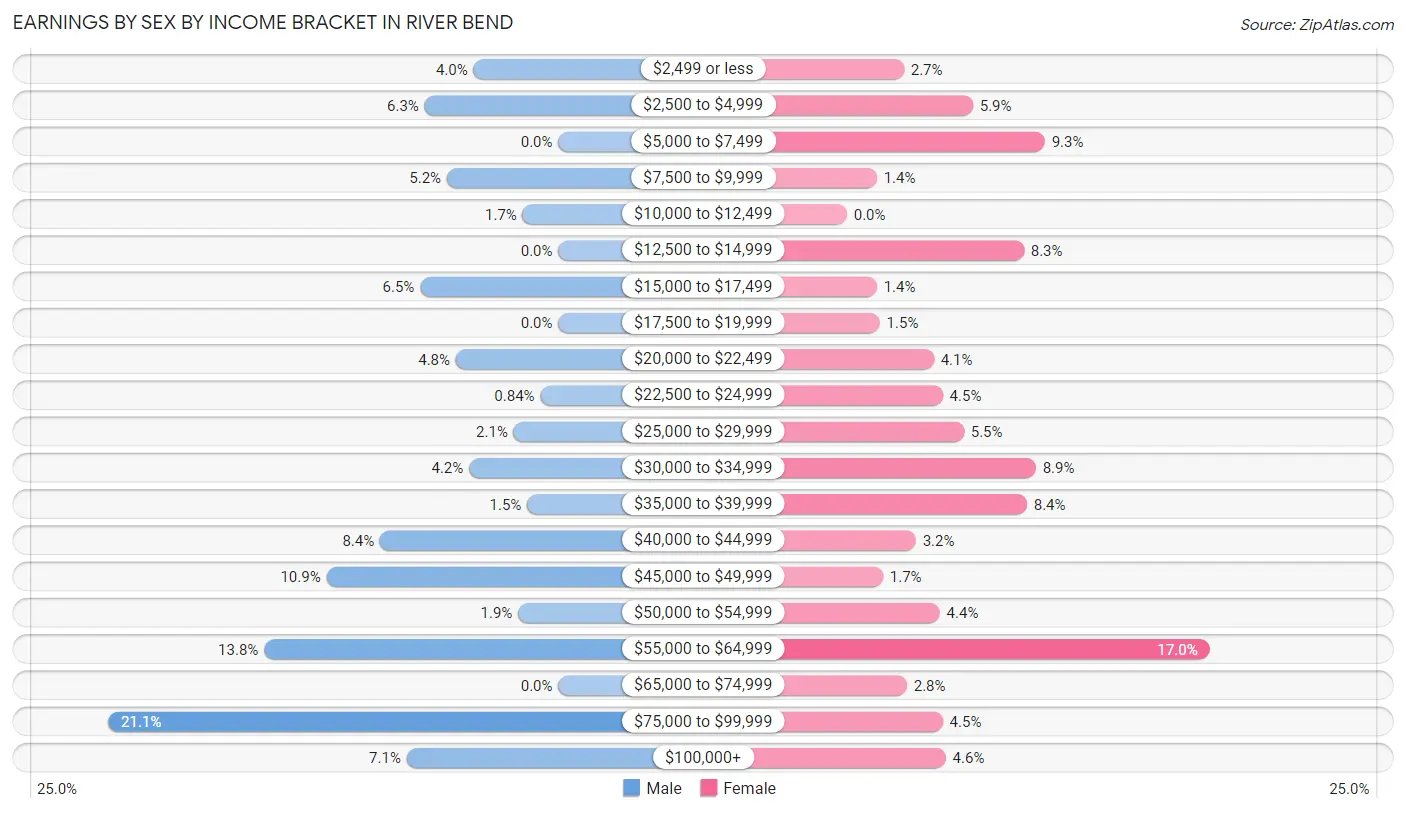
Earnings by Sex by Income Bracket in River Bend
The most common earnings brackets in River Bend are $75,000 to $99,999 for men (101 | 21.1%) and $55,000 to $64,999 for women (121 | 17.0%).
| Income | Male | Female |
| $2,499 or less | 19 (4.0%) | 19 (2.7%) |
| $2,500 to $4,999 | 30 (6.3%) | 42 (5.9%) |
| $5,000 to $7,499 | 0 (0.0%) | 66 (9.3%) |
| $7,500 to $9,999 | 25 (5.2%) | 10 (1.4%) |
| $10,000 to $12,499 | 8 (1.7%) | 0 (0.0%) |
| $12,500 to $14,999 | 0 (0.0%) | 59 (8.3%) |
| $15,000 to $17,499 | 31 (6.5%) | 10 (1.4%) |
| $17,500 to $19,999 | 0 (0.0%) | 11 (1.5%) |
| $20,000 to $22,499 | 23 (4.8%) | 29 (4.1%) |
| $22,500 to $24,999 | 4 (0.8%) | 32 (4.5%) |
| $25,000 to $29,999 | 10 (2.1%) | 39 (5.5%) |
| $30,000 to $34,999 | 20 (4.2%) | 63 (8.8%) |
| $35,000 to $39,999 | 7 (1.5%) | 60 (8.4%) |
| $40,000 to $44,999 | 40 (8.4%) | 23 (3.2%) |
| $45,000 to $49,999 | 52 (10.9%) | 12 (1.7%) |
| $50,000 to $54,999 | 9 (1.9%) | 31 (4.3%) |
| $55,000 to $64,999 | 66 (13.8%) | 121 (17.0%) |
| $65,000 to $74,999 | 0 (0.0%) | 20 (2.8%) |
| $75,000 to $99,999 | 101 (21.1%) | 32 (4.5%) |
| $100,000+ | 34 (7.1%) | 33 (4.6%) |
| Total | 479 (100.0%) | 712 (100.0%) |
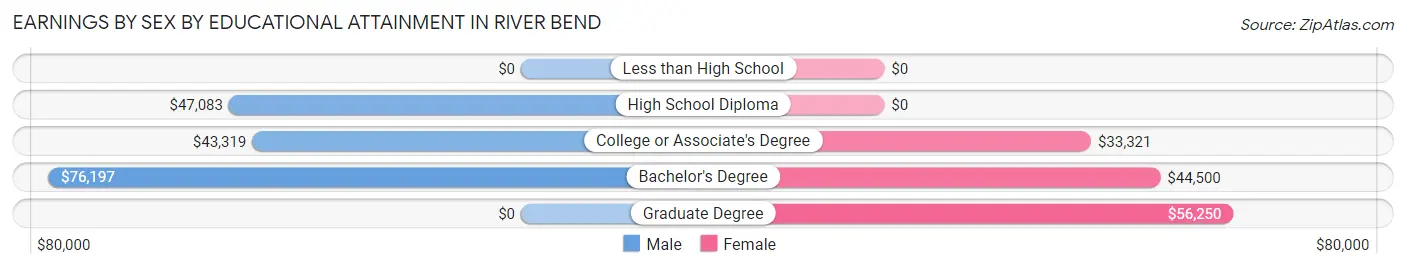
Earnings by Sex by Educational Attainment in River Bend
Average earnings in River Bend are $50,417 for men and $36,213 for women, a difference of 28.2%. Men with an educational attainment of bachelor's degree enjoy the highest average annual earnings of $76,197, while those with college or associate's degree education earn the least with $43,319. Women with an educational attainment of graduate degree earn the most with the average annual earnings of $56,250, while those with college or associate's degree education have the smallest earnings of $33,321.
| Educational Attainment | Male Income | Female Income |
| Less than High School | - | - |
| High School Diploma | $47,083 | $0 |
| College or Associate's Degree | $43,319 | $33,321 |
| Bachelor's Degree | $76,197 | $44,500 |
| Graduate Degree | - | - |
| Total | $50,417 | $36,213 |
Family Income in River Bend
Family Income Brackets in River Bend
According to the River Bend family income data, there are 360 families falling into the $100,000 to $149,999 income range, which is the most common income bracket and makes up 40.9% of all families.
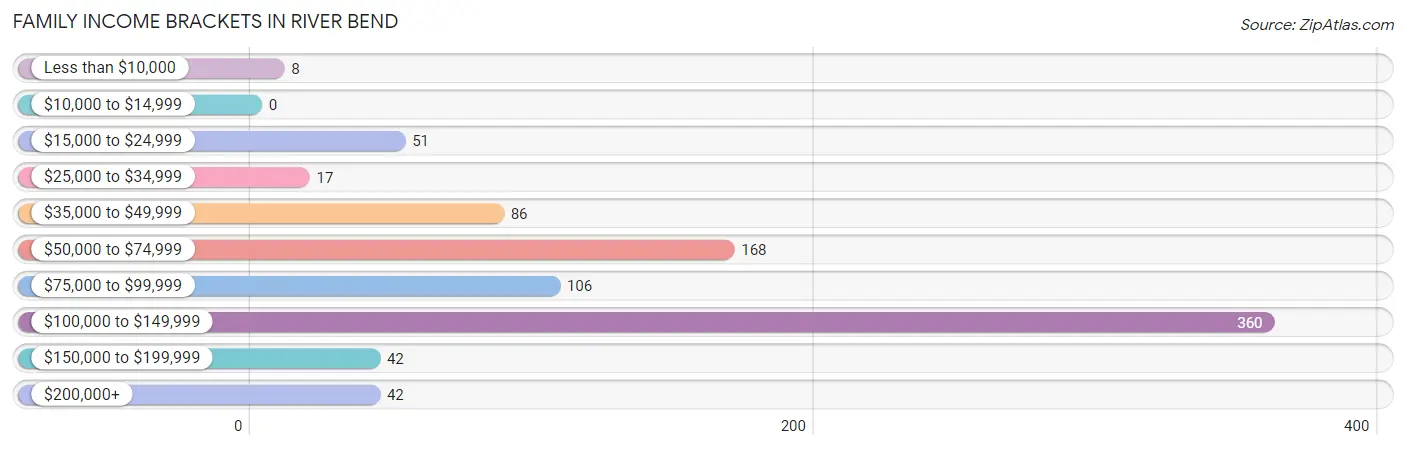
| Income Bracket | # Families | % Families |
| Less than $10,000 | 8 | 0.9% |
| $10,000 to $14,999 | 0 | 0.0% |
| $15,000 to $24,999 | 51 | 5.8% |
| $25,000 to $34,999 | 17 | 1.9% |
| $35,000 to $49,999 | 86 | 9.8% |
| $50,000 to $74,999 | 168 | 19.1% |
| $75,000 to $99,999 | 106 | 12.0% |
| $100,000 to $149,999 | 360 | 40.9% |
| $150,000 to $199,999 | 42 | 4.8% |
| $200,000+ | 42 | 4.8% |
Family Income by Famaliy Size in River Bend
3-person families (119 | 13.5%) account for the highest median family income in River Bend with $111,648 per family, while 2-person families (694 | 78.9%) have the highest median income of $49,868 per family member.
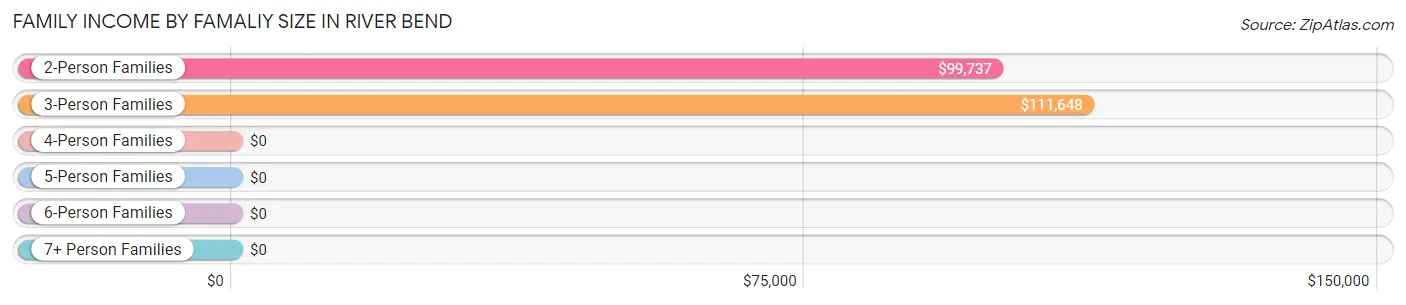
| Income Bracket | # Families | Median Income |
| 2-Person Families | 694 (78.9%) | $99,737 |
| 3-Person Families | 119 (13.5%) | $111,648 |
| 4-Person Families | 49 (5.6%) | $0 |
| 5-Person Families | 18 (2.1%) | $0 |
| 6-Person Families | 0 (0.0%) | $0 |
| 7+ Person Families | 0 (0.0%) | $0 |
| Total | 880 (100.0%) | $100,417 |
Family Income by Number of Earners in River Bend
The median family income in River Bend is $100,417, with families comprising 3+ earners (36) having the highest median family income of $165,000, while families with 1 earner (266) have the lowest median family income of $66,375, accounting for 4.1% and 30.2% of families, respectively.
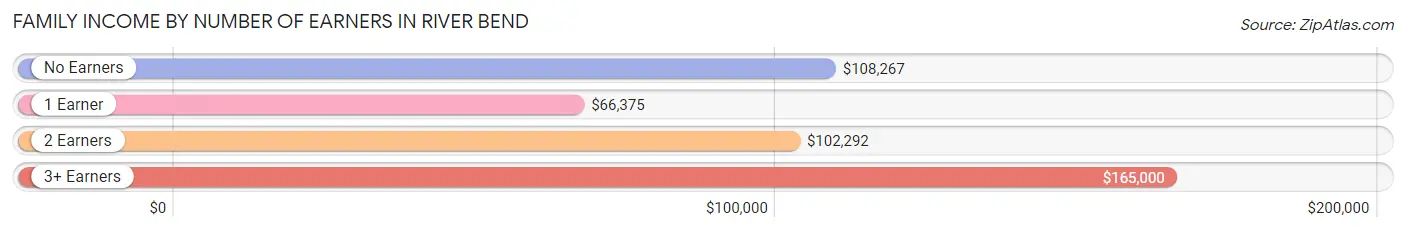
| Number of Earners | # Families | Median Income |
| No Earners | 364 (41.4%) | $108,267 |
| 1 Earner | 266 (30.2%) | $66,375 |
| 2 Earners | 214 (24.3%) | $102,292 |
| 3+ Earners | 36 (4.1%) | $165,000 |
| Total | 880 (100.0%) | $100,417 |
Household Income in River Bend
Household Income Brackets in River Bend
With 410 households falling in the category, the $100,000 to $149,999 income range is the most frequent in River Bend, accounting for 31.0% of all households.
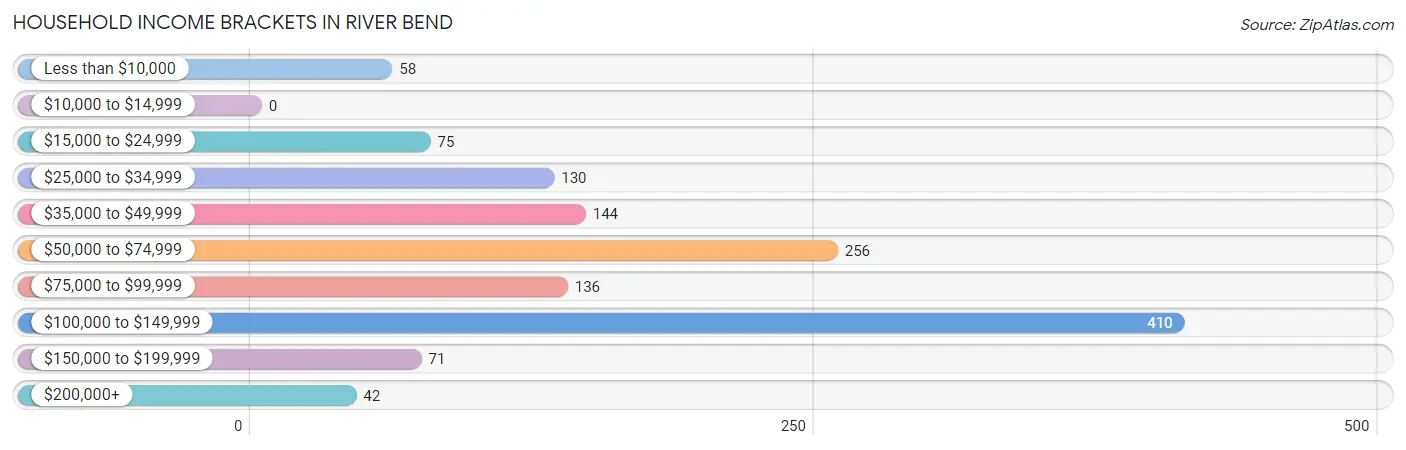
| Income Bracket | # Households | % Households |
| Less than $10,000 | 58 | 4.4% |
| $10,000 to $14,999 | 0 | 0.0% |
| $15,000 to $24,999 | 75 | 5.7% |
| $25,000 to $34,999 | 130 | 9.8% |
| $35,000 to $49,999 | 144 | 10.9% |
| $50,000 to $74,999 | 256 | 19.4% |
| $75,000 to $99,999 | 136 | 10.3% |
| $100,000 to $149,999 | 410 | 31.0% |
| $150,000 to $199,999 | 71 | 5.4% |
| $200,000+ | 42 | 3.2% |
Household Income by Householder Age in River Bend
The median household income in River Bend is $74,375, with the highest median household income of $98,750 found in the 45 to 64 years age bracket for the primary householder. A total of 371 households (28.1%) fall into this category. Meanwhile, the 15 to 24 years age bracket for the primary householder has the lowest median household income of $0, with 24 households (1.8%) in this group.
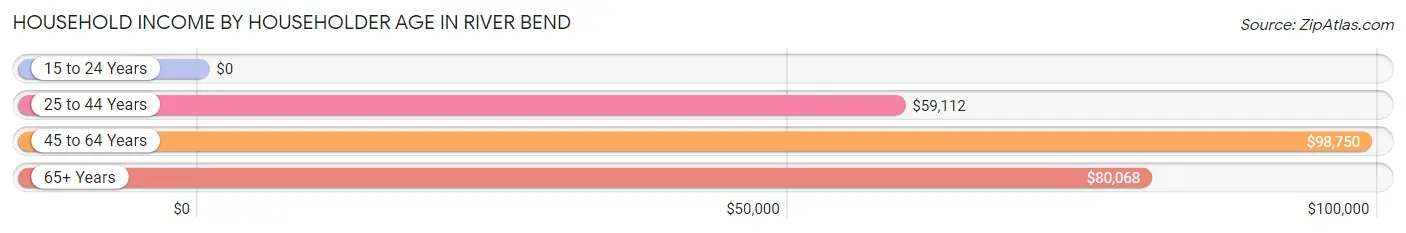
| Income Bracket | # Households | Median Income |
| 15 to 24 Years | 24 (1.8%) | $0 |
| 25 to 44 Years | 283 (21.4%) | $59,112 |
| 45 to 64 Years | 371 (28.1%) | $98,750 |
| 65+ Years | 644 (48.7%) | $80,068 |
| Total | 1,322 (100.0%) | $74,375 |
Poverty in River Bend
Income Below Poverty by Sex and Age in River Bend
With 9.5% poverty level for males and 8.2% for females among the residents of River Bend, 16 and 17 year old males and 35 to 44 year old females are the most vulnerable to poverty, with 9 males (100.0%) and 40 females (30.8%) in their respective age groups living below the poverty level.
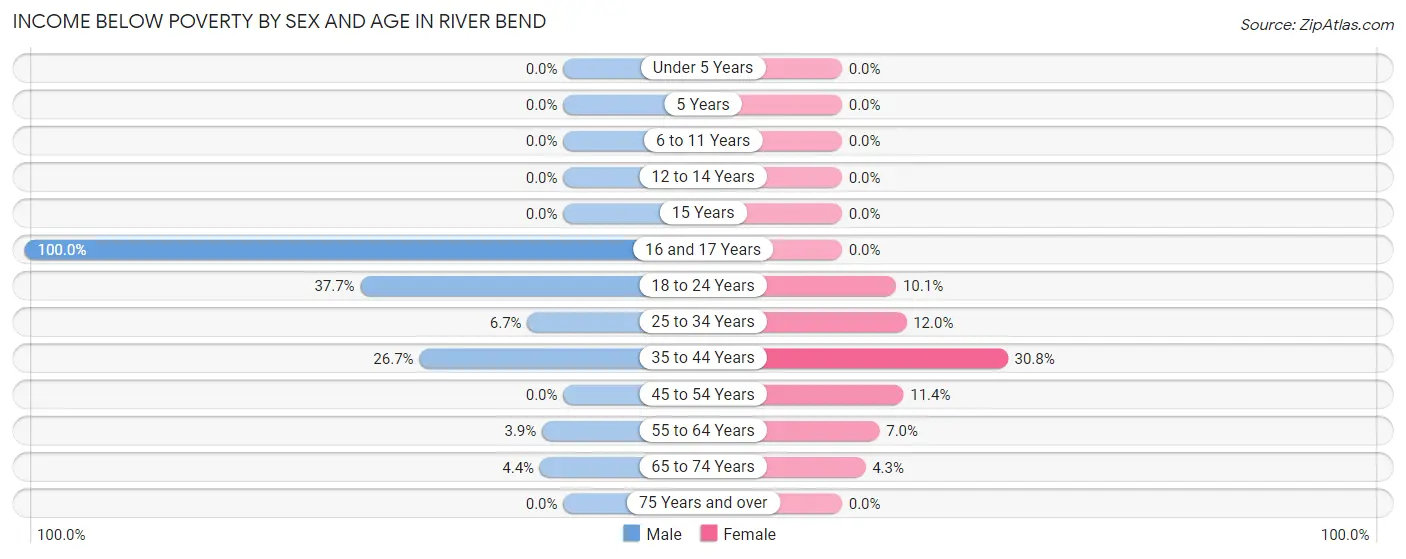
| Age Bracket | Male | Female |
| Under 5 Years | 0 (0.0%) | 0 (0.0%) |
| 5 Years | 0 (0.0%) | 0 (0.0%) |
| 6 to 11 Years | 0 (0.0%) | 0 (0.0%) |
| 12 to 14 Years | 0 (0.0%) | 0 (0.0%) |
| 15 Years | 0 (0.0%) | 0 (0.0%) |
| 16 and 17 Years | 9 (100.0%) | 0 (0.0%) |
| 18 to 24 Years | 58 (37.7%) | 18 (10.1%) |
| 25 to 34 Years | 8 (6.7%) | 25 (12.0%) |
| 35 to 44 Years | 31 (26.7%) | 40 (30.8%) |
| 45 to 54 Years | 0 (0.0%) | 25 (11.4%) |
| 55 to 64 Years | 8 (3.9%) | 8 (7.0%) |
| 65 to 74 Years | 9 (4.3%) | 15 (4.3%) |
| 75 Years and over | 0 (0.0%) | 0 (0.0%) |
| Total | 123 (9.5%) | 131 (8.2%) |
Income Above Poverty by Sex and Age in River Bend
According to the poverty statistics in River Bend, males aged under 5 years and females aged under 5 years are the age groups that are most secure financially, with 100.0% of males and 100.0% of females in these age groups living above the poverty line.
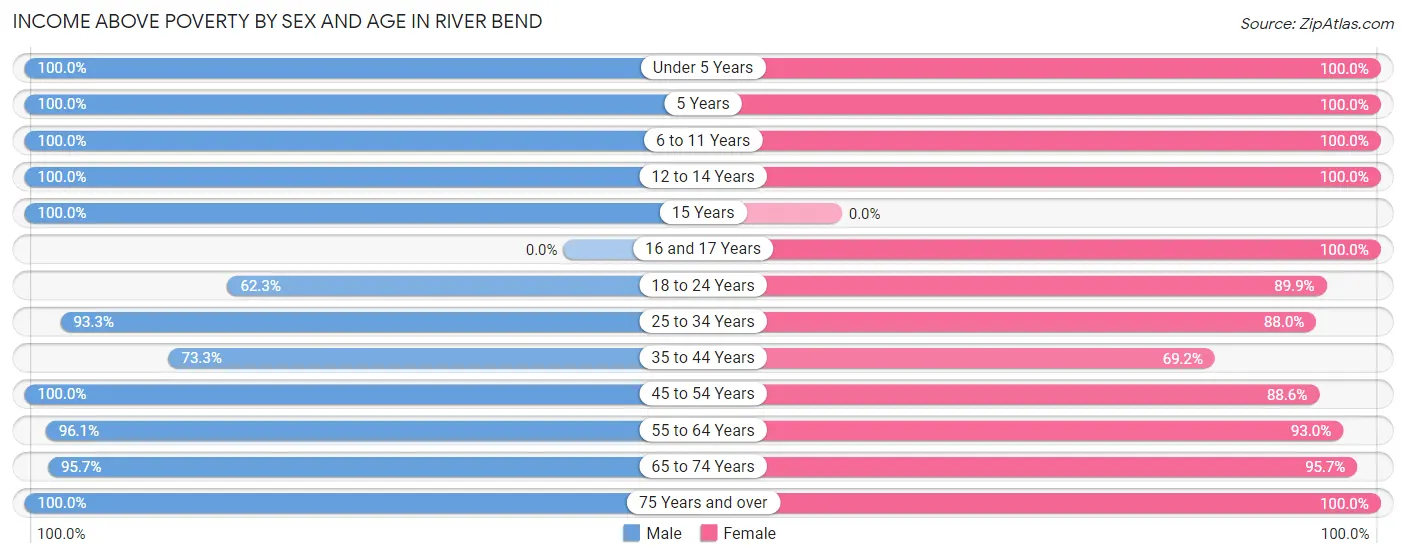
| Age Bracket | Male | Female |
| Under 5 Years | 13 (100.0%) | 44 (100.0%) |
| 5 Years | 8 (100.0%) | 15 (100.0%) |
| 6 to 11 Years | 35 (100.0%) | 15 (100.0%) |
| 12 to 14 Years | 22 (100.0%) | 38 (100.0%) |
| 15 Years | 6 (100.0%) | 0 (0.0%) |
| 16 and 17 Years | 0 (0.0%) | 30 (100.0%) |
| 18 to 24 Years | 96 (62.3%) | 161 (89.9%) |
| 25 to 34 Years | 112 (93.3%) | 184 (88.0%) |
| 35 to 44 Years | 85 (73.3%) | 90 (69.2%) |
| 45 to 54 Years | 198 (100.0%) | 194 (88.6%) |
| 55 to 64 Years | 195 (96.1%) | 107 (93.0%) |
| 65 to 74 Years | 198 (95.7%) | 331 (95.7%) |
| 75 Years and over | 211 (100.0%) | 252 (100.0%) |
| Total | 1,179 (90.5%) | 1,461 (91.8%) |
Income Below Poverty Among Married-Couple Families in River Bend
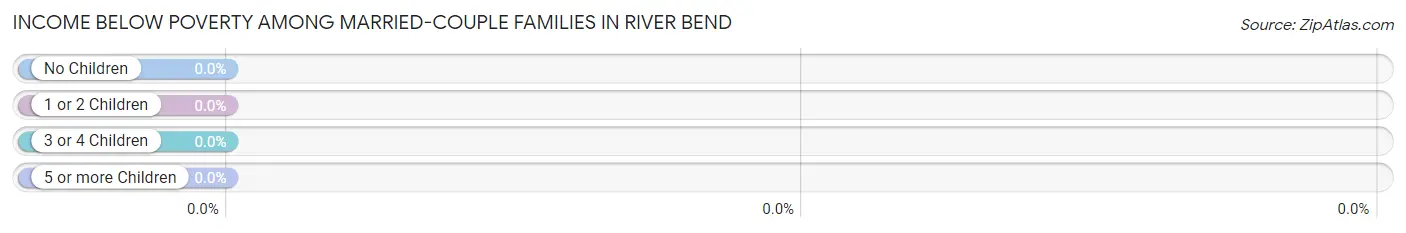
| Children | Above Poverty | Below Poverty |
| No Children | 652 (100.0%) | 0 (0.0%) |
| 1 or 2 Children | 76 (100.0%) | 0 (0.0%) |
| 3 or 4 Children | 0 (0.0%) | 0 (0.0%) |
| 5 or more Children | 0 (0.0%) | 0 (0.0%) |
| Total | 728 (100.0%) | 0 (0.0%) |
Income Below Poverty Among Single-Parent Households in River Bend
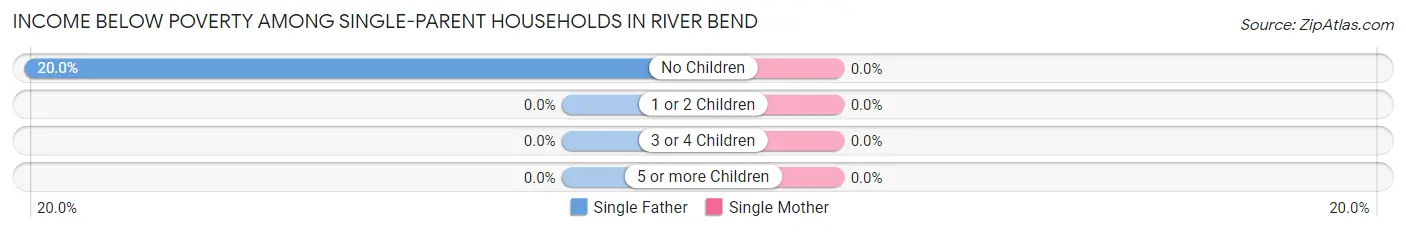
| Children | Single Father | Single Mother |
| No Children | 8 (20.0%) | 0 (0.0%) |
| 1 or 2 Children | 0 (0.0%) | 0 (0.0%) |
| 3 or 4 Children | 0 (0.0%) | 0 (0.0%) |
| 5 or more Children | 0 (0.0%) | 0 (0.0%) |
| Total | 8 (15.7%) | 0 (0.0%) |
Income Below Poverty Among Married-Couple vs Single-Parent Households in River Bend
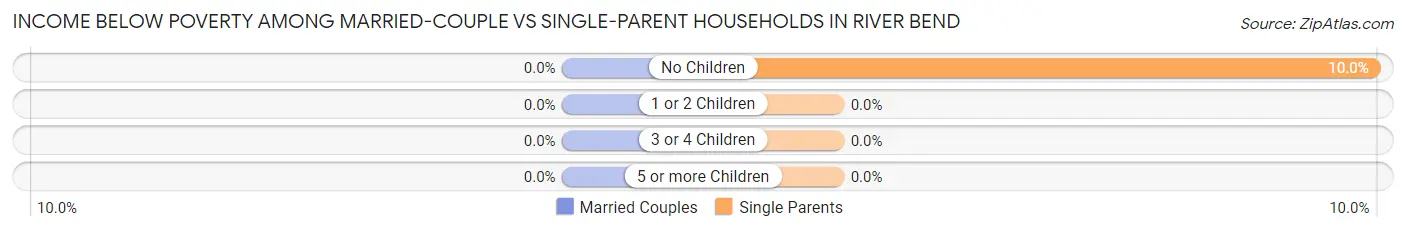
| Children | Married-Couple Families | Single-Parent Households |
| No Children | 0 (0.0%) | 8 (10.0%) |
| 1 or 2 Children | 0 (0.0%) | 0 (0.0%) |
| 3 or 4 Children | 0 (0.0%) | 0 (0.0%) |
| 5 or more Children | 0 (0.0%) | 0 (0.0%) |
| Total | 0 (0.0%) | 8 (5.3%) |
Race in River Bend
The most populous races in River Bend are White / Caucasian (2,460 | 84.4%), Black / African American (355 | 12.2%), and Hispanic or Latino (176 | 6.0%).
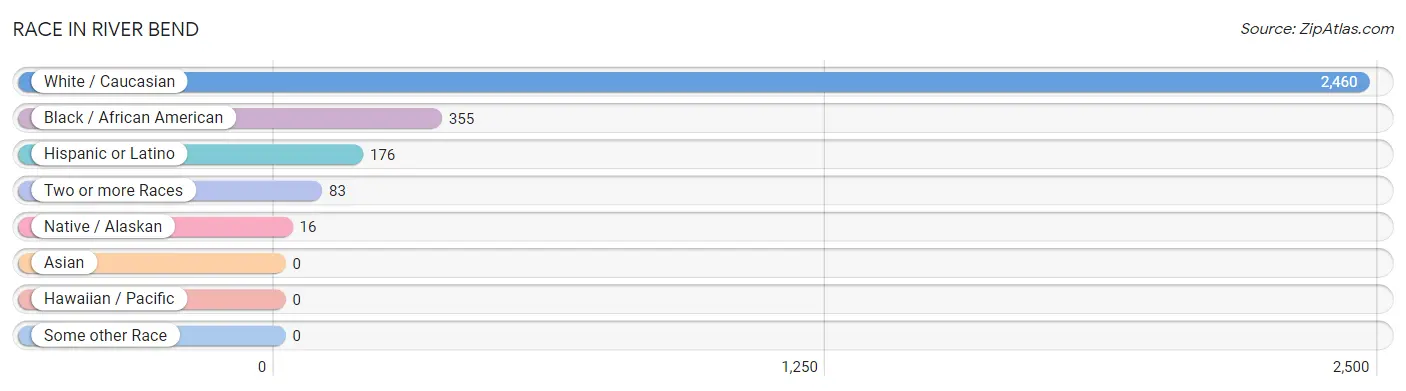
| Race | # Population | % Population |
| Asian | 0 | 0.0% |
| Black / African American | 355 | 12.2% |
| Hawaiian / Pacific | 0 | 0.0% |
| Hispanic or Latino | 176 | 6.0% |
| Native / Alaskan | 16 | 0.5% |
| White / Caucasian | 2,460 | 84.4% |
| Two or more Races | 83 | 2.9% |
| Some other Race | 0 | 0.0% |
| Total | 2,914 | 100.0% |
Ancestry in River Bend
The most populous ancestries reported in River Bend are Irish (441 | 15.1%), English (416 | 14.3%), German (391 | 13.4%), American (344 | 11.8%), and Italian (202 | 6.9%), together accounting for 61.6% of all River Bend residents.
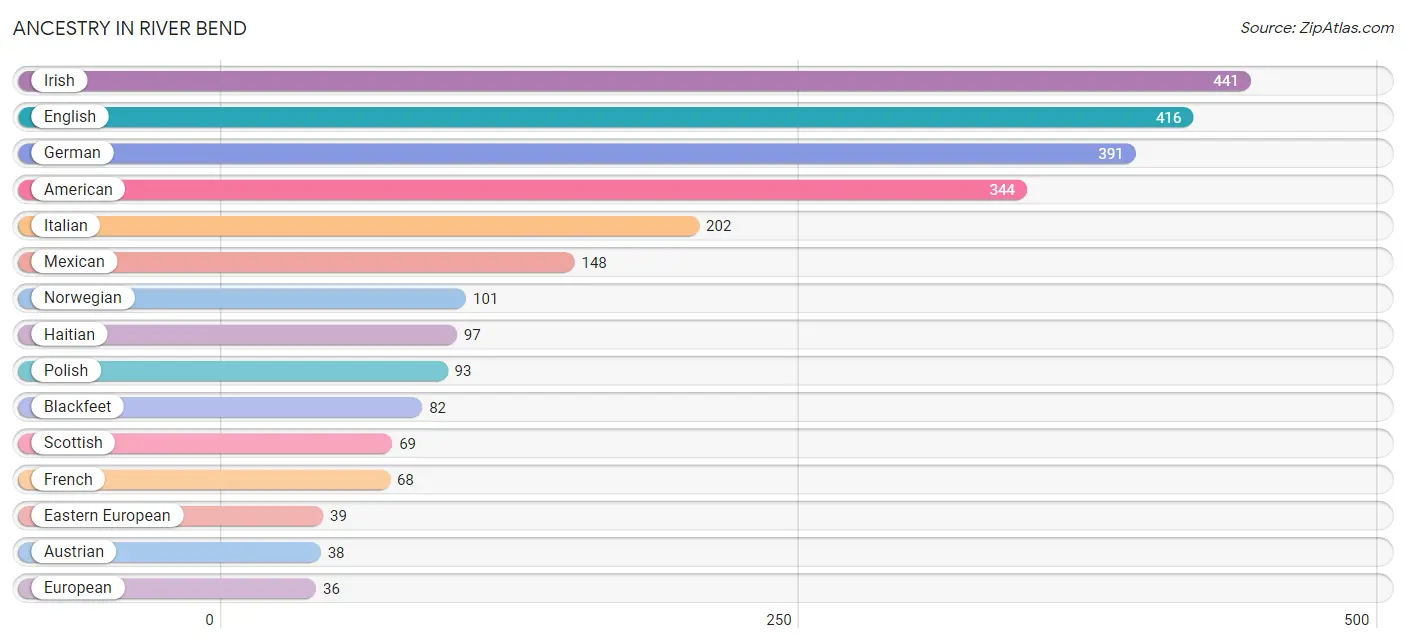
| Ancestry | # Population | % Population |
| American | 344 | 11.8% |
| Austrian | 38 | 1.3% |
| Blackfeet | 82 | 2.8% |
| British | 9 | 0.3% |
| Canadian | 8 | 0.3% |
| Czech | 11 | 0.4% |
| Dutch | 19 | 0.6% |
| Eastern European | 39 | 1.3% |
| English | 416 | 14.3% |
| European | 36 | 1.2% |
| French | 68 | 2.3% |
| French Canadian | 17 | 0.6% |
| German | 391 | 13.4% |
| Greek | 28 | 1.0% |
| Haitian | 97 | 3.3% |
| Hungarian | 19 | 0.6% |
| Irish | 441 | 15.1% |
| Italian | 202 | 6.9% |
| Mexican | 148 | 5.1% |
| Norwegian | 101 | 3.5% |
| Polish | 93 | 3.2% |
| Puerto Rican | 28 | 1.0% |
| Scotch-Irish | 18 | 0.6% |
| Scottish | 69 | 2.4% |
| Slovak | 15 | 0.5% |
| Welsh | 27 | 0.9% | View All 26 Rows |
Immigrants in River Bend
The most numerous immigrant groups reported in River Bend came from Central America (48 | 1.7%), Latin America (48 | 1.7%), Mexico (48 | 1.7%), Europe (29 | 1.0%), and Western Europe (22 | 0.7%), together accounting for 6.7% of all River Bend residents.
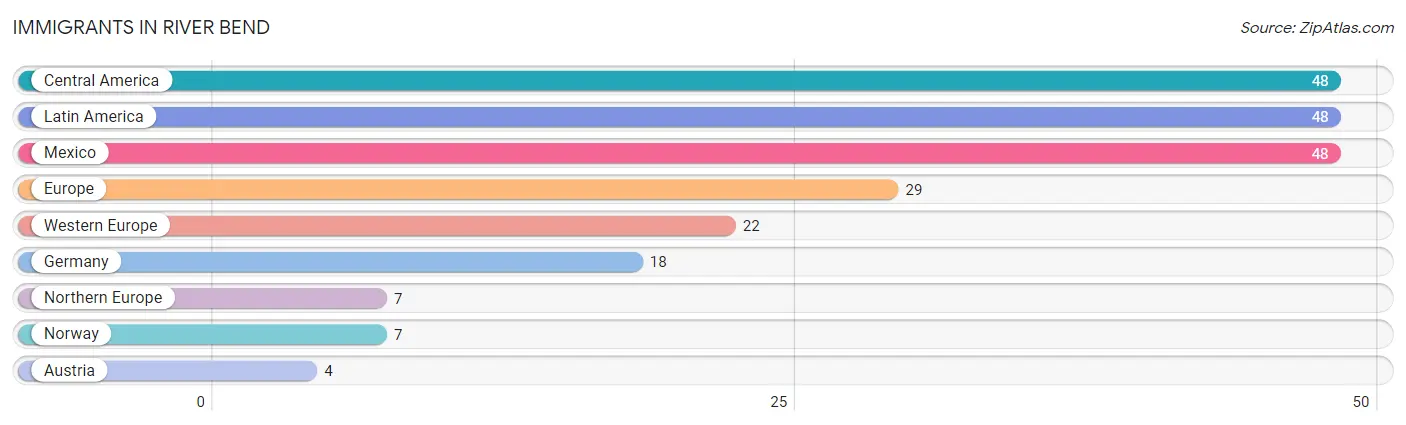
| Immigration Origin | # Population | % Population |
| Austria | 4 | 0.1% |
| Central America | 48 | 1.7% |
| Europe | 29 | 1.0% |
| Germany | 18 | 0.6% |
| Latin America | 48 | 1.7% |
| Mexico | 48 | 1.7% |
| Northern Europe | 7 | 0.2% |
| Norway | 7 | 0.2% |
| Western Europe | 22 | 0.7% | View All 9 Rows |
Sex and Age in River Bend
Sex and Age in River Bend
The most populous age groups in River Bend are 45 to 49 Years (147 | 11.2%) for men and 75 to 79 Years (190 | 11.9%) for women.
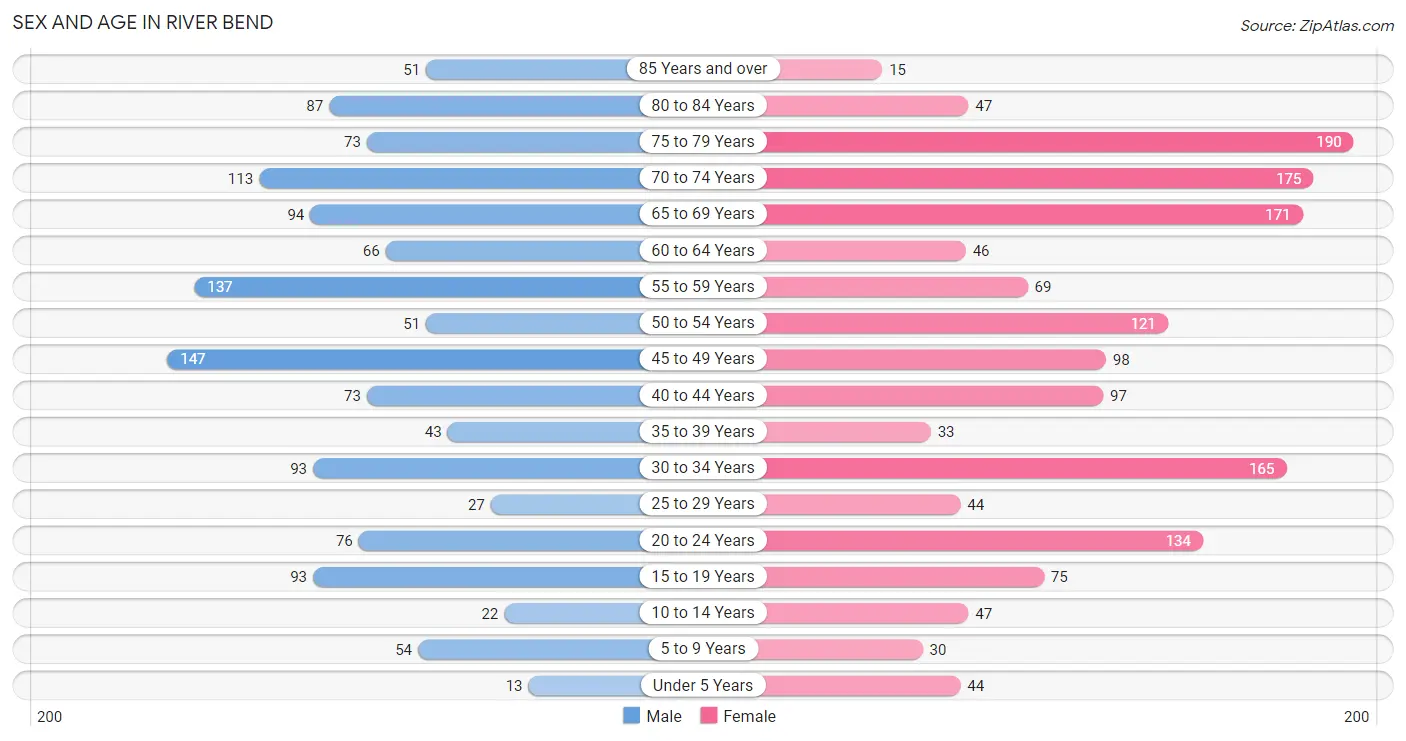
| Age Bracket | Male | Female |
| Under 5 Years | 13 (1.0%) | 44 (2.8%) |
| 5 to 9 Years | 54 (4.1%) | 30 (1.9%) |
| 10 to 14 Years | 22 (1.7%) | 47 (2.9%) |
| 15 to 19 Years | 93 (7.1%) | 75 (4.7%) |
| 20 to 24 Years | 76 (5.8%) | 134 (8.4%) |
| 25 to 29 Years | 27 (2.1%) | 44 (2.8%) |
| 30 to 34 Years | 93 (7.1%) | 165 (10.3%) |
| 35 to 39 Years | 43 (3.3%) | 33 (2.1%) |
| 40 to 44 Years | 73 (5.6%) | 97 (6.1%) |
| 45 to 49 Years | 147 (11.2%) | 98 (6.1%) |
| 50 to 54 Years | 51 (3.9%) | 121 (7.6%) |
| 55 to 59 Years | 137 (10.4%) | 69 (4.3%) |
| 60 to 64 Years | 66 (5.0%) | 46 (2.9%) |
| 65 to 69 Years | 94 (7.2%) | 171 (10.7%) |
| 70 to 74 Years | 113 (8.6%) | 175 (10.9%) |
| 75 to 79 Years | 73 (5.6%) | 190 (11.9%) |
| 80 to 84 Years | 87 (6.6%) | 47 (2.9%) |
| 85 Years and over | 51 (3.9%) | 15 (0.9%) |
| Total | 1,313 (100.0%) | 1,601 (100.0%) |
Families and Households in River Bend
Median Family Size in River Bend
The median family size in River Bend is 2.51 persons per family, with single male/father families (51 | 5.8%) accounting for the largest median family size of 3.08 persons per family. On the other hand, married-couple families (728 | 82.7%) represent the smallest median family size with 2.42 persons per family.
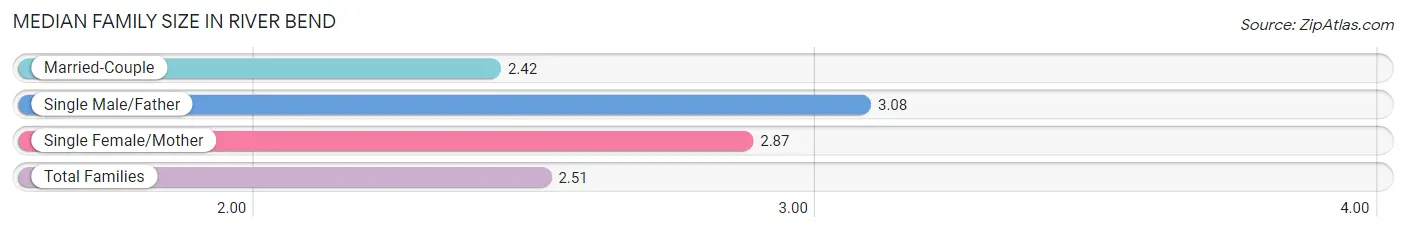
| Family Type | # Families | Family Size |
| Married-Couple | 728 (82.7%) | 2.42 |
| Single Male/Father | 51 (5.8%) | 3.08 |
| Single Female/Mother | 101 (11.5%) | 2.87 |
| Total Families | 880 (100.0%) | 2.51 |
Median Household Size in River Bend
The median household size in River Bend is 2.10 persons per household, with single male/father households (51 | 3.9%) accounting for the largest median household size of 3.08 persons per household. non-family households (442 | 33.4%) represent the smallest median household size with 1.21 persons per household.
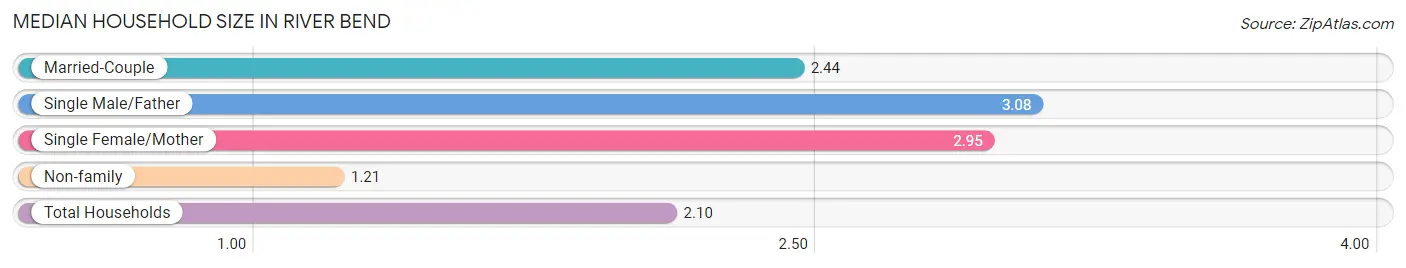
| Household Type | # Households | Household Size |
| Married-Couple | 728 (55.1%) | 2.44 |
| Single Male/Father | 51 (3.9%) | 3.08 |
| Single Female/Mother | 101 (7.6%) | 2.95 |
| Non-family | 442 (33.4%) | 1.21 |
| Total Households | 1,322 (100.0%) | 2.10 |
Household Size by Marriage Status in River Bend
Out of a total of 1,322 households in River Bend, 880 (66.6%) are family households, while 442 (33.4%) are nonfamily households. The most numerous type of family households are 2-person households, comprising 655, and the most common type of nonfamily households are 1-person households, comprising 371.
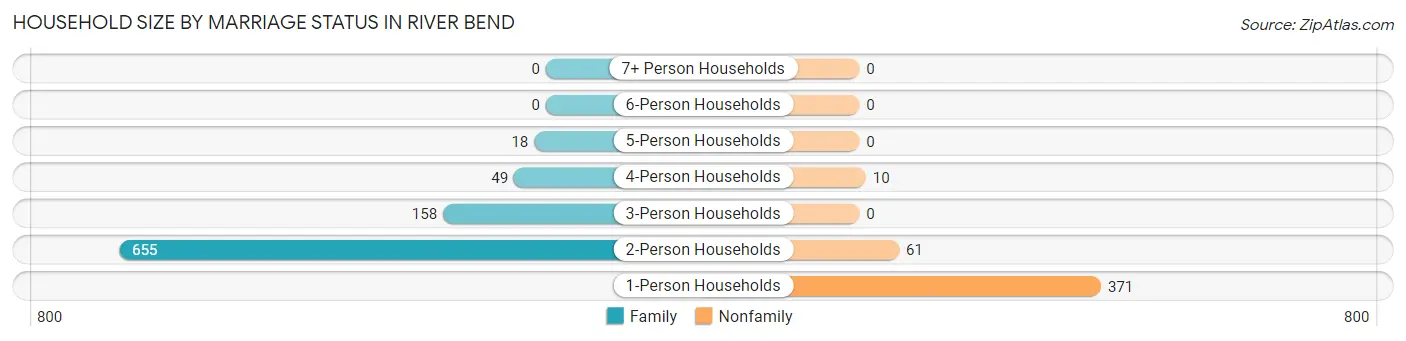
| Household Size | Family Households | Nonfamily Households |
| 1-Person Households | - | 371 (28.1%) |
| 2-Person Households | 655 (49.5%) | 61 (4.6%) |
| 3-Person Households | 158 (11.9%) | 0 (0.0%) |
| 4-Person Households | 49 (3.7%) | 10 (0.8%) |
| 5-Person Households | 18 (1.4%) | 0 (0.0%) |
| 6-Person Households | 0 (0.0%) | 0 (0.0%) |
| 7+ Person Households | 0 (0.0%) | 0 (0.0%) |
| Total | 880 (66.6%) | 442 (33.4%) |
Female Fertility in River Bend
Fertility by Age in River Bend
Average fertility rate in River Bend is 66.0 births per 1,000 women. Women in the age bracket of 20 to 34 years have the highest fertility rate with 131.0 births per 1,000 women. Women in the age bracket of 20 to 34 years acount for 100.0% of all women with births.
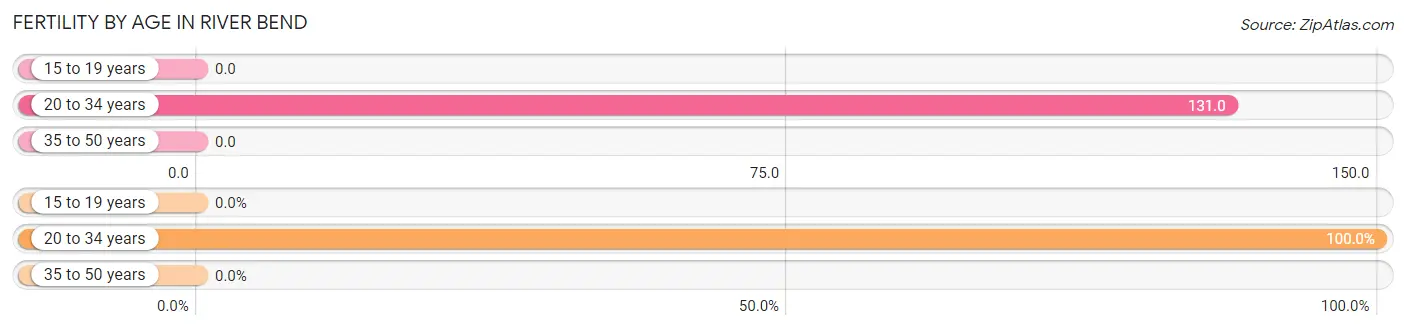
| Age Bracket | Women with Births | Births / 1,000 Women |
| 15 to 19 years | 0 (0.0%) | 0.0 |
| 20 to 34 years | 45 (100.0%) | 131.0 |
| 35 to 50 years | 0 (0.0%) | 0.0 |
| Total | 45 (100.0%) | 66.0 |
Fertility by Age by Marriage Status in River Bend
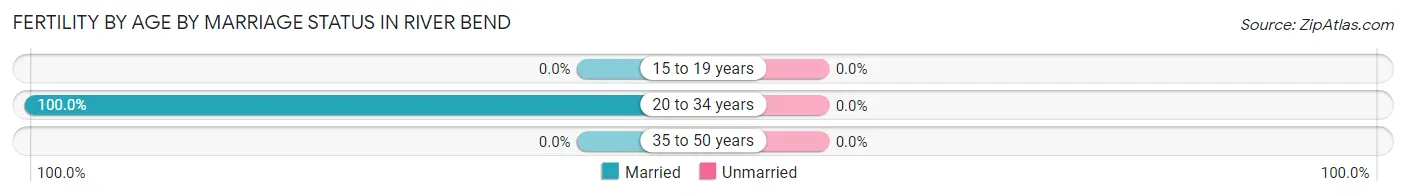
| Age Bracket | Married | Unmarried |
| 15 to 19 years | 0 (0.0%) | 0 (0.0%) |
| 20 to 34 years | 45 (100.0%) | 0 (0.0%) |
| 35 to 50 years | 0 (0.0%) | 0 (0.0%) |
| Total | 45 (100.0%) | 0 (0.0%) |
Fertility by Education in River Bend
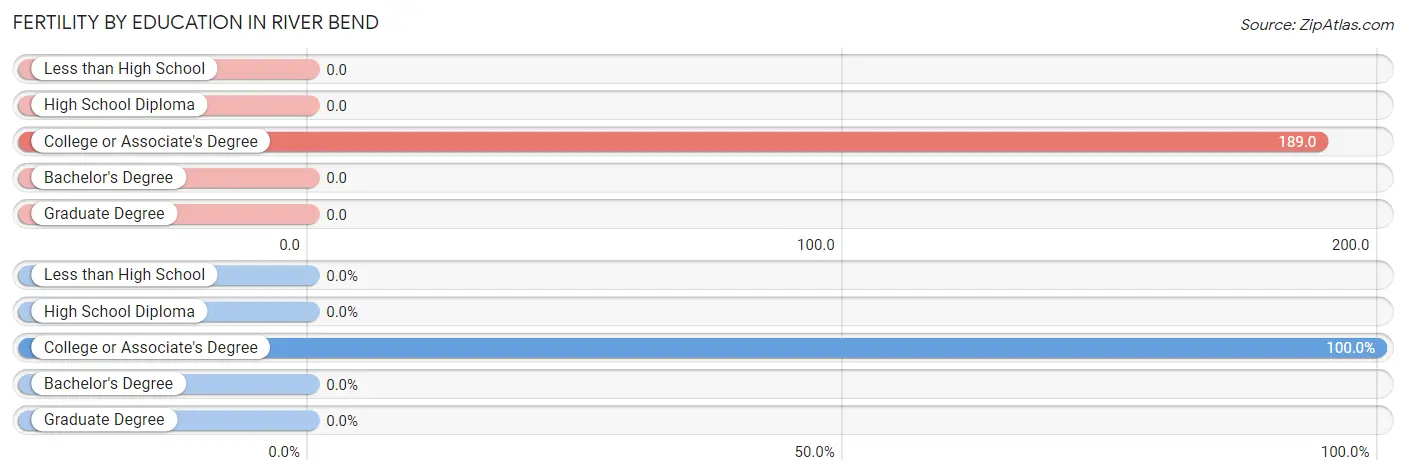
| Educational Attainment | Women with Births | Births / 1,000 Women |
| Less than High School | 0 (0.0%) | 0.0 |
| High School Diploma | 0 (0.0%) | 0.0 |
| College or Associate's Degree | 45 (100.0%) | 189.0 |
| Bachelor's Degree | 0 (0.0%) | 0.0 |
| Graduate Degree | 0 (0.0%) | 0.0 |
| Total | 45 (100.0%) | 66.0 |
Fertility by Education by Marriage Status in River Bend
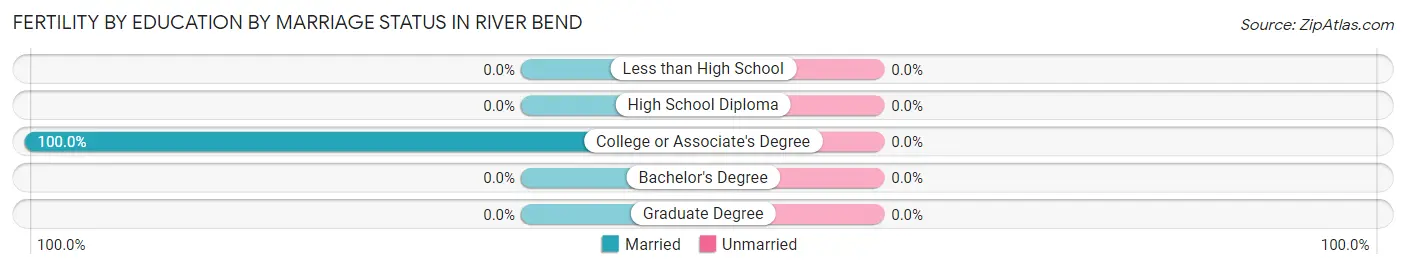
| Educational Attainment | Married | Unmarried |
| Less than High School | 0 (0.0%) | 0 (0.0%) |
| High School Diploma | 0 (0.0%) | 0 (0.0%) |
| College or Associate's Degree | 45 (100.0%) | 0 (0.0%) |
| Bachelor's Degree | 0 (0.0%) | 0 (0.0%) |
| Graduate Degree | 0 (0.0%) | 0 (0.0%) |
| Total | 45 (100.0%) | 0 (0.0%) |
Employment Characteristics in River Bend
Employment by Class of Employer in River Bend
Among the 1,148 employed individuals in River Bend, private company employees (759 | 66.1%), not-for-profit organizations (94 | 8.2%), and local government employees (93 | 8.1%) make up the most common classes of employment.
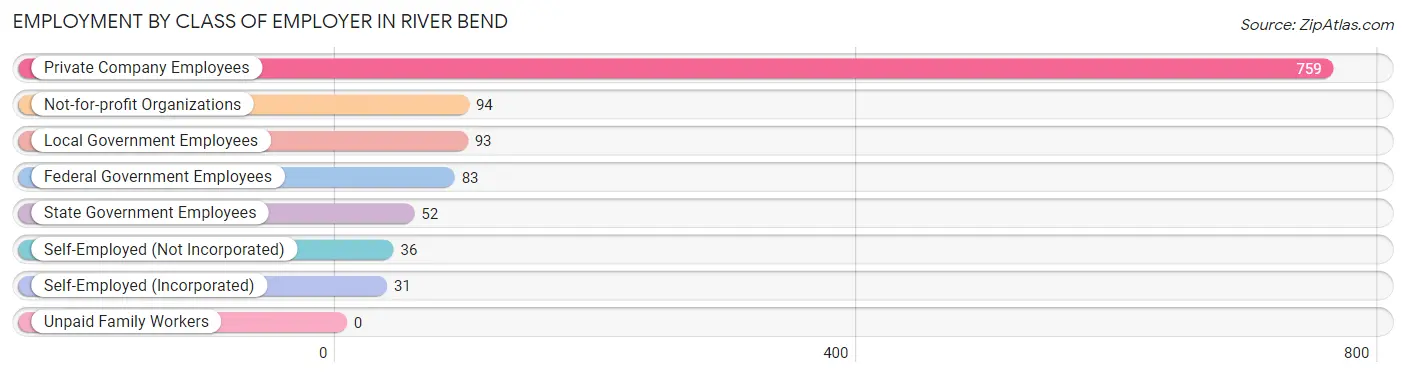
| Employer Class | # Employees | % Employees |
| Private Company Employees | 759 | 66.1% |
| Self-Employed (Incorporated) | 31 | 2.7% |
| Self-Employed (Not Incorporated) | 36 | 3.1% |
| Not-for-profit Organizations | 94 | 8.2% |
| Local Government Employees | 93 | 8.1% |
| State Government Employees | 52 | 4.5% |
| Federal Government Employees | 83 | 7.2% |
| Unpaid Family Workers | 0 | 0.0% |
| Total | 1,148 | 100.0% |
Employment Status by Age in River Bend
According to the labor force statistics for River Bend, out of the total population over 16 years of age (2,698), 43.1% or 1,163 individuals are in the labor force, with 1.2% or 14 of them unemployed. The age group with the highest labor force participation rate is 30 to 34 years, with 100.0% or 258 individuals in the labor force. Within the labor force, the 25 to 29 years age range has the highest percentage of unemployed individuals, with 31.8% or 14 of them being unemployed.
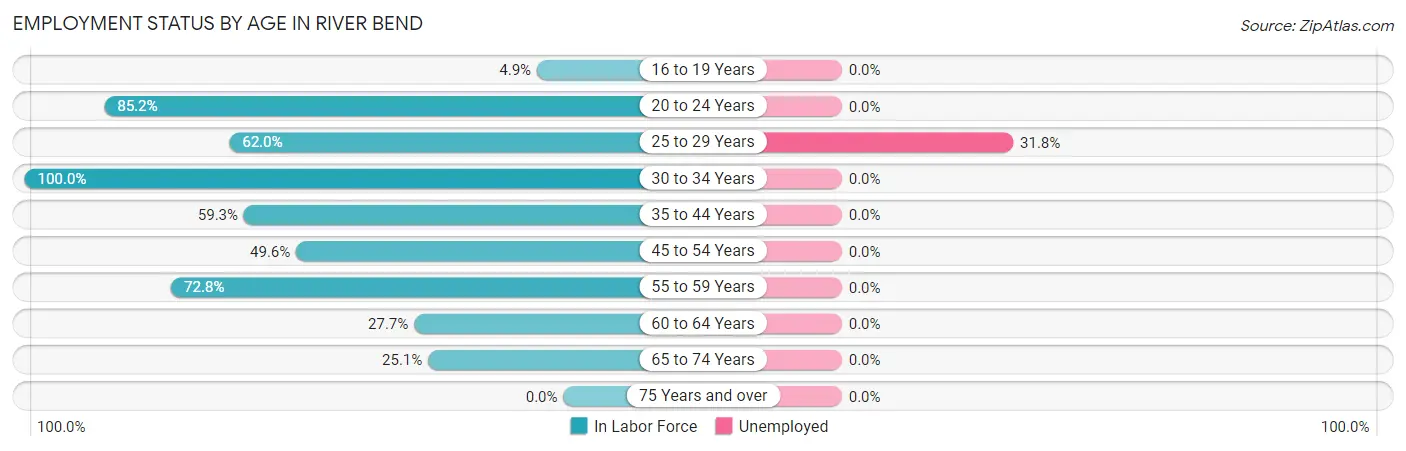
| Age Bracket | In Labor Force | Unemployed |
| 16 to 19 Years | 8 (4.9%) | 0 (0.0%) |
| 20 to 24 Years | 179 (85.2%) | 0 (0.0%) |
| 25 to 29 Years | 44 (62.0%) | 14 (31.8%) |
| 30 to 34 Years | 258 (100.0%) | 0 (0.0%) |
| 35 to 44 Years | 146 (59.3%) | 0 (0.0%) |
| 45 to 54 Years | 207 (49.6%) | 0 (0.0%) |
| 55 to 59 Years | 150 (72.8%) | 0 (0.0%) |
| 60 to 64 Years | 31 (27.7%) | 0 (0.0%) |
| 65 to 74 Years | 139 (25.1%) | 0 (0.0%) |
| 75 Years and over | 0 (0.0%) | 0 (0.0%) |
| Total | 1,163 (43.1%) | 14 (1.2%) |
Employment Status by Educational Attainment in River Bend
According to labor force statistics for River Bend, 63.8% of individuals (836) out of the total population between 25 and 64 years of age (1,310) are in the labor force, with 1.7% or 14 of them being unemployed. The group with the highest labor force participation rate are those with the educational attainment of college / associate degree, with 76.0% or 380 individuals in the labor force. Within the labor force, individuals with high school diploma education have the highest percentage of unemployment, with 18.2% or 14 of them being unemployed.
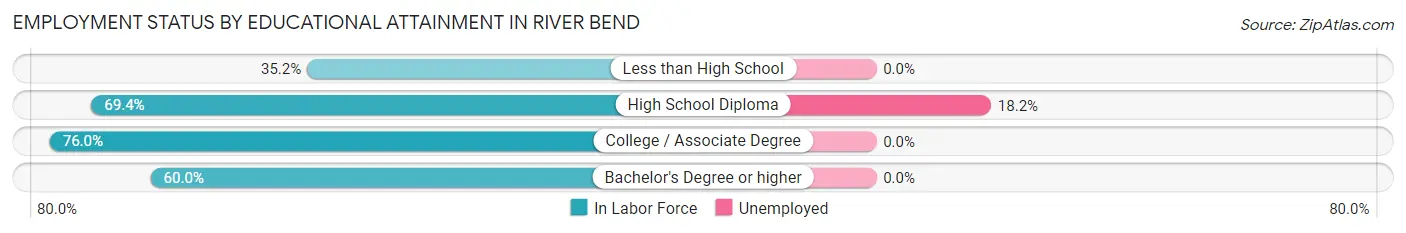
| Educational Attainment | In Labor Force | Unemployed |
| Less than High School | 57 (35.2%) | 0 (0.0%) |
| High School Diploma | 77 (69.4%) | 20 (18.2%) |
| College / Associate Degree | 380 (76.0%) | 0 (0.0%) |
| Bachelor's Degree or higher | 322 (60.0%) | 0 (0.0%) |
| Total | 836 (63.8%) | 22 (1.7%) |
Employment Occupations by Sex in River Bend
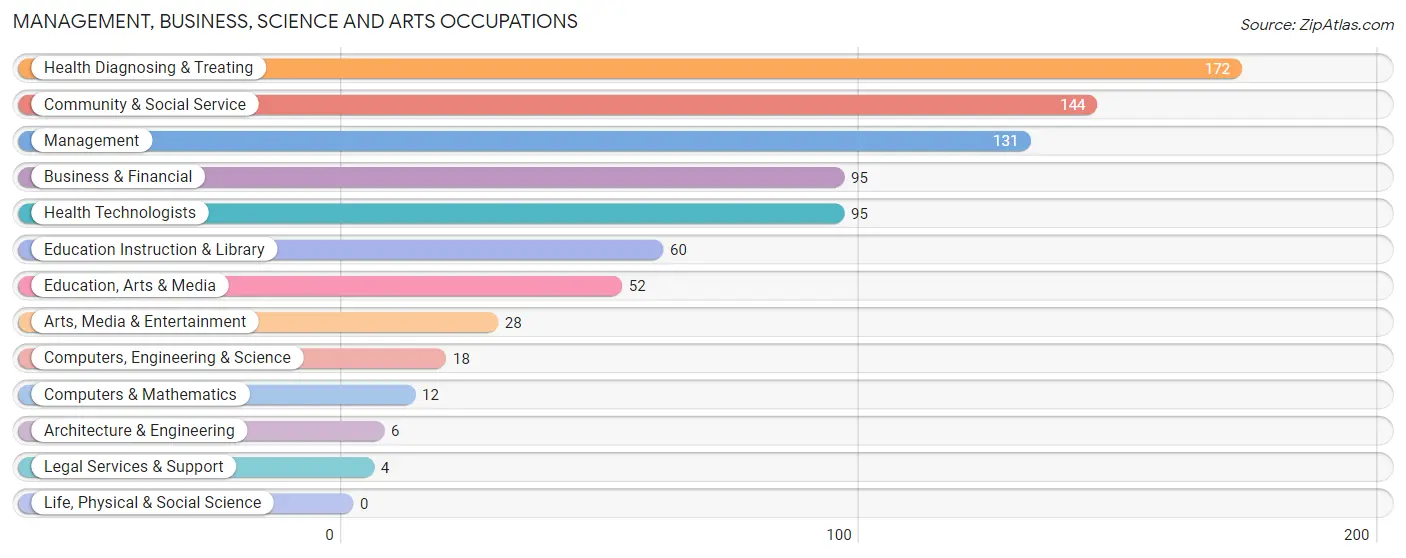
Management, Business, Science and Arts Occupations
The most common Management, Business, Science and Arts occupations in River Bend are Health Diagnosing & Treating (172 | 15.1%), Community & Social Service (144 | 12.7%), Management (131 | 11.5%), Business & Financial (95 | 8.4%), and Health Technologists (95 | 8.4%).
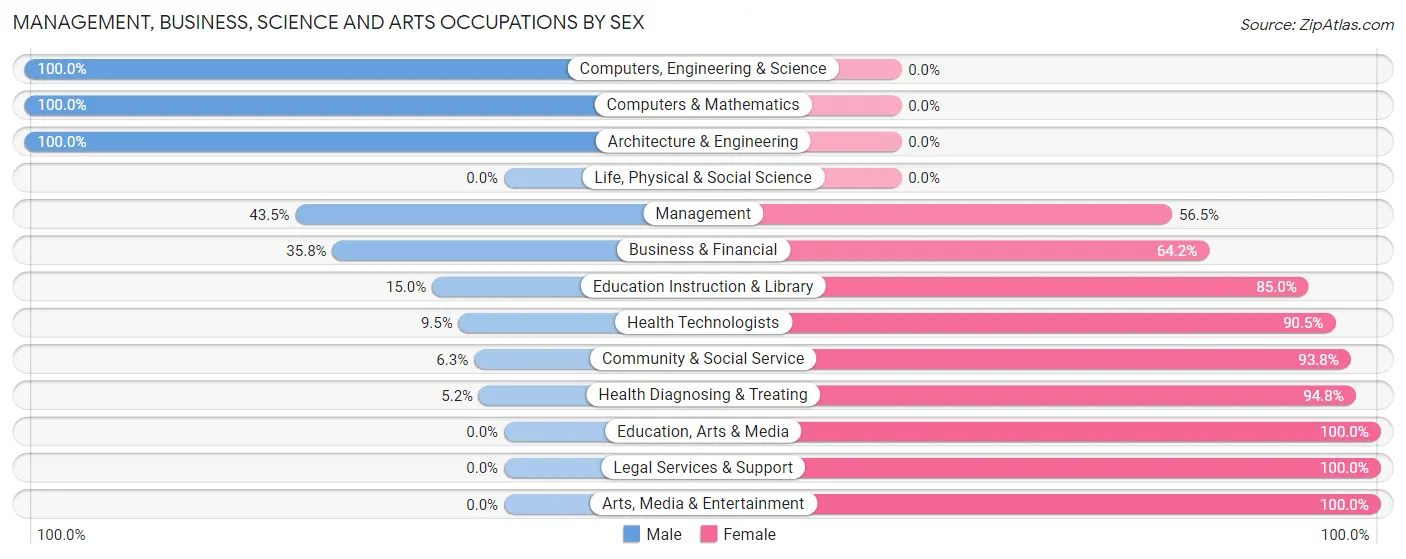
Management, Business, Science and Arts Occupations by Sex
Within the Management, Business, Science and Arts occupations in River Bend, the most male-oriented occupations are Computers, Engineering & Science (100.0%), Computers & Mathematics (100.0%), and Architecture & Engineering (100.0%), while the most female-oriented occupations are Education, Arts & Media (100.0%), Legal Services & Support (100.0%), and Arts, Media & Entertainment (100.0%).
| Occupation | Male | Female |
| Management | 57 (43.5%) | 74 (56.5%) |
| Business & Financial | 34 (35.8%) | 61 (64.2%) |
| Computers, Engineering & Science | 18 (100.0%) | 0 (0.0%) |
| Computers & Mathematics | 12 (100.0%) | 0 (0.0%) |
| Architecture & Engineering | 6 (100.0%) | 0 (0.0%) |
| Life, Physical & Social Science | 0 (0.0%) | 0 (0.0%) |
| Community & Social Service | 9 (6.2%) | 135 (93.8%) |
| Education, Arts & Media | 0 (0.0%) | 52 (100.0%) |
| Legal Services & Support | 0 (0.0%) | 4 (100.0%) |
| Education Instruction & Library | 9 (15.0%) | 51 (85.0%) |
| Arts, Media & Entertainment | 0 (0.0%) | 28 (100.0%) |
| Health Diagnosing & Treating | 9 (5.2%) | 163 (94.8%) |
| Health Technologists | 9 (9.5%) | 86 (90.5%) |
| Total (Category) | 127 (22.7%) | 433 (77.3%) |
| Total (Overall) | 469 (41.2%) | 669 (58.8%) |
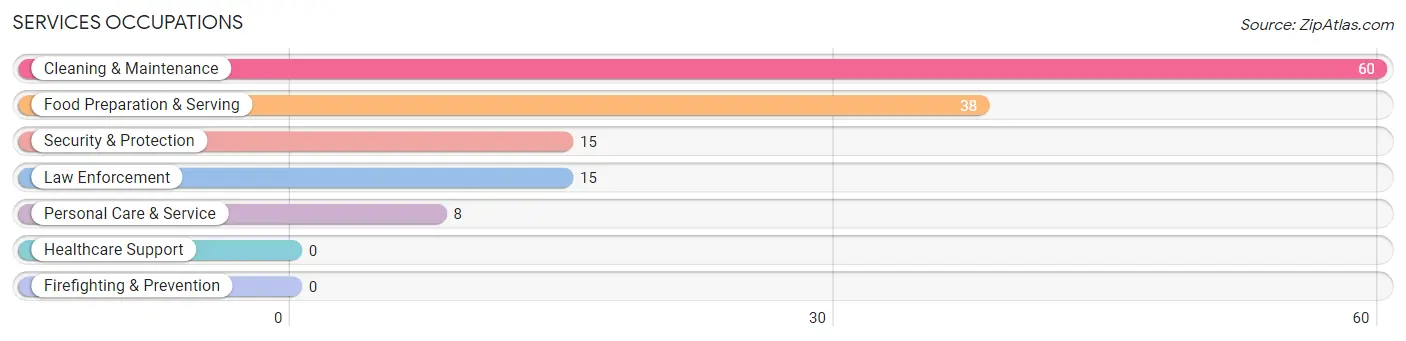
Services Occupations
The most common Services occupations in River Bend are Cleaning & Maintenance (60 | 5.3%), Food Preparation & Serving (38 | 3.3%), Security & Protection (15 | 1.3%), Law Enforcement (15 | 1.3%), and Personal Care & Service (8 | 0.7%).
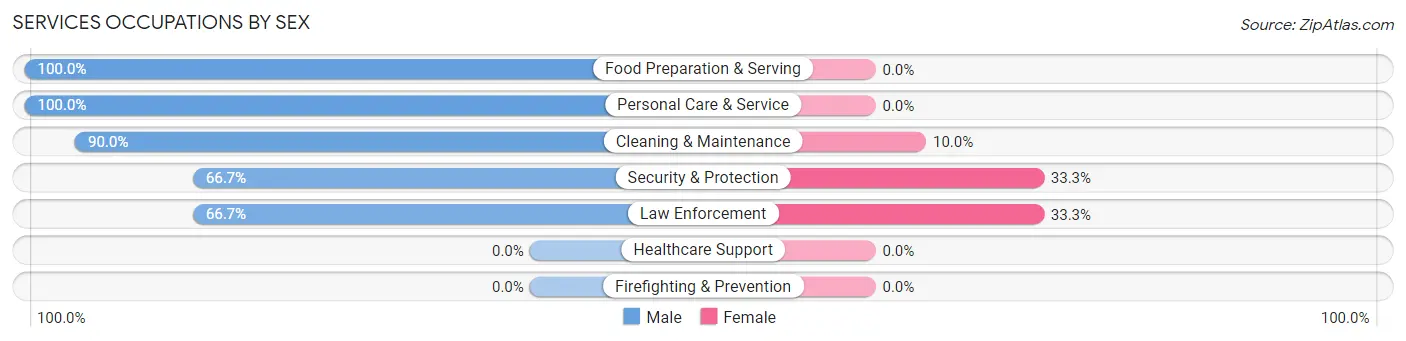
Services Occupations by Sex
Within the Services occupations in River Bend, the most male-oriented occupations are Food Preparation & Serving (100.0%), Personal Care & Service (100.0%), and Cleaning & Maintenance (90.0%), while the most female-oriented occupations are Security & Protection (33.3%), Law Enforcement (33.3%), and Cleaning & Maintenance (10.0%).
| Occupation | Male | Female |
| Healthcare Support | 0 (0.0%) | 0 (0.0%) |
| Security & Protection | 10 (66.7%) | 5 (33.3%) |
| Firefighting & Prevention | 0 (0.0%) | 0 (0.0%) |
| Law Enforcement | 10 (66.7%) | 5 (33.3%) |
| Food Preparation & Serving | 38 (100.0%) | 0 (0.0%) |
| Cleaning & Maintenance | 54 (90.0%) | 6 (10.0%) |
| Personal Care & Service | 8 (100.0%) | 0 (0.0%) |
| Total (Category) | 110 (90.9%) | 11 (9.1%) |
| Total (Overall) | 469 (41.2%) | 669 (58.8%) |
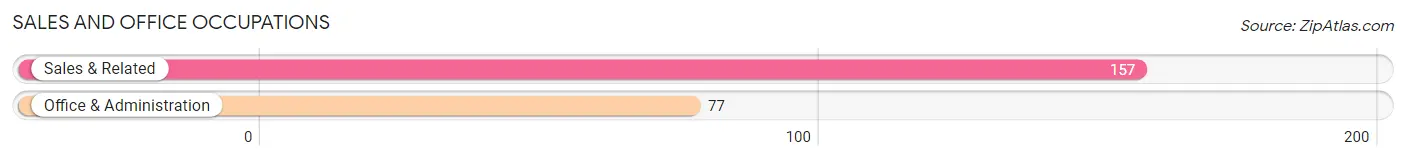
Sales and Office Occupations
The most common Sales and Office occupations in River Bend are Sales & Related (157 | 13.8%), and Office & Administration (77 | 6.8%).
Sales and Office Occupations by Sex
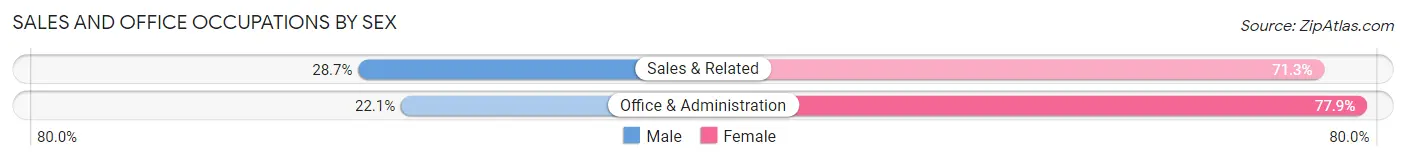
| Occupation | Male | Female |
| Sales & Related | 45 (28.7%) | 112 (71.3%) |
| Office & Administration | 17 (22.1%) | 60 (77.9%) |
| Total (Category) | 62 (26.5%) | 172 (73.5%) |
| Total (Overall) | 469 (41.2%) | 669 (58.8%) |
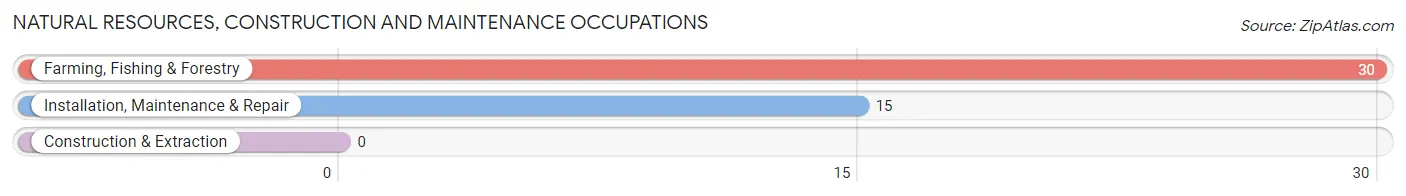
Natural Resources, Construction and Maintenance Occupations
The most common Natural Resources, Construction and Maintenance occupations in River Bend are Farming, Fishing & Forestry (30 | 2.6%), and Installation, Maintenance & Repair (15 | 1.3%).
Natural Resources, Construction and Maintenance Occupations by Sex
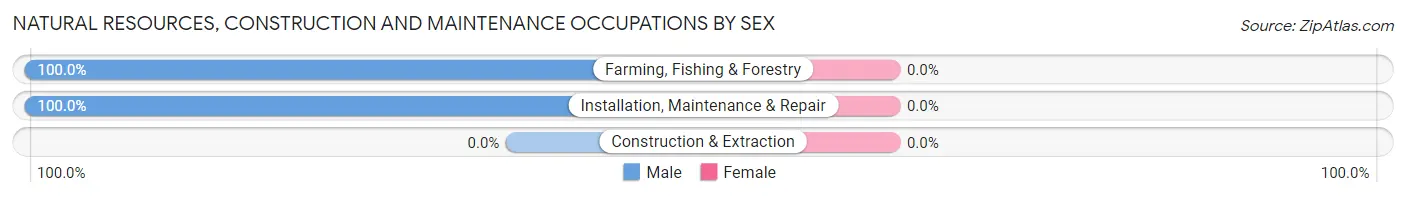
| Occupation | Male | Female |
| Farming, Fishing & Forestry | 30 (100.0%) | 0 (0.0%) |
| Construction & Extraction | 0 (0.0%) | 0 (0.0%) |
| Installation, Maintenance & Repair | 15 (100.0%) | 0 (0.0%) |
| Total (Category) | 45 (100.0%) | 0 (0.0%) |
| Total (Overall) | 469 (41.2%) | 669 (58.8%) |
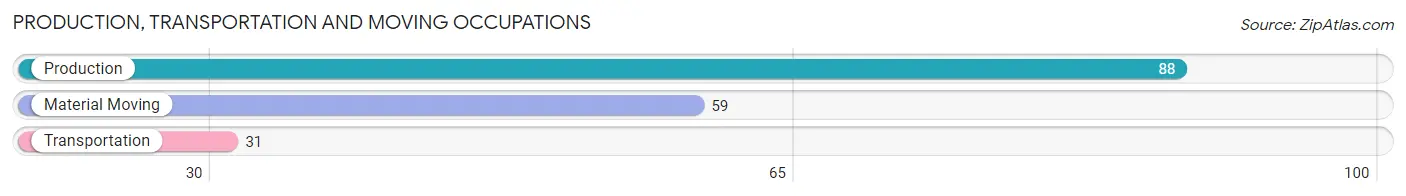
Production, Transportation and Moving Occupations
The most common Production, Transportation and Moving occupations in River Bend are Production (88 | 7.7%), Material Moving (59 | 5.2%), and Transportation (31 | 2.7%).
Production, Transportation and Moving Occupations by Sex
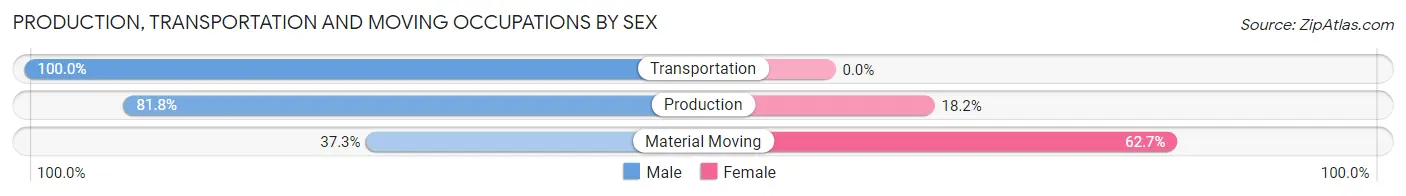
| Occupation | Male | Female |
| Production | 72 (81.8%) | 16 (18.2%) |
| Transportation | 31 (100.0%) | 0 (0.0%) |
| Material Moving | 22 (37.3%) | 37 (62.7%) |
| Total (Category) | 125 (70.2%) | 53 (29.8%) |
| Total (Overall) | 469 (41.2%) | 669 (58.8%) |
Employment Industries by Sex in River Bend
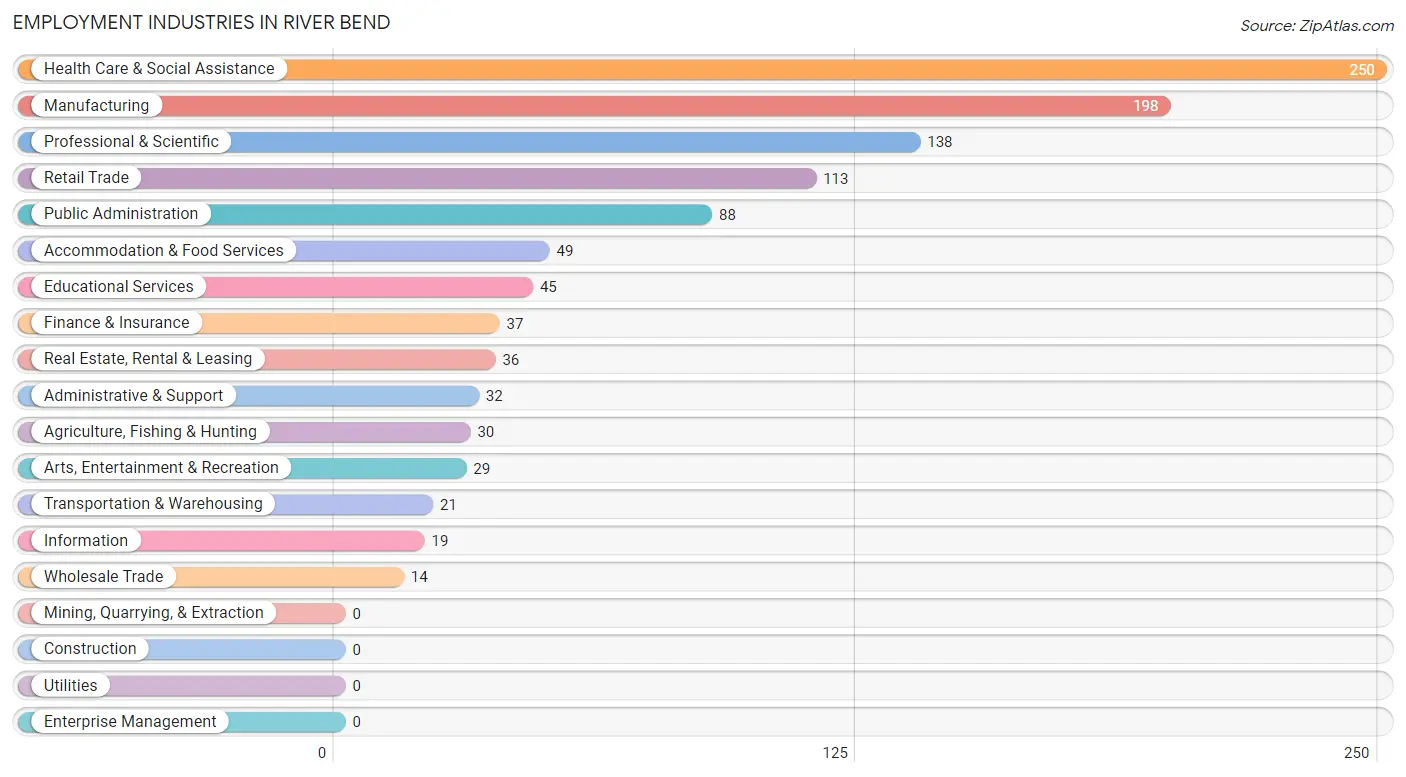
Employment Industries in River Bend
The major employment industries in River Bend include Health Care & Social Assistance (250 | 22.0%), Manufacturing (198 | 17.4%), Professional & Scientific (138 | 12.1%), Retail Trade (113 | 9.9%), and Public Administration (88 | 7.7%).
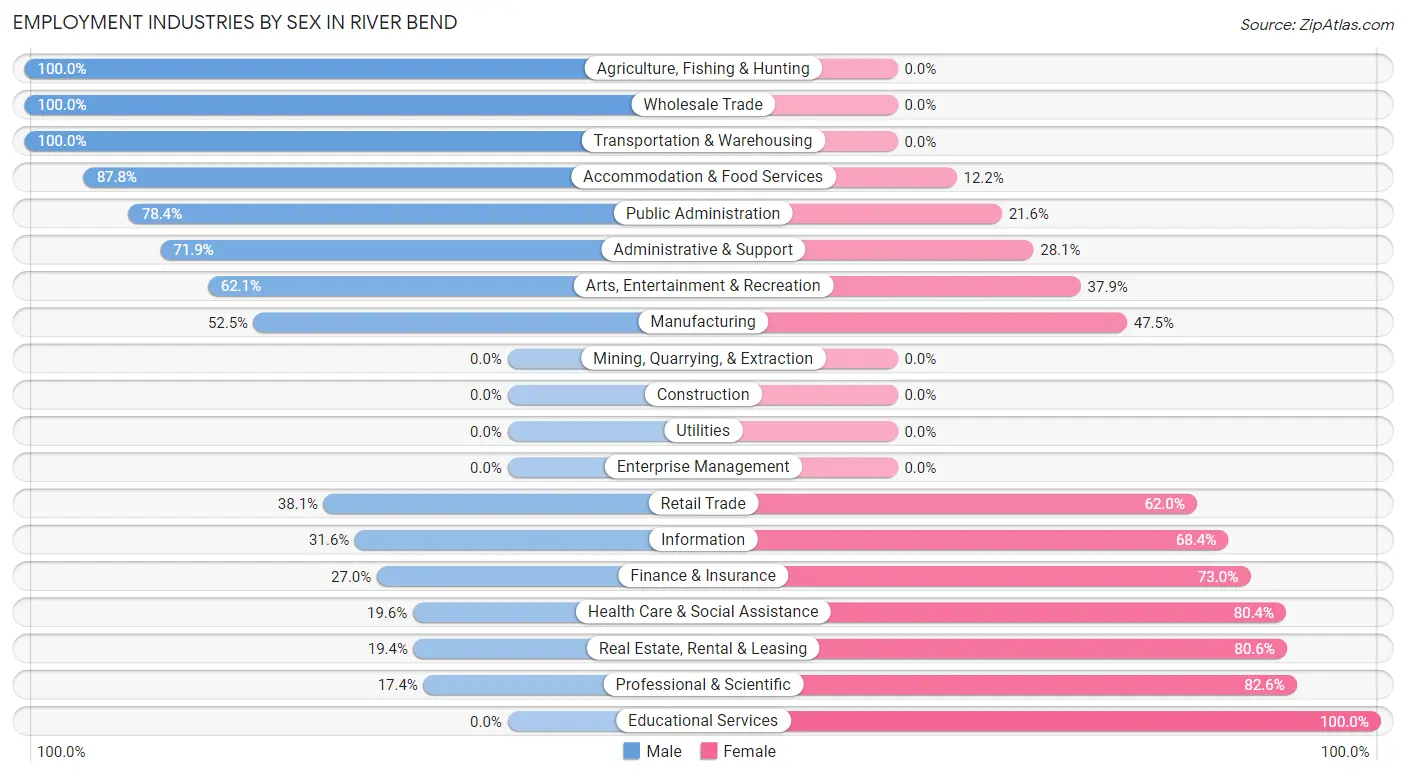
Employment Industries by Sex in River Bend
The River Bend industries that see more men than women are Agriculture, Fishing & Hunting (100.0%), Wholesale Trade (100.0%), and Transportation & Warehousing (100.0%), whereas the industries that tend to have a higher number of women are Educational Services (100.0%), Professional & Scientific (82.6%), and Real Estate, Rental & Leasing (80.6%).
| Industry | Male | Female |
| Agriculture, Fishing & Hunting | 30 (100.0%) | 0 (0.0%) |
| Mining, Quarrying, & Extraction | 0 (0.0%) | 0 (0.0%) |
| Construction | 0 (0.0%) | 0 (0.0%) |
| Manufacturing | 104 (52.5%) | 94 (47.5%) |
| Wholesale Trade | 14 (100.0%) | 0 (0.0%) |
| Retail Trade | 43 (38.1%) | 70 (62.0%) |
| Transportation & Warehousing | 21 (100.0%) | 0 (0.0%) |
| Utilities | 0 (0.0%) | 0 (0.0%) |
| Information | 6 (31.6%) | 13 (68.4%) |
| Finance & Insurance | 10 (27.0%) | 27 (73.0%) |
| Real Estate, Rental & Leasing | 7 (19.4%) | 29 (80.6%) |
| Professional & Scientific | 24 (17.4%) | 114 (82.6%) |
| Enterprise Management | 0 (0.0%) | 0 (0.0%) |
| Administrative & Support | 23 (71.9%) | 9 (28.1%) |
| Educational Services | 0 (0.0%) | 45 (100.0%) |
| Health Care & Social Assistance | 49 (19.6%) | 201 (80.4%) |
| Arts, Entertainment & Recreation | 18 (62.1%) | 11 (37.9%) |
| Accommodation & Food Services | 43 (87.8%) | 6 (12.2%) |
| Public Administration | 69 (78.4%) | 19 (21.6%) |
| Total | 469 (41.2%) | 669 (58.8%) |
Education in River Bend
School Enrollment in River Bend
The most common levels of schooling among the 502 students in River Bend are college / undergraduate (143 | 28.5%), high school (137 | 27.3%), and middle school (75 | 14.9%).
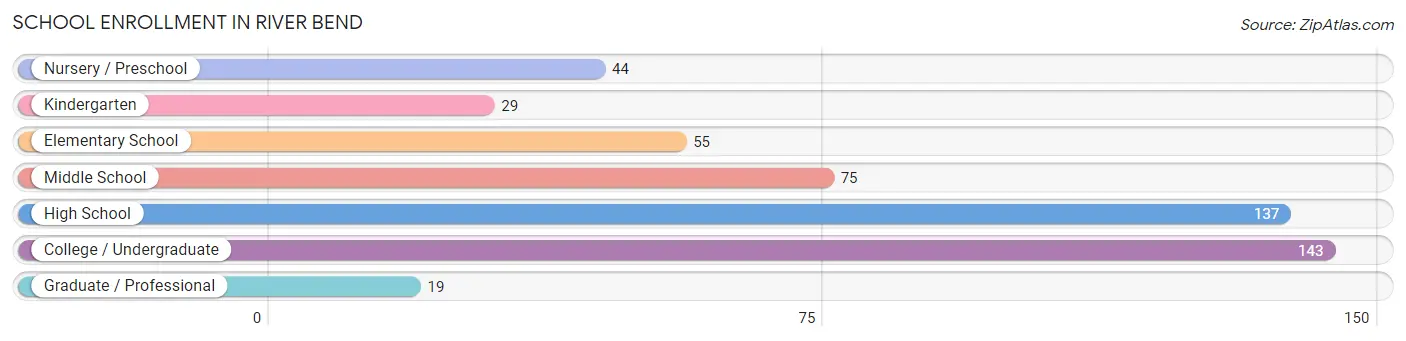
| School Level | # Students | % Students |
| Nursery / Preschool | 44 | 8.8% |
| Kindergarten | 29 | 5.8% |
| Elementary School | 55 | 11.0% |
| Middle School | 75 | 14.9% |
| High School | 137 | 27.3% |
| College / Undergraduate | 143 | 28.5% |
| Graduate / Professional | 19 | 3.8% |
| Total | 502 | 100.0% |
School Enrollment by Age by Funding Source in River Bend
Out of a total of 502 students who are enrolled in schools in River Bend, 77 (15.3%) attend a private institution, while the remaining 425 (84.7%) are enrolled in public schools. The age group of 3 to 4 year olds has the highest likelihood of being enrolled in private schools, with 31 (70.5% in the age bracket) enrolled. Conversely, the age group of 15 to 17 year olds has the lowest likelihood of being enrolled in a private school, with 45 (100.0% in the age bracket) attending a public institution.
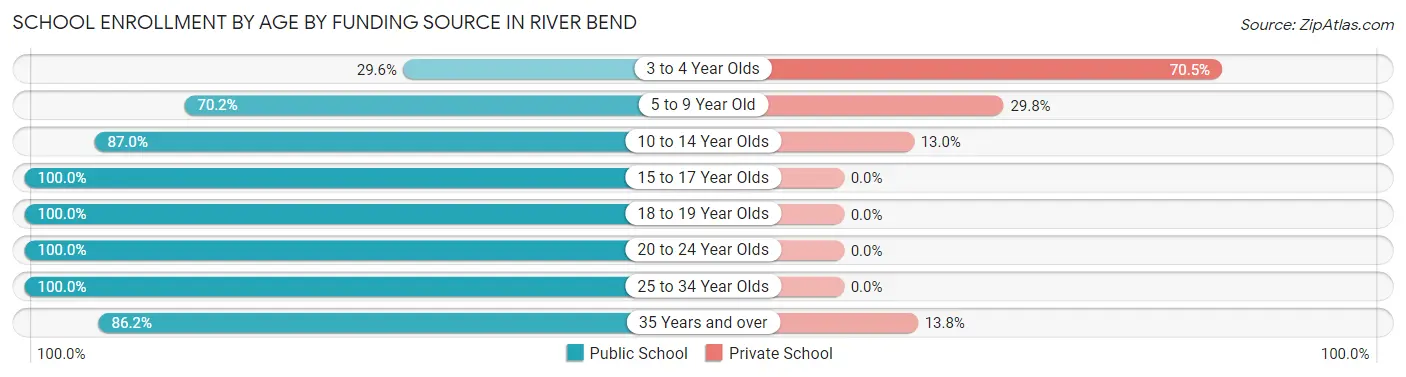
| Age Bracket | Public School | Private School |
| 3 to 4 Year Olds | 13 (29.5%) | 31 (70.5%) |
| 5 to 9 Year Old | 59 (70.2%) | 25 (29.8%) |
| 10 to 14 Year Olds | 60 (87.0%) | 9 (13.0%) |
| 15 to 17 Year Olds | 45 (100.0%) | 0 (0.0%) |
| 18 to 19 Year Olds | 117 (100.0%) | 0 (0.0%) |
| 20 to 24 Year Olds | 22 (100.0%) | 0 (0.0%) |
| 25 to 34 Year Olds | 34 (100.0%) | 0 (0.0%) |
| 35 Years and over | 75 (86.2%) | 12 (13.8%) |
| Total | 425 (84.7%) | 77 (15.3%) |
Educational Attainment by Field of Study in River Bend
Social sciences (225 | 24.3%), education (103 | 11.1%), business (95 | 10.3%), arts & humanities (95 | 10.3%), and bio, nature & agricultural (92 | 9.9%) are the most common fields of study among 926 individuals in River Bend who have obtained a bachelor's degree or higher.
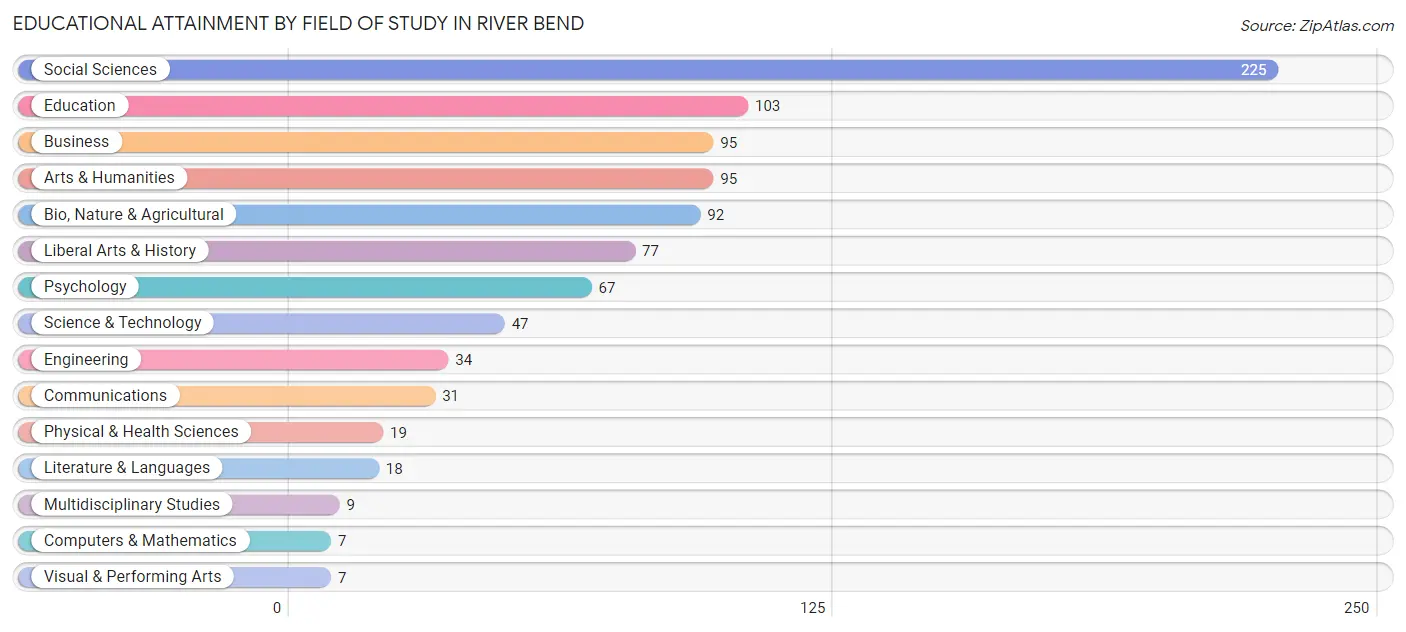
| Field of Study | # Graduates | % Graduates |
| Computers & Mathematics | 7 | 0.8% |
| Bio, Nature & Agricultural | 92 | 9.9% |
| Physical & Health Sciences | 19 | 2.1% |
| Psychology | 67 | 7.2% |
| Social Sciences | 225 | 24.3% |
| Engineering | 34 | 3.7% |
| Multidisciplinary Studies | 9 | 1.0% |
| Science & Technology | 47 | 5.1% |
| Business | 95 | 10.3% |
| Education | 103 | 11.1% |
| Literature & Languages | 18 | 1.9% |
| Liberal Arts & History | 77 | 8.3% |
| Visual & Performing Arts | 7 | 0.8% |
| Communications | 31 | 3.4% |
| Arts & Humanities | 95 | 10.3% |
| Total | 926 | 100.0% |
Transportation & Commute in River Bend
Vehicle Availability by Sex in River Bend
The most prevalent vehicle ownership categories in River Bend are males with 2 vehicles (287, accounting for 63.9%) and females with 2 vehicles (243, making up 42.9%).
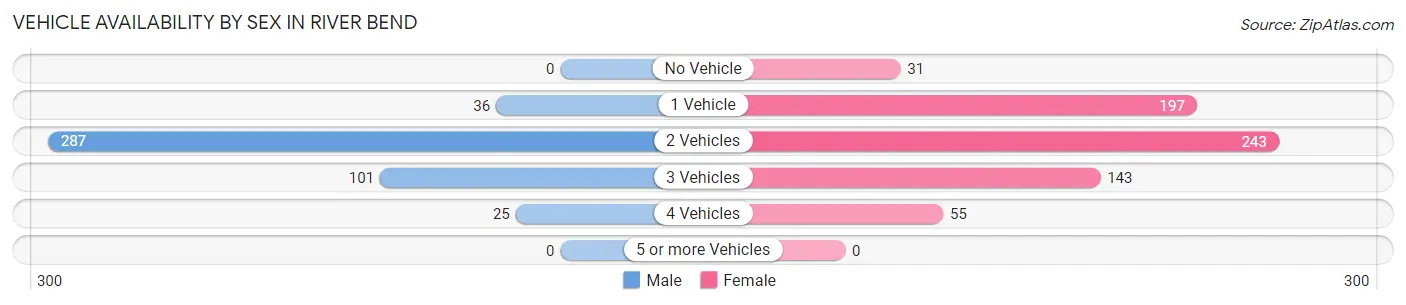
| Vehicles Available | Male | Female |
| No Vehicle | 0 (0.0%) | 31 (4.6%) |
| 1 Vehicle | 36 (8.0%) | 197 (29.4%) |
| 2 Vehicles | 287 (63.9%) | 243 (36.3%) |
| 3 Vehicles | 101 (22.5%) | 143 (21.4%) |
| 4 Vehicles | 25 (5.6%) | 55 (8.2%) |
| 5 or more Vehicles | 0 (0.0%) | 0 (0.0%) |
| Total | 449 (100.0%) | 669 (100.0%) |
Commute Time in River Bend
The most frequently occuring commute durations in River Bend are 10 to 14 minutes (255 commuters, 23.3%), 15 to 19 minutes (235 commuters, 21.5%), and 20 to 24 minutes (215 commuters, 19.7%).
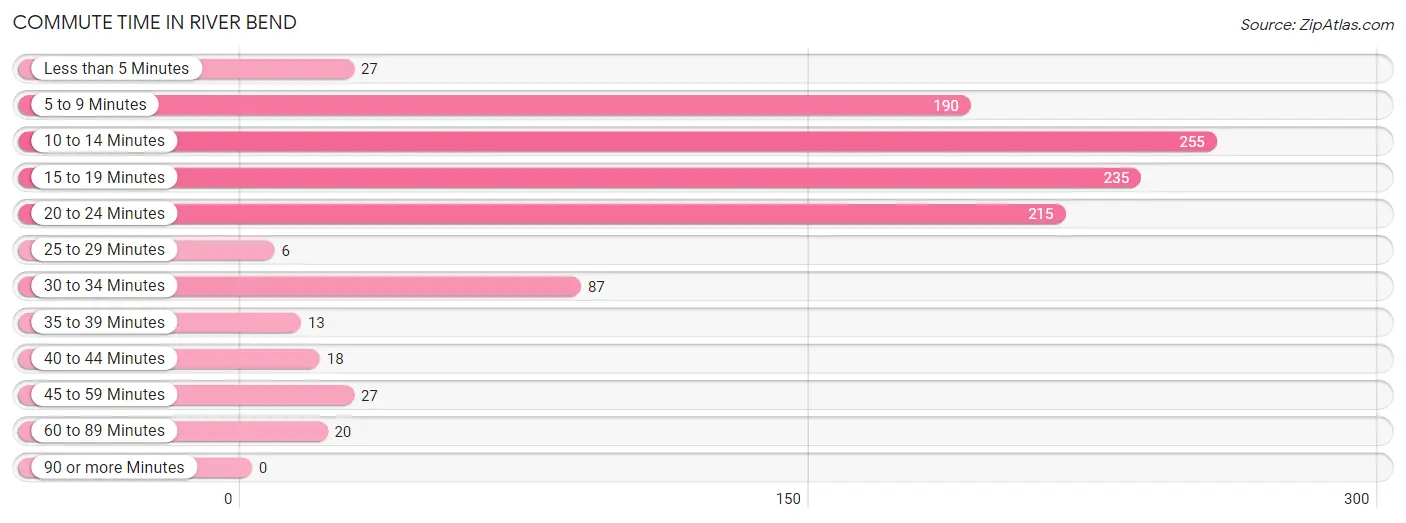
| Commute Time | # Commuters | % Commuters |
| Less than 5 Minutes | 27 | 2.5% |
| 5 to 9 Minutes | 190 | 17.4% |
| 10 to 14 Minutes | 255 | 23.3% |
| 15 to 19 Minutes | 235 | 21.5% |
| 20 to 24 Minutes | 215 | 19.7% |
| 25 to 29 Minutes | 6 | 0.5% |
| 30 to 34 Minutes | 87 | 8.0% |
| 35 to 39 Minutes | 13 | 1.2% |
| 40 to 44 Minutes | 18 | 1.7% |
| 45 to 59 Minutes | 27 | 2.5% |
| 60 to 89 Minutes | 20 | 1.8% |
| 90 or more Minutes | 0 | 0.0% |
Commute Time by Sex in River Bend
The most common commute times in River Bend are 20 to 24 minutes (103 commuters, 24.3%) for males and 10 to 14 minutes (177 commuters, 26.5%) for females.
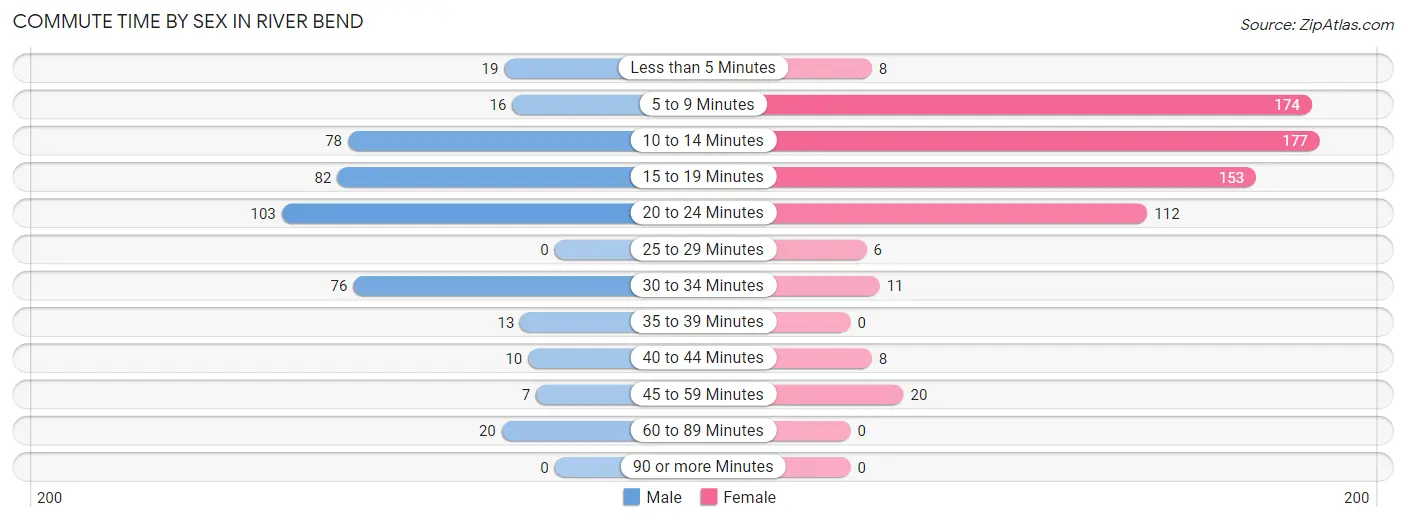
| Commute Time | Male | Female |
| Less than 5 Minutes | 19 (4.5%) | 8 (1.2%) |
| 5 to 9 Minutes | 16 (3.8%) | 174 (26.0%) |
| 10 to 14 Minutes | 78 (18.4%) | 177 (26.5%) |
| 15 to 19 Minutes | 82 (19.3%) | 153 (22.9%) |
| 20 to 24 Minutes | 103 (24.3%) | 112 (16.7%) |
| 25 to 29 Minutes | 0 (0.0%) | 6 (0.9%) |
| 30 to 34 Minutes | 76 (17.9%) | 11 (1.6%) |
| 35 to 39 Minutes | 13 (3.1%) | 0 (0.0%) |
| 40 to 44 Minutes | 10 (2.4%) | 8 (1.2%) |
| 45 to 59 Minutes | 7 (1.7%) | 20 (3.0%) |
| 60 to 89 Minutes | 20 (4.7%) | 0 (0.0%) |
| 90 or more Minutes | 0 (0.0%) | 0 (0.0%) |
Time of Departure to Work by Sex in River Bend
The most frequent times of departure to work in River Bend are 7:00 AM to 7:29 AM (136, 32.1%) for males and 7:30 AM to 7:59 AM (139, 20.8%) for females.
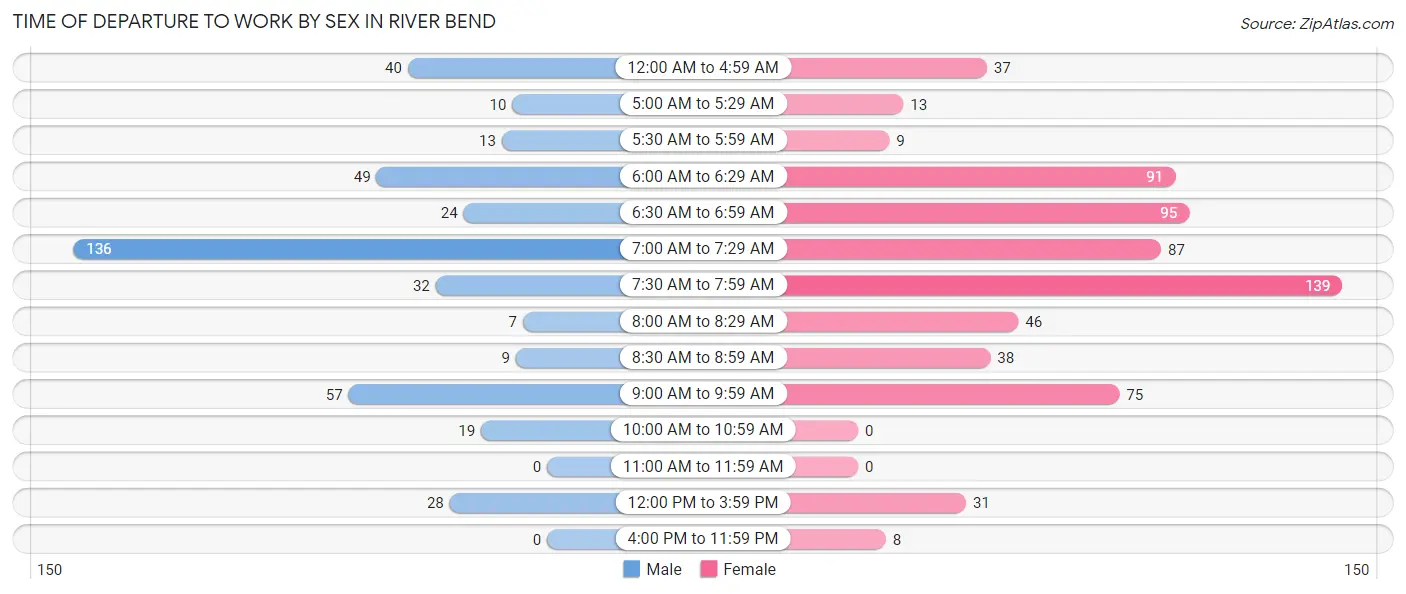
| Time of Departure | Male | Female |
| 12:00 AM to 4:59 AM | 40 (9.4%) | 37 (5.5%) |
| 5:00 AM to 5:29 AM | 10 (2.4%) | 13 (1.9%) |
| 5:30 AM to 5:59 AM | 13 (3.1%) | 9 (1.3%) |
| 6:00 AM to 6:29 AM | 49 (11.6%) | 91 (13.6%) |
| 6:30 AM to 6:59 AM | 24 (5.7%) | 95 (14.2%) |
| 7:00 AM to 7:29 AM | 136 (32.1%) | 87 (13.0%) |
| 7:30 AM to 7:59 AM | 32 (7.5%) | 139 (20.8%) |
| 8:00 AM to 8:29 AM | 7 (1.7%) | 46 (6.9%) |
| 8:30 AM to 8:59 AM | 9 (2.1%) | 38 (5.7%) |
| 9:00 AM to 9:59 AM | 57 (13.4%) | 75 (11.2%) |
| 10:00 AM to 10:59 AM | 19 (4.5%) | 0 (0.0%) |
| 11:00 AM to 11:59 AM | 0 (0.0%) | 0 (0.0%) |
| 12:00 PM to 3:59 PM | 28 (6.6%) | 31 (4.6%) |
| 4:00 PM to 11:59 PM | 0 (0.0%) | 8 (1.2%) |
| Total | 424 (100.0%) | 669 (100.0%) |
Housing Occupancy in River Bend
Occupancy by Ownership in River Bend
Of the total 1,322 dwellings in River Bend, owner-occupied units account for 1,177 (89.0%), while renter-occupied units make up 145 (11.0%).
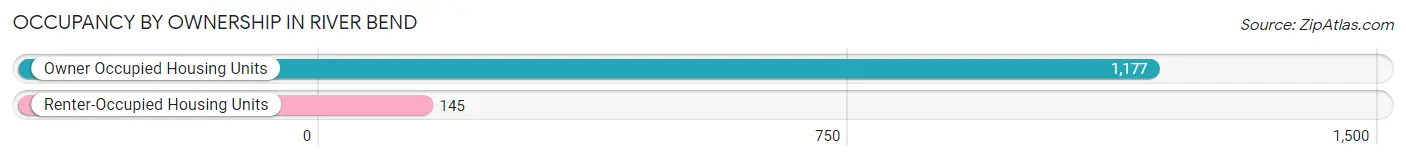
| Occupancy | # Housing Units | % Housing Units |
| Owner Occupied Housing Units | 1,177 | 89.0% |
| Renter-Occupied Housing Units | 145 | 11.0% |
| Total Occupied Housing Units | 1,322 | 100.0% |
Occupancy by Household Size in River Bend
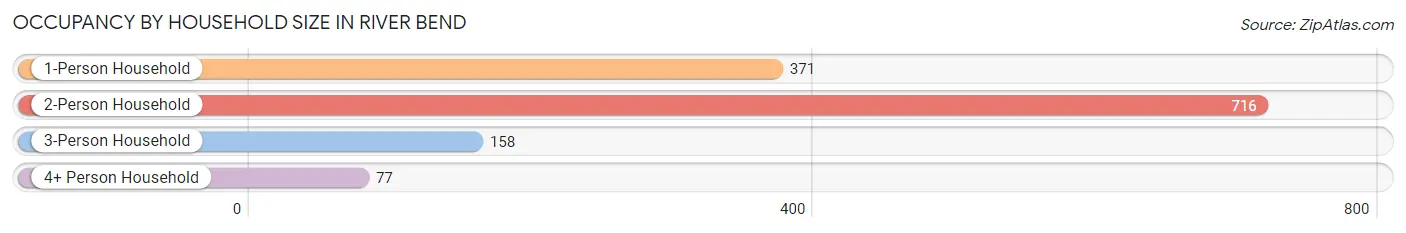
| Household Size | # Housing Units | % Housing Units |
| 1-Person Household | 371 | 28.1% |
| 2-Person Household | 716 | 54.2% |
| 3-Person Household | 158 | 11.9% |
| 4+ Person Household | 77 | 5.8% |
| Total Housing Units | 1,322 | 100.0% |
Occupancy by Ownership by Household Size in River Bend
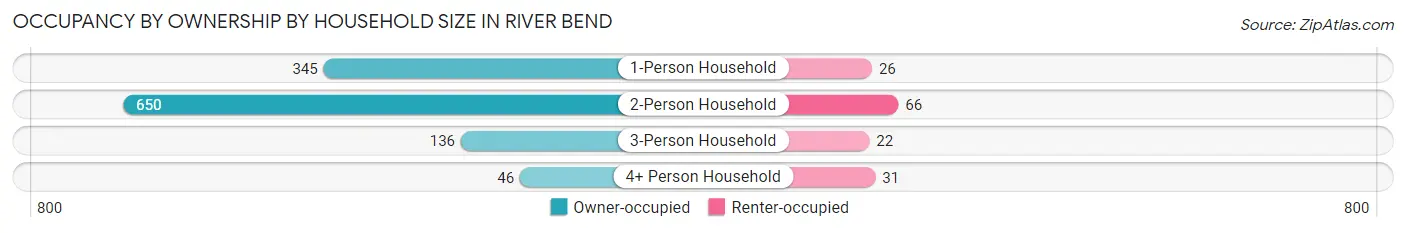
| Household Size | Owner-occupied | Renter-occupied |
| 1-Person Household | 345 (93.0%) | 26 (7.0%) |
| 2-Person Household | 650 (90.8%) | 66 (9.2%) |
| 3-Person Household | 136 (86.1%) | 22 (13.9%) |
| 4+ Person Household | 46 (59.7%) | 31 (40.3%) |
| Total Housing Units | 1,177 (89.0%) | 145 (11.0%) |
Occupancy by Educational Attainment in River Bend
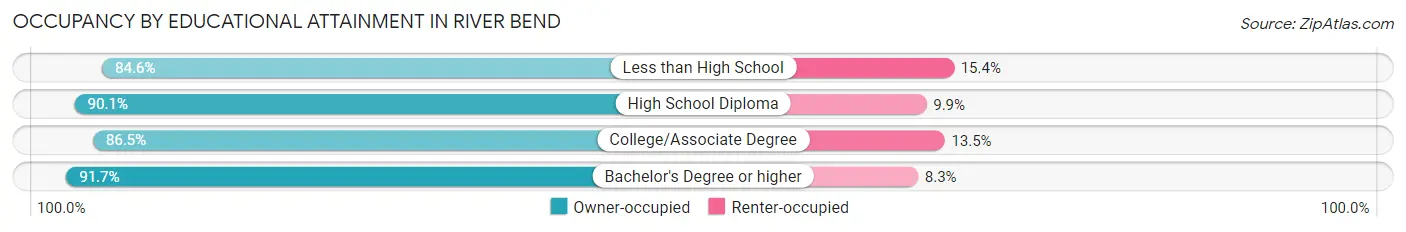
| Household Size | Owner-occupied | Renter-occupied |
| Less than High School | 33 (84.6%) | 6 (15.4%) |
| High School Diploma | 136 (90.1%) | 15 (9.9%) |
| College/Associate Degree | 498 (86.5%) | 78 (13.5%) |
| Bachelor's Degree or higher | 510 (91.7%) | 46 (8.3%) |
Occupancy by Age of Householder in River Bend
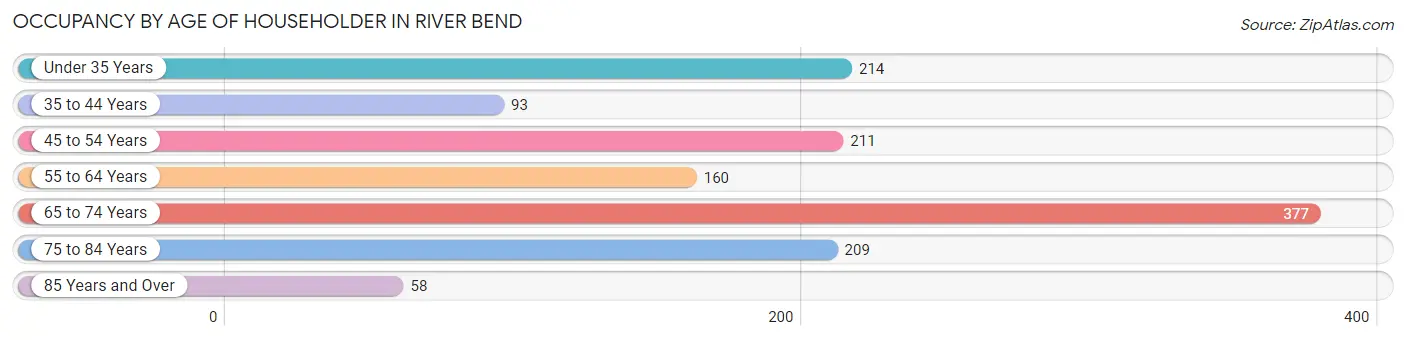
| Age Bracket | # Households | % Households |
| Under 35 Years | 214 | 16.2% |
| 35 to 44 Years | 93 | 7.0% |
| 45 to 54 Years | 211 | 16.0% |
| 55 to 64 Years | 160 | 12.1% |
| 65 to 74 Years | 377 | 28.5% |
| 75 to 84 Years | 209 | 15.8% |
| 85 Years and Over | 58 | 4.4% |
| Total | 1,322 | 100.0% |
Housing Finances in River Bend
Median Income by Occupancy in River Bend
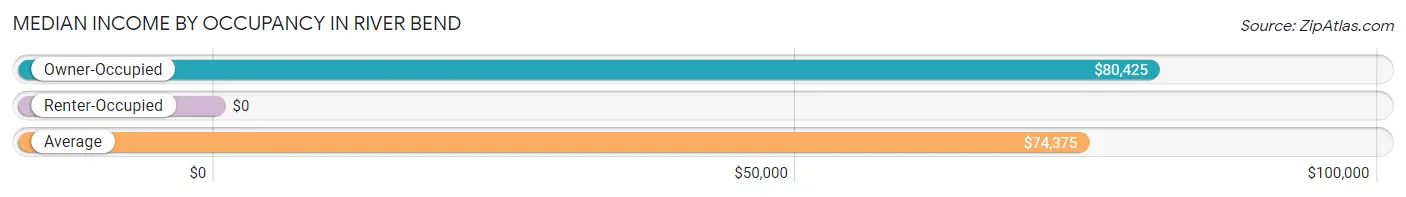
| Occupancy Type | # Households | Median Income |
| Owner-Occupied | 1,177 (89.0%) | $80,425 |
| Renter-Occupied | 145 (11.0%) | $0 |
| Average | 1,322 (100.0%) | $74,375 |
Occupancy by Householder Income Bracket in River Bend
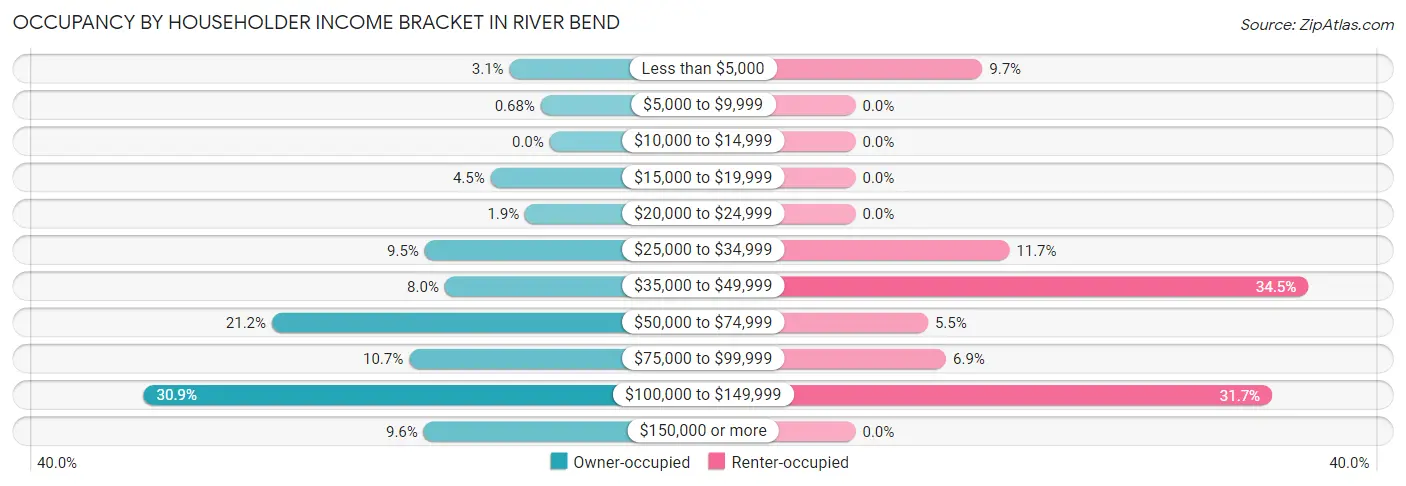
| Income Bracket | Owner-occupied | Renter-occupied |
| Less than $5,000 | 36 (3.1%) | 14 (9.7%) |
| $5,000 to $9,999 | 8 (0.7%) | 0 (0.0%) |
| $10,000 to $14,999 | 0 (0.0%) | 0 (0.0%) |
| $15,000 to $19,999 | 53 (4.5%) | 0 (0.0%) |
| $20,000 to $24,999 | 22 (1.9%) | 0 (0.0%) |
| $25,000 to $34,999 | 112 (9.5%) | 17 (11.7%) |
| $35,000 to $49,999 | 94 (8.0%) | 50 (34.5%) |
| $50,000 to $74,999 | 249 (21.2%) | 8 (5.5%) |
| $75,000 to $99,999 | 126 (10.7%) | 10 (6.9%) |
| $100,000 to $149,999 | 364 (30.9%) | 46 (31.7%) |
| $150,000 or more | 113 (9.6%) | 0 (0.0%) |
| Total | 1,177 (100.0%) | 145 (100.0%) |
Monthly Housing Cost Tiers in River Bend
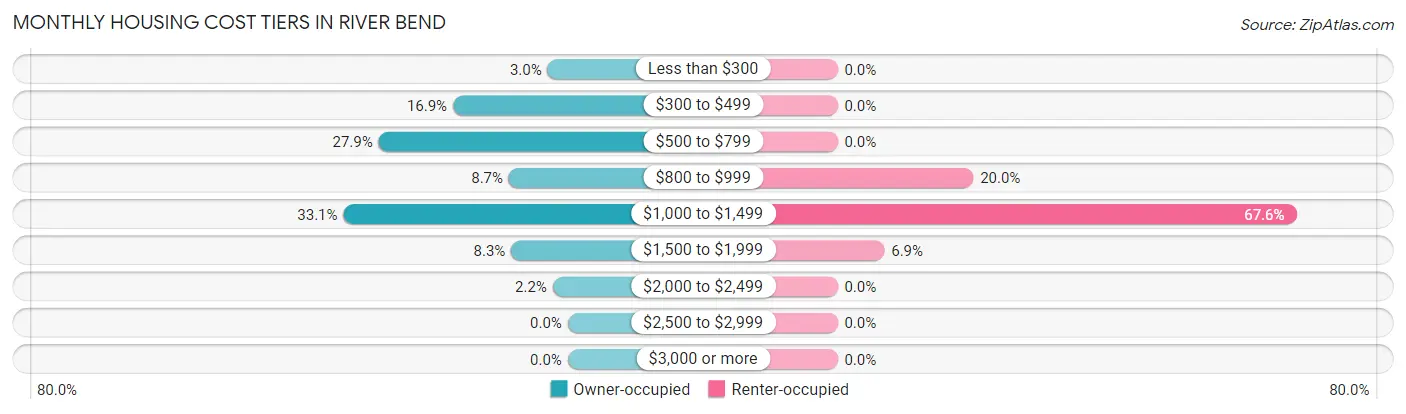
| Monthly Cost | Owner-occupied | Renter-occupied |
| Less than $300 | 35 (3.0%) | 0 (0.0%) |
| $300 to $499 | 199 (16.9%) | 0 (0.0%) |
| $500 to $799 | 328 (27.9%) | 0 (0.0%) |
| $800 to $999 | 102 (8.7%) | 29 (20.0%) |
| $1,000 to $1,499 | 389 (33.1%) | 98 (67.6%) |
| $1,500 to $1,999 | 98 (8.3%) | 10 (6.9%) |
| $2,000 to $2,499 | 26 (2.2%) | 0 (0.0%) |
| $2,500 to $2,999 | 0 (0.0%) | 0 (0.0%) |
| $3,000 or more | 0 (0.0%) | 0 (0.0%) |
| Total | 1,177 (100.0%) | 145 (100.0%) |
Physical Housing Characteristics in River Bend
Housing Structures in River Bend
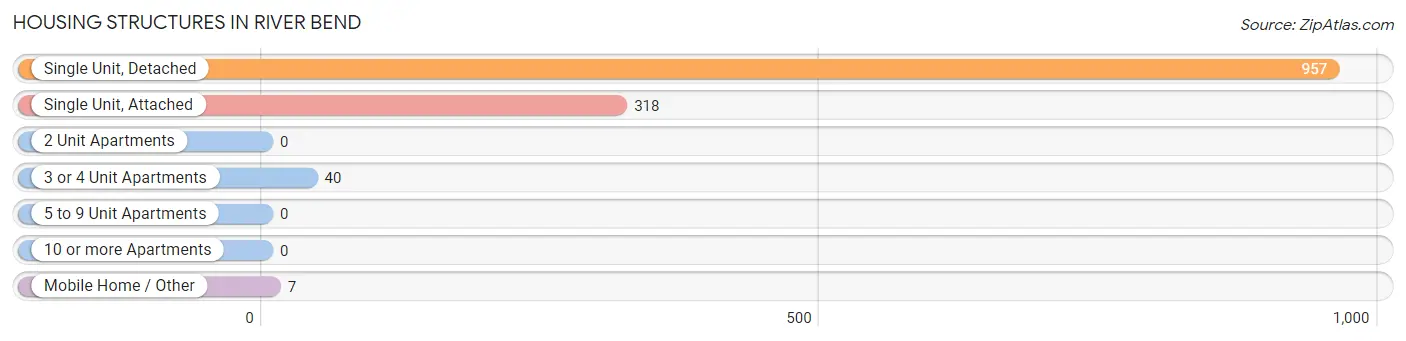
| Structure Type | # Housing Units | % Housing Units |
| Single Unit, Detached | 957 | 72.4% |
| Single Unit, Attached | 318 | 24.0% |
| 2 Unit Apartments | 0 | 0.0% |
| 3 or 4 Unit Apartments | 40 | 3.0% |
| 5 to 9 Unit Apartments | 0 | 0.0% |
| 10 or more Apartments | 0 | 0.0% |
| Mobile Home / Other | 7 | 0.5% |
| Total | 1,322 | 100.0% |
Housing Structures by Occupancy in River Bend
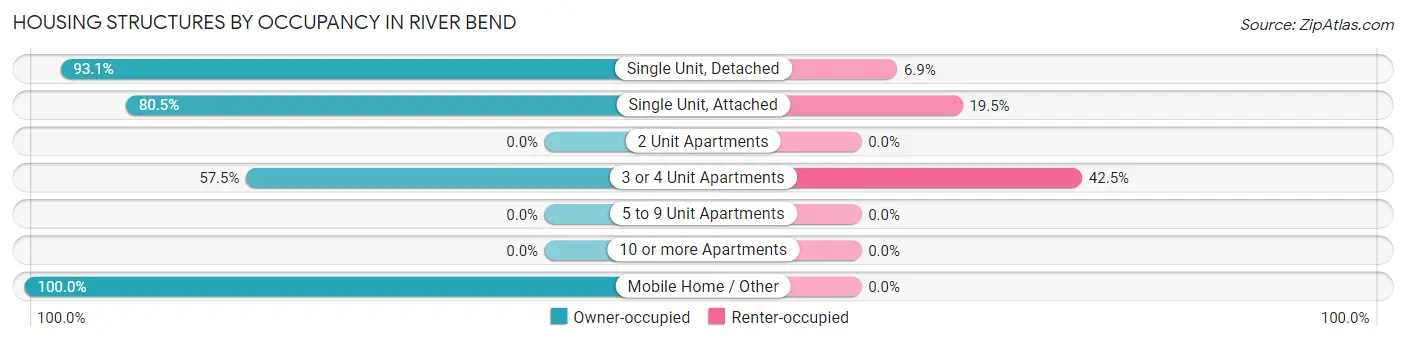
| Structure Type | Owner-occupied | Renter-occupied |
| Single Unit, Detached | 891 (93.1%) | 66 (6.9%) |
| Single Unit, Attached | 256 (80.5%) | 62 (19.5%) |
| 2 Unit Apartments | 0 (0.0%) | 0 (0.0%) |
| 3 or 4 Unit Apartments | 23 (57.5%) | 17 (42.5%) |
| 5 to 9 Unit Apartments | 0 (0.0%) | 0 (0.0%) |
| 10 or more Apartments | 0 (0.0%) | 0 (0.0%) |
| Mobile Home / Other | 7 (100.0%) | 0 (0.0%) |
| Total | 1,177 (89.0%) | 145 (11.0%) |
Housing Structures by Number of Rooms in River Bend
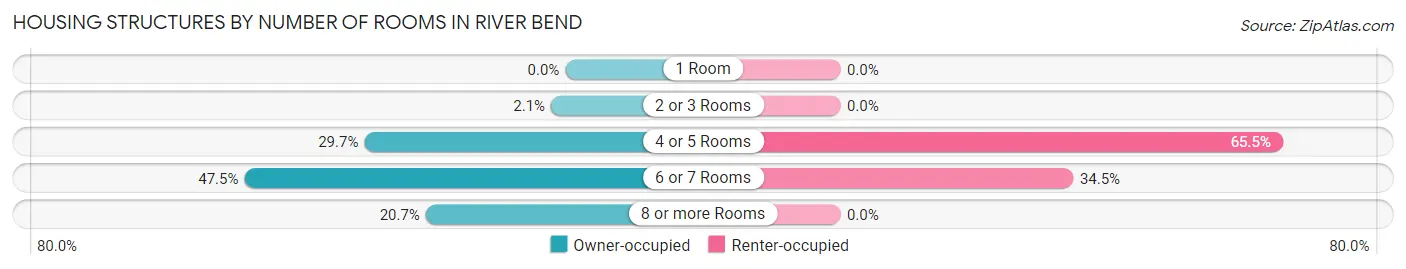
| Number of Rooms | Owner-occupied | Renter-occupied |
| 1 Room | 0 (0.0%) | 0 (0.0%) |
| 2 or 3 Rooms | 25 (2.1%) | 0 (0.0%) |
| 4 or 5 Rooms | 350 (29.7%) | 95 (65.5%) |
| 6 or 7 Rooms | 559 (47.5%) | 50 (34.5%) |
| 8 or more Rooms | 243 (20.6%) | 0 (0.0%) |
| Total | 1,177 (100.0%) | 145 (100.0%) |
Housing Structure by Heating Type in River Bend
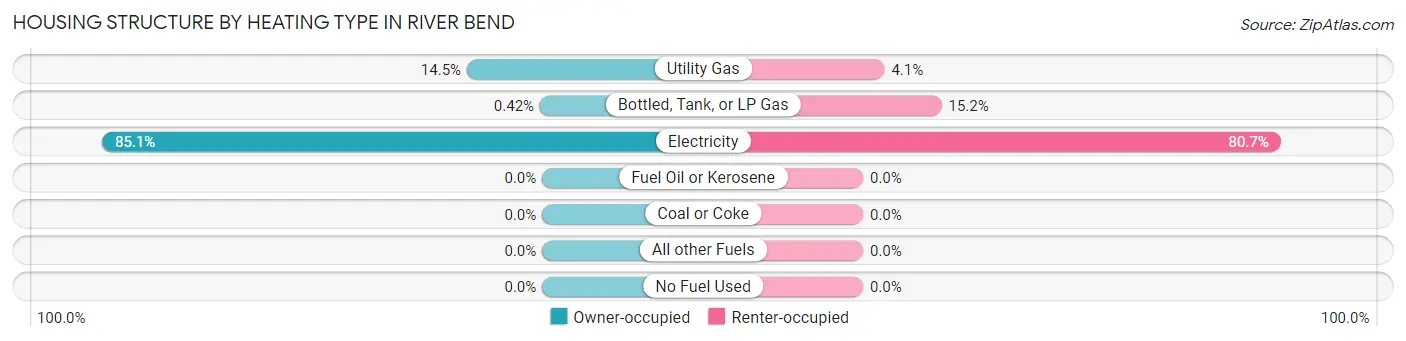
| Heating Type | Owner-occupied | Renter-occupied |
| Utility Gas | 171 (14.5%) | 6 (4.1%) |
| Bottled, Tank, or LP Gas | 5 (0.4%) | 22 (15.2%) |
| Electricity | 1,001 (85.1%) | 117 (80.7%) |
| Fuel Oil or Kerosene | 0 (0.0%) | 0 (0.0%) |
| Coal or Coke | 0 (0.0%) | 0 (0.0%) |
| All other Fuels | 0 (0.0%) | 0 (0.0%) |
| No Fuel Used | 0 (0.0%) | 0 (0.0%) |
| Total | 1,177 (100.0%) | 145 (100.0%) |
Household Vehicle Usage in River Bend
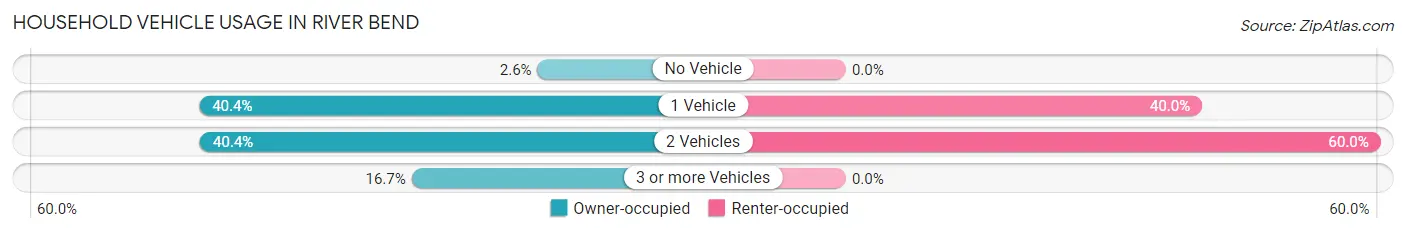
| Vehicles per Household | Owner-occupied | Renter-occupied |
| No Vehicle | 30 (2.5%) | 0 (0.0%) |
| 1 Vehicle | 476 (40.4%) | 58 (40.0%) |
| 2 Vehicles | 475 (40.4%) | 87 (60.0%) |
| 3 or more Vehicles | 196 (16.7%) | 0 (0.0%) |
| Total | 1,177 (100.0%) | 145 (100.0%) |
Real Estate & Mortgages in River Bend
Real Estate and Mortgage Overview in River Bend
| Characteristic | Without Mortgage | With Mortgage |
| Housing Units | 558 | 619 |
| Median Property Value | $236,100 | $198,900 |
| Median Household Income | $80,811 | $51 |
| Monthly Housing Costs | $558 | $0 |
| Real Estate Taxes | $1,641 | $56 |
Property Value by Mortgage Status in River Bend
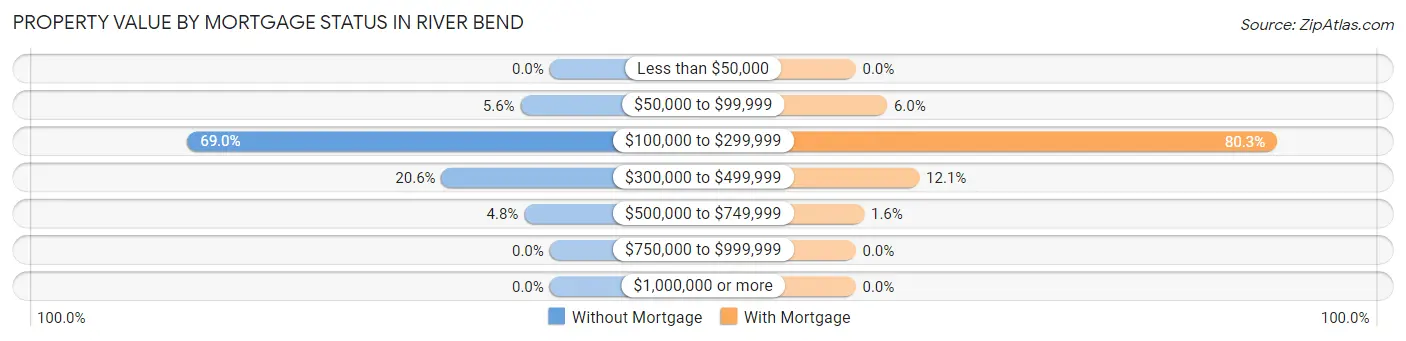
| Property Value | Without Mortgage | With Mortgage |
| Less than $50,000 | 0 (0.0%) | 0 (0.0%) |
| $50,000 to $99,999 | 31 (5.6%) | 37 (6.0%) |
| $100,000 to $299,999 | 385 (69.0%) | 497 (80.3%) |
| $300,000 to $499,999 | 115 (20.6%) | 75 (12.1%) |
| $500,000 to $749,999 | 27 (4.8%) | 10 (1.6%) |
| $750,000 to $999,999 | 0 (0.0%) | 0 (0.0%) |
| $1,000,000 or more | 0 (0.0%) | 0 (0.0%) |
| Total | 558 (100.0%) | 619 (100.0%) |
Household Income by Mortgage Status in River Bend
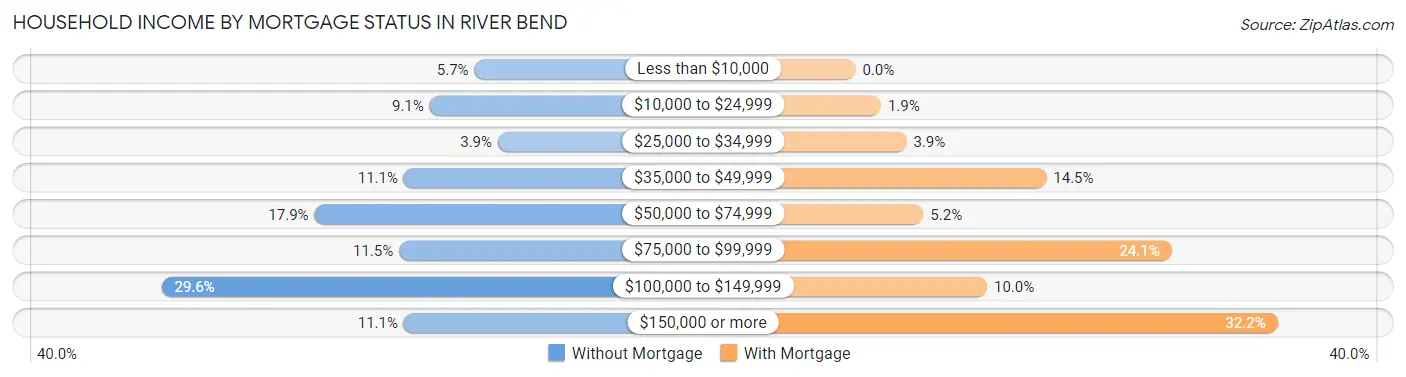
| Household Income | Without Mortgage | With Mortgage |
| Less than $10,000 | 32 (5.7%) | 0 (0.0%) |
| $10,000 to $24,999 | 51 (9.1%) | 12 (1.9%) |
| $25,000 to $34,999 | 22 (3.9%) | 24 (3.9%) |
| $35,000 to $49,999 | 62 (11.1%) | 90 (14.5%) |
| $50,000 to $74,999 | 100 (17.9%) | 32 (5.2%) |
| $75,000 to $99,999 | 64 (11.5%) | 149 (24.1%) |
| $100,000 to $149,999 | 165 (29.6%) | 62 (10.0%) |
| $150,000 or more | 62 (11.1%) | 199 (32.2%) |
| Total | 558 (100.0%) | 619 (100.0%) |
Property Value to Household Income Ratio in River Bend
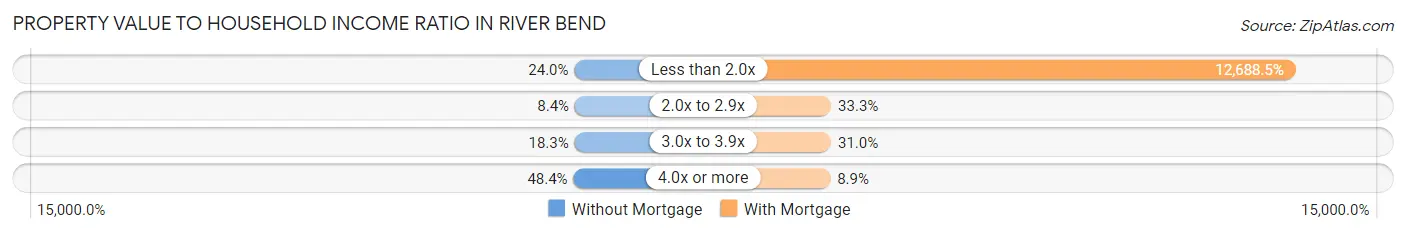
| Value-to-Income Ratio | Without Mortgage | With Mortgage |
| Less than 2.0x | 134 (24.0%) | 78,542 (12,688.5%) |
| 2.0x to 2.9x | 47 (8.4%) | 206 (33.3%) |
| 3.0x to 3.9x | 102 (18.3%) | 192 (31.0%) |
| 4.0x or more | 270 (48.4%) | 55 (8.9%) |
| Total | 558 (100.0%) | 619 (100.0%) |
Real Estate Taxes by Mortgage Status in River Bend
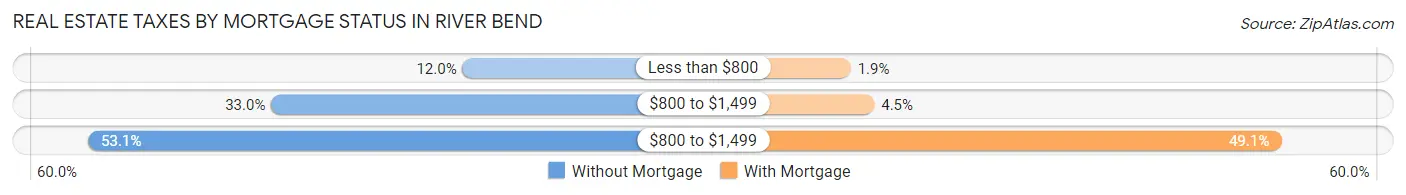
| Property Taxes | Without Mortgage | With Mortgage |
| Less than $800 | 67 (12.0%) | 12 (1.9%) |
| $800 to $1,499 | 184 (33.0%) | 28 (4.5%) |
| $800 to $1,499 | 296 (53.0%) | 304 (49.1%) |
| Total | 558 (100.0%) | 619 (100.0%) |
Health & Disability in River Bend
Health Insurance Coverage by Age in River Bend
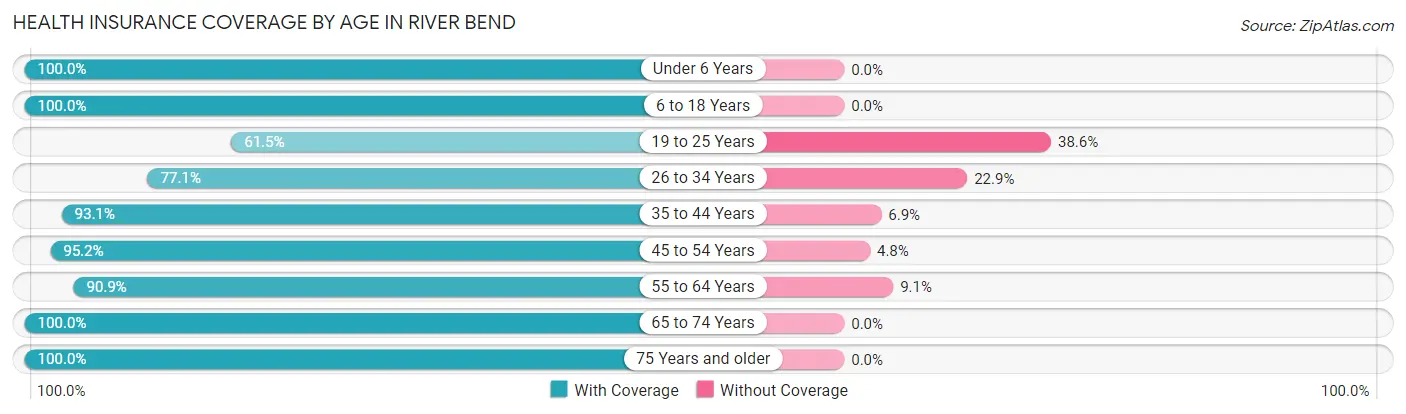
| Age Bracket | With Coverage | Without Coverage |
| Under 6 Years | 80 (100.0%) | 0 (0.0%) |
| 6 to 18 Years | 264 (100.0%) | 0 (0.0%) |
| 19 to 25 Years | 153 (61.5%) | 96 (38.6%) |
| 26 to 34 Years | 242 (77.1%) | 72 (22.9%) |
| 35 to 44 Years | 229 (93.1%) | 17 (6.9%) |
| 45 to 54 Years | 397 (95.2%) | 20 (4.8%) |
| 55 to 64 Years | 289 (90.9%) | 29 (9.1%) |
| 65 to 74 Years | 553 (100.0%) | 0 (0.0%) |
| 75 Years and older | 463 (100.0%) | 0 (0.0%) |
| Total | 2,670 (91.9%) | 234 (8.1%) |
Health Insurance Coverage by Citizenship Status in River Bend
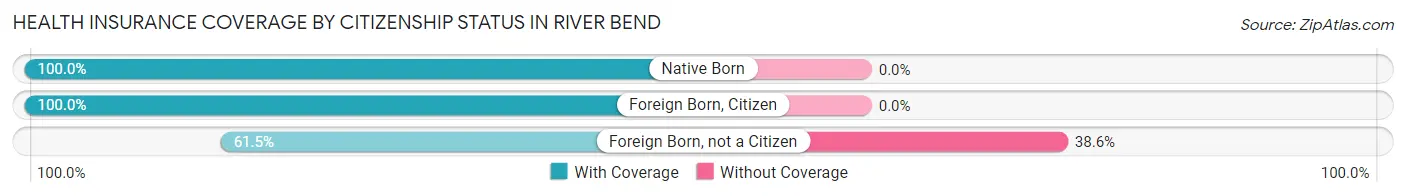
| Citizenship Status | With Coverage | Without Coverage |
| Native Born | 80 (100.0%) | 0 (0.0%) |
| Foreign Born, Citizen | 264 (100.0%) | 0 (0.0%) |
| Foreign Born, not a Citizen | 153 (61.5%) | 96 (38.6%) |
Health Insurance Coverage by Household Income in River Bend
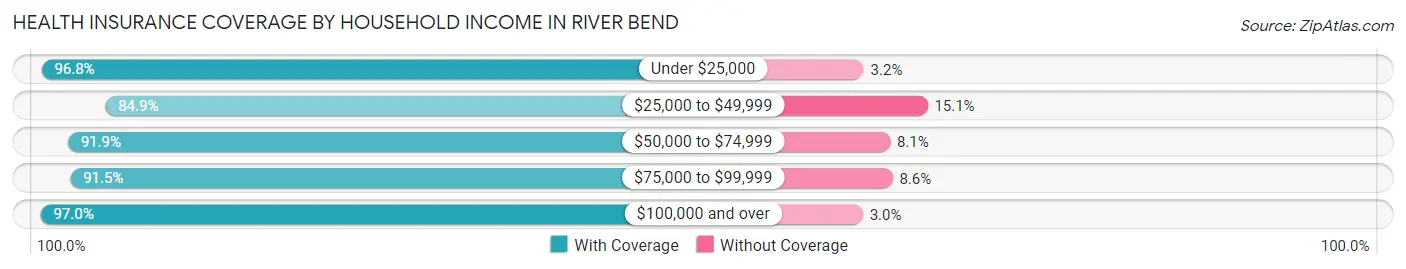
| Household Income | With Coverage | Without Coverage |
| Under $25,000 | 153 (96.8%) | 5 (3.2%) |
| $25,000 to $49,999 | 528 (84.9%) | 94 (15.1%) |
| $50,000 to $74,999 | 432 (91.9%) | 38 (8.1%) |
| $75,000 to $99,999 | 246 (91.4%) | 23 (8.6%) |
| $100,000 and over | 1,204 (97.0%) | 37 (3.0%) |
Public vs Private Health Insurance Coverage by Age in River Bend
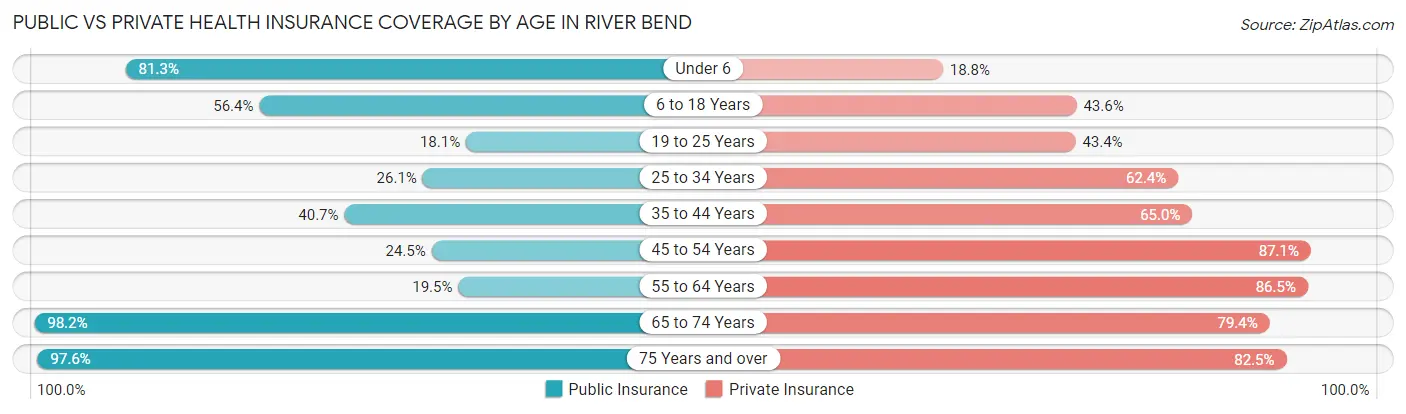
| Age Bracket | Public Insurance | Private Insurance |
| Under 6 | 65 (81.2%) | 15 (18.8%) |
| 6 to 18 Years | 149 (56.4%) | 115 (43.6%) |
| 19 to 25 Years | 45 (18.1%) | 108 (43.4%) |
| 25 to 34 Years | 82 (26.1%) | 196 (62.4%) |
| 35 to 44 Years | 100 (40.6%) | 160 (65.0%) |
| 45 to 54 Years | 102 (24.5%) | 363 (87.1%) |
| 55 to 64 Years | 62 (19.5%) | 275 (86.5%) |
| 65 to 74 Years | 543 (98.2%) | 439 (79.4%) |
| 75 Years and over | 452 (97.6%) | 382 (82.5%) |
| Total | 1,600 (55.1%) | 2,053 (70.7%) |
Disability Status by Sex by Age in River Bend
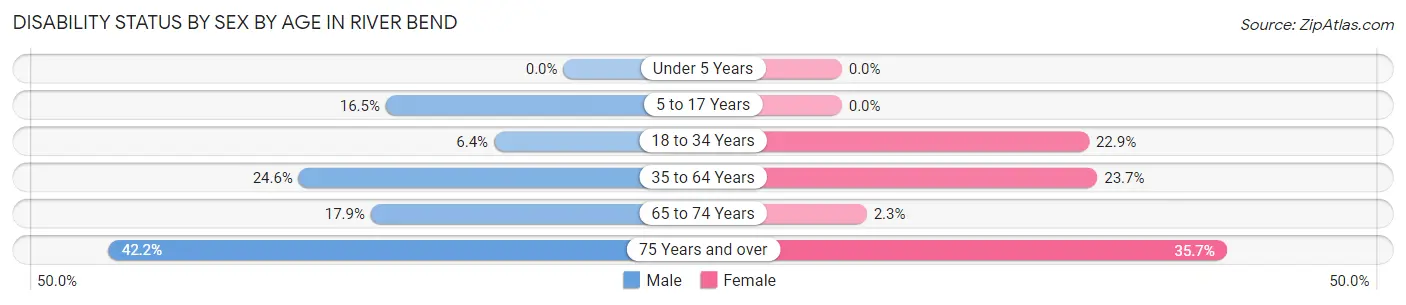
| Age Bracket | Male | Female |
| Under 5 Years | 0 (0.0%) | 0 (0.0%) |
| 5 to 17 Years | 15 (16.5%) | 0 (0.0%) |
| 18 to 34 Years | 17 (6.4%) | 89 (22.9%) |
| 35 to 64 Years | 127 (24.6%) | 110 (23.7%) |
| 65 to 74 Years | 37 (17.9%) | 8 (2.3%) |
| 75 Years and over | 89 (42.2%) | 90 (35.7%) |
Disability Class by Sex by Age in River Bend
Disability Class: Hearing Difficulty
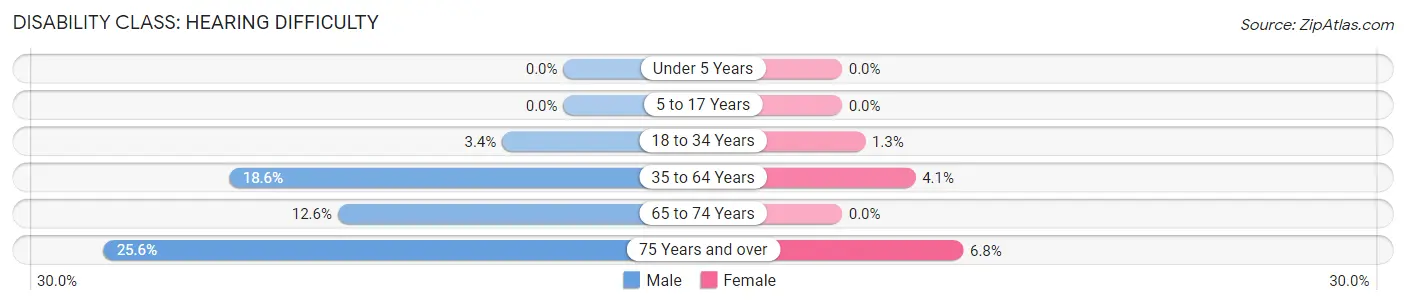
| Age Bracket | Male | Female |
| Under 5 Years | 0 (0.0%) | 0 (0.0%) |
| 5 to 17 Years | 0 (0.0%) | 0 (0.0%) |
| 18 to 34 Years | 9 (3.4%) | 5 (1.3%) |
| 35 to 64 Years | 96 (18.6%) | 19 (4.1%) |
| 65 to 74 Years | 26 (12.6%) | 0 (0.0%) |
| 75 Years and over | 54 (25.6%) | 17 (6.8%) |
Disability Class: Vision Difficulty
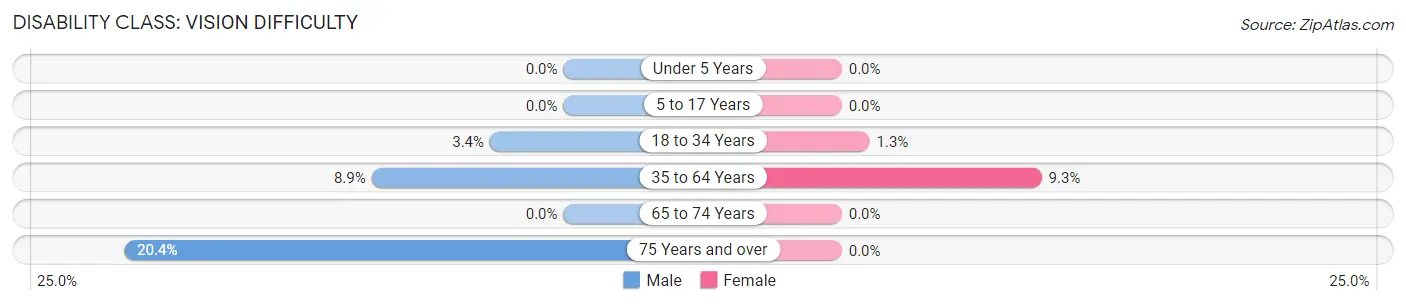
| Age Bracket | Male | Female |
| Under 5 Years | 0 (0.0%) | 0 (0.0%) |
| 5 to 17 Years | 0 (0.0%) | 0 (0.0%) |
| 18 to 34 Years | 9 (3.4%) | 5 (1.3%) |
| 35 to 64 Years | 46 (8.9%) | 43 (9.3%) |
| 65 to 74 Years | 0 (0.0%) | 0 (0.0%) |
| 75 Years and over | 43 (20.4%) | 0 (0.0%) |
Disability Class: Cognitive Difficulty
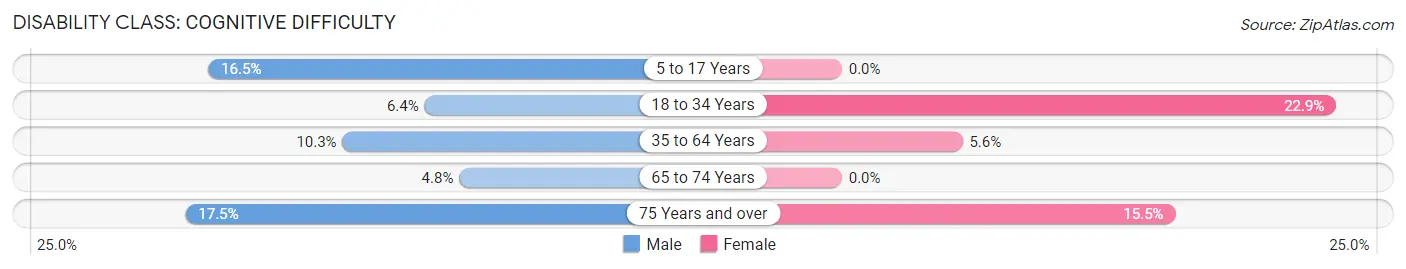
| Age Bracket | Male | Female |
| 5 to 17 Years | 15 (16.5%) | 0 (0.0%) |
| 18 to 34 Years | 17 (6.4%) | 89 (22.9%) |
| 35 to 64 Years | 53 (10.2%) | 26 (5.6%) |
| 65 to 74 Years | 10 (4.8%) | 0 (0.0%) |
| 75 Years and over | 37 (17.5%) | 39 (15.5%) |
Disability Class: Ambulatory Difficulty
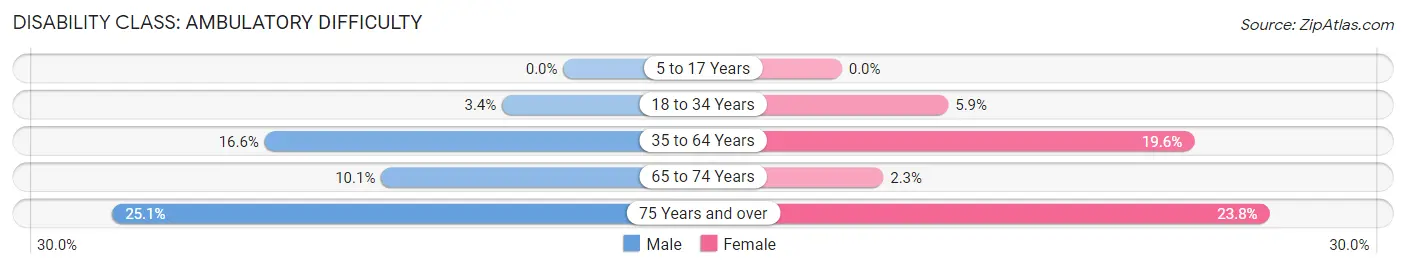
| Age Bracket | Male | Female |
| 5 to 17 Years | 0 (0.0%) | 0 (0.0%) |
| 18 to 34 Years | 9 (3.4%) | 23 (5.9%) |
| 35 to 64 Years | 86 (16.6%) | 91 (19.6%) |
| 65 to 74 Years | 21 (10.1%) | 8 (2.3%) |
| 75 Years and over | 53 (25.1%) | 60 (23.8%) |
Disability Class: Self-Care Difficulty
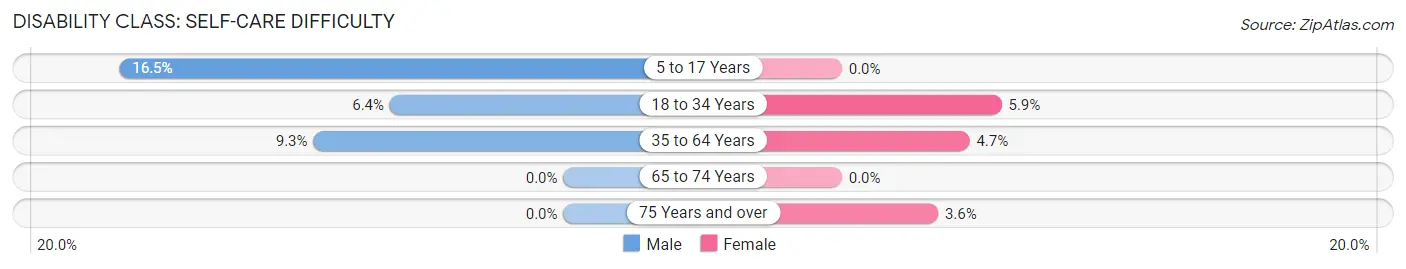
| Age Bracket | Male | Female |
| 5 to 17 Years | 15 (16.5%) | 0 (0.0%) |
| 18 to 34 Years | 17 (6.4%) | 23 (5.9%) |
| 35 to 64 Years | 48 (9.3%) | 22 (4.7%) |
| 65 to 74 Years | 0 (0.0%) | 0 (0.0%) |
| 75 Years and over | 0 (0.0%) | 9 (3.6%) |
Technology Access in River Bend
Computing Device Access in River Bend
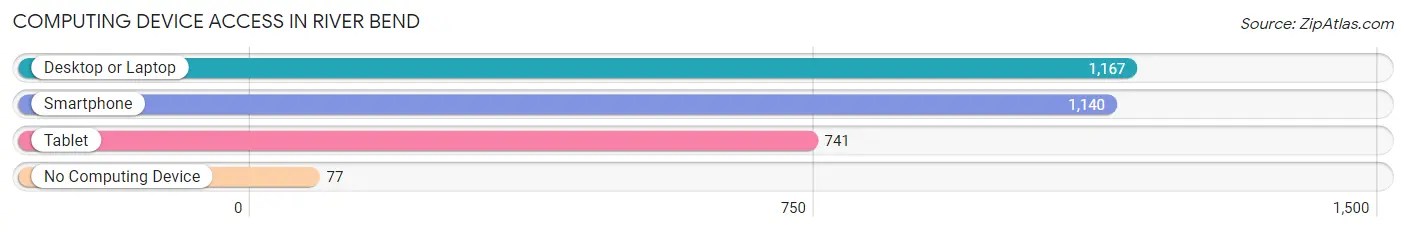
| Device Type | # Households | % Households |
| Desktop or Laptop | 1,167 | 88.3% |
| Smartphone | 1,140 | 86.2% |
| Tablet | 741 | 56.0% |
| No Computing Device | 77 | 5.8% |
| Total | 1,322 | 100.0% |
Internet Access in River Bend
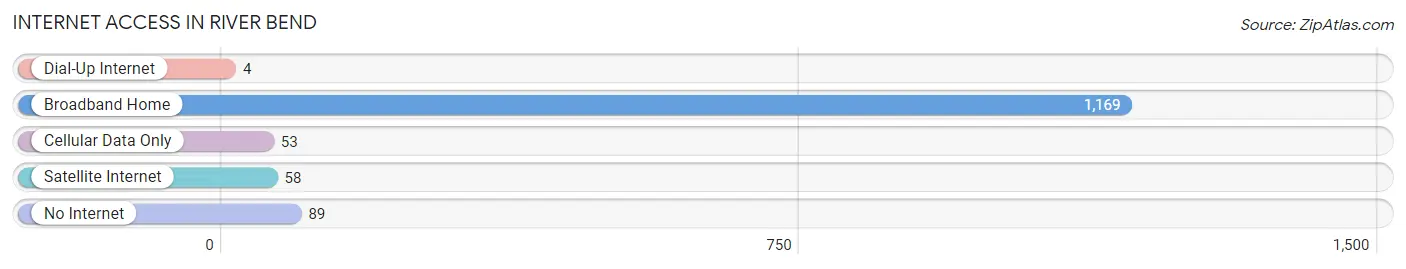
| Internet Type | # Households | % Households |
| Dial-Up Internet | 4 | 0.3% |
| Broadband Home | 1,169 | 88.4% |
| Cellular Data Only | 53 | 4.0% |
| Satellite Internet | 58 | 4.4% |
| No Internet | 89 | 6.7% |
| Total | 1,322 | 100.0% |
River Bend Summary
River Bend, NC is a small town located in the northeastern corner of North Carolina. It is situated on the banks of the Neuse River, which is the longest river in the state. The town is part of the larger Craven County, which is located in the Coastal Plain region of the state. The town has a population of approximately 2,000 people and is known for its small-town charm and friendly atmosphere.
History
The area that is now River Bend was first settled in the late 1700s by a group of settlers from Scotland. The settlers named the area River Bend due to its location on the bend of the Neuse River. The town was officially incorporated in 1887 and has remained a small, rural community ever since.
The town was an important stop on the Wilmington and Weldon Railroad, which ran through the area in the late 1800s. The railroad brought economic growth to the area and helped to spur the development of the town.
Geography
River Bend is located in the northeastern corner of North Carolina, on the banks of the Neuse River. The town is situated in the Coastal Plain region of the state, which is characterized by flat terrain and sandy soils. The town is located approximately 30 miles from the Atlantic Ocean and is surrounded by a number of small towns and rural communities.
The town is located in Craven County, which is home to a number of other small towns and rural communities. The county is bordered by Pamlico County to the north, Carteret County to the east, Jones County to the south, and Lenoir County to the west.
Economy
The economy of River Bend is largely based on agriculture and tourism. The town is home to a number of small farms, which produce a variety of crops, including corn, soybeans, and cotton. The town is also home to a number of small businesses, including restaurants, shops, and other services.
Tourism is an important part of the local economy, as the town is located near a number of popular tourist attractions, including the Neuse River, the Croatan National Forest, and the Outer Banks. The town is also home to a number of festivals and events throughout the year, which attract visitors from all over the region.
Demographics
As of the 2010 census, the population of River Bend was 2,000 people. The town is predominantly white, with approximately 85% of the population identifying as white. The remaining 15% of the population is made up of African Americans, Hispanics, and other ethnicities.
The median household income in River Bend is $37,000, which is slightly lower than the state average. The town has a poverty rate of approximately 15%, which is slightly higher than the state average.
River Bend is a small, rural town with a friendly atmosphere and a strong sense of community. The town is home to a number of small businesses and farms, and is a popular destination for tourists looking to explore the area. The town is also home to a diverse population, with a variety of ethnicities and backgrounds.
Common Questions
What is Per Capita Income in River Bend?
Per Capita income in River Bend is $39,150.
What is the Median Family Income in River Bend?
Median Family Income in River Bend is $100,417.
What is the Median Household income in River Bend?
Median Household Income in River Bend is $74,375.
What is Income or Wage Gap in River Bend?
Income or Wage Gap in River Bend is 29.2%.
Women in River Bend earn 70.8 cents for every dollar earned by a man.
What is Inequality or Gini Index in River Bend?
Inequality or Gini Index in River Bend is 0.35.
What is the Total Population of River Bend?
Total Population of River Bend is 2,914.
What is the Total Male Population of River Bend?
Total Male Population of River Bend is 1,313.
What is the Total Female Population of River Bend?
Total Female Population of River Bend is 1,601.
What is the Ratio of Males per 100 Females in River Bend?
There are 82.01 Males per 100 Females in River Bend.
What is the Ratio of Females per 100 Males in River Bend?
There are 121.93 Females per 100 Males in River Bend.
What is the Median Population Age in River Bend?
Median Population Age in River Bend is 51.0 Years.
What is the Average Family Size in River Bend
Average Family Size in River Bend is 2.5 People.
What is the Average Household Size in River Bend
Average Household Size in River Bend is 2.1 People.
How Large is the Labor Force in River Bend?
There are 1,163 People in the Labor Forcein in River Bend.
What is the Percentage of People in the Labor Force in River Bend?
43.1% of People are in the Labor Force in River Bend.
What is the Unemployment Rate in River Bend?
Unemployment Rate in River Bend is 1.2%.