Zip Codes with the Highest Percentage of Population Employed in Health Diagnosing & Treating in High Point, NC
RELATED REPORTS & OPTIONS
Health Diagnosing & Treating
High Point
Compare Zip Codes
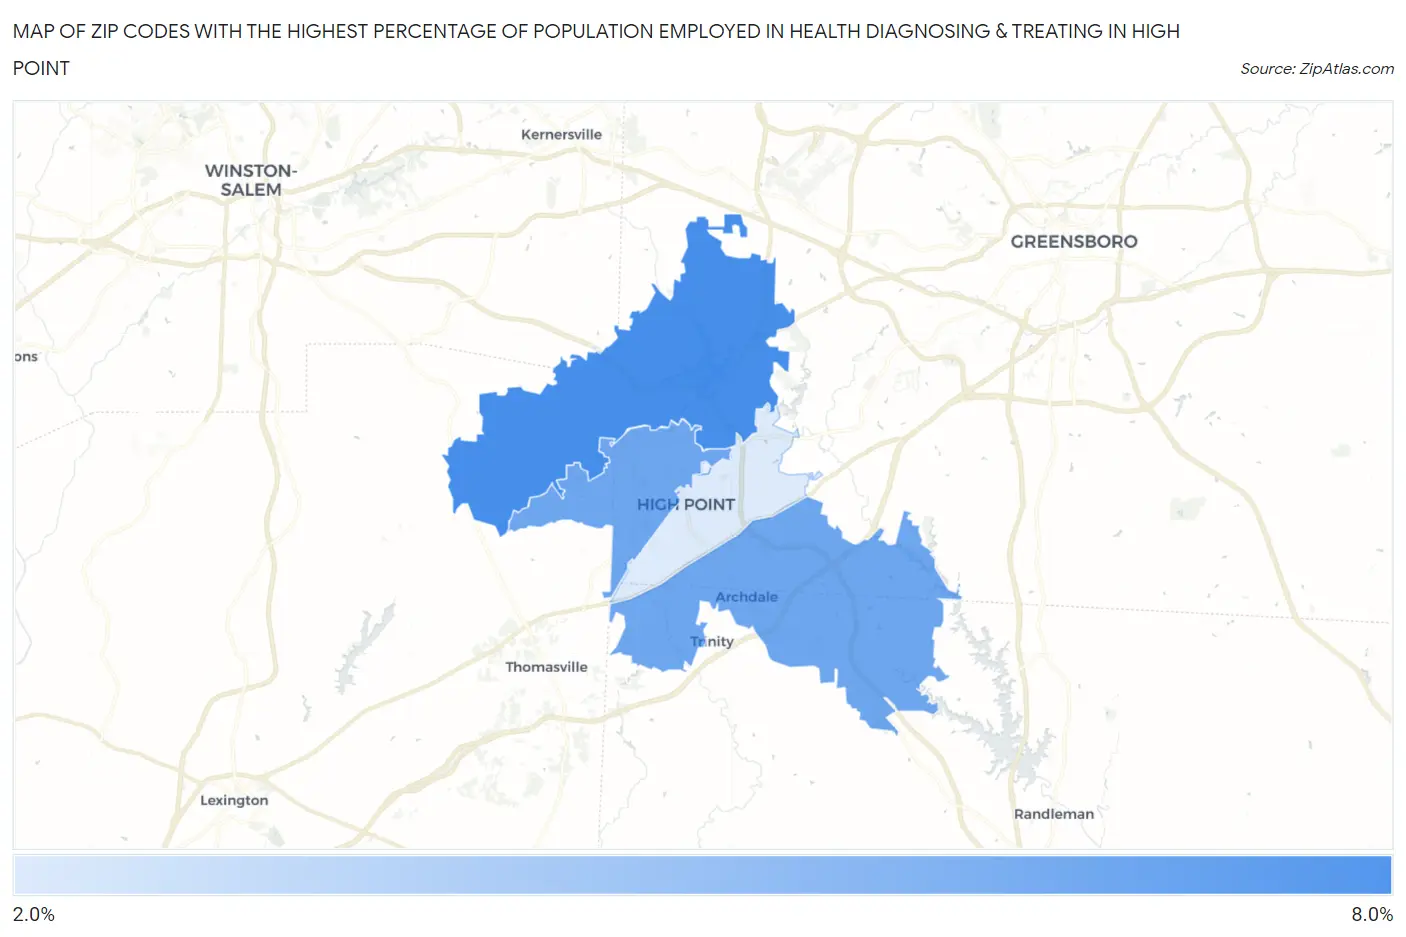
Map of Zip Codes with the Highest Percentage of Population Employed in Health Diagnosing & Treating in High Point
2.3%
7.1%
Zip Codes with the Highest Percentage of Population Employed in Health Diagnosing & Treating in High Point, NC
| Zip Code | % Employed | vs State | vs National | |
| 1. | 27265 | 7.1% | 6.4%(+0.638)#263 | 6.2%(+0.814)#10,165 |
| 2. | 27263 | 5.8% | 6.4%(-0.631)#393 | 6.2%(-0.454)#14,646 |
| 3. | 27262 | 5.8% | 6.4%(-0.656)#395 | 6.2%(-0.479)#14,739 |
| 4. | 27260 | 2.3% | 6.4%(-4.10)#681 | 6.2%(-3.93)#25,886 |
1
Common Questions
What are the Top 3 Zip Codes with the Highest Percentage of Population Employed in Health Diagnosing & Treating in High Point, NC?
Top 3 Zip Codes with the Highest Percentage of Population Employed in Health Diagnosing & Treating in High Point, NC are:
What zip code has the Highest Percentage of Population Employed in Health Diagnosing & Treating in High Point, NC?
27265 has the Highest Percentage of Population Employed in Health Diagnosing & Treating in High Point, NC with 7.1%.
What is the Percentage of Population Employed in Health Diagnosing & Treating in High Point, NC?
Percentage of Population Employed in Health Diagnosing & Treating in High Point is 5.9%.
What is the Percentage of Population Employed in Health Diagnosing & Treating in North Carolina?
Percentage of Population Employed in Health Diagnosing & Treating in North Carolina is 6.4%.
What is the Percentage of Population Employed in Health Diagnosing & Treating in the United States?
Percentage of Population Employed in Health Diagnosing & Treating in the United States is 6.2%.