Zip Codes with the Highest Percentage of Population Employed in Health Diagnosing & Treating in Greenville, NC
RELATED REPORTS & OPTIONS
Health Diagnosing & Treating
Greenville
Compare Zip Codes
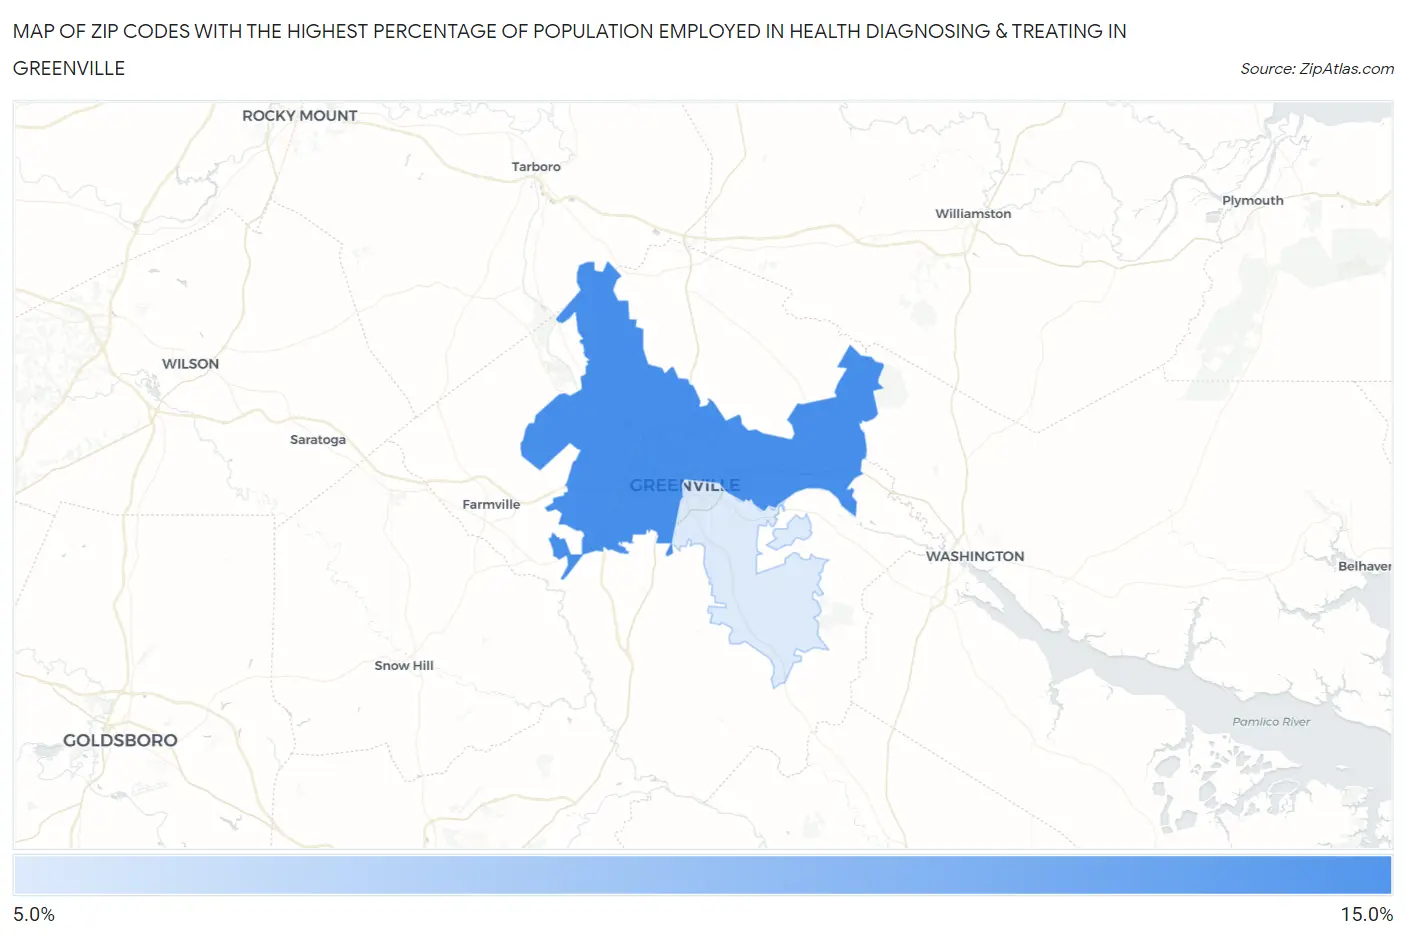
Map of Zip Codes with the Highest Percentage of Population Employed in Health Diagnosing & Treating in Greenville
9.2%
10.8%
Zip Codes with the Highest Percentage of Population Employed in Health Diagnosing & Treating in Greenville, NC
| Zip Code | % Employed | vs State | vs National | |
| 1. | 27834 | 10.8% | 6.4%(+4.42)#64 | 6.2%(+4.60)#3,016 |
| 2. | 27858 | 9.2% | 6.4%(+2.81)#122 | 6.2%(+2.98)#4,977 |
1
Common Questions
What are the Top Zip Codes with the Highest Percentage of Population Employed in Health Diagnosing & Treating in Greenville, NC?
Top Zip Codes with the Highest Percentage of Population Employed in Health Diagnosing & Treating in Greenville, NC are:
What zip code has the Highest Percentage of Population Employed in Health Diagnosing & Treating in Greenville, NC?
27834 has the Highest Percentage of Population Employed in Health Diagnosing & Treating in Greenville, NC with 10.8%.
What is the Percentage of Population Employed in Health Diagnosing & Treating in Greenville, NC?
Percentage of Population Employed in Health Diagnosing & Treating in Greenville is 10.9%.
What is the Percentage of Population Employed in Health Diagnosing & Treating in North Carolina?
Percentage of Population Employed in Health Diagnosing & Treating in North Carolina is 6.4%.
What is the Percentage of Population Employed in Health Diagnosing & Treating in the United States?
Percentage of Population Employed in Health Diagnosing & Treating in the United States is 6.2%.