Zip Codes with the Highest Percentage of Population Employed in Health Diagnosing & Treating in Chapel Hill, NC
RELATED REPORTS & OPTIONS
Health Diagnosing & Treating
Chapel Hill
Compare Zip Codes
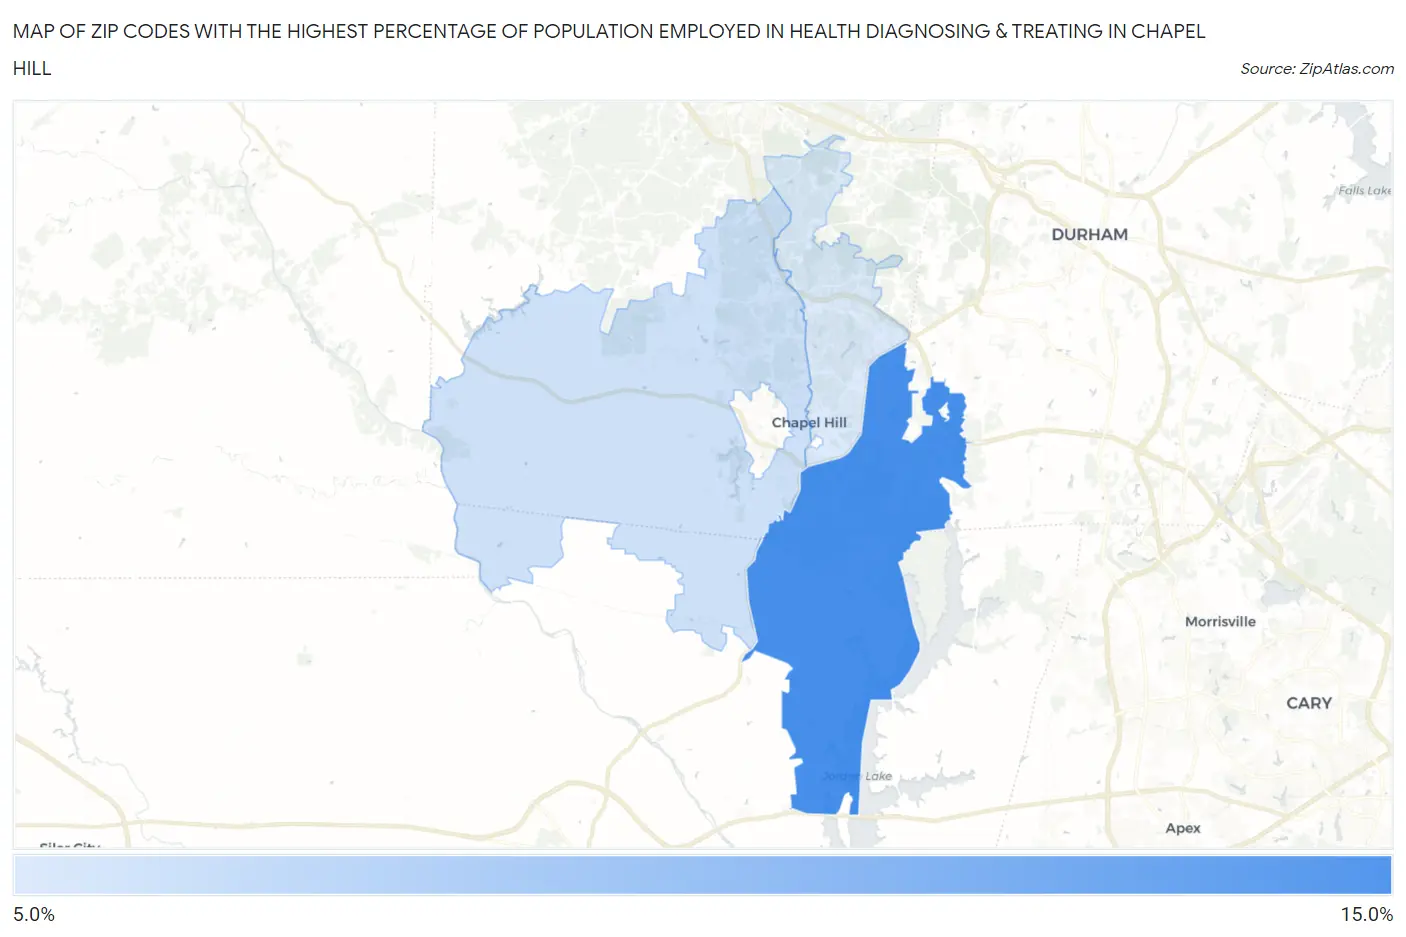
Map of Zip Codes with the Highest Percentage of Population Employed in Health Diagnosing & Treating in Chapel Hill
9.8%
12.4%
Zip Codes with the Highest Percentage of Population Employed in Health Diagnosing & Treating in Chapel Hill, NC
| Zip Code | % Employed | vs State | vs National | |
| 1. | 27517 | 12.4% | 6.4%(+5.95)#43 | 6.2%(+6.12)#2,020 |
| 2. | 27516 | 10.1% | 6.4%(+3.66)#90 | 6.2%(+3.84)#3,792 |
| 3. | 27514 | 9.8% | 6.4%(+3.41)#98 | 6.2%(+3.59)#4,078 |
1
Common Questions
What are the Top Zip Codes with the Highest Percentage of Population Employed in Health Diagnosing & Treating in Chapel Hill, NC?
Top Zip Codes with the Highest Percentage of Population Employed in Health Diagnosing & Treating in Chapel Hill, NC are:
What zip code has the Highest Percentage of Population Employed in Health Diagnosing & Treating in Chapel Hill, NC?
27517 has the Highest Percentage of Population Employed in Health Diagnosing & Treating in Chapel Hill, NC with 12.4%.
What is the Percentage of Population Employed in Health Diagnosing & Treating in Chapel Hill, NC?
Percentage of Population Employed in Health Diagnosing & Treating in Chapel Hill is 10.1%.
What is the Percentage of Population Employed in Health Diagnosing & Treating in North Carolina?
Percentage of Population Employed in Health Diagnosing & Treating in North Carolina is 6.4%.
What is the Percentage of Population Employed in Health Diagnosing & Treating in the United States?
Percentage of Population Employed in Health Diagnosing & Treating in the United States is 6.2%.