Saxapahaw, NC Map & Demographics
Saxapahaw Map
Saxapahaw Overview
$29,496
PER CAPITA INCOME
$61,196
AVG FAMILY INCOME
$50,909
AVG HOUSEHOLD INCOME
23.4%
WAGE / INCOME GAP [ % ]
76.6¢/ $1
WAGE / INCOME GAP [ $ ]
0.38
INEQUALITY / GINI INDEX
1,200
TOTAL POPULATION
591
MALE POPULATION
609
FEMALE POPULATION
97.04
MALES / 100 FEMALES
103.05
FEMALES / 100 MALES
46.9
MEDIAN AGE
2.6
AVG FAMILY SIZE
2.1
AVG HOUSEHOLD SIZE
580
LABOR FORCE [ PEOPLE ]
58.0%
PERCENT IN LABOR FORCE
8.3%
UNEMPLOYMENT RATE
Saxapahaw Zip Codes
Income in Saxapahaw
Income Overview in Saxapahaw
Per Capita Income in Saxapahaw is $29,496, while median incomes of families and households are $61,196 and $50,909 respectively.
| Characteristic | Number | Measure |
| Per Capita Income | 1,200 | $29,496 |
| Median Family Income | 384 | $61,196 |
| Mean Family Income | 384 | $74,703 |
| Median Household Income | 560 | $50,909 |
| Mean Household Income | 560 | $63,402 |
| Income Deficit | 384 | $0 |
| Wage / Income Gap (%) | 1,200 | 23.45% |
| Wage / Income Gap ($) | 1,200 | 76.55¢ per $1 |
| Gini / Inequality Index | 1,200 | 0.38 |
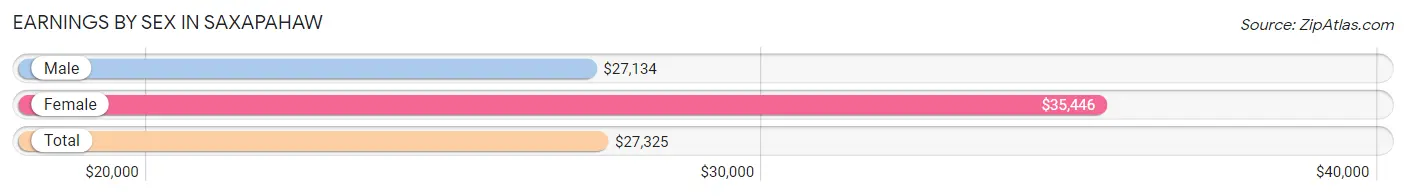
Earnings by Sex in Saxapahaw
Average Earnings in Saxapahaw are $27,325, $27,134 for men and $35,446 for women, a difference of 23.4%.
| Sex | Number | Average Earnings |
| Male | 320 (53.2%) | $27,134 |
| Female | 281 (46.8%) | $35,446 |
| Total | 601 (100.0%) | $27,325 |
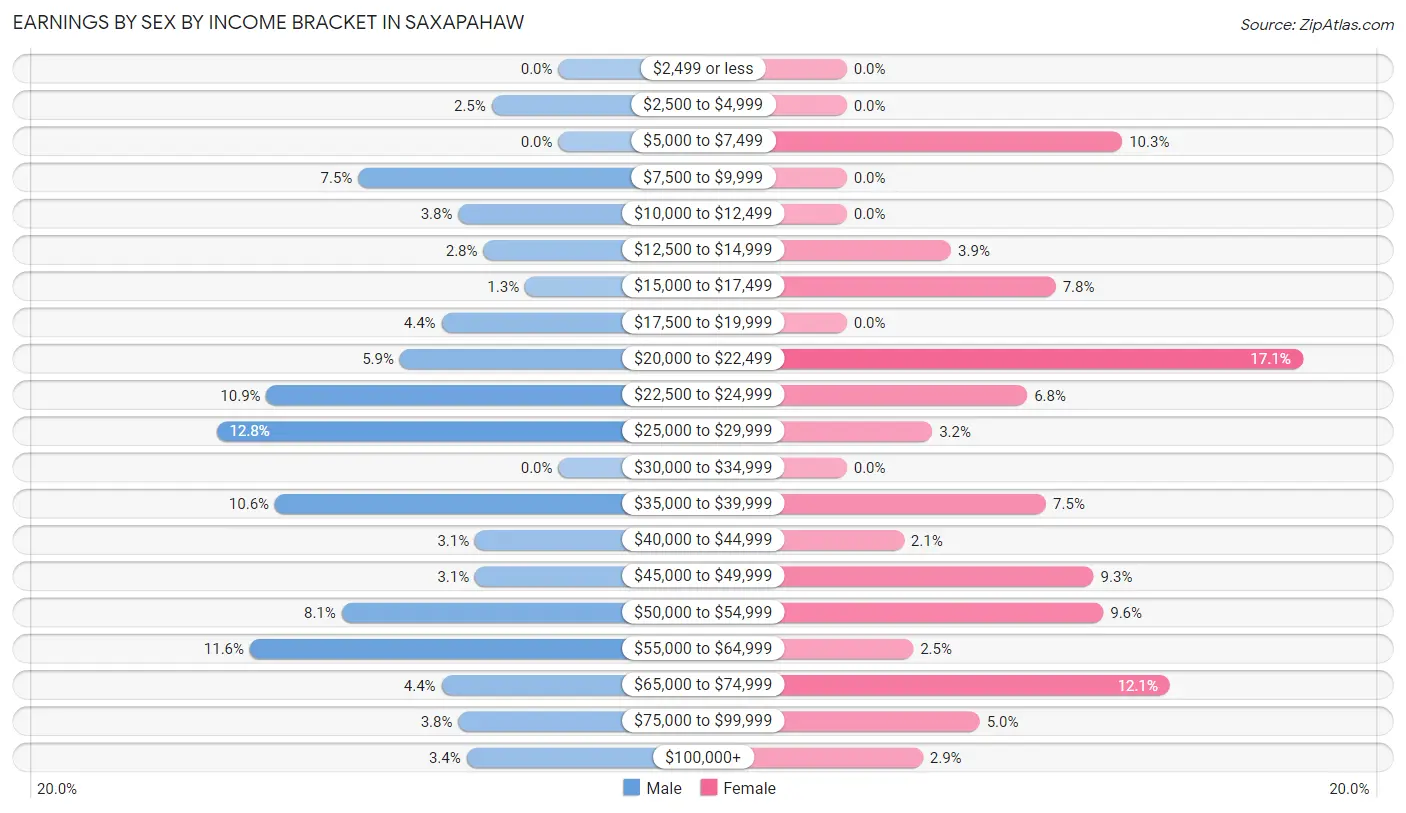
Earnings by Sex by Income Bracket in Saxapahaw
The most common earnings brackets in Saxapahaw are $25,000 to $29,999 for men (41 | 12.8%) and $20,000 to $22,499 for women (48 | 17.1%).
| Income | Male | Female |
| $2,499 or less | 0 (0.0%) | 0 (0.0%) |
| $2,500 to $4,999 | 8 (2.5%) | 0 (0.0%) |
| $5,000 to $7,499 | 0 (0.0%) | 29 (10.3%) |
| $7,500 to $9,999 | 24 (7.5%) | 0 (0.0%) |
| $10,000 to $12,499 | 12 (3.7%) | 0 (0.0%) |
| $12,500 to $14,999 | 9 (2.8%) | 11 (3.9%) |
| $15,000 to $17,499 | 4 (1.3%) | 22 (7.8%) |
| $17,500 to $19,999 | 14 (4.4%) | 0 (0.0%) |
| $20,000 to $22,499 | 19 (5.9%) | 48 (17.1%) |
| $22,500 to $24,999 | 35 (10.9%) | 19 (6.8%) |
| $25,000 to $29,999 | 41 (12.8%) | 9 (3.2%) |
| $30,000 to $34,999 | 0 (0.0%) | 0 (0.0%) |
| $35,000 to $39,999 | 34 (10.6%) | 21 (7.5%) |
| $40,000 to $44,999 | 10 (3.1%) | 6 (2.1%) |
| $45,000 to $49,999 | 10 (3.1%) | 26 (9.2%) |
| $50,000 to $54,999 | 26 (8.1%) | 27 (9.6%) |
| $55,000 to $64,999 | 37 (11.6%) | 7 (2.5%) |
| $65,000 to $74,999 | 14 (4.4%) | 34 (12.1%) |
| $75,000 to $99,999 | 12 (3.7%) | 14 (5.0%) |
| $100,000+ | 11 (3.4%) | 8 (2.9%) |
| Total | 320 (100.0%) | 281 (100.0%) |
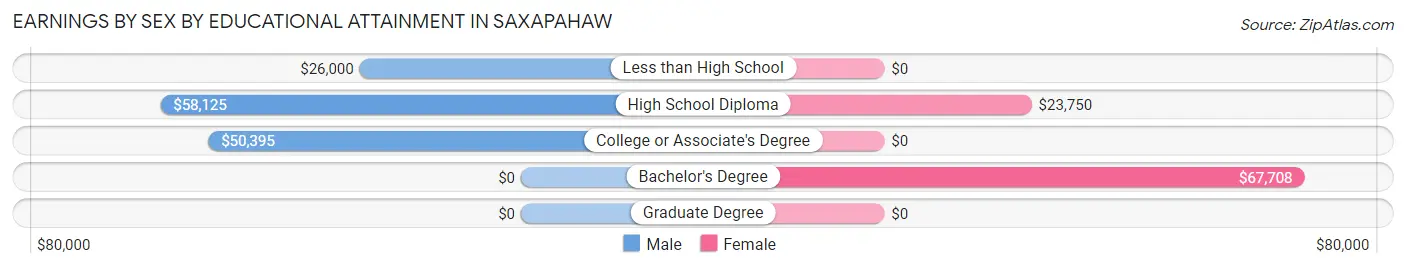
Earnings by Sex by Educational Attainment in Saxapahaw
Average earnings in Saxapahaw are $37,361 for men and $35,446 for women, a difference of 5.1%. Men with an educational attainment of high school diploma enjoy the highest average annual earnings of $58,125, while those with less than high school education earn the least with $26,000. Women with an educational attainment of bachelor's degree earn the most with the average annual earnings of $67,708, while those with high school diploma education have the smallest earnings of $23,750.
| Educational Attainment | Male Income | Female Income |
| Less than High School | $26,000 | $0 |
| High School Diploma | $58,125 | $23,750 |
| College or Associate's Degree | $50,395 | $0 |
| Bachelor's Degree | - | - |
| Graduate Degree | - | - |
| Total | $37,361 | $35,446 |
Family Income in Saxapahaw
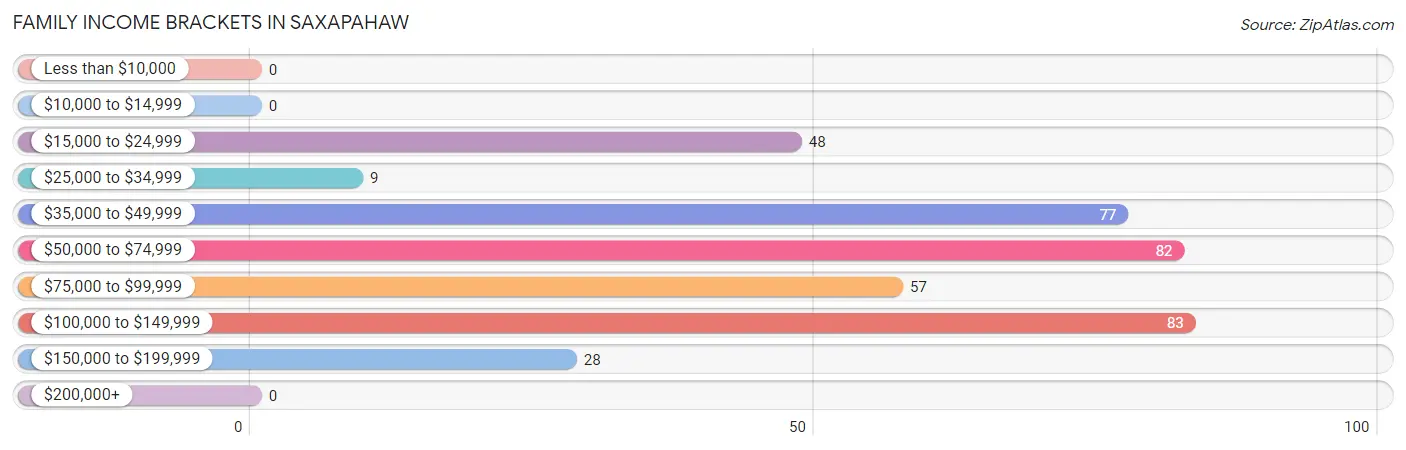
Family Income Brackets in Saxapahaw
According to the Saxapahaw family income data, there are 83 families falling into the $100,000 to $149,999 income range, which is the most common income bracket and makes up 21.6% of all families.
| Income Bracket | # Families | % Families |
| Less than $10,000 | 0 | 0.0% |
| $10,000 to $14,999 | 0 | 0.0% |
| $15,000 to $24,999 | 48 | 12.5% |
| $25,000 to $34,999 | 9 | 2.3% |
| $35,000 to $49,999 | 77 | 20.1% |
| $50,000 to $74,999 | 82 | 21.4% |
| $75,000 to $99,999 | 57 | 14.8% |
| $100,000 to $149,999 | 83 | 21.6% |
| $150,000 to $199,999 | 28 | 7.3% |
| $200,000+ | 0 | 0.0% |
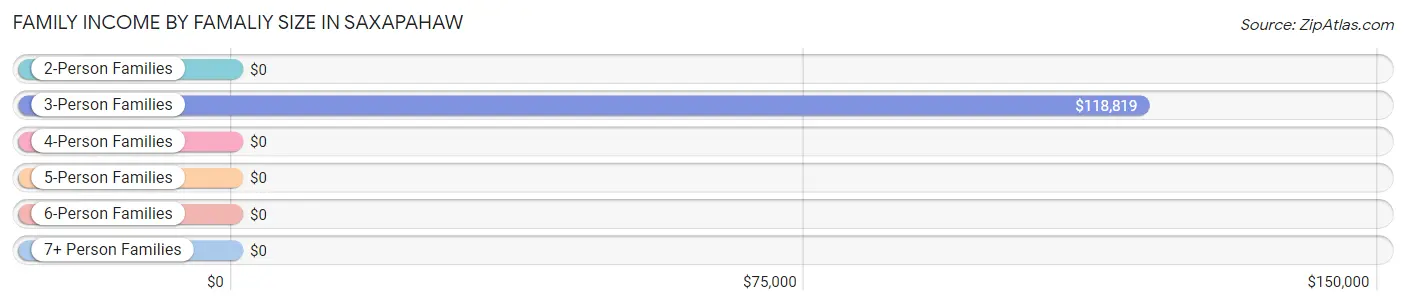
Family Income by Famaliy Size in Saxapahaw
3-person families (61 | 15.9%) account for the highest median family income in Saxapahaw with $118,819 per family, while 3-person families (61 | 15.9%) have the highest median income of $39,606 per family member.
| Income Bracket | # Families | Median Income |
| 2-Person Families | 262 (68.2%) | $0 |
| 3-Person Families | 61 (15.9%) | $118,819 |
| 4-Person Families | 23 (6.0%) | $0 |
| 5-Person Families | 19 (5.0%) | $0 |
| 6-Person Families | 19 (5.0%) | $0 |
| 7+ Person Families | 0 (0.0%) | $0 |
| Total | 384 (100.0%) | $61,196 |
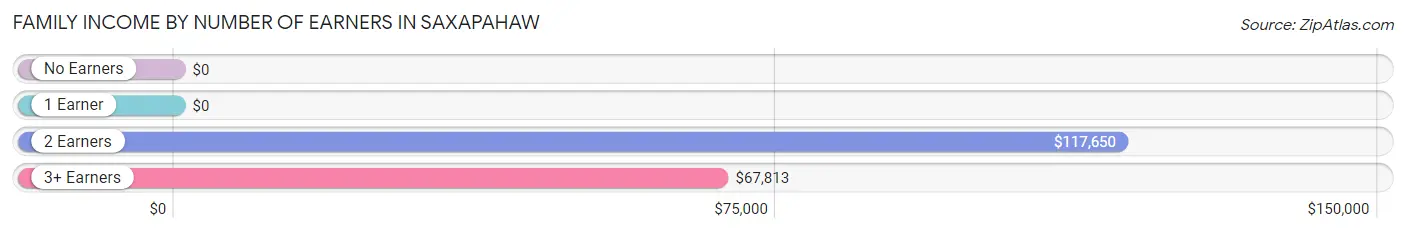
Family Income by Number of Earners in Saxapahaw
| Number of Earners | # Families | Median Income |
| No Earners | 104 (27.1%) | $0 |
| 1 Earner | 128 (33.3%) | $0 |
| 2 Earners | 111 (28.9%) | $117,650 |
| 3+ Earners | 41 (10.7%) | $67,813 |
| Total | 384 (100.0%) | $61,196 |
Household Income in Saxapahaw
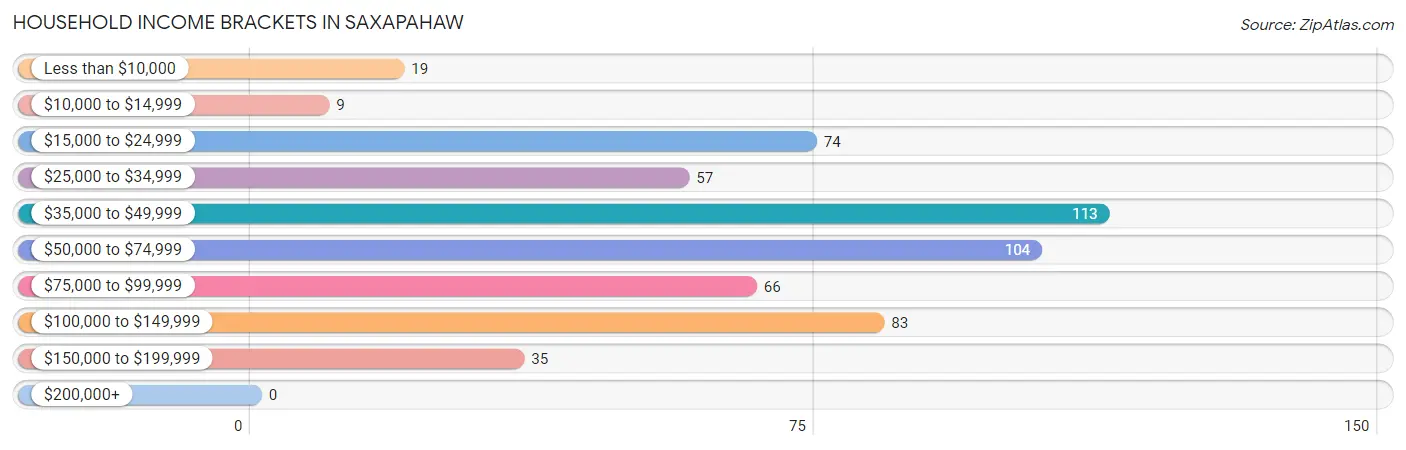
Household Income Brackets in Saxapahaw
With 113 households falling in the category, the $35,000 to $49,999 income range is the most frequent in Saxapahaw, accounting for 20.2% of all households.
| Income Bracket | # Households | % Households |
| Less than $10,000 | 19 | 3.4% |
| $10,000 to $14,999 | 9 | 1.6% |
| $15,000 to $24,999 | 74 | 13.2% |
| $25,000 to $34,999 | 57 | 10.2% |
| $35,000 to $49,999 | 113 | 20.2% |
| $50,000 to $74,999 | 104 | 18.6% |
| $75,000 to $99,999 | 66 | 11.8% |
| $100,000 to $149,999 | 83 | 14.8% |
| $150,000 to $199,999 | 35 | 6.3% |
| $200,000+ | 0 | 0.0% |
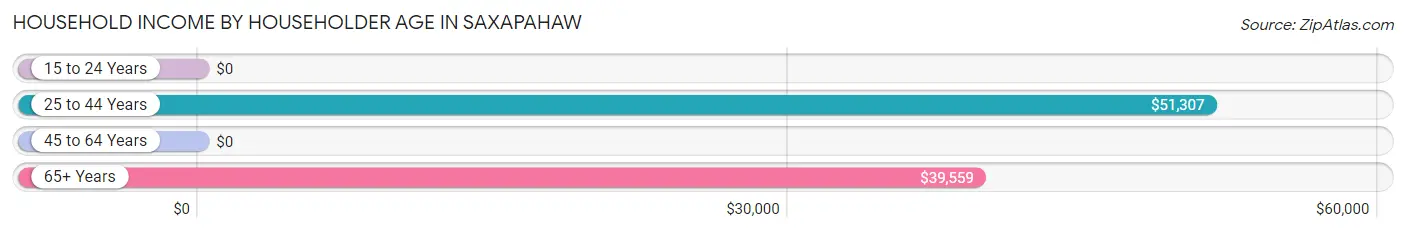
Household Income by Householder Age in Saxapahaw
The median household income in Saxapahaw is $50,909, with the highest median household income of $51,307 found in the 25 to 44 years age bracket for the primary householder. A total of 187 households (33.4%) fall into this category.
| Income Bracket | # Households | Median Income |
| 15 to 24 Years | 0 (0.0%) | $0 |
| 25 to 44 Years | 187 (33.4%) | $51,307 |
| 45 to 64 Years | 135 (24.1%) | $0 |
| 65+ Years | 238 (42.5%) | $39,559 |
| Total | 560 (100.0%) | $50,909 |
Poverty in Saxapahaw
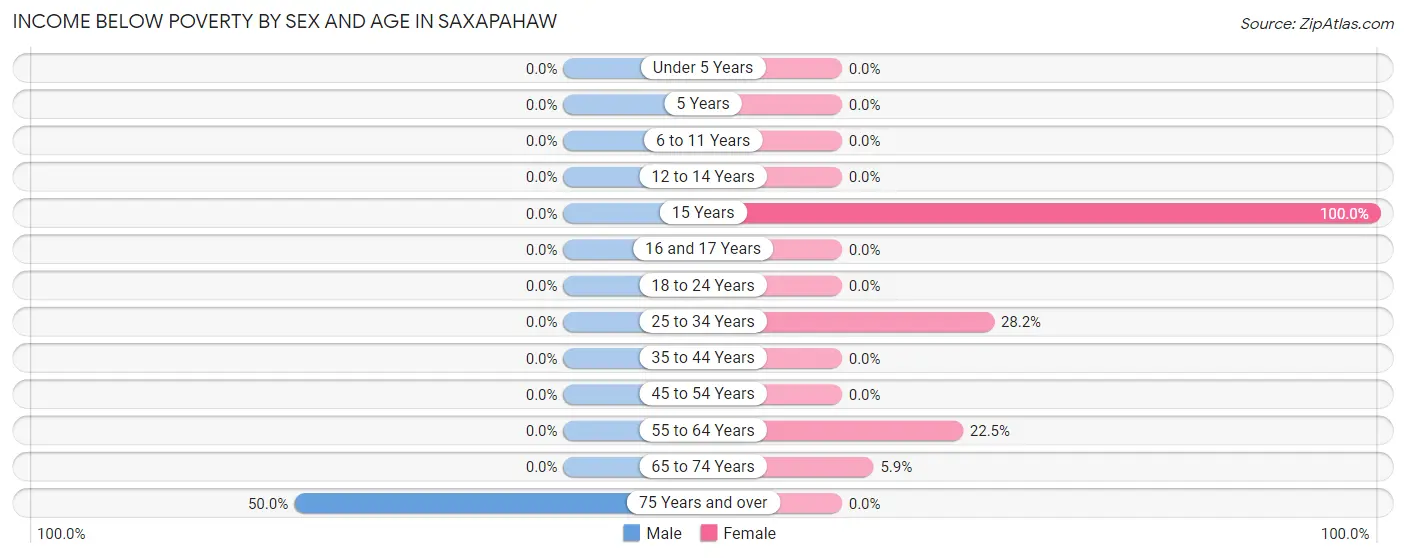
Income Below Poverty by Sex and Age in Saxapahaw
With 3.2% poverty level for males and 20.5% for females among the residents of Saxapahaw, 75 year old and over males and 15 year old females are the most vulnerable to poverty, with 19 males (50.0%) and 49 females (100.0%) in their respective age groups living below the poverty level.
| Age Bracket | Male | Female |
| Under 5 Years | 0 (0.0%) | 0 (0.0%) |
| 5 Years | 0 (0.0%) | 0 (0.0%) |
| 6 to 11 Years | 0 (0.0%) | 0 (0.0%) |
| 12 to 14 Years | 0 (0.0%) | 0 (0.0%) |
| 15 Years | 0 (0.0%) | 49 (100.0%) |
| 16 and 17 Years | 0 (0.0%) | 0 (0.0%) |
| 18 to 24 Years | 0 (0.0%) | 0 (0.0%) |
| 25 to 34 Years | 0 (0.0%) | 48 (28.2%) |
| 35 to 44 Years | 0 (0.0%) | 0 (0.0%) |
| 45 to 54 Years | 0 (0.0%) | 0 (0.0%) |
| 55 to 64 Years | 0 (0.0%) | 20 (22.5%) |
| 65 to 74 Years | 0 (0.0%) | 8 (5.9%) |
| 75 Years and over | 19 (50.0%) | 0 (0.0%) |
| Total | 19 (3.2%) | 125 (20.5%) |
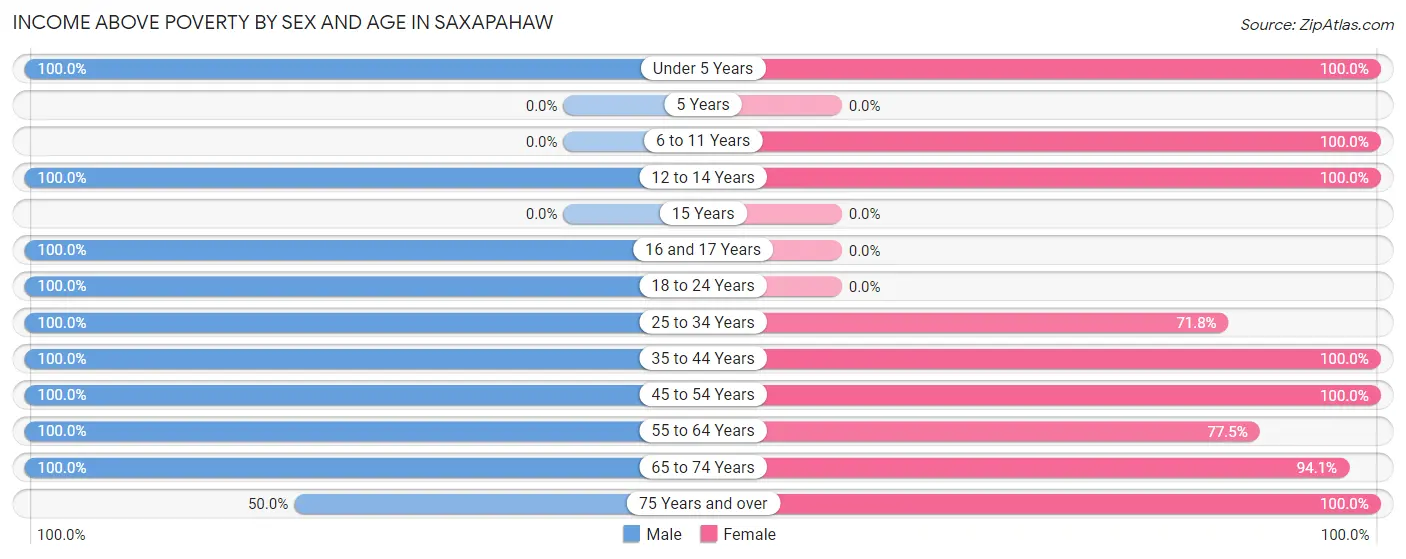
Income Above Poverty by Sex and Age in Saxapahaw
According to the poverty statistics in Saxapahaw, males aged under 5 years and females aged under 5 years are the age groups that are most secure financially, with 100.0% of males and 100.0% of females in these age groups living above the poverty line.
| Age Bracket | Male | Female |
| Under 5 Years | 45 (100.0%) | 21 (100.0%) |
| 5 Years | 0 (0.0%) | 0 (0.0%) |
| 6 to 11 Years | 0 (0.0%) | 22 (100.0%) |
| 12 to 14 Years | 50 (100.0%) | 13 (100.0%) |
| 15 Years | 0 (0.0%) | 0 (0.0%) |
| 16 and 17 Years | 8 (100.0%) | 0 (0.0%) |
| 18 to 24 Years | 38 (100.0%) | 0 (0.0%) |
| 25 to 34 Years | 97 (100.0%) | 122 (71.8%) |
| 35 to 44 Years | 46 (100.0%) | 29 (100.0%) |
| 45 to 54 Years | 73 (100.0%) | 37 (100.0%) |
| 55 to 64 Years | 69 (100.0%) | 69 (77.5%) |
| 65 to 74 Years | 127 (100.0%) | 128 (94.1%) |
| 75 Years and over | 19 (50.0%) | 43 (100.0%) |
| Total | 572 (96.8%) | 484 (79.5%) |
Income Below Poverty Among Married-Couple Families in Saxapahaw
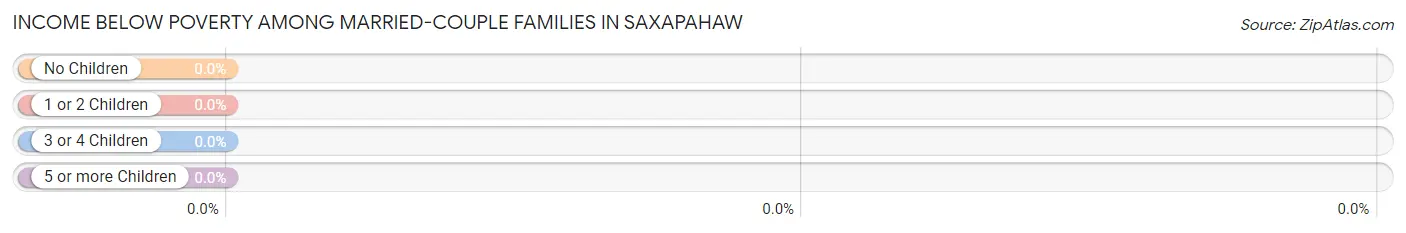
| Children | Above Poverty | Below Poverty |
| No Children | 210 (100.0%) | 0 (0.0%) |
| 1 or 2 Children | 82 (100.0%) | 0 (0.0%) |
| 3 or 4 Children | 19 (100.0%) | 0 (0.0%) |
| 5 or more Children | 0 (0.0%) | 0 (0.0%) |
| Total | 311 (100.0%) | 0 (0.0%) |
Income Below Poverty Among Single-Parent Households in Saxapahaw
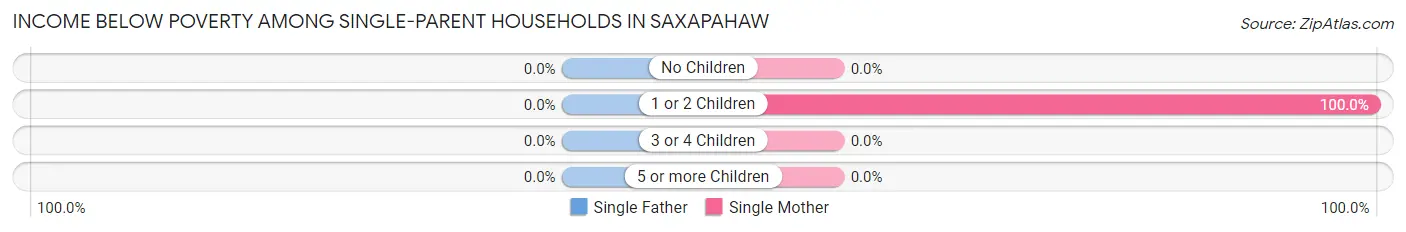
| Children | Single Father | Single Mother |
| No Children | 0 (0.0%) | 0 (0.0%) |
| 1 or 2 Children | 0 (0.0%) | 48 (100.0%) |
| 3 or 4 Children | 0 (0.0%) | 0 (0.0%) |
| 5 or more Children | 0 (0.0%) | 0 (0.0%) |
| Total | 0 (0.0%) | 48 (73.9%) |
Income Below Poverty Among Married-Couple vs Single-Parent Households in Saxapahaw
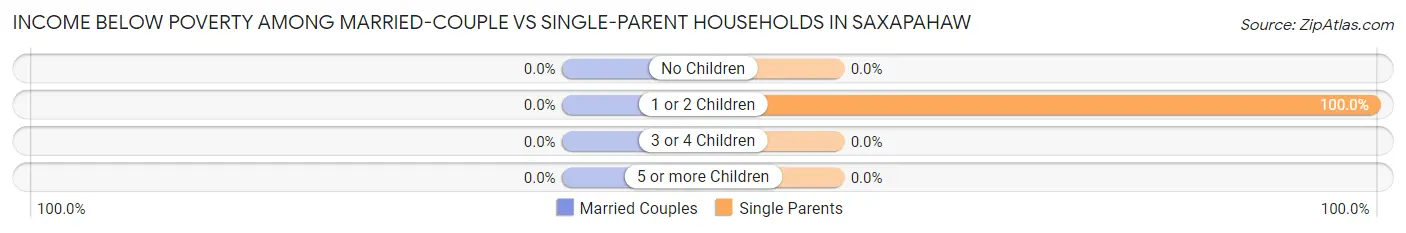
| Children | Married-Couple Families | Single-Parent Households |
| No Children | 0 (0.0%) | 0 (0.0%) |
| 1 or 2 Children | 0 (0.0%) | 48 (100.0%) |
| 3 or 4 Children | 0 (0.0%) | 0 (0.0%) |
| 5 or more Children | 0 (0.0%) | 0 (0.0%) |
| Total | 0 (0.0%) | 48 (65.7%) |
Race in Saxapahaw
The most populous races in Saxapahaw are White / Caucasian (1,045 | 87.1%), Hispanic or Latino (183 | 15.2%), and Native / Alaskan (136 | 11.3%).
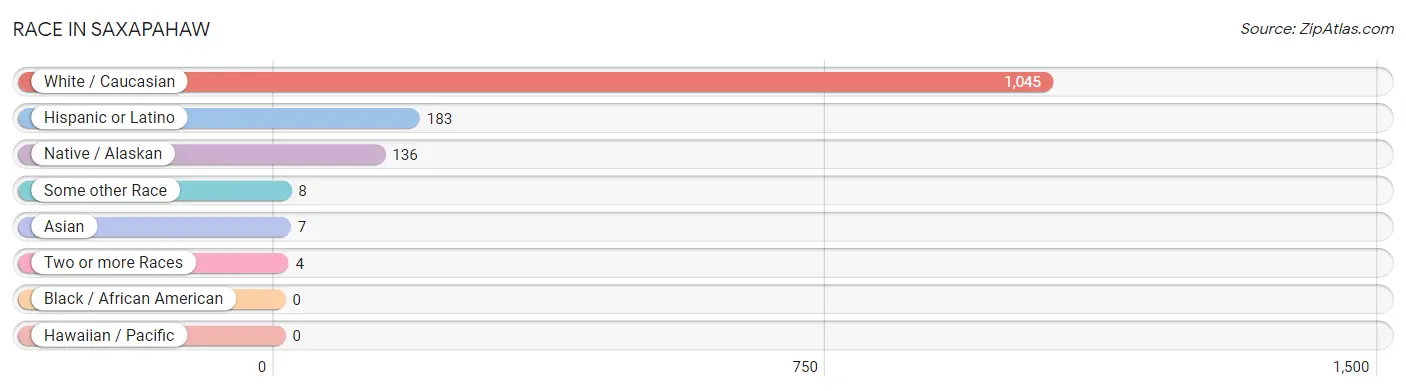
| Race | # Population | % Population |
| Asian | 7 | 0.6% |
| Black / African American | 0 | 0.0% |
| Hawaiian / Pacific | 0 | 0.0% |
| Hispanic or Latino | 183 | 15.2% |
| Native / Alaskan | 136 | 11.3% |
| White / Caucasian | 1,045 | 87.1% |
| Two or more Races | 4 | 0.3% |
| Some other Race | 8 | 0.7% |
| Total | 1,200 | 100.0% |
Ancestry in Saxapahaw
The most populous ancestries reported in Saxapahaw are American (168 | 14.0%), English (164 | 13.7%), Mexican (136 | 11.3%), German (94 | 7.8%), and European (90 | 7.5%), together accounting for 54.3% of all Saxapahaw residents.
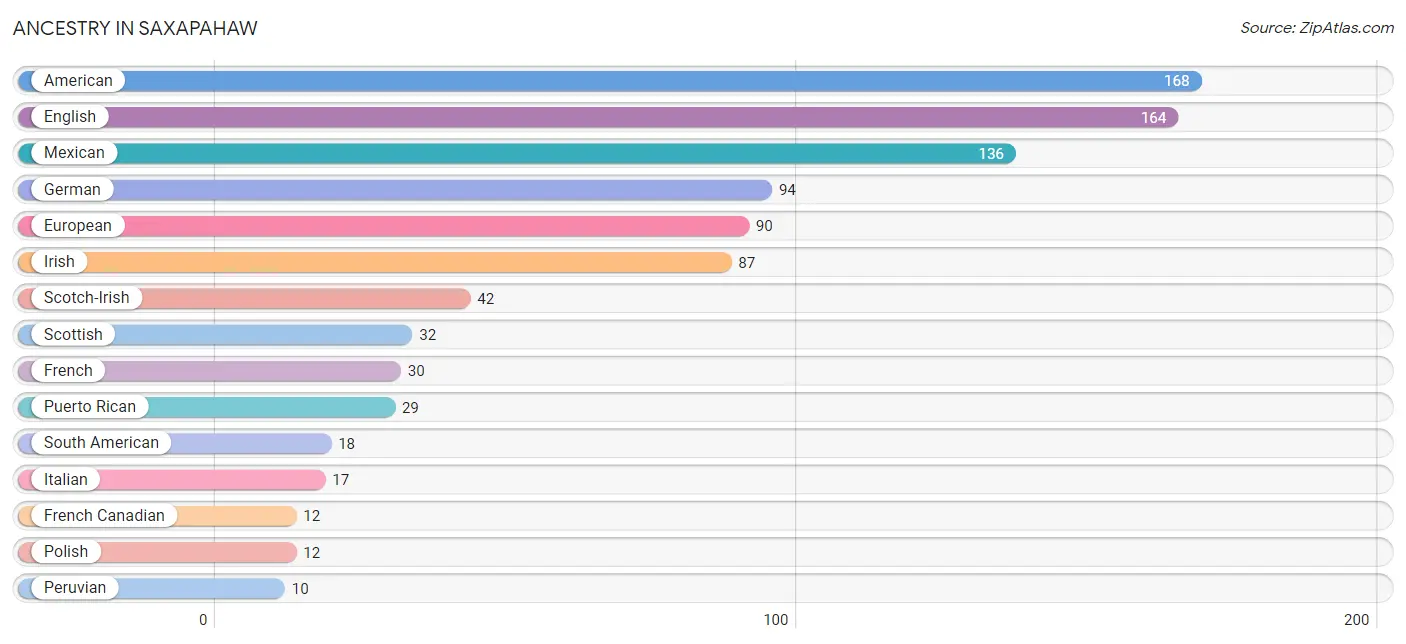
| Ancestry | # Population | % Population |
| American | 168 | 14.0% |
| Argentinean | 8 | 0.7% |
| Burmese | 7 | 0.6% |
| English | 164 | 13.7% |
| European | 90 | 7.5% |
| French | 30 | 2.5% |
| French Canadian | 12 | 1.0% |
| German | 94 | 7.8% |
| Irish | 87 | 7.2% |
| Italian | 17 | 1.4% |
| Mexican | 136 | 11.3% |
| Norwegian | 8 | 0.7% |
| Peruvian | 10 | 0.8% |
| Polish | 12 | 1.0% |
| Puerto Rican | 29 | 2.4% |
| Scotch-Irish | 42 | 3.5% |
| Scottish | 32 | 2.7% |
| South American | 18 | 1.5% |
| Swedish | 7 | 0.6% |
| Welsh | 5 | 0.4% | View All 20 Rows |
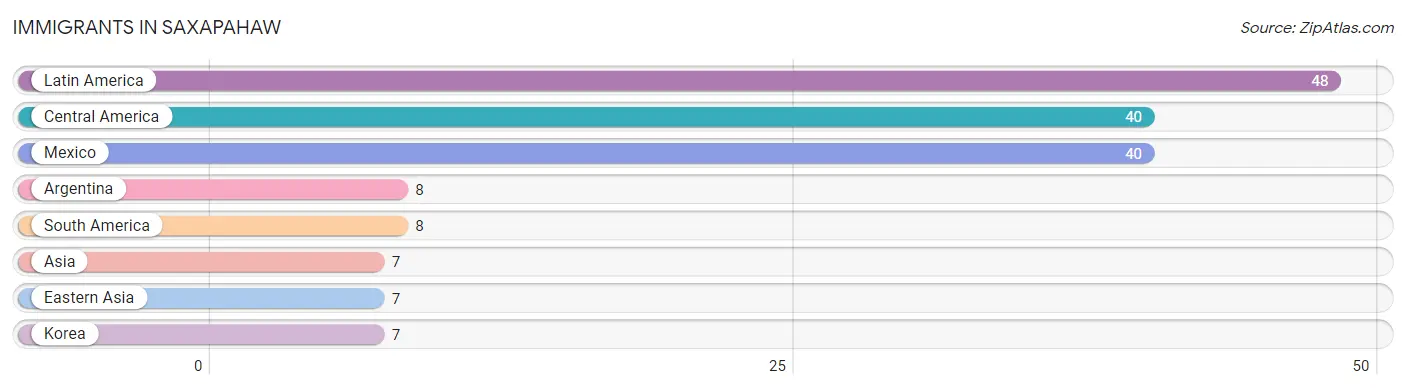
Immigrants in Saxapahaw
The most numerous immigrant groups reported in Saxapahaw came from Latin America (48 | 4.0%), Central America (40 | 3.3%), Mexico (40 | 3.3%), Argentina (8 | 0.7%), and South America (8 | 0.7%), together accounting for 12.0% of all Saxapahaw residents.
| Immigration Origin | # Population | % Population |
| Argentina | 8 | 0.7% |
| Asia | 7 | 0.6% |
| Central America | 40 | 3.3% |
| Eastern Asia | 7 | 0.6% |
| Korea | 7 | 0.6% |
| Latin America | 48 | 4.0% |
| Mexico | 40 | 3.3% |
| South America | 8 | 0.7% | View All 8 Rows |
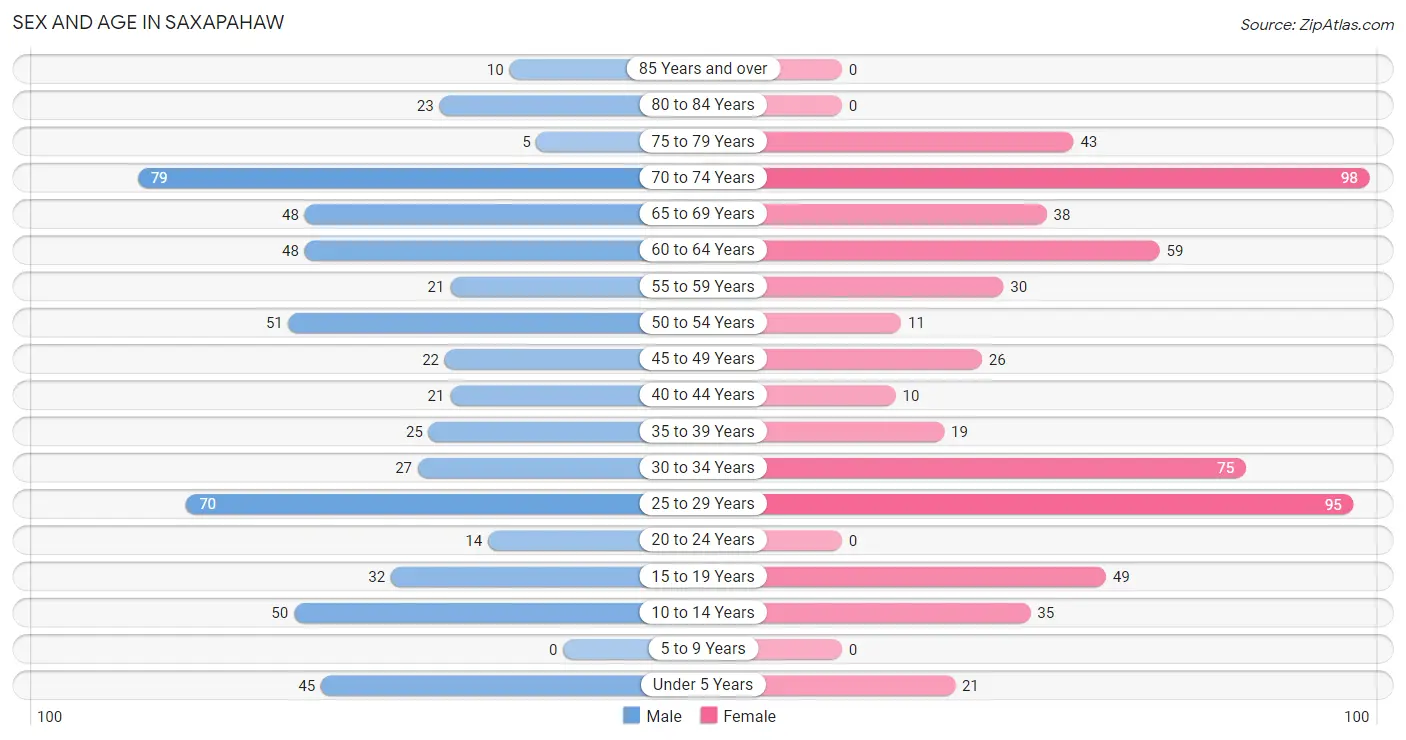
Sex and Age in Saxapahaw
Sex and Age in Saxapahaw
The most populous age groups in Saxapahaw are 70 to 74 Years (79 | 13.4%) for men and 70 to 74 Years (98 | 16.1%) for women.
| Age Bracket | Male | Female |
| Under 5 Years | 45 (7.6%) | 21 (3.5%) |
| 5 to 9 Years | 0 (0.0%) | 0 (0.0%) |
| 10 to 14 Years | 50 (8.5%) | 35 (5.8%) |
| 15 to 19 Years | 32 (5.4%) | 49 (8.1%) |
| 20 to 24 Years | 14 (2.4%) | 0 (0.0%) |
| 25 to 29 Years | 70 (11.8%) | 95 (15.6%) |
| 30 to 34 Years | 27 (4.6%) | 75 (12.3%) |
| 35 to 39 Years | 25 (4.2%) | 19 (3.1%) |
| 40 to 44 Years | 21 (3.5%) | 10 (1.6%) |
| 45 to 49 Years | 22 (3.7%) | 26 (4.3%) |
| 50 to 54 Years | 51 (8.6%) | 11 (1.8%) |
| 55 to 59 Years | 21 (3.5%) | 30 (4.9%) |
| 60 to 64 Years | 48 (8.1%) | 59 (9.7%) |
| 65 to 69 Years | 48 (8.1%) | 38 (6.2%) |
| 70 to 74 Years | 79 (13.4%) | 98 (16.1%) |
| 75 to 79 Years | 5 (0.9%) | 43 (7.1%) |
| 80 to 84 Years | 23 (3.9%) | 0 (0.0%) |
| 85 Years and over | 10 (1.7%) | 0 (0.0%) |
| Total | 591 (100.0%) | 609 (100.0%) |
Families and Households in Saxapahaw
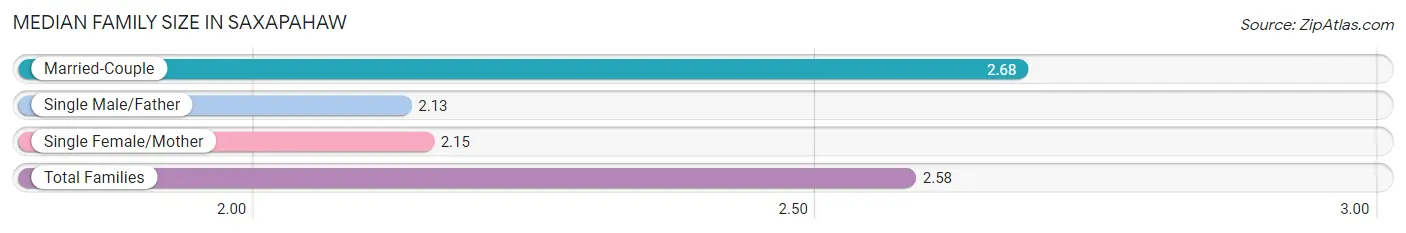
Median Family Size in Saxapahaw
The median family size in Saxapahaw is 2.58 persons per family, with married-couple families (311 | 81.0%) accounting for the largest median family size of 2.68 persons per family. On the other hand, single male/father families (8 | 2.1%) represent the smallest median family size with 2.13 persons per family.
| Family Type | # Families | Family Size |
| Married-Couple | 311 (81.0%) | 2.68 |
| Single Male/Father | 8 (2.1%) | 2.13 |
| Single Female/Mother | 65 (16.9%) | 2.15 |
| Total Families | 384 (100.0%) | 2.58 |
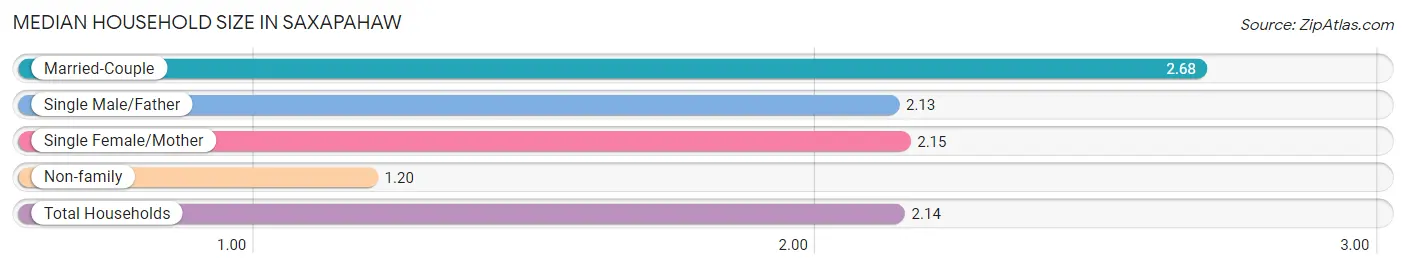
Median Household Size in Saxapahaw
The median household size in Saxapahaw is 2.14 persons per household, with married-couple households (311 | 55.5%) accounting for the largest median household size of 2.68 persons per household. non-family households (176 | 31.4%) represent the smallest median household size with 1.20 persons per household.
| Household Type | # Households | Household Size |
| Married-Couple | 311 (55.5%) | 2.68 |
| Single Male/Father | 8 (1.4%) | 2.13 |
| Single Female/Mother | 65 (11.6%) | 2.15 |
| Non-family | 176 (31.4%) | 1.20 |
| Total Households | 560 (100.0%) | 2.14 |
Household Size by Marriage Status in Saxapahaw
Out of a total of 560 households in Saxapahaw, 384 (68.6%) are family households, while 176 (31.4%) are nonfamily households. The most numerous type of family households are 2-person households, comprising 262, and the most common type of nonfamily households are 1-person households, comprising 148.
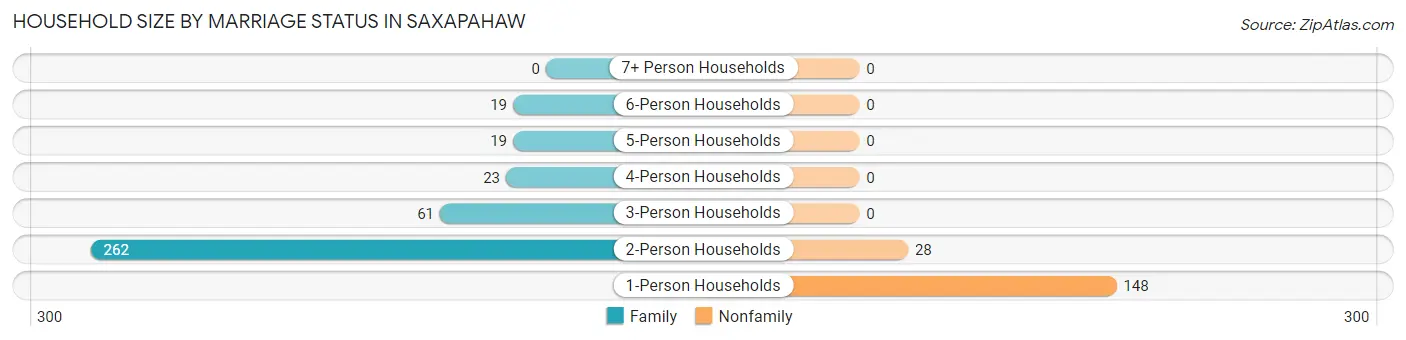
| Household Size | Family Households | Nonfamily Households |
| 1-Person Households | - | 148 (26.4%) |
| 2-Person Households | 262 (46.8%) | 28 (5.0%) |
| 3-Person Households | 61 (10.9%) | 0 (0.0%) |
| 4-Person Households | 23 (4.1%) | 0 (0.0%) |
| 5-Person Households | 19 (3.4%) | 0 (0.0%) |
| 6-Person Households | 19 (3.4%) | 0 (0.0%) |
| 7+ Person Households | 0 (0.0%) | 0 (0.0%) |
| Total | 384 (68.6%) | 176 (31.4%) |
Female Fertility in Saxapahaw
Fertility by Age in Saxapahaw
| Age Bracket | Women with Births | Births / 1,000 Women |
| 15 to 19 years | 0 (0.0%) | 0.0 |
| 20 to 34 years | 0 (0.0%) | 0.0 |
| 35 to 50 years | 0 (0.0%) | 0.0 |
| Total | 0 (0.0%) | 0.0 |
Fertility by Age by Marriage Status in Saxapahaw
| Age Bracket | Married | Unmarried |
| 15 to 19 years | 0 (0.0%) | 0 (0.0%) |
| 20 to 34 years | 0 (0.0%) | 0 (0.0%) |
| 35 to 50 years | 0 (0.0%) | 0 (0.0%) |
| Total | 0 (0.0%) | 0 (0.0%) |
Fertility by Education in Saxapahaw
| Educational Attainment | Women with Births | Births / 1,000 Women |
| Less than High School | 0 (0.0%) | 0.0 |
| High School Diploma | 0 (0.0%) | 0.0 |
| College or Associate's Degree | 0 (0.0%) | 0.0 |
| Bachelor's Degree | 0 (0.0%) | 0.0 |
| Graduate Degree | 0 (0.0%) | 0.0 |
| Total | 0 (0.0%) | 0.0 |
Fertility by Education by Marriage Status in Saxapahaw
| Educational Attainment | Married | Unmarried |
| Less than High School | 0 (0.0%) | 0 (0.0%) |
| High School Diploma | 0 (0.0%) | 0 (0.0%) |
| College or Associate's Degree | 0 (0.0%) | 0 (0.0%) |
| Bachelor's Degree | 0 (0.0%) | 0 (0.0%) |
| Graduate Degree | 0 (0.0%) | 0 (0.0%) |
| Total | 0 (0.0%) | 0 (0.0%) |
Employment Characteristics in Saxapahaw
Employment by Class of Employer in Saxapahaw
Among the 532 employed individuals in Saxapahaw, private company employees (305 | 57.3%), state government employees (86 | 16.2%), and local government employees (61 | 11.5%) make up the most common classes of employment.
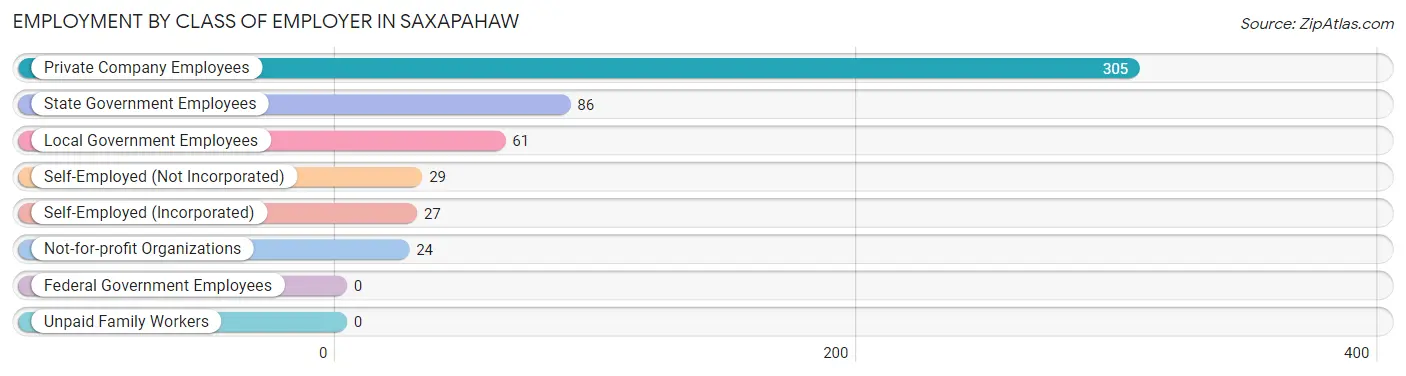
| Employer Class | # Employees | % Employees |
| Private Company Employees | 305 | 57.3% |
| Self-Employed (Incorporated) | 27 | 5.1% |
| Self-Employed (Not Incorporated) | 29 | 5.4% |
| Not-for-profit Organizations | 24 | 4.5% |
| Local Government Employees | 61 | 11.5% |
| State Government Employees | 86 | 16.2% |
| Federal Government Employees | 0 | 0.0% |
| Unpaid Family Workers | 0 | 0.0% |
| Total | 532 | 100.0% |
Employment Status by Age in Saxapahaw
According to the labor force statistics for Saxapahaw, out of the total population over 16 years of age (1,000), 58.0% or 580 individuals are in the labor force, with 8.3% or 48 of them unemployed. The age group with the highest labor force participation rate is 16 to 19 years, with 100.0% or 32 individuals in the labor force. Within the labor force, the 30 to 34 years age range has the highest percentage of unemployed individuals, with 47.1% or 48 of them being unemployed.
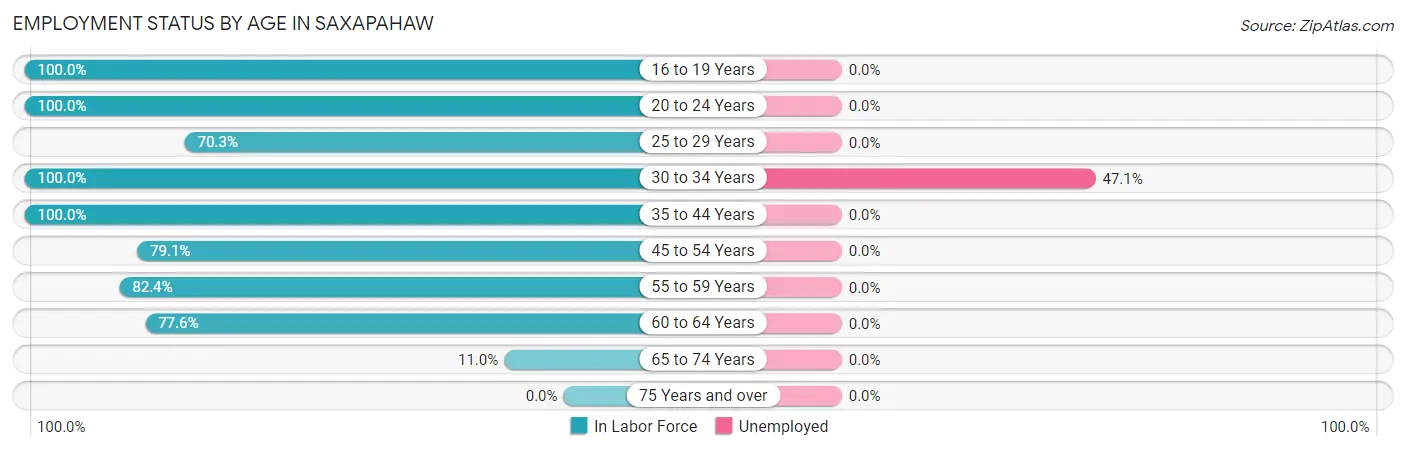
| Age Bracket | In Labor Force | Unemployed |
| 16 to 19 Years | 32 (100.0%) | 0 (0.0%) |
| 20 to 24 Years | 14 (100.0%) | 0 (0.0%) |
| 25 to 29 Years | 116 (70.3%) | 0 (0.0%) |
| 30 to 34 Years | 102 (100.0%) | 48 (47.1%) |
| 35 to 44 Years | 75 (100.0%) | 0 (0.0%) |
| 45 to 54 Years | 87 (79.1%) | 0 (0.0%) |
| 55 to 59 Years | 42 (82.4%) | 0 (0.0%) |
| 60 to 64 Years | 83 (77.6%) | 0 (0.0%) |
| 65 to 74 Years | 29 (11.0%) | 0 (0.0%) |
| 75 Years and over | 0 (0.0%) | 0 (0.0%) |
| Total | 580 (58.0%) | 48 (8.3%) |
Employment Status by Educational Attainment in Saxapahaw
According to labor force statistics for Saxapahaw, 82.8% of individuals (505) out of the total population between 25 and 64 years of age (610) are in the labor force, with 9.5% or 48 of them being unemployed. The group with the highest labor force participation rate are those with the educational attainment of less than high school, with 100.0% or 84 individuals in the labor force. Within the labor force, individuals with college / associate degree education have the highest percentage of unemployment, with 27.7% or 48 of them being unemployed.
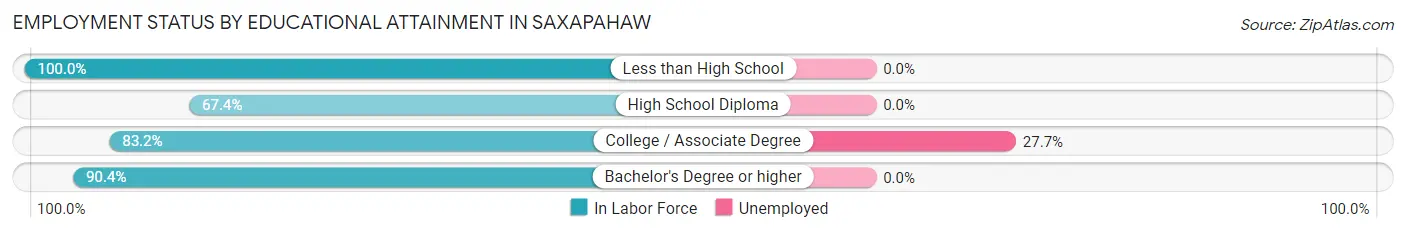
| Educational Attainment | In Labor Force | Unemployed |
| Less than High School | 84 (100.0%) | 0 (0.0%) |
| High School Diploma | 116 (67.4%) | 0 (0.0%) |
| College / Associate Degree | 173 (83.2%) | 58 (27.7%) |
| Bachelor's Degree or higher | 132 (90.4%) | 0 (0.0%) |
| Total | 505 (82.8%) | 58 (9.5%) |
Employment Occupations by Sex in Saxapahaw
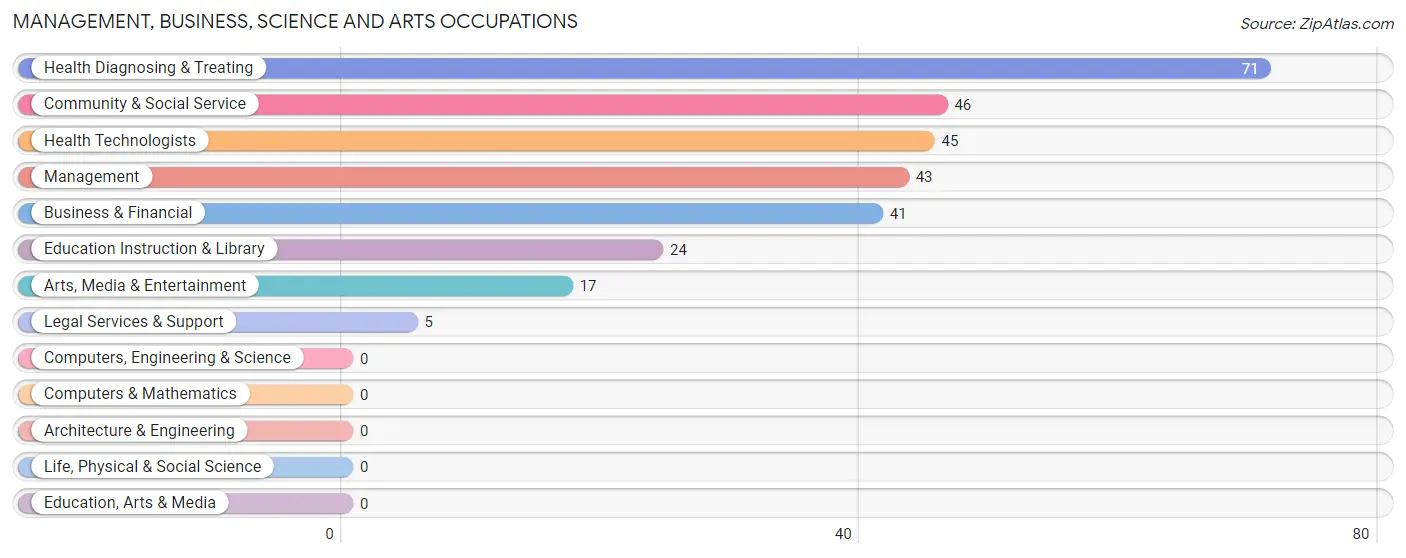
Management, Business, Science and Arts Occupations
The most common Management, Business, Science and Arts occupations in Saxapahaw are Health Diagnosing & Treating (71 | 13.4%), Community & Social Service (46 | 8.6%), Health Technologists (45 | 8.5%), Management (43 | 8.1%), and Business & Financial (41 | 7.7%).
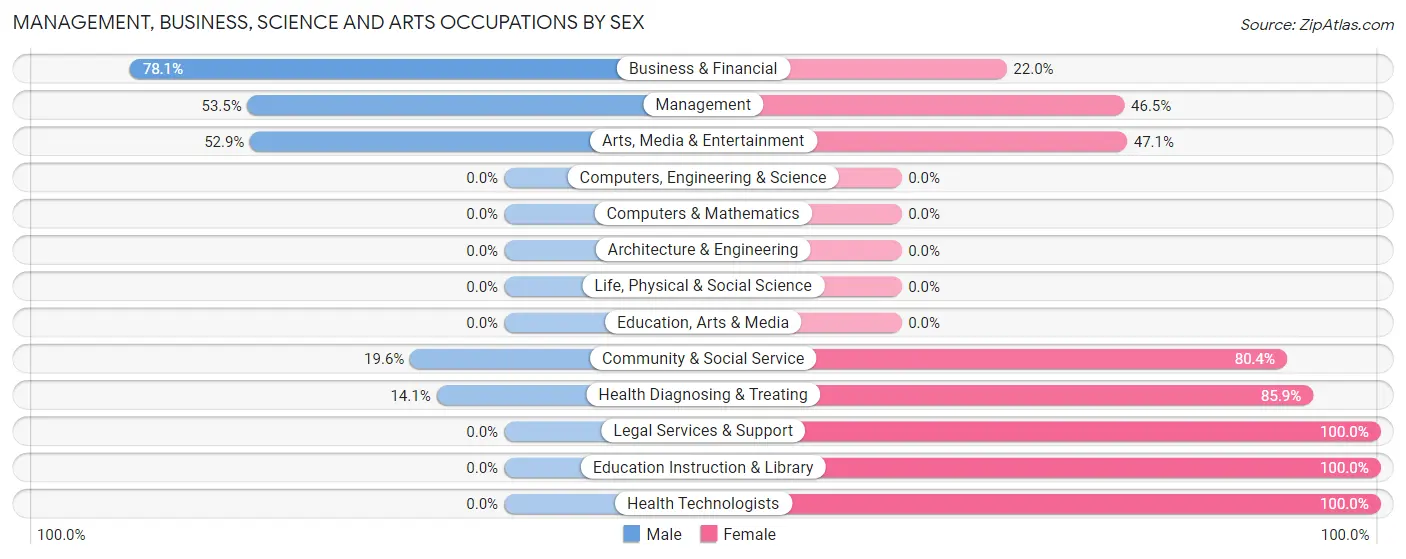
Management, Business, Science and Arts Occupations by Sex
Within the Management, Business, Science and Arts occupations in Saxapahaw, the most male-oriented occupations are Business & Financial (78.0%), Management (53.5%), and Arts, Media & Entertainment (52.9%), while the most female-oriented occupations are Legal Services & Support (100.0%), Education Instruction & Library (100.0%), and Health Technologists (100.0%).
| Occupation | Male | Female |
| Management | 23 (53.5%) | 20 (46.5%) |
| Business & Financial | 32 (78.0%) | 9 (22.0%) |
| Computers, Engineering & Science | 0 (0.0%) | 0 (0.0%) |
| Computers & Mathematics | 0 (0.0%) | 0 (0.0%) |
| Architecture & Engineering | 0 (0.0%) | 0 (0.0%) |
| Life, Physical & Social Science | 0 (0.0%) | 0 (0.0%) |
| Community & Social Service | 9 (19.6%) | 37 (80.4%) |
| Education, Arts & Media | 0 (0.0%) | 0 (0.0%) |
| Legal Services & Support | 0 (0.0%) | 5 (100.0%) |
| Education Instruction & Library | 0 (0.0%) | 24 (100.0%) |
| Arts, Media & Entertainment | 9 (52.9%) | 8 (47.1%) |
| Health Diagnosing & Treating | 10 (14.1%) | 61 (85.9%) |
| Health Technologists | 0 (0.0%) | 45 (100.0%) |
| Total (Category) | 74 (36.8%) | 127 (63.2%) |
| Total (Overall) | 316 (59.4%) | 216 (40.6%) |
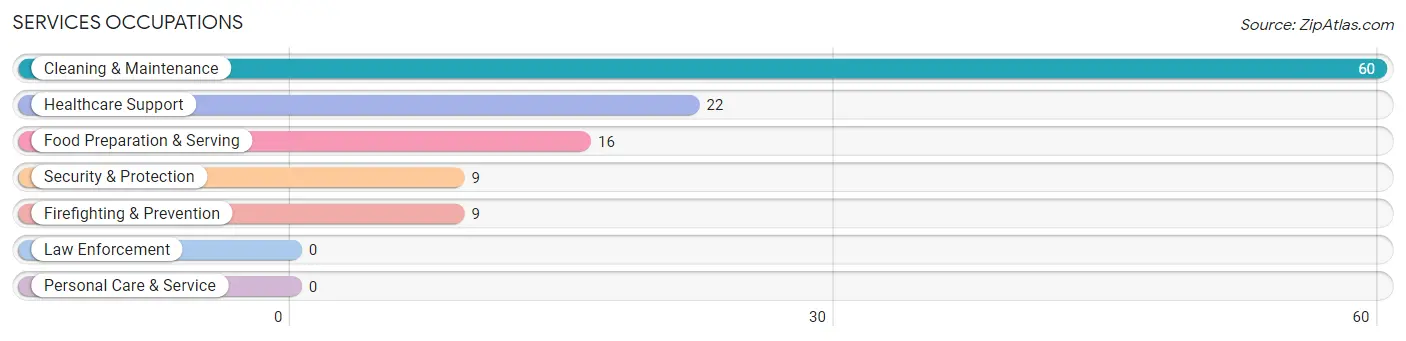
Services Occupations
The most common Services occupations in Saxapahaw are Cleaning & Maintenance (60 | 11.3%), Healthcare Support (22 | 4.1%), Food Preparation & Serving (16 | 3.0%), Security & Protection (9 | 1.7%), and Firefighting & Prevention (9 | 1.7%).
Services Occupations by Sex
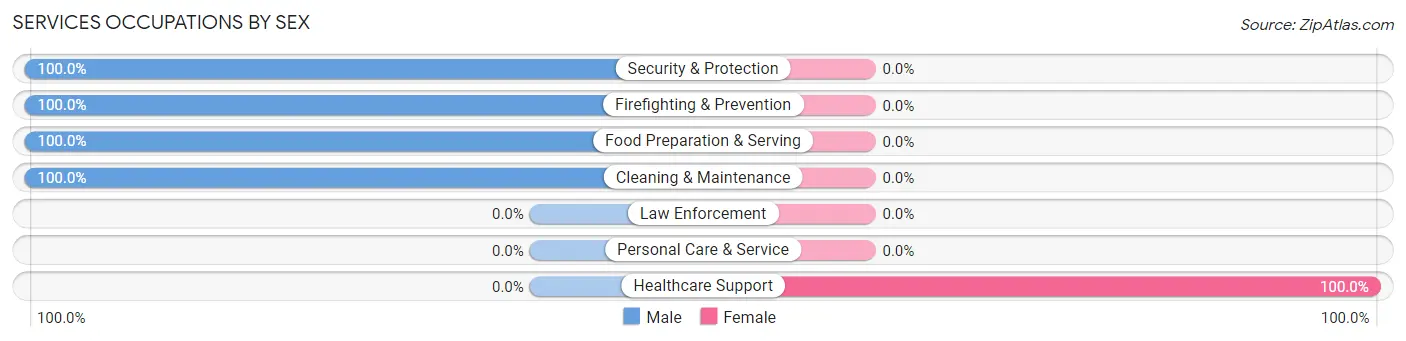
| Occupation | Male | Female |
| Healthcare Support | 0 (0.0%) | 22 (100.0%) |
| Security & Protection | 9 (100.0%) | 0 (0.0%) |
| Firefighting & Prevention | 9 (100.0%) | 0 (0.0%) |
| Law Enforcement | 0 (0.0%) | 0 (0.0%) |
| Food Preparation & Serving | 16 (100.0%) | 0 (0.0%) |
| Cleaning & Maintenance | 60 (100.0%) | 0 (0.0%) |
| Personal Care & Service | 0 (0.0%) | 0 (0.0%) |
| Total (Category) | 85 (79.4%) | 22 (20.6%) |
| Total (Overall) | 316 (59.4%) | 216 (40.6%) |
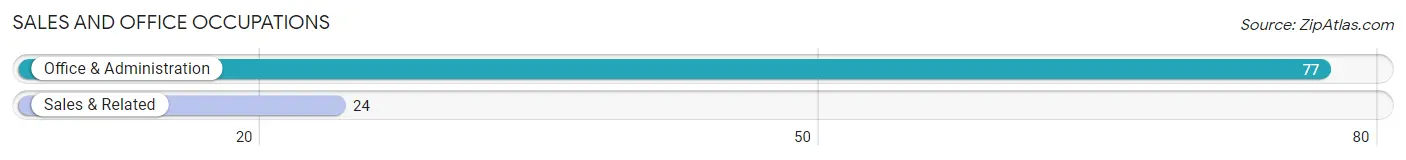
Sales and Office Occupations
The most common Sales and Office occupations in Saxapahaw are Office & Administration (77 | 14.5%), and Sales & Related (24 | 4.5%).
Sales and Office Occupations by Sex
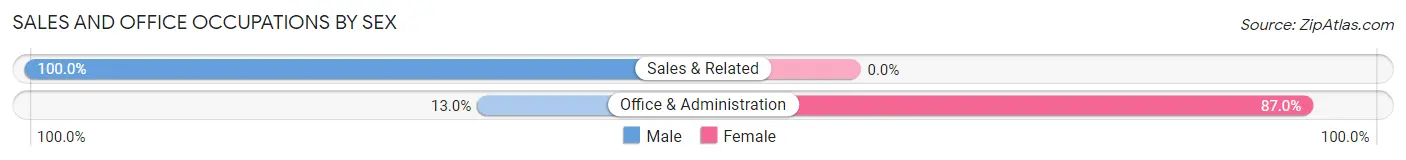
| Occupation | Male | Female |
| Sales & Related | 24 (100.0%) | 0 (0.0%) |
| Office & Administration | 10 (13.0%) | 67 (87.0%) |
| Total (Category) | 34 (33.7%) | 67 (66.3%) |
| Total (Overall) | 316 (59.4%) | 216 (40.6%) |
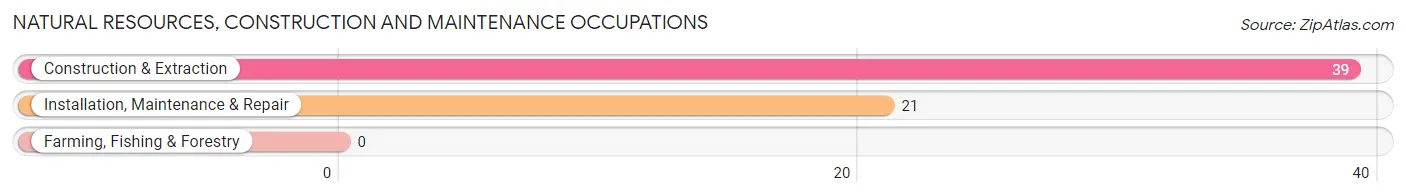
Natural Resources, Construction and Maintenance Occupations
The most common Natural Resources, Construction and Maintenance occupations in Saxapahaw are Construction & Extraction (39 | 7.3%), and Installation, Maintenance & Repair (21 | 4.0%).
Natural Resources, Construction and Maintenance Occupations by Sex
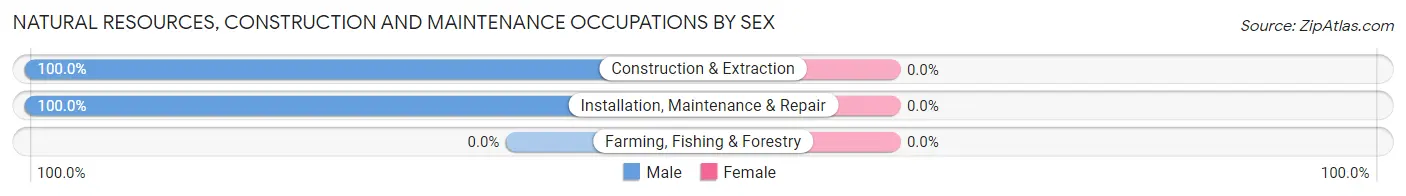
| Occupation | Male | Female |
| Farming, Fishing & Forestry | 0 (0.0%) | 0 (0.0%) |
| Construction & Extraction | 39 (100.0%) | 0 (0.0%) |
| Installation, Maintenance & Repair | 21 (100.0%) | 0 (0.0%) |
| Total (Category) | 60 (100.0%) | 0 (0.0%) |
| Total (Overall) | 316 (59.4%) | 216 (40.6%) |
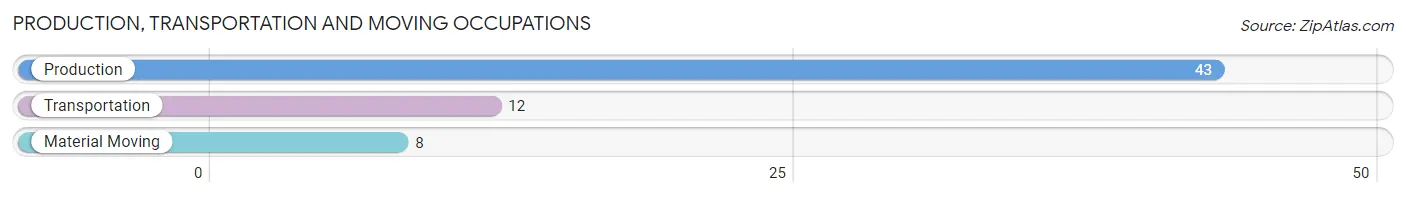
Production, Transportation and Moving Occupations
The most common Production, Transportation and Moving occupations in Saxapahaw are Production (43 | 8.1%), Transportation (12 | 2.3%), and Material Moving (8 | 1.5%).
Production, Transportation and Moving Occupations by Sex
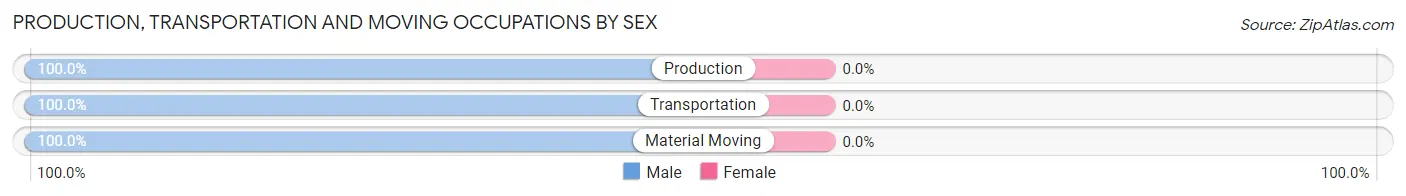
| Occupation | Male | Female |
| Production | 43 (100.0%) | 0 (0.0%) |
| Transportation | 12 (100.0%) | 0 (0.0%) |
| Material Moving | 8 (100.0%) | 0 (0.0%) |
| Total (Category) | 63 (100.0%) | 0 (0.0%) |
| Total (Overall) | 316 (59.4%) | 216 (40.6%) |
Employment Industries by Sex in Saxapahaw
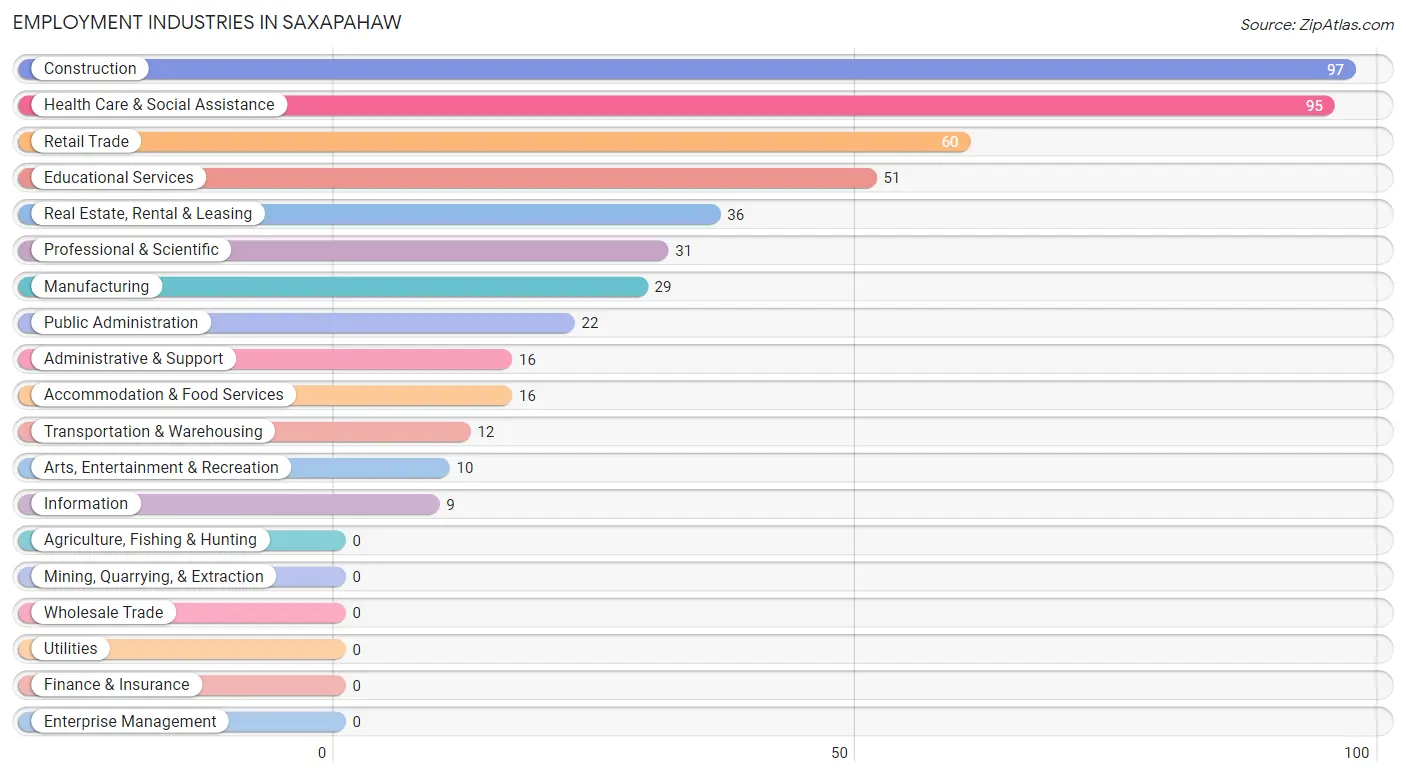
Employment Industries in Saxapahaw
The major employment industries in Saxapahaw include Construction (97 | 18.2%), Health Care & Social Assistance (95 | 17.9%), Retail Trade (60 | 11.3%), Educational Services (51 | 9.6%), and Real Estate, Rental & Leasing (36 | 6.8%).
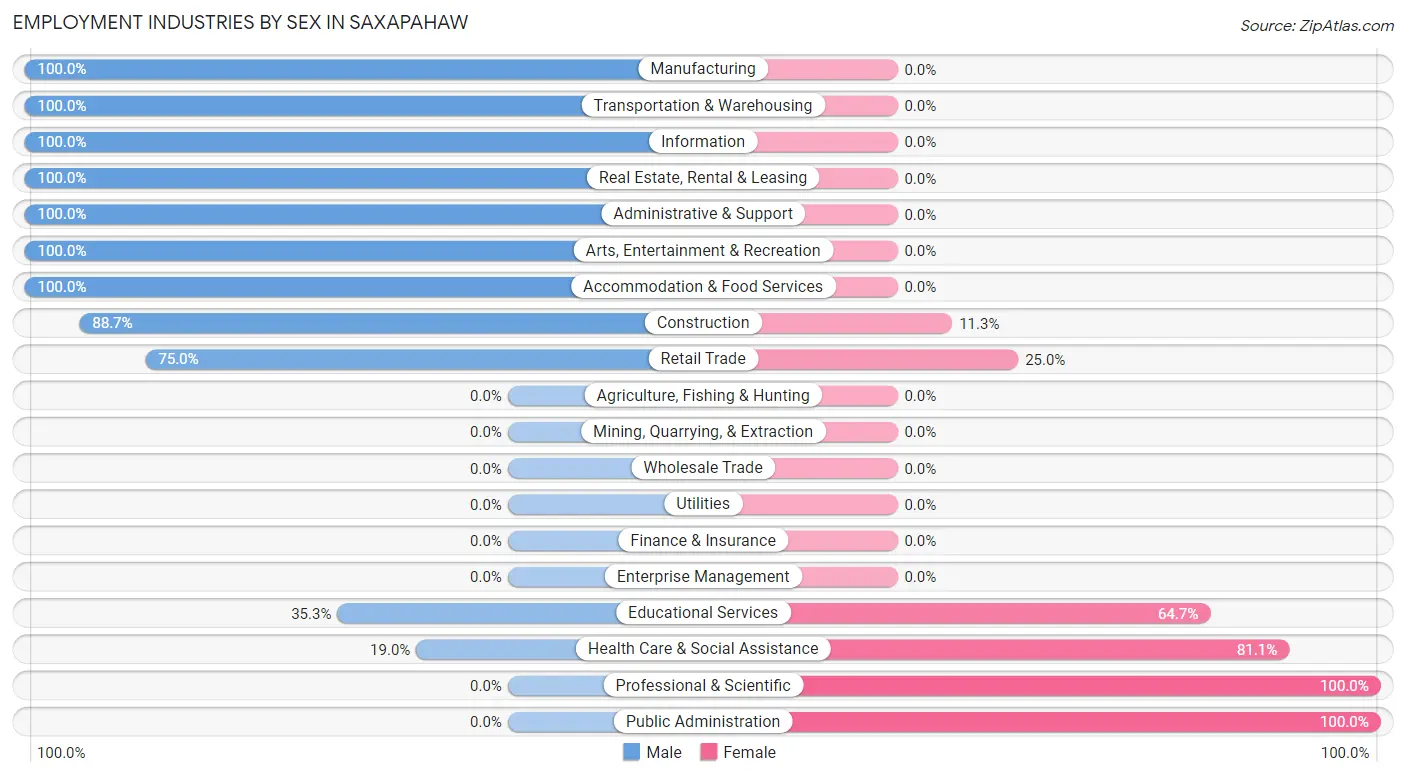
Employment Industries by Sex in Saxapahaw
The Saxapahaw industries that see more men than women are Manufacturing (100.0%), Transportation & Warehousing (100.0%), and Information (100.0%), whereas the industries that tend to have a higher number of women are Professional & Scientific (100.0%), Public Administration (100.0%), and Health Care & Social Assistance (81.0%).
| Industry | Male | Female |
| Agriculture, Fishing & Hunting | 0 (0.0%) | 0 (0.0%) |
| Mining, Quarrying, & Extraction | 0 (0.0%) | 0 (0.0%) |
| Construction | 86 (88.7%) | 11 (11.3%) |
| Manufacturing | 29 (100.0%) | 0 (0.0%) |
| Wholesale Trade | 0 (0.0%) | 0 (0.0%) |
| Retail Trade | 45 (75.0%) | 15 (25.0%) |
| Transportation & Warehousing | 12 (100.0%) | 0 (0.0%) |
| Utilities | 0 (0.0%) | 0 (0.0%) |
| Information | 9 (100.0%) | 0 (0.0%) |
| Finance & Insurance | 0 (0.0%) | 0 (0.0%) |
| Real Estate, Rental & Leasing | 36 (100.0%) | 0 (0.0%) |
| Professional & Scientific | 0 (0.0%) | 31 (100.0%) |
| Enterprise Management | 0 (0.0%) | 0 (0.0%) |
| Administrative & Support | 16 (100.0%) | 0 (0.0%) |
| Educational Services | 18 (35.3%) | 33 (64.7%) |
| Health Care & Social Assistance | 18 (19.0%) | 77 (81.0%) |
| Arts, Entertainment & Recreation | 10 (100.0%) | 0 (0.0%) |
| Accommodation & Food Services | 16 (100.0%) | 0 (0.0%) |
| Public Administration | 0 (0.0%) | 22 (100.0%) |
| Total | 316 (59.4%) | 216 (40.6%) |
Education in Saxapahaw
School Enrollment in Saxapahaw
The most common levels of schooling among the 142 students in Saxapahaw are high school (82 | 57.8%), middle school (38 | 26.8%), and elementary school (22 | 15.5%).
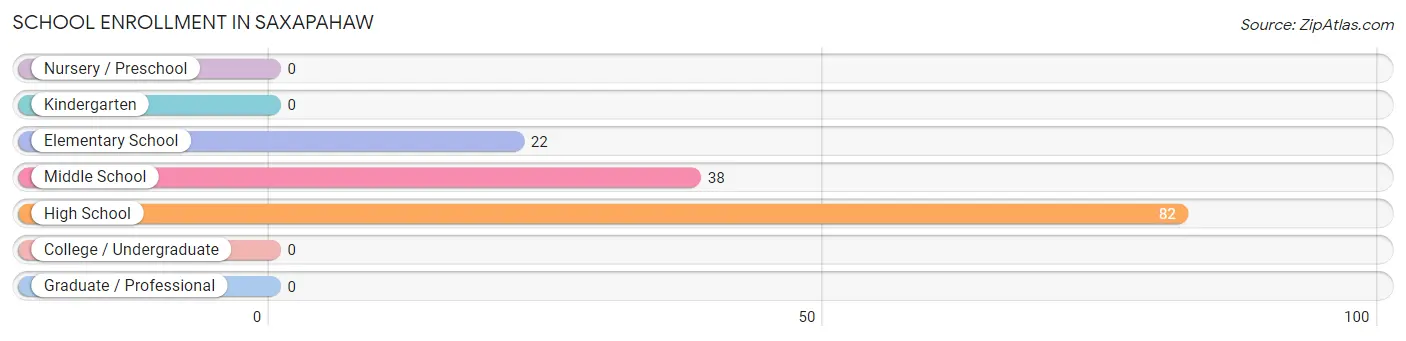
| School Level | # Students | % Students |
| Nursery / Preschool | 0 | 0.0% |
| Kindergarten | 0 | 0.0% |
| Elementary School | 22 | 15.5% |
| Middle School | 38 | 26.8% |
| High School | 82 | 57.8% |
| College / Undergraduate | 0 | 0.0% |
| Graduate / Professional | 0 | 0.0% |
| Total | 142 | 100.0% |
School Enrollment by Age by Funding Source in Saxapahaw
Out of a total of 142 students who are enrolled in schools in Saxapahaw, 13 (9.2%) attend a private institution, while the remaining 129 (90.8%) are enrolled in public schools. The age group of 10 to 14 year olds has the highest likelihood of being enrolled in private schools, with 13 (15.3% in the age bracket) enrolled. Conversely, the age group of 15 to 17 year olds has the lowest likelihood of being enrolled in a private school, with 57 (100.0% in the age bracket) attending a public institution.

| Age Bracket | Public School | Private School |
| 3 to 4 Year Olds | 0 (0.0%) | 0 (0.0%) |
| 5 to 9 Year Old | 0 (0.0%) | 0 (0.0%) |
| 10 to 14 Year Olds | 72 (84.7%) | 13 (15.3%) |
| 15 to 17 Year Olds | 57 (100.0%) | 0 (0.0%) |
| 18 to 19 Year Olds | 0 (0.0%) | 0 (0.0%) |
| 20 to 24 Year Olds | 0 (0.0%) | 0 (0.0%) |
| 25 to 34 Year Olds | 0 (0.0%) | 0 (0.0%) |
| 35 Years and over | 0 (0.0%) | 0 (0.0%) |
| Total | 129 (90.8%) | 13 (9.2%) |
Educational Attainment by Field of Study in Saxapahaw
Literature & languages (39 | 18.5%), science & technology (38 | 18.0%), liberal arts & history (32 | 15.2%), business (28 | 13.3%), and bio, nature & agricultural (23 | 10.9%) are the most common fields of study among 211 individuals in Saxapahaw who have obtained a bachelor's degree or higher.
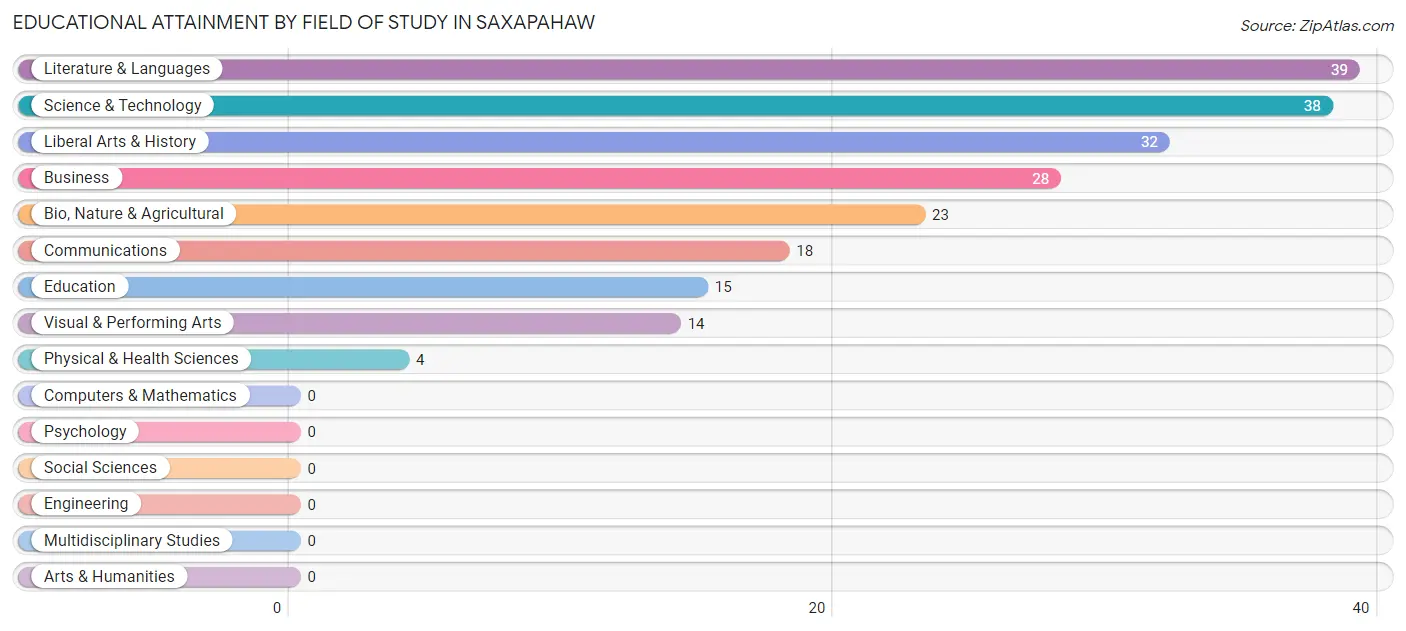
| Field of Study | # Graduates | % Graduates |
| Computers & Mathematics | 0 | 0.0% |
| Bio, Nature & Agricultural | 23 | 10.9% |
| Physical & Health Sciences | 4 | 1.9% |
| Psychology | 0 | 0.0% |
| Social Sciences | 0 | 0.0% |
| Engineering | 0 | 0.0% |
| Multidisciplinary Studies | 0 | 0.0% |
| Science & Technology | 38 | 18.0% |
| Business | 28 | 13.3% |
| Education | 15 | 7.1% |
| Literature & Languages | 39 | 18.5% |
| Liberal Arts & History | 32 | 15.2% |
| Visual & Performing Arts | 14 | 6.6% |
| Communications | 18 | 8.5% |
| Arts & Humanities | 0 | 0.0% |
| Total | 211 | 100.0% |
Transportation & Commute in Saxapahaw
Vehicle Availability by Sex in Saxapahaw
The most prevalent vehicle ownership categories in Saxapahaw are males with 3 vehicles (120, accounting for 38.0%) and females with 3 vehicles (95, making up 55.6%).
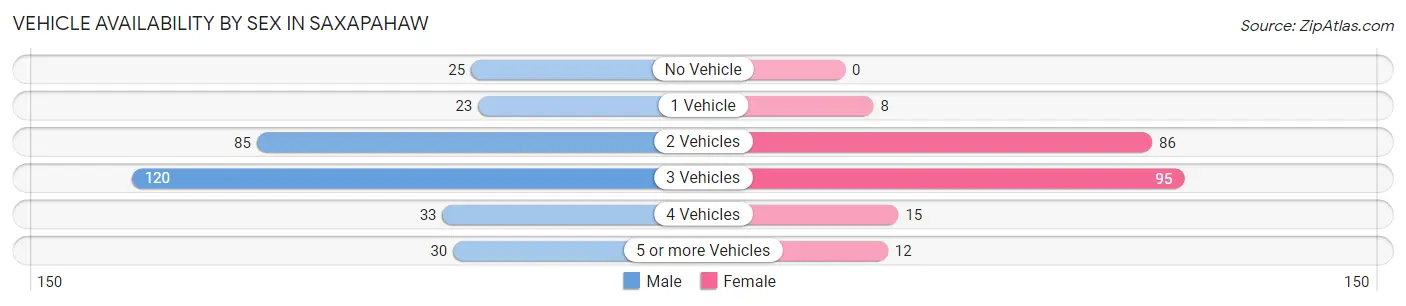
| Vehicles Available | Male | Female |
| No Vehicle | 25 (7.9%) | 0 (0.0%) |
| 1 Vehicle | 23 (7.3%) | 8 (3.7%) |
| 2 Vehicles | 85 (26.9%) | 86 (39.8%) |
| 3 Vehicles | 120 (38.0%) | 95 (44.0%) |
| 4 Vehicles | 33 (10.4%) | 15 (6.9%) |
| 5 or more Vehicles | 30 (9.5%) | 12 (5.6%) |
| Total | 316 (100.0%) | 216 (100.0%) |
Commute Time in Saxapahaw
The most frequently occuring commute durations in Saxapahaw are 30 to 34 minutes (144 commuters, 32.1%), 15 to 19 minutes (94 commuters, 21.0%), and 5 to 9 minutes (57 commuters, 12.7%).
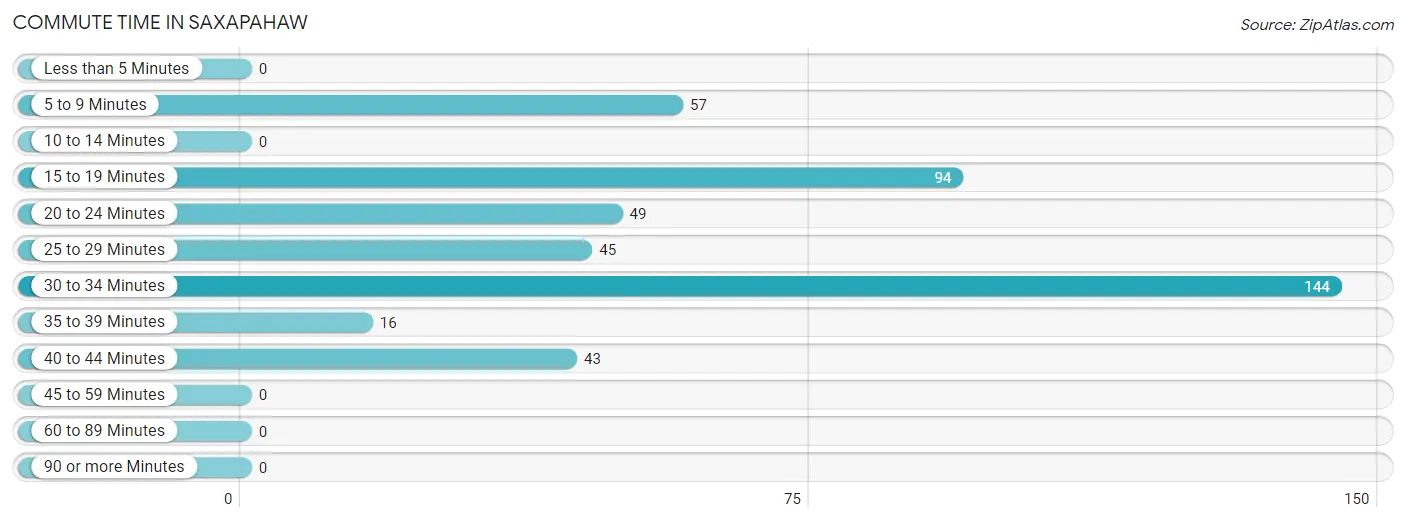
| Commute Time | # Commuters | % Commuters |
| Less than 5 Minutes | 0 | 0.0% |
| 5 to 9 Minutes | 57 | 12.7% |
| 10 to 14 Minutes | 0 | 0.0% |
| 15 to 19 Minutes | 94 | 21.0% |
| 20 to 24 Minutes | 49 | 10.9% |
| 25 to 29 Minutes | 45 | 10.0% |
| 30 to 34 Minutes | 144 | 32.1% |
| 35 to 39 Minutes | 16 | 3.6% |
| 40 to 44 Minutes | 43 | 9.6% |
| 45 to 59 Minutes | 0 | 0.0% |
| 60 to 89 Minutes | 0 | 0.0% |
| 90 or more Minutes | 0 | 0.0% |
Commute Time by Sex in Saxapahaw
The most common commute times in Saxapahaw are 30 to 34 minutes (80 commuters, 28.8%) for males and 30 to 34 minutes (64 commuters, 37.7%) for females.
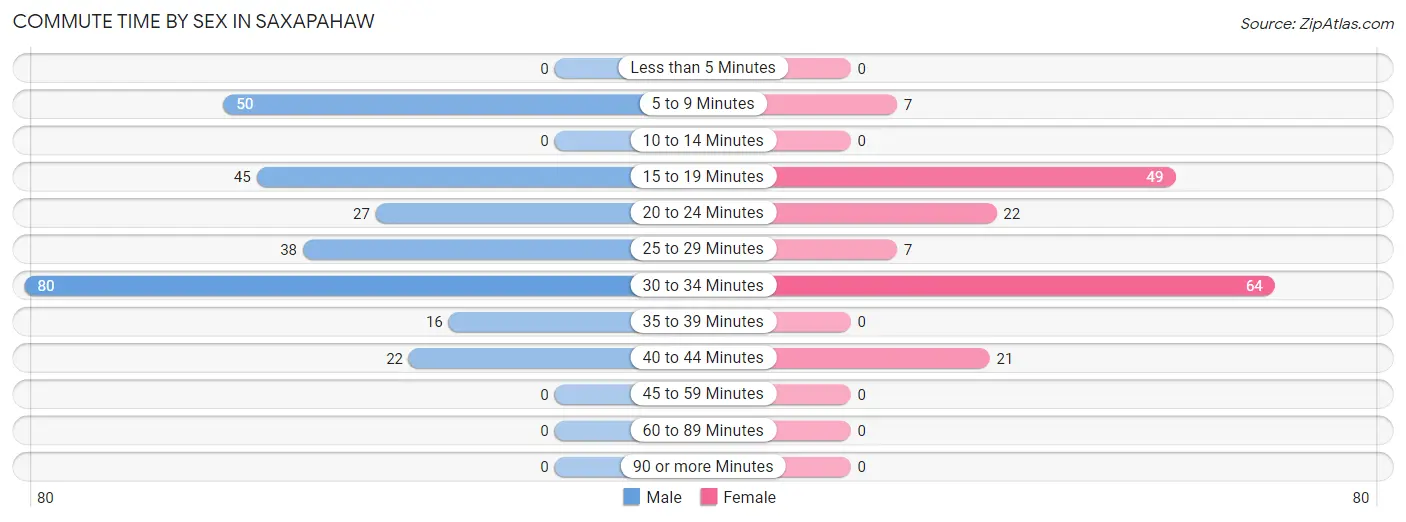
| Commute Time | Male | Female |
| Less than 5 Minutes | 0 (0.0%) | 0 (0.0%) |
| 5 to 9 Minutes | 50 (18.0%) | 7 (4.1%) |
| 10 to 14 Minutes | 0 (0.0%) | 0 (0.0%) |
| 15 to 19 Minutes | 45 (16.2%) | 49 (28.8%) |
| 20 to 24 Minutes | 27 (9.7%) | 22 (12.9%) |
| 25 to 29 Minutes | 38 (13.7%) | 7 (4.1%) |
| 30 to 34 Minutes | 80 (28.8%) | 64 (37.7%) |
| 35 to 39 Minutes | 16 (5.8%) | 0 (0.0%) |
| 40 to 44 Minutes | 22 (7.9%) | 21 (12.3%) |
| 45 to 59 Minutes | 0 (0.0%) | 0 (0.0%) |
| 60 to 89 Minutes | 0 (0.0%) | 0 (0.0%) |
| 90 or more Minutes | 0 (0.0%) | 0 (0.0%) |
Time of Departure to Work by Sex in Saxapahaw
The most frequent times of departure to work in Saxapahaw are 7:00 AM to 7:29 AM (115, 41.4%) for males and 6:00 AM to 6:29 AM (47, 27.7%) for females.
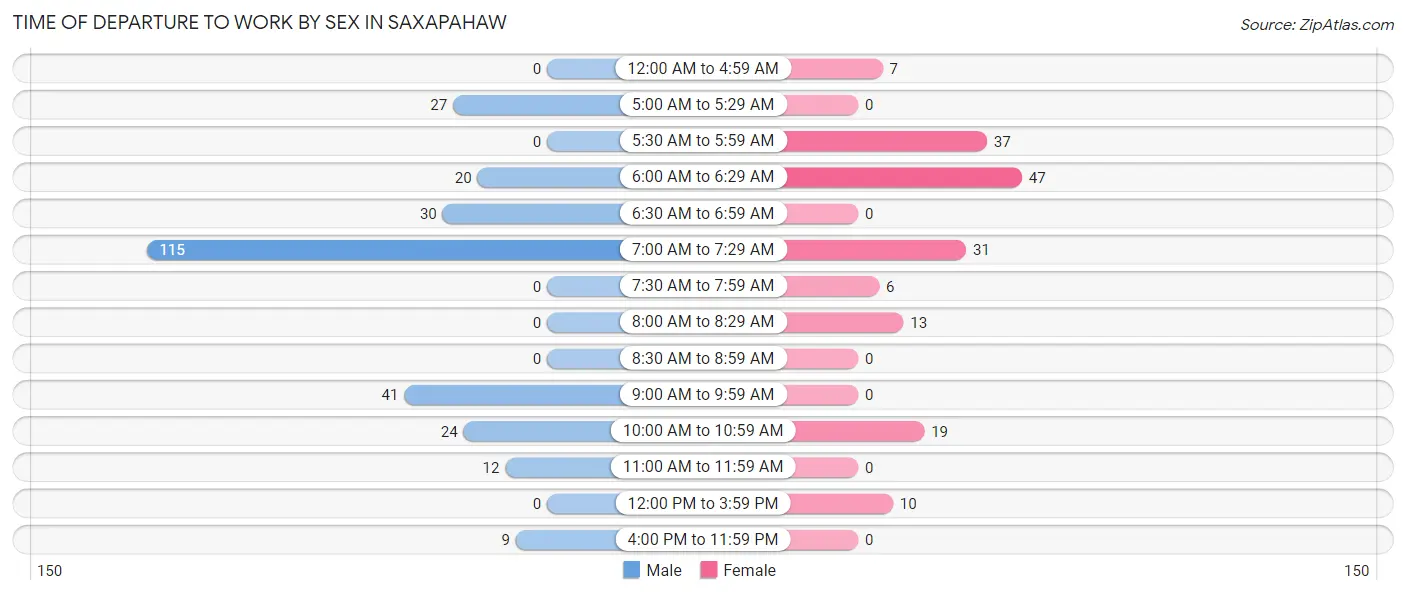
| Time of Departure | Male | Female |
| 12:00 AM to 4:59 AM | 0 (0.0%) | 7 (4.1%) |
| 5:00 AM to 5:29 AM | 27 (9.7%) | 0 (0.0%) |
| 5:30 AM to 5:59 AM | 0 (0.0%) | 37 (21.8%) |
| 6:00 AM to 6:29 AM | 20 (7.2%) | 47 (27.7%) |
| 6:30 AM to 6:59 AM | 30 (10.8%) | 0 (0.0%) |
| 7:00 AM to 7:29 AM | 115 (41.4%) | 31 (18.2%) |
| 7:30 AM to 7:59 AM | 0 (0.0%) | 6 (3.5%) |
| 8:00 AM to 8:29 AM | 0 (0.0%) | 13 (7.6%) |
| 8:30 AM to 8:59 AM | 0 (0.0%) | 0 (0.0%) |
| 9:00 AM to 9:59 AM | 41 (14.7%) | 0 (0.0%) |
| 10:00 AM to 10:59 AM | 24 (8.6%) | 19 (11.2%) |
| 11:00 AM to 11:59 AM | 12 (4.3%) | 0 (0.0%) |
| 12:00 PM to 3:59 PM | 0 (0.0%) | 10 (5.9%) |
| 4:00 PM to 11:59 PM | 9 (3.2%) | 0 (0.0%) |
| Total | 278 (100.0%) | 170 (100.0%) |
Housing Occupancy in Saxapahaw
Occupancy by Ownership in Saxapahaw
Of the total 560 dwellings in Saxapahaw, owner-occupied units account for 400 (71.4%), while renter-occupied units make up 160 (28.6%).
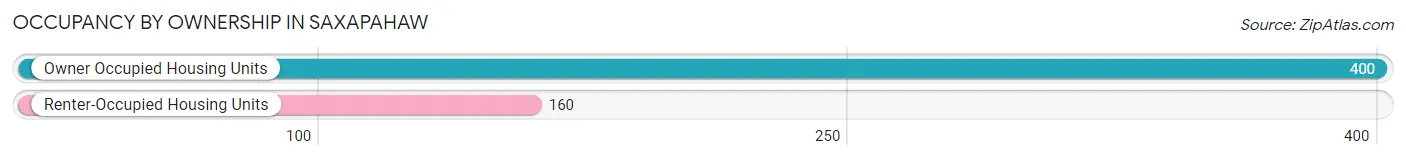
| Occupancy | # Housing Units | % Housing Units |
| Owner Occupied Housing Units | 400 | 71.4% |
| Renter-Occupied Housing Units | 160 | 28.6% |
| Total Occupied Housing Units | 560 | 100.0% |
Occupancy by Household Size in Saxapahaw
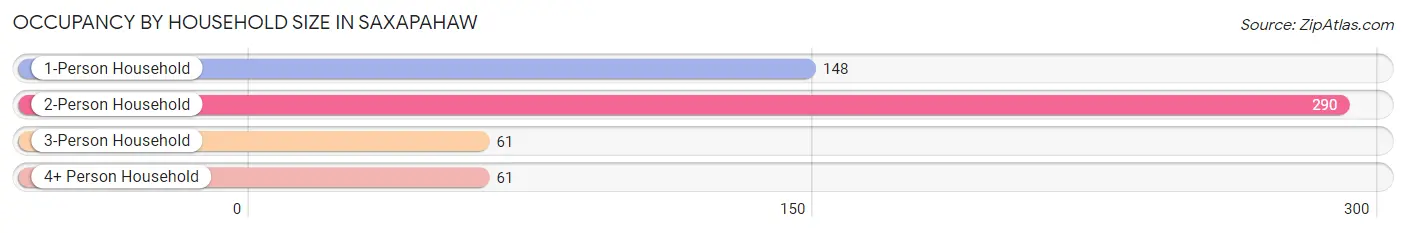
| Household Size | # Housing Units | % Housing Units |
| 1-Person Household | 148 | 26.4% |
| 2-Person Household | 290 | 51.8% |
| 3-Person Household | 61 | 10.9% |
| 4+ Person Household | 61 | 10.9% |
| Total Housing Units | 560 | 100.0% |
Occupancy by Ownership by Household Size in Saxapahaw
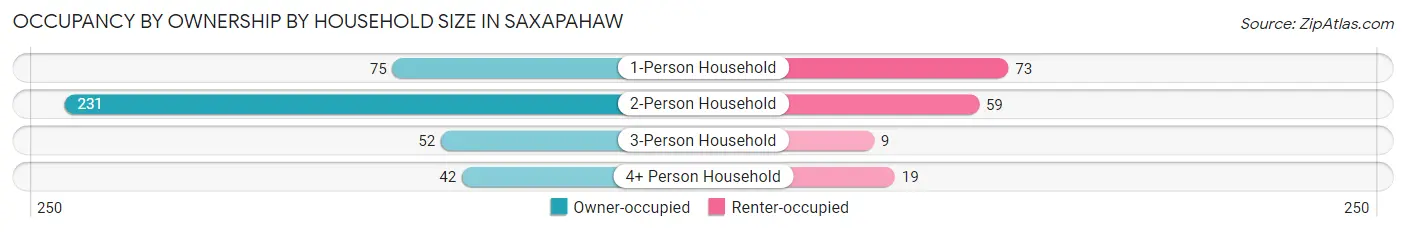
| Household Size | Owner-occupied | Renter-occupied |
| 1-Person Household | 75 (50.7%) | 73 (49.3%) |
| 2-Person Household | 231 (79.7%) | 59 (20.3%) |
| 3-Person Household | 52 (85.3%) | 9 (14.7%) |
| 4+ Person Household | 42 (68.9%) | 19 (31.1%) |
| Total Housing Units | 400 (71.4%) | 160 (28.6%) |
Occupancy by Educational Attainment in Saxapahaw
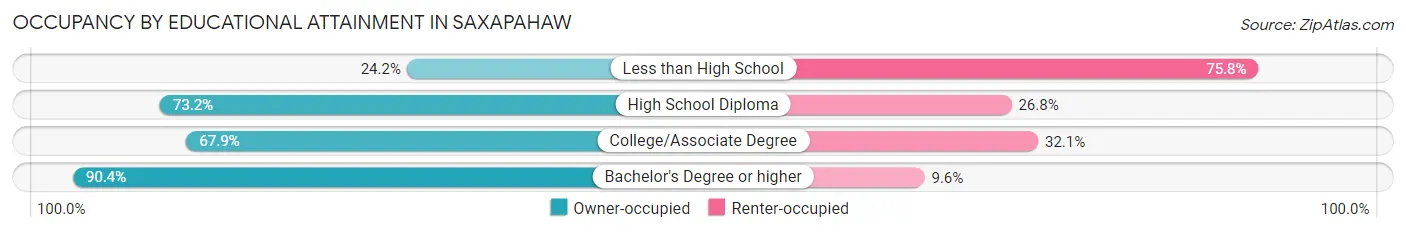
| Household Size | Owner-occupied | Renter-occupied |
| Less than High School | 8 (24.2%) | 25 (75.8%) |
| High School Diploma | 180 (73.2%) | 66 (26.8%) |
| College/Associate Degree | 127 (67.9%) | 60 (32.1%) |
| Bachelor's Degree or higher | 85 (90.4%) | 9 (9.6%) |
Occupancy by Age of Householder in Saxapahaw
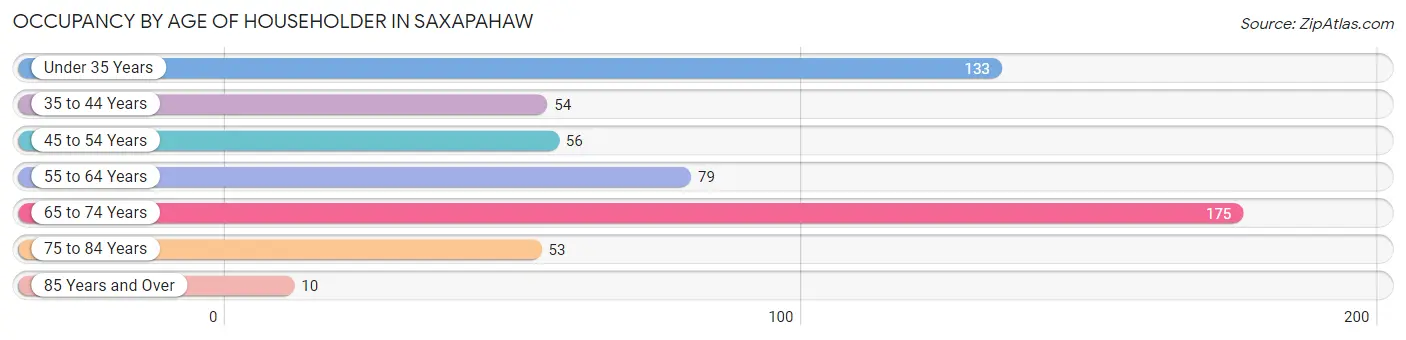
| Age Bracket | # Households | % Households |
| Under 35 Years | 133 | 23.7% |
| 35 to 44 Years | 54 | 9.6% |
| 45 to 54 Years | 56 | 10.0% |
| 55 to 64 Years | 79 | 14.1% |
| 65 to 74 Years | 175 | 31.2% |
| 75 to 84 Years | 53 | 9.5% |
| 85 Years and Over | 10 | 1.8% |
| Total | 560 | 100.0% |
Housing Finances in Saxapahaw
Median Income by Occupancy in Saxapahaw
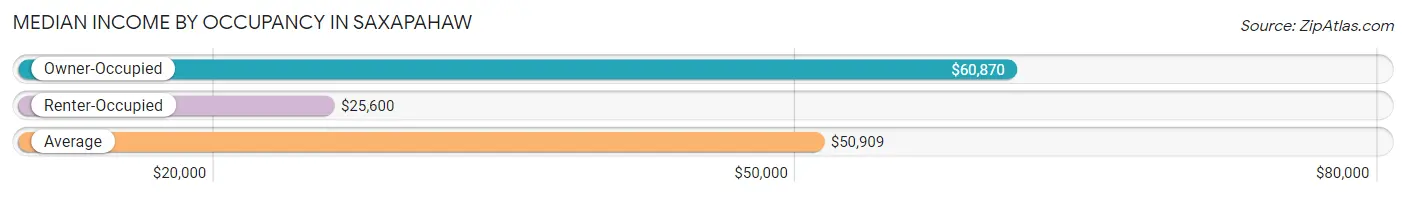
| Occupancy Type | # Households | Median Income |
| Owner-Occupied | 400 (71.4%) | $60,870 |
| Renter-Occupied | 160 (28.6%) | $25,600 |
| Average | 560 (100.0%) | $50,909 |
Occupancy by Householder Income Bracket in Saxapahaw
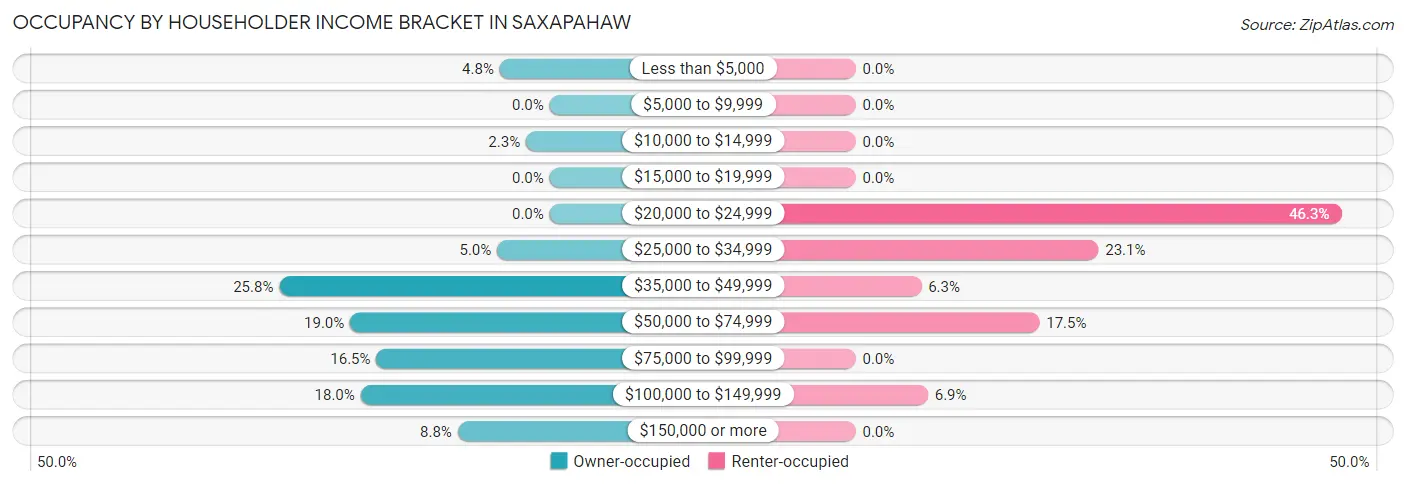
| Income Bracket | Owner-occupied | Renter-occupied |
| Less than $5,000 | 19 (4.8%) | 0 (0.0%) |
| $5,000 to $9,999 | 0 (0.0%) | 0 (0.0%) |
| $10,000 to $14,999 | 9 (2.2%) | 0 (0.0%) |
| $15,000 to $19,999 | 0 (0.0%) | 0 (0.0%) |
| $20,000 to $24,999 | 0 (0.0%) | 74 (46.3%) |
| $25,000 to $34,999 | 20 (5.0%) | 37 (23.1%) |
| $35,000 to $49,999 | 103 (25.8%) | 10 (6.2%) |
| $50,000 to $74,999 | 76 (19.0%) | 28 (17.5%) |
| $75,000 to $99,999 | 66 (16.5%) | 0 (0.0%) |
| $100,000 to $149,999 | 72 (18.0%) | 11 (6.9%) |
| $150,000 or more | 35 (8.7%) | 0 (0.0%) |
| Total | 400 (100.0%) | 160 (100.0%) |
Monthly Housing Cost Tiers in Saxapahaw
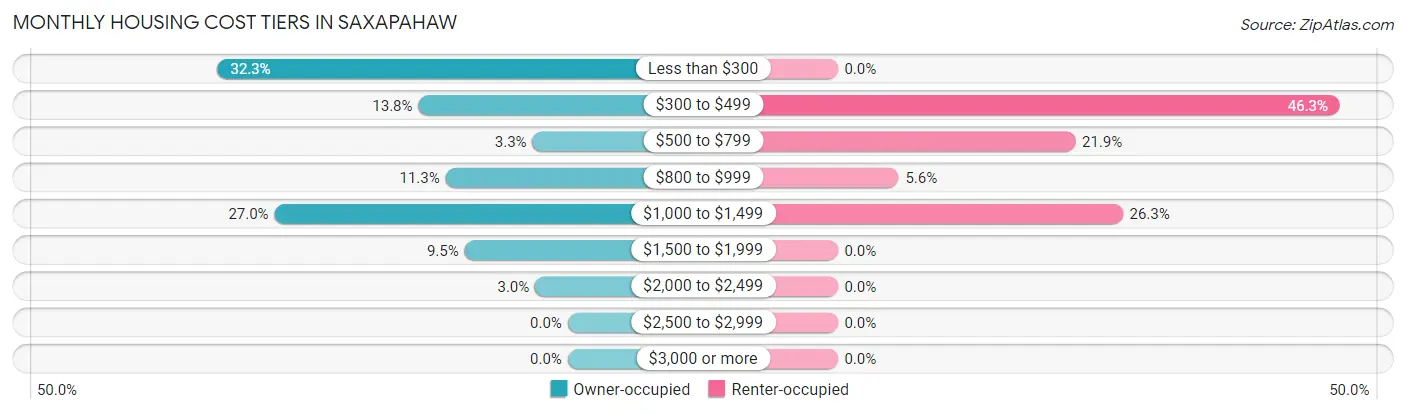
| Monthly Cost | Owner-occupied | Renter-occupied |
| Less than $300 | 129 (32.3%) | 0 (0.0%) |
| $300 to $499 | 55 (13.8%) | 74 (46.3%) |
| $500 to $799 | 13 (3.3%) | 35 (21.9%) |
| $800 to $999 | 45 (11.3%) | 9 (5.6%) |
| $1,000 to $1,499 | 108 (27.0%) | 42 (26.3%) |
| $1,500 to $1,999 | 38 (9.5%) | 0 (0.0%) |
| $2,000 to $2,499 | 12 (3.0%) | 0 (0.0%) |
| $2,500 to $2,999 | 0 (0.0%) | 0 (0.0%) |
| $3,000 or more | 0 (0.0%) | 0 (0.0%) |
| Total | 400 (100.0%) | 160 (100.0%) |
Physical Housing Characteristics in Saxapahaw
Housing Structures in Saxapahaw
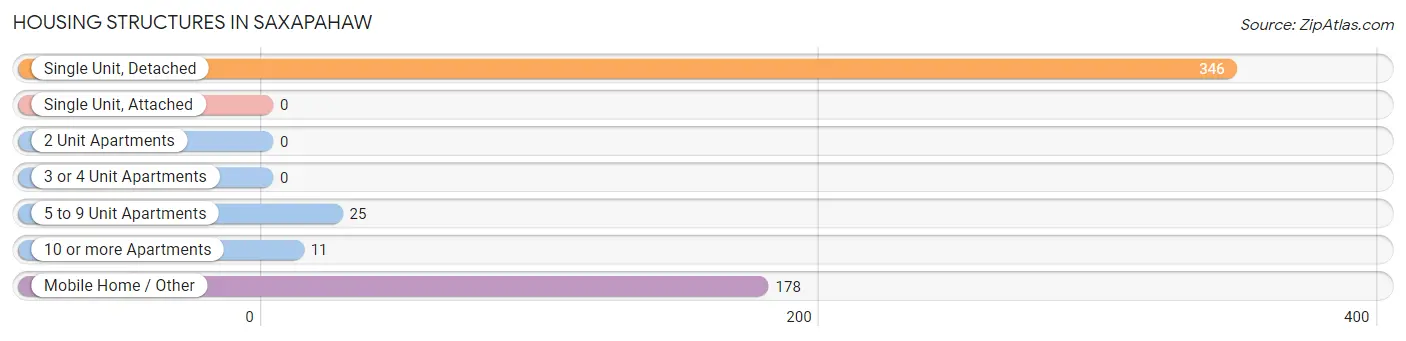
| Structure Type | # Housing Units | % Housing Units |
| Single Unit, Detached | 346 | 61.8% |
| Single Unit, Attached | 0 | 0.0% |
| 2 Unit Apartments | 0 | 0.0% |
| 3 or 4 Unit Apartments | 0 | 0.0% |
| 5 to 9 Unit Apartments | 25 | 4.5% |
| 10 or more Apartments | 11 | 2.0% |
| Mobile Home / Other | 178 | 31.8% |
| Total | 560 | 100.0% |
Housing Structures by Occupancy in Saxapahaw
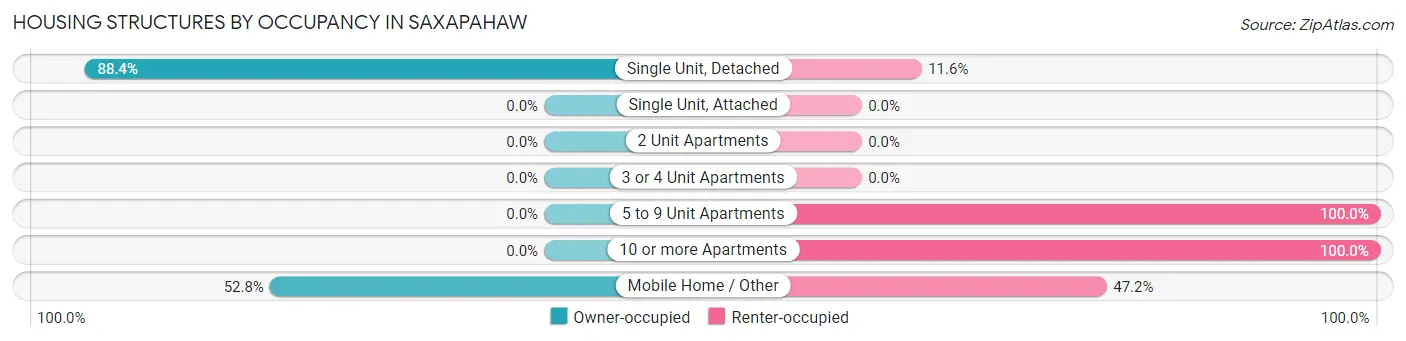
| Structure Type | Owner-occupied | Renter-occupied |
| Single Unit, Detached | 306 (88.4%) | 40 (11.6%) |
| Single Unit, Attached | 0 (0.0%) | 0 (0.0%) |
| 2 Unit Apartments | 0 (0.0%) | 0 (0.0%) |
| 3 or 4 Unit Apartments | 0 (0.0%) | 0 (0.0%) |
| 5 to 9 Unit Apartments | 0 (0.0%) | 25 (100.0%) |
| 10 or more Apartments | 0 (0.0%) | 11 (100.0%) |
| Mobile Home / Other | 94 (52.8%) | 84 (47.2%) |
| Total | 400 (71.4%) | 160 (28.6%) |
Housing Structures by Number of Rooms in Saxapahaw
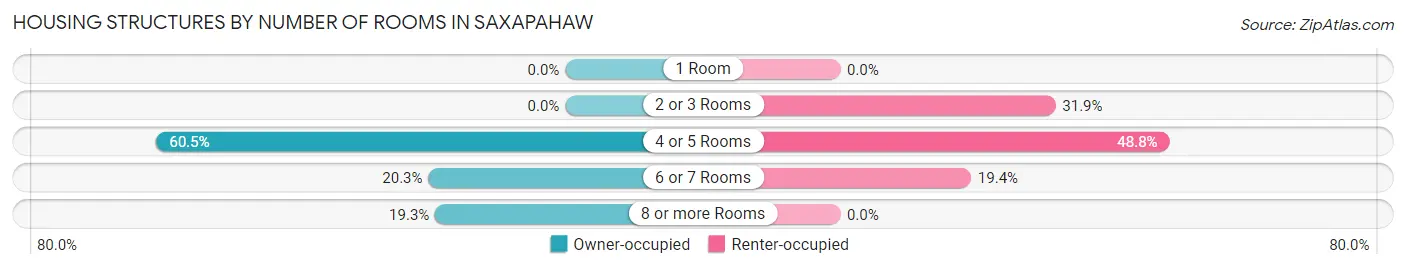
| Number of Rooms | Owner-occupied | Renter-occupied |
| 1 Room | 0 (0.0%) | 0 (0.0%) |
| 2 or 3 Rooms | 0 (0.0%) | 51 (31.9%) |
| 4 or 5 Rooms | 242 (60.5%) | 78 (48.7%) |
| 6 or 7 Rooms | 81 (20.3%) | 31 (19.4%) |
| 8 or more Rooms | 77 (19.3%) | 0 (0.0%) |
| Total | 400 (100.0%) | 160 (100.0%) |
Housing Structure by Heating Type in Saxapahaw
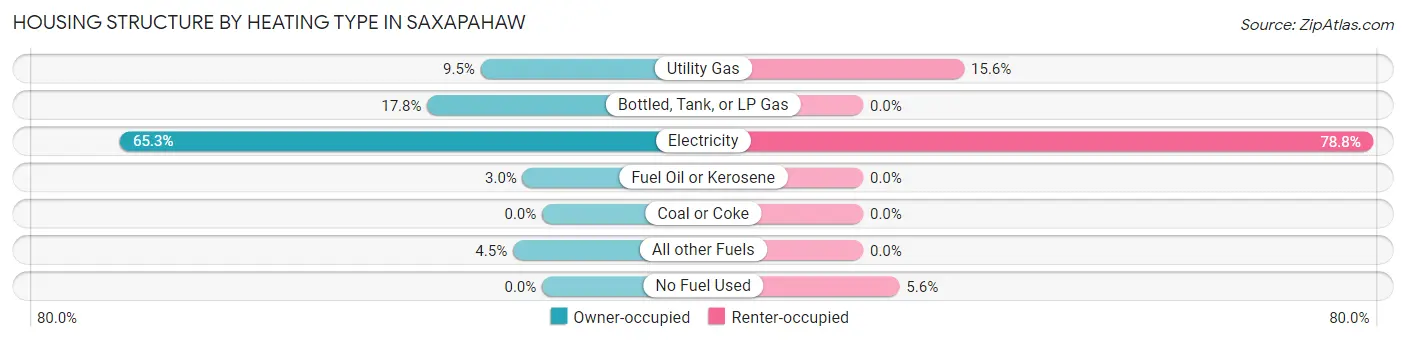
| Heating Type | Owner-occupied | Renter-occupied |
| Utility Gas | 38 (9.5%) | 25 (15.6%) |
| Bottled, Tank, or LP Gas | 71 (17.7%) | 0 (0.0%) |
| Electricity | 261 (65.2%) | 126 (78.7%) |
| Fuel Oil or Kerosene | 12 (3.0%) | 0 (0.0%) |
| Coal or Coke | 0 (0.0%) | 0 (0.0%) |
| All other Fuels | 18 (4.5%) | 0 (0.0%) |
| No Fuel Used | 0 (0.0%) | 9 (5.6%) |
| Total | 400 (100.0%) | 160 (100.0%) |
Household Vehicle Usage in Saxapahaw
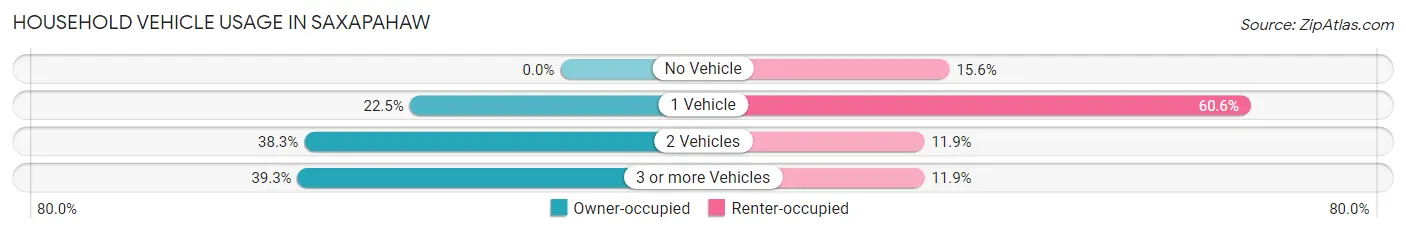
| Vehicles per Household | Owner-occupied | Renter-occupied |
| No Vehicle | 0 (0.0%) | 25 (15.6%) |
| 1 Vehicle | 90 (22.5%) | 97 (60.6%) |
| 2 Vehicles | 153 (38.3%) | 19 (11.9%) |
| 3 or more Vehicles | 157 (39.3%) | 19 (11.9%) |
| Total | 400 (100.0%) | 160 (100.0%) |
Real Estate & Mortgages in Saxapahaw
Real Estate and Mortgage Overview in Saxapahaw
| Characteristic | Without Mortgage | With Mortgage |
| Housing Units | 203 | 197 |
| Median Property Value | - | - |
| Median Household Income | $39,871 | $18 |
| Monthly Housing Costs | $192 | $0 |
| Real Estate Taxes | - | - |
Property Value by Mortgage Status in Saxapahaw
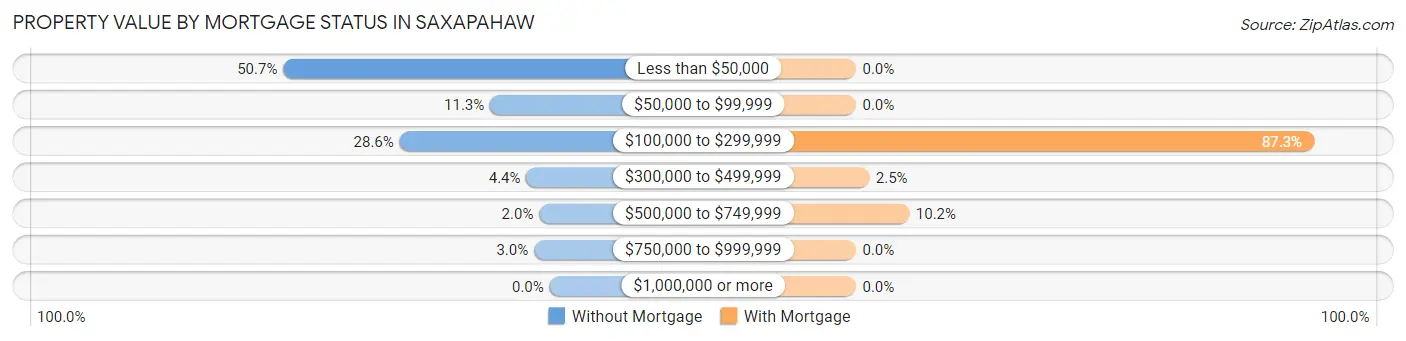
| Property Value | Without Mortgage | With Mortgage |
| Less than $50,000 | 103 (50.7%) | 0 (0.0%) |
| $50,000 to $99,999 | 23 (11.3%) | 0 (0.0%) |
| $100,000 to $299,999 | 58 (28.6%) | 172 (87.3%) |
| $300,000 to $499,999 | 9 (4.4%) | 5 (2.5%) |
| $500,000 to $749,999 | 4 (2.0%) | 20 (10.2%) |
| $750,000 to $999,999 | 6 (3.0%) | 0 (0.0%) |
| $1,000,000 or more | 0 (0.0%) | 0 (0.0%) |
| Total | 203 (100.0%) | 197 (100.0%) |
Household Income by Mortgage Status in Saxapahaw
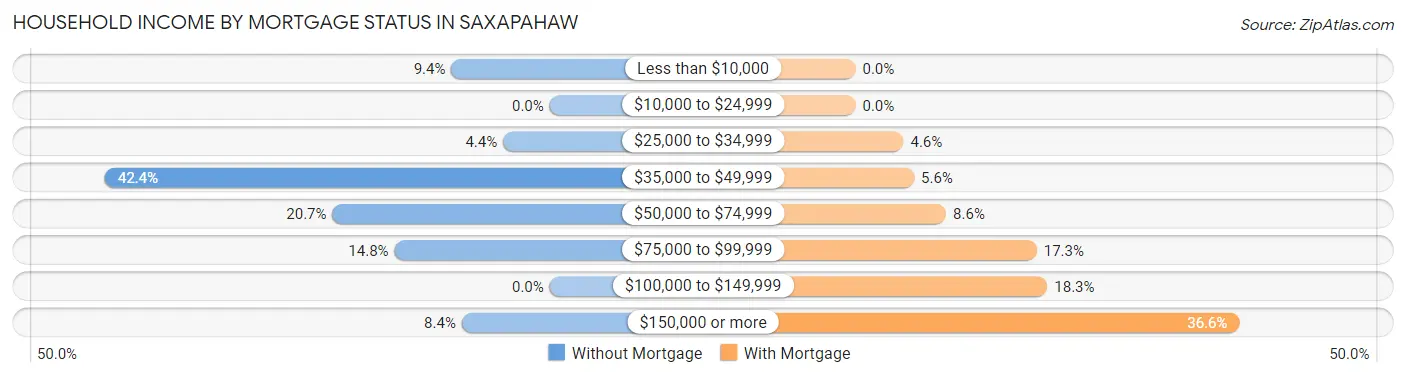
| Household Income | Without Mortgage | With Mortgage |
| Less than $10,000 | 19 (9.4%) | 0 (0.0%) |
| $10,000 to $24,999 | 0 (0.0%) | 0 (0.0%) |
| $25,000 to $34,999 | 9 (4.4%) | 9 (4.6%) |
| $35,000 to $49,999 | 86 (42.4%) | 11 (5.6%) |
| $50,000 to $74,999 | 42 (20.7%) | 17 (8.6%) |
| $75,000 to $99,999 | 30 (14.8%) | 34 (17.3%) |
| $100,000 to $149,999 | 0 (0.0%) | 36 (18.3%) |
| $150,000 or more | 17 (8.4%) | 72 (36.5%) |
| Total | 203 (100.0%) | 197 (100.0%) |
Property Value to Household Income Ratio in Saxapahaw
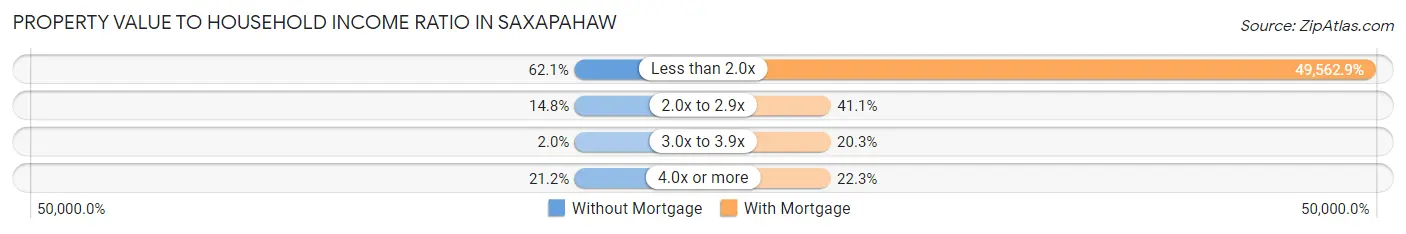
| Value-to-Income Ratio | Without Mortgage | With Mortgage |
| Less than 2.0x | 126 (62.1%) | 97,639 (49,562.9%) |
| 2.0x to 2.9x | 30 (14.8%) | 81 (41.1%) |
| 3.0x to 3.9x | 4 (2.0%) | 40 (20.3%) |
| 4.0x or more | 43 (21.2%) | 44 (22.3%) |
| Total | 203 (100.0%) | 197 (100.0%) |
Real Estate Taxes by Mortgage Status in Saxapahaw
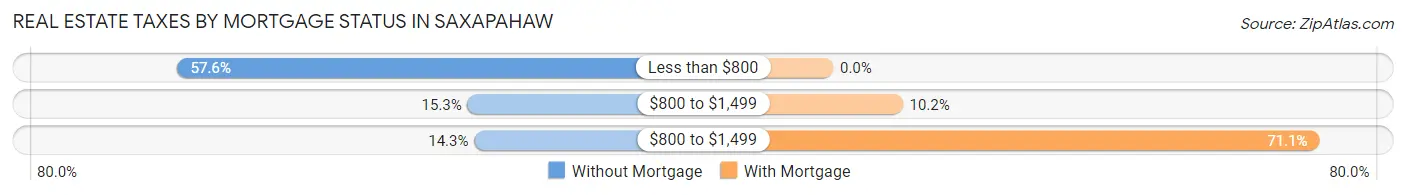
| Property Taxes | Without Mortgage | With Mortgage |
| Less than $800 | 117 (57.6%) | 0 (0.0%) |
| $800 to $1,499 | 31 (15.3%) | 20 (10.2%) |
| $800 to $1,499 | 29 (14.3%) | 140 (71.1%) |
| Total | 203 (100.0%) | 197 (100.0%) |
Health & Disability in Saxapahaw
Health Insurance Coverage by Age in Saxapahaw
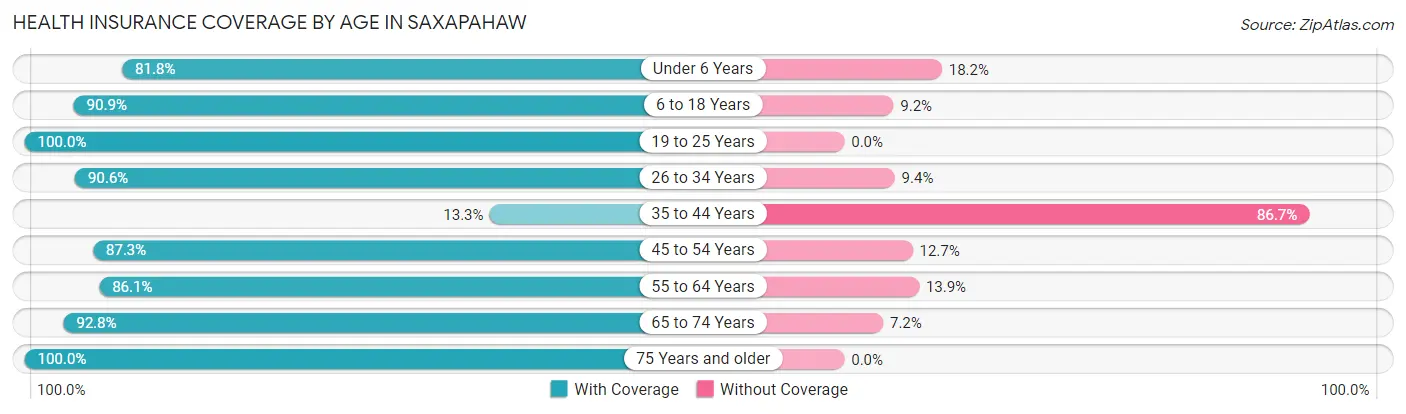
| Age Bracket | With Coverage | Without Coverage |
| Under 6 Years | 54 (81.8%) | 12 (18.2%) |
| 6 to 18 Years | 129 (90.8%) | 13 (9.1%) |
| 19 to 25 Years | 60 (100.0%) | 0 (0.0%) |
| 26 to 34 Years | 222 (90.6%) | 23 (9.4%) |
| 35 to 44 Years | 10 (13.3%) | 65 (86.7%) |
| 45 to 54 Years | 96 (87.3%) | 14 (12.7%) |
| 55 to 64 Years | 136 (86.1%) | 22 (13.9%) |
| 65 to 74 Years | 244 (92.8%) | 19 (7.2%) |
| 75 Years and older | 81 (100.0%) | 0 (0.0%) |
| Total | 1,032 (86.0%) | 168 (14.0%) |
Health Insurance Coverage by Citizenship Status in Saxapahaw
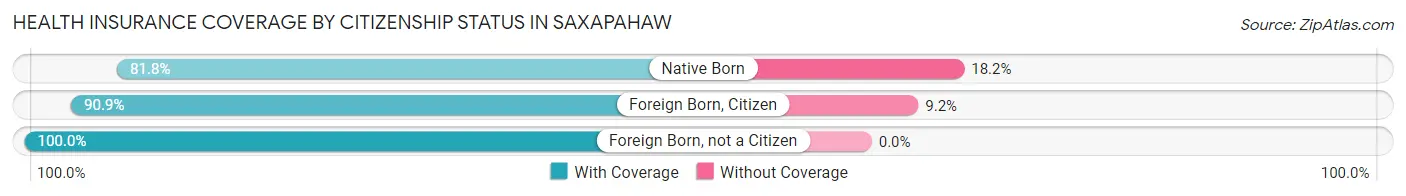
| Citizenship Status | With Coverage | Without Coverage |
| Native Born | 54 (81.8%) | 12 (18.2%) |
| Foreign Born, Citizen | 129 (90.8%) | 13 (9.1%) |
| Foreign Born, not a Citizen | 60 (100.0%) | 0 (0.0%) |
Health Insurance Coverage by Household Income in Saxapahaw
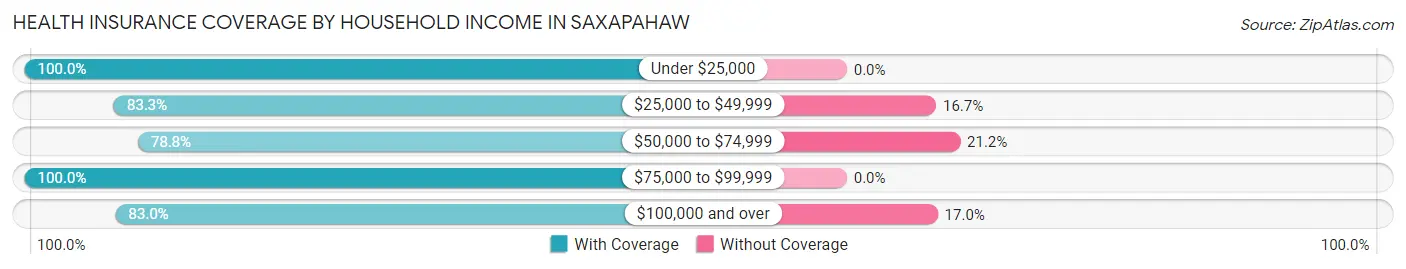
| Household Income | With Coverage | Without Coverage |
| Under $25,000 | 151 (100.0%) | 0 (0.0%) |
| $25,000 to $49,999 | 219 (83.3%) | 44 (16.7%) |
| $50,000 to $74,999 | 282 (78.8%) | 76 (21.2%) |
| $75,000 to $99,999 | 146 (100.0%) | 0 (0.0%) |
| $100,000 and over | 234 (83.0%) | 48 (17.0%) |
Public vs Private Health Insurance Coverage by Age in Saxapahaw
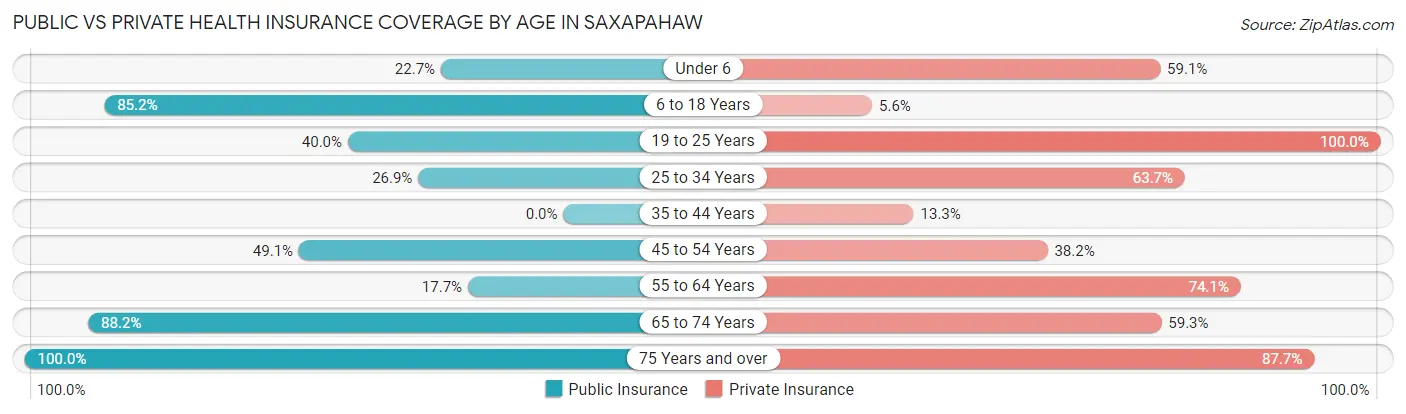
| Age Bracket | Public Insurance | Private Insurance |
| Under 6 | 15 (22.7%) | 39 (59.1%) |
| 6 to 18 Years | 121 (85.2%) | 8 (5.6%) |
| 19 to 25 Years | 24 (40.0%) | 60 (100.0%) |
| 25 to 34 Years | 66 (26.9%) | 156 (63.7%) |
| 35 to 44 Years | 0 (0.0%) | 10 (13.3%) |
| 45 to 54 Years | 54 (49.1%) | 42 (38.2%) |
| 55 to 64 Years | 28 (17.7%) | 117 (74.1%) |
| 65 to 74 Years | 232 (88.2%) | 156 (59.3%) |
| 75 Years and over | 81 (100.0%) | 71 (87.6%) |
| Total | 621 (51.7%) | 659 (54.9%) |
Disability Status by Sex by Age in Saxapahaw
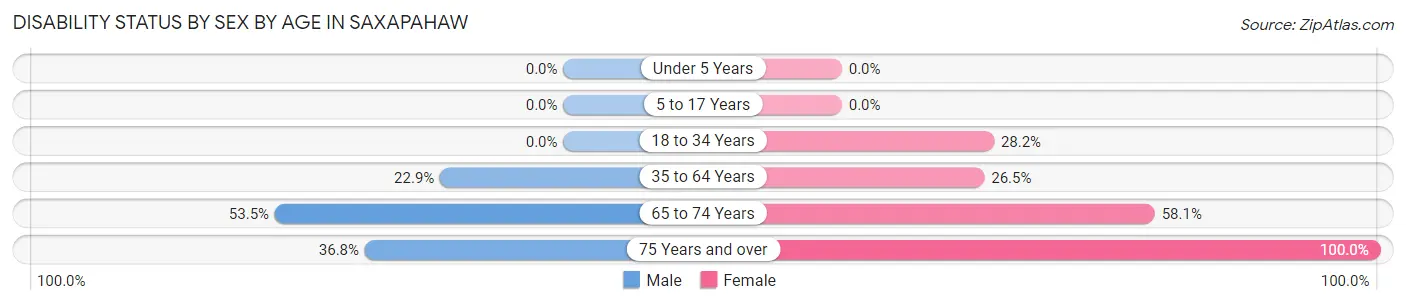
| Age Bracket | Male | Female |
| Under 5 Years | 0 (0.0%) | 0 (0.0%) |
| 5 to 17 Years | 0 (0.0%) | 0 (0.0%) |
| 18 to 34 Years | 0 (0.0%) | 48 (28.2%) |
| 35 to 64 Years | 43 (22.9%) | 41 (26.5%) |
| 65 to 74 Years | 68 (53.5%) | 79 (58.1%) |
| 75 Years and over | 14 (36.8%) | 43 (100.0%) |
Disability Class by Sex by Age in Saxapahaw
Disability Class: Hearing Difficulty
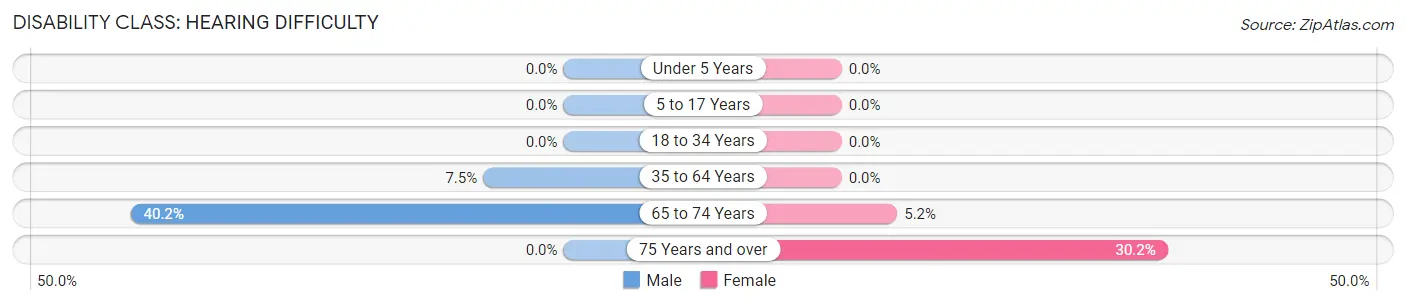
| Age Bracket | Male | Female |
| Under 5 Years | 0 (0.0%) | 0 (0.0%) |
| 5 to 17 Years | 0 (0.0%) | 0 (0.0%) |
| 18 to 34 Years | 0 (0.0%) | 0 (0.0%) |
| 35 to 64 Years | 14 (7.4%) | 0 (0.0%) |
| 65 to 74 Years | 51 (40.2%) | 7 (5.1%) |
| 75 Years and over | 0 (0.0%) | 13 (30.2%) |
Disability Class: Vision Difficulty
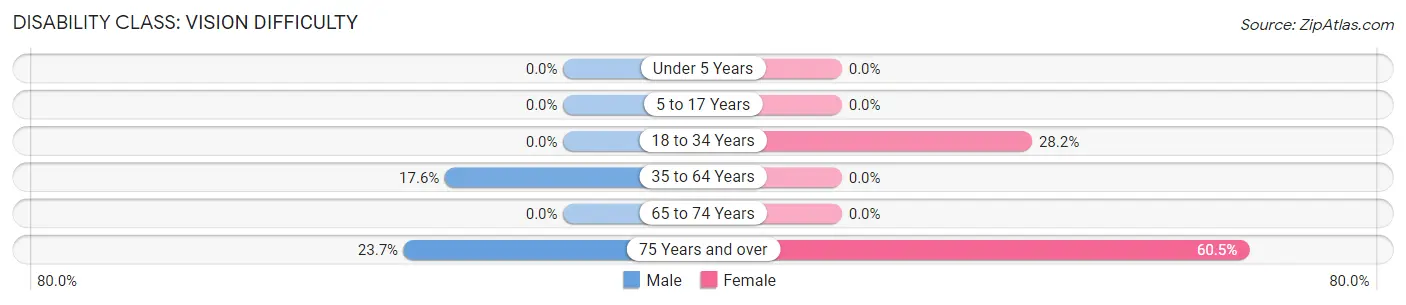
| Age Bracket | Male | Female |
| Under 5 Years | 0 (0.0%) | 0 (0.0%) |
| 5 to 17 Years | 0 (0.0%) | 0 (0.0%) |
| 18 to 34 Years | 0 (0.0%) | 48 (28.2%) |
| 35 to 64 Years | 33 (17.5%) | 0 (0.0%) |
| 65 to 74 Years | 0 (0.0%) | 0 (0.0%) |
| 75 Years and over | 9 (23.7%) | 26 (60.5%) |
Disability Class: Cognitive Difficulty
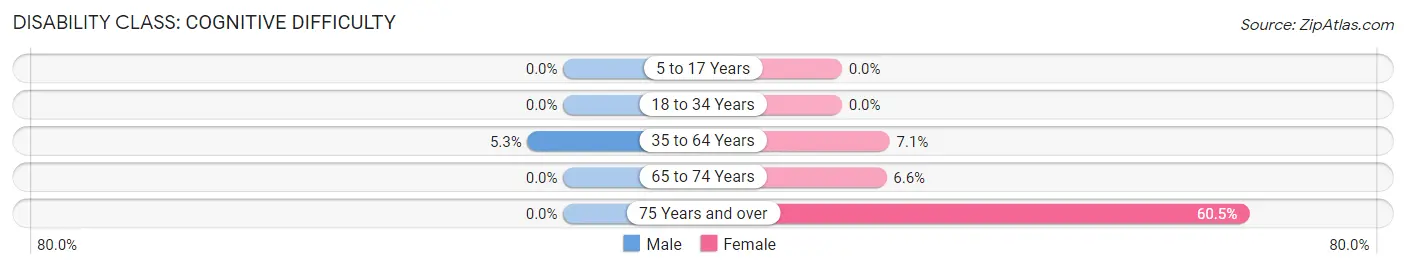
| Age Bracket | Male | Female |
| 5 to 17 Years | 0 (0.0%) | 0 (0.0%) |
| 18 to 34 Years | 0 (0.0%) | 0 (0.0%) |
| 35 to 64 Years | 10 (5.3%) | 11 (7.1%) |
| 65 to 74 Years | 0 (0.0%) | 9 (6.6%) |
| 75 Years and over | 0 (0.0%) | 26 (60.5%) |
Disability Class: Ambulatory Difficulty
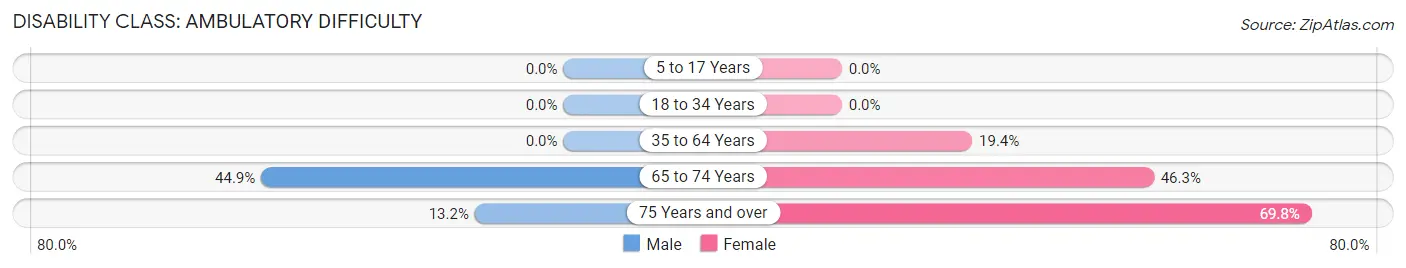
| Age Bracket | Male | Female |
| 5 to 17 Years | 0 (0.0%) | 0 (0.0%) |
| 18 to 34 Years | 0 (0.0%) | 0 (0.0%) |
| 35 to 64 Years | 0 (0.0%) | 30 (19.4%) |
| 65 to 74 Years | 57 (44.9%) | 63 (46.3%) |
| 75 Years and over | 5 (13.2%) | 30 (69.8%) |
Disability Class: Self-Care Difficulty
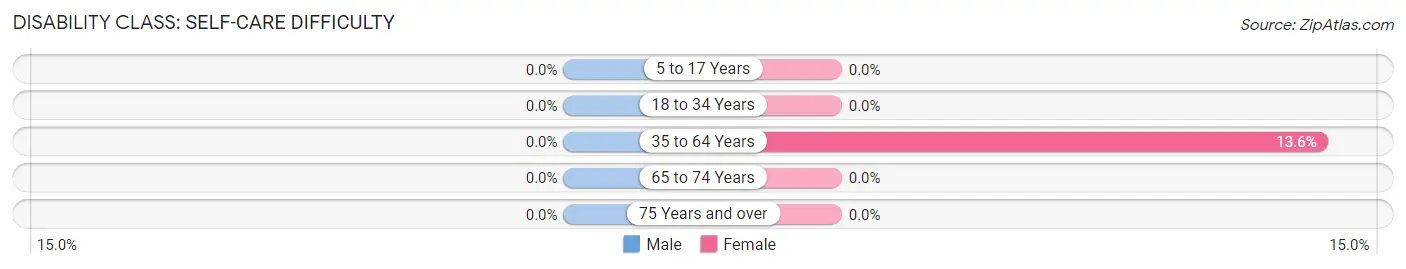
| Age Bracket | Male | Female |
| 5 to 17 Years | 0 (0.0%) | 0 (0.0%) |
| 18 to 34 Years | 0 (0.0%) | 0 (0.0%) |
| 35 to 64 Years | 0 (0.0%) | 21 (13.6%) |
| 65 to 74 Years | 0 (0.0%) | 0 (0.0%) |
| 75 Years and over | 0 (0.0%) | 0 (0.0%) |
Technology Access in Saxapahaw
Computing Device Access in Saxapahaw
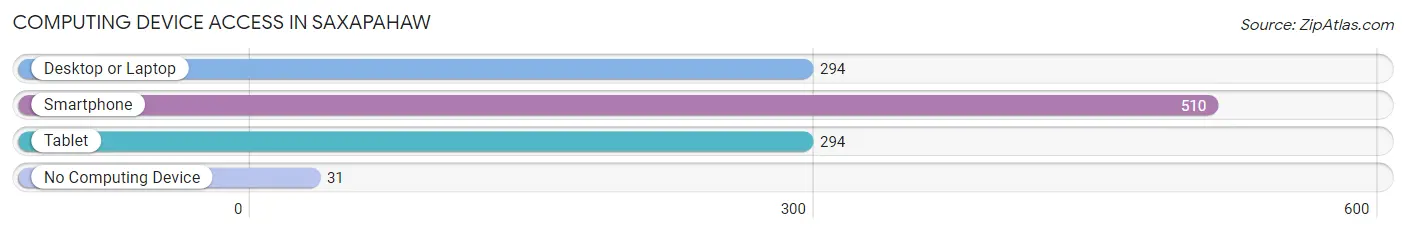
| Device Type | # Households | % Households |
| Desktop or Laptop | 294 | 52.5% |
| Smartphone | 510 | 91.1% |
| Tablet | 294 | 52.5% |
| No Computing Device | 31 | 5.5% |
| Total | 560 | 100.0% |
Internet Access in Saxapahaw
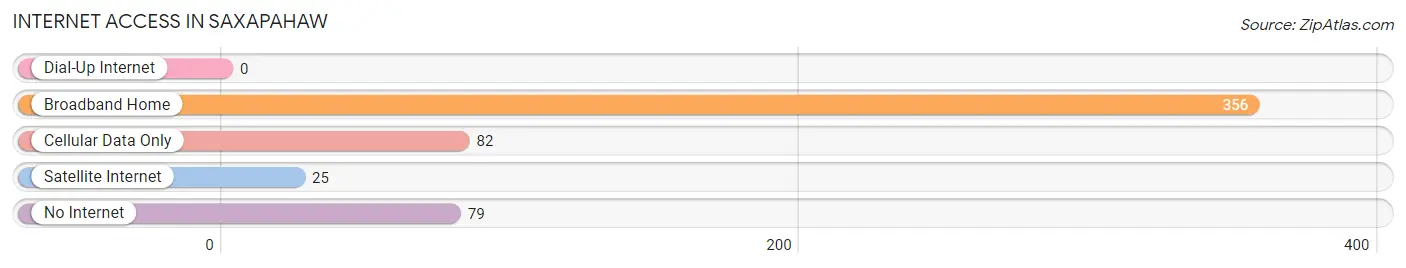
| Internet Type | # Households | % Households |
| Dial-Up Internet | 0 | 0.0% |
| Broadband Home | 356 | 63.6% |
| Cellular Data Only | 82 | 14.6% |
| Satellite Internet | 25 | 4.5% |
| No Internet | 79 | 14.1% |
| Total | 560 | 100.0% |
Saxapahaw Summary
Saxapahaw, NC is a small unincorporated community located in Alamance County, North Carolina. It is situated along the Haw River, approximately 10 miles east of Burlington and 25 miles west of Chapel Hill. The population of Saxapahaw was estimated to be 1,845 in 2019.
History
Saxapahaw was first settled in the late 1700s by German and Scots-Irish immigrants. The town was originally known as Saxapahaw Mills, named after the Saxapahaw River, which was a tributary of the Haw River. The town was incorporated in 1887 and was home to several mills, including a cotton mill, a grist mill, and a sawmill. The cotton mill was the largest employer in the area and was owned by the Holt family. The mill was in operation until the early 2000s, when it was closed due to economic decline.
Geography
Saxapahaw is located in the Piedmont region of North Carolina, approximately 10 miles east of Burlington and 25 miles west of Chapel Hill. The town is situated along the Haw River, which is a tributary of the Cape Fear River. The terrain is mostly flat, with some rolling hills in the surrounding area. The climate is humid subtropical, with hot, humid summers and mild winters.
Economy
Saxapahaw’s economy is largely based on agriculture and tourism. The town is home to several farms, including a dairy farm, a vegetable farm, and a Christmas tree farm. The town is also home to several small businesses, including a general store, a cafe, and a brewery. Tourism is also an important part of the local economy, with visitors coming to the area to enjoy the scenic views of the Haw River and the nearby Haw River State Park.
Demographics
As of 2019, the population of Saxapahaw was estimated to be 1,845. The racial makeup of the town was 87.3% White, 8.2% African American, 1.2% Hispanic or Latino, 0.7% Asian, and 2.6% other. The median household income was $45,938, and the median home value was $179,400. The town has a high rate of homeownership, with 73.3% of residents owning their own homes.
Saxapahaw is a small, rural community with a rich history and a vibrant economy. The town is home to several farms and businesses, and is a popular destination for tourists looking to enjoy the scenic views of the Haw River and the nearby Haw River State Park. The town has a diverse population and a high rate of homeownership, making it an attractive place to live and work.
Common Questions
What is Per Capita Income in Saxapahaw?
Per Capita income in Saxapahaw is $29,496.
What is the Median Family Income in Saxapahaw?
Median Family Income in Saxapahaw is $61,196.
What is the Median Household income in Saxapahaw?
Median Household Income in Saxapahaw is $50,909.
What is Income or Wage Gap in Saxapahaw?
Income or Wage Gap in Saxapahaw is 23.4%.
Women in Saxapahaw earn 76.6 cents for every dollar earned by a man.
What is Inequality or Gini Index in Saxapahaw?
Inequality or Gini Index in Saxapahaw is 0.38.
What is the Total Population of Saxapahaw?
Total Population of Saxapahaw is 1,200.
What is the Total Male Population of Saxapahaw?
Total Male Population of Saxapahaw is 591.
What is the Total Female Population of Saxapahaw?
Total Female Population of Saxapahaw is 609.
What is the Ratio of Males per 100 Females in Saxapahaw?
There are 97.04 Males per 100 Females in Saxapahaw.
What is the Ratio of Females per 100 Males in Saxapahaw?
There are 103.05 Females per 100 Males in Saxapahaw.
What is the Median Population Age in Saxapahaw?
Median Population Age in Saxapahaw is 46.9 Years.
What is the Average Family Size in Saxapahaw
Average Family Size in Saxapahaw is 2.6 People.
What is the Average Household Size in Saxapahaw
Average Household Size in Saxapahaw is 2.1 People.
How Large is the Labor Force in Saxapahaw?
There are 580 People in the Labor Forcein in Saxapahaw.
What is the Percentage of People in the Labor Force in Saxapahaw?
58.0% of People are in the Labor Force in Saxapahaw.
What is the Unemployment Rate in Saxapahaw?
Unemployment Rate in Saxapahaw is 8.3%.