Proctorville, NC Map & Demographics
Proctorville Map
Proctorville Overview
$27,199
PER CAPITA INCOME
$68,125
AVG FAMILY INCOME
$60,625
AVG HOUSEHOLD INCOME
21.2%
WAGE / INCOME GAP [ % ]
78.8¢/ $1
WAGE / INCOME GAP [ $ ]
0.42
INEQUALITY / GINI INDEX
140
TOTAL POPULATION
58
MALE POPULATION
82
FEMALE POPULATION
70.73
MALES / 100 FEMALES
141.38
FEMALES / 100 MALES
46.5
MEDIAN AGE
3.5
AVG FAMILY SIZE
2.8
AVG HOUSEHOLD SIZE
52
LABOR FORCE [ PEOPLE ]
42.3%
PERCENT IN LABOR FORCE
Proctorville Zip Codes
Proctorville Area Codes
Income in Proctorville
Income Overview in Proctorville
Per Capita Income in Proctorville is $27,199, while median incomes of families and households are $68,125 and $60,625 respectively.
| Characteristic | Number | Measure |
| Per Capita Income | 140 | $27,199 |
| Median Family Income | 34 | $68,125 |
| Mean Family Income | 34 | $67,888 |
| Median Household Income | 51 | $60,625 |
| Mean Household Income | 51 | $70,176 |
| Income Deficit | 34 | $0 |
| Wage / Income Gap (%) | 140 | 21.21% |
| Wage / Income Gap ($) | 140 | 78.79¢ per $1 |
| Gini / Inequality Index | 140 | 0.42 |
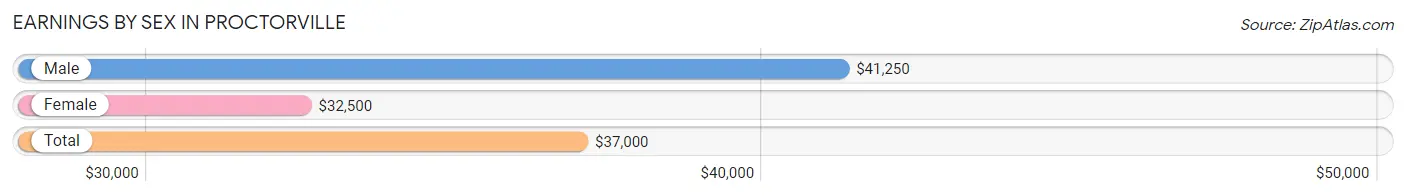
Earnings by Sex in Proctorville
Average Earnings in Proctorville are $37,000, $41,250 for men and $32,500 for women, a difference of 21.2%.
| Sex | Number | Average Earnings |
| Male | 26 (50.0%) | $41,250 |
| Female | 26 (50.0%) | $32,500 |
| Total | 52 (100.0%) | $37,000 |
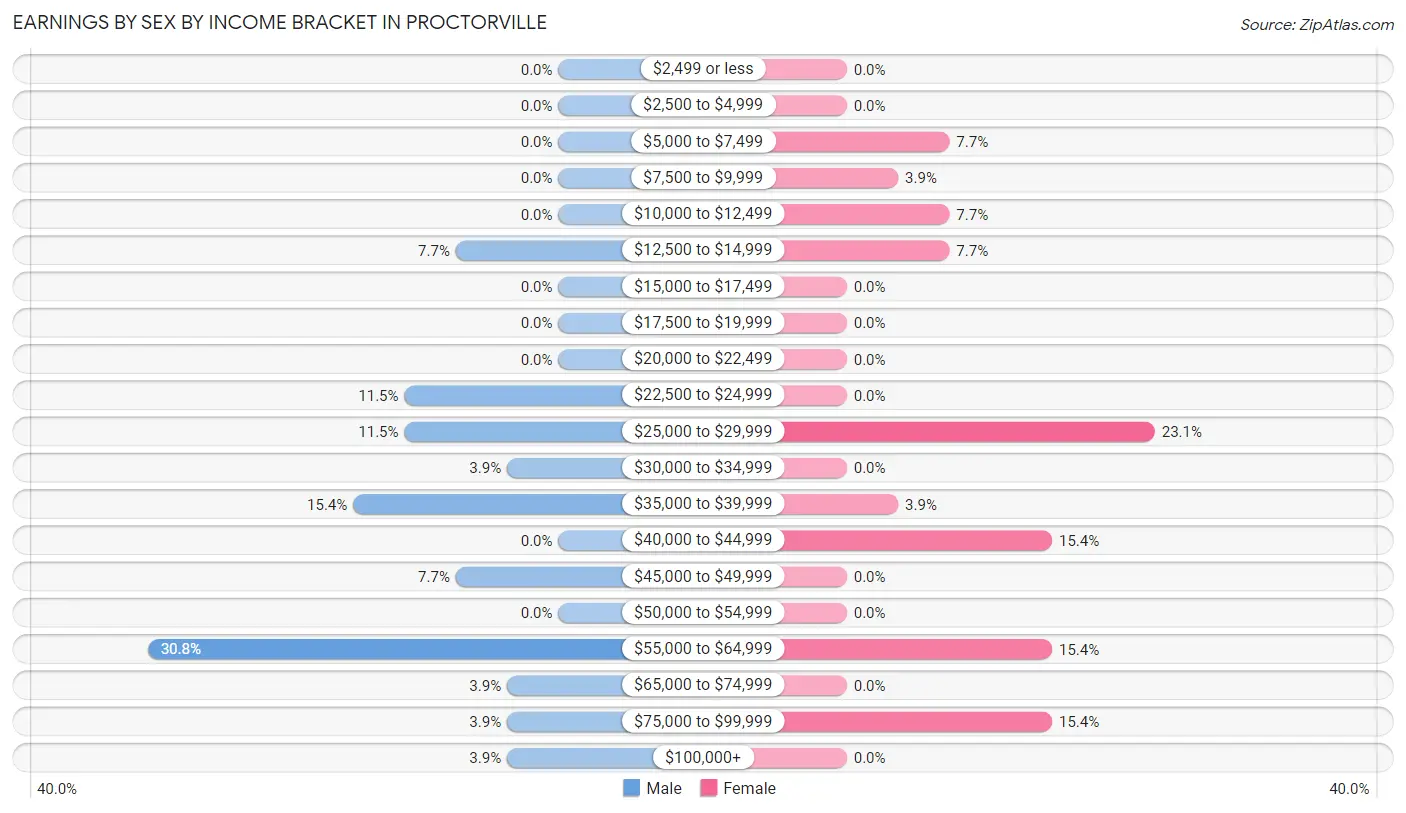
Earnings by Sex by Income Bracket in Proctorville
The most common earnings brackets in Proctorville are $55,000 to $64,999 for men (8 | 30.8%) and $25,000 to $29,999 for women (6 | 23.1%).
| Income | Male | Female |
| $2,499 or less | 0 (0.0%) | 0 (0.0%) |
| $2,500 to $4,999 | 0 (0.0%) | 0 (0.0%) |
| $5,000 to $7,499 | 0 (0.0%) | 2 (7.7%) |
| $7,500 to $9,999 | 0 (0.0%) | 1 (3.8%) |
| $10,000 to $12,499 | 0 (0.0%) | 2 (7.7%) |
| $12,500 to $14,999 | 2 (7.7%) | 2 (7.7%) |
| $15,000 to $17,499 | 0 (0.0%) | 0 (0.0%) |
| $17,500 to $19,999 | 0 (0.0%) | 0 (0.0%) |
| $20,000 to $22,499 | 0 (0.0%) | 0 (0.0%) |
| $22,500 to $24,999 | 3 (11.5%) | 0 (0.0%) |
| $25,000 to $29,999 | 3 (11.5%) | 6 (23.1%) |
| $30,000 to $34,999 | 1 (3.8%) | 0 (0.0%) |
| $35,000 to $39,999 | 4 (15.4%) | 1 (3.8%) |
| $40,000 to $44,999 | 0 (0.0%) | 4 (15.4%) |
| $45,000 to $49,999 | 2 (7.7%) | 0 (0.0%) |
| $50,000 to $54,999 | 0 (0.0%) | 0 (0.0%) |
| $55,000 to $64,999 | 8 (30.8%) | 4 (15.4%) |
| $65,000 to $74,999 | 1 (3.8%) | 0 (0.0%) |
| $75,000 to $99,999 | 1 (3.8%) | 4 (15.4%) |
| $100,000+ | 1 (3.8%) | 0 (0.0%) |
| Total | 26 (100.0%) | 26 (100.0%) |
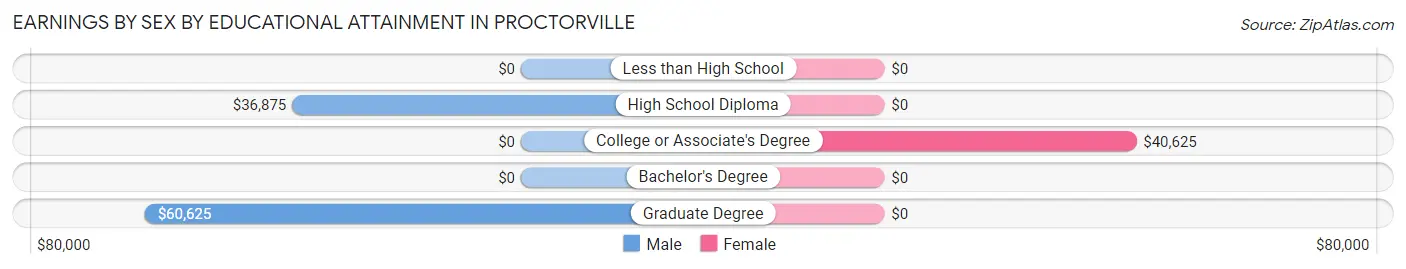
Earnings by Sex by Educational Attainment in Proctorville
Average earnings in Proctorville are $46,875 for men and $40,938 for women, a difference of 12.7%. Men with an educational attainment of graduate degree enjoy the highest average annual earnings of $60,625, while those with high school diploma education earn the least with $36,875. Women with an educational attainment of college or associate's degree earn the most with the average annual earnings of $40,625, while those with college or associate's degree education have the smallest earnings of $40,625.
| Educational Attainment | Male Income | Female Income |
| Less than High School | - | - |
| High School Diploma | $36,875 | $0 |
| College or Associate's Degree | - | - |
| Bachelor's Degree | - | - |
| Graduate Degree | $60,625 | $0 |
| Total | $46,875 | $40,938 |
Family Income in Proctorville
Family Income Brackets in Proctorville
According to the Proctorville family income data, there are 10 families falling into the $50,000 to $74,999 income range, which is the most common income bracket and makes up 29.4% of all families.
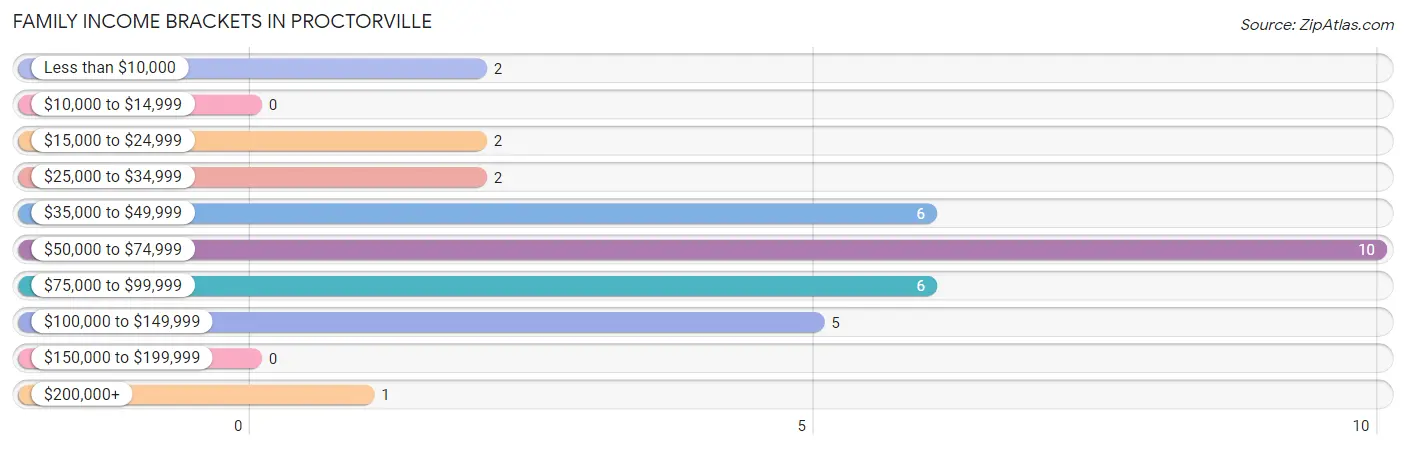
| Income Bracket | # Families | % Families |
| Less than $10,000 | 2 | 5.9% |
| $10,000 to $14,999 | 0 | 0.0% |
| $15,000 to $24,999 | 2 | 5.9% |
| $25,000 to $34,999 | 2 | 5.9% |
| $35,000 to $49,999 | 6 | 17.6% |
| $50,000 to $74,999 | 10 | 29.4% |
| $75,000 to $99,999 | 6 | 17.6% |
| $100,000 to $149,999 | 5 | 14.7% |
| $150,000 to $199,999 | 0 | 0.0% |
| $200,000+ | 1 | 2.9% |
Family Income by Famaliy Size in Proctorville
3-person families (5 | 14.7%) account for the highest median family income in Proctorville with $101,250 per family, while 3-person families (5 | 14.7%) have the highest median income of $33,750 per family member.
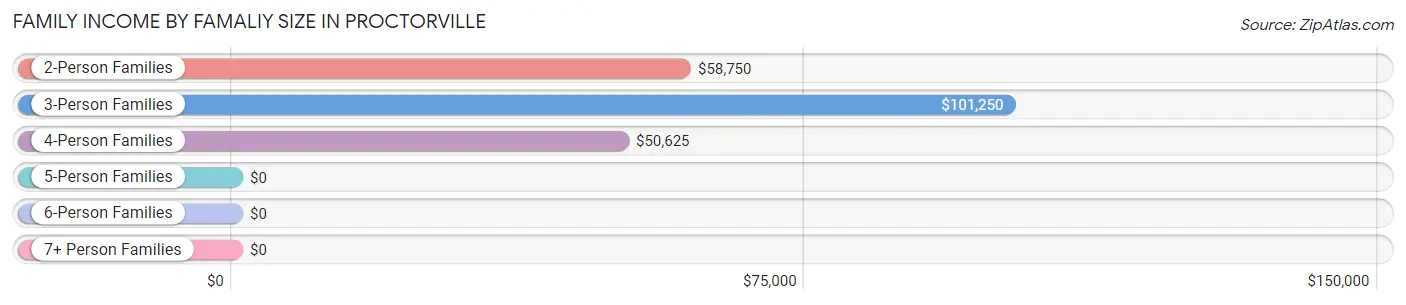
| Income Bracket | # Families | Median Income |
| 2-Person Families | 18 (52.9%) | $58,750 |
| 3-Person Families | 5 (14.7%) | $101,250 |
| 4-Person Families | 7 (20.6%) | $50,625 |
| 5-Person Families | 2 (5.9%) | $0 |
| 6-Person Families | 2 (5.9%) | $0 |
| 7+ Person Families | 0 (0.0%) | $0 |
| Total | 34 (100.0%) | $68,125 |
Family Income by Number of Earners in Proctorville
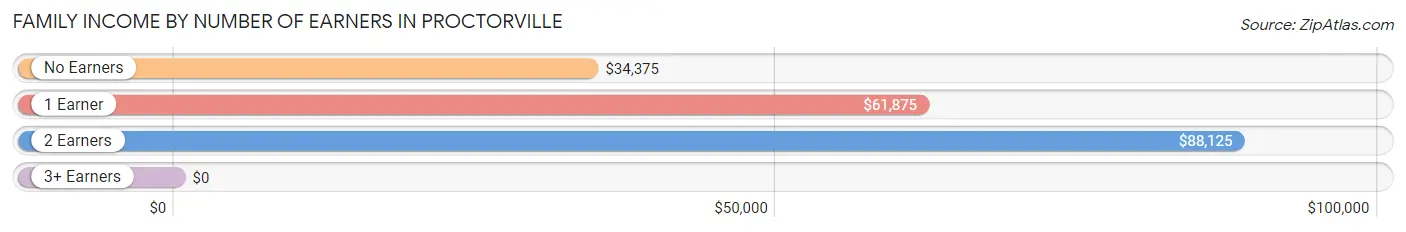
| Number of Earners | # Families | Median Income |
| No Earners | 11 (32.4%) | $34,375 |
| 1 Earner | 11 (32.4%) | $61,875 |
| 2 Earners | 9 (26.5%) | $88,125 |
| 3+ Earners | 3 (8.8%) | $0 |
| Total | 34 (100.0%) | $68,125 |
Household Income in Proctorville
Household Income Brackets in Proctorville
With 10 households falling in the category, the $50,000 to $74,999 income range is the most frequent in Proctorville, accounting for 19.6% of all households.
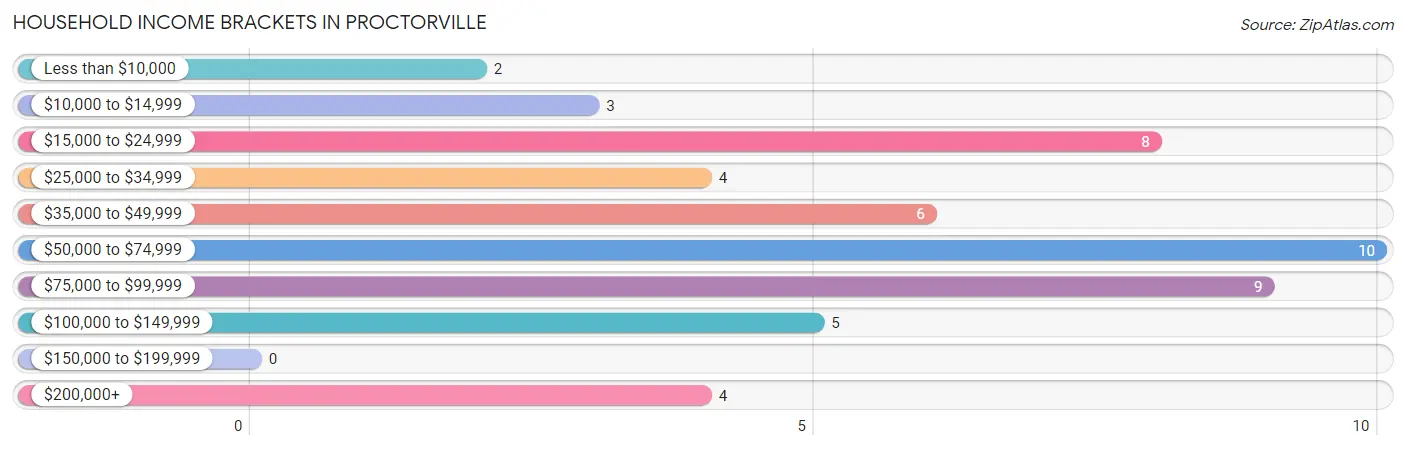
| Income Bracket | # Households | % Households |
| Less than $10,000 | 2 | 3.9% |
| $10,000 to $14,999 | 3 | 5.9% |
| $15,000 to $24,999 | 8 | 15.7% |
| $25,000 to $34,999 | 4 | 7.8% |
| $35,000 to $49,999 | 6 | 11.8% |
| $50,000 to $74,999 | 10 | 19.6% |
| $75,000 to $99,999 | 9 | 17.6% |
| $100,000 to $149,999 | 5 | 9.8% |
| $150,000 to $199,999 | 0 | 0.0% |
| $200,000+ | 4 | 7.8% |
Household Income by Householder Age in Proctorville
The median household income in Proctorville is $60,625, with the highest median household income of $71,250 found in the 45 to 64 years age bracket for the primary householder. A total of 15 households (29.4%) fall into this category.
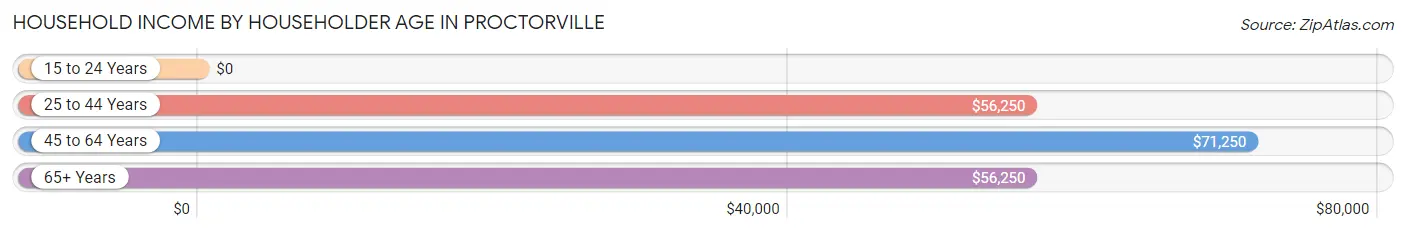
| Income Bracket | # Households | Median Income |
| 15 to 24 Years | 0 (0.0%) | $0 |
| 25 to 44 Years | 14 (27.5%) | $56,250 |
| 45 to 64 Years | 15 (29.4%) | $71,250 |
| 65+ Years | 22 (43.1%) | $56,250 |
| Total | 51 (100.0%) | $60,625 |
Poverty in Proctorville
Income Below Poverty by Sex and Age in Proctorville
With 8.6% poverty level for males and 9.8% for females among the residents of Proctorville, 12 to 14 year old males and 6 to 11 year old females are the most vulnerable to poverty, with 2 males (66.7%) and 2 females (100.0%) in their respective age groups living below the poverty level.
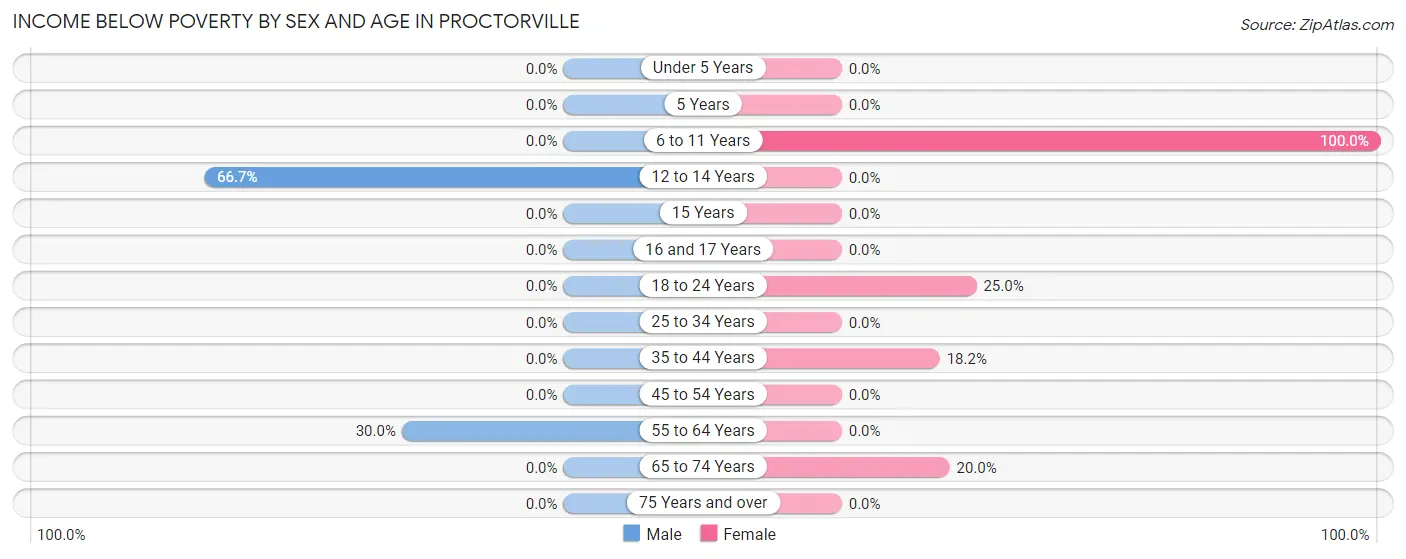
| Age Bracket | Male | Female |
| Under 5 Years | 0 (0.0%) | 0 (0.0%) |
| 5 Years | 0 (0.0%) | 0 (0.0%) |
| 6 to 11 Years | 0 (0.0%) | 2 (100.0%) |
| 12 to 14 Years | 2 (66.7%) | 0 (0.0%) |
| 15 Years | 0 (0.0%) | 0 (0.0%) |
| 16 and 17 Years | 0 (0.0%) | 0 (0.0%) |
| 18 to 24 Years | 0 (0.0%) | 2 (25.0%) |
| 25 to 34 Years | 0 (0.0%) | 0 (0.0%) |
| 35 to 44 Years | 0 (0.0%) | 2 (18.2%) |
| 45 to 54 Years | 0 (0.0%) | 0 (0.0%) |
| 55 to 64 Years | 3 (30.0%) | 0 (0.0%) |
| 65 to 74 Years | 0 (0.0%) | 2 (20.0%) |
| 75 Years and over | 0 (0.0%) | 0 (0.0%) |
| Total | 5 (8.6%) | 8 (9.8%) |
Income Above Poverty by Sex and Age in Proctorville
According to the poverty statistics in Proctorville, males aged 6 to 11 years and females aged under 5 years are the age groups that are most secure financially, with 100.0% of males and 100.0% of females in these age groups living above the poverty line.
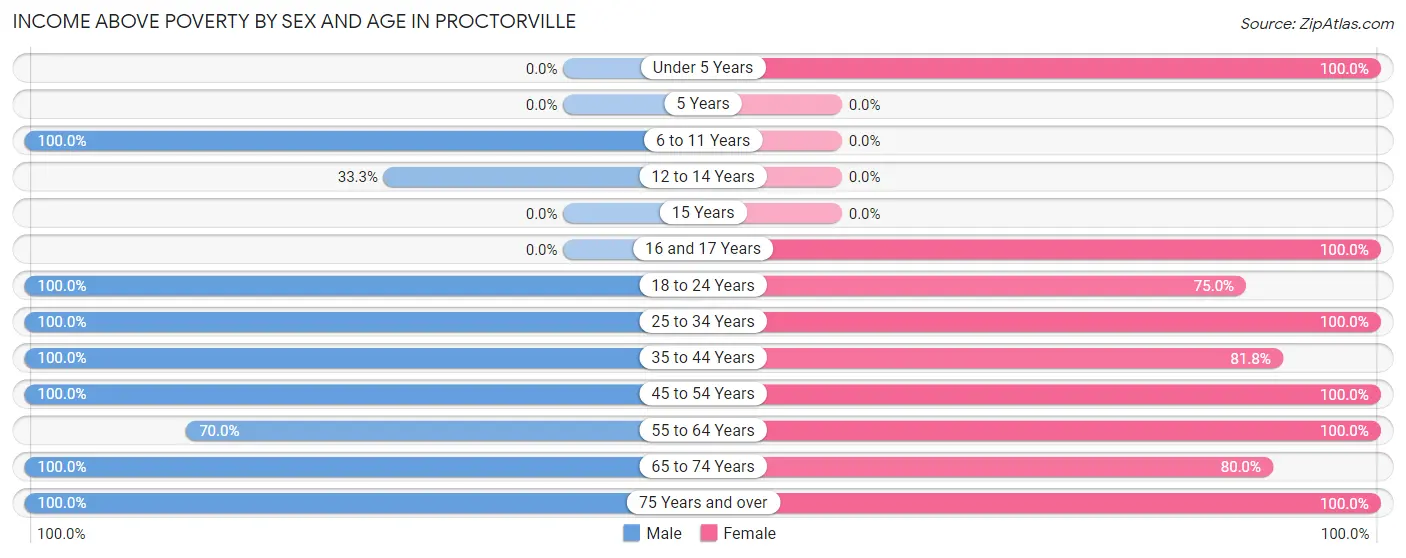
| Age Bracket | Male | Female |
| Under 5 Years | 0 (0.0%) | 6 (100.0%) |
| 5 Years | 0 (0.0%) | 0 (0.0%) |
| 6 to 11 Years | 6 (100.0%) | 0 (0.0%) |
| 12 to 14 Years | 1 (33.3%) | 0 (0.0%) |
| 15 Years | 0 (0.0%) | 0 (0.0%) |
| 16 and 17 Years | 0 (0.0%) | 2 (100.0%) |
| 18 to 24 Years | 5 (100.0%) | 6 (75.0%) |
| 25 to 34 Years | 10 (100.0%) | 10 (100.0%) |
| 35 to 44 Years | 6 (100.0%) | 9 (81.8%) |
| 45 to 54 Years | 5 (100.0%) | 7 (100.0%) |
| 55 to 64 Years | 7 (70.0%) | 16 (100.0%) |
| 65 to 74 Years | 8 (100.0%) | 8 (80.0%) |
| 75 Years and over | 5 (100.0%) | 10 (100.0%) |
| Total | 53 (91.4%) | 74 (90.2%) |
Income Below Poverty Among Married-Couple Families in Proctorville
The poverty statistics for married-couple families in Proctorville show that 9.5% or 2 of the total 21 families live below the poverty line. Families with 1 or 2 children have the highest poverty rate of 33.3%, comprising of 2 families. On the other hand, families with no children have the lowest poverty rate of 0.0%, which includes 0 families.
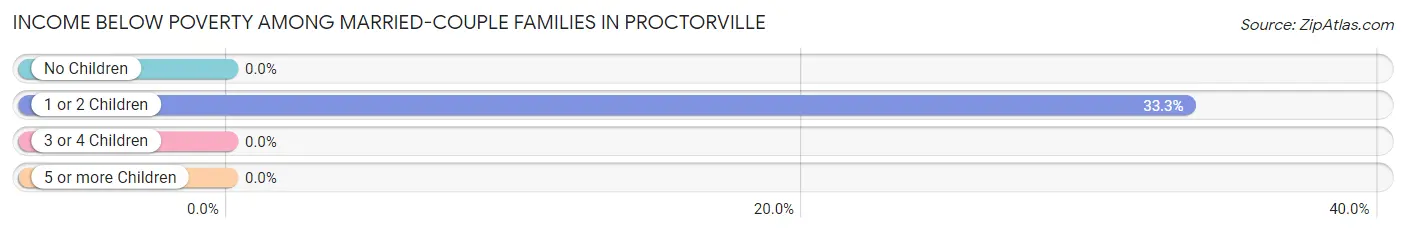
| Children | Above Poverty | Below Poverty |
| No Children | 13 (100.0%) | 0 (0.0%) |
| 1 or 2 Children | 4 (66.7%) | 2 (33.3%) |
| 3 or 4 Children | 2 (100.0%) | 0 (0.0%) |
| 5 or more Children | 0 (0.0%) | 0 (0.0%) |
| Total | 19 (90.5%) | 2 (9.5%) |
Income Below Poverty Among Single-Parent Households in Proctorville
| Children | Single Father | Single Mother |
| No Children | 0 (0.0%) | 0 (0.0%) |
| 1 or 2 Children | 0 (0.0%) | 0 (0.0%) |
| 3 or 4 Children | 0 (0.0%) | 0 (0.0%) |
| 5 or more Children | 0 (0.0%) | 0 (0.0%) |
| Total | 0 (0.0%) | 0 (0.0%) |
Income Below Poverty Among Married-Couple vs Single-Parent Households in Proctorville
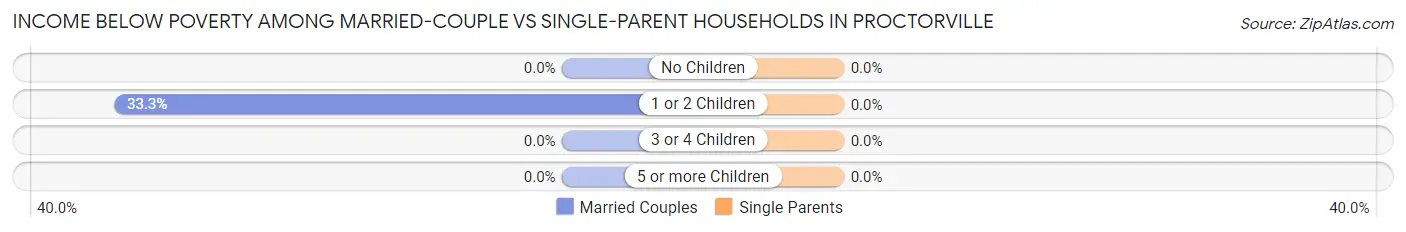
| Children | Married-Couple Families | Single-Parent Households |
| No Children | 0 (0.0%) | 0 (0.0%) |
| 1 or 2 Children | 2 (33.3%) | 0 (0.0%) |
| 3 or 4 Children | 0 (0.0%) | 0 (0.0%) |
| 5 or more Children | 0 (0.0%) | 0 (0.0%) |
| Total | 2 (9.5%) | 0 (0.0%) |
Race in Proctorville
The most populous races in Proctorville are White / Caucasian (108 | 77.1%), Black / African American (21 | 15.0%), and Native / Alaskan (10 | 7.1%).
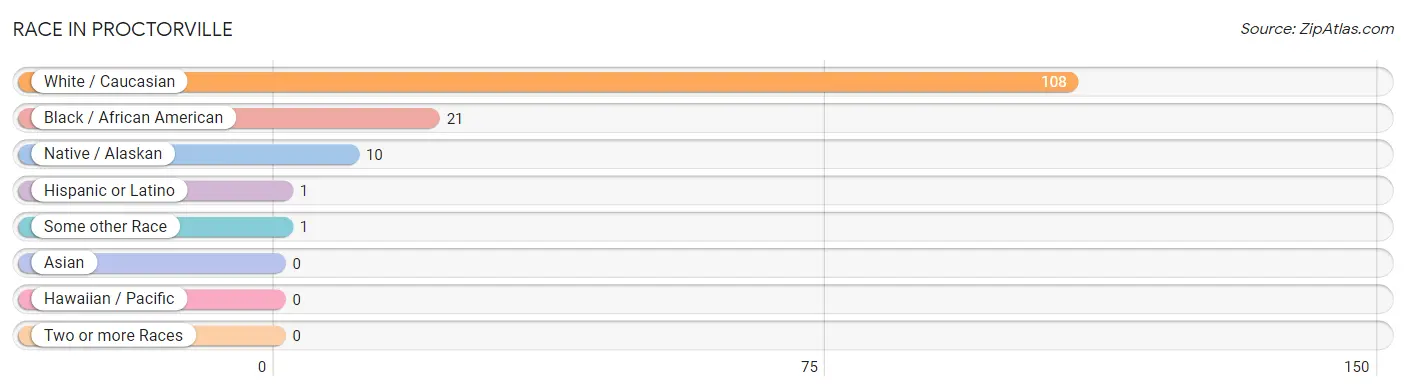
| Race | # Population | % Population |
| Asian | 0 | 0.0% |
| Black / African American | 21 | 15.0% |
| Hawaiian / Pacific | 0 | 0.0% |
| Hispanic or Latino | 1 | 0.7% |
| Native / Alaskan | 10 | 7.1% |
| White / Caucasian | 108 | 77.1% |
| Two or more Races | 0 | 0.0% |
| Some other Race | 1 | 0.7% |
| Total | 140 | 100.0% |
Ancestry in Proctorville
The most populous ancestries reported in Proctorville are American (87 | 62.1%), English (14 | 10.0%), Lumbee (10 | 7.1%), German (9 | 6.4%), and European (4 | 2.9%), together accounting for 88.6% of all Proctorville residents.
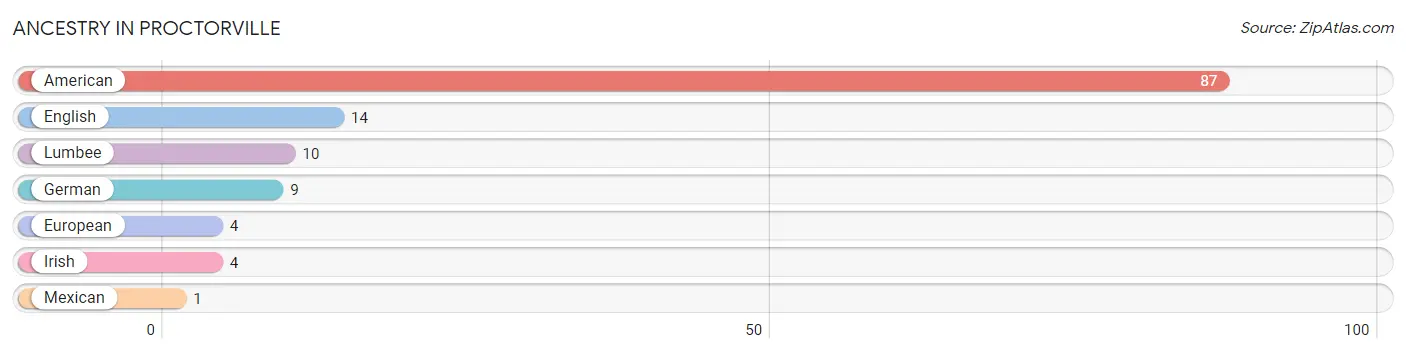
| Ancestry | # Population | % Population |
| American | 87 | 62.1% |
| English | 14 | 10.0% |
| European | 4 | 2.9% |
| German | 9 | 6.4% |
| Irish | 4 | 2.9% |
| Lumbee | 10 | 7.1% |
| Mexican | 1 | 0.7% | View All 7 Rows |
Immigrants in Proctorville

| Immigration Origin | # Population | % Population | View All 0 Rows |
Sex and Age in Proctorville
Sex and Age in Proctorville
The most populous age groups in Proctorville are 30 to 34 Years (9 | 15.5%) for men and 60 to 64 Years (16 | 19.5%) for women.
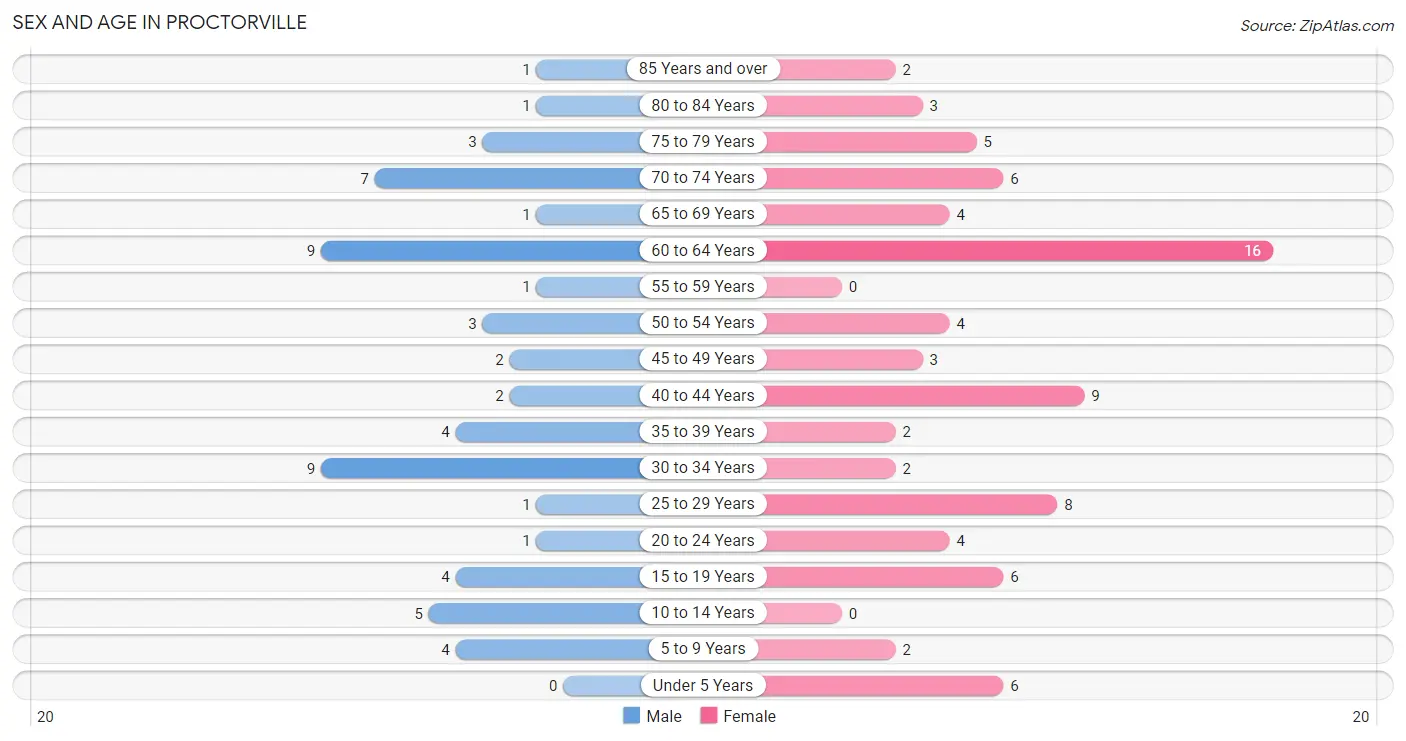
| Age Bracket | Male | Female |
| Under 5 Years | 0 (0.0%) | 6 (7.3%) |
| 5 to 9 Years | 4 (6.9%) | 2 (2.4%) |
| 10 to 14 Years | 5 (8.6%) | 0 (0.0%) |
| 15 to 19 Years | 4 (6.9%) | 6 (7.3%) |
| 20 to 24 Years | 1 (1.7%) | 4 (4.9%) |
| 25 to 29 Years | 1 (1.7%) | 8 (9.8%) |
| 30 to 34 Years | 9 (15.5%) | 2 (2.4%) |
| 35 to 39 Years | 4 (6.9%) | 2 (2.4%) |
| 40 to 44 Years | 2 (3.5%) | 9 (11.0%) |
| 45 to 49 Years | 2 (3.5%) | 3 (3.7%) |
| 50 to 54 Years | 3 (5.2%) | 4 (4.9%) |
| 55 to 59 Years | 1 (1.7%) | 0 (0.0%) |
| 60 to 64 Years | 9 (15.5%) | 16 (19.5%) |
| 65 to 69 Years | 1 (1.7%) | 4 (4.9%) |
| 70 to 74 Years | 7 (12.1%) | 6 (7.3%) |
| 75 to 79 Years | 3 (5.2%) | 5 (6.1%) |
| 80 to 84 Years | 1 (1.7%) | 3 (3.7%) |
| 85 Years and over | 1 (1.7%) | 2 (2.4%) |
| Total | 58 (100.0%) | 82 (100.0%) |
Families and Households in Proctorville
Median Family Size in Proctorville
The median family size in Proctorville is 3.50 persons per family, with single female/mother families (7 | 20.6%) accounting for the largest median family size of 4 persons per family. On the other hand, single male/father families (6 | 17.6%) represent the smallest median family size with 2.67 persons per family.
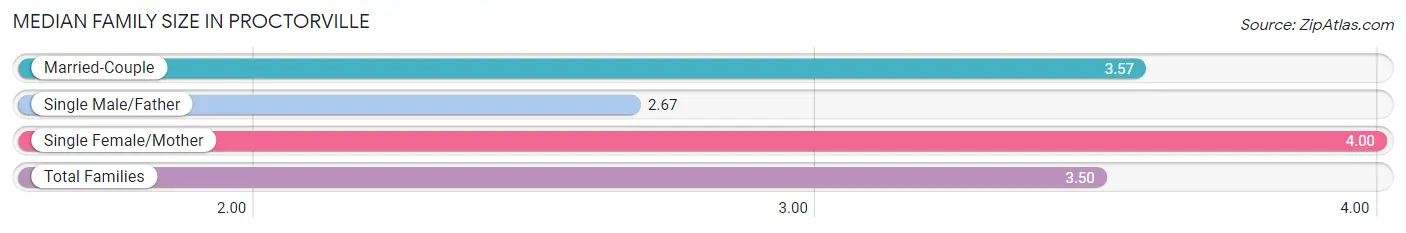
| Family Type | # Families | Family Size |
| Married-Couple | 21 (61.8%) | 3.57 |
| Single Male/Father | 6 (17.6%) | 2.67 |
| Single Female/Mother | 7 (20.6%) | 4.00 |
| Total Families | 34 (100.0%) | 3.50 |
Median Household Size in Proctorville
The median household size in Proctorville is 2.75 persons per household, with single female/mother households (7 | 13.7%) accounting for the largest median household size of 4 persons per household. non-family households (17 | 33.3%) represent the smallest median household size with 1.12 persons per household.
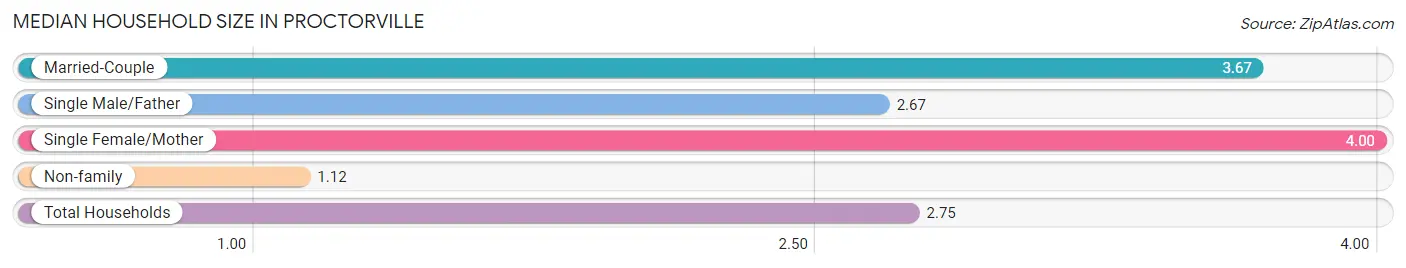
| Household Type | # Households | Household Size |
| Married-Couple | 21 (41.2%) | 3.67 |
| Single Male/Father | 6 (11.8%) | 2.67 |
| Single Female/Mother | 7 (13.7%) | 4.00 |
| Non-family | 17 (33.3%) | 1.12 |
| Total Households | 51 (100.0%) | 2.75 |
Household Size by Marriage Status in Proctorville
Out of a total of 51 households in Proctorville, 34 (66.7%) are family households, while 17 (33.3%) are nonfamily households. The most numerous type of family households are 2-person households, comprising 18, and the most common type of nonfamily households are 1-person households, comprising 15.
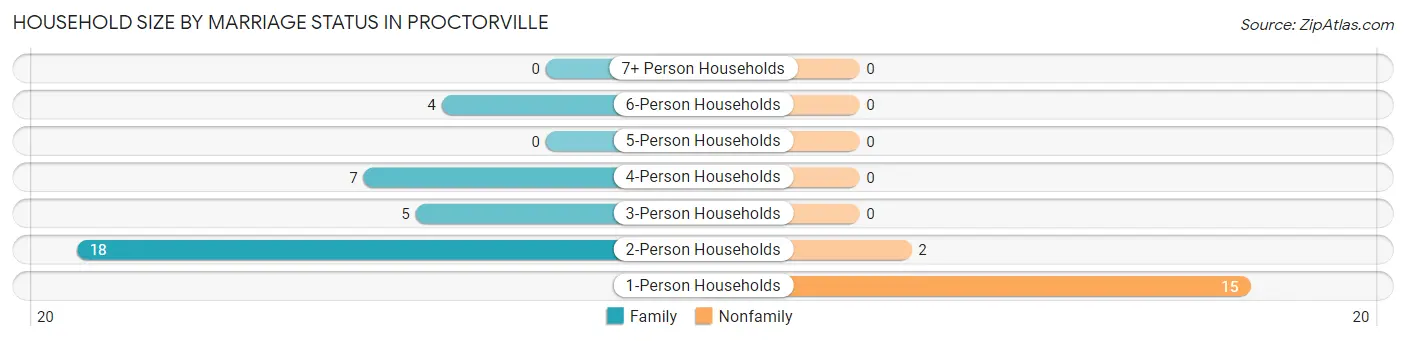
| Household Size | Family Households | Nonfamily Households |
| 1-Person Households | - | 15 (29.4%) |
| 2-Person Households | 18 (35.3%) | 2 (3.9%) |
| 3-Person Households | 5 (9.8%) | 0 (0.0%) |
| 4-Person Households | 7 (13.7%) | 0 (0.0%) |
| 5-Person Households | 0 (0.0%) | 0 (0.0%) |
| 6-Person Households | 4 (7.8%) | 0 (0.0%) |
| 7+ Person Households | 0 (0.0%) | 0 (0.0%) |
| Total | 34 (66.7%) | 17 (33.3%) |
Female Fertility in Proctorville
Fertility by Age in Proctorville
| Age Bracket | Women with Births | Births / 1,000 Women |
| 15 to 19 years | 0 (0.0%) | 0.0 |
| 20 to 34 years | 0 (0.0%) | 0.0 |
| 35 to 50 years | 0 (0.0%) | 0.0 |
| Total | 0 (0.0%) | 0.0 |
Fertility by Age by Marriage Status in Proctorville
| Age Bracket | Married | Unmarried |
| 15 to 19 years | 0 (0.0%) | 0 (0.0%) |
| 20 to 34 years | 0 (0.0%) | 0 (0.0%) |
| 35 to 50 years | 0 (0.0%) | 0 (0.0%) |
| Total | 0 (0.0%) | 0 (0.0%) |
Fertility by Education in Proctorville
| Educational Attainment | Women with Births | Births / 1,000 Women |
| Less than High School | 0 (0.0%) | 0.0 |
| High School Diploma | 0 (0.0%) | 0.0 |
| College or Associate's Degree | 0 (0.0%) | 0.0 |
| Bachelor's Degree | 0 (0.0%) | 0.0 |
| Graduate Degree | 0 (0.0%) | 0.0 |
| Total | 0 (0.0%) | 0.0 |
Fertility by Education by Marriage Status in Proctorville
| Educational Attainment | Married | Unmarried |
| Less than High School | 0 (0.0%) | 0 (0.0%) |
| High School Diploma | 0 (0.0%) | 0 (0.0%) |
| College or Associate's Degree | 0 (0.0%) | 0 (0.0%) |
| Bachelor's Degree | 0 (0.0%) | 0 (0.0%) |
| Graduate Degree | 0 (0.0%) | 0 (0.0%) |
| Total | 0 (0.0%) | 0 (0.0%) |
Employment Characteristics in Proctorville
Employment by Class of Employer in Proctorville
Among the 52 employed individuals in Proctorville, private company employees (34 | 65.4%), not-for-profit organizations (11 | 21.1%), and state government employees (5 | 9.6%) make up the most common classes of employment.
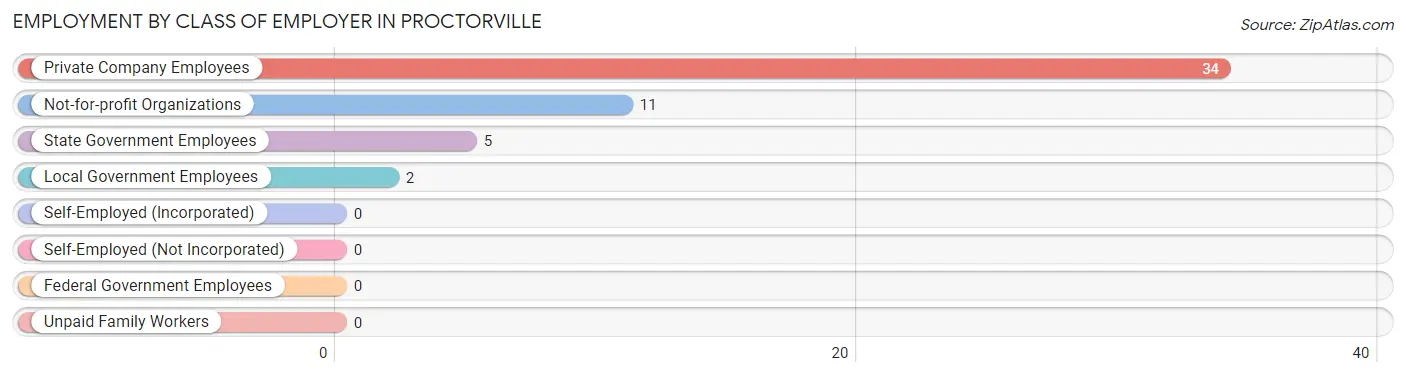
| Employer Class | # Employees | % Employees |
| Private Company Employees | 34 | 65.4% |
| Self-Employed (Incorporated) | 0 | 0.0% |
| Self-Employed (Not Incorporated) | 0 | 0.0% |
| Not-for-profit Organizations | 11 | 21.1% |
| Local Government Employees | 2 | 3.8% |
| State Government Employees | 5 | 9.6% |
| Federal Government Employees | 0 | 0.0% |
| Unpaid Family Workers | 0 | 0.0% |
| Total | 52 | 100.0% |
Employment Status by Age in Proctorville
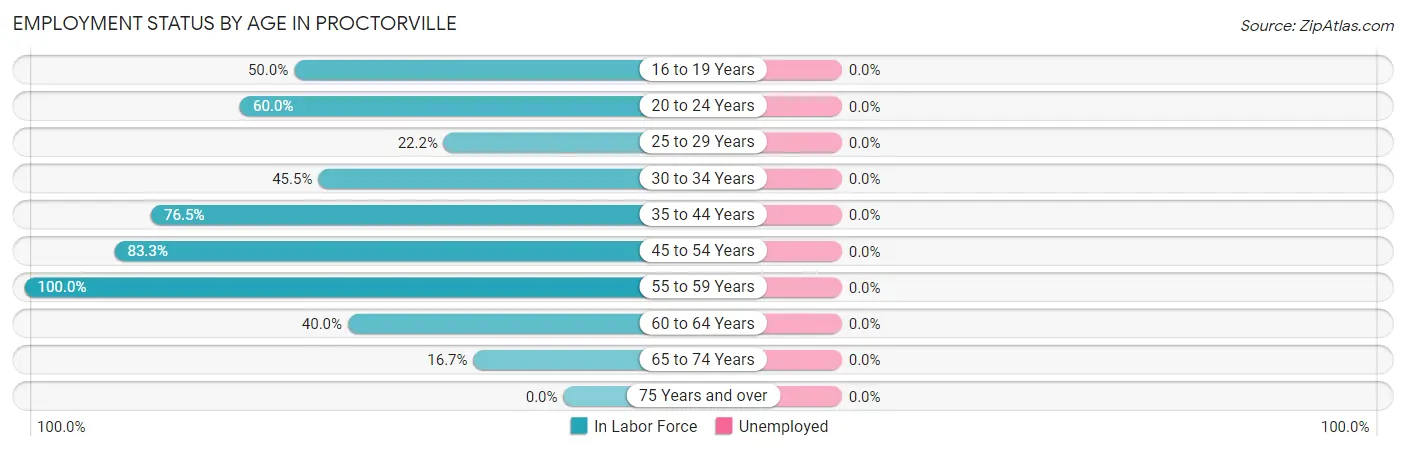
| Age Bracket | In Labor Force | Unemployed |
| 16 to 19 Years | 5 (50.0%) | 0 (0.0%) |
| 20 to 24 Years | 3 (60.0%) | 0 (0.0%) |
| 25 to 29 Years | 2 (22.2%) | 0 (0.0%) |
| 30 to 34 Years | 5 (45.5%) | 0 (0.0%) |
| 35 to 44 Years | 13 (76.5%) | 0 (0.0%) |
| 45 to 54 Years | 10 (83.3%) | 0 (0.0%) |
| 55 to 59 Years | 1 (100.0%) | 0 (0.0%) |
| 60 to 64 Years | 10 (40.0%) | 0 (0.0%) |
| 65 to 74 Years | 3 (16.7%) | 0 (0.0%) |
| 75 Years and over | 0 (0.0%) | 0 (0.0%) |
| Total | 52 (42.3%) | 0 (0.0%) |
Employment Status by Educational Attainment in Proctorville
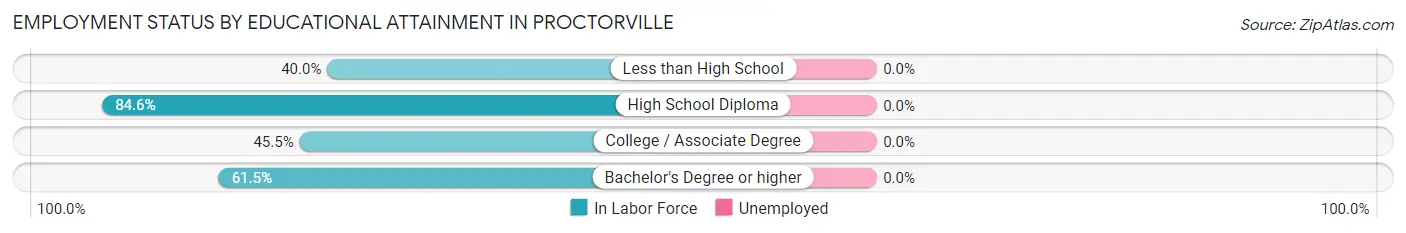
| Educational Attainment | In Labor Force | Unemployed |
| Less than High School | 2 (40.0%) | 0 (0.0%) |
| High School Diploma | 11 (84.6%) | 0 (0.0%) |
| College / Associate Degree | 20 (45.5%) | 0 (0.0%) |
| Bachelor's Degree or higher | 8 (61.5%) | 0 (0.0%) |
| Total | 41 (54.7%) | 0 (0.0%) |
Employment Occupations by Sex in Proctorville
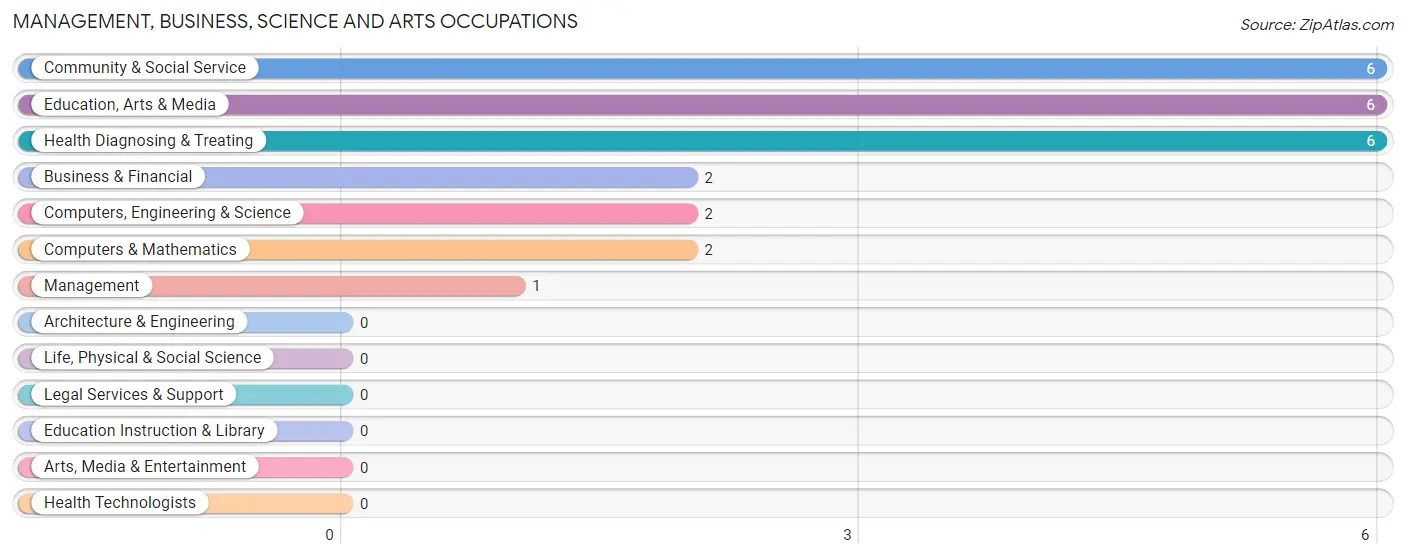
Management, Business, Science and Arts Occupations
The most common Management, Business, Science and Arts occupations in Proctorville are Community & Social Service (6 | 11.5%), Education, Arts & Media (6 | 11.5%), Health Diagnosing & Treating (6 | 11.5%), Business & Financial (2 | 3.8%), and Computers, Engineering & Science (2 | 3.8%).
Management, Business, Science and Arts Occupations by Sex
Within the Management, Business, Science and Arts occupations in Proctorville, the most male-oriented occupations are Business & Financial (100.0%), Community & Social Service (66.7%), and Education, Arts & Media (66.7%), while the most female-oriented occupations are Management (100.0%), Computers, Engineering & Science (100.0%), and Computers & Mathematics (100.0%).
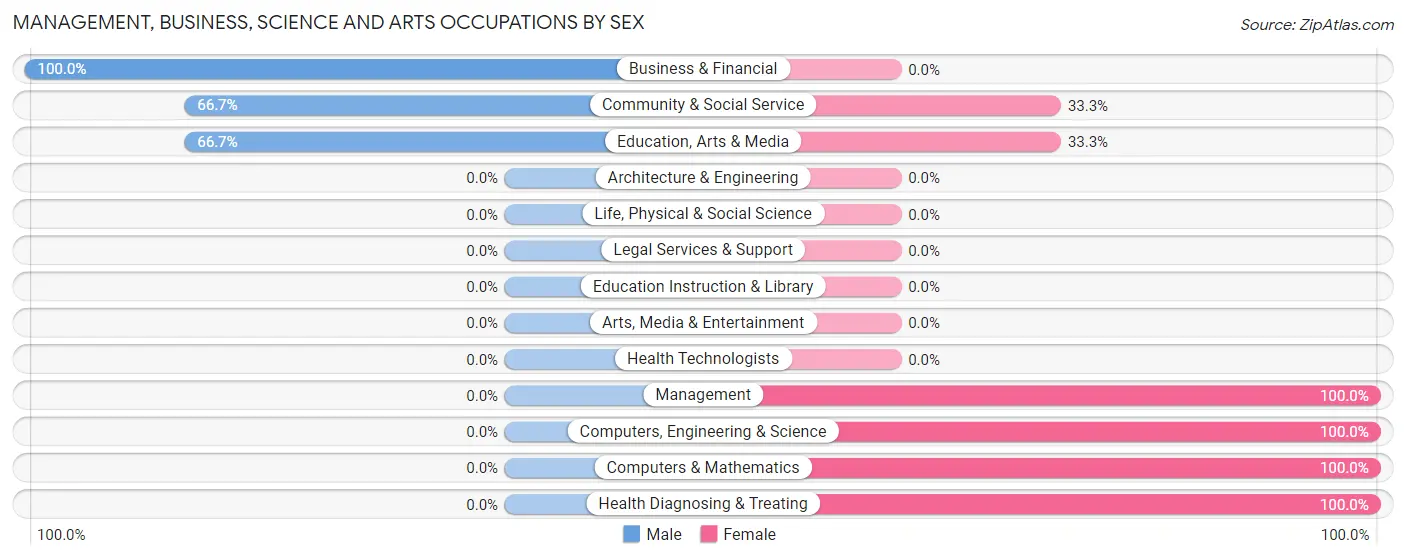
| Occupation | Male | Female |
| Management | 0 (0.0%) | 1 (100.0%) |
| Business & Financial | 2 (100.0%) | 0 (0.0%) |
| Computers, Engineering & Science | 0 (0.0%) | 2 (100.0%) |
| Computers & Mathematics | 0 (0.0%) | 2 (100.0%) |
| Architecture & Engineering | 0 (0.0%) | 0 (0.0%) |
| Life, Physical & Social Science | 0 (0.0%) | 0 (0.0%) |
| Community & Social Service | 4 (66.7%) | 2 (33.3%) |
| Education, Arts & Media | 4 (66.7%) | 2 (33.3%) |
| Legal Services & Support | 0 (0.0%) | 0 (0.0%) |
| Education Instruction & Library | 0 (0.0%) | 0 (0.0%) |
| Arts, Media & Entertainment | 0 (0.0%) | 0 (0.0%) |
| Health Diagnosing & Treating | 0 (0.0%) | 6 (100.0%) |
| Health Technologists | 0 (0.0%) | 0 (0.0%) |
| Total (Category) | 6 (35.3%) | 11 (64.7%) |
| Total (Overall) | 26 (50.0%) | 26 (50.0%) |
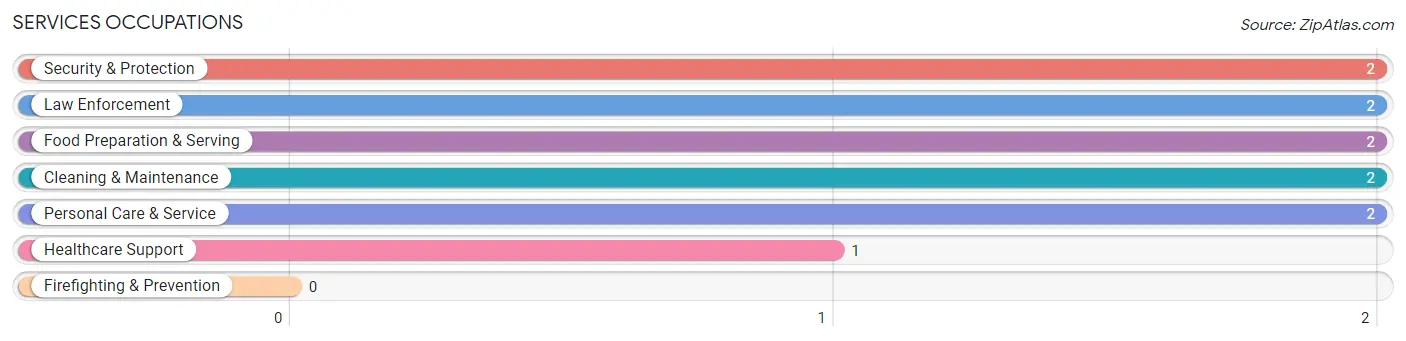
Services Occupations
The most common Services occupations in Proctorville are Security & Protection (2 | 3.8%), Law Enforcement (2 | 3.8%), Food Preparation & Serving (2 | 3.8%), Cleaning & Maintenance (2 | 3.8%), and Personal Care & Service (2 | 3.8%).
Services Occupations by Sex
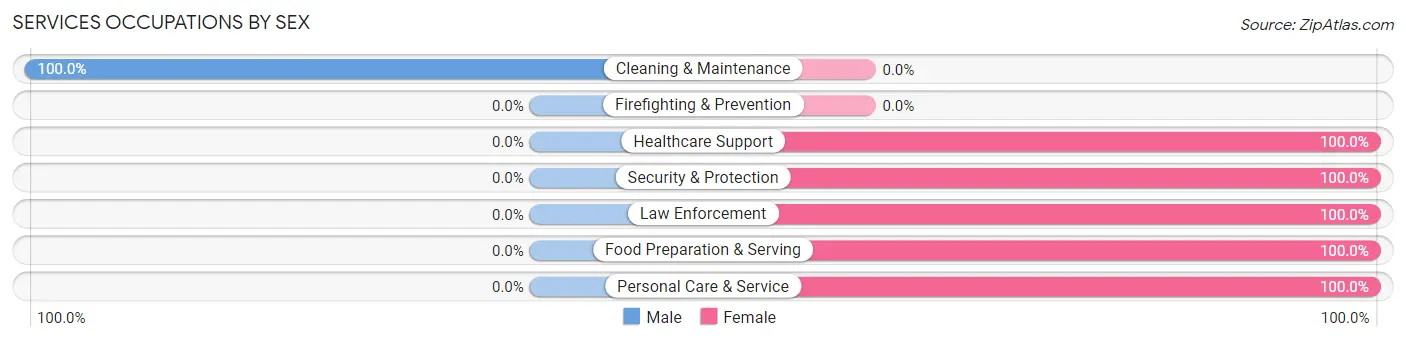
| Occupation | Male | Female |
| Healthcare Support | 0 (0.0%) | 1 (100.0%) |
| Security & Protection | 0 (0.0%) | 2 (100.0%) |
| Firefighting & Prevention | 0 (0.0%) | 0 (0.0%) |
| Law Enforcement | 0 (0.0%) | 2 (100.0%) |
| Food Preparation & Serving | 0 (0.0%) | 2 (100.0%) |
| Cleaning & Maintenance | 2 (100.0%) | 0 (0.0%) |
| Personal Care & Service | 0 (0.0%) | 2 (100.0%) |
| Total (Category) | 2 (22.2%) | 7 (77.8%) |
| Total (Overall) | 26 (50.0%) | 26 (50.0%) |
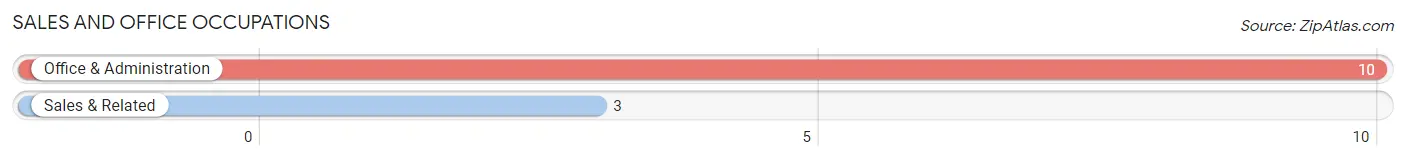
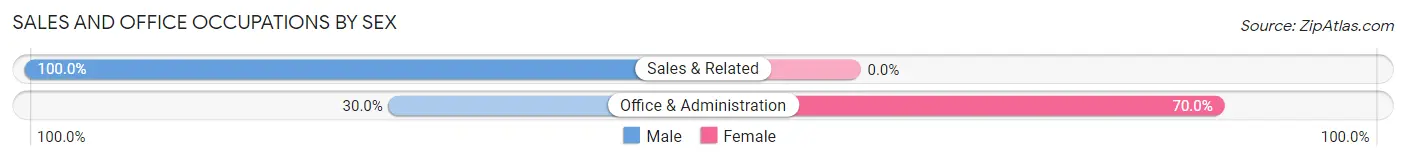
Sales and Office Occupations
The most common Sales and Office occupations in Proctorville are Office & Administration (10 | 19.2%), and Sales & Related (3 | 5.8%).
Sales and Office Occupations by Sex
| Occupation | Male | Female |
| Sales & Related | 3 (100.0%) | 0 (0.0%) |
| Office & Administration | 3 (30.0%) | 7 (70.0%) |
| Total (Category) | 6 (46.2%) | 7 (53.8%) |
| Total (Overall) | 26 (50.0%) | 26 (50.0%) |
Natural Resources, Construction and Maintenance Occupations
The most common Natural Resources, Construction and Maintenance occupations in Proctorville are , and Construction & Extraction (9 | 17.3%).
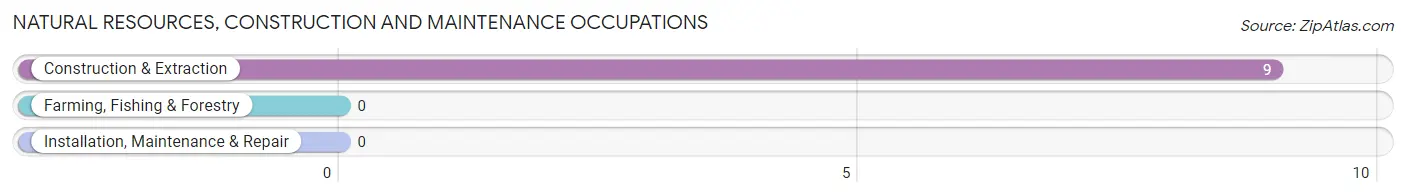
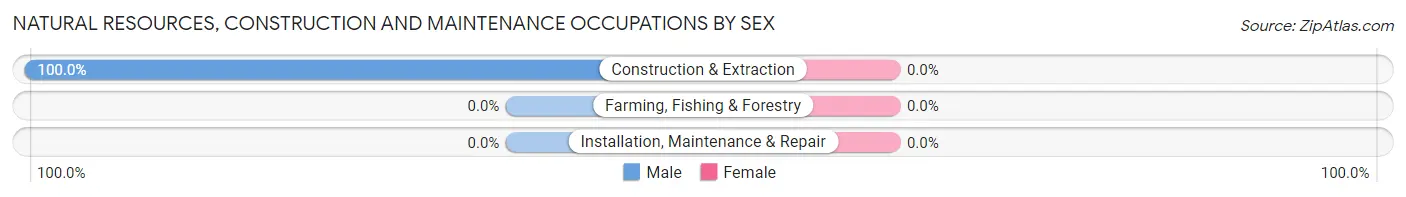
Natural Resources, Construction and Maintenance Occupations by Sex
| Occupation | Male | Female |
| Farming, Fishing & Forestry | 0 (0.0%) | 0 (0.0%) |
| Construction & Extraction | 9 (100.0%) | 0 (0.0%) |
| Installation, Maintenance & Repair | 0 (0.0%) | 0 (0.0%) |
| Total (Category) | 9 (100.0%) | 0 (0.0%) |
| Total (Overall) | 26 (50.0%) | 26 (50.0%) |
Production, Transportation and Moving Occupations
The most common Production, Transportation and Moving occupations in Proctorville are Production (2 | 3.8%), Transportation (1 | 1.9%), and Material Moving (1 | 1.9%).
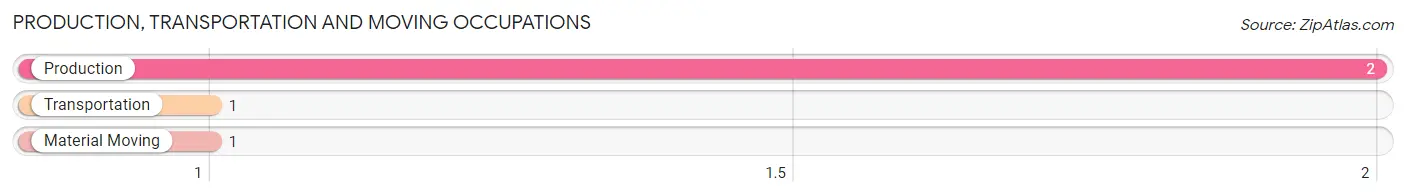
Production, Transportation and Moving Occupations by Sex
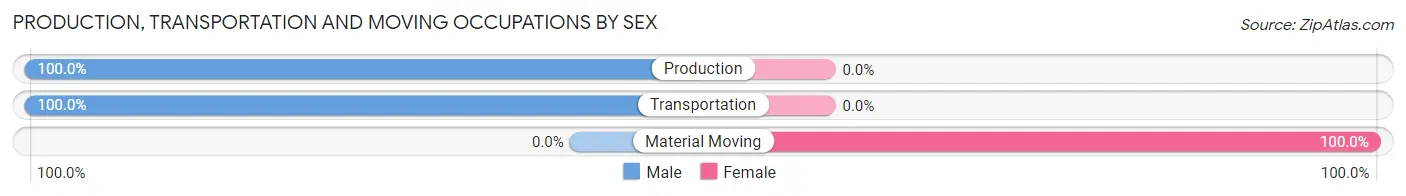
| Occupation | Male | Female |
| Production | 2 (100.0%) | 0 (0.0%) |
| Transportation | 1 (100.0%) | 0 (0.0%) |
| Material Moving | 0 (0.0%) | 1 (100.0%) |
| Total (Category) | 3 (75.0%) | 1 (25.0%) |
| Total (Overall) | 26 (50.0%) | 26 (50.0%) |
Employment Industries by Sex in Proctorville
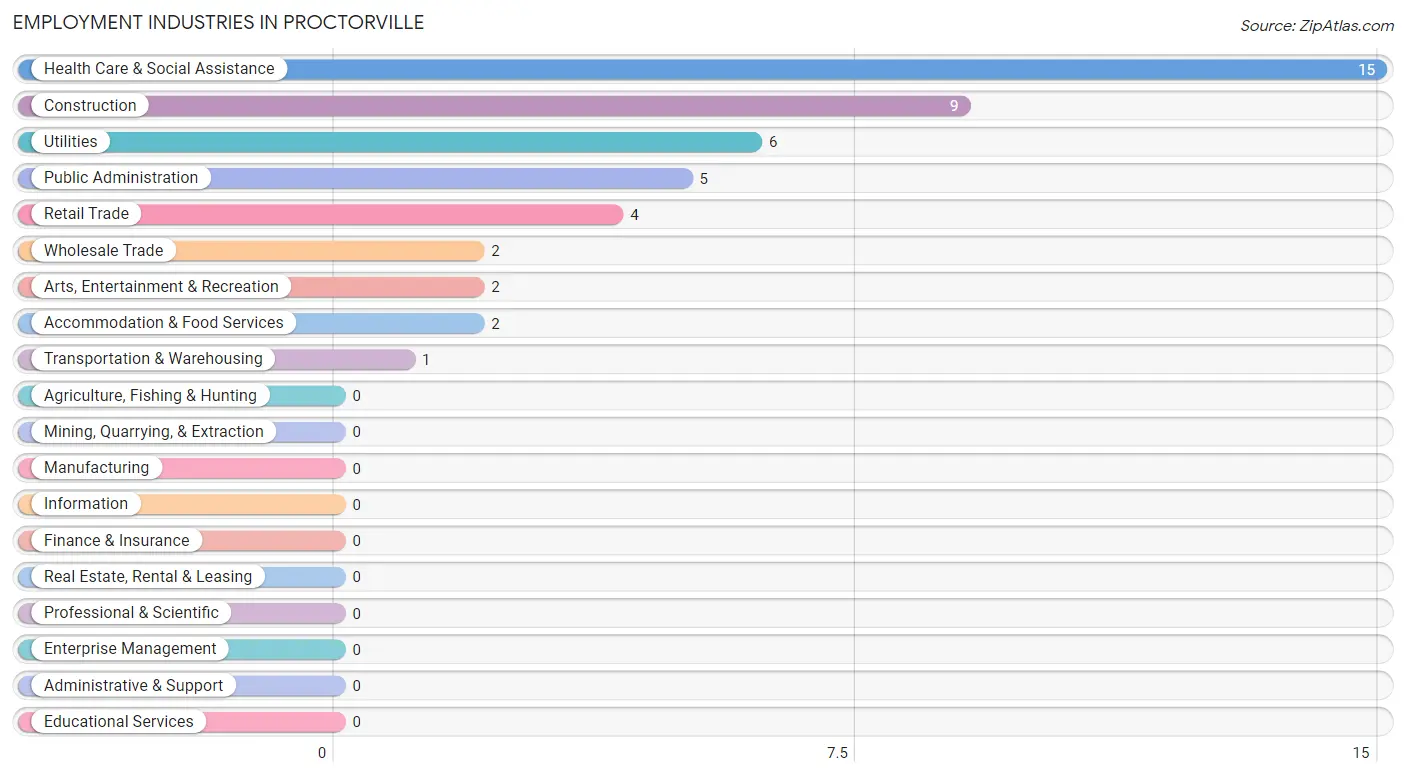
Employment Industries in Proctorville
The major employment industries in Proctorville include Health Care & Social Assistance (15 | 28.8%), Construction (9 | 17.3%), Utilities (6 | 11.5%), Public Administration (5 | 9.6%), and Retail Trade (4 | 7.7%).
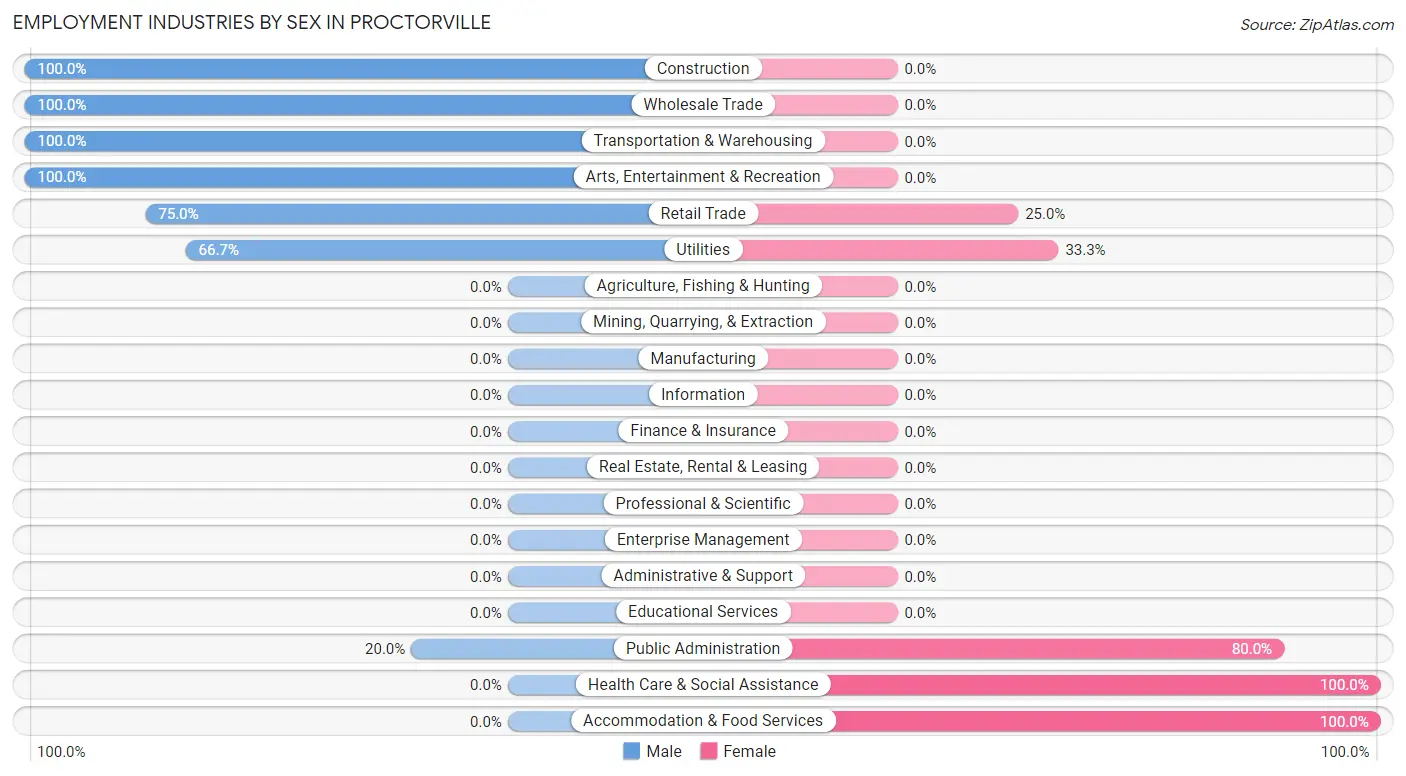
Employment Industries by Sex in Proctorville
The Proctorville industries that see more men than women are Construction (100.0%), Wholesale Trade (100.0%), and Transportation & Warehousing (100.0%), whereas the industries that tend to have a higher number of women are Health Care & Social Assistance (100.0%), Accommodation & Food Services (100.0%), and Public Administration (80.0%).
| Industry | Male | Female |
| Agriculture, Fishing & Hunting | 0 (0.0%) | 0 (0.0%) |
| Mining, Quarrying, & Extraction | 0 (0.0%) | 0 (0.0%) |
| Construction | 9 (100.0%) | 0 (0.0%) |
| Manufacturing | 0 (0.0%) | 0 (0.0%) |
| Wholesale Trade | 2 (100.0%) | 0 (0.0%) |
| Retail Trade | 3 (75.0%) | 1 (25.0%) |
| Transportation & Warehousing | 1 (100.0%) | 0 (0.0%) |
| Utilities | 4 (66.7%) | 2 (33.3%) |
| Information | 0 (0.0%) | 0 (0.0%) |
| Finance & Insurance | 0 (0.0%) | 0 (0.0%) |
| Real Estate, Rental & Leasing | 0 (0.0%) | 0 (0.0%) |
| Professional & Scientific | 0 (0.0%) | 0 (0.0%) |
| Enterprise Management | 0 (0.0%) | 0 (0.0%) |
| Administrative & Support | 0 (0.0%) | 0 (0.0%) |
| Educational Services | 0 (0.0%) | 0 (0.0%) |
| Health Care & Social Assistance | 0 (0.0%) | 15 (100.0%) |
| Arts, Entertainment & Recreation | 2 (100.0%) | 0 (0.0%) |
| Accommodation & Food Services | 0 (0.0%) | 2 (100.0%) |
| Public Administration | 1 (20.0%) | 4 (80.0%) |
| Total | 26 (50.0%) | 26 (50.0%) |
Education in Proctorville
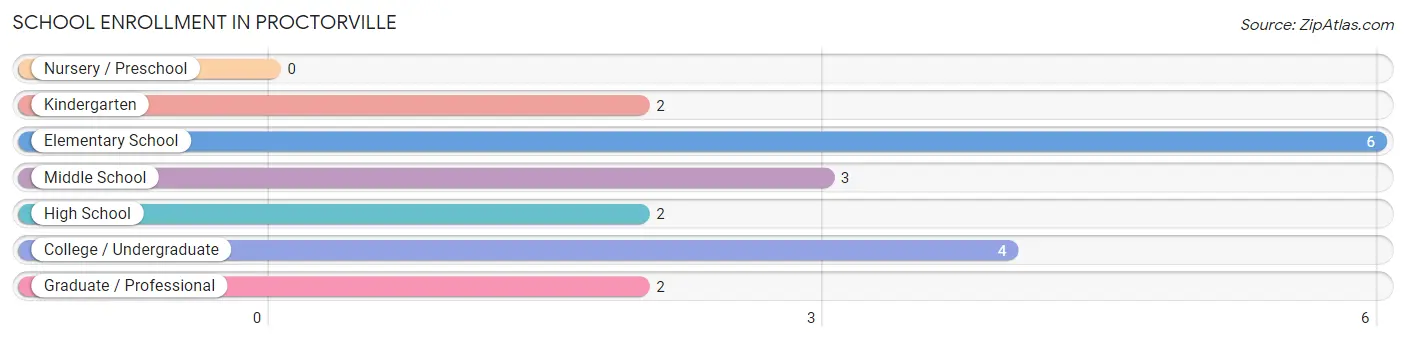
School Enrollment in Proctorville
The most common levels of schooling among the 19 students in Proctorville are elementary school (6 | 31.6%), college / undergraduate (4 | 21.0%), and middle school (3 | 15.8%).
| School Level | # Students | % Students |
| Nursery / Preschool | 0 | 0.0% |
| Kindergarten | 2 | 10.5% |
| Elementary School | 6 | 31.6% |
| Middle School | 3 | 15.8% |
| High School | 2 | 10.5% |
| College / Undergraduate | 4 | 21.0% |
| Graduate / Professional | 2 | 10.5% |
| Total | 19 | 100.0% |
School Enrollment by Age by Funding Source in Proctorville
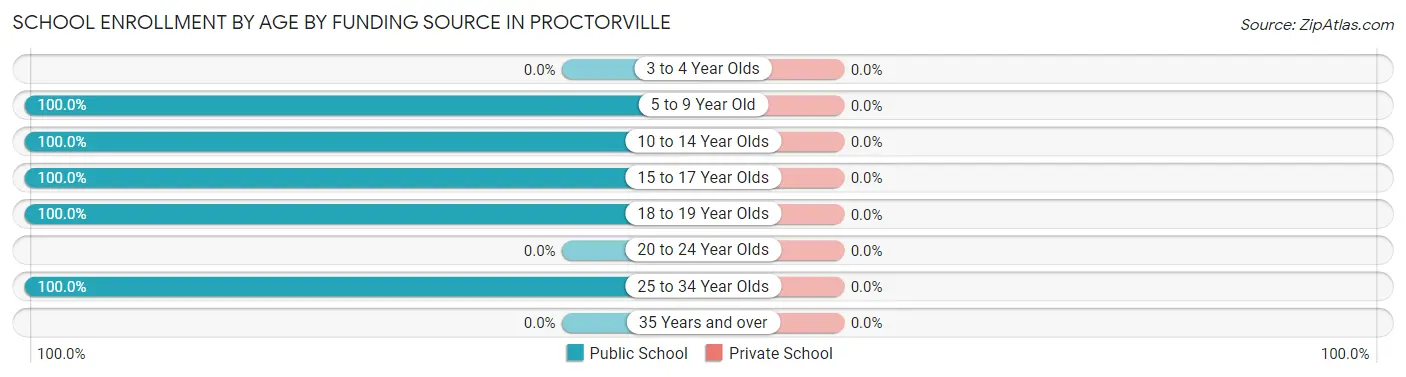
| Age Bracket | Public School | Private School |
| 3 to 4 Year Olds | 0 (0.0%) | 0 (0.0%) |
| 5 to 9 Year Old | 6 (100.0%) | 0 (0.0%) |
| 10 to 14 Year Olds | 5 (100.0%) | 0 (0.0%) |
| 15 to 17 Year Olds | 2 (100.0%) | 0 (0.0%) |
| 18 to 19 Year Olds | 4 (100.0%) | 0 (0.0%) |
| 20 to 24 Year Olds | 0 (0.0%) | 0 (0.0%) |
| 25 to 34 Year Olds | 2 (100.0%) | 0 (0.0%) |
| 35 Years and over | 0 (0.0%) | 0 (0.0%) |
| Total | 19 (100.0%) | 0 (0.0%) |
Educational Attainment by Field of Study in Proctorville
Education (5 | 33.3%), liberal arts & history (4 | 26.7%), bio, nature & agricultural (2 | 13.3%), engineering (2 | 13.3%), and business (2 | 13.3%) are the most common fields of study among 15 individuals in Proctorville who have obtained a bachelor's degree or higher.
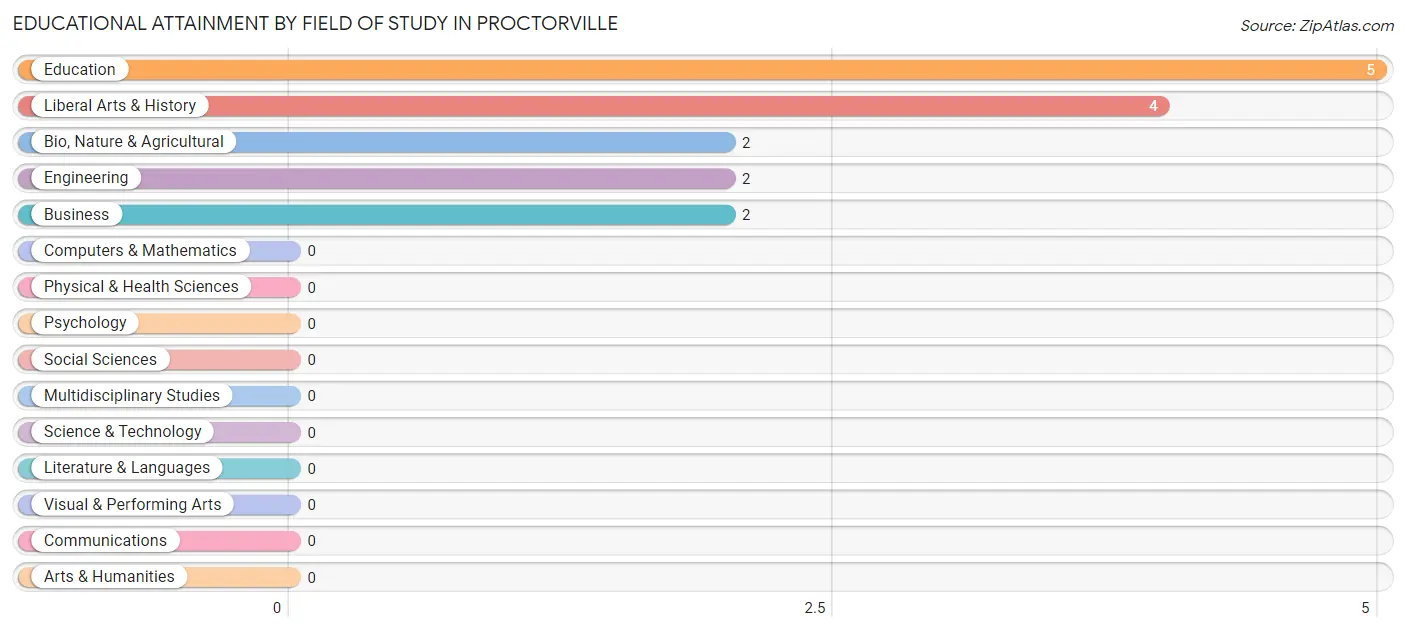
| Field of Study | # Graduates | % Graduates |
| Computers & Mathematics | 0 | 0.0% |
| Bio, Nature & Agricultural | 2 | 13.3% |
| Physical & Health Sciences | 0 | 0.0% |
| Psychology | 0 | 0.0% |
| Social Sciences | 0 | 0.0% |
| Engineering | 2 | 13.3% |
| Multidisciplinary Studies | 0 | 0.0% |
| Science & Technology | 0 | 0.0% |
| Business | 2 | 13.3% |
| Education | 5 | 33.3% |
| Literature & Languages | 0 | 0.0% |
| Liberal Arts & History | 4 | 26.7% |
| Visual & Performing Arts | 0 | 0.0% |
| Communications | 0 | 0.0% |
| Arts & Humanities | 0 | 0.0% |
| Total | 15 | 100.0% |
Transportation & Commute in Proctorville
Vehicle Availability by Sex in Proctorville
The most prevalent vehicle ownership categories in Proctorville are males with 4 vehicles (13, accounting for 50.0%) and females with 4 vehicles (7, making up 50.0%).
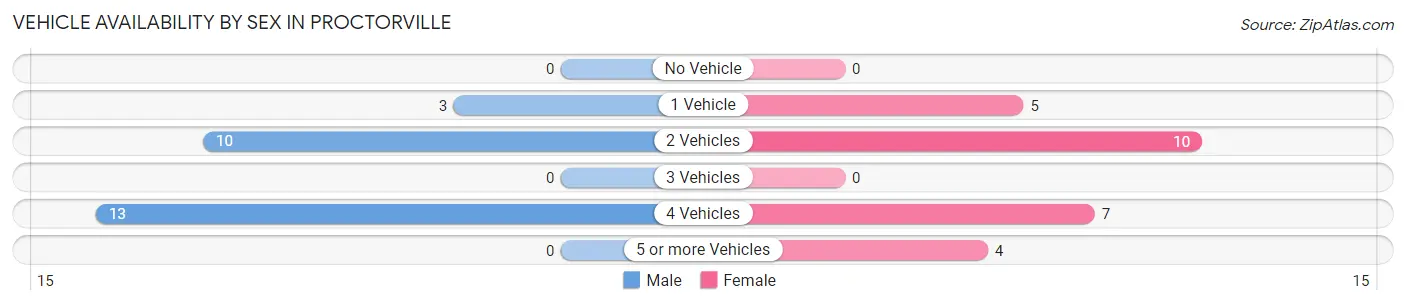
| Vehicles Available | Male | Female |
| No Vehicle | 0 (0.0%) | 0 (0.0%) |
| 1 Vehicle | 3 (11.5%) | 5 (19.2%) |
| 2 Vehicles | 10 (38.5%) | 10 (38.5%) |
| 3 Vehicles | 0 (0.0%) | 0 (0.0%) |
| 4 Vehicles | 13 (50.0%) | 7 (26.9%) |
| 5 or more Vehicles | 0 (0.0%) | 4 (15.4%) |
| Total | 26 (100.0%) | 26 (100.0%) |
Commute Time in Proctorville
The most frequently occuring commute durations in Proctorville are 25 to 29 minutes (15 commuters, 28.8%), 20 to 24 minutes (10 commuters, 19.2%), and 30 to 34 minutes (8 commuters, 15.4%).
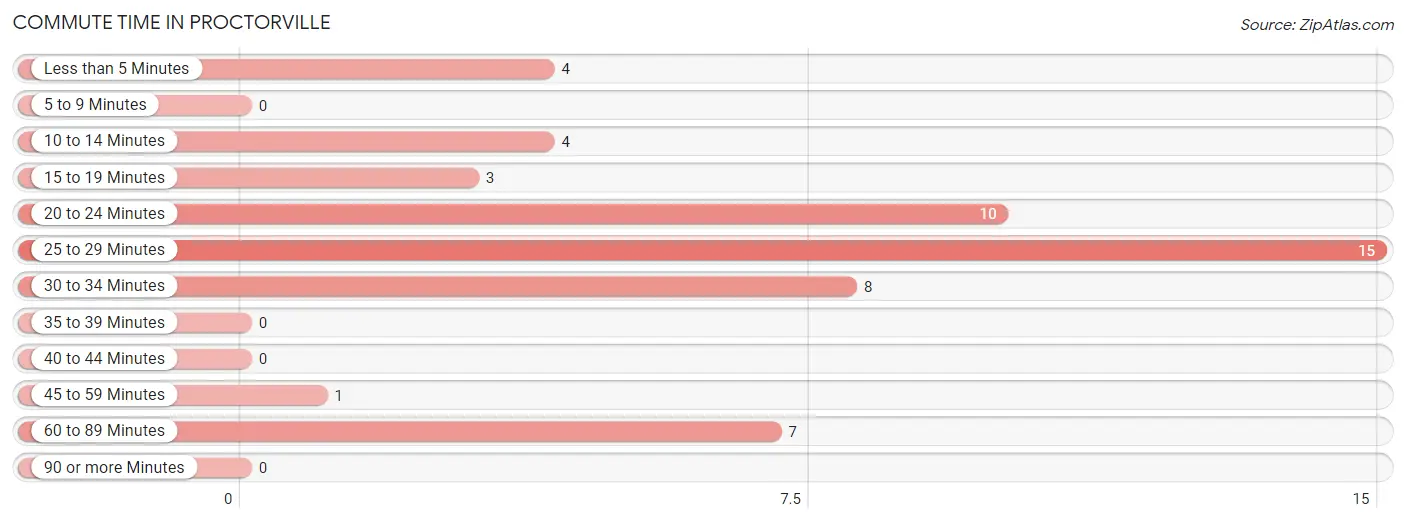
| Commute Time | # Commuters | % Commuters |
| Less than 5 Minutes | 4 | 7.7% |
| 5 to 9 Minutes | 0 | 0.0% |
| 10 to 14 Minutes | 4 | 7.7% |
| 15 to 19 Minutes | 3 | 5.8% |
| 20 to 24 Minutes | 10 | 19.2% |
| 25 to 29 Minutes | 15 | 28.8% |
| 30 to 34 Minutes | 8 | 15.4% |
| 35 to 39 Minutes | 0 | 0.0% |
| 40 to 44 Minutes | 0 | 0.0% |
| 45 to 59 Minutes | 1 | 1.9% |
| 60 to 89 Minutes | 7 | 13.5% |
| 90 or more Minutes | 0 | 0.0% |
Commute Time by Sex in Proctorville
The most common commute times in Proctorville are 20 to 24 minutes (8 commuters, 30.8%) for males and 25 to 29 minutes (13 commuters, 50.0%) for females.
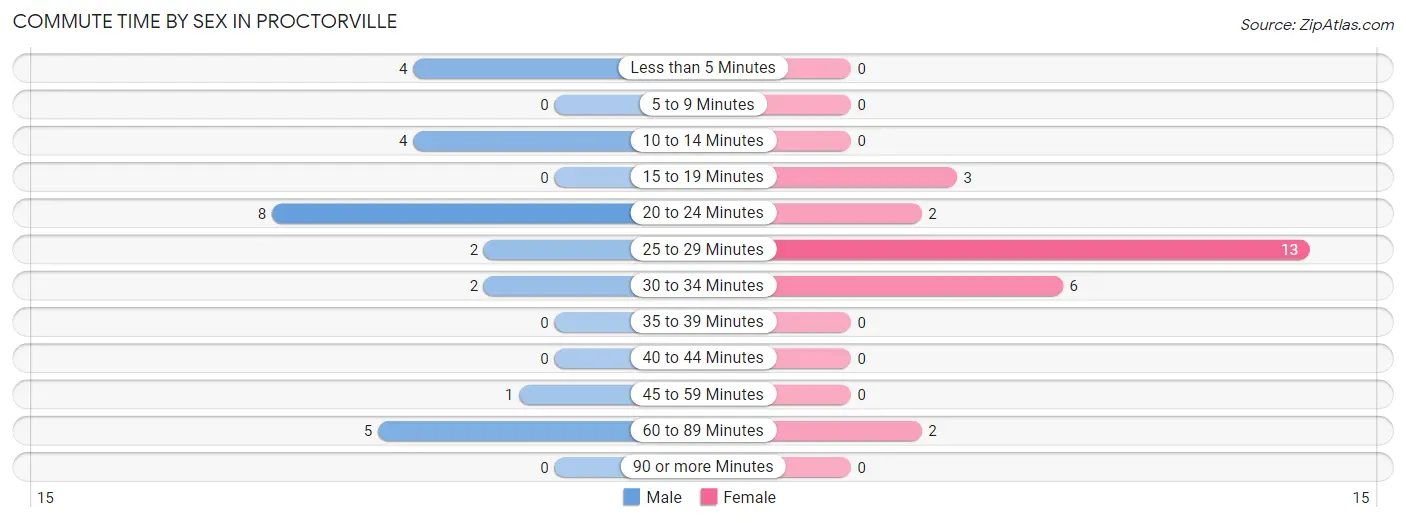
| Commute Time | Male | Female |
| Less than 5 Minutes | 4 (15.4%) | 0 (0.0%) |
| 5 to 9 Minutes | 0 (0.0%) | 0 (0.0%) |
| 10 to 14 Minutes | 4 (15.4%) | 0 (0.0%) |
| 15 to 19 Minutes | 0 (0.0%) | 3 (11.5%) |
| 20 to 24 Minutes | 8 (30.8%) | 2 (7.7%) |
| 25 to 29 Minutes | 2 (7.7%) | 13 (50.0%) |
| 30 to 34 Minutes | 2 (7.7%) | 6 (23.1%) |
| 35 to 39 Minutes | 0 (0.0%) | 0 (0.0%) |
| 40 to 44 Minutes | 0 (0.0%) | 0 (0.0%) |
| 45 to 59 Minutes | 1 (3.8%) | 0 (0.0%) |
| 60 to 89 Minutes | 5 (19.2%) | 2 (7.7%) |
| 90 or more Minutes | 0 (0.0%) | 0 (0.0%) |
Time of Departure to Work by Sex in Proctorville
The most frequent times of departure to work in Proctorville are 7:00 AM to 7:29 AM (8, 30.8%) for males and 7:00 AM to 7:29 AM (7, 26.9%) for females.
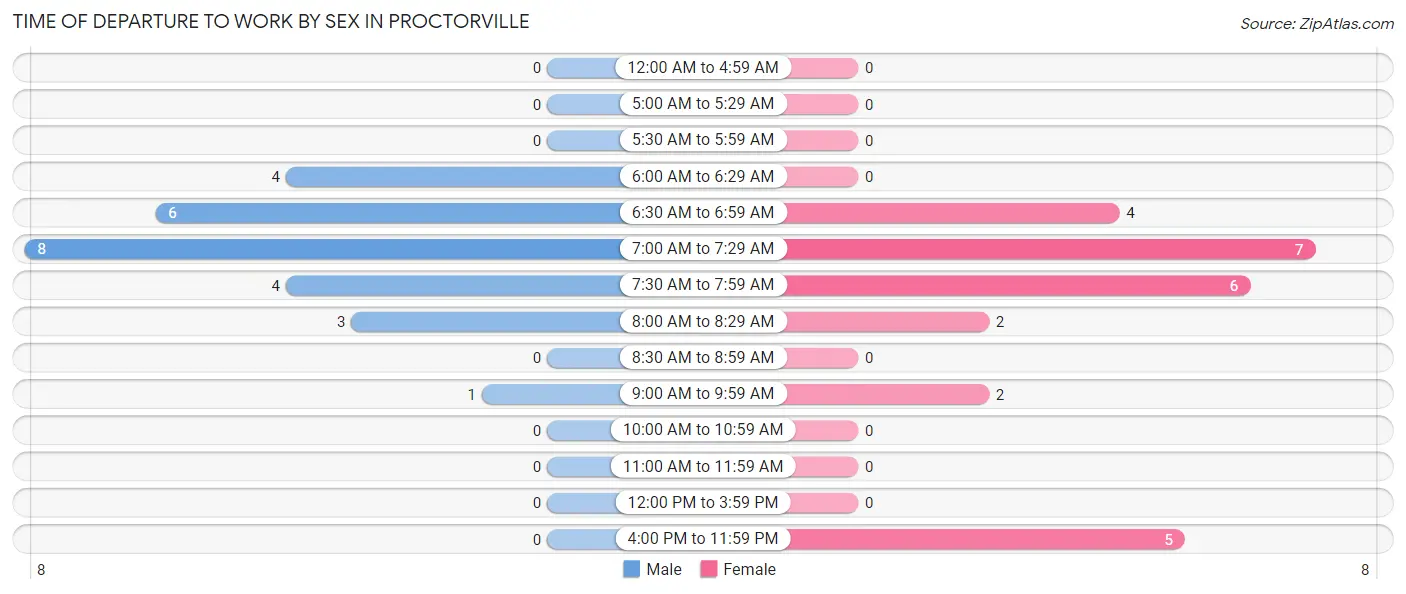
| Time of Departure | Male | Female |
| 12:00 AM to 4:59 AM | 0 (0.0%) | 0 (0.0%) |
| 5:00 AM to 5:29 AM | 0 (0.0%) | 0 (0.0%) |
| 5:30 AM to 5:59 AM | 0 (0.0%) | 0 (0.0%) |
| 6:00 AM to 6:29 AM | 4 (15.4%) | 0 (0.0%) |
| 6:30 AM to 6:59 AM | 6 (23.1%) | 4 (15.4%) |
| 7:00 AM to 7:29 AM | 8 (30.8%) | 7 (26.9%) |
| 7:30 AM to 7:59 AM | 4 (15.4%) | 6 (23.1%) |
| 8:00 AM to 8:29 AM | 3 (11.5%) | 2 (7.7%) |
| 8:30 AM to 8:59 AM | 0 (0.0%) | 0 (0.0%) |
| 9:00 AM to 9:59 AM | 1 (3.8%) | 2 (7.7%) |
| 10:00 AM to 10:59 AM | 0 (0.0%) | 0 (0.0%) |
| 11:00 AM to 11:59 AM | 0 (0.0%) | 0 (0.0%) |
| 12:00 PM to 3:59 PM | 0 (0.0%) | 0 (0.0%) |
| 4:00 PM to 11:59 PM | 0 (0.0%) | 5 (19.2%) |
| Total | 26 (100.0%) | 26 (100.0%) |
Housing Occupancy in Proctorville
Occupancy by Ownership in Proctorville
Of the total 51 dwellings in Proctorville, owner-occupied units account for 38 (74.5%), while renter-occupied units make up 13 (25.5%).
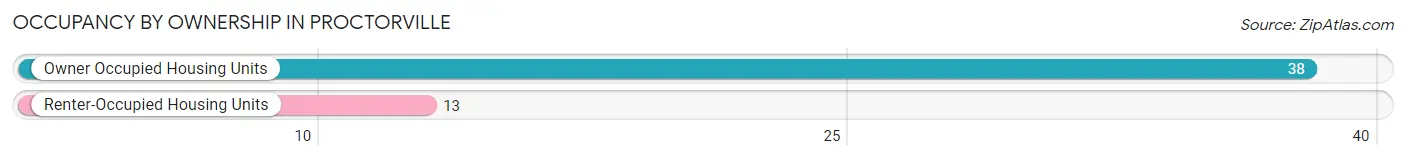
| Occupancy | # Housing Units | % Housing Units |
| Owner Occupied Housing Units | 38 | 74.5% |
| Renter-Occupied Housing Units | 13 | 25.5% |
| Total Occupied Housing Units | 51 | 100.0% |
Occupancy by Household Size in Proctorville
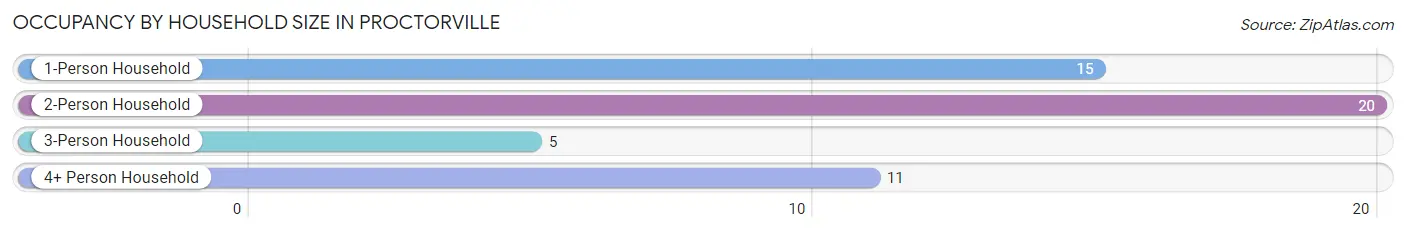
| Household Size | # Housing Units | % Housing Units |
| 1-Person Household | 15 | 29.4% |
| 2-Person Household | 20 | 39.2% |
| 3-Person Household | 5 | 9.8% |
| 4+ Person Household | 11 | 21.6% |
| Total Housing Units | 51 | 100.0% |
Occupancy by Ownership by Household Size in Proctorville
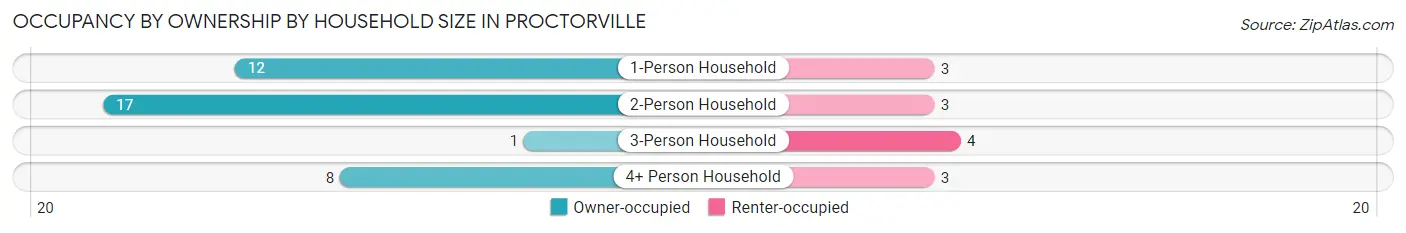
| Household Size | Owner-occupied | Renter-occupied |
| 1-Person Household | 12 (80.0%) | 3 (20.0%) |
| 2-Person Household | 17 (85.0%) | 3 (15.0%) |
| 3-Person Household | 1 (20.0%) | 4 (80.0%) |
| 4+ Person Household | 8 (72.7%) | 3 (27.3%) |
| Total Housing Units | 38 (74.5%) | 13 (25.5%) |
Occupancy by Educational Attainment in Proctorville
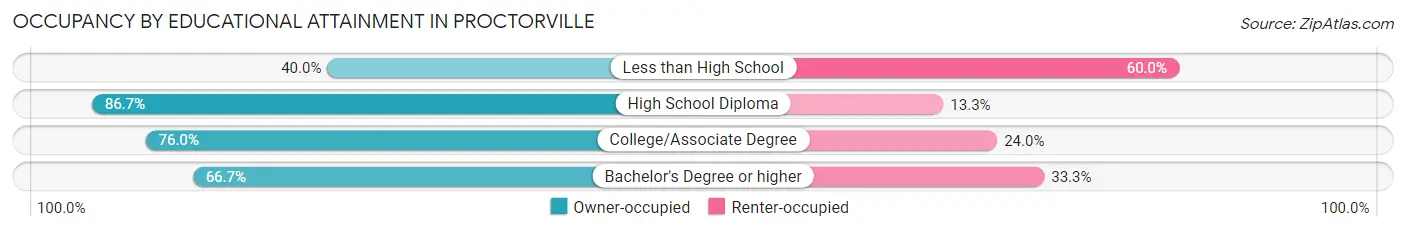
| Household Size | Owner-occupied | Renter-occupied |
| Less than High School | 2 (40.0%) | 3 (60.0%) |
| High School Diploma | 13 (86.7%) | 2 (13.3%) |
| College/Associate Degree | 19 (76.0%) | 6 (24.0%) |
| Bachelor's Degree or higher | 4 (66.7%) | 2 (33.3%) |
Occupancy by Age of Householder in Proctorville
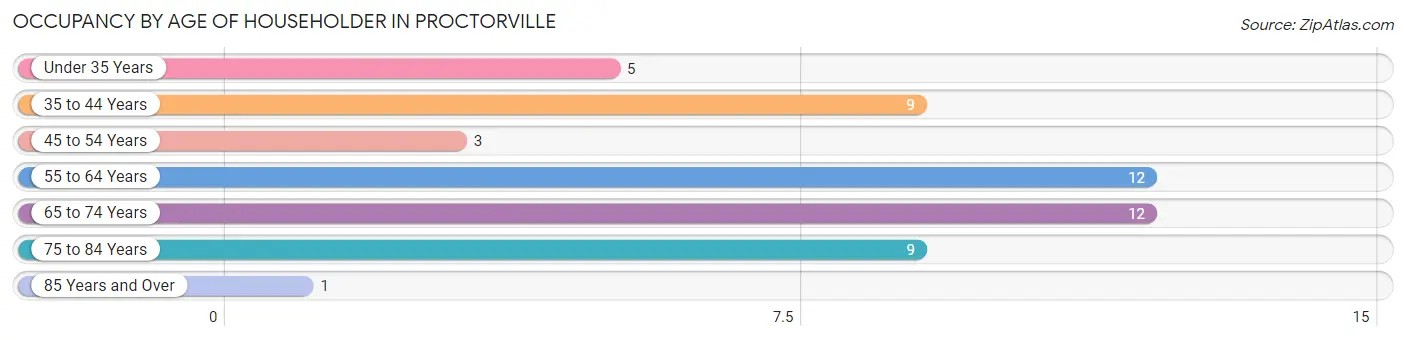
| Age Bracket | # Households | % Households |
| Under 35 Years | 5 | 9.8% |
| 35 to 44 Years | 9 | 17.6% |
| 45 to 54 Years | 3 | 5.9% |
| 55 to 64 Years | 12 | 23.5% |
| 65 to 74 Years | 12 | 23.5% |
| 75 to 84 Years | 9 | 17.6% |
| 85 Years and Over | 1 | 2.0% |
| Total | 51 | 100.0% |
Housing Finances in Proctorville
Median Income by Occupancy in Proctorville
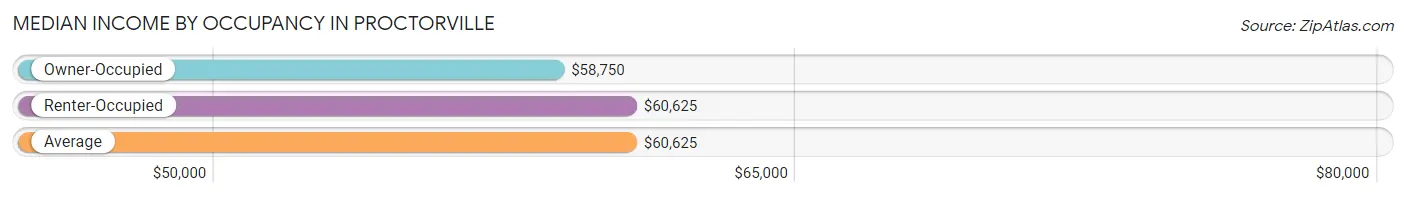
| Occupancy Type | # Households | Median Income |
| Owner-Occupied | 38 (74.5%) | $58,750 |
| Renter-Occupied | 13 (25.5%) | $60,625 |
| Average | 51 (100.0%) | $60,625 |
Occupancy by Householder Income Bracket in Proctorville
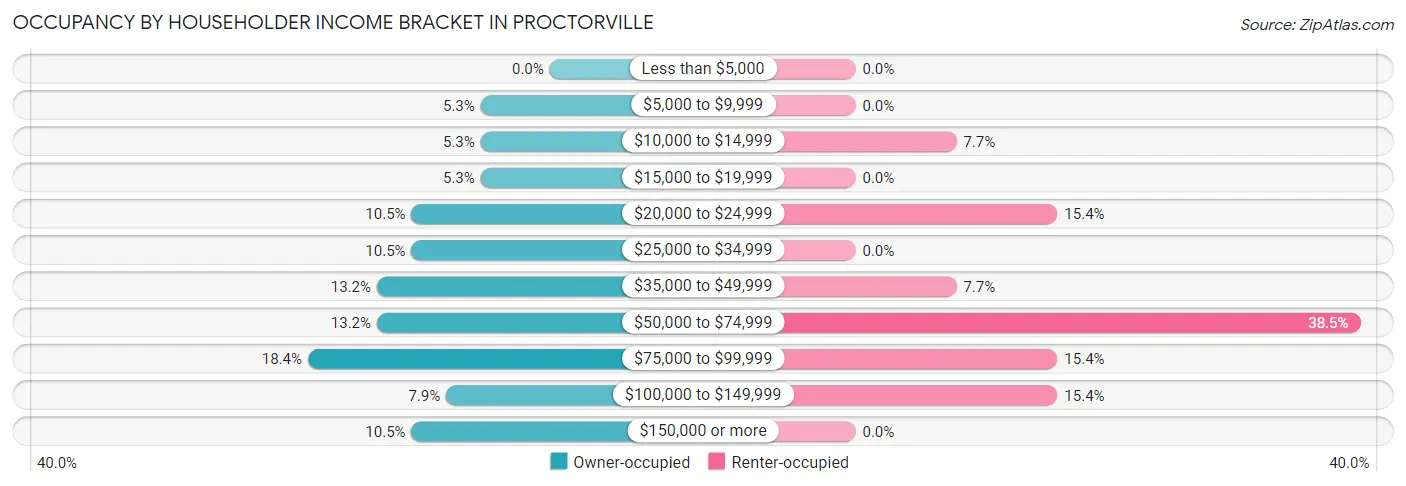
| Income Bracket | Owner-occupied | Renter-occupied |
| Less than $5,000 | 0 (0.0%) | 0 (0.0%) |
| $5,000 to $9,999 | 2 (5.3%) | 0 (0.0%) |
| $10,000 to $14,999 | 2 (5.3%) | 1 (7.7%) |
| $15,000 to $19,999 | 2 (5.3%) | 0 (0.0%) |
| $20,000 to $24,999 | 4 (10.5%) | 2 (15.4%) |
| $25,000 to $34,999 | 4 (10.5%) | 0 (0.0%) |
| $35,000 to $49,999 | 5 (13.2%) | 1 (7.7%) |
| $50,000 to $74,999 | 5 (13.2%) | 5 (38.5%) |
| $75,000 to $99,999 | 7 (18.4%) | 2 (15.4%) |
| $100,000 to $149,999 | 3 (7.9%) | 2 (15.4%) |
| $150,000 or more | 4 (10.5%) | 0 (0.0%) |
| Total | 38 (100.0%) | 13 (100.0%) |
Monthly Housing Cost Tiers in Proctorville
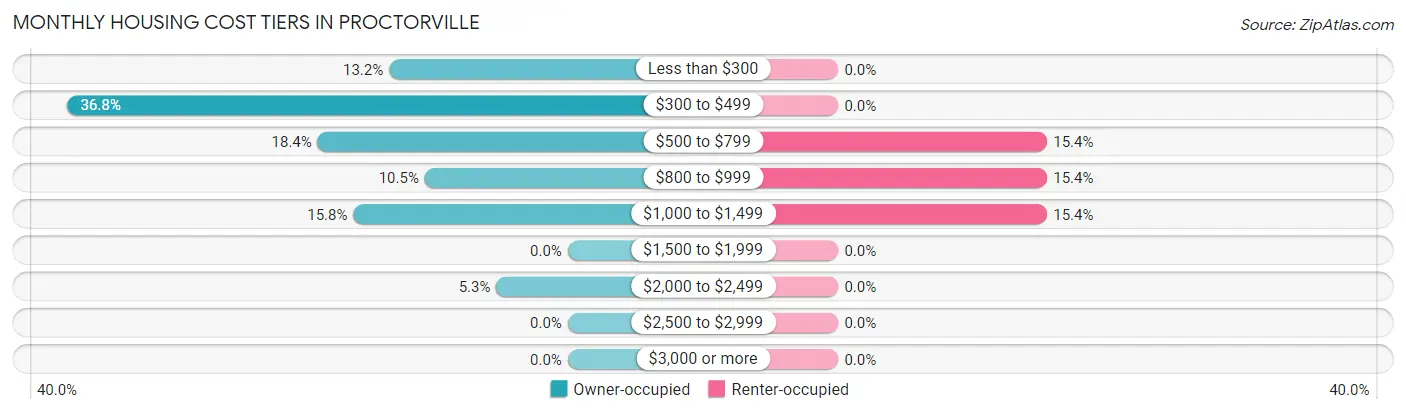
| Monthly Cost | Owner-occupied | Renter-occupied |
| Less than $300 | 5 (13.2%) | 0 (0.0%) |
| $300 to $499 | 14 (36.8%) | 0 (0.0%) |
| $500 to $799 | 7 (18.4%) | 2 (15.4%) |
| $800 to $999 | 4 (10.5%) | 2 (15.4%) |
| $1,000 to $1,499 | 6 (15.8%) | 2 (15.4%) |
| $1,500 to $1,999 | 0 (0.0%) | 0 (0.0%) |
| $2,000 to $2,499 | 2 (5.3%) | 0 (0.0%) |
| $2,500 to $2,999 | 0 (0.0%) | 0 (0.0%) |
| $3,000 or more | 0 (0.0%) | 0 (0.0%) |
| Total | 38 (100.0%) | 13 (100.0%) |
Physical Housing Characteristics in Proctorville
Housing Structures in Proctorville
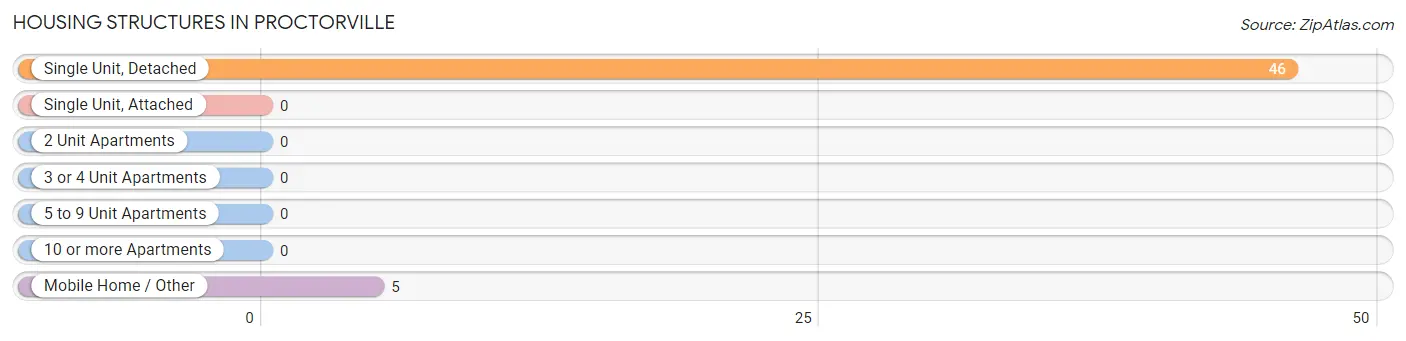
| Structure Type | # Housing Units | % Housing Units |
| Single Unit, Detached | 46 | 90.2% |
| Single Unit, Attached | 0 | 0.0% |
| 2 Unit Apartments | 0 | 0.0% |
| 3 or 4 Unit Apartments | 0 | 0.0% |
| 5 to 9 Unit Apartments | 0 | 0.0% |
| 10 or more Apartments | 0 | 0.0% |
| Mobile Home / Other | 5 | 9.8% |
| Total | 51 | 100.0% |
Housing Structures by Occupancy in Proctorville
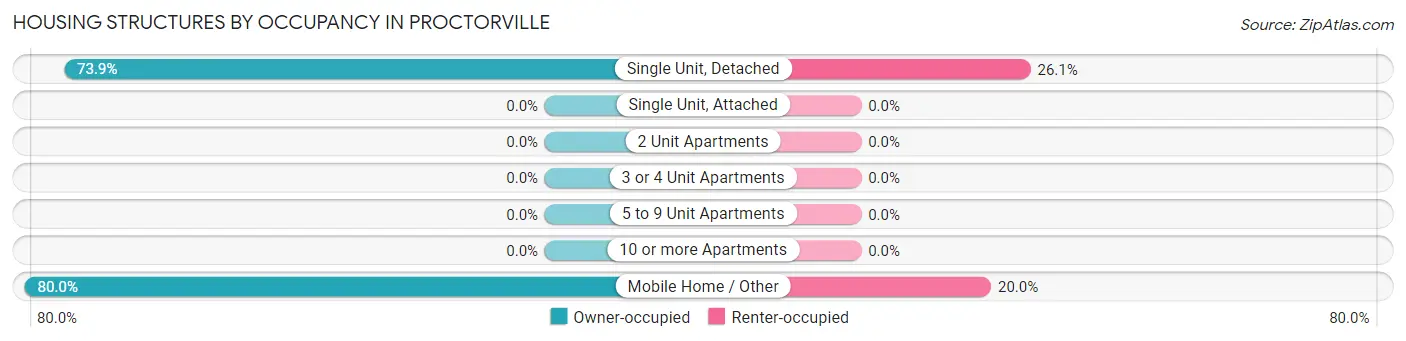
| Structure Type | Owner-occupied | Renter-occupied |
| Single Unit, Detached | 34 (73.9%) | 12 (26.1%) |
| Single Unit, Attached | 0 (0.0%) | 0 (0.0%) |
| 2 Unit Apartments | 0 (0.0%) | 0 (0.0%) |
| 3 or 4 Unit Apartments | 0 (0.0%) | 0 (0.0%) |
| 5 to 9 Unit Apartments | 0 (0.0%) | 0 (0.0%) |
| 10 or more Apartments | 0 (0.0%) | 0 (0.0%) |
| Mobile Home / Other | 4 (80.0%) | 1 (20.0%) |
| Total | 38 (74.5%) | 13 (25.5%) |
Housing Structures by Number of Rooms in Proctorville
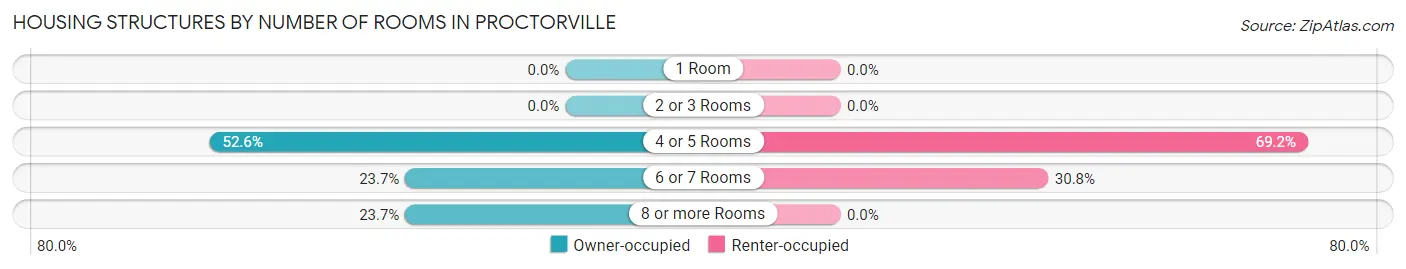
| Number of Rooms | Owner-occupied | Renter-occupied |
| 1 Room | 0 (0.0%) | 0 (0.0%) |
| 2 or 3 Rooms | 0 (0.0%) | 0 (0.0%) |
| 4 or 5 Rooms | 20 (52.6%) | 9 (69.2%) |
| 6 or 7 Rooms | 9 (23.7%) | 4 (30.8%) |
| 8 or more Rooms | 9 (23.7%) | 0 (0.0%) |
| Total | 38 (100.0%) | 13 (100.0%) |
Housing Structure by Heating Type in Proctorville
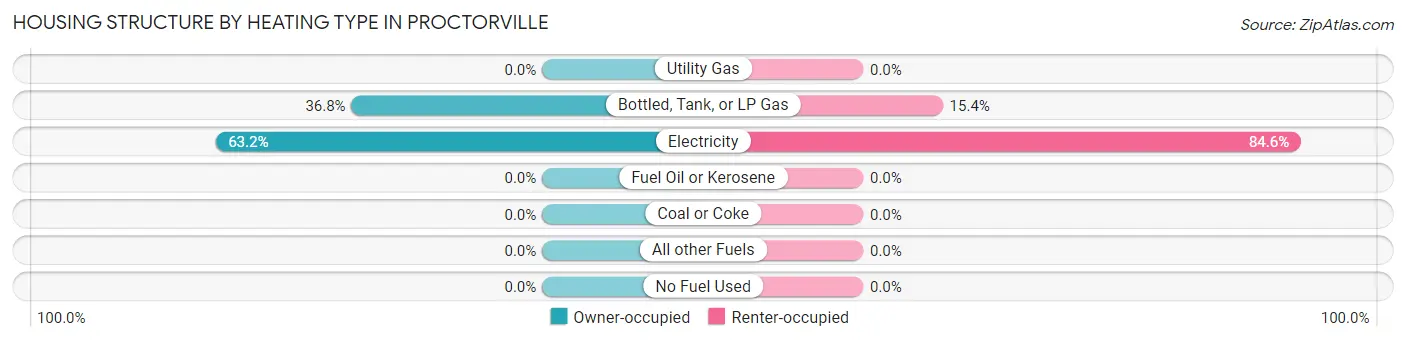
| Heating Type | Owner-occupied | Renter-occupied |
| Utility Gas | 0 (0.0%) | 0 (0.0%) |
| Bottled, Tank, or LP Gas | 14 (36.8%) | 2 (15.4%) |
| Electricity | 24 (63.2%) | 11 (84.6%) |
| Fuel Oil or Kerosene | 0 (0.0%) | 0 (0.0%) |
| Coal or Coke | 0 (0.0%) | 0 (0.0%) |
| All other Fuels | 0 (0.0%) | 0 (0.0%) |
| No Fuel Used | 0 (0.0%) | 0 (0.0%) |
| Total | 38 (100.0%) | 13 (100.0%) |
Household Vehicle Usage in Proctorville
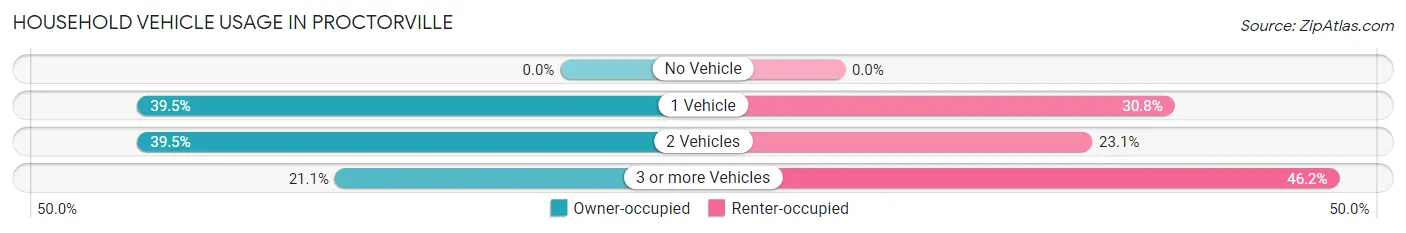
| Vehicles per Household | Owner-occupied | Renter-occupied |
| No Vehicle | 0 (0.0%) | 0 (0.0%) |
| 1 Vehicle | 15 (39.5%) | 4 (30.8%) |
| 2 Vehicles | 15 (39.5%) | 3 (23.1%) |
| 3 or more Vehicles | 8 (21.0%) | 6 (46.2%) |
| Total | 38 (100.0%) | 13 (100.0%) |
Real Estate & Mortgages in Proctorville
Real Estate and Mortgage Overview in Proctorville
| Characteristic | Without Mortgage | With Mortgage |
| Housing Units | 28 | 10 |
| Median Property Value | $84,000 | $95,000 |
| Median Household Income | - | - |
| Monthly Housing Costs | $400 | $0 |
| Real Estate Taxes | $800 | $0 |
Property Value by Mortgage Status in Proctorville
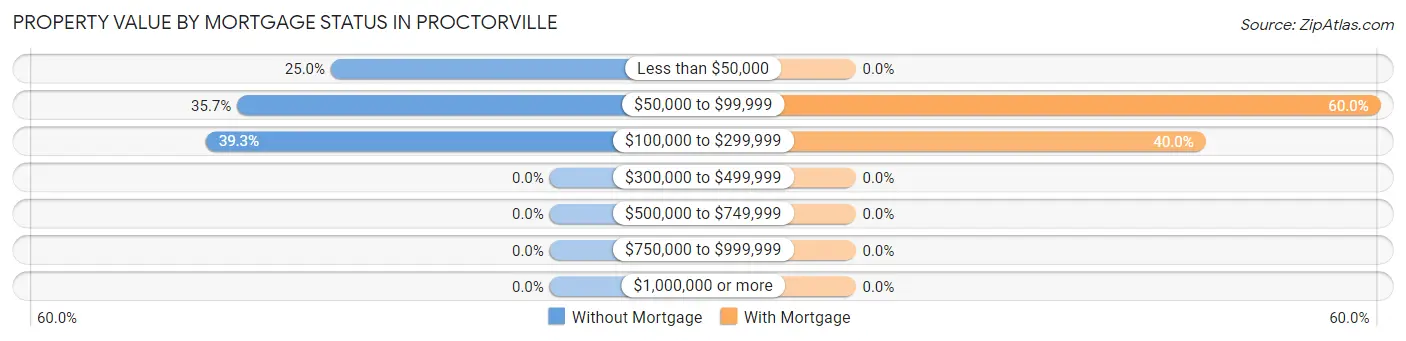
| Property Value | Without Mortgage | With Mortgage |
| Less than $50,000 | 7 (25.0%) | 0 (0.0%) |
| $50,000 to $99,999 | 10 (35.7%) | 6 (60.0%) |
| $100,000 to $299,999 | 11 (39.3%) | 4 (40.0%) |
| $300,000 to $499,999 | 0 (0.0%) | 0 (0.0%) |
| $500,000 to $749,999 | 0 (0.0%) | 0 (0.0%) |
| $750,000 to $999,999 | 0 (0.0%) | 0 (0.0%) |
| $1,000,000 or more | 0 (0.0%) | 0 (0.0%) |
| Total | 28 (100.0%) | 10 (100.0%) |
Household Income by Mortgage Status in Proctorville
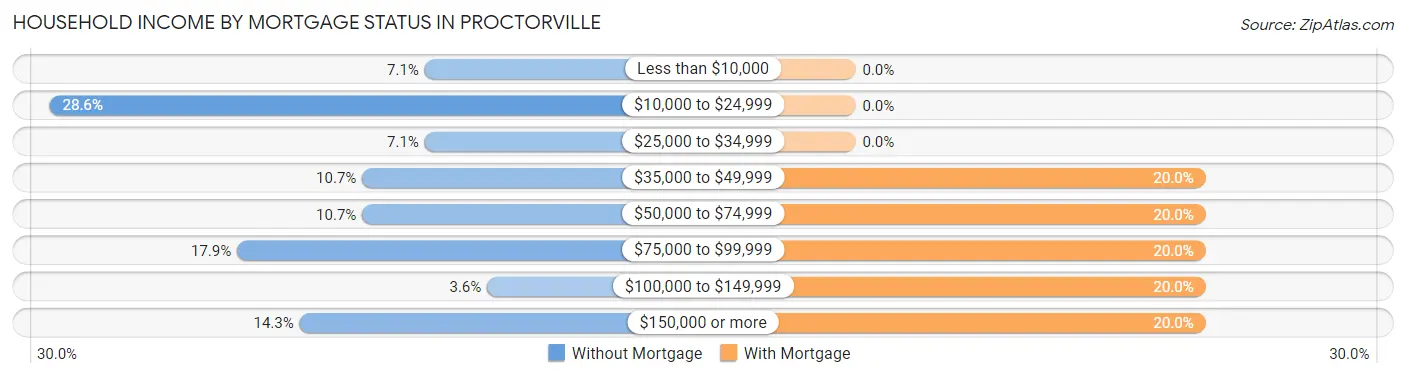
| Household Income | Without Mortgage | With Mortgage |
| Less than $10,000 | 2 (7.1%) | 0 (0.0%) |
| $10,000 to $24,999 | 8 (28.6%) | 0 (0.0%) |
| $25,000 to $34,999 | 2 (7.1%) | 0 (0.0%) |
| $35,000 to $49,999 | 3 (10.7%) | 2 (20.0%) |
| $50,000 to $74,999 | 3 (10.7%) | 2 (20.0%) |
| $75,000 to $99,999 | 5 (17.9%) | 2 (20.0%) |
| $100,000 to $149,999 | 1 (3.6%) | 2 (20.0%) |
| $150,000 or more | 4 (14.3%) | 2 (20.0%) |
| Total | 28 (100.0%) | 10 (100.0%) |
Property Value to Household Income Ratio in Proctorville
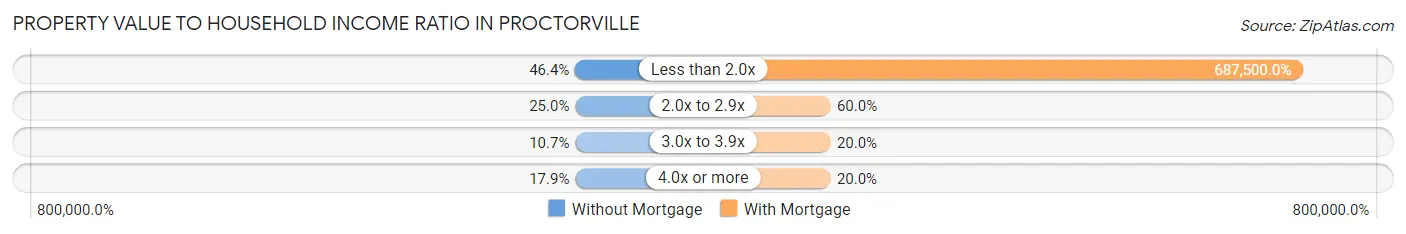
| Value-to-Income Ratio | Without Mortgage | With Mortgage |
| Less than 2.0x | 13 (46.4%) | 68,750 (687,500.0%) |
| 2.0x to 2.9x | 7 (25.0%) | 6 (60.0%) |
| 3.0x to 3.9x | 3 (10.7%) | 2 (20.0%) |
| 4.0x or more | 5 (17.9%) | 2 (20.0%) |
| Total | 28 (100.0%) | 10 (100.0%) |
Real Estate Taxes by Mortgage Status in Proctorville
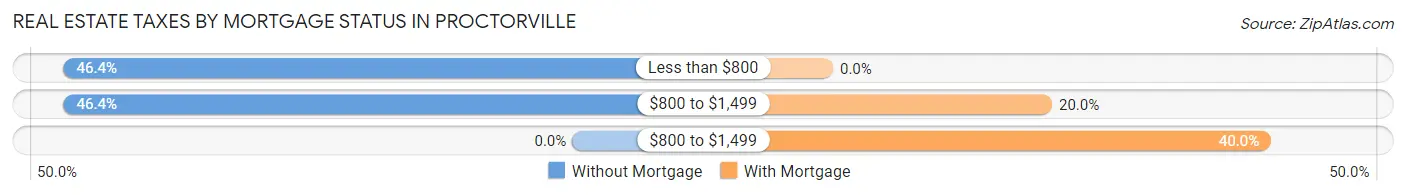
| Property Taxes | Without Mortgage | With Mortgage |
| Less than $800 | 13 (46.4%) | 0 (0.0%) |
| $800 to $1,499 | 13 (46.4%) | 2 (20.0%) |
| $800 to $1,499 | 0 (0.0%) | 4 (40.0%) |
| Total | 28 (100.0%) | 10 (100.0%) |
Health & Disability in Proctorville
Health Insurance Coverage by Age in Proctorville
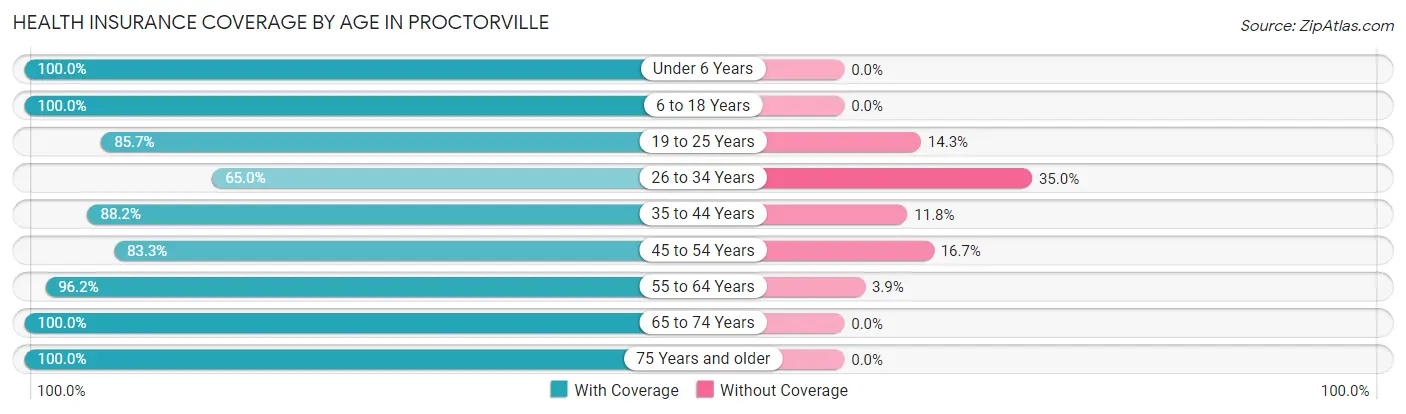
| Age Bracket | With Coverage | Without Coverage |
| Under 6 Years | 6 (100.0%) | 0 (0.0%) |
| 6 to 18 Years | 19 (100.0%) | 0 (0.0%) |
| 19 to 25 Years | 6 (85.7%) | 1 (14.3%) |
| 26 to 34 Years | 13 (65.0%) | 7 (35.0%) |
| 35 to 44 Years | 15 (88.2%) | 2 (11.8%) |
| 45 to 54 Years | 10 (83.3%) | 2 (16.7%) |
| 55 to 64 Years | 25 (96.2%) | 1 (3.8%) |
| 65 to 74 Years | 18 (100.0%) | 0 (0.0%) |
| 75 Years and older | 15 (100.0%) | 0 (0.0%) |
| Total | 127 (90.7%) | 13 (9.3%) |
Health Insurance Coverage by Citizenship Status in Proctorville
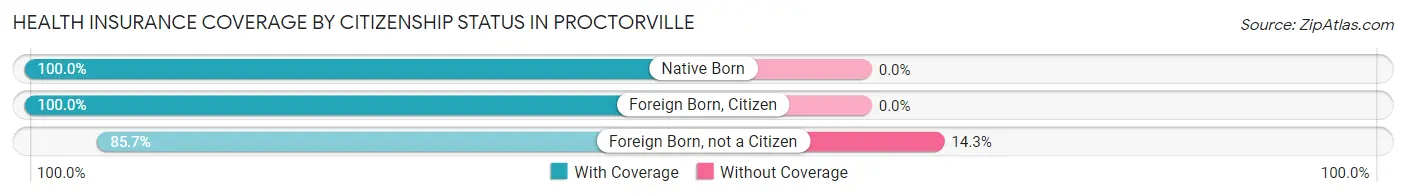
| Citizenship Status | With Coverage | Without Coverage |
| Native Born | 6 (100.0%) | 0 (0.0%) |
| Foreign Born, Citizen | 19 (100.0%) | 0 (0.0%) |
| Foreign Born, not a Citizen | 6 (85.7%) | 1 (14.3%) |
Health Insurance Coverage by Household Income in Proctorville
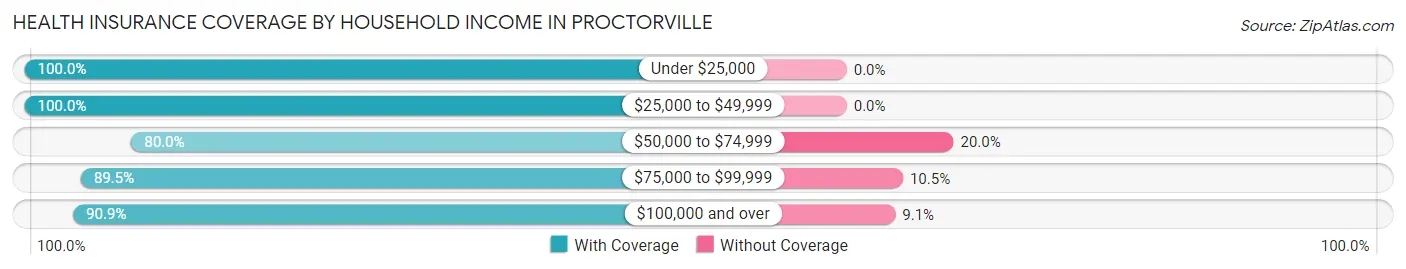
| Household Income | With Coverage | Without Coverage |
| Under $25,000 | 20 (100.0%) | 0 (0.0%) |
| $25,000 to $49,999 | 25 (100.0%) | 0 (0.0%) |
| $50,000 to $74,999 | 28 (80.0%) | 7 (20.0%) |
| $75,000 to $99,999 | 34 (89.5%) | 4 (10.5%) |
| $100,000 and over | 20 (90.9%) | 2 (9.1%) |
Public vs Private Health Insurance Coverage by Age in Proctorville
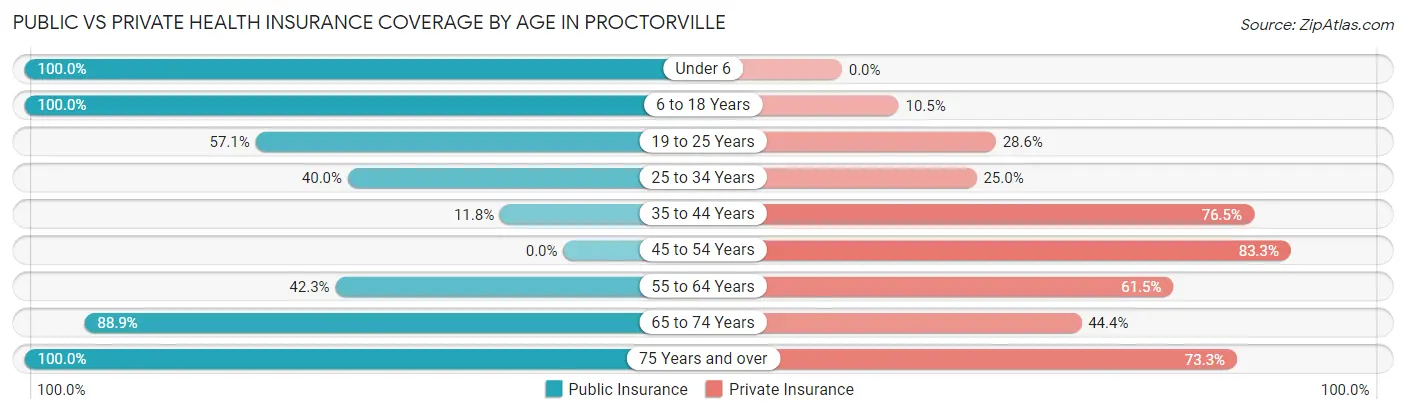
| Age Bracket | Public Insurance | Private Insurance |
| Under 6 | 6 (100.0%) | 0 (0.0%) |
| 6 to 18 Years | 19 (100.0%) | 2 (10.5%) |
| 19 to 25 Years | 4 (57.1%) | 2 (28.6%) |
| 25 to 34 Years | 8 (40.0%) | 5 (25.0%) |
| 35 to 44 Years | 2 (11.8%) | 13 (76.5%) |
| 45 to 54 Years | 0 (0.0%) | 10 (83.3%) |
| 55 to 64 Years | 11 (42.3%) | 16 (61.5%) |
| 65 to 74 Years | 16 (88.9%) | 8 (44.4%) |
| 75 Years and over | 15 (100.0%) | 11 (73.3%) |
| Total | 81 (57.9%) | 67 (47.9%) |
Disability Status by Sex by Age in Proctorville
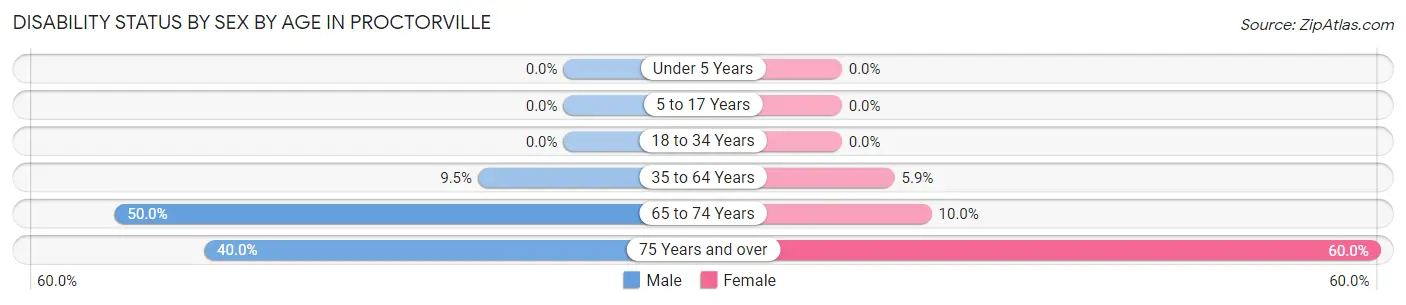
| Age Bracket | Male | Female |
| Under 5 Years | 0 (0.0%) | 0 (0.0%) |
| 5 to 17 Years | 0 (0.0%) | 0 (0.0%) |
| 18 to 34 Years | 0 (0.0%) | 0 (0.0%) |
| 35 to 64 Years | 2 (9.5%) | 2 (5.9%) |
| 65 to 74 Years | 4 (50.0%) | 1 (10.0%) |
| 75 Years and over | 2 (40.0%) | 6 (60.0%) |
Disability Class by Sex by Age in Proctorville
Disability Class: Hearing Difficulty
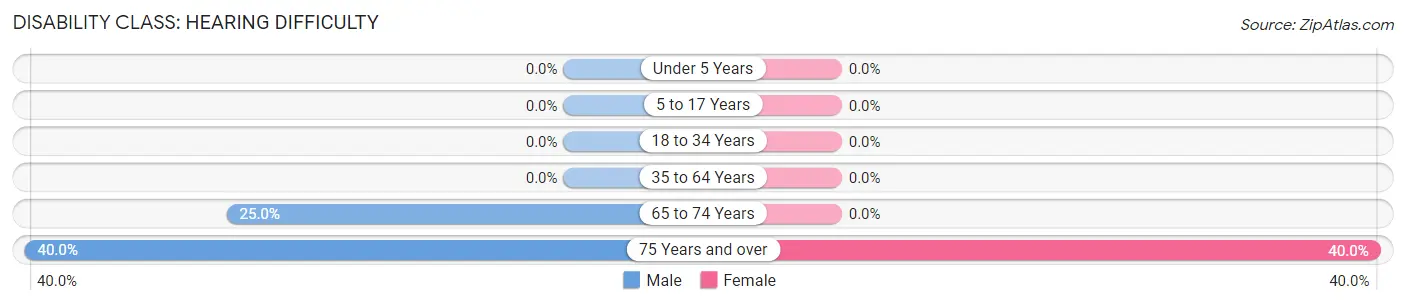
| Age Bracket | Male | Female |
| Under 5 Years | 0 (0.0%) | 0 (0.0%) |
| 5 to 17 Years | 0 (0.0%) | 0 (0.0%) |
| 18 to 34 Years | 0 (0.0%) | 0 (0.0%) |
| 35 to 64 Years | 0 (0.0%) | 0 (0.0%) |
| 65 to 74 Years | 2 (25.0%) | 0 (0.0%) |
| 75 Years and over | 2 (40.0%) | 4 (40.0%) |
Disability Class: Vision Difficulty
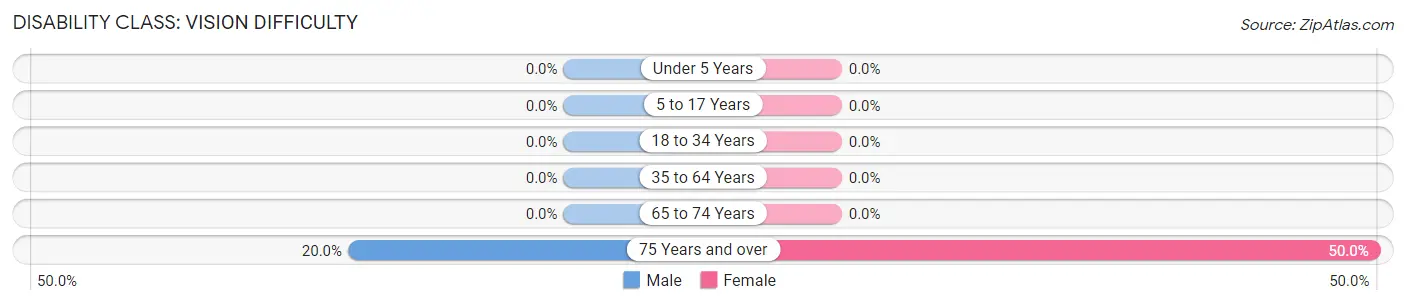
| Age Bracket | Male | Female |
| Under 5 Years | 0 (0.0%) | 0 (0.0%) |
| 5 to 17 Years | 0 (0.0%) | 0 (0.0%) |
| 18 to 34 Years | 0 (0.0%) | 0 (0.0%) |
| 35 to 64 Years | 0 (0.0%) | 0 (0.0%) |
| 65 to 74 Years | 0 (0.0%) | 0 (0.0%) |
| 75 Years and over | 1 (20.0%) | 5 (50.0%) |
Disability Class: Cognitive Difficulty
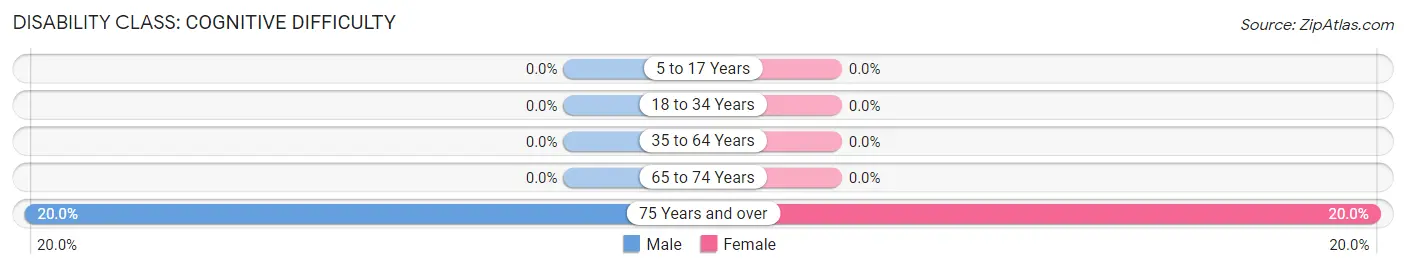
| Age Bracket | Male | Female |
| 5 to 17 Years | 0 (0.0%) | 0 (0.0%) |
| 18 to 34 Years | 0 (0.0%) | 0 (0.0%) |
| 35 to 64 Years | 0 (0.0%) | 0 (0.0%) |
| 65 to 74 Years | 0 (0.0%) | 0 (0.0%) |
| 75 Years and over | 1 (20.0%) | 2 (20.0%) |
Disability Class: Ambulatory Difficulty
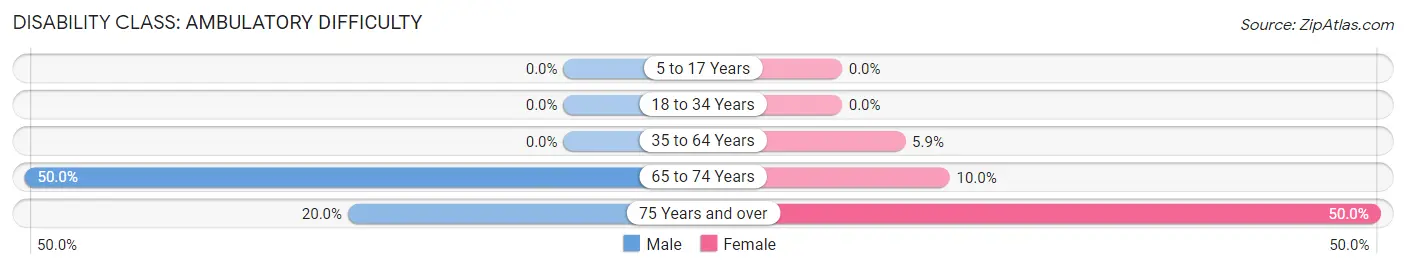
| Age Bracket | Male | Female |
| 5 to 17 Years | 0 (0.0%) | 0 (0.0%) |
| 18 to 34 Years | 0 (0.0%) | 0 (0.0%) |
| 35 to 64 Years | 0 (0.0%) | 2 (5.9%) |
| 65 to 74 Years | 4 (50.0%) | 1 (10.0%) |
| 75 Years and over | 1 (20.0%) | 5 (50.0%) |
Disability Class: Self-Care Difficulty
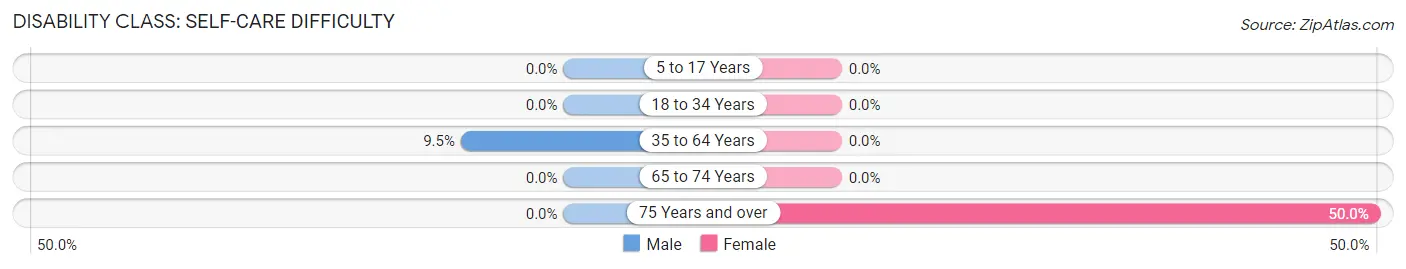
| Age Bracket | Male | Female |
| 5 to 17 Years | 0 (0.0%) | 0 (0.0%) |
| 18 to 34 Years | 0 (0.0%) | 0 (0.0%) |
| 35 to 64 Years | 2 (9.5%) | 0 (0.0%) |
| 65 to 74 Years | 0 (0.0%) | 0 (0.0%) |
| 75 Years and over | 0 (0.0%) | 5 (50.0%) |
Technology Access in Proctorville
Computing Device Access in Proctorville
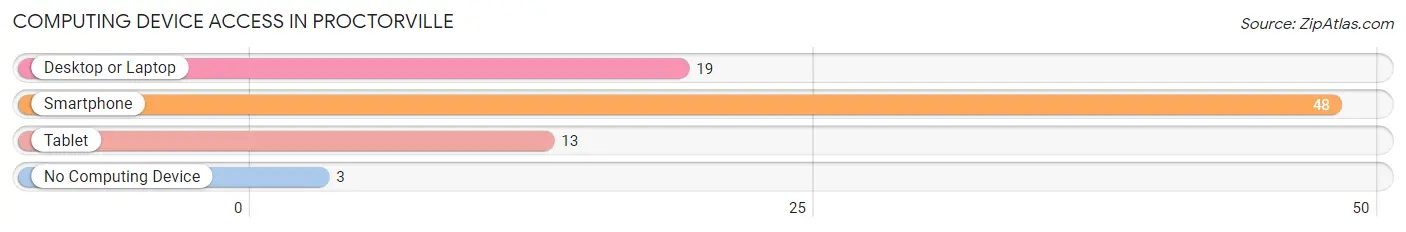
| Device Type | # Households | % Households |
| Desktop or Laptop | 19 | 37.2% |
| Smartphone | 48 | 94.1% |
| Tablet | 13 | 25.5% |
| No Computing Device | 3 | 5.9% |
| Total | 51 | 100.0% |
Internet Access in Proctorville
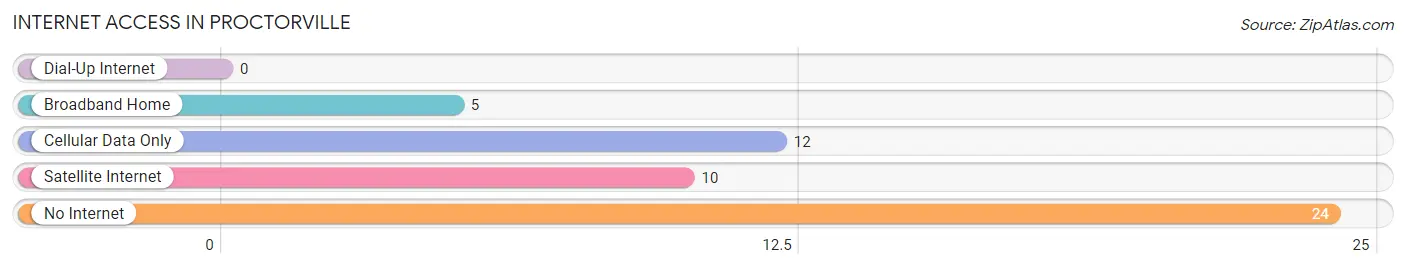
| Internet Type | # Households | % Households |
| Dial-Up Internet | 0 | 0.0% |
| Broadband Home | 5 | 9.8% |
| Cellular Data Only | 12 | 23.5% |
| Satellite Internet | 10 | 19.6% |
| No Internet | 24 | 47.1% |
| Total | 51 | 100.0% |
Proctorville Summary
Proctorville is a small unincorporated community located in North Carolina, in the United States. It is situated in the northeastern part of the state, in the county of Bertie. The population of Proctorville was estimated to be around 1,000 people in 2020.
History
Proctorville was founded in the late 19th century by a man named William Proctor. He was a former slave who had been freed after the Civil War. He purchased a large tract of land in the area and began to develop it. He built a store, a post office, and a school. He also built a church and a cemetery. The town was named after him in recognition of his efforts.
The town grew slowly over the years, but it was not until the 1950s that it began to experience significant growth. This was due to the construction of a nearby military base, which brought many new people to the area. The town also benefited from the development of the nearby Roanoke River, which provided a source of transportation and commerce.
Geography
Proctorville is located in the northeastern part of North Carolina, in the county of Bertie. It is situated on the banks of the Roanoke River, which provides a source of transportation and commerce. The town is surrounded by forests and farmland, and is located about 30 miles from the city of Elizabeth City.
The climate in Proctorville is humid subtropical, with hot summers and mild winters. The average annual temperature is around 70 degrees Fahrenheit. The average annual precipitation is around 45 inches.
Economy
The economy of Proctorville is largely based on agriculture and forestry. The town is home to several farms, which produce a variety of crops, including corn, soybeans, and cotton. The nearby forests provide a source of timber, which is used for construction and other purposes.
The town also has a few small businesses, including a grocery store, a hardware store, and a few restaurants. There is also a post office and a bank.
Demographics
The population of Proctorville was estimated to be around 1,000 people in 2020. The majority of the population is white, with a small percentage of African Americans and other races. The median household income is around $35,000, and the median home value is around $150,000.
The town is served by the Bertie County School District, which provides education for students from kindergarten through 12th grade. There are also several churches in the area, including Baptist, Methodist, and Presbyterian.
Conclusion
Proctorville is a small unincorporated community located in North Carolina, in the United States. It was founded in the late 19th century by a former slave, and has since grown to a population of around 1,000 people. The economy of Proctorville is largely based on agriculture and forestry, and the town is served by the Bertie County School District. The median household income is around $35,000, and the median home value is around $150,000.
Common Questions
What is Per Capita Income in Proctorville?
Per Capita income in Proctorville is $27,199.
What is the Median Family Income in Proctorville?
Median Family Income in Proctorville is $68,125.
What is the Median Household income in Proctorville?
Median Household Income in Proctorville is $60,625.
What is Income or Wage Gap in Proctorville?
Income or Wage Gap in Proctorville is 21.2%.
Women in Proctorville earn 78.8 cents for every dollar earned by a man.
What is Inequality or Gini Index in Proctorville?
Inequality or Gini Index in Proctorville is 0.42.
What is the Total Population of Proctorville?
Total Population of Proctorville is 140.
What is the Total Male Population of Proctorville?
Total Male Population of Proctorville is 58.
What is the Total Female Population of Proctorville?
Total Female Population of Proctorville is 82.
What is the Ratio of Males per 100 Females in Proctorville?
There are 70.73 Males per 100 Females in Proctorville.
What is the Ratio of Females per 100 Males in Proctorville?
There are 141.38 Females per 100 Males in Proctorville.
What is the Median Population Age in Proctorville?
Median Population Age in Proctorville is 46.5 Years.
What is the Average Family Size in Proctorville
Average Family Size in Proctorville is 3.5 People.
What is the Average Household Size in Proctorville
Average Household Size in Proctorville is 2.8 People.
How Large is the Labor Force in Proctorville?
There are 52 People in the Labor Forcein in Proctorville.
What is the Percentage of People in the Labor Force in Proctorville?
42.3% of People are in the Labor Force in Proctorville.