Zip Codes with the Highest Percentage of Population Employed in Real Estate, Rental & Leasing in Independence, MO
RELATED REPORTS & OPTIONS
Real Estate, Rental & Leasing
Independence
Compare Zip Codes
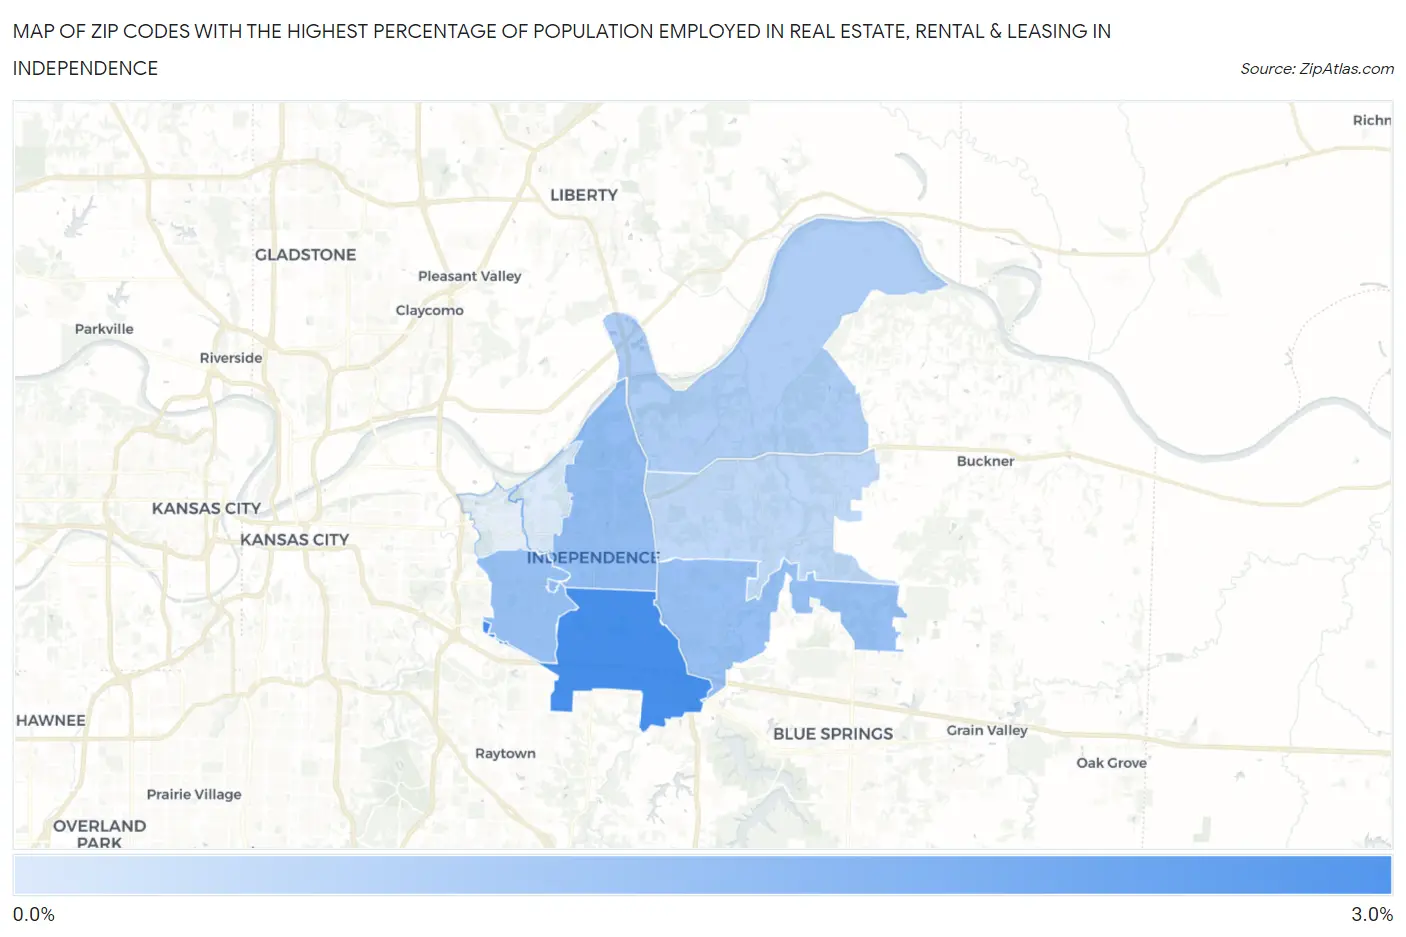
Map of Zip Codes with the Highest Percentage of Population Employed in Real Estate, Rental & Leasing in Independence
0.65%
2.7%
Zip Codes with the Highest Percentage of Population Employed in Real Estate, Rental & Leasing in Independence, MO
| Zip Code | % Employed | vs State | vs National | |
| 1. | 64055 | 2.7% | 1.6%(+1.08)#107 | 1.9%(+0.821)#4,708 |
| 2. | 64050 | 1.6% | 1.6%(+0.016)#230 | 1.9%(-0.245)#10,138 |
| 3. | 64052 | 1.6% | 1.6%(-0.028)#236 | 1.9%(-0.288)#10,419 |
| 4. | 64057 | 1.6% | 1.6%(-0.030)#237 | 1.9%(-0.291)#10,436 |
| 5. | 64058 | 1.3% | 1.6%(-0.341)#305 | 1.9%(-0.602)#12,799 |
| 6. | 64056 | 1.0% | 1.6%(-0.586)#349 | 1.9%(-0.847)#14,757 |
| 7. | 64054 | 0.65% | 1.6%(-0.985)#439 | 1.9%(-1.25)#17,910 |
1
Common Questions
What are the Top 5 Zip Codes with the Highest Percentage of Population Employed in Real Estate, Rental & Leasing in Independence, MO?
Top 5 Zip Codes with the Highest Percentage of Population Employed in Real Estate, Rental & Leasing in Independence, MO are:
What zip code has the Highest Percentage of Population Employed in Real Estate, Rental & Leasing in Independence, MO?
64055 has the Highest Percentage of Population Employed in Real Estate, Rental & Leasing in Independence, MO with 2.7%.
What is the Percentage of Population Employed in Real Estate, Rental & Leasing in Independence, MO?
Percentage of Population Employed in Real Estate, Rental & Leasing in Independence is 1.7%.
What is the Percentage of Population Employed in Real Estate, Rental & Leasing in Missouri?
Percentage of Population Employed in Real Estate, Rental & Leasing in Missouri is 1.6%.
What is the Percentage of Population Employed in Real Estate, Rental & Leasing in the United States?
Percentage of Population Employed in Real Estate, Rental & Leasing in the United States is 1.9%.