Zip Codes with the Highest Percentage of Population Employed in Real Estate, Rental & Leasing in O Fallon, MO
RELATED REPORTS & OPTIONS
Real Estate, Rental & Leasing
O Fallon
Compare Zip Codes
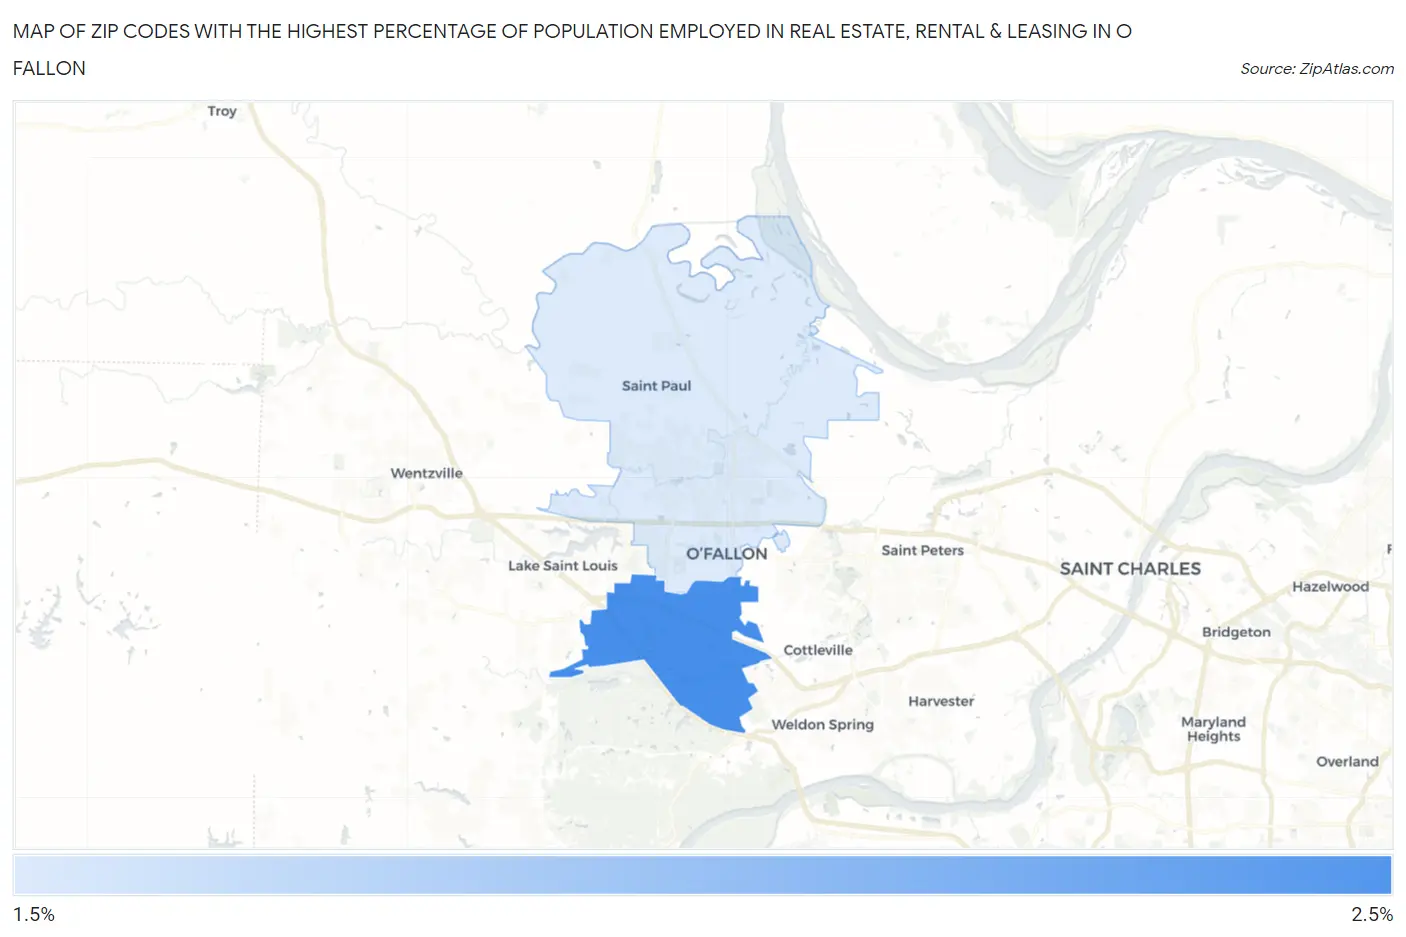
Map of Zip Codes with the Highest Percentage of Population Employed in Real Estate, Rental & Leasing in O Fallon
1.8%
2.2%
Zip Codes with the Highest Percentage of Population Employed in Real Estate, Rental & Leasing in O Fallon, MO
| Zip Code | % Employed | vs State | vs National | |
| 1. | 63368 | 2.2% | 1.6%(+0.523)#169 | 1.9%(+0.262)#7,049 |
| 2. | 63366 | 1.8% | 1.6%(+0.210)#205 | 1.9%(-0.050)#8,854 |
1
Common Questions
What are the Top Zip Codes with the Highest Percentage of Population Employed in Real Estate, Rental & Leasing in O Fallon, MO?
Top Zip Codes with the Highest Percentage of Population Employed in Real Estate, Rental & Leasing in O Fallon, MO are:
What zip code has the Highest Percentage of Population Employed in Real Estate, Rental & Leasing in O Fallon, MO?
63368 has the Highest Percentage of Population Employed in Real Estate, Rental & Leasing in O Fallon, MO with 2.2%.
What is the Percentage of Population Employed in Real Estate, Rental & Leasing in O Fallon, MO?
Percentage of Population Employed in Real Estate, Rental & Leasing in O Fallon is 2.0%.
What is the Percentage of Population Employed in Real Estate, Rental & Leasing in Missouri?
Percentage of Population Employed in Real Estate, Rental & Leasing in Missouri is 1.6%.
What is the Percentage of Population Employed in Real Estate, Rental & Leasing in the United States?
Percentage of Population Employed in Real Estate, Rental & Leasing in the United States is 1.9%.