Homestown, MO Map & Demographics
Homestown Map
Homestown Overview
$23,465
PER CAPITA INCOME
$82,763
AVG FAMILY INCOME
0.35
INEQUALITY / GINI INDEX
120
TOTAL POPULATION
49
MALE POPULATION
71
FEMALE POPULATION
69.01
MALES / 100 FEMALES
144.90
FEMALES / 100 MALES
56.5
MEDIAN AGE
2.6
AVG FAMILY SIZE
2.1
AVG HOUSEHOLD SIZE
52
LABOR FORCE [ PEOPLE ]
45.2%
PERCENT IN LABOR FORCE
1.9%
UNEMPLOYMENT RATE
Homestown Area Codes
Income in Homestown
Income Overview in Homestown
| Characteristic | Number | Measure |
| Per Capita Income | 120 | $23,465 |
| Median Family Income | 34 | $82,763 |
| Mean Family Income | 34 | $66,974 |
| Median Household Income | 58 | $0 |
| Mean Household Income | 58 | $51,836 |
| Income Deficit | 34 | $0 |
| Wage / Income Gap (%) | 120 | 0.00% |
| Wage / Income Gap ($) | 120 | 100.00¢ per $1 |
| Gini / Inequality Index | 120 | 0.35 |
Earnings by Sex in Homestown
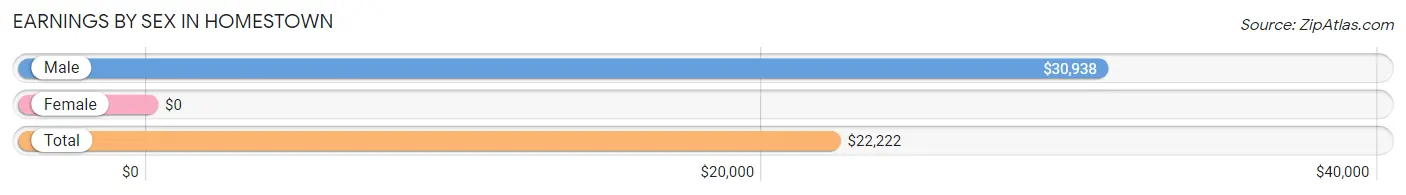
| Sex | Number | Average Earnings |
| Male | 11 (19.6%) | $30,938 |
| Female | 45 (80.4%) | $0 |
| Total | 56 (100.0%) | $22,222 |
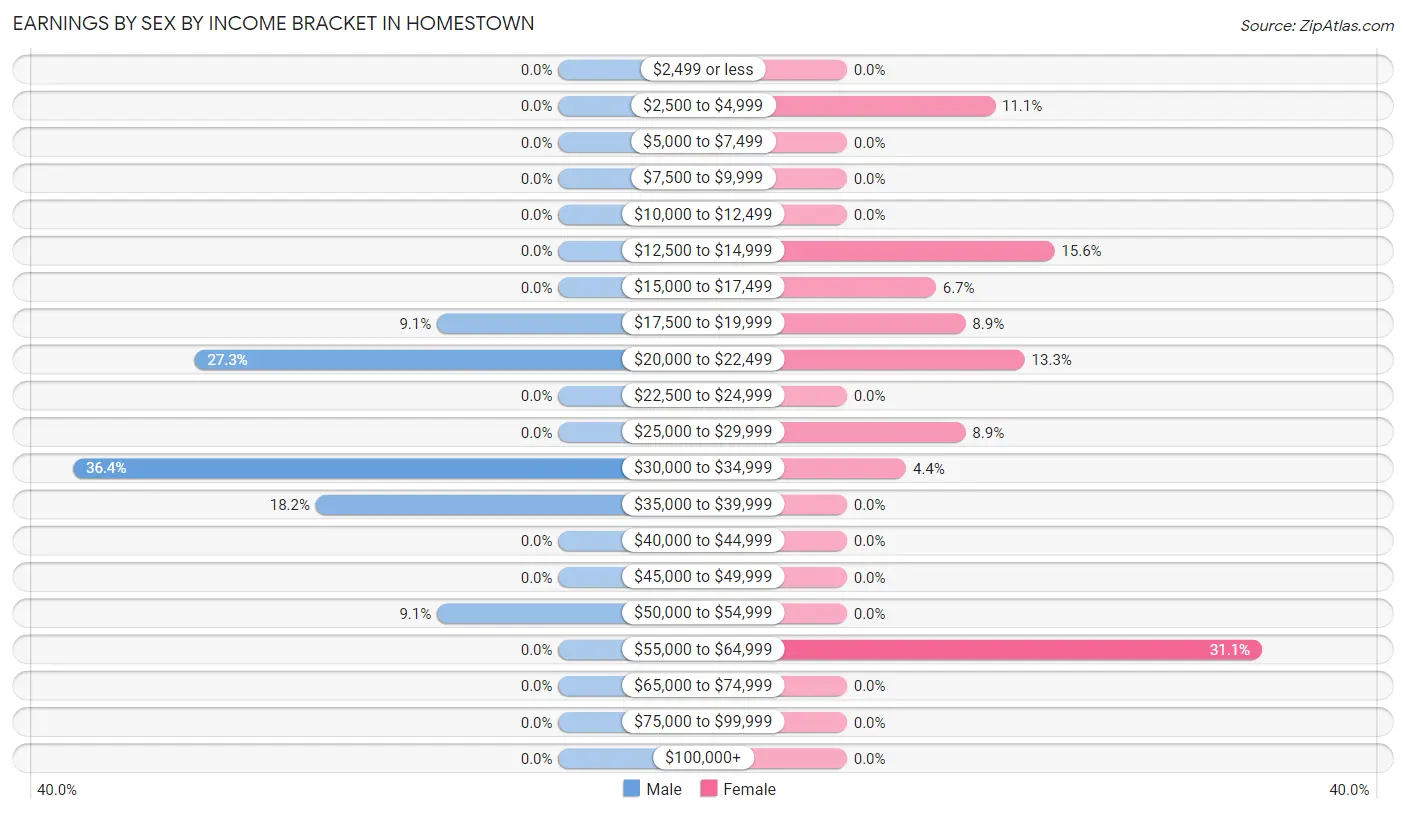
Earnings by Sex by Income Bracket in Homestown
The most common earnings brackets in Homestown are $30,000 to $34,999 for men (4 | 36.4%) and $55,000 to $64,999 for women (14 | 31.1%).
| Income | Male | Female |
| $2,499 or less | 0 (0.0%) | 0 (0.0%) |
| $2,500 to $4,999 | 0 (0.0%) | 5 (11.1%) |
| $5,000 to $7,499 | 0 (0.0%) | 0 (0.0%) |
| $7,500 to $9,999 | 0 (0.0%) | 0 (0.0%) |
| $10,000 to $12,499 | 0 (0.0%) | 0 (0.0%) |
| $12,500 to $14,999 | 0 (0.0%) | 7 (15.6%) |
| $15,000 to $17,499 | 0 (0.0%) | 3 (6.7%) |
| $17,500 to $19,999 | 1 (9.1%) | 4 (8.9%) |
| $20,000 to $22,499 | 3 (27.3%) | 6 (13.3%) |
| $22,500 to $24,999 | 0 (0.0%) | 0 (0.0%) |
| $25,000 to $29,999 | 0 (0.0%) | 4 (8.9%) |
| $30,000 to $34,999 | 4 (36.4%) | 2 (4.4%) |
| $35,000 to $39,999 | 2 (18.2%) | 0 (0.0%) |
| $40,000 to $44,999 | 0 (0.0%) | 0 (0.0%) |
| $45,000 to $49,999 | 0 (0.0%) | 0 (0.0%) |
| $50,000 to $54,999 | 1 (9.1%) | 0 (0.0%) |
| $55,000 to $64,999 | 0 (0.0%) | 14 (31.1%) |
| $65,000 to $74,999 | 0 (0.0%) | 0 (0.0%) |
| $75,000 to $99,999 | 0 (0.0%) | 0 (0.0%) |
| $100,000+ | 0 (0.0%) | 0 (0.0%) |
| Total | 11 (100.0%) | 45 (100.0%) |
Earnings by Sex by Educational Attainment in Homestown
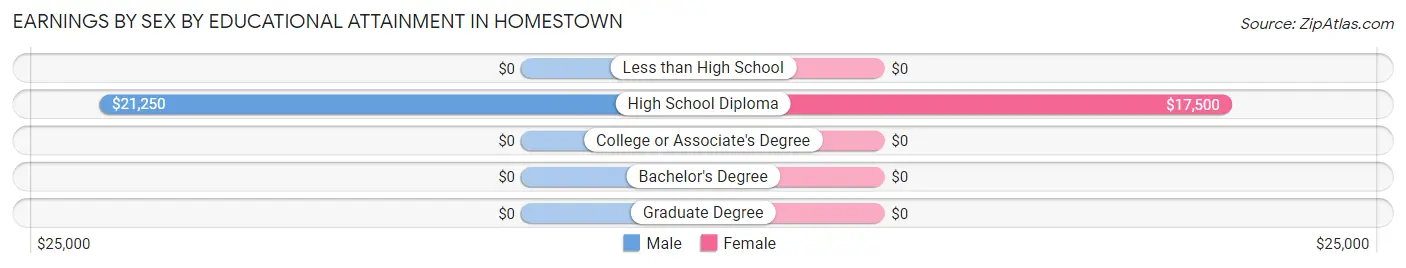
| Educational Attainment | Male Income | Female Income |
| Less than High School | - | - |
| High School Diploma | $21,250 | $17,500 |
| College or Associate's Degree | - | - |
| Bachelor's Degree | - | - |
| Graduate Degree | - | - |
| Total | $30,938 | $0 |
Family Income in Homestown
Family Income Brackets in Homestown
According to the Homestown family income data, there are 21 families falling into the $75,000 to $99,999 income range, which is the most common income bracket and makes up 61.8% of all families.
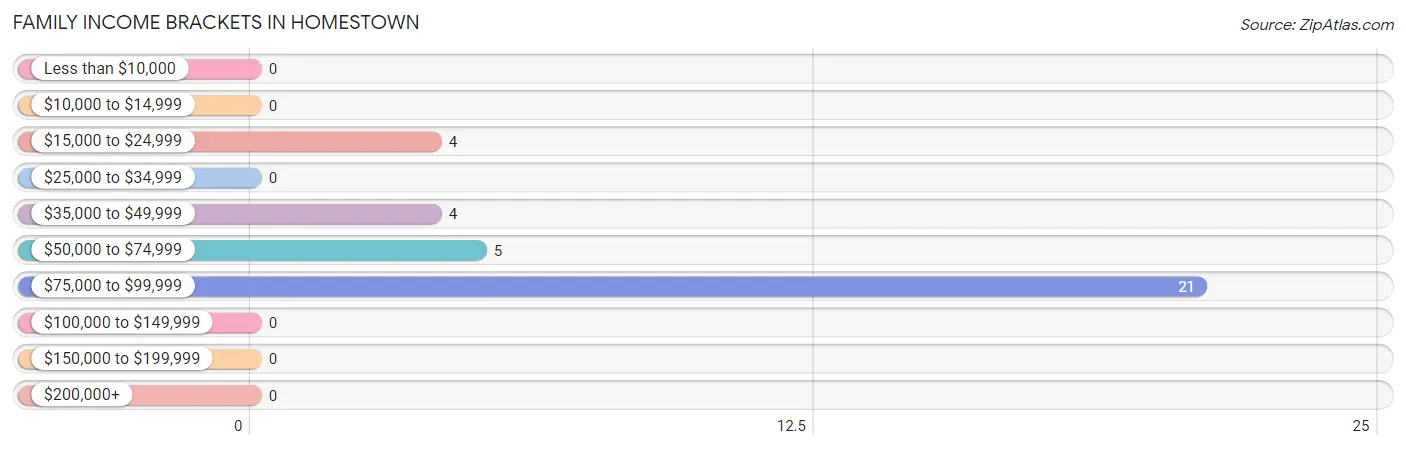
| Income Bracket | # Families | % Families |
| Less than $10,000 | 0 | 0.0% |
| $10,000 to $14,999 | 0 | 0.0% |
| $15,000 to $24,999 | 4 | 11.8% |
| $25,000 to $34,999 | 0 | 0.0% |
| $35,000 to $49,999 | 4 | 11.8% |
| $50,000 to $74,999 | 5 | 14.7% |
| $75,000 to $99,999 | 21 | 61.8% |
| $100,000 to $149,999 | 0 | 0.0% |
| $150,000 to $199,999 | 0 | 0.0% |
| $200,000+ | 0 | 0.0% |
Family Income by Famaliy Size in Homestown
2-person families (21 | 61.8%) account for the highest median family income in Homestown with $83,618 per family, while 2-person families (21 | 61.8%) have the highest median income of $41,809 per family member.
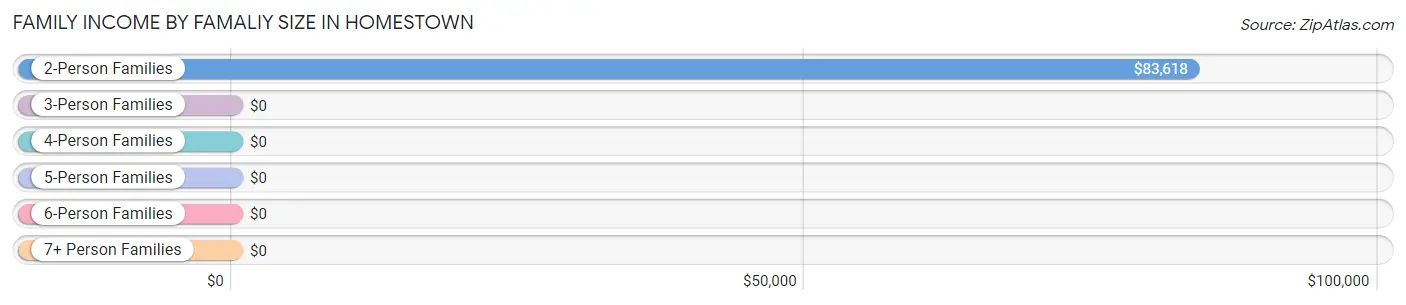
| Income Bracket | # Families | Median Income |
| 2-Person Families | 21 (61.8%) | $83,618 |
| 3-Person Families | 6 (17.6%) | $0 |
| 4-Person Families | 7 (20.6%) | $0 |
| 5-Person Families | 0 (0.0%) | $0 |
| 6-Person Families | 0 (0.0%) | $0 |
| 7+ Person Families | 0 (0.0%) | $0 |
| Total | 34 (100.0%) | $82,763 |
Family Income by Number of Earners in Homestown
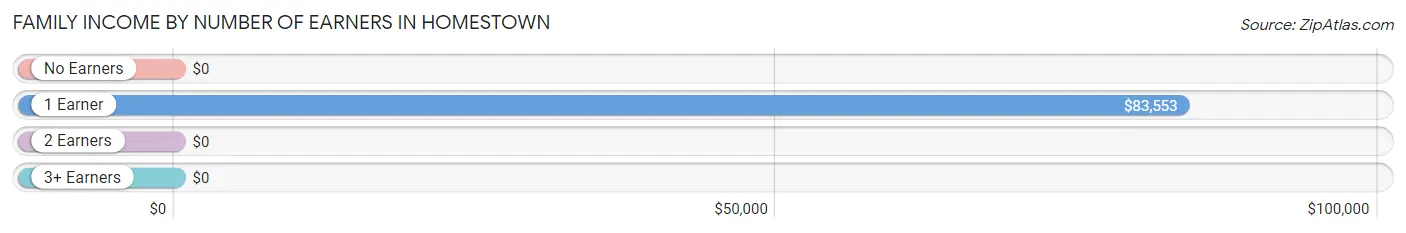
| Number of Earners | # Families | Median Income |
| No Earners | 5 (14.7%) | $0 |
| 1 Earner | 22 (64.7%) | $83,553 |
| 2 Earners | 3 (8.8%) | $0 |
| 3+ Earners | 4 (11.8%) | $0 |
| Total | 34 (100.0%) | $82,763 |
Household Income in Homestown
Household Income Brackets in Homestown
With 20 households falling in the category, the $75,000 to $99,999 income range is the most frequent in Homestown, accounting for 34.5% of all households.
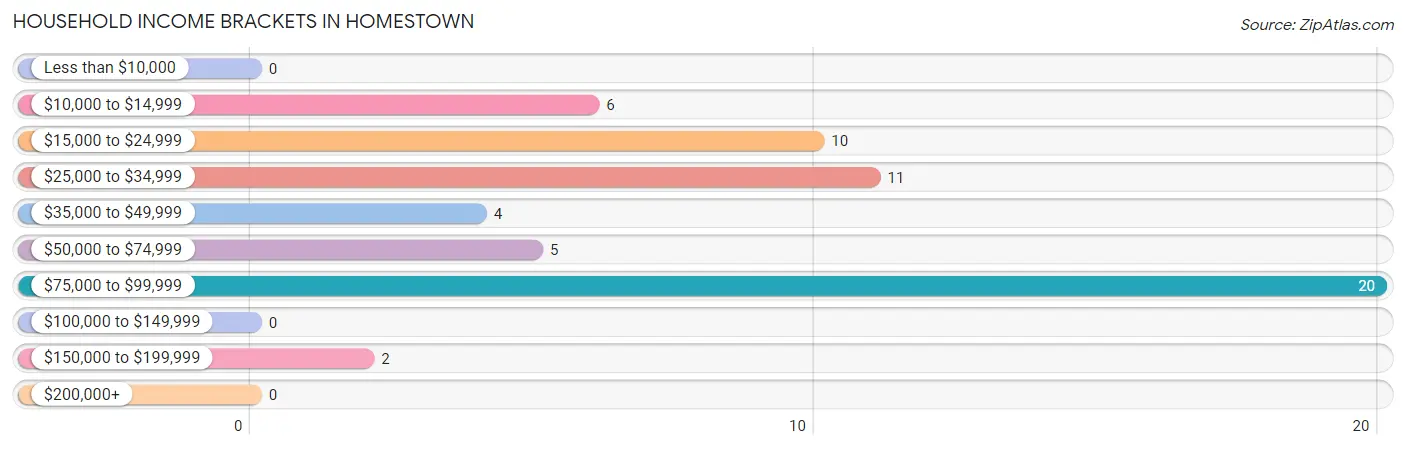
| Income Bracket | # Households | % Households |
| Less than $10,000 | 0 | 0.0% |
| $10,000 to $14,999 | 6 | 10.3% |
| $15,000 to $24,999 | 10 | 17.2% |
| $25,000 to $34,999 | 11 | 19.0% |
| $35,000 to $49,999 | 4 | 6.9% |
| $50,000 to $74,999 | 5 | 8.6% |
| $75,000 to $99,999 | 20 | 34.5% |
| $100,000 to $149,999 | 0 | 0.0% |
| $150,000 to $199,999 | 2 | 3.4% |
| $200,000+ | 0 | 0.0% |
Household Income by Householder Age in Homestown
The median household income in Homestown is $0, with the highest median household income of $68,750 found in the 45 to 64 years age bracket for the primary householder. A total of 22 households (37.9%) fall into this category.
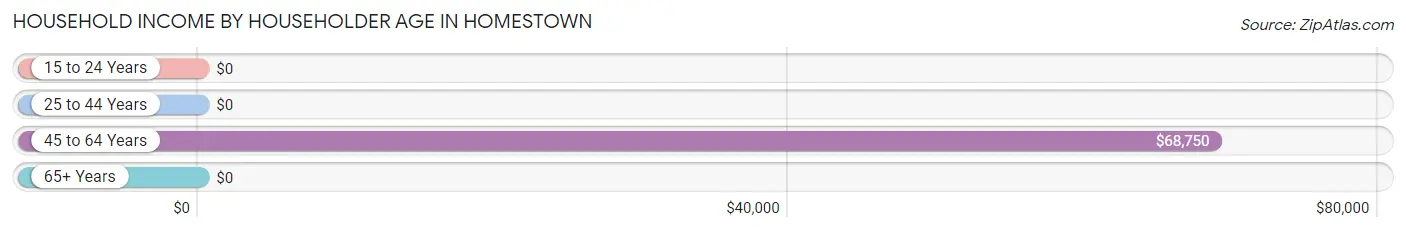
| Income Bracket | # Households | Median Income |
| 15 to 24 Years | 0 (0.0%) | $0 |
| 25 to 44 Years | 8 (13.8%) | $0 |
| 45 to 64 Years | 22 (37.9%) | $68,750 |
| 65+ Years | 28 (48.3%) | $0 |
| Total | 58 (100.0%) | $0 |
Poverty in Homestown
Income Below Poverty by Sex and Age in Homestown
With 63.3% poverty level for males and 5.6% for females among the residents of Homestown, 18 to 24 year old males and 55 to 64 year old females are the most vulnerable to poverty, with 22 males (100.0%) and 4 females (28.6%) in their respective age groups living below the poverty level.
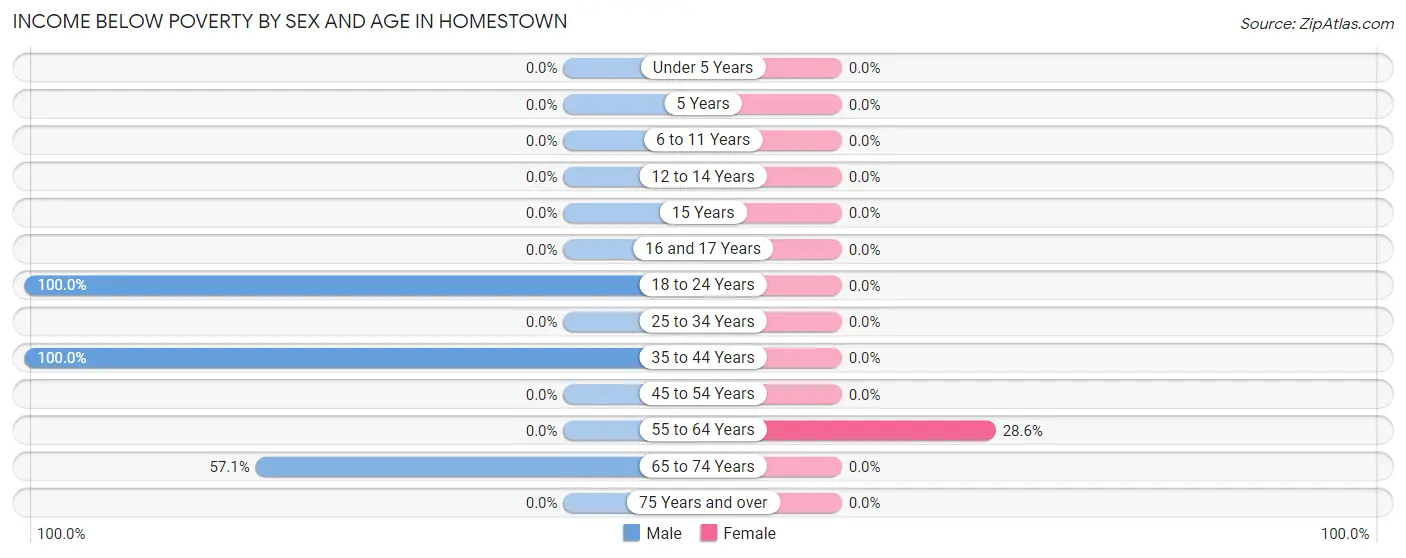
| Age Bracket | Male | Female |
| Under 5 Years | 0 (0.0%) | 0 (0.0%) |
| 5 Years | 0 (0.0%) | 0 (0.0%) |
| 6 to 11 Years | 0 (0.0%) | 0 (0.0%) |
| 12 to 14 Years | 0 (0.0%) | 0 (0.0%) |
| 15 Years | 0 (0.0%) | 0 (0.0%) |
| 16 and 17 Years | 0 (0.0%) | 0 (0.0%) |
| 18 to 24 Years | 22 (100.0%) | 0 (0.0%) |
| 25 to 34 Years | 0 (0.0%) | 0 (0.0%) |
| 35 to 44 Years | 5 (100.0%) | 0 (0.0%) |
| 45 to 54 Years | 0 (0.0%) | 0 (0.0%) |
| 55 to 64 Years | 0 (0.0%) | 4 (28.6%) |
| 65 to 74 Years | 4 (57.1%) | 0 (0.0%) |
| 75 Years and over | 0 (0.0%) | 0 (0.0%) |
| Total | 31 (63.3%) | 4 (5.6%) |
Income Above Poverty by Sex and Age in Homestown
According to the poverty statistics in Homestown, males aged 12 to 14 years and females aged 5 years are the age groups that are most secure financially, with 100.0% of males and 100.0% of females in these age groups living above the poverty line.
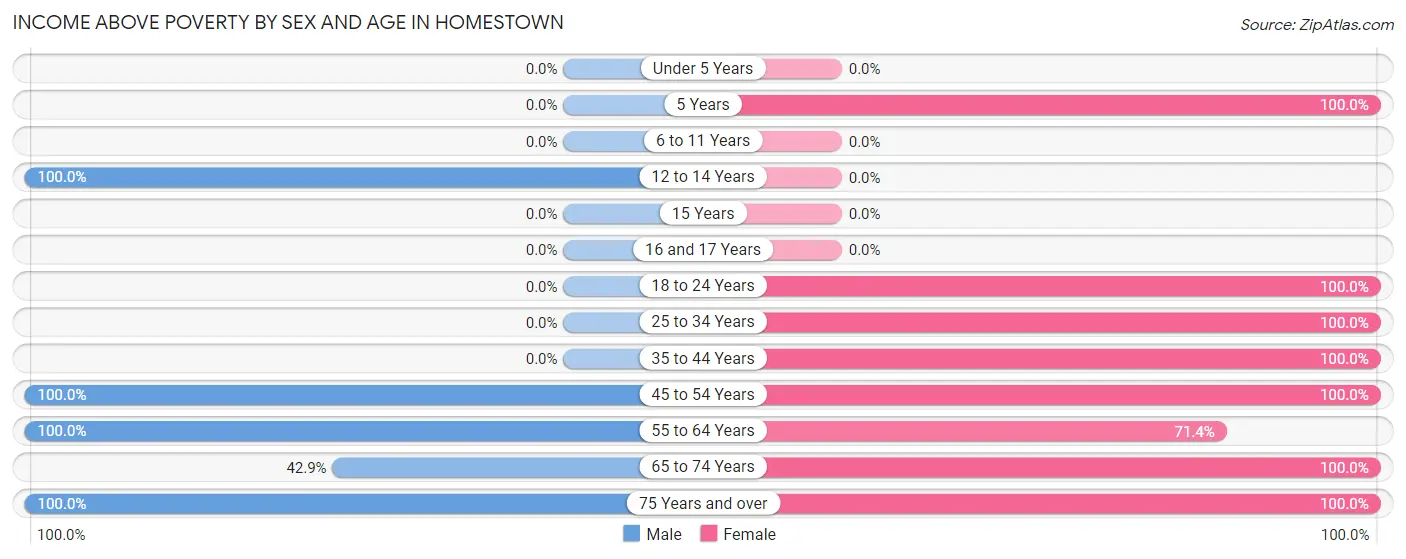
| Age Bracket | Male | Female |
| Under 5 Years | 0 (0.0%) | 0 (0.0%) |
| 5 Years | 0 (0.0%) | 3 (100.0%) |
| 6 to 11 Years | 0 (0.0%) | 0 (0.0%) |
| 12 to 14 Years | 2 (100.0%) | 0 (0.0%) |
| 15 Years | 0 (0.0%) | 0 (0.0%) |
| 16 and 17 Years | 0 (0.0%) | 0 (0.0%) |
| 18 to 24 Years | 0 (0.0%) | 5 (100.0%) |
| 25 to 34 Years | 0 (0.0%) | 2 (100.0%) |
| 35 to 44 Years | 0 (0.0%) | 8 (100.0%) |
| 45 to 54 Years | 3 (100.0%) | 8 (100.0%) |
| 55 to 64 Years | 7 (100.0%) | 10 (71.4%) |
| 65 to 74 Years | 3 (42.9%) | 11 (100.0%) |
| 75 Years and over | 3 (100.0%) | 20 (100.0%) |
| Total | 18 (36.7%) | 67 (94.4%) |
Income Below Poverty Among Married-Couple Families in Homestown
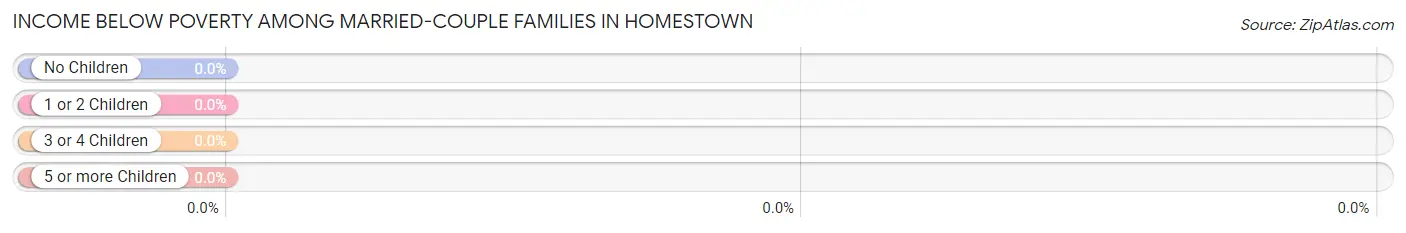
| Children | Above Poverty | Below Poverty |
| No Children | 8 (100.0%) | 0 (0.0%) |
| 1 or 2 Children | 3 (100.0%) | 0 (0.0%) |
| 3 or 4 Children | 0 (0.0%) | 0 (0.0%) |
| 5 or more Children | 0 (0.0%) | 0 (0.0%) |
| Total | 11 (100.0%) | 0 (0.0%) |
Income Below Poverty Among Single-Parent Households in Homestown
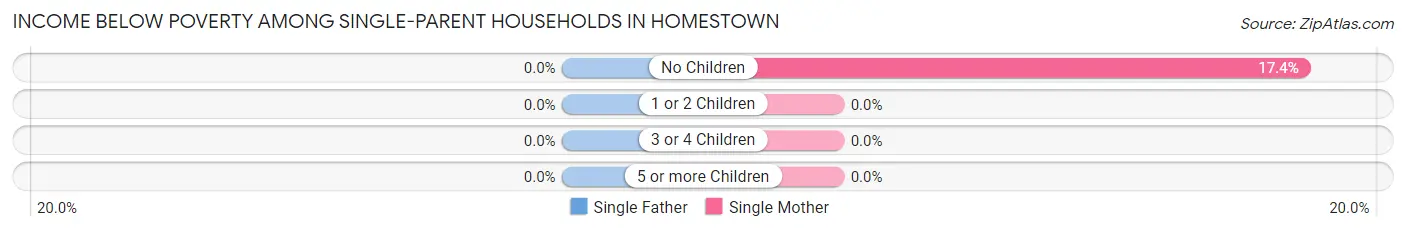
| Children | Single Father | Single Mother |
| No Children | 0 (0.0%) | 4 (17.4%) |
| 1 or 2 Children | 0 (0.0%) | 0 (0.0%) |
| 3 or 4 Children | 0 (0.0%) | 0 (0.0%) |
| 5 or more Children | 0 (0.0%) | 0 (0.0%) |
| Total | 0 (0.0%) | 4 (17.4%) |
Income Below Poverty Among Married-Couple vs Single-Parent Households in Homestown
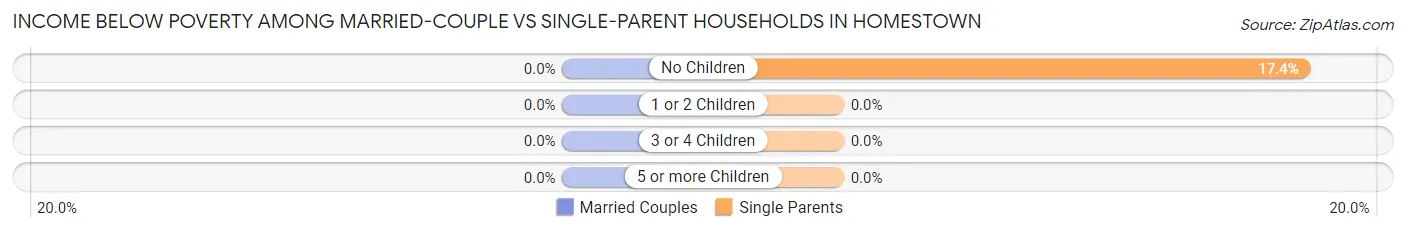
| Children | Married-Couple Families | Single-Parent Households |
| No Children | 0 (0.0%) | 4 (17.4%) |
| 1 or 2 Children | 0 (0.0%) | 0 (0.0%) |
| 3 or 4 Children | 0 (0.0%) | 0 (0.0%) |
| 5 or more Children | 0 (0.0%) | 0 (0.0%) |
| Total | 0 (0.0%) | 4 (17.4%) |
Race in Homestown
The most populous races in Homestown are Black / African American (118 | 98.3%), and White / Caucasian (2 | 1.7%).
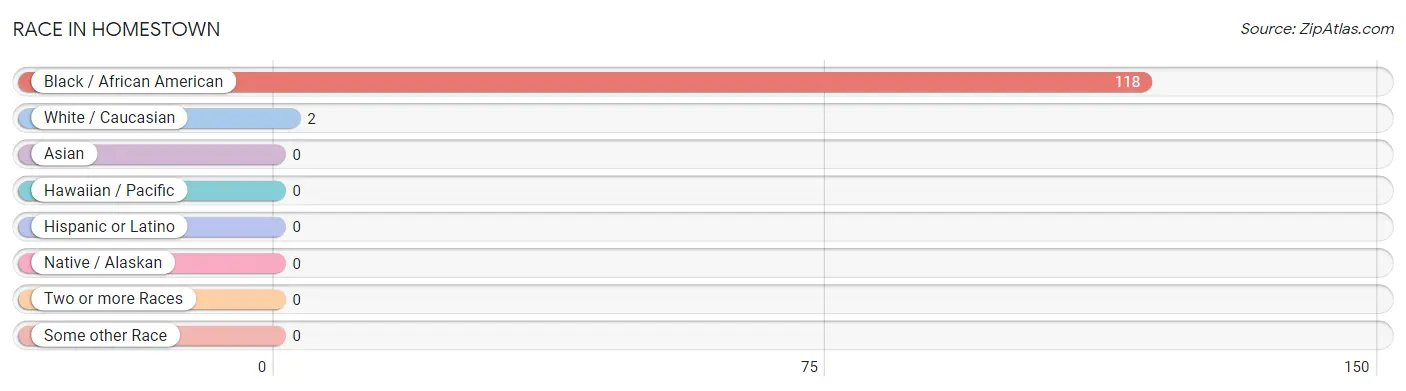
| Race | # Population | % Population |
| Asian | 0 | 0.0% |
| Black / African American | 118 | 98.3% |
| Hawaiian / Pacific | 0 | 0.0% |
| Hispanic or Latino | 0 | 0.0% |
| Native / Alaskan | 0 | 0.0% |
| White / Caucasian | 2 | 1.7% |
| Two or more Races | 0 | 0.0% |
| Some other Race | 0 | 0.0% |
| Total | 120 | 100.0% |
Ancestry in Homestown

| Ancestry | # Population | % Population | View All 0 Rows |
Immigrants in Homestown

| Immigration Origin | # Population | % Population | View All 0 Rows |
Sex and Age in Homestown
Sex and Age in Homestown
The most populous age groups in Homestown are 20 to 24 Years (22 | 44.9%) for men and 65 to 69 Years (11 | 15.5%) for women.
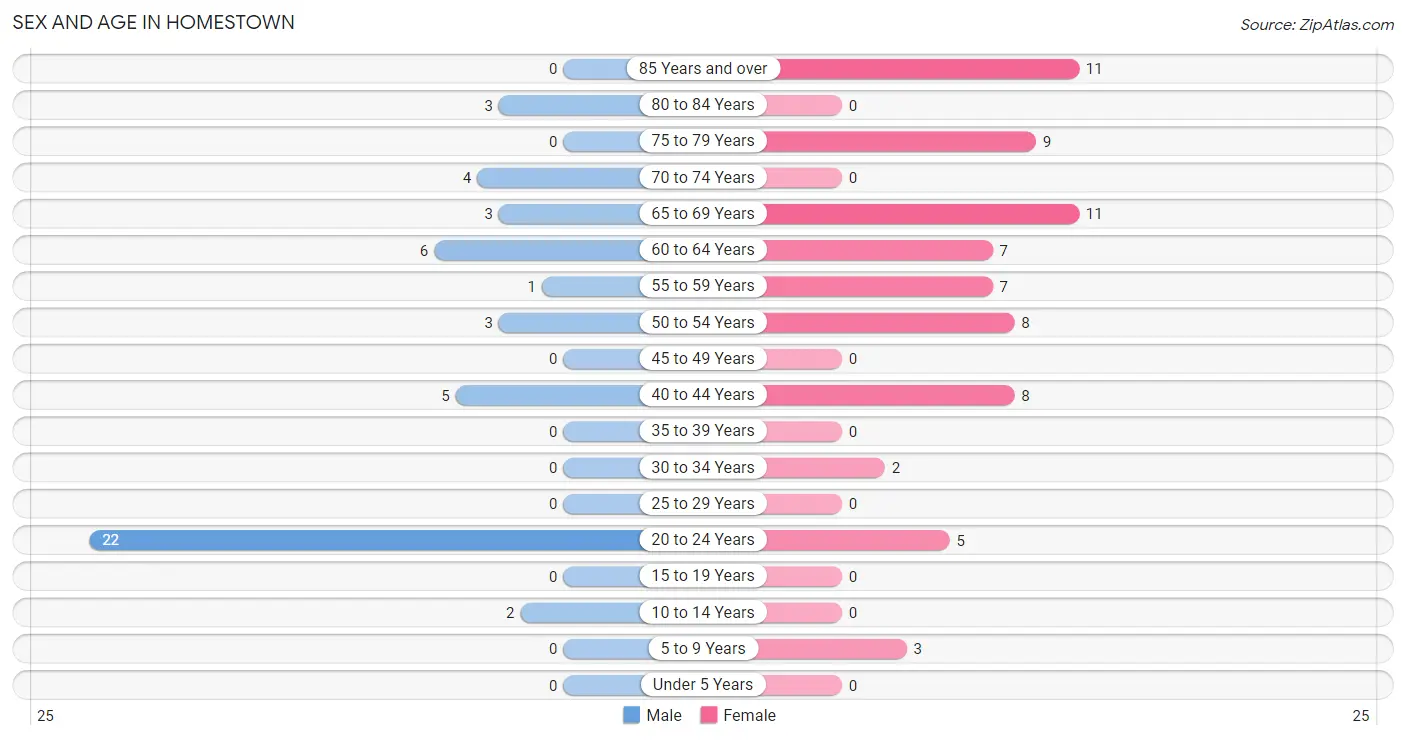
| Age Bracket | Male | Female |
| Under 5 Years | 0 (0.0%) | 0 (0.0%) |
| 5 to 9 Years | 0 (0.0%) | 3 (4.2%) |
| 10 to 14 Years | 2 (4.1%) | 0 (0.0%) |
| 15 to 19 Years | 0 (0.0%) | 0 (0.0%) |
| 20 to 24 Years | 22 (44.9%) | 5 (7.0%) |
| 25 to 29 Years | 0 (0.0%) | 0 (0.0%) |
| 30 to 34 Years | 0 (0.0%) | 2 (2.8%) |
| 35 to 39 Years | 0 (0.0%) | 0 (0.0%) |
| 40 to 44 Years | 5 (10.2%) | 8 (11.3%) |
| 45 to 49 Years | 0 (0.0%) | 0 (0.0%) |
| 50 to 54 Years | 3 (6.1%) | 8 (11.3%) |
| 55 to 59 Years | 1 (2.0%) | 7 (9.9%) |
| 60 to 64 Years | 6 (12.2%) | 7 (9.9%) |
| 65 to 69 Years | 3 (6.1%) | 11 (15.5%) |
| 70 to 74 Years | 4 (8.2%) | 0 (0.0%) |
| 75 to 79 Years | 0 (0.0%) | 9 (12.7%) |
| 80 to 84 Years | 3 (6.1%) | 0 (0.0%) |
| 85 Years and over | 0 (0.0%) | 11 (15.5%) |
| Total | 49 (100.0%) | 71 (100.0%) |
Families and Households in Homestown
Median Family Size in Homestown
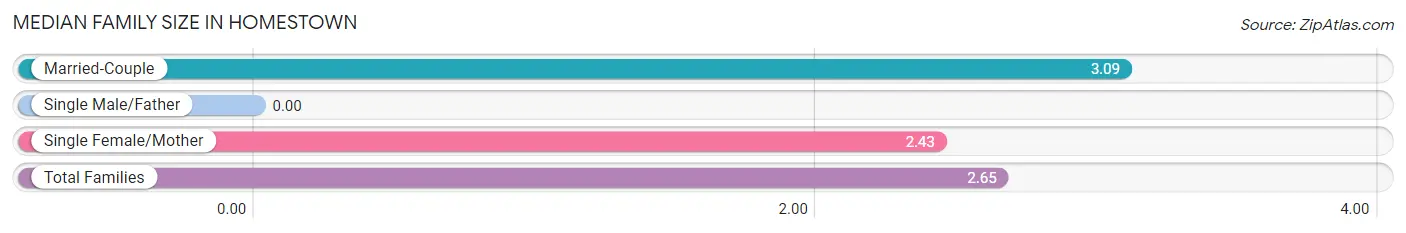
| Family Type | # Families | Family Size |
| Married-Couple | 11 (32.4%) | 3.09 |
| Single Male/Father | 0 (0.0%) | - |
| Single Female/Mother | 23 (67.6%) | 2.43 |
| Total Families | 34 (100.0%) | 2.65 |
Median Household Size in Homestown
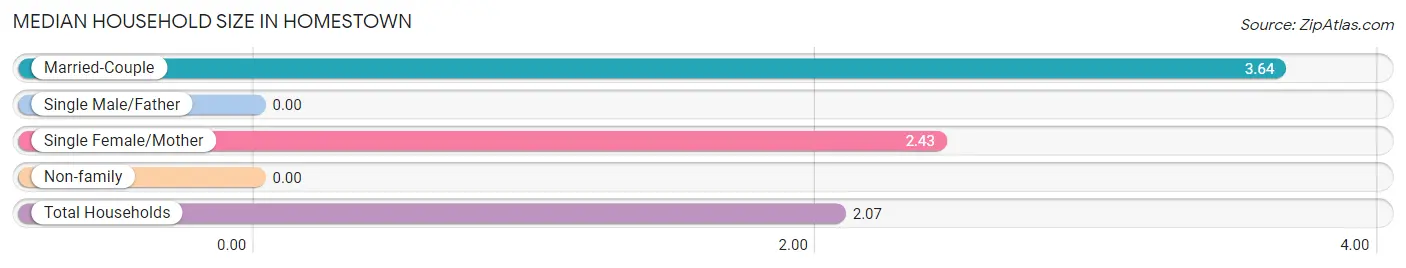
| Household Type | # Households | Household Size |
| Married-Couple | 11 (19.0%) | 3.64 |
| Single Male/Father | 0 (0.0%) | - |
| Single Female/Mother | 23 (39.7%) | 2.43 |
| Non-family | 24 (41.4%) | - |
| Total Households | 58 (100.0%) | 2.07 |
Household Size by Marriage Status in Homestown
Out of a total of 58 households in Homestown, 34 (58.6%) are family households, while 24 (41.4%) are nonfamily households. The most numerous type of family households are 2-person households, comprising 21, and the most common type of nonfamily households are 1-person households, comprising 24.
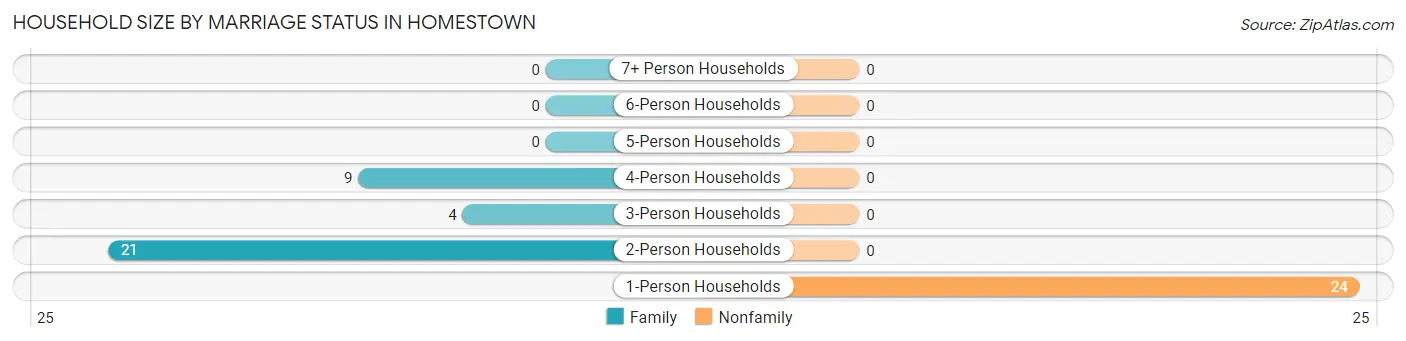
| Household Size | Family Households | Nonfamily Households |
| 1-Person Households | - | 24 (41.4%) |
| 2-Person Households | 21 (36.2%) | 0 (0.0%) |
| 3-Person Households | 4 (6.9%) | 0 (0.0%) |
| 4-Person Households | 9 (15.5%) | 0 (0.0%) |
| 5-Person Households | 0 (0.0%) | 0 (0.0%) |
| 6-Person Households | 0 (0.0%) | 0 (0.0%) |
| 7+ Person Households | 0 (0.0%) | 0 (0.0%) |
| Total | 34 (58.6%) | 24 (41.4%) |
Female Fertility in Homestown
Fertility by Age in Homestown
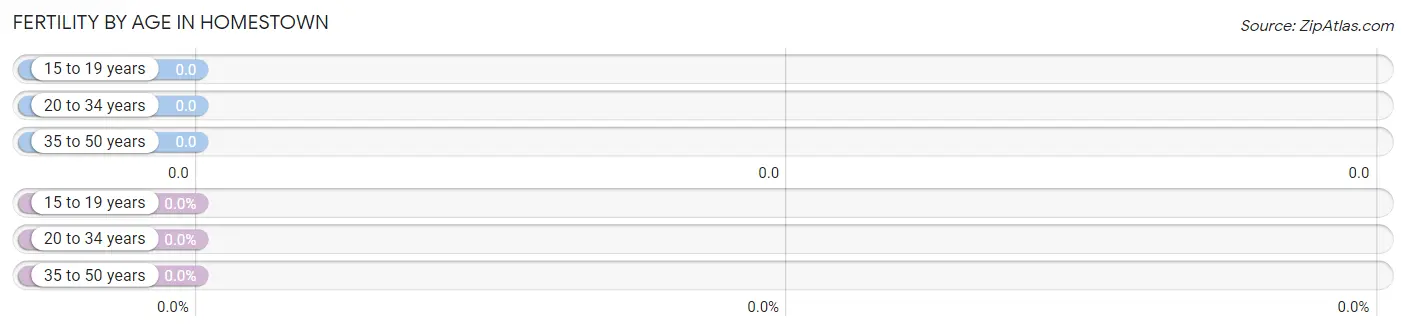
| Age Bracket | Women with Births | Births / 1,000 Women |
| 15 to 19 years | 0 (0.0%) | 0.0 |
| 20 to 34 years | 0 (0.0%) | 0.0 |
| 35 to 50 years | 0 (0.0%) | 0.0 |
| Total | 0 (0.0%) | 0.0 |
Fertility by Age by Marriage Status in Homestown
| Age Bracket | Married | Unmarried |
| 15 to 19 years | 0 (0.0%) | 0 (0.0%) |
| 20 to 34 years | 0 (0.0%) | 0 (0.0%) |
| 35 to 50 years | 0 (0.0%) | 0 (0.0%) |
| Total | 0 (0.0%) | 0 (0.0%) |
Fertility by Education in Homestown
| Educational Attainment | Women with Births | Births / 1,000 Women |
| Less than High School | 0 (0.0%) | 0.0 |
| High School Diploma | 0 (0.0%) | 0.0 |
| College or Associate's Degree | 0 (0.0%) | 0.0 |
| Bachelor's Degree | 0 (0.0%) | 0.0 |
| Graduate Degree | 0 (0.0%) | 0.0 |
| Total | 0 (0.0%) | 0.0 |
Fertility by Education by Marriage Status in Homestown
| Educational Attainment | Married | Unmarried |
| Less than High School | 0 (0.0%) | 0 (0.0%) |
| High School Diploma | 0 (0.0%) | 0 (0.0%) |
| College or Associate's Degree | 0 (0.0%) | 0 (0.0%) |
| Bachelor's Degree | 0 (0.0%) | 0 (0.0%) |
| Graduate Degree | 0 (0.0%) | 0 (0.0%) |
| Total | 0 (0.0%) | 0 (0.0%) |
Employment Characteristics in Homestown
Employment by Class of Employer in Homestown
Among the 51 employed individuals in Homestown, private company employees (34 | 66.7%), local government employees (8 | 15.7%), and federal government employees (6 | 11.8%) make up the most common classes of employment.
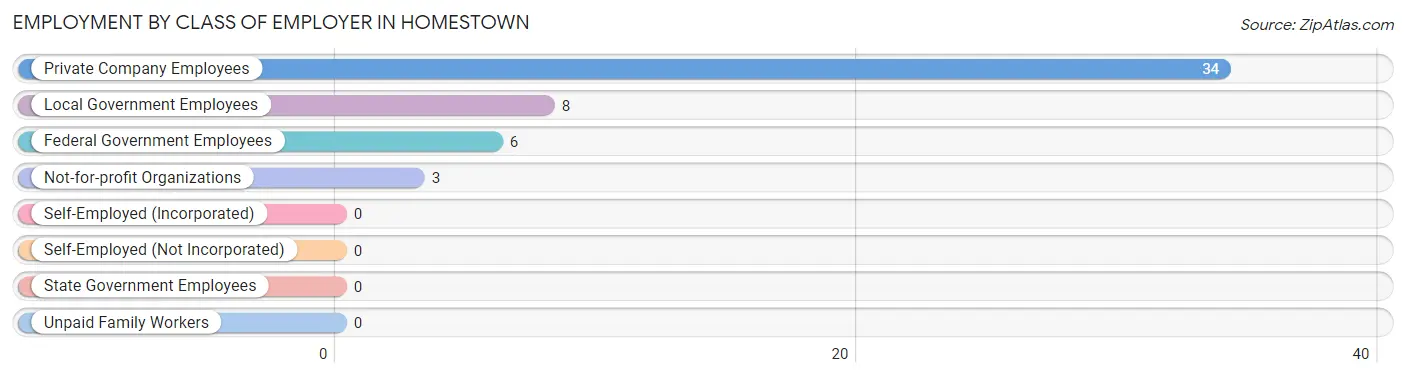
| Employer Class | # Employees | % Employees |
| Private Company Employees | 34 | 66.7% |
| Self-Employed (Incorporated) | 0 | 0.0% |
| Self-Employed (Not Incorporated) | 0 | 0.0% |
| Not-for-profit Organizations | 3 | 5.9% |
| Local Government Employees | 8 | 15.7% |
| State Government Employees | 0 | 0.0% |
| Federal Government Employees | 6 | 11.8% |
| Unpaid Family Workers | 0 | 0.0% |
| Total | 51 | 100.0% |
Employment Status by Age in Homestown
According to the labor force statistics for Homestown, out of the total population over 16 years of age (115), 45.2% or 52 individuals are in the labor force, with 1.9% or 1 of them unemployed. The age group with the highest labor force participation rate is 30 to 34 years, with 100.0% or 2 individuals in the labor force. Within the labor force, the 75 years and over age range has the highest percentage of unemployed individuals, with 14.3% or 1 of them being unemployed.
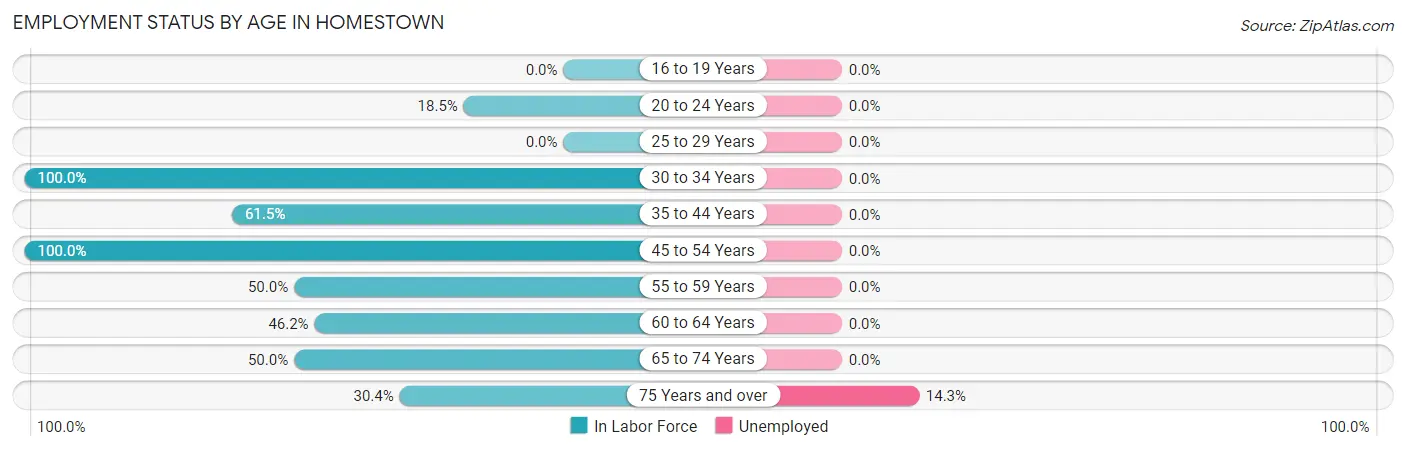
| Age Bracket | In Labor Force | Unemployed |
| 16 to 19 Years | 0 (0.0%) | 0 (0.0%) |
| 20 to 24 Years | 5 (18.5%) | 0 (0.0%) |
| 25 to 29 Years | 0 (0.0%) | 0 (0.0%) |
| 30 to 34 Years | 2 (100.0%) | 0 (0.0%) |
| 35 to 44 Years | 8 (61.5%) | 0 (0.0%) |
| 45 to 54 Years | 11 (100.0%) | 0 (0.0%) |
| 55 to 59 Years | 4 (50.0%) | 0 (0.0%) |
| 60 to 64 Years | 6 (46.2%) | 0 (0.0%) |
| 65 to 74 Years | 9 (50.0%) | 0 (0.0%) |
| 75 Years and over | 7 (30.4%) | 1 (14.3%) |
| Total | 52 (45.2%) | 1 (1.9%) |
Employment Status by Educational Attainment in Homestown
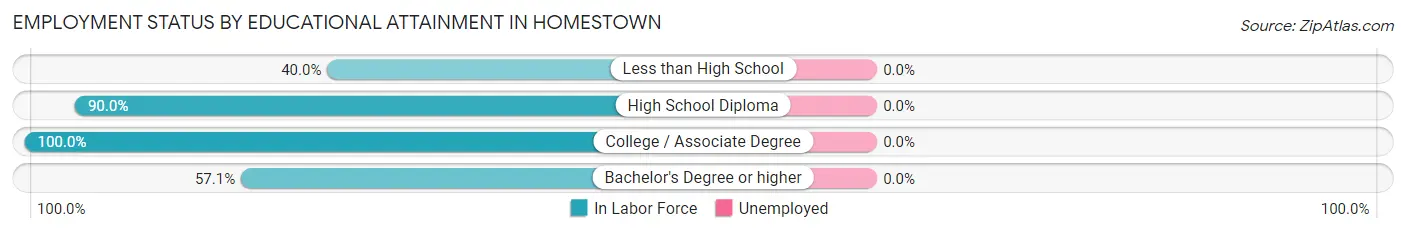
| Educational Attainment | In Labor Force | Unemployed |
| Less than High School | 6 (40.0%) | 0 (0.0%) |
| High School Diploma | 9 (90.0%) | 0 (0.0%) |
| College / Associate Degree | 8 (100.0%) | 0 (0.0%) |
| Bachelor's Degree or higher | 8 (57.1%) | 0 (0.0%) |
| Total | 31 (66.0%) | 0 (0.0%) |
Employment Occupations by Sex in Homestown
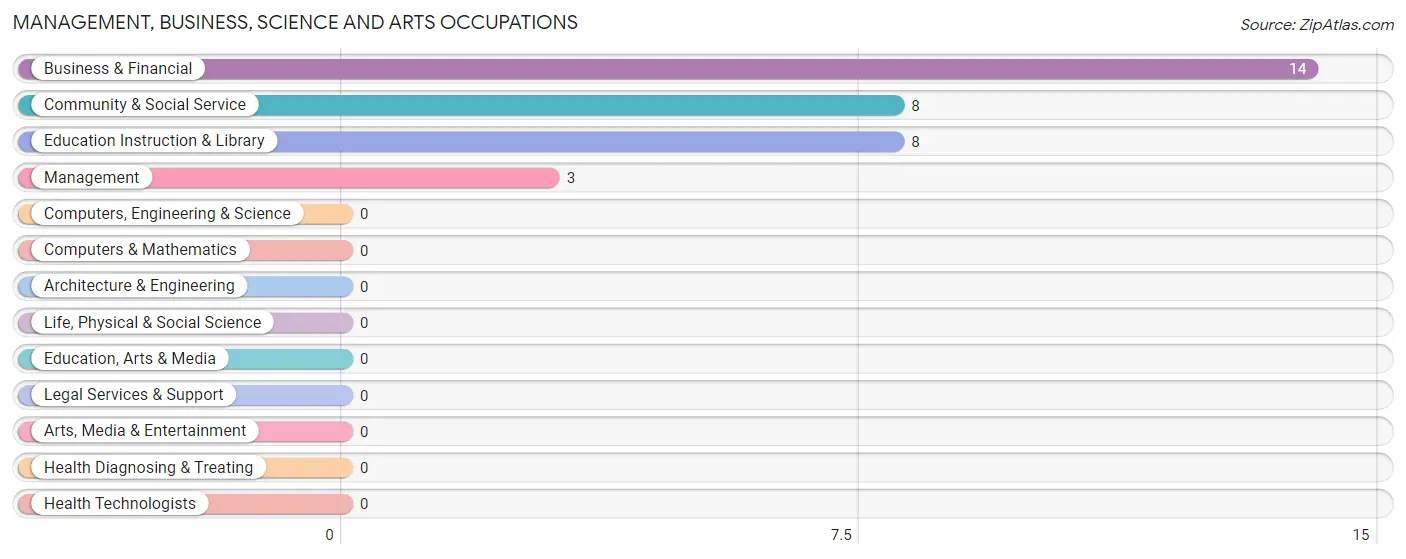
Management, Business, Science and Arts Occupations
The most common Management, Business, Science and Arts occupations in Homestown are Business & Financial (14 | 27.5%), Community & Social Service (8 | 15.7%), Education Instruction & Library (8 | 15.7%), and Management (3 | 5.9%).
Management, Business, Science and Arts Occupations by Sex
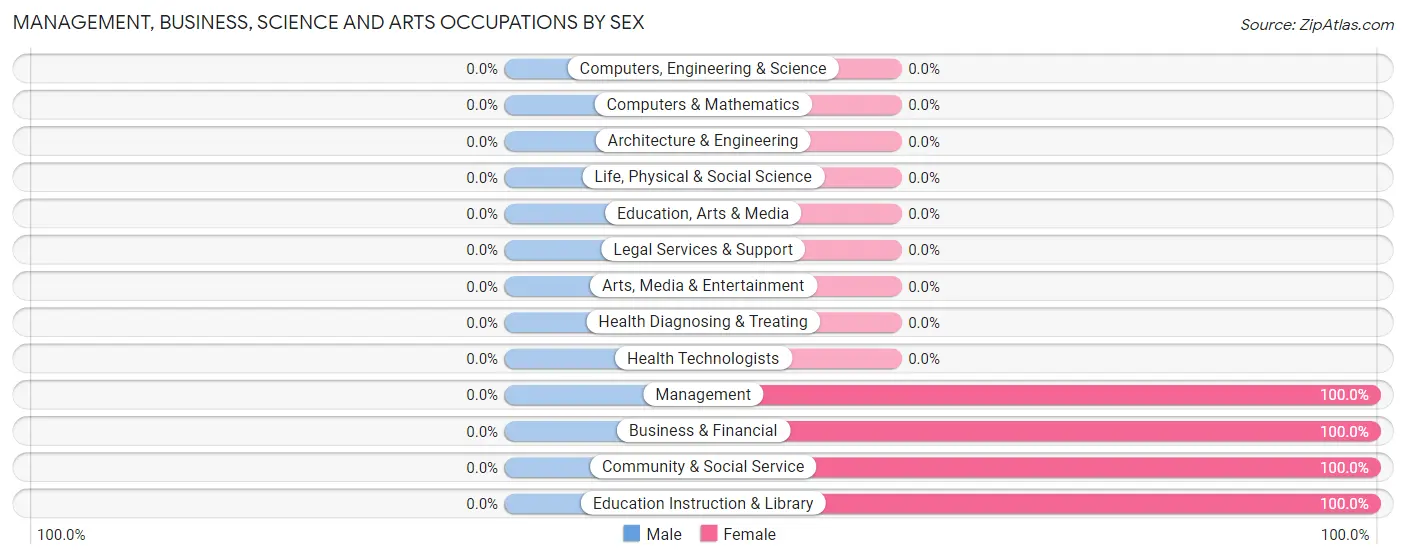
| Occupation | Male | Female |
| Management | 0 (0.0%) | 3 (100.0%) |
| Business & Financial | 0 (0.0%) | 14 (100.0%) |
| Computers, Engineering & Science | 0 (0.0%) | 0 (0.0%) |
| Computers & Mathematics | 0 (0.0%) | 0 (0.0%) |
| Architecture & Engineering | 0 (0.0%) | 0 (0.0%) |
| Life, Physical & Social Science | 0 (0.0%) | 0 (0.0%) |
| Community & Social Service | 0 (0.0%) | 8 (100.0%) |
| Education, Arts & Media | 0 (0.0%) | 0 (0.0%) |
| Legal Services & Support | 0 (0.0%) | 0 (0.0%) |
| Education Instruction & Library | 0 (0.0%) | 8 (100.0%) |
| Arts, Media & Entertainment | 0 (0.0%) | 0 (0.0%) |
| Health Diagnosing & Treating | 0 (0.0%) | 0 (0.0%) |
| Health Technologists | 0 (0.0%) | 0 (0.0%) |
| Total (Category) | 0 (0.0%) | 25 (100.0%) |
| Total (Overall) | 10 (19.6%) | 41 (80.4%) |
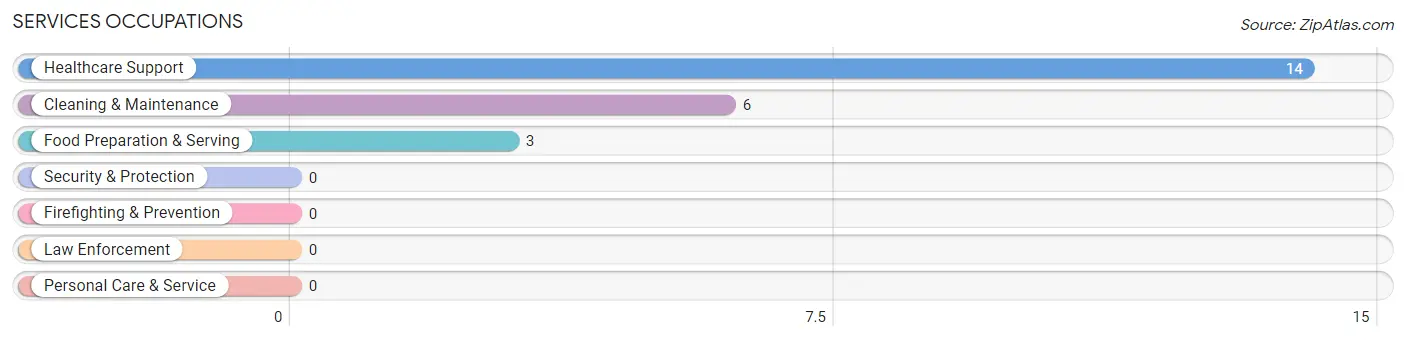
Services Occupations
The most common Services occupations in Homestown are Healthcare Support (14 | 27.5%), Cleaning & Maintenance (6 | 11.8%), and Food Preparation & Serving (3 | 5.9%).
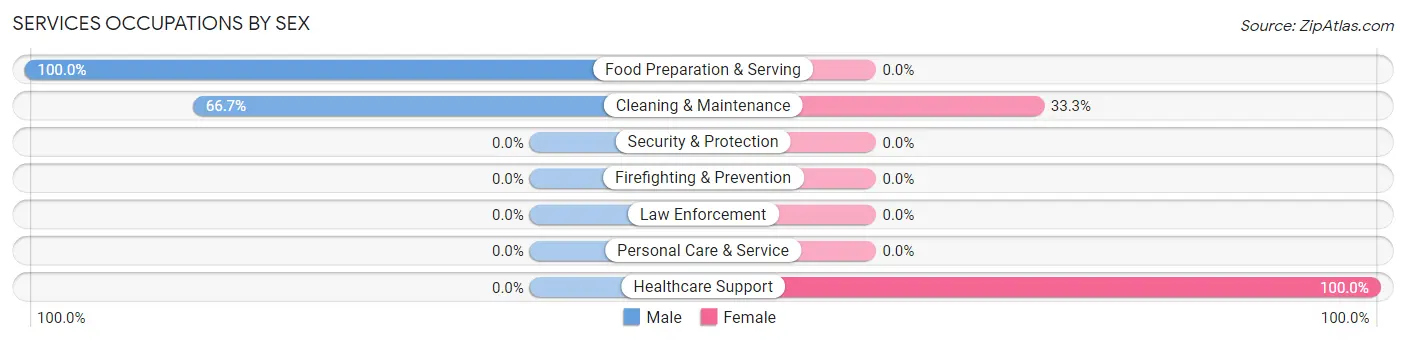
Services Occupations by Sex
Within the Services occupations in Homestown, the most male-oriented occupations are Food Preparation & Serving (100.0%), and Cleaning & Maintenance (66.7%), while the most female-oriented occupations are Healthcare Support (100.0%), and Cleaning & Maintenance (33.3%).
| Occupation | Male | Female |
| Healthcare Support | 0 (0.0%) | 14 (100.0%) |
| Security & Protection | 0 (0.0%) | 0 (0.0%) |
| Firefighting & Prevention | 0 (0.0%) | 0 (0.0%) |
| Law Enforcement | 0 (0.0%) | 0 (0.0%) |
| Food Preparation & Serving | 3 (100.0%) | 0 (0.0%) |
| Cleaning & Maintenance | 4 (66.7%) | 2 (33.3%) |
| Personal Care & Service | 0 (0.0%) | 0 (0.0%) |
| Total (Category) | 7 (30.4%) | 16 (69.6%) |
| Total (Overall) | 10 (19.6%) | 41 (80.4%) |
Sales and Office Occupations
Sales and Office Occupations by Sex
| Occupation | Male | Female |
| Sales & Related | 0 (0.0%) | 0 (0.0%) |
| Office & Administration | 0 (0.0%) | 0 (0.0%) |
| Total (Category) | 0 (0.0%) | 0 (0.0%) |
| Total (Overall) | 10 (19.6%) | 41 (80.4%) |
Natural Resources, Construction and Maintenance Occupations
The most common Natural Resources, Construction and Maintenance occupations in Homestown are , and Farming, Fishing & Forestry (2 | 3.9%).
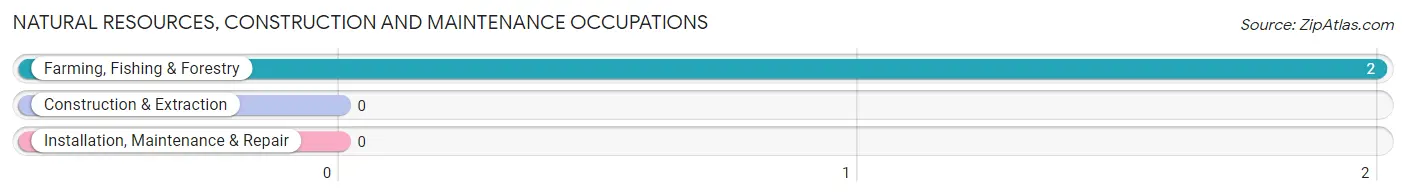
Natural Resources, Construction and Maintenance Occupations by Sex
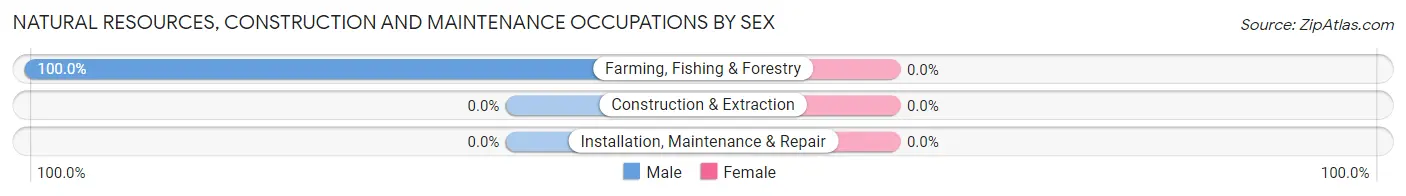
| Occupation | Male | Female |
| Farming, Fishing & Forestry | 2 (100.0%) | 0 (0.0%) |
| Construction & Extraction | 0 (0.0%) | 0 (0.0%) |
| Installation, Maintenance & Repair | 0 (0.0%) | 0 (0.0%) |
| Total (Category) | 2 (100.0%) | 0 (0.0%) |
| Total (Overall) | 10 (19.6%) | 41 (80.4%) |
Production, Transportation and Moving Occupations
The most common Production, Transportation and Moving occupations in Homestown are , and Production (1 | 2.0%).
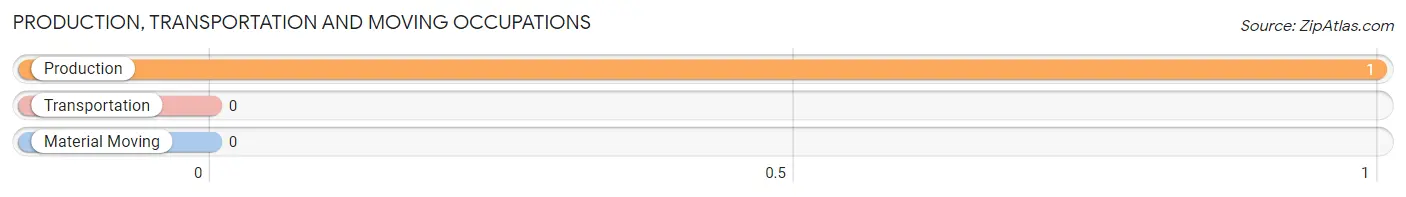
Production, Transportation and Moving Occupations by Sex
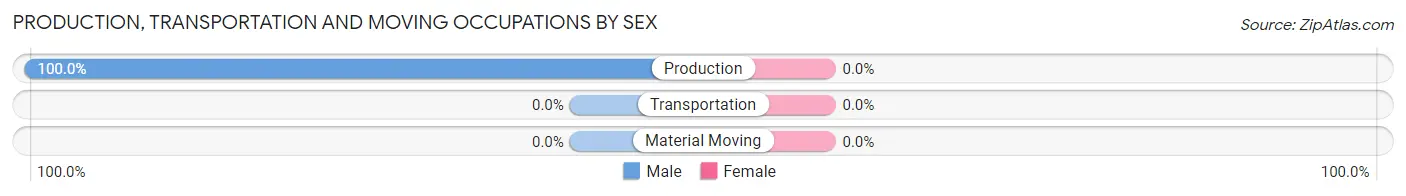
| Occupation | Male | Female |
| Production | 1 (100.0%) | 0 (0.0%) |
| Transportation | 0 (0.0%) | 0 (0.0%) |
| Material Moving | 0 (0.0%) | 0 (0.0%) |
| Total (Category) | 1 (100.0%) | 0 (0.0%) |
| Total (Overall) | 10 (19.6%) | 41 (80.4%) |
Employment Industries by Sex in Homestown
Employment Industries in Homestown
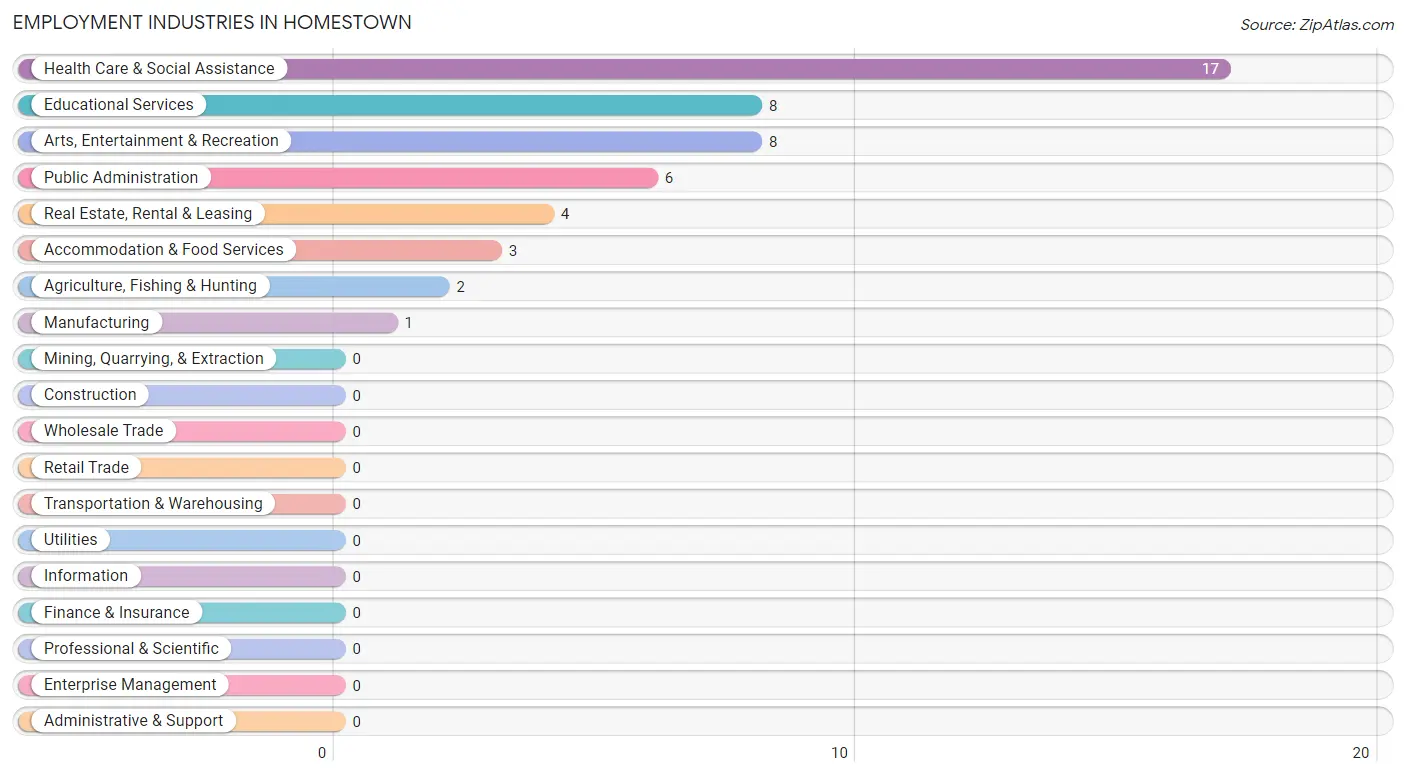
The major employment industries in Homestown include Health Care & Social Assistance (17 | 33.3%), Educational Services (8 | 15.7%), Arts, Entertainment & Recreation (8 | 15.7%), Public Administration (6 | 11.8%), and Real Estate, Rental & Leasing (4 | 7.8%).
Employment Industries by Sex in Homestown
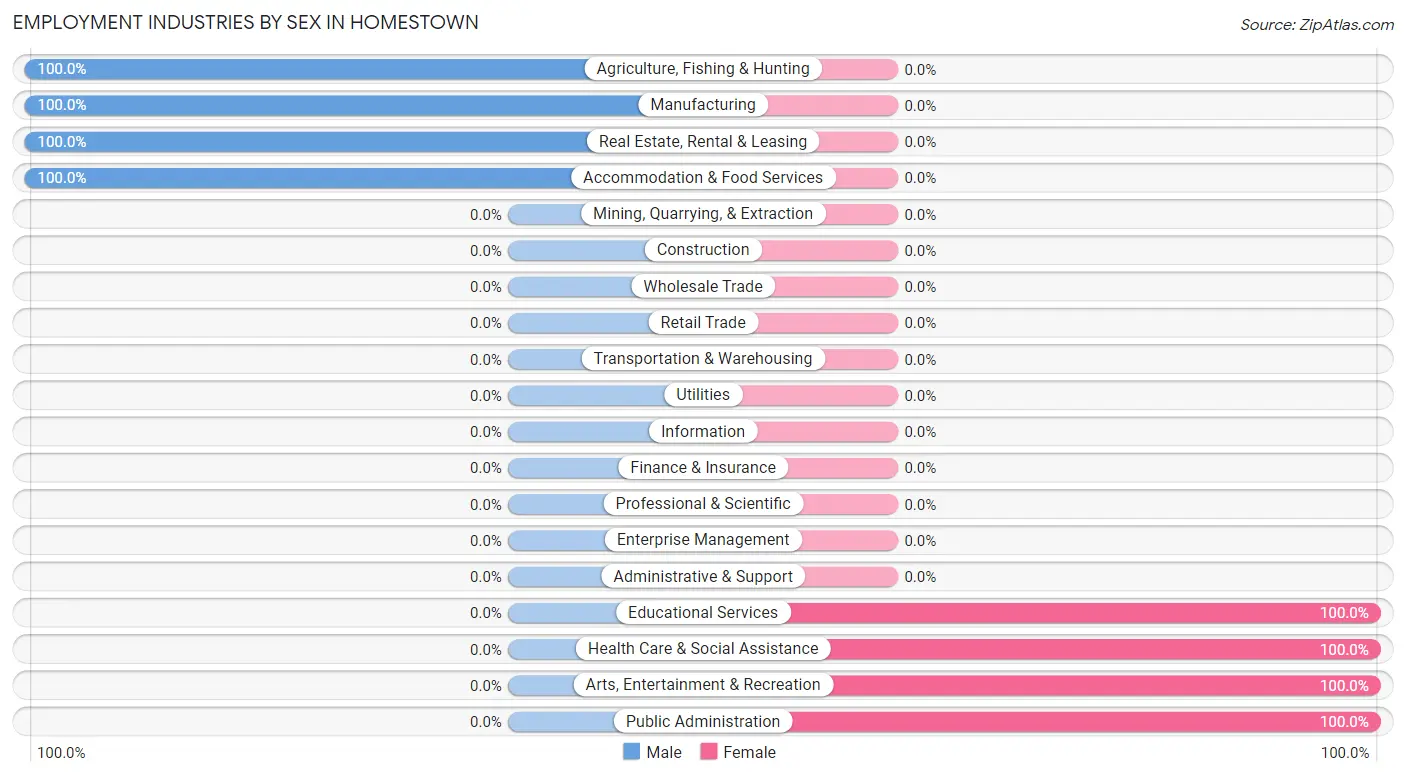
The Homestown industries that see more men than women are Agriculture, Fishing & Hunting (100.0%), Manufacturing (100.0%), and Real Estate, Rental & Leasing (100.0%), whereas the industries that tend to have a higher number of women are Educational Services (100.0%), Health Care & Social Assistance (100.0%), and Arts, Entertainment & Recreation (100.0%).
| Industry | Male | Female |
| Agriculture, Fishing & Hunting | 2 (100.0%) | 0 (0.0%) |
| Mining, Quarrying, & Extraction | 0 (0.0%) | 0 (0.0%) |
| Construction | 0 (0.0%) | 0 (0.0%) |
| Manufacturing | 1 (100.0%) | 0 (0.0%) |
| Wholesale Trade | 0 (0.0%) | 0 (0.0%) |
| Retail Trade | 0 (0.0%) | 0 (0.0%) |
| Transportation & Warehousing | 0 (0.0%) | 0 (0.0%) |
| Utilities | 0 (0.0%) | 0 (0.0%) |
| Information | 0 (0.0%) | 0 (0.0%) |
| Finance & Insurance | 0 (0.0%) | 0 (0.0%) |
| Real Estate, Rental & Leasing | 4 (100.0%) | 0 (0.0%) |
| Professional & Scientific | 0 (0.0%) | 0 (0.0%) |
| Enterprise Management | 0 (0.0%) | 0 (0.0%) |
| Administrative & Support | 0 (0.0%) | 0 (0.0%) |
| Educational Services | 0 (0.0%) | 8 (100.0%) |
| Health Care & Social Assistance | 0 (0.0%) | 17 (100.0%) |
| Arts, Entertainment & Recreation | 0 (0.0%) | 8 (100.0%) |
| Accommodation & Food Services | 3 (100.0%) | 0 (0.0%) |
| Public Administration | 0 (0.0%) | 6 (100.0%) |
| Total | 10 (19.6%) | 41 (80.4%) |
Education in Homestown
School Enrollment in Homestown
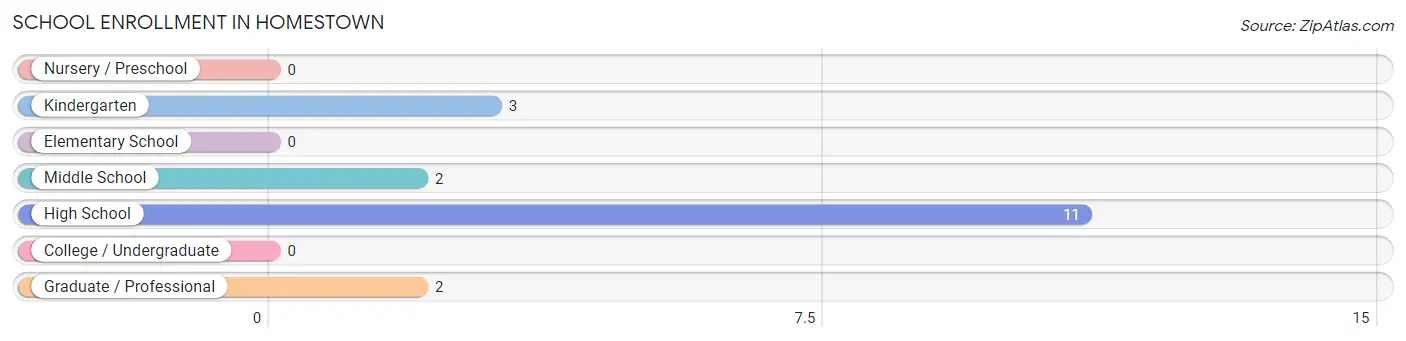
The most common levels of schooling among the 18 students in Homestown are high school (11 | 61.1%), kindergarten (3 | 16.7%), and middle school (2 | 11.1%).
| School Level | # Students | % Students |
| Nursery / Preschool | 0 | 0.0% |
| Kindergarten | 3 | 16.7% |
| Elementary School | 0 | 0.0% |
| Middle School | 2 | 11.1% |
| High School | 11 | 61.1% |
| College / Undergraduate | 0 | 0.0% |
| Graduate / Professional | 2 | 11.1% |
| Total | 18 | 100.0% |
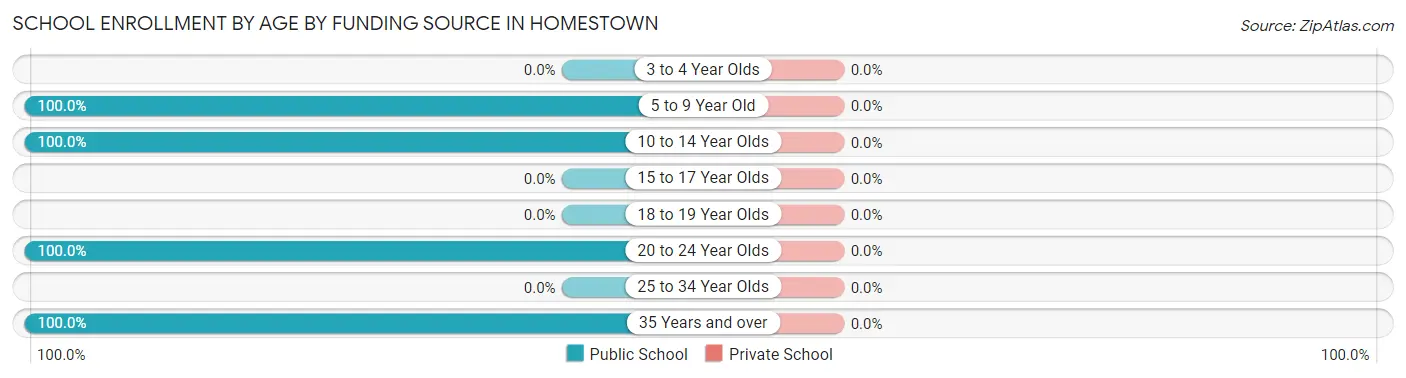
School Enrollment by Age by Funding Source in Homestown
| Age Bracket | Public School | Private School |
| 3 to 4 Year Olds | 0 (0.0%) | 0 (0.0%) |
| 5 to 9 Year Old | 3 (100.0%) | 0 (0.0%) |
| 10 to 14 Year Olds | 2 (100.0%) | 0 (0.0%) |
| 15 to 17 Year Olds | 0 (0.0%) | 0 (0.0%) |
| 18 to 19 Year Olds | 0 (0.0%) | 0 (0.0%) |
| 20 to 24 Year Olds | 11 (100.0%) | 0 (0.0%) |
| 25 to 34 Year Olds | 0 (0.0%) | 0 (0.0%) |
| 35 Years and over | 2 (100.0%) | 0 (0.0%) |
| Total | 18 (100.0%) | 0 (0.0%) |
Educational Attainment by Field of Study in Homestown
Business (10 | 71.4%), science & technology (2 | 14.3%), and education (2 | 14.3%) are the most common fields of study among 14 individuals in Homestown who have obtained a bachelor's degree or higher.
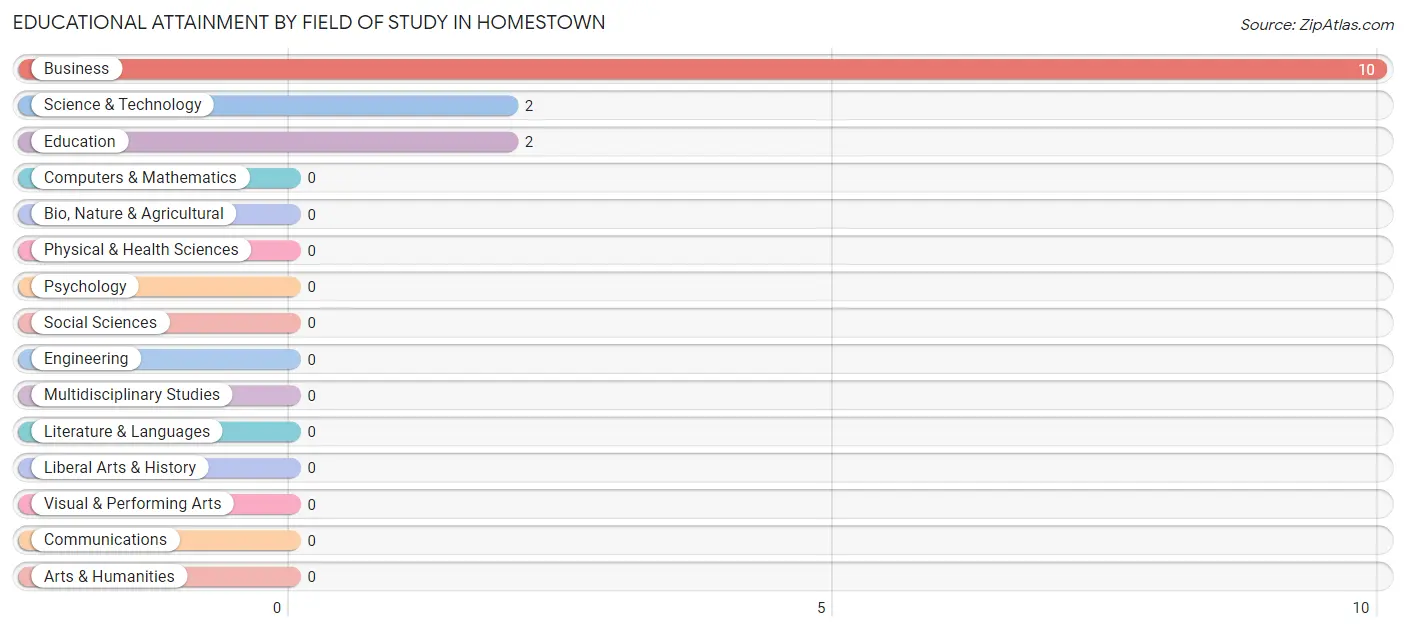
| Field of Study | # Graduates | % Graduates |
| Computers & Mathematics | 0 | 0.0% |
| Bio, Nature & Agricultural | 0 | 0.0% |
| Physical & Health Sciences | 0 | 0.0% |
| Psychology | 0 | 0.0% |
| Social Sciences | 0 | 0.0% |
| Engineering | 0 | 0.0% |
| Multidisciplinary Studies | 0 | 0.0% |
| Science & Technology | 2 | 14.3% |
| Business | 10 | 71.4% |
| Education | 2 | 14.3% |
| Literature & Languages | 0 | 0.0% |
| Liberal Arts & History | 0 | 0.0% |
| Visual & Performing Arts | 0 | 0.0% |
| Communications | 0 | 0.0% |
| Arts & Humanities | 0 | 0.0% |
| Total | 14 | 100.0% |
Transportation & Commute in Homestown
Vehicle Availability by Sex in Homestown
The most prevalent vehicle ownership categories in Homestown are males with 3 vehicles (4, accounting for 40.0%) and females with 3 vehicles (8, making up 9.8%).
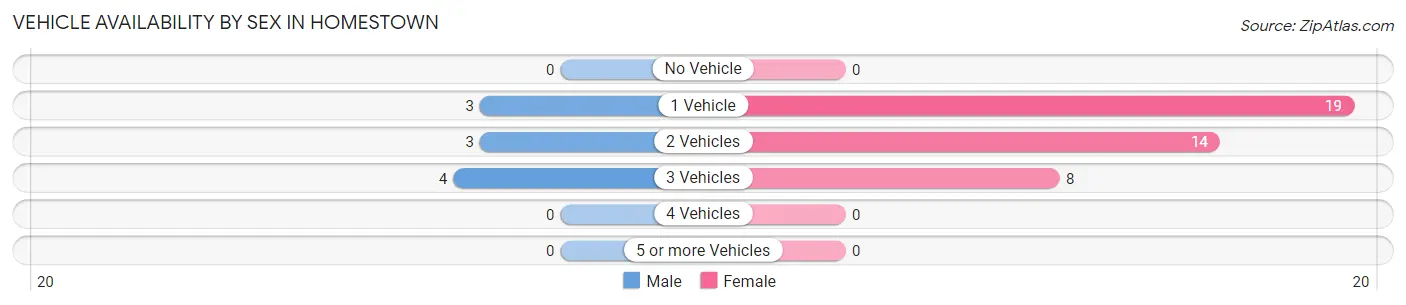
| Vehicles Available | Male | Female |
| No Vehicle | 0 (0.0%) | 0 (0.0%) |
| 1 Vehicle | 3 (30.0%) | 19 (46.3%) |
| 2 Vehicles | 3 (30.0%) | 14 (34.2%) |
| 3 Vehicles | 4 (40.0%) | 8 (19.5%) |
| 4 Vehicles | 0 (0.0%) | 0 (0.0%) |
| 5 or more Vehicles | 0 (0.0%) | 0 (0.0%) |
| Total | 10 (100.0%) | 41 (100.0%) |
Commute Time in Homestown
The most frequently occuring commute durations in Homestown are 20 to 24 minutes (15 commuters, 29.4%), 30 to 34 minutes (14 commuters, 27.5%), and 25 to 29 minutes (9 commuters, 17.6%).
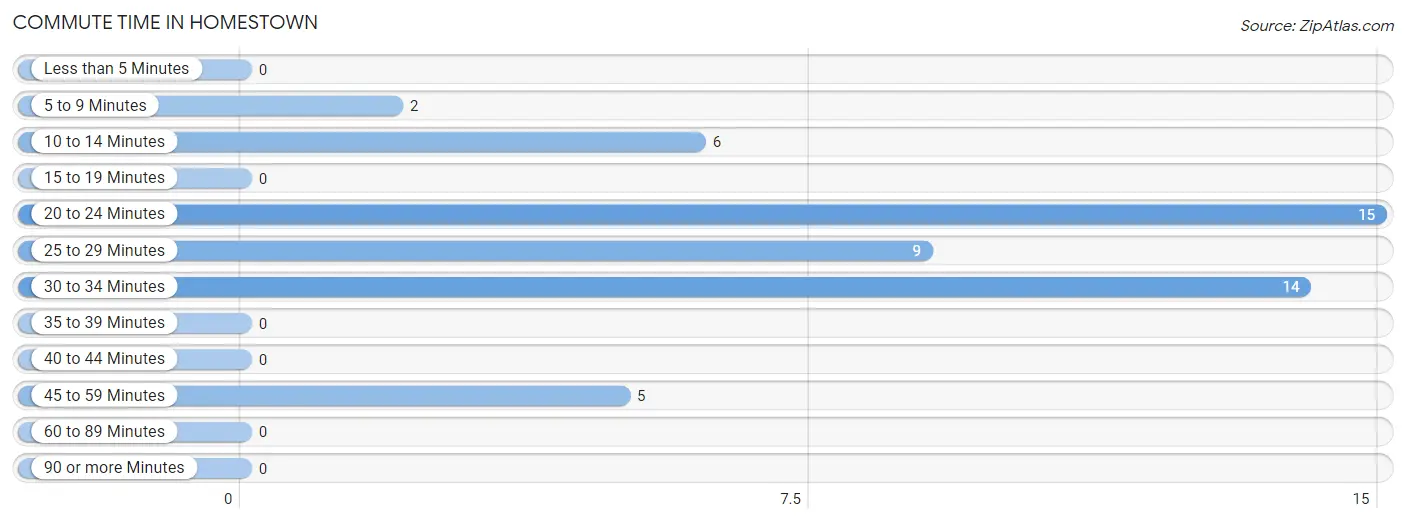
| Commute Time | # Commuters | % Commuters |
| Less than 5 Minutes | 0 | 0.0% |
| 5 to 9 Minutes | 2 | 3.9% |
| 10 to 14 Minutes | 6 | 11.8% |
| 15 to 19 Minutes | 0 | 0.0% |
| 20 to 24 Minutes | 15 | 29.4% |
| 25 to 29 Minutes | 9 | 17.6% |
| 30 to 34 Minutes | 14 | 27.5% |
| 35 to 39 Minutes | 0 | 0.0% |
| 40 to 44 Minutes | 0 | 0.0% |
| 45 to 59 Minutes | 5 | 9.8% |
| 60 to 89 Minutes | 0 | 0.0% |
| 90 or more Minutes | 0 | 0.0% |
Commute Time by Sex in Homestown
The most common commute times in Homestown are 45 to 59 minutes (5 commuters, 50.0%) for males and 30 to 34 minutes (14 commuters, 34.2%) for females.
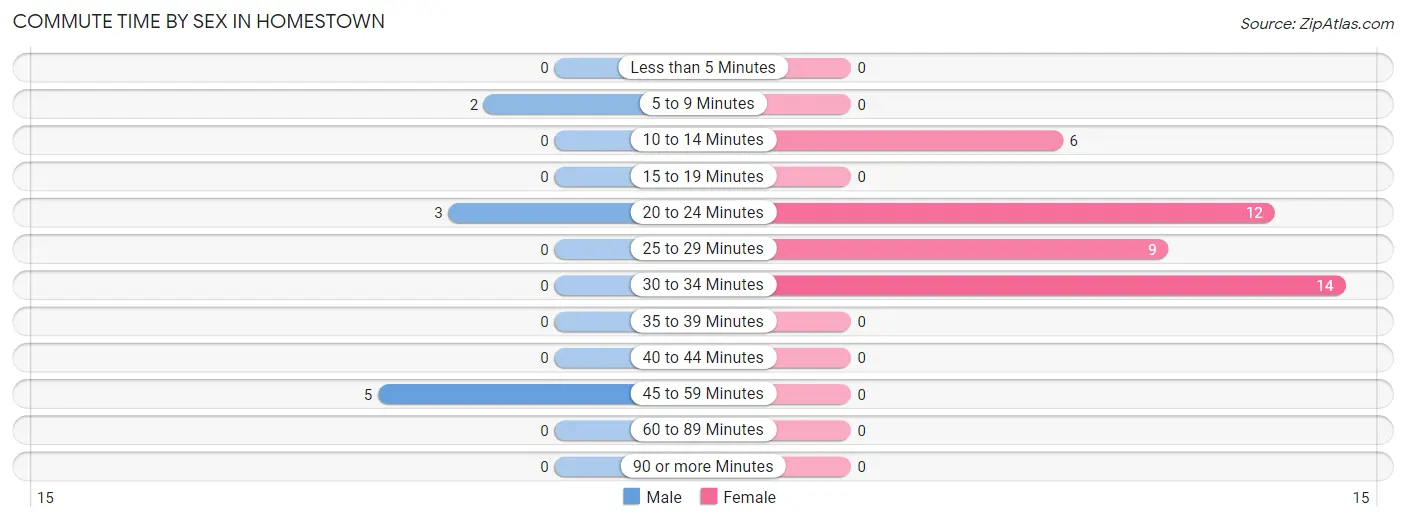
| Commute Time | Male | Female |
| Less than 5 Minutes | 0 (0.0%) | 0 (0.0%) |
| 5 to 9 Minutes | 2 (20.0%) | 0 (0.0%) |
| 10 to 14 Minutes | 0 (0.0%) | 6 (14.6%) |
| 15 to 19 Minutes | 0 (0.0%) | 0 (0.0%) |
| 20 to 24 Minutes | 3 (30.0%) | 12 (29.3%) |
| 25 to 29 Minutes | 0 (0.0%) | 9 (22.0%) |
| 30 to 34 Minutes | 0 (0.0%) | 14 (34.2%) |
| 35 to 39 Minutes | 0 (0.0%) | 0 (0.0%) |
| 40 to 44 Minutes | 0 (0.0%) | 0 (0.0%) |
| 45 to 59 Minutes | 5 (50.0%) | 0 (0.0%) |
| 60 to 89 Minutes | 0 (0.0%) | 0 (0.0%) |
| 90 or more Minutes | 0 (0.0%) | 0 (0.0%) |
Time of Departure to Work by Sex in Homestown
The most frequent times of departure to work in Homestown are 7:30 AM to 7:59 AM (6, 60.0%) for males and 7:30 AM to 7:59 AM (15, 36.6%) for females.
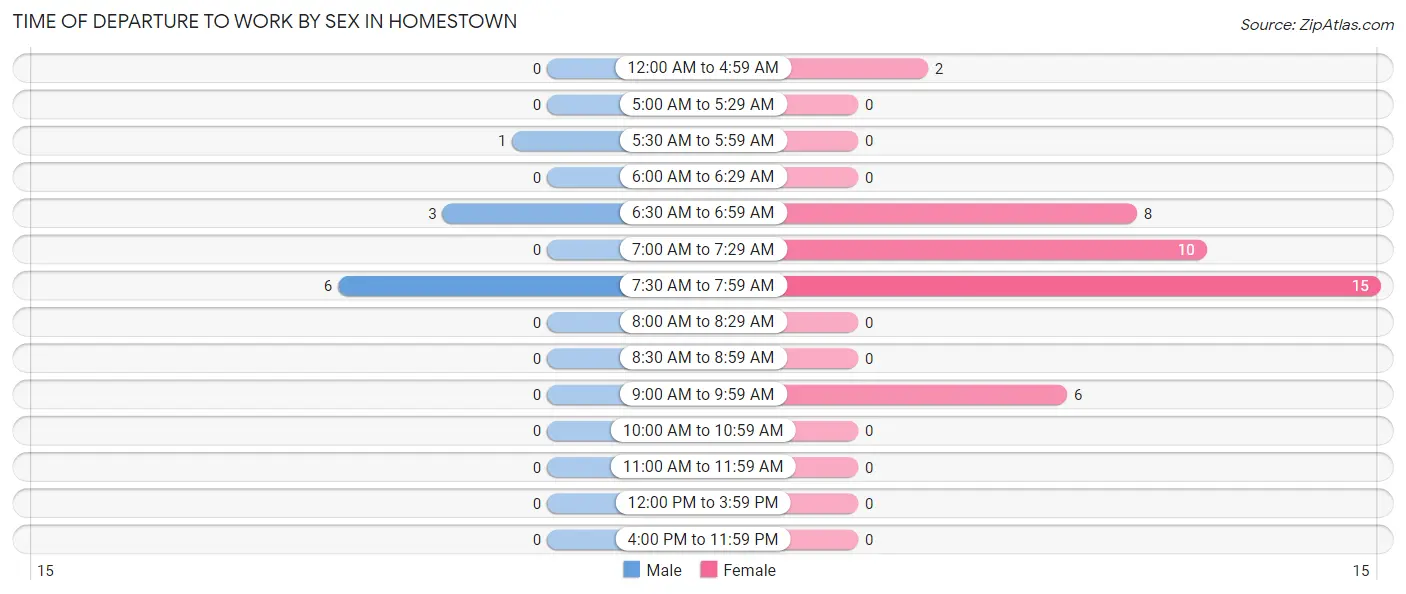
| Time of Departure | Male | Female |
| 12:00 AM to 4:59 AM | 0 (0.0%) | 2 (4.9%) |
| 5:00 AM to 5:29 AM | 0 (0.0%) | 0 (0.0%) |
| 5:30 AM to 5:59 AM | 1 (10.0%) | 0 (0.0%) |
| 6:00 AM to 6:29 AM | 0 (0.0%) | 0 (0.0%) |
| 6:30 AM to 6:59 AM | 3 (30.0%) | 8 (19.5%) |
| 7:00 AM to 7:29 AM | 0 (0.0%) | 10 (24.4%) |
| 7:30 AM to 7:59 AM | 6 (60.0%) | 15 (36.6%) |
| 8:00 AM to 8:29 AM | 0 (0.0%) | 0 (0.0%) |
| 8:30 AM to 8:59 AM | 0 (0.0%) | 0 (0.0%) |
| 9:00 AM to 9:59 AM | 0 (0.0%) | 6 (14.6%) |
| 10:00 AM to 10:59 AM | 0 (0.0%) | 0 (0.0%) |
| 11:00 AM to 11:59 AM | 0 (0.0%) | 0 (0.0%) |
| 12:00 PM to 3:59 PM | 0 (0.0%) | 0 (0.0%) |
| 4:00 PM to 11:59 PM | 0 (0.0%) | 0 (0.0%) |
| Total | 10 (100.0%) | 41 (100.0%) |
Housing Occupancy in Homestown
Occupancy by Ownership in Homestown
Of the total 58 dwellings in Homestown, owner-occupied units account for 49 (84.5%), while renter-occupied units make up 9 (15.5%).
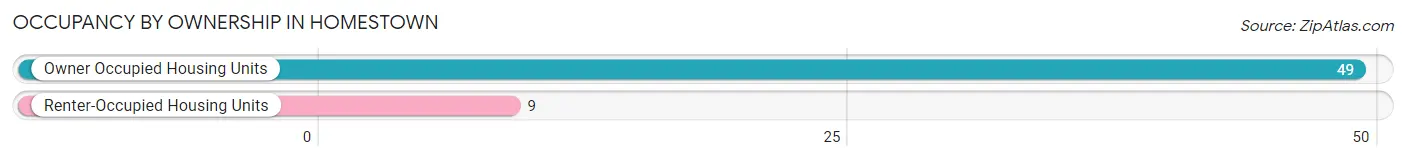
| Occupancy | # Housing Units | % Housing Units |
| Owner Occupied Housing Units | 49 | 84.5% |
| Renter-Occupied Housing Units | 9 | 15.5% |
| Total Occupied Housing Units | 58 | 100.0% |
Occupancy by Household Size in Homestown
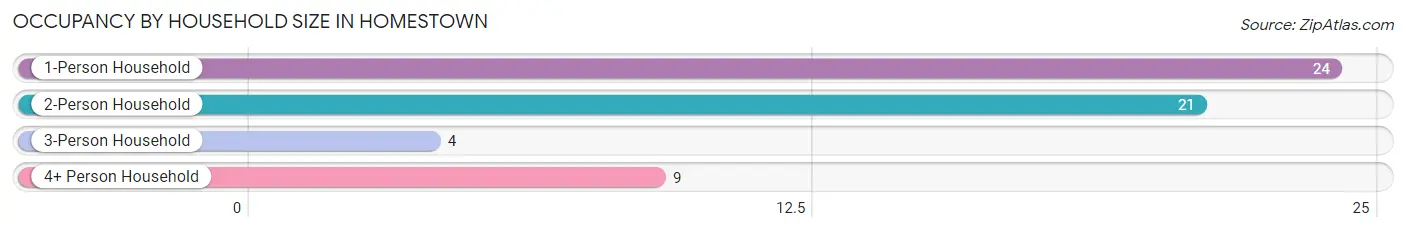
| Household Size | # Housing Units | % Housing Units |
| 1-Person Household | 24 | 41.4% |
| 2-Person Household | 21 | 36.2% |
| 3-Person Household | 4 | 6.9% |
| 4+ Person Household | 9 | 15.5% |
| Total Housing Units | 58 | 100.0% |
Occupancy by Ownership by Household Size in Homestown
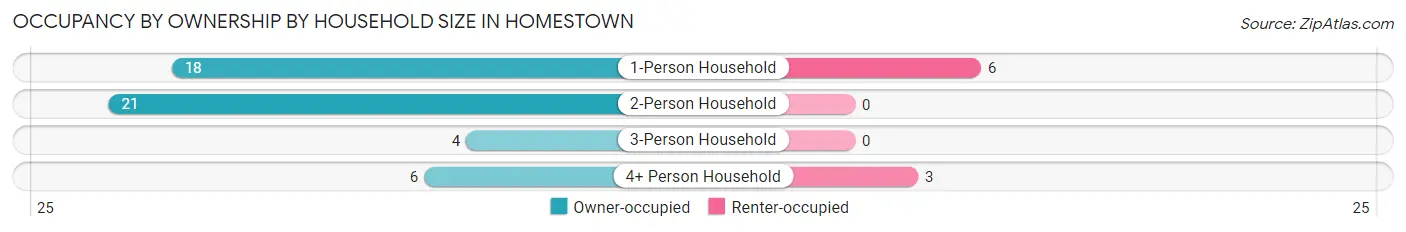
| Household Size | Owner-occupied | Renter-occupied |
| 1-Person Household | 18 (75.0%) | 6 (25.0%) |
| 2-Person Household | 21 (100.0%) | 0 (0.0%) |
| 3-Person Household | 4 (100.0%) | 0 (0.0%) |
| 4+ Person Household | 6 (66.7%) | 3 (33.3%) |
| Total Housing Units | 49 (84.5%) | 9 (15.5%) |
Occupancy by Educational Attainment in Homestown
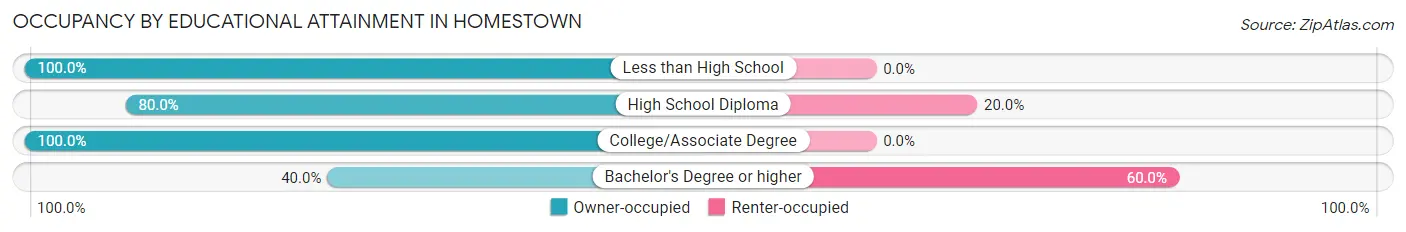
| Household Size | Owner-occupied | Renter-occupied |
| Less than High School | 23 (100.0%) | 0 (0.0%) |
| High School Diploma | 12 (80.0%) | 3 (20.0%) |
| College/Associate Degree | 10 (100.0%) | 0 (0.0%) |
| Bachelor's Degree or higher | 4 (40.0%) | 6 (60.0%) |
Occupancy by Age of Householder in Homestown
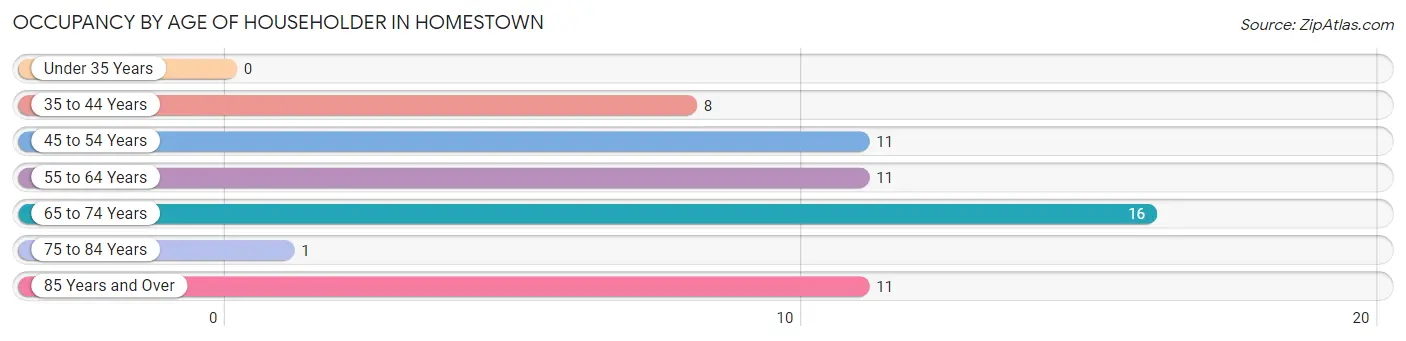
| Age Bracket | # Households | % Households |
| Under 35 Years | 0 | 0.0% |
| 35 to 44 Years | 8 | 13.8% |
| 45 to 54 Years | 11 | 19.0% |
| 55 to 64 Years | 11 | 19.0% |
| 65 to 74 Years | 16 | 27.6% |
| 75 to 84 Years | 1 | 1.7% |
| 85 Years and Over | 11 | 19.0% |
| Total | 58 | 100.0% |
Housing Finances in Homestown
Median Income by Occupancy in Homestown
| Occupancy Type | # Households | Median Income |
| Owner-Occupied | 49 (84.5%) | $0 |
| Renter-Occupied | 9 (15.5%) | $0 |
| Average | 58 (100.0%) | $0 |
Occupancy by Householder Income Bracket in Homestown
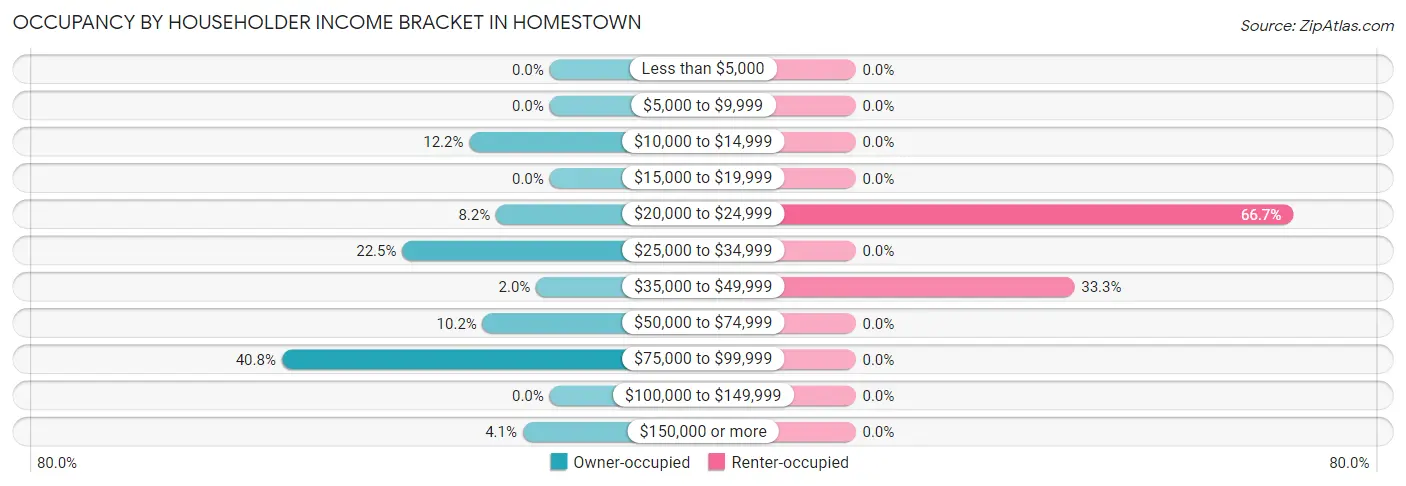
| Income Bracket | Owner-occupied | Renter-occupied |
| Less than $5,000 | 0 (0.0%) | 0 (0.0%) |
| $5,000 to $9,999 | 0 (0.0%) | 0 (0.0%) |
| $10,000 to $14,999 | 6 (12.2%) | 0 (0.0%) |
| $15,000 to $19,999 | 0 (0.0%) | 0 (0.0%) |
| $20,000 to $24,999 | 4 (8.2%) | 6 (66.7%) |
| $25,000 to $34,999 | 11 (22.5%) | 0 (0.0%) |
| $35,000 to $49,999 | 1 (2.0%) | 3 (33.3%) |
| $50,000 to $74,999 | 5 (10.2%) | 0 (0.0%) |
| $75,000 to $99,999 | 20 (40.8%) | 0 (0.0%) |
| $100,000 to $149,999 | 0 (0.0%) | 0 (0.0%) |
| $150,000 or more | 2 (4.1%) | 0 (0.0%) |
| Total | 49 (100.0%) | 9 (100.0%) |
Monthly Housing Cost Tiers in Homestown
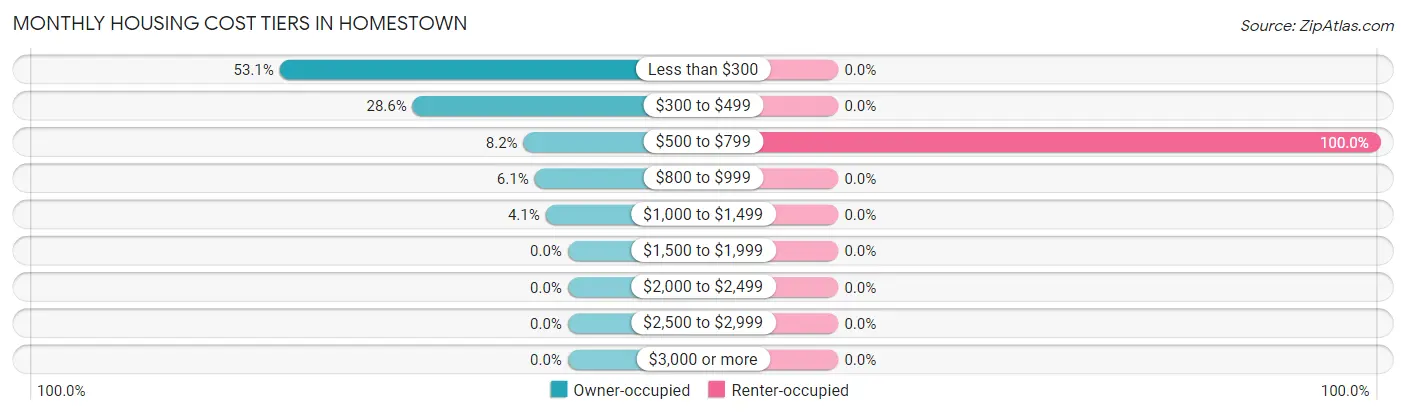
| Monthly Cost | Owner-occupied | Renter-occupied |
| Less than $300 | 26 (53.1%) | 0 (0.0%) |
| $300 to $499 | 14 (28.6%) | 0 (0.0%) |
| $500 to $799 | 4 (8.2%) | 9 (100.0%) |
| $800 to $999 | 3 (6.1%) | 0 (0.0%) |
| $1,000 to $1,499 | 2 (4.1%) | 0 (0.0%) |
| $1,500 to $1,999 | 0 (0.0%) | 0 (0.0%) |
| $2,000 to $2,499 | 0 (0.0%) | 0 (0.0%) |
| $2,500 to $2,999 | 0 (0.0%) | 0 (0.0%) |
| $3,000 or more | 0 (0.0%) | 0 (0.0%) |
| Total | 49 (100.0%) | 9 (100.0%) |
Physical Housing Characteristics in Homestown
Housing Structures in Homestown
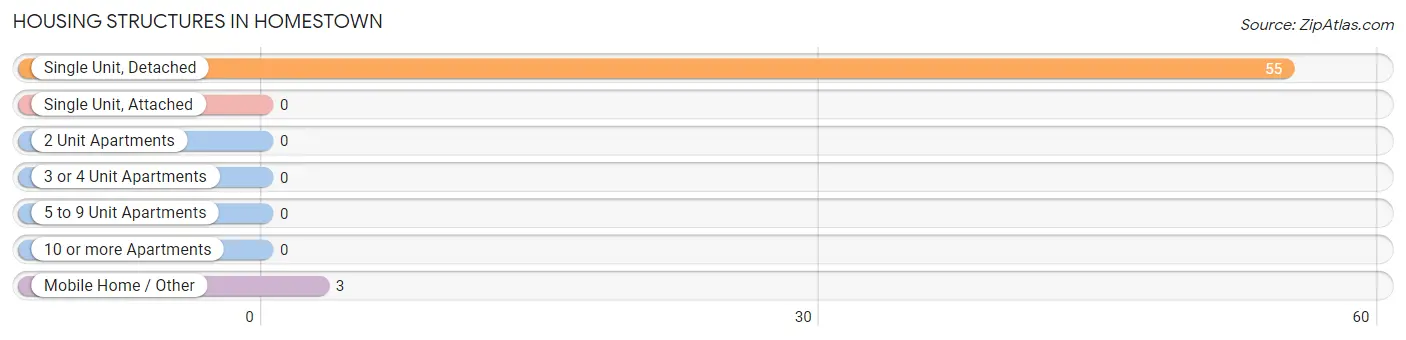
| Structure Type | # Housing Units | % Housing Units |
| Single Unit, Detached | 55 | 94.8% |
| Single Unit, Attached | 0 | 0.0% |
| 2 Unit Apartments | 0 | 0.0% |
| 3 or 4 Unit Apartments | 0 | 0.0% |
| 5 to 9 Unit Apartments | 0 | 0.0% |
| 10 or more Apartments | 0 | 0.0% |
| Mobile Home / Other | 3 | 5.2% |
| Total | 58 | 100.0% |
Housing Structures by Occupancy in Homestown
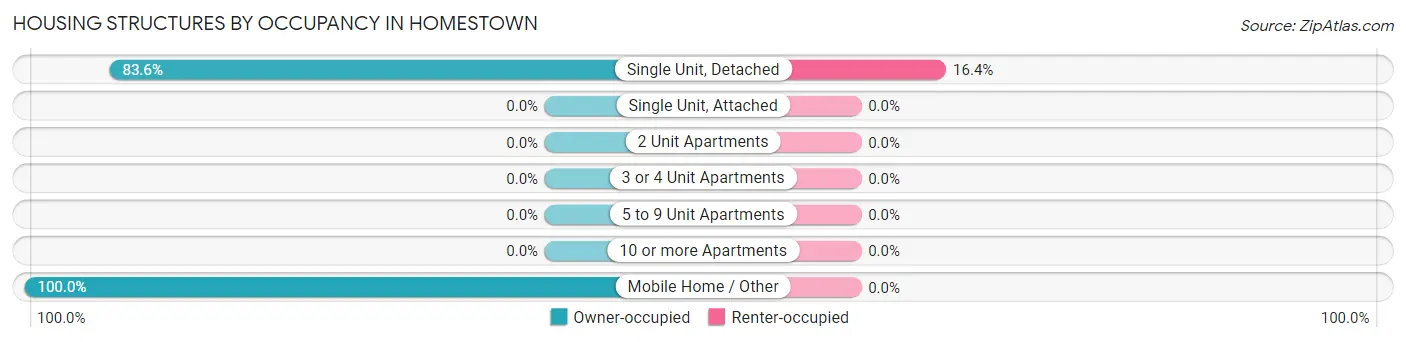
| Structure Type | Owner-occupied | Renter-occupied |
| Single Unit, Detached | 46 (83.6%) | 9 (16.4%) |
| Single Unit, Attached | 0 (0.0%) | 0 (0.0%) |
| 2 Unit Apartments | 0 (0.0%) | 0 (0.0%) |
| 3 or 4 Unit Apartments | 0 (0.0%) | 0 (0.0%) |
| 5 to 9 Unit Apartments | 0 (0.0%) | 0 (0.0%) |
| 10 or more Apartments | 0 (0.0%) | 0 (0.0%) |
| Mobile Home / Other | 3 (100.0%) | 0 (0.0%) |
| Total | 49 (84.5%) | 9 (15.5%) |
Housing Structures by Number of Rooms in Homestown
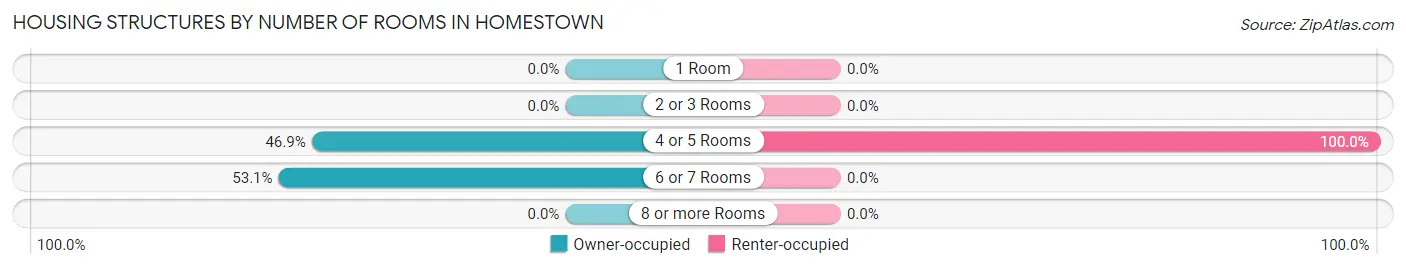
| Number of Rooms | Owner-occupied | Renter-occupied |
| 1 Room | 0 (0.0%) | 0 (0.0%) |
| 2 or 3 Rooms | 0 (0.0%) | 0 (0.0%) |
| 4 or 5 Rooms | 23 (46.9%) | 9 (100.0%) |
| 6 or 7 Rooms | 26 (53.1%) | 0 (0.0%) |
| 8 or more Rooms | 0 (0.0%) | 0 (0.0%) |
| Total | 49 (100.0%) | 9 (100.0%) |
Housing Structure by Heating Type in Homestown
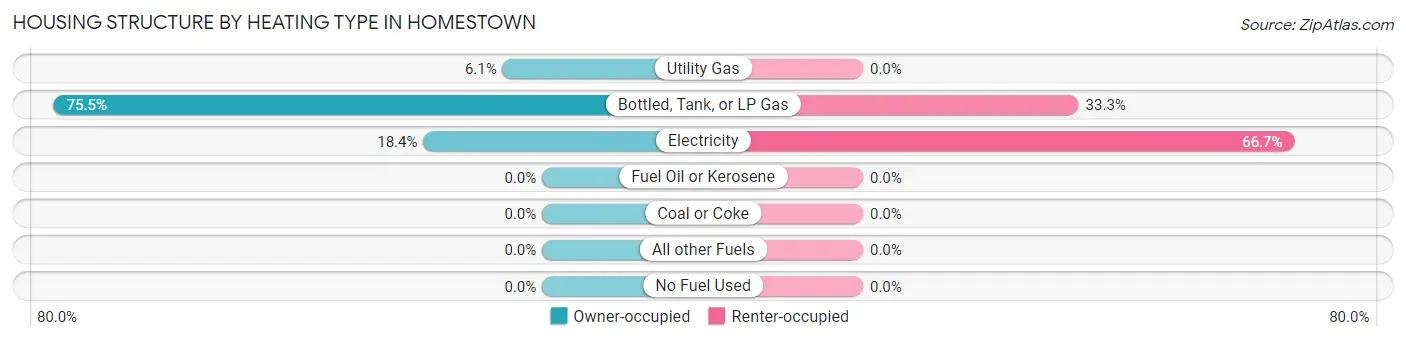
| Heating Type | Owner-occupied | Renter-occupied |
| Utility Gas | 3 (6.1%) | 0 (0.0%) |
| Bottled, Tank, or LP Gas | 37 (75.5%) | 3 (33.3%) |
| Electricity | 9 (18.4%) | 6 (66.7%) |
| Fuel Oil or Kerosene | 0 (0.0%) | 0 (0.0%) |
| Coal or Coke | 0 (0.0%) | 0 (0.0%) |
| All other Fuels | 0 (0.0%) | 0 (0.0%) |
| No Fuel Used | 0 (0.0%) | 0 (0.0%) |
| Total | 49 (100.0%) | 9 (100.0%) |
Household Vehicle Usage in Homestown
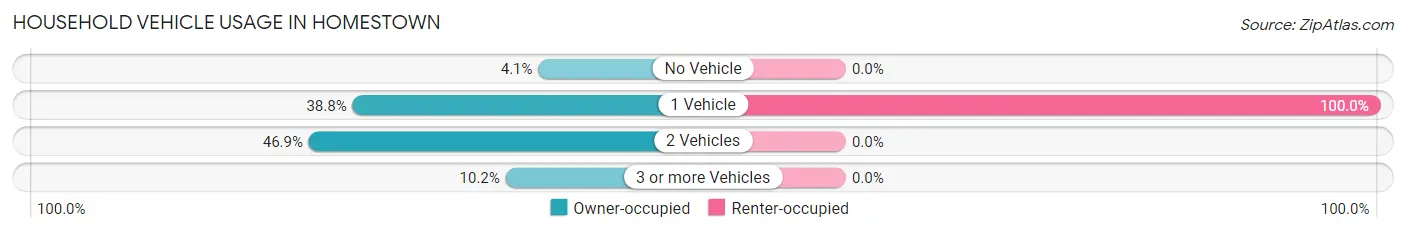
| Vehicles per Household | Owner-occupied | Renter-occupied |
| No Vehicle | 2 (4.1%) | 0 (0.0%) |
| 1 Vehicle | 19 (38.8%) | 9 (100.0%) |
| 2 Vehicles | 23 (46.9%) | 0 (0.0%) |
| 3 or more Vehicles | 5 (10.2%) | 0 (0.0%) |
| Total | 49 (100.0%) | 9 (100.0%) |
Real Estate & Mortgages in Homestown
Real Estate and Mortgage Overview in Homestown
| Characteristic | Without Mortgage | With Mortgage |
| Housing Units | 44 | 5 |
| Median Property Value | - | - |
| Median Household Income | - | - |
| Monthly Housing Costs | $275 | $0 |
| Real Estate Taxes | $218 | $0 |
Property Value by Mortgage Status in Homestown
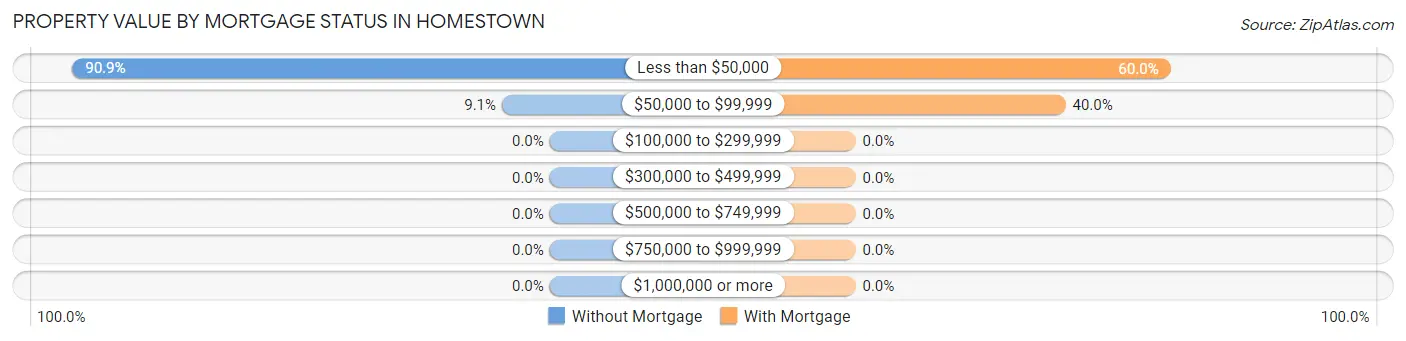
| Property Value | Without Mortgage | With Mortgage |
| Less than $50,000 | 40 (90.9%) | 3 (60.0%) |
| $50,000 to $99,999 | 4 (9.1%) | 2 (40.0%) |
| $100,000 to $299,999 | 0 (0.0%) | 0 (0.0%) |
| $300,000 to $499,999 | 0 (0.0%) | 0 (0.0%) |
| $500,000 to $749,999 | 0 (0.0%) | 0 (0.0%) |
| $750,000 to $999,999 | 0 (0.0%) | 0 (0.0%) |
| $1,000,000 or more | 0 (0.0%) | 0 (0.0%) |
| Total | 44 (100.0%) | 5 (100.0%) |
Household Income by Mortgage Status in Homestown
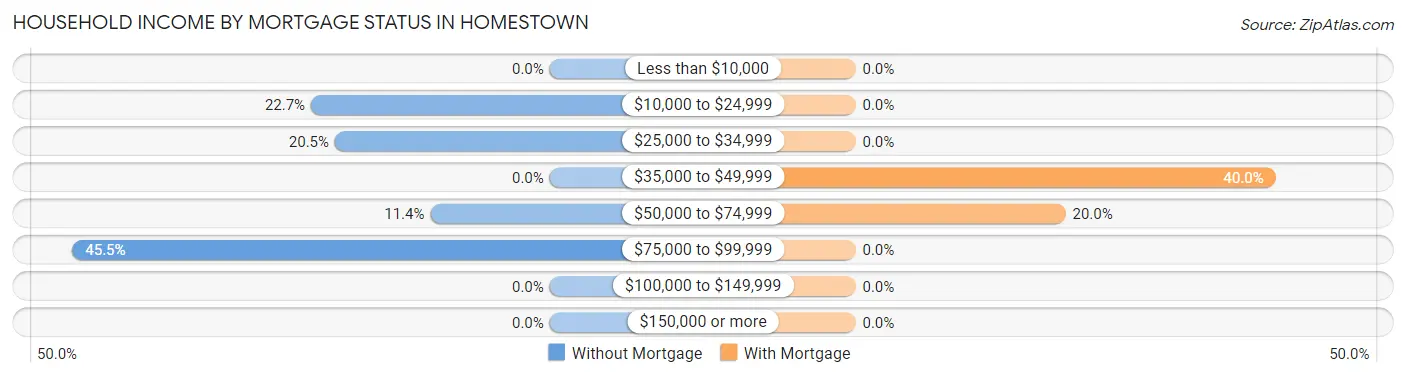
| Household Income | Without Mortgage | With Mortgage |
| Less than $10,000 | 0 (0.0%) | 0 (0.0%) |
| $10,000 to $24,999 | 10 (22.7%) | 0 (0.0%) |
| $25,000 to $34,999 | 9 (20.4%) | 0 (0.0%) |
| $35,000 to $49,999 | 0 (0.0%) | 2 (40.0%) |
| $50,000 to $74,999 | 5 (11.4%) | 1 (20.0%) |
| $75,000 to $99,999 | 20 (45.5%) | 0 (0.0%) |
| $100,000 to $149,999 | 0 (0.0%) | 0 (0.0%) |
| $150,000 or more | 0 (0.0%) | 0 (0.0%) |
| Total | 44 (100.0%) | 5 (100.0%) |
Property Value to Household Income Ratio in Homestown
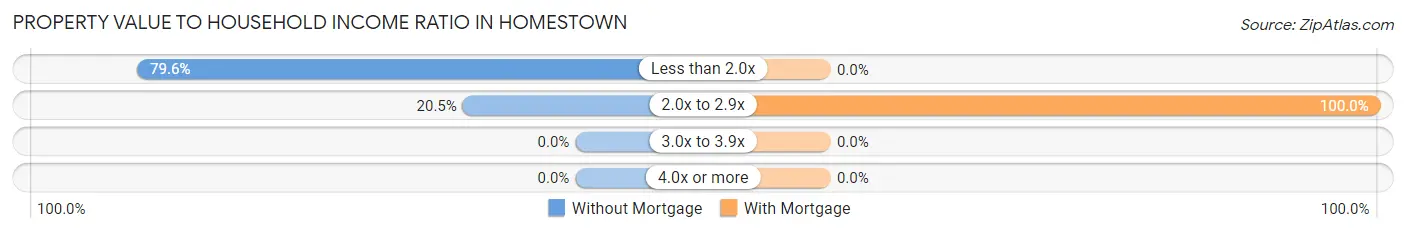
| Value-to-Income Ratio | Without Mortgage | With Mortgage |
| Less than 2.0x | 35 (79.5%) | 0 (0.0%) |
| 2.0x to 2.9x | 9 (20.4%) | 5 (100.0%) |
| 3.0x to 3.9x | 0 (0.0%) | 0 (0.0%) |
| 4.0x or more | 0 (0.0%) | 0 (0.0%) |
| Total | 44 (100.0%) | 5 (100.0%) |
Real Estate Taxes by Mortgage Status in Homestown
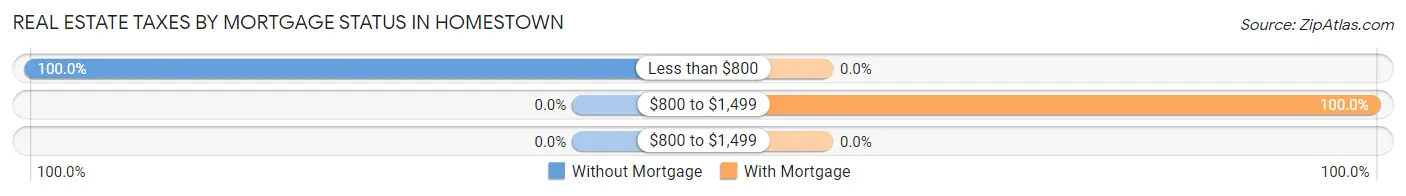
| Property Taxes | Without Mortgage | With Mortgage |
| Less than $800 | 44 (100.0%) | 0 (0.0%) |
| $800 to $1,499 | 0 (0.0%) | 5 (100.0%) |
| $800 to $1,499 | 0 (0.0%) | 0 (0.0%) |
| Total | 44 (100.0%) | 5 (100.0%) |
Health & Disability in Homestown
Health Insurance Coverage by Age in Homestown
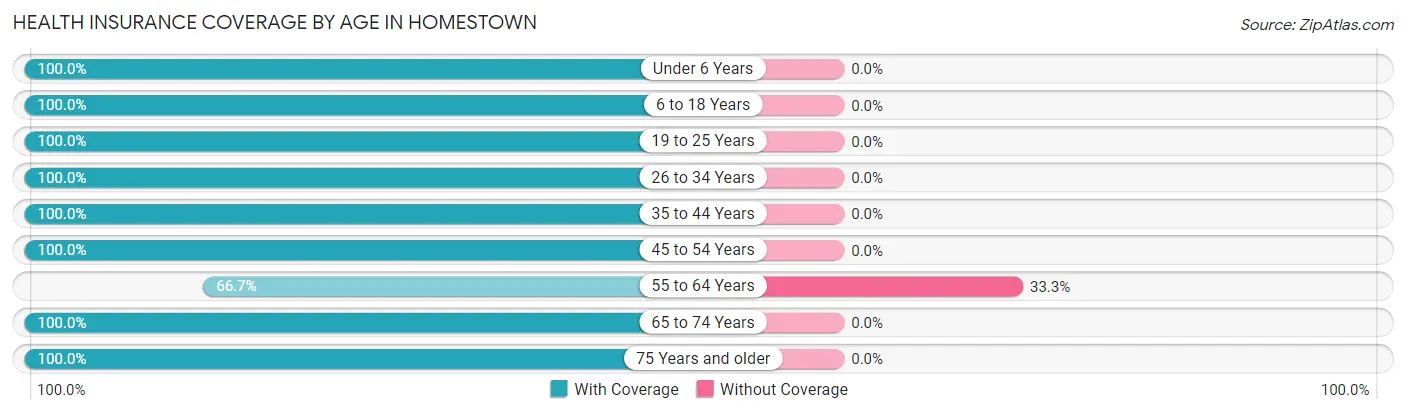
| Age Bracket | With Coverage | Without Coverage |
| Under 6 Years | 3 (100.0%) | 0 (0.0%) |
| 6 to 18 Years | 2 (100.0%) | 0 (0.0%) |
| 19 to 25 Years | 27 (100.0%) | 0 (0.0%) |
| 26 to 34 Years | 2 (100.0%) | 0 (0.0%) |
| 35 to 44 Years | 13 (100.0%) | 0 (0.0%) |
| 45 to 54 Years | 11 (100.0%) | 0 (0.0%) |
| 55 to 64 Years | 14 (66.7%) | 7 (33.3%) |
| 65 to 74 Years | 18 (100.0%) | 0 (0.0%) |
| 75 Years and older | 23 (100.0%) | 0 (0.0%) |
| Total | 113 (94.2%) | 7 (5.8%) |
Health Insurance Coverage by Citizenship Status in Homestown
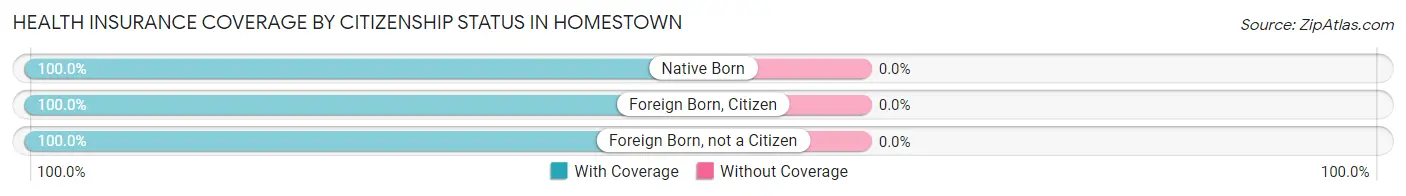
| Citizenship Status | With Coverage | Without Coverage |
| Native Born | 3 (100.0%) | 0 (0.0%) |
| Foreign Born, Citizen | 2 (100.0%) | 0 (0.0%) |
| Foreign Born, not a Citizen | 27 (100.0%) | 0 (0.0%) |
Health Insurance Coverage by Household Income in Homestown
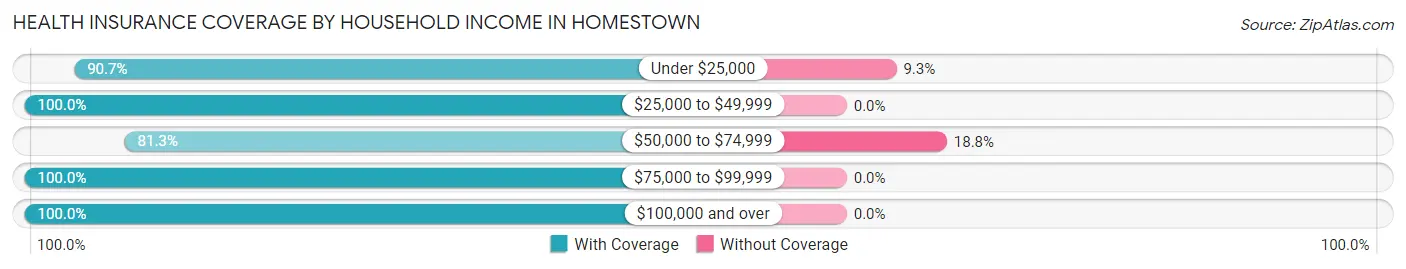
| Household Income | With Coverage | Without Coverage |
| Under $25,000 | 39 (90.7%) | 4 (9.3%) |
| $25,000 to $49,999 | 23 (100.0%) | 0 (0.0%) |
| $50,000 to $74,999 | 13 (81.2%) | 3 (18.8%) |
| $75,000 to $99,999 | 26 (100.0%) | 0 (0.0%) |
| $100,000 and over | 12 (100.0%) | 0 (0.0%) |
Public vs Private Health Insurance Coverage by Age in Homestown
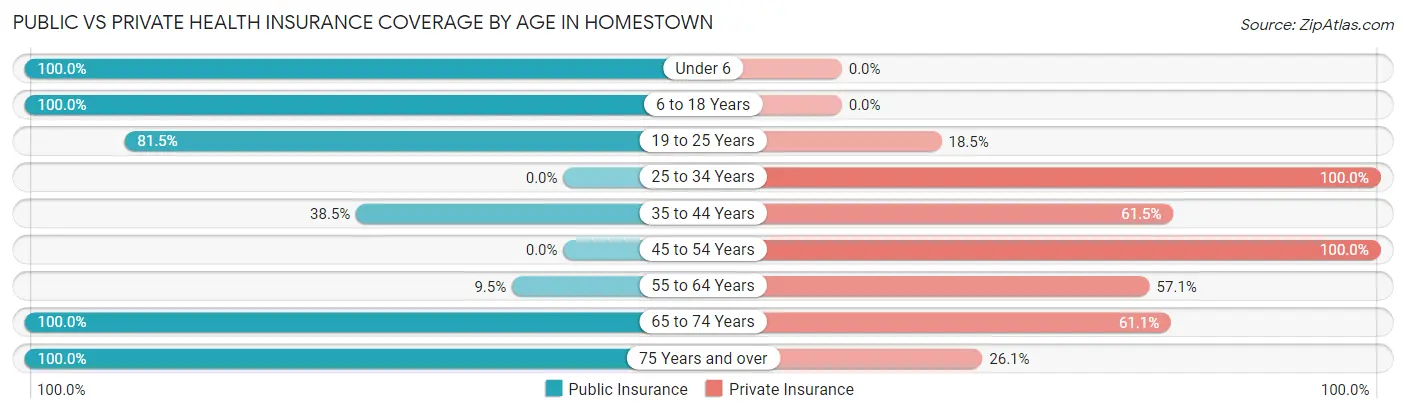
| Age Bracket | Public Insurance | Private Insurance |
| Under 6 | 3 (100.0%) | 0 (0.0%) |
| 6 to 18 Years | 2 (100.0%) | 0 (0.0%) |
| 19 to 25 Years | 22 (81.5%) | 5 (18.5%) |
| 25 to 34 Years | 0 (0.0%) | 2 (100.0%) |
| 35 to 44 Years | 5 (38.5%) | 8 (61.5%) |
| 45 to 54 Years | 0 (0.0%) | 11 (100.0%) |
| 55 to 64 Years | 2 (9.5%) | 12 (57.1%) |
| 65 to 74 Years | 18 (100.0%) | 11 (61.1%) |
| 75 Years and over | 23 (100.0%) | 6 (26.1%) |
| Total | 75 (62.5%) | 55 (45.8%) |
Disability Status by Sex by Age in Homestown
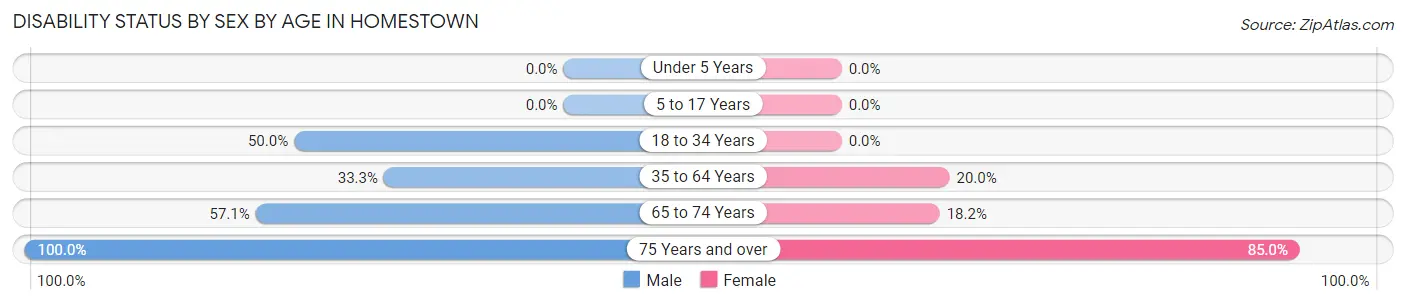
| Age Bracket | Male | Female |
| Under 5 Years | 0 (0.0%) | 0 (0.0%) |
| 5 to 17 Years | 0 (0.0%) | 0 (0.0%) |
| 18 to 34 Years | 11 (50.0%) | 0 (0.0%) |
| 35 to 64 Years | 5 (33.3%) | 6 (20.0%) |
| 65 to 74 Years | 4 (57.1%) | 2 (18.2%) |
| 75 Years and over | 3 (100.0%) | 17 (85.0%) |
Disability Class by Sex by Age in Homestown
Disability Class: Hearing Difficulty
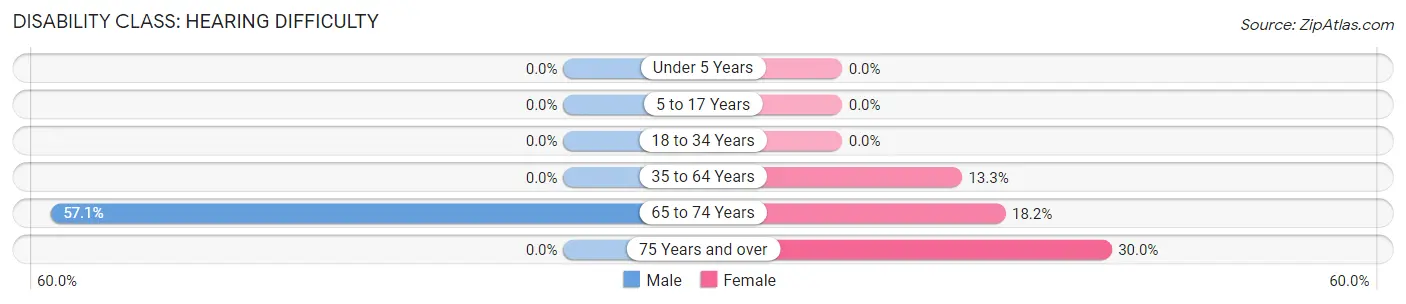
| Age Bracket | Male | Female |
| Under 5 Years | 0 (0.0%) | 0 (0.0%) |
| 5 to 17 Years | 0 (0.0%) | 0 (0.0%) |
| 18 to 34 Years | 0 (0.0%) | 0 (0.0%) |
| 35 to 64 Years | 0 (0.0%) | 4 (13.3%) |
| 65 to 74 Years | 4 (57.1%) | 2 (18.2%) |
| 75 Years and over | 0 (0.0%) | 6 (30.0%) |
Disability Class: Vision Difficulty
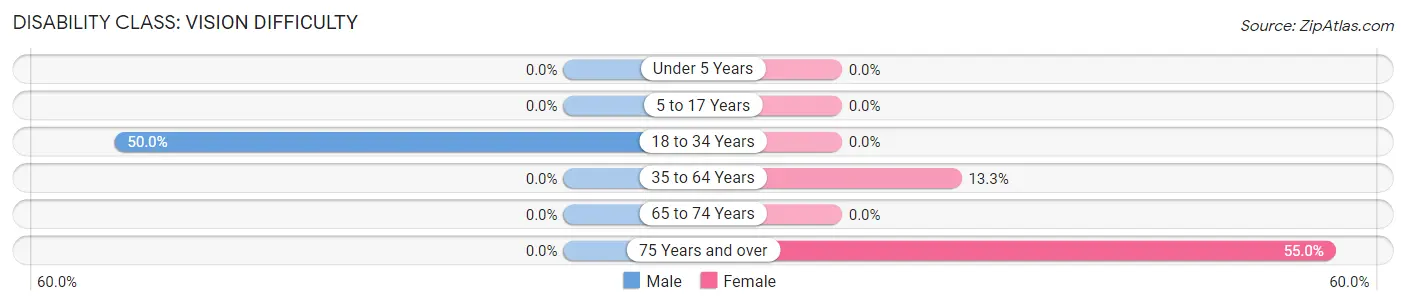
| Age Bracket | Male | Female |
| Under 5 Years | 0 (0.0%) | 0 (0.0%) |
| 5 to 17 Years | 0 (0.0%) | 0 (0.0%) |
| 18 to 34 Years | 11 (50.0%) | 0 (0.0%) |
| 35 to 64 Years | 0 (0.0%) | 4 (13.3%) |
| 65 to 74 Years | 0 (0.0%) | 0 (0.0%) |
| 75 Years and over | 0 (0.0%) | 11 (55.0%) |
Disability Class: Cognitive Difficulty
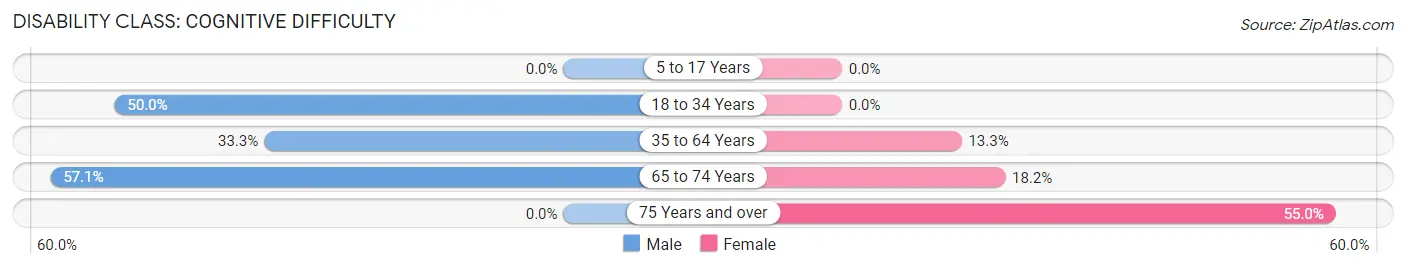
| Age Bracket | Male | Female |
| 5 to 17 Years | 0 (0.0%) | 0 (0.0%) |
| 18 to 34 Years | 11 (50.0%) | 0 (0.0%) |
| 35 to 64 Years | 5 (33.3%) | 4 (13.3%) |
| 65 to 74 Years | 4 (57.1%) | 2 (18.2%) |
| 75 Years and over | 0 (0.0%) | 11 (55.0%) |
Disability Class: Ambulatory Difficulty
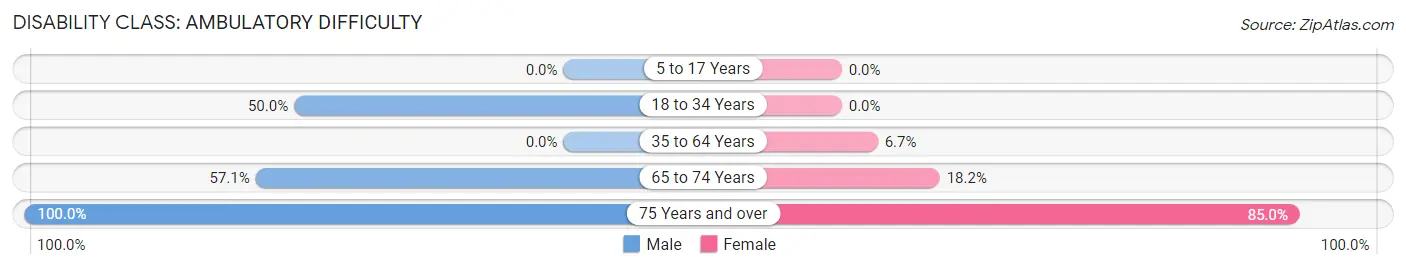
| Age Bracket | Male | Female |
| 5 to 17 Years | 0 (0.0%) | 0 (0.0%) |
| 18 to 34 Years | 11 (50.0%) | 0 (0.0%) |
| 35 to 64 Years | 0 (0.0%) | 2 (6.7%) |
| 65 to 74 Years | 4 (57.1%) | 2 (18.2%) |
| 75 Years and over | 3 (100.0%) | 17 (85.0%) |
Disability Class: Self-Care Difficulty
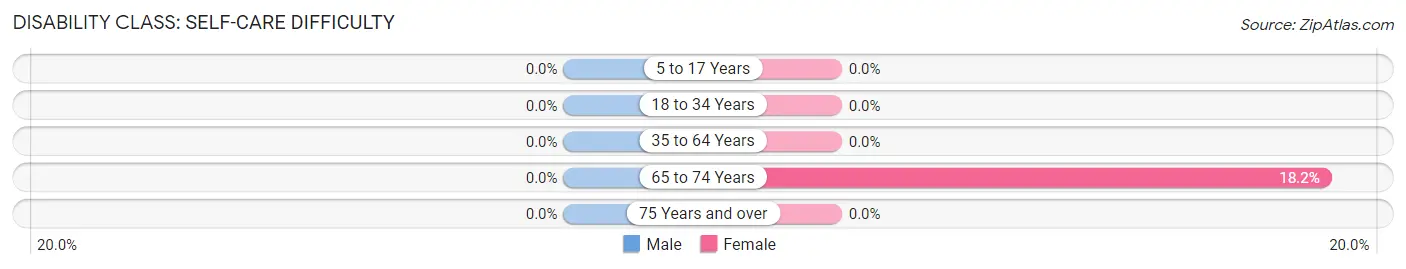
| Age Bracket | Male | Female |
| 5 to 17 Years | 0 (0.0%) | 0 (0.0%) |
| 18 to 34 Years | 0 (0.0%) | 0 (0.0%) |
| 35 to 64 Years | 0 (0.0%) | 0 (0.0%) |
| 65 to 74 Years | 0 (0.0%) | 2 (18.2%) |
| 75 Years and over | 0 (0.0%) | 0 (0.0%) |
Technology Access in Homestown
Computing Device Access in Homestown
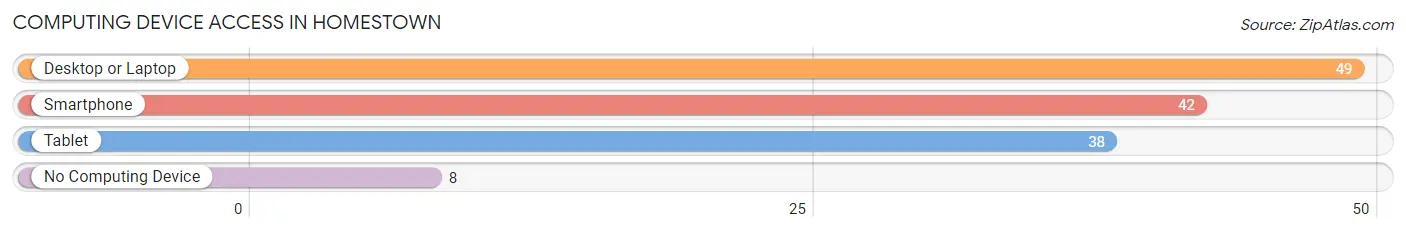
| Device Type | # Households | % Households |
| Desktop or Laptop | 49 | 84.5% |
| Smartphone | 42 | 72.4% |
| Tablet | 38 | 65.5% |
| No Computing Device | 8 | 13.8% |
| Total | 58 | 100.0% |
Internet Access in Homestown
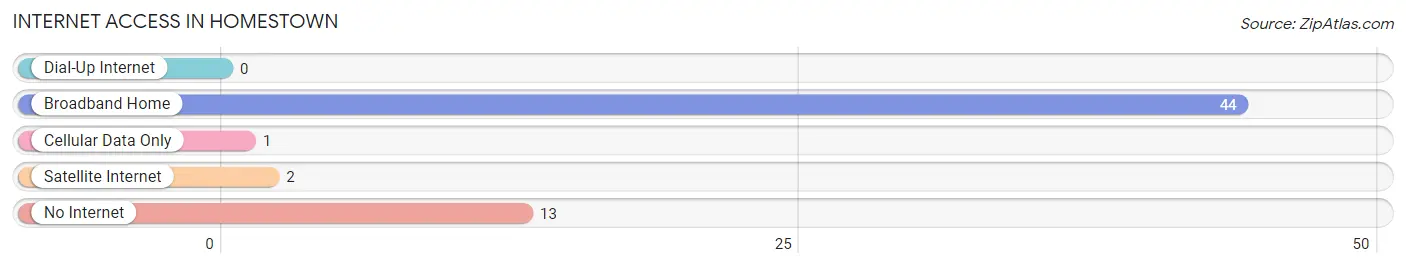
| Internet Type | # Households | % Households |
| Dial-Up Internet | 0 | 0.0% |
| Broadband Home | 44 | 75.9% |
| Cellular Data Only | 1 | 1.7% |
| Satellite Internet | 2 | 3.5% |
| No Internet | 13 | 22.4% |
| Total | 58 | 100.0% |
Homestown Summary
Homestown, MO is a small town located in the Ozark Mountains of Missouri. It is situated in the southeastern corner of the state, near the Arkansas border. The town has a population of approximately 1,500 people and is the county seat of Ozark County.
History
Homestown was founded in 1845 by a group of settlers from Tennessee. The town was originally called “Homesville”, but the name was changed to “Homestown” in 1848. The town was incorporated in 1851 and has remained a small, rural community ever since.
The town was an important stop on the Butterfield Overland Mail route, which ran from St. Louis to San Francisco. The route was established in 1858 and ran through Homestown until 1861, when the Civil War caused it to be discontinued.
Geography
Homestown is located in the Ozark Mountains of Missouri. The town is situated in the southeastern corner of the state, near the Arkansas border. The town is surrounded by rolling hills and is located in a valley between two mountain ranges. The town is located at an elevation of 1,000 feet above sea level.
The climate in Homestown is humid subtropical, with hot summers and mild winters. The average annual temperature is around 60 degrees Fahrenheit. The town receives an average of 45 inches of precipitation per year, with most of it falling in the spring and summer months.
Economy
The economy of Homestown is largely based on agriculture and tourism. The town is home to several small farms, which produce a variety of crops, including corn, soybeans, wheat, and hay. The town also has several small businesses, including a grocery store, a hardware store, and a few restaurants.
Tourism is an important part of the local economy. The town is home to several attractions, including a historic courthouse, a museum, and a number of outdoor activities, such as fishing, hunting, and camping.
Demographics
As of the 2010 census, the population of Homestown was 1,500 people. The racial makeup of the town was 97.3% White, 0.7% African American, 0.3% Native American, 0.3% Asian, and 1.3% from other races. The median household income was $35,000, and the median age was 42 years.
Conclusion
Homestown, MO is a small town located in the Ozark Mountains of Missouri. It has a population of approximately 1,500 people and is the county seat of Ozark County. The town was founded in 1845 and has remained a small, rural community ever since. The economy of Homestown is largely based on agriculture and tourism, and the town is home to several attractions, including a historic courthouse, a museum, and a number of outdoor activities. As of the 2010 census, the population of Homestown was 1,500 people, with a median household income of $35,000 and a median age of 42 years.
Common Questions
What is Per Capita Income in Homestown?
Per Capita income in Homestown is $23,465.
What is the Median Family Income in Homestown?
Median Family Income in Homestown is $82,763.
What is Inequality or Gini Index in Homestown?
Inequality or Gini Index in Homestown is 0.35.
What is the Total Population of Homestown?
Total Population of Homestown is 120.
What is the Total Male Population of Homestown?
Total Male Population of Homestown is 49.
What is the Total Female Population of Homestown?
Total Female Population of Homestown is 71.
What is the Ratio of Males per 100 Females in Homestown?
There are 69.01 Males per 100 Females in Homestown.
What is the Ratio of Females per 100 Males in Homestown?
There are 144.90 Females per 100 Males in Homestown.
What is the Median Population Age in Homestown?
Median Population Age in Homestown is 56.5 Years.
What is the Average Family Size in Homestown
Average Family Size in Homestown is 2.6 People.
What is the Average Household Size in Homestown
Average Household Size in Homestown is 2.1 People.
How Large is the Labor Force in Homestown?
There are 52 People in the Labor Forcein in Homestown.
What is the Percentage of People in the Labor Force in Homestown?
45.2% of People are in the Labor Force in Homestown.
What is the Unemployment Rate in Homestown?
Unemployment Rate in Homestown is 1.9%.