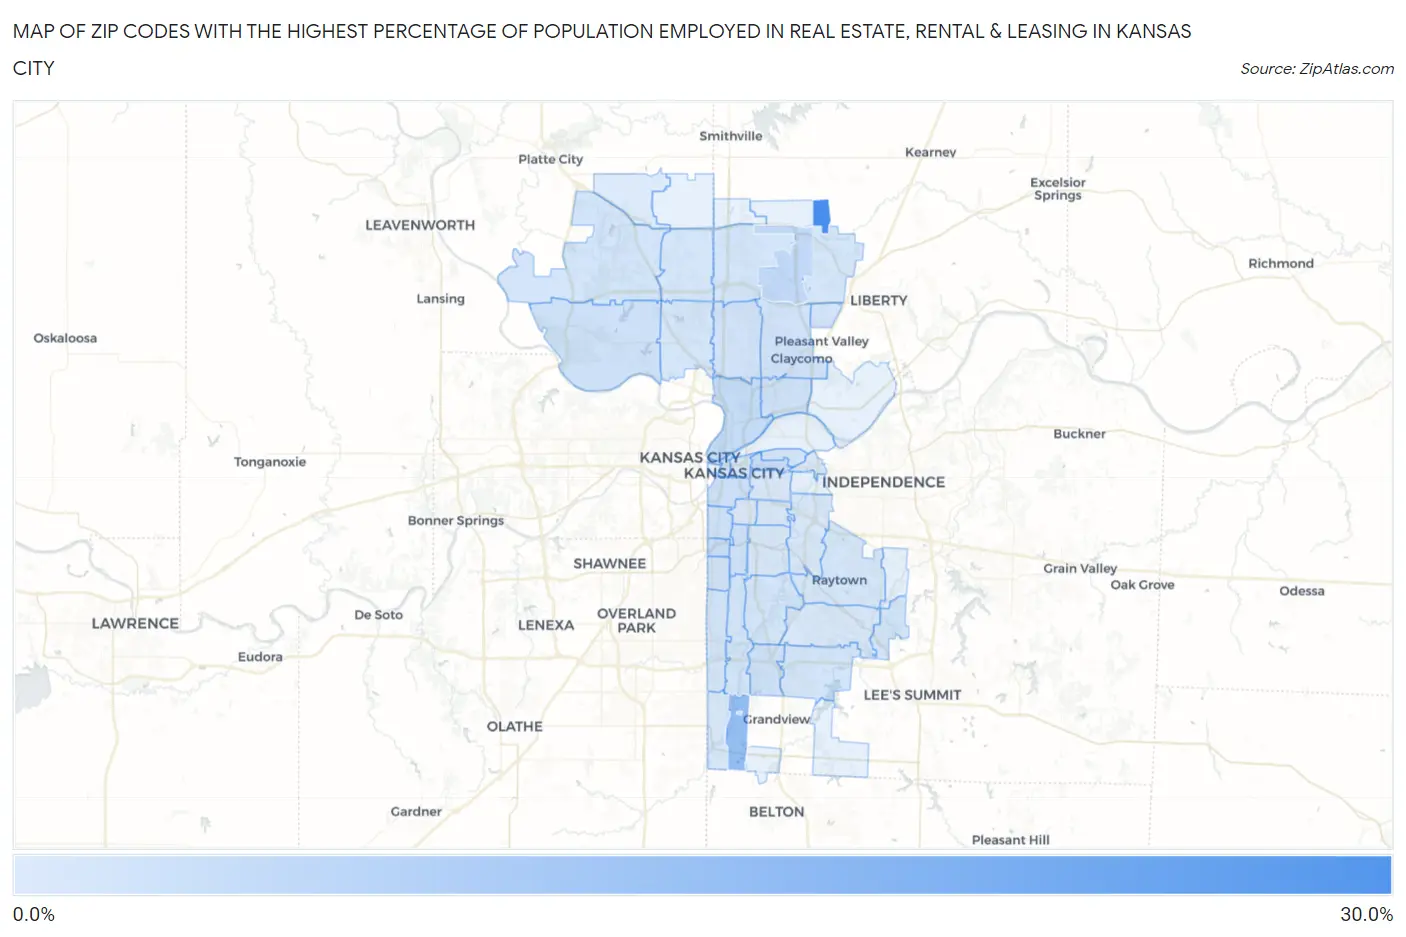
Zip Codes with the Highest Percentage of Population Employed in Real Estate, Rental & Leasing in Kansas City, MO
RELATED REPORTS & OPTIONS
Real Estate, Rental & Leasing
Kansas City
Compare Zip Codes
Map of Zip Codes with the Highest Percentage of Population Employed in Real Estate, Rental & Leasing in Kansas City
0.20%
28.5%
Zip Codes with the Highest Percentage of Population Employed in Real Estate, Rental & Leasing in Kansas City, MO
| Zip Code | % Employed | vs State | vs National | |
| 1. | 64167 | 28.5% | 1.6%(+26.8)#4 | 1.9%(+26.6)#50 |
| 2. | 64146 | 12.9% | 1.6%(+11.3)#7 | 1.9%(+11.1)#229 |
| 3. | 64156 | 4.9% | 1.6%(+3.30)#37 | 1.9%(+3.04)#1,433 |
| 4. | 64116 | 4.1% | 1.6%(+2.46)#49 | 1.9%(+2.19)#2,081 |
| 5. | 64124 | 3.3% | 1.6%(+1.70)#69 | 1.9%(+1.44)#3,148 |
| 6. | 64112 | 3.2% | 1.6%(+1.58)#73 | 1.9%(+1.32)#3,386 |
| 7. | 64108 | 2.7% | 1.6%(+1.12)#102 | 1.9%(+0.856)#4,590 |
| 8. | 64152 | 2.7% | 1.6%(+1.09)#105 | 1.9%(+0.824)#4,698 |
| 9. | 64111 | 2.7% | 1.6%(+1.07)#109 | 1.9%(+0.805)#4,753 |
| 10. | 64117 | 2.7% | 1.6%(+1.03)#115 | 1.9%(+0.766)#4,906 |
| 11. | 64137 | 2.7% | 1.6%(+1.03)#116 | 1.9%(+0.764)#4,915 |
| 12. | 64110 | 2.7% | 1.6%(+1.02)#117 | 1.9%(+0.759)#4,934 |
| 13. | 64118 | 2.3% | 1.6%(+0.693)#148 | 1.9%(+0.433)#6,207 |
| 14. | 64119 | 2.3% | 1.6%(+0.652)#155 | 1.9%(+0.392)#6,384 |
| 15. | 64113 | 2.3% | 1.6%(+0.623)#158 | 1.9%(+0.362)#6,544 |
| 16. | 64105 | 2.2% | 1.6%(+0.540)#167 | 1.9%(+0.279)#6,953 |
| 17. | 64158 | 2.0% | 1.6%(+0.352)#188 | 1.9%(+0.091)#7,935 |
| 18. | 64131 | 1.9% | 1.6%(+0.224)#201 | 1.9%(-0.037)#8,746 |
| 19. | 64114 | 1.9% | 1.6%(+0.221)#202 | 1.9%(-0.039)#8,760 |
| 20. | 64123 | 1.8% | 1.6%(+0.177)#210 | 1.9%(-0.084)#9,076 |
| 21. | 64153 | 1.8% | 1.6%(+0.119)#216 | 1.9%(-0.141)#9,437 |
| 22. | 64155 | 1.6% | 1.6%(+0.014)#232 | 1.9%(-0.247)#10,148 |
| 23. | 64139 | 1.6% | 1.6%(-0.045)#239 | 1.9%(-0.306)#10,543 |
| 24. | 64134 | 1.6% | 1.6%(-0.057)#241 | 1.9%(-0.318)#10,617 |
| 25. | 64132 | 1.6% | 1.6%(-0.062)#244 | 1.9%(-0.323)#10,647 |
| 26. | 64151 | 1.5% | 1.6%(-0.084)#247 | 1.9%(-0.344)#10,810 |
| 27. | 64133 | 1.5% | 1.6%(-0.104)#253 | 1.9%(-0.365)#10,955 |
| 28. | 64154 | 1.4% | 1.6%(-0.187)#266 | 1.9%(-0.447)#11,622 |
| 29. | 64157 | 1.4% | 1.6%(-0.249)#288 | 1.9%(-0.510)#12,125 |
| 30. | 64106 | 1.3% | 1.6%(-0.379)#310 | 1.9%(-0.640)#13,079 |
| 31. | 64138 | 1.1% | 1.6%(-0.510)#328 | 1.9%(-0.771)#14,108 |
| 32. | 64130 | 1.1% | 1.6%(-0.575)#345 | 1.9%(-0.836)#14,671 |
| 33. | 64128 | 0.92% | 1.6%(-0.710)#381 | 1.9%(-0.970)#15,783 |
| 34. | 64125 | 0.91% | 1.6%(-0.718)#383 | 1.9%(-0.979)#15,871 |
| 35. | 64145 | 0.86% | 1.6%(-0.767)#394 | 1.9%(-1.03)#16,230 |
| 36. | 64129 | 0.79% | 1.6%(-0.843)#409 | 1.9%(-1.10)#16,796 |
| 37. | 64127 | 0.77% | 1.6%(-0.860)#410 | 1.9%(-1.12)#16,915 |
| 38. | 64109 | 0.65% | 1.6%(-0.979)#434 | 1.9%(-1.24)#17,861 |
| 39. | 64163 | 0.20% | 1.6%(-1.43)#543 | 1.9%(-1.69)#20,984 |
1
Common Questions
What are the Top 10 Zip Codes with the Highest Percentage of Population Employed in Real Estate, Rental & Leasing in Kansas City, MO?
Top 10 Zip Codes with the Highest Percentage of Population Employed in Real Estate, Rental & Leasing in Kansas City, MO are:
What zip code has the Highest Percentage of Population Employed in Real Estate, Rental & Leasing in Kansas City, MO?
64167 has the Highest Percentage of Population Employed in Real Estate, Rental & Leasing in Kansas City, MO with 28.5%.
What is the Percentage of Population Employed in Real Estate, Rental & Leasing in Kansas City, MO?
Percentage of Population Employed in Real Estate, Rental & Leasing in Kansas City is 1.9%.
What is the Percentage of Population Employed in Real Estate, Rental & Leasing in Missouri?
Percentage of Population Employed in Real Estate, Rental & Leasing in Missouri is 1.6%.
What is the Percentage of Population Employed in Real Estate, Rental & Leasing in the United States?
Percentage of Population Employed in Real Estate, Rental & Leasing in the United States is 1.9%.