Whiteside, MO Map & Demographics
Whiteside Map
Whiteside Overview
$32,115
PER CAPITA INCOME
$88,125
AVG FAMILY INCOME
$93,333
AVG HOUSEHOLD INCOME
39.6%
WAGE / INCOME GAP [ % ]
60.4¢/ $1
WAGE / INCOME GAP [ $ ]
0.32
INEQUALITY / GINI INDEX
107
TOTAL POPULATION
76
MALE POPULATION
31
FEMALE POPULATION
245.16
MALES / 100 FEMALES
40.79
FEMALES / 100 MALES
43.5
MEDIAN AGE
3.0
AVG FAMILY SIZE
2.4
AVG HOUSEHOLD SIZE
58
LABOR FORCE [ PEOPLE ]
66.7%
PERCENT IN LABOR FORCE
6.9%
UNEMPLOYMENT RATE
Whiteside Zip Codes
Income in Whiteside
Income Overview in Whiteside
Per Capita Income in Whiteside is $32,115, while median incomes of families and households are $88,125 and $93,333 respectively.
| Characteristic | Number | Measure |
| Per Capita Income | 107 | $32,115 |
| Median Family Income | 24 | $88,125 |
| Mean Family Income | 24 | $80,571 |
| Median Household Income | 44 | $93,333 |
| Mean Household Income | 44 | $81,420 |
| Income Deficit | 24 | $0 |
| Wage / Income Gap (%) | 107 | 39.56% |
| Wage / Income Gap ($) | 107 | 60.44¢ per $1 |
| Gini / Inequality Index | 107 | 0.32 |
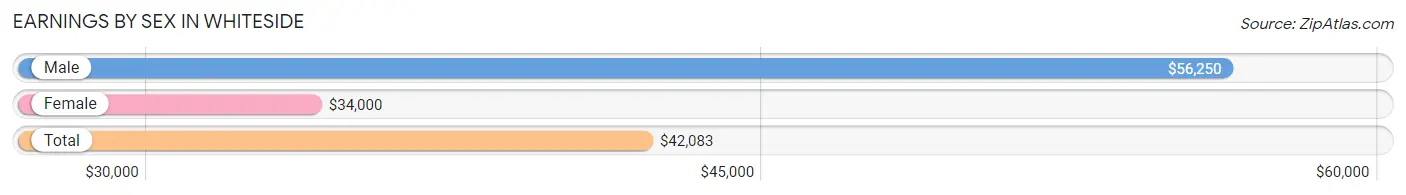
Earnings by Sex in Whiteside
Average Earnings in Whiteside are $42,083, $56,250 for men and $34,000 for women, a difference of 39.6%.
| Sex | Number | Average Earnings |
| Male | 40 (69.0%) | $56,250 |
| Female | 18 (31.0%) | $34,000 |
| Total | 58 (100.0%) | $42,083 |
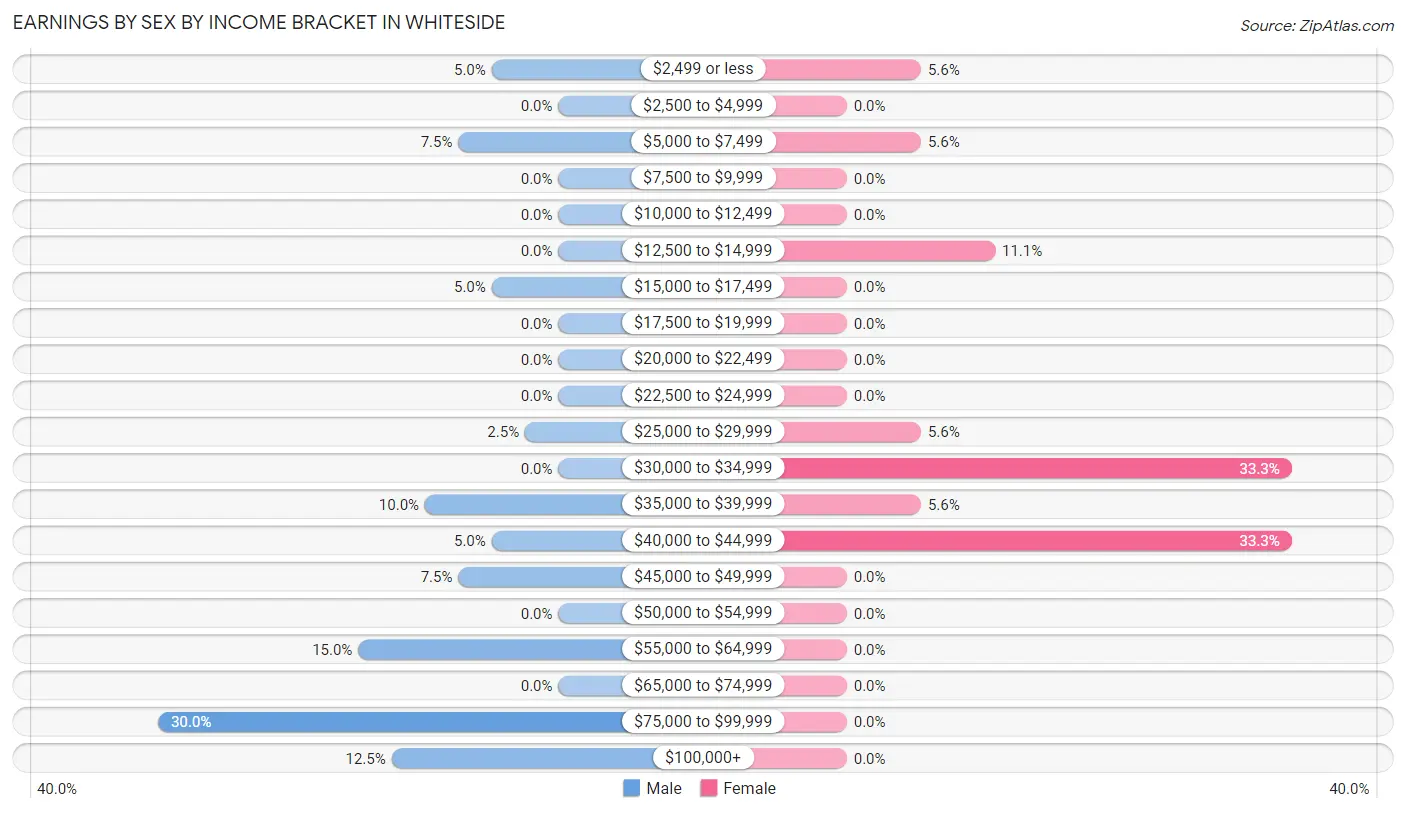
Earnings by Sex by Income Bracket in Whiteside
The most common earnings brackets in Whiteside are $75,000 to $99,999 for men (12 | 30.0%) and $30,000 to $34,999 for women (6 | 33.3%).
| Income | Male | Female |
| $2,499 or less | 2 (5.0%) | 1 (5.6%) |
| $2,500 to $4,999 | 0 (0.0%) | 0 (0.0%) |
| $5,000 to $7,499 | 3 (7.5%) | 1 (5.6%) |
| $7,500 to $9,999 | 0 (0.0%) | 0 (0.0%) |
| $10,000 to $12,499 | 0 (0.0%) | 0 (0.0%) |
| $12,500 to $14,999 | 0 (0.0%) | 2 (11.1%) |
| $15,000 to $17,499 | 2 (5.0%) | 0 (0.0%) |
| $17,500 to $19,999 | 0 (0.0%) | 0 (0.0%) |
| $20,000 to $22,499 | 0 (0.0%) | 0 (0.0%) |
| $22,500 to $24,999 | 0 (0.0%) | 0 (0.0%) |
| $25,000 to $29,999 | 1 (2.5%) | 1 (5.6%) |
| $30,000 to $34,999 | 0 (0.0%) | 6 (33.3%) |
| $35,000 to $39,999 | 4 (10.0%) | 1 (5.6%) |
| $40,000 to $44,999 | 2 (5.0%) | 6 (33.3%) |
| $45,000 to $49,999 | 3 (7.5%) | 0 (0.0%) |
| $50,000 to $54,999 | 0 (0.0%) | 0 (0.0%) |
| $55,000 to $64,999 | 6 (15.0%) | 0 (0.0%) |
| $65,000 to $74,999 | 0 (0.0%) | 0 (0.0%) |
| $75,000 to $99,999 | 12 (30.0%) | 0 (0.0%) |
| $100,000+ | 5 (12.5%) | 0 (0.0%) |
| Total | 40 (100.0%) | 18 (100.0%) |
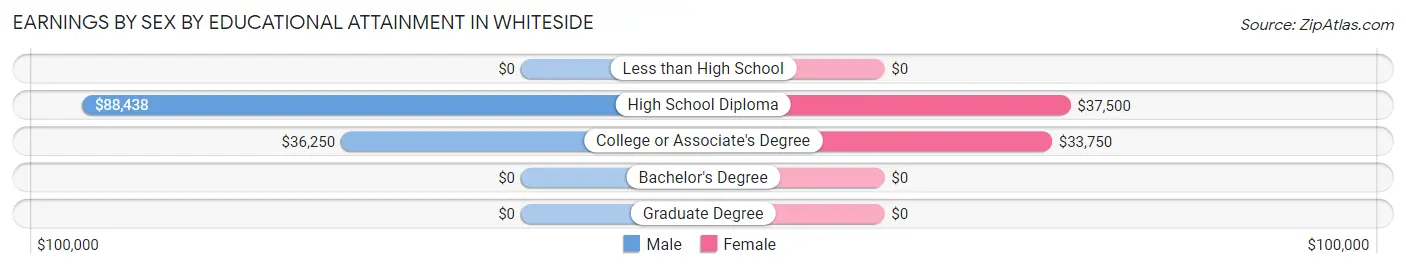
Earnings by Sex by Educational Attainment in Whiteside
Average earnings in Whiteside are $56,875 for men and $34,000 for women, a difference of 40.2%. Men with an educational attainment of high school diploma enjoy the highest average annual earnings of $88,438, while those with college or associate's degree education earn the least with $36,250. Women with an educational attainment of high school diploma earn the most with the average annual earnings of $37,500, while those with college or associate's degree education have the smallest earnings of $33,750.
| Educational Attainment | Male Income | Female Income |
| Less than High School | - | - |
| High School Diploma | $88,438 | $37,500 |
| College or Associate's Degree | $36,250 | $33,750 |
| Bachelor's Degree | - | - |
| Graduate Degree | - | - |
| Total | $56,875 | $34,000 |
Family Income in Whiteside
Family Income Brackets in Whiteside
According to the Whiteside family income data, there are 10 families falling into the $75,000 to $99,999 income range, which is the most common income bracket and makes up 41.7% of all families.
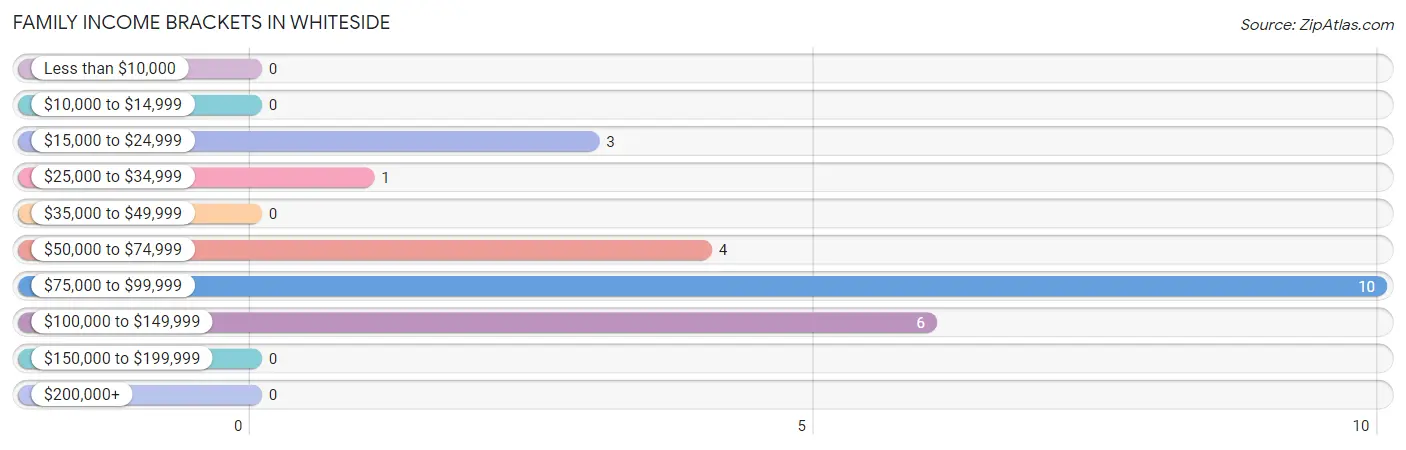
| Income Bracket | # Families | % Families |
| Less than $10,000 | 0 | 0.0% |
| $10,000 to $14,999 | 0 | 0.0% |
| $15,000 to $24,999 | 3 | 12.5% |
| $25,000 to $34,999 | 1 | 4.2% |
| $35,000 to $49,999 | 0 | 0.0% |
| $50,000 to $74,999 | 4 | 16.7% |
| $75,000 to $99,999 | 10 | 41.7% |
| $100,000 to $149,999 | 6 | 25.0% |
| $150,000 to $199,999 | 0 | 0.0% |
| $200,000+ | 0 | 0.0% |
Family Income by Famaliy Size in Whiteside
2-person families (16 | 66.7%) account for the highest median family income in Whiteside with $87,813 per family, while 2-person families (16 | 66.7%) have the highest median income of $43,906 per family member.
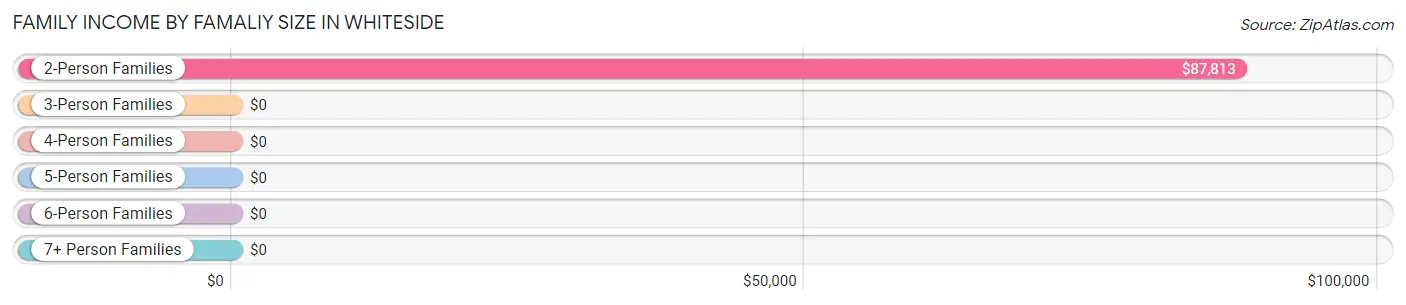
| Income Bracket | # Families | Median Income |
| 2-Person Families | 16 (66.7%) | $87,813 |
| 3-Person Families | 3 (12.5%) | $0 |
| 4-Person Families | 0 (0.0%) | $0 |
| 5-Person Families | 5 (20.8%) | $0 |
| 6-Person Families | 0 (0.0%) | $0 |
| 7+ Person Families | 0 (0.0%) | $0 |
| Total | 24 (100.0%) | $88,125 |
Family Income by Number of Earners in Whiteside
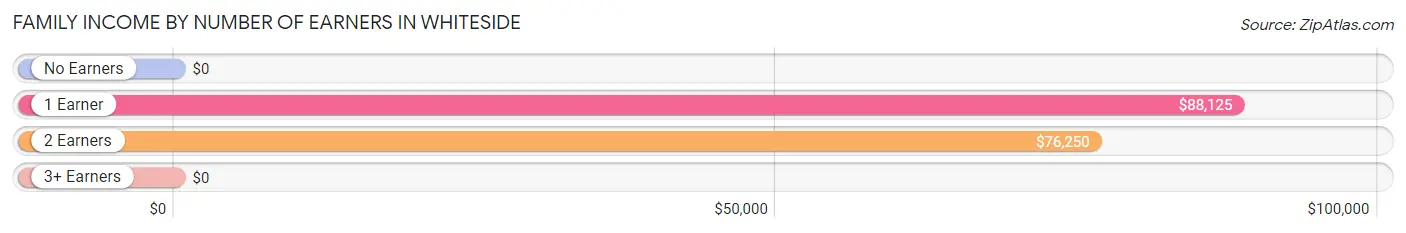
| Number of Earners | # Families | Median Income |
| No Earners | 3 (12.5%) | $0 |
| 1 Earner | 12 (50.0%) | $88,125 |
| 2 Earners | 4 (16.7%) | $76,250 |
| 3+ Earners | 5 (20.8%) | $0 |
| Total | 24 (100.0%) | $88,125 |
Household Income in Whiteside
Household Income Brackets in Whiteside
With 19 households falling in the category, the $100,000 to $149,999 income range is the most frequent in Whiteside, accounting for 43.2% of all households.
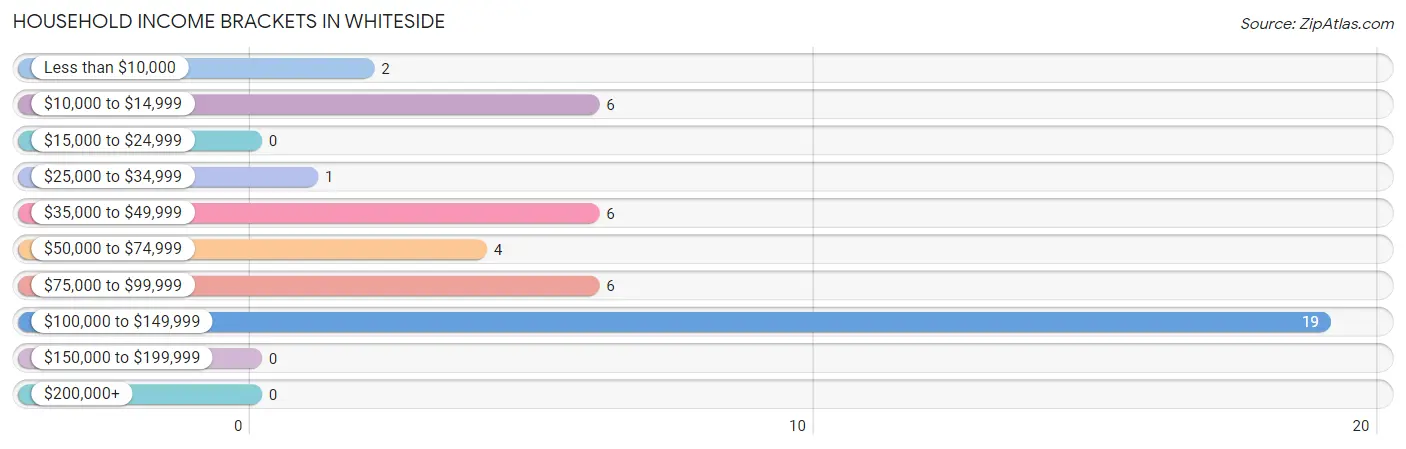
| Income Bracket | # Households | % Households |
| Less than $10,000 | 2 | 4.5% |
| $10,000 to $14,999 | 6 | 13.6% |
| $15,000 to $24,999 | 0 | 0.0% |
| $25,000 to $34,999 | 1 | 2.3% |
| $35,000 to $49,999 | 6 | 13.6% |
| $50,000 to $74,999 | 4 | 9.1% |
| $75,000 to $99,999 | 6 | 13.6% |
| $100,000 to $149,999 | 19 | 43.2% |
| $150,000 to $199,999 | 0 | 0.0% |
| $200,000+ | 0 | 0.0% |
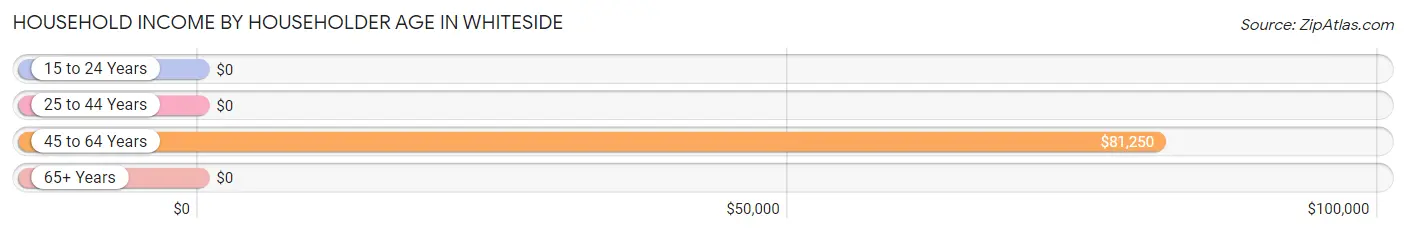
Household Income by Householder Age in Whiteside
The median household income in Whiteside is $93,333, with the highest median household income of $81,250 found in the 45 to 64 years age bracket for the primary householder. A total of 20 households (45.5%) fall into this category.
| Income Bracket | # Households | Median Income |
| 15 to 24 Years | 0 (0.0%) | $0 |
| 25 to 44 Years | 15 (34.1%) | $0 |
| 45 to 64 Years | 20 (45.5%) | $81,250 |
| 65+ Years | 9 (20.4%) | $0 |
| Total | 44 (100.0%) | $93,333 |
Poverty in Whiteside
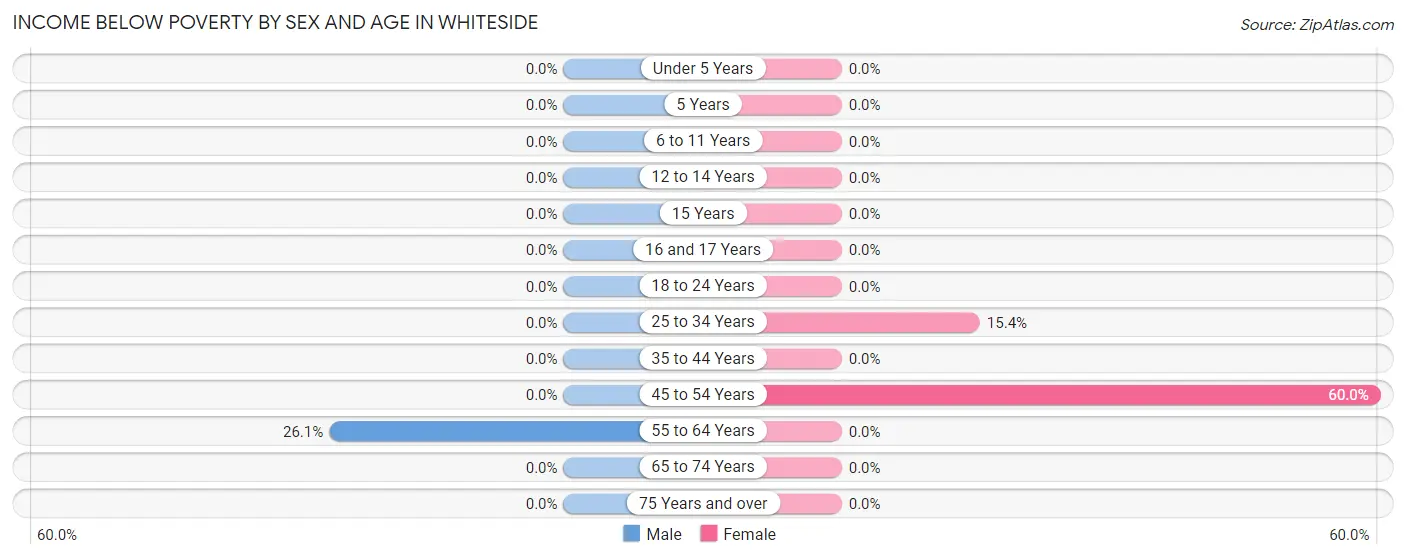
Income Below Poverty by Sex and Age in Whiteside
With 7.9% poverty level for males and 16.1% for females among the residents of Whiteside, 55 to 64 year old males and 45 to 54 year old females are the most vulnerable to poverty, with 6 males (26.1%) and 3 females (60.0%) in their respective age groups living below the poverty level.
| Age Bracket | Male | Female |
| Under 5 Years | 0 (0.0%) | 0 (0.0%) |
| 5 Years | 0 (0.0%) | 0 (0.0%) |
| 6 to 11 Years | 0 (0.0%) | 0 (0.0%) |
| 12 to 14 Years | 0 (0.0%) | 0 (0.0%) |
| 15 Years | 0 (0.0%) | 0 (0.0%) |
| 16 and 17 Years | 0 (0.0%) | 0 (0.0%) |
| 18 to 24 Years | 0 (0.0%) | 0 (0.0%) |
| 25 to 34 Years | 0 (0.0%) | 2 (15.4%) |
| 35 to 44 Years | 0 (0.0%) | 0 (0.0%) |
| 45 to 54 Years | 0 (0.0%) | 3 (60.0%) |
| 55 to 64 Years | 6 (26.1%) | 0 (0.0%) |
| 65 to 74 Years | 0 (0.0%) | 0 (0.0%) |
| 75 Years and over | 0 (0.0%) | 0 (0.0%) |
| Total | 6 (7.9%) | 5 (16.1%) |
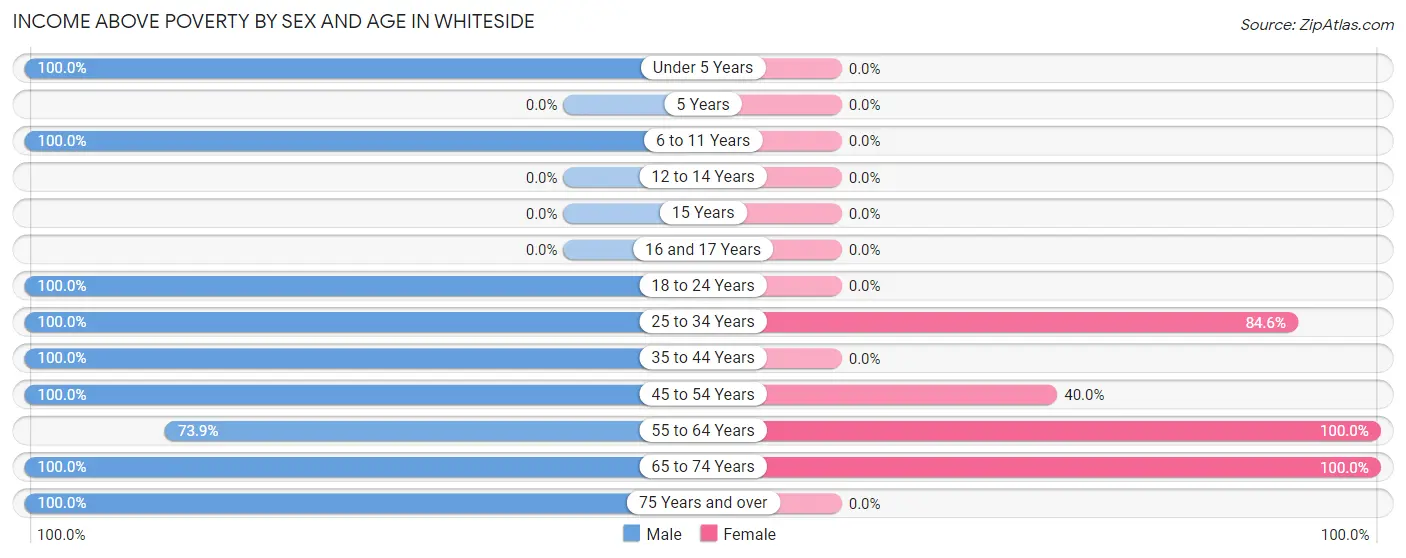
Income Above Poverty by Sex and Age in Whiteside
According to the poverty statistics in Whiteside, males aged under 5 years and females aged 55 to 64 years are the age groups that are most secure financially, with 100.0% of males and 100.0% of females in these age groups living above the poverty line.
| Age Bracket | Male | Female |
| Under 5 Years | 18 (100.0%) | 0 (0.0%) |
| 5 Years | 0 (0.0%) | 0 (0.0%) |
| 6 to 11 Years | 2 (100.0%) | 0 (0.0%) |
| 12 to 14 Years | 0 (0.0%) | 0 (0.0%) |
| 15 Years | 0 (0.0%) | 0 (0.0%) |
| 16 and 17 Years | 0 (0.0%) | 0 (0.0%) |
| 18 to 24 Years | 3 (100.0%) | 0 (0.0%) |
| 25 to 34 Years | 16 (100.0%) | 11 (84.6%) |
| 35 to 44 Years | 3 (100.0%) | 0 (0.0%) |
| 45 to 54 Years | 1 (100.0%) | 2 (40.0%) |
| 55 to 64 Years | 17 (73.9%) | 9 (100.0%) |
| 65 to 74 Years | 4 (100.0%) | 4 (100.0%) |
| 75 Years and over | 6 (100.0%) | 0 (0.0%) |
| Total | 70 (92.1%) | 26 (83.9%) |
Income Below Poverty Among Married-Couple Families in Whiteside
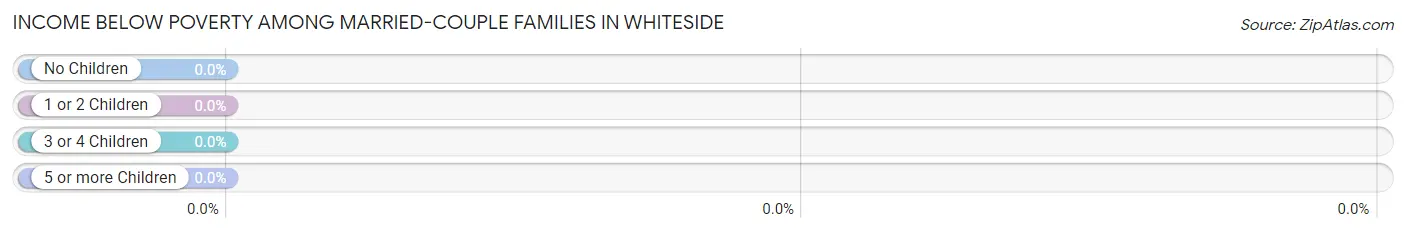
| Children | Above Poverty | Below Poverty |
| No Children | 8 (100.0%) | 0 (0.0%) |
| 1 or 2 Children | 6 (100.0%) | 0 (0.0%) |
| 3 or 4 Children | 0 (0.0%) | 0 (0.0%) |
| 5 or more Children | 0 (0.0%) | 0 (0.0%) |
| Total | 14 (100.0%) | 0 (0.0%) |
Income Below Poverty Among Single-Parent Households in Whiteside
| Children | Single Father | Single Mother |
| No Children | 0 (0.0%) | 0 (0.0%) |
| 1 or 2 Children | 0 (0.0%) | 0 (0.0%) |
| 3 or 4 Children | 0 (0.0%) | 0 (0.0%) |
| 5 or more Children | 0 (0.0%) | 0 (0.0%) |
| Total | 0 (0.0%) | 0 (0.0%) |
Income Below Poverty Among Married-Couple vs Single-Parent Households in Whiteside
| Children | Married-Couple Families | Single-Parent Households |
| No Children | 0 (0.0%) | 0 (0.0%) |
| 1 or 2 Children | 0 (0.0%) | 0 (0.0%) |
| 3 or 4 Children | 0 (0.0%) | 0 (0.0%) |
| 5 or more Children | 0 (0.0%) | 0 (0.0%) |
| Total | 0 (0.0%) | 0 (0.0%) |
Race in Whiteside
The most populous races in Whiteside are White / Caucasian (106 | 99.1%), and Two or more Races (1 | 0.9%).
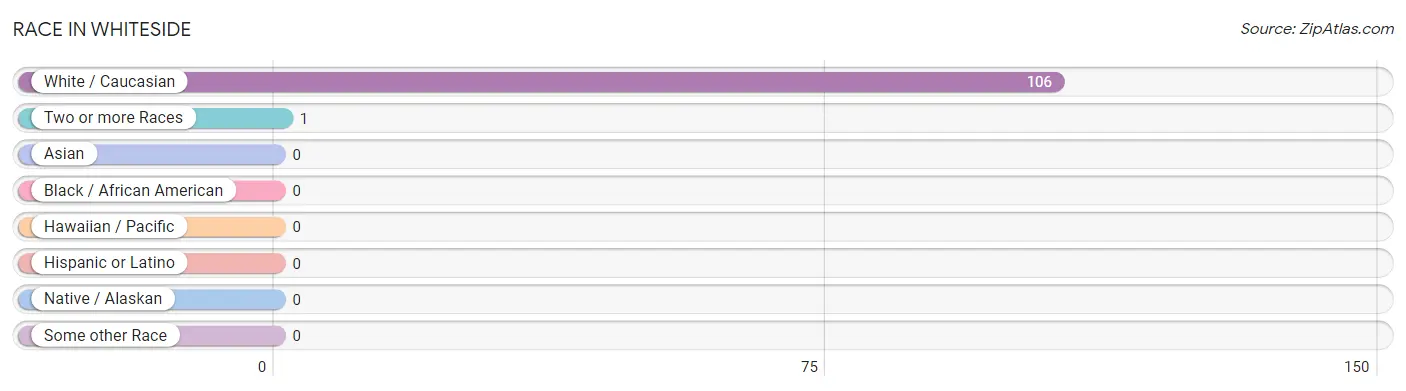
| Race | # Population | % Population |
| Asian | 0 | 0.0% |
| Black / African American | 0 | 0.0% |
| Hawaiian / Pacific | 0 | 0.0% |
| Hispanic or Latino | 0 | 0.0% |
| Native / Alaskan | 0 | 0.0% |
| White / Caucasian | 106 | 99.1% |
| Two or more Races | 1 | 0.9% |
| Some other Race | 0 | 0.0% |
| Total | 107 | 100.0% |
Ancestry in Whiteside
The most populous ancestries reported in Whiteside are German (11 | 10.3%), Irish (8 | 7.5%), American (2 | 1.9%), English (2 | 1.9%), and Italian (1 | 0.9%), together accounting for 22.4% of all Whiteside residents.
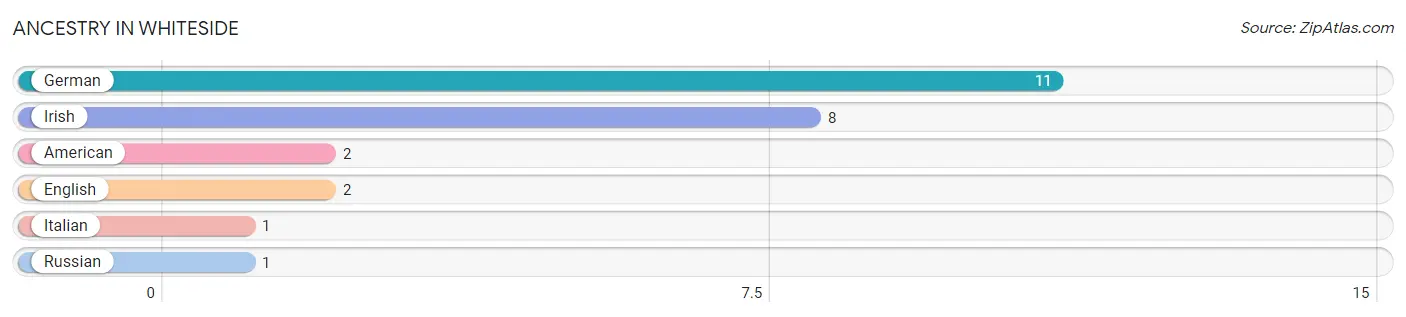
| Ancestry | # Population | % Population |
| American | 2 | 1.9% |
| English | 2 | 1.9% |
| German | 11 | 10.3% |
| Irish | 8 | 7.5% |
| Italian | 1 | 0.9% |
| Russian | 1 | 0.9% | View All 6 Rows |
Immigrants in Whiteside
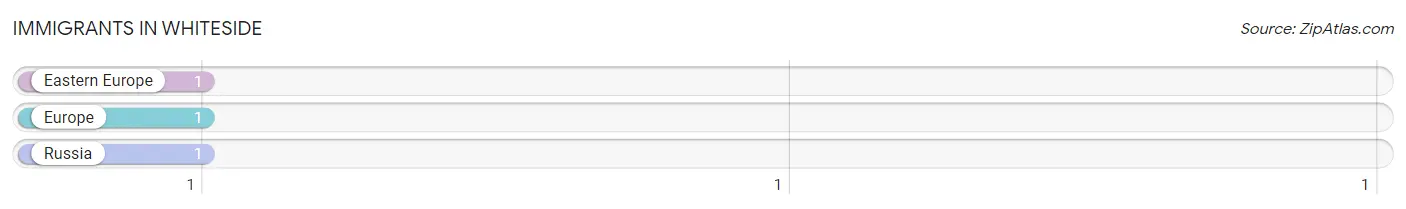
The most numerous immigrant groups reported in Whiteside came from Eastern Europe (1 | 0.9%), Europe (1 | 0.9%), and Russia (1 | 0.9%), together accounting for 2.8% of all Whiteside residents.
| Immigration Origin | # Population | % Population |
| Eastern Europe | 1 | 0.9% |
| Europe | 1 | 0.9% |
| Russia | 1 | 0.9% | View All 3 Rows |
Sex and Age in Whiteside
Sex and Age in Whiteside
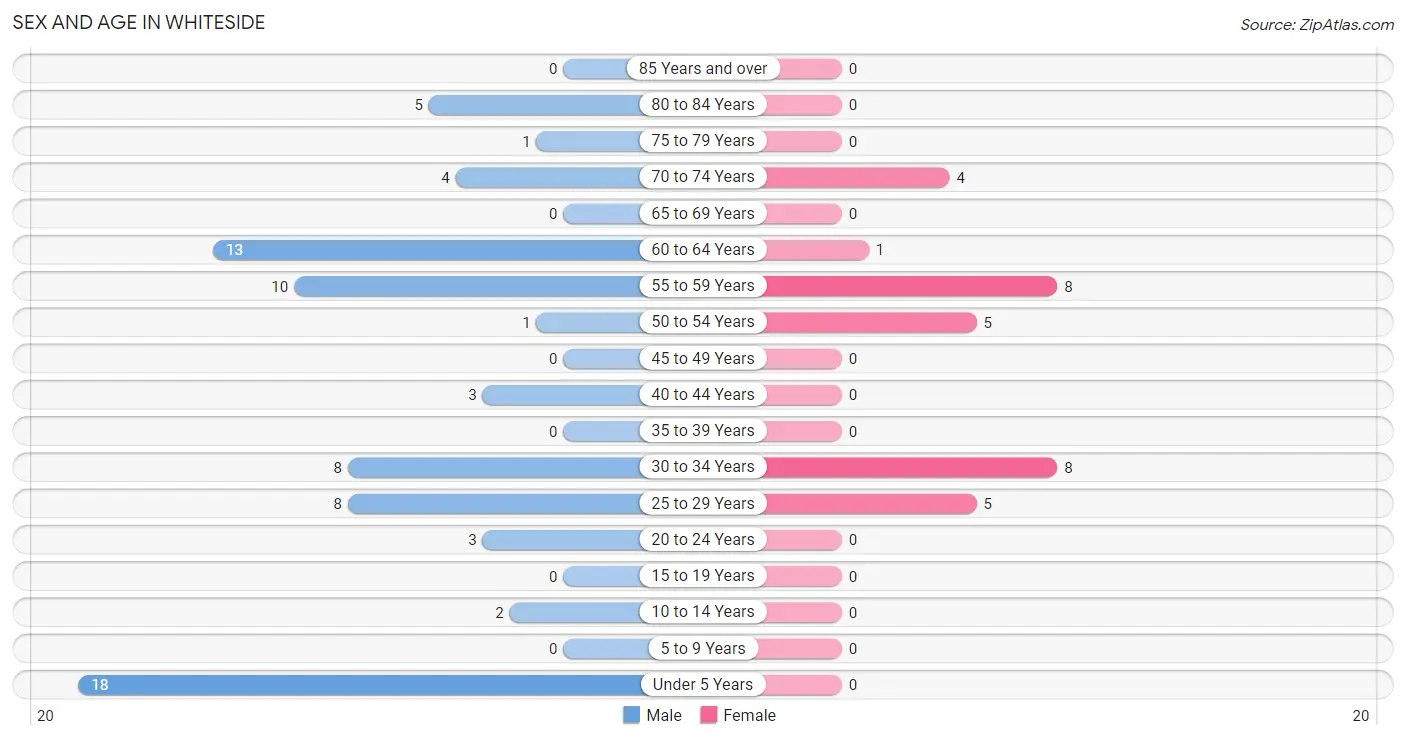
The most populous age groups in Whiteside are Under 5 Years (18 | 23.7%) for men and 30 to 34 Years (8 | 25.8%) for women.
| Age Bracket | Male | Female |
| Under 5 Years | 18 (23.7%) | 0 (0.0%) |
| 5 to 9 Years | 0 (0.0%) | 0 (0.0%) |
| 10 to 14 Years | 2 (2.6%) | 0 (0.0%) |
| 15 to 19 Years | 0 (0.0%) | 0 (0.0%) |
| 20 to 24 Years | 3 (4.0%) | 0 (0.0%) |
| 25 to 29 Years | 8 (10.5%) | 5 (16.1%) |
| 30 to 34 Years | 8 (10.5%) | 8 (25.8%) |
| 35 to 39 Years | 0 (0.0%) | 0 (0.0%) |
| 40 to 44 Years | 3 (4.0%) | 0 (0.0%) |
| 45 to 49 Years | 0 (0.0%) | 0 (0.0%) |
| 50 to 54 Years | 1 (1.3%) | 5 (16.1%) |
| 55 to 59 Years | 10 (13.2%) | 8 (25.8%) |
| 60 to 64 Years | 13 (17.1%) | 1 (3.2%) |
| 65 to 69 Years | 0 (0.0%) | 0 (0.0%) |
| 70 to 74 Years | 4 (5.3%) | 4 (12.9%) |
| 75 to 79 Years | 1 (1.3%) | 0 (0.0%) |
| 80 to 84 Years | 5 (6.6%) | 0 (0.0%) |
| 85 Years and over | 0 (0.0%) | 0 (0.0%) |
| Total | 76 (100.0%) | 31 (100.0%) |
Families and Households in Whiteside
Median Family Size in Whiteside
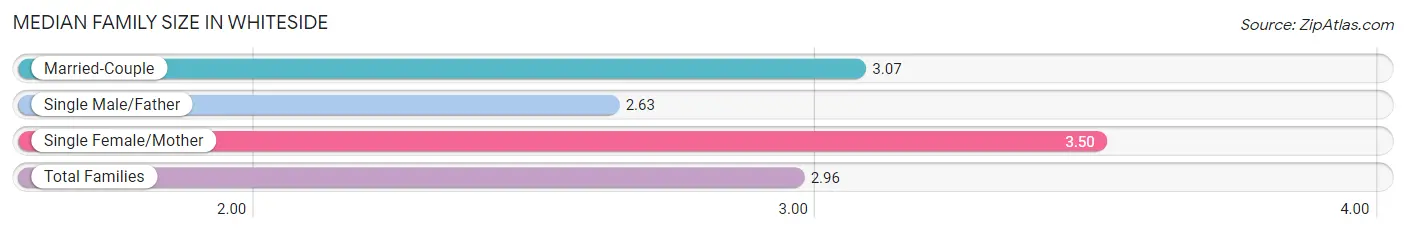
The median family size in Whiteside is 2.96 persons per family, with single female/mother families (2 | 8.3%) accounting for the largest median family size of 3.5 persons per family. On the other hand, single male/father families (8 | 33.3%) represent the smallest median family size with 2.63 persons per family.
| Family Type | # Families | Family Size |
| Married-Couple | 14 (58.3%) | 3.07 |
| Single Male/Father | 8 (33.3%) | 2.63 |
| Single Female/Mother | 2 (8.3%) | 3.50 |
| Total Families | 24 (100.0%) | 2.96 |
Median Household Size in Whiteside
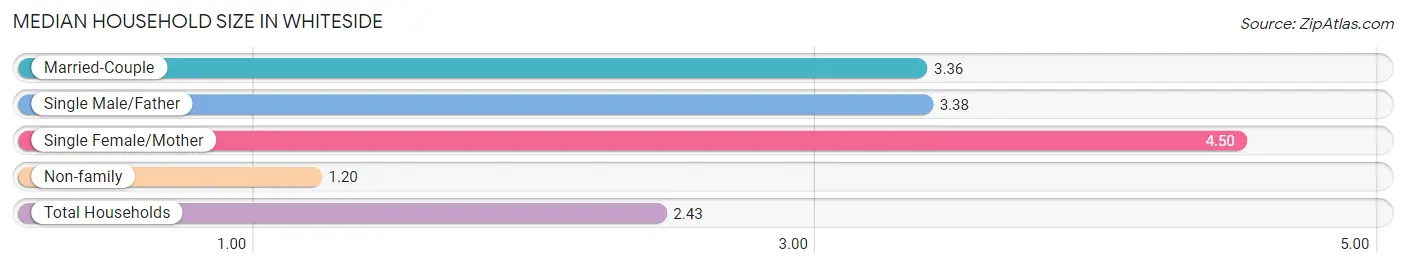
The median household size in Whiteside is 2.43 persons per household, with single female/mother households (2 | 4.5%) accounting for the largest median household size of 4.5 persons per household. non-family households (20 | 45.5%) represent the smallest median household size with 1.20 persons per household.
| Household Type | # Households | Household Size |
| Married-Couple | 14 (31.8%) | 3.36 |
| Single Male/Father | 8 (18.2%) | 3.38 |
| Single Female/Mother | 2 (4.5%) | 4.50 |
| Non-family | 20 (45.5%) | 1.20 |
| Total Households | 44 (100.0%) | 2.43 |
Household Size by Marriage Status in Whiteside
Out of a total of 44 households in Whiteside, 24 (54.5%) are family households, while 20 (45.5%) are nonfamily households. The most numerous type of family households are 3-person households, comprising 12, and the most common type of nonfamily households are 1-person households, comprising 16.
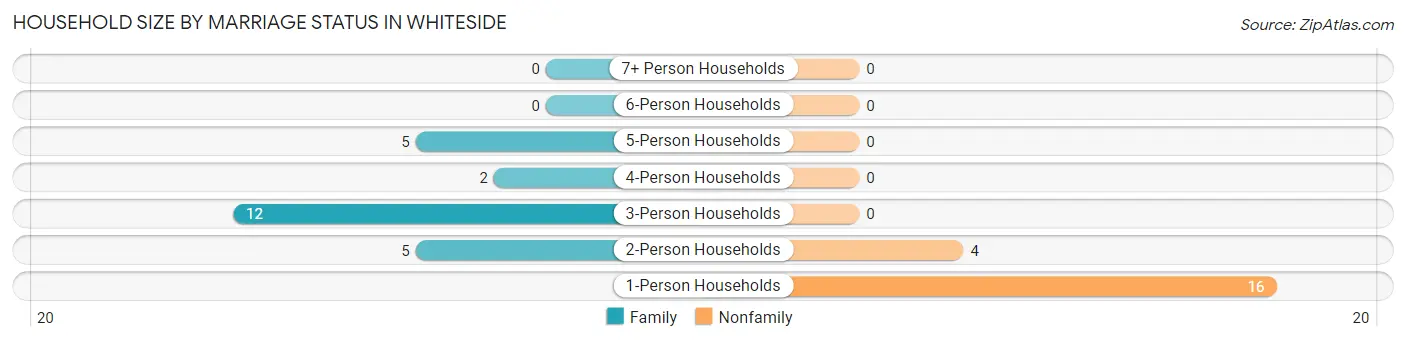
| Household Size | Family Households | Nonfamily Households |
| 1-Person Households | - | 16 (36.4%) |
| 2-Person Households | 5 (11.4%) | 4 (9.1%) |
| 3-Person Households | 12 (27.3%) | 0 (0.0%) |
| 4-Person Households | 2 (4.5%) | 0 (0.0%) |
| 5-Person Households | 5 (11.4%) | 0 (0.0%) |
| 6-Person Households | 0 (0.0%) | 0 (0.0%) |
| 7+ Person Households | 0 (0.0%) | 0 (0.0%) |
| Total | 24 (54.5%) | 20 (45.5%) |
Female Fertility in Whiteside
Fertility by Age in Whiteside
Average fertility rate in Whiteside is 462.0 births per 1,000 women. Women in the age bracket of 20 to 34 years have the highest fertility rate with 462.0 births per 1,000 women. Women in the age bracket of 20 to 34 years acount for 100.0% of all women with births.
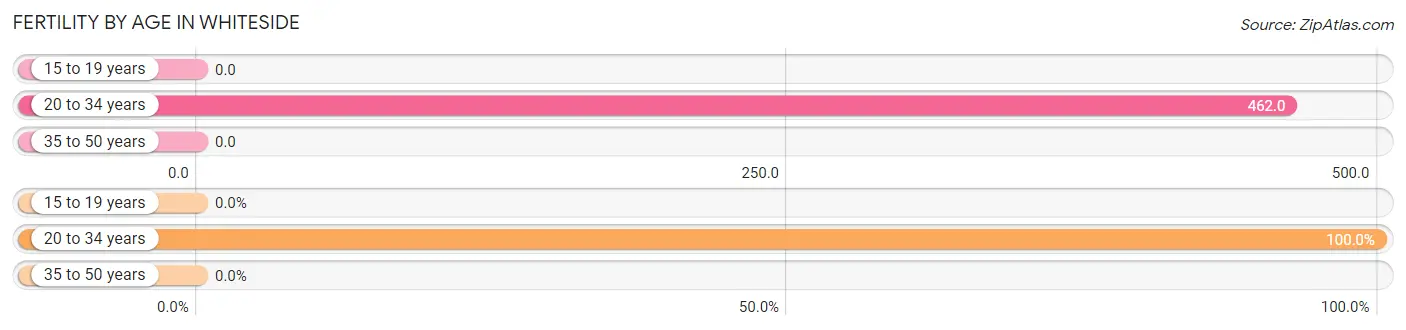
| Age Bracket | Women with Births | Births / 1,000 Women |
| 15 to 19 years | 0 (0.0%) | 0.0 |
| 20 to 34 years | 6 (100.0%) | 462.0 |
| 35 to 50 years | 0 (0.0%) | 0.0 |
| Total | 6 (100.0%) | 462.0 |
Fertility by Age by Marriage Status in Whiteside
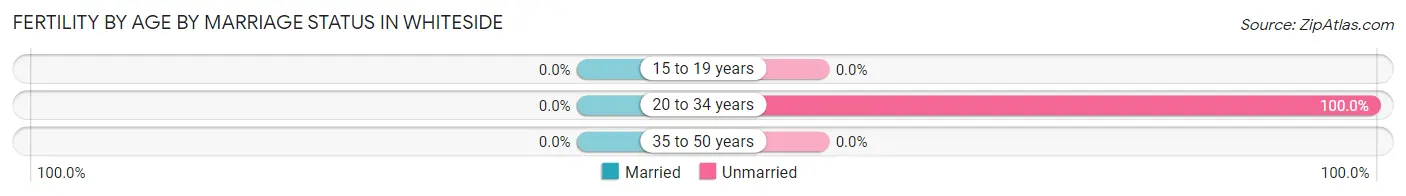
| Age Bracket | Married | Unmarried |
| 15 to 19 years | 0 (0.0%) | 0 (0.0%) |
| 20 to 34 years | 0 (0.0%) | 6 (100.0%) |
| 35 to 50 years | 0 (0.0%) | 0 (0.0%) |
| Total | 0 (0.0%) | 6 (100.0%) |
Fertility by Education in Whiteside
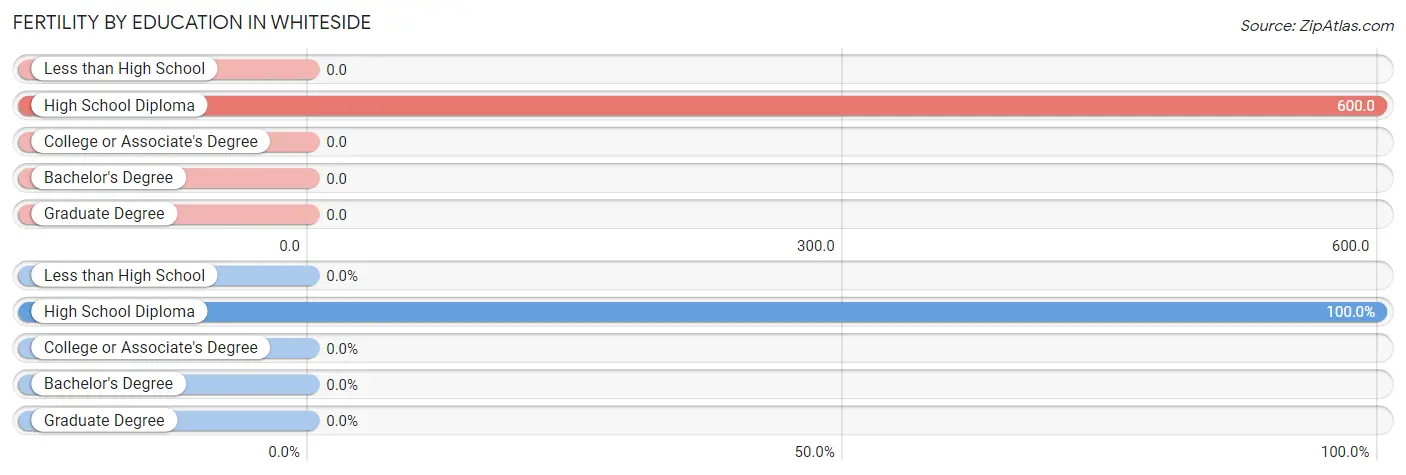
| Educational Attainment | Women with Births | Births / 1,000 Women |
| Less than High School | 0 (0.0%) | 0.0 |
| High School Diploma | 6 (100.0%) | 600.0 |
| College or Associate's Degree | 0 (0.0%) | 0.0 |
| Bachelor's Degree | 0 (0.0%) | 0.0 |
| Graduate Degree | 0 (0.0%) | 0.0 |
| Total | 6 (100.0%) | 462.0 |
Fertility by Education by Marriage Status in Whiteside
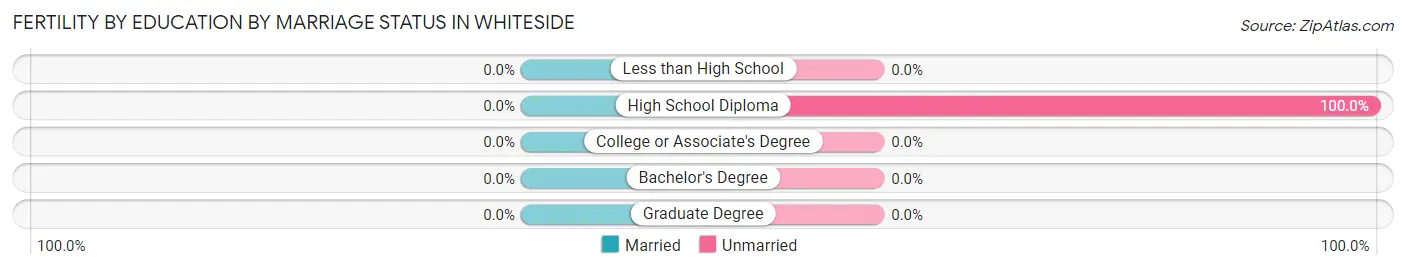
| Educational Attainment | Married | Unmarried |
| Less than High School | 0 (0.0%) | 0 (0.0%) |
| High School Diploma | 0 (0.0%) | 6 (100.0%) |
| College or Associate's Degree | 0 (0.0%) | 0 (0.0%) |
| Bachelor's Degree | 0 (0.0%) | 0 (0.0%) |
| Graduate Degree | 0 (0.0%) | 0 (0.0%) |
| Total | 0 (0.0%) | 6 (100.0%) |
Employment Characteristics in Whiteside
Employment by Class of Employer in Whiteside
Among the 54 employed individuals in Whiteside, private company employees (40 | 74.1%), state government employees (8 | 14.8%), and self-employed (incorporated) (5 | 9.3%) make up the most common classes of employment.
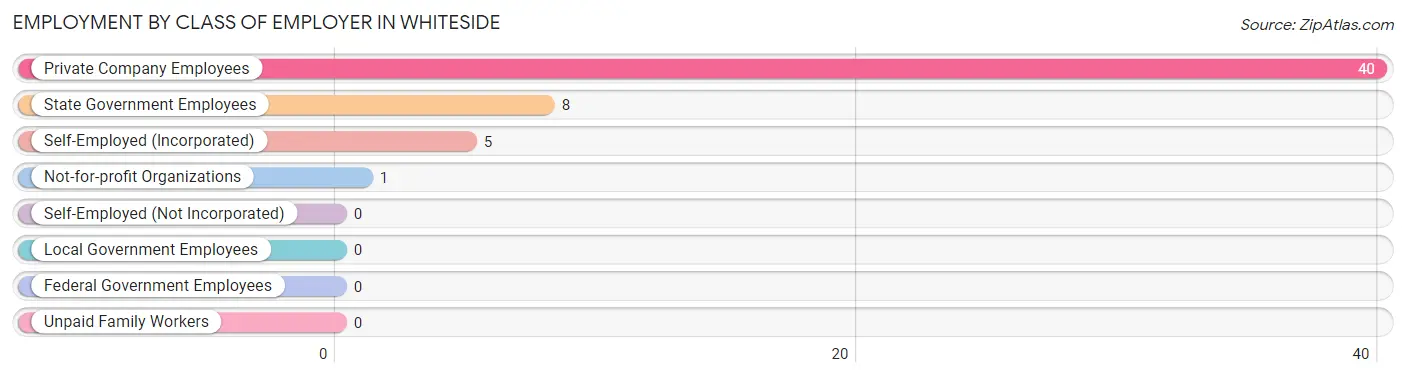
| Employer Class | # Employees | % Employees |
| Private Company Employees | 40 | 74.1% |
| Self-Employed (Incorporated) | 5 | 9.3% |
| Self-Employed (Not Incorporated) | 0 | 0.0% |
| Not-for-profit Organizations | 1 | 1.8% |
| Local Government Employees | 0 | 0.0% |
| State Government Employees | 8 | 14.8% |
| Federal Government Employees | 0 | 0.0% |
| Unpaid Family Workers | 0 | 0.0% |
| Total | 54 | 100.0% |
Employment Status by Age in Whiteside
According to the labor force statistics for Whiteside, out of the total population over 16 years of age (87), 66.7% or 58 individuals are in the labor force, with 6.9% or 4 of them unemployed. The age group with the highest labor force participation rate is 20 to 24 years, with 100.0% or 3 individuals in the labor force. Within the labor force, the 20 to 24 years age range has the highest percentage of unemployed individuals, with 100.0% or 3 of them being unemployed.
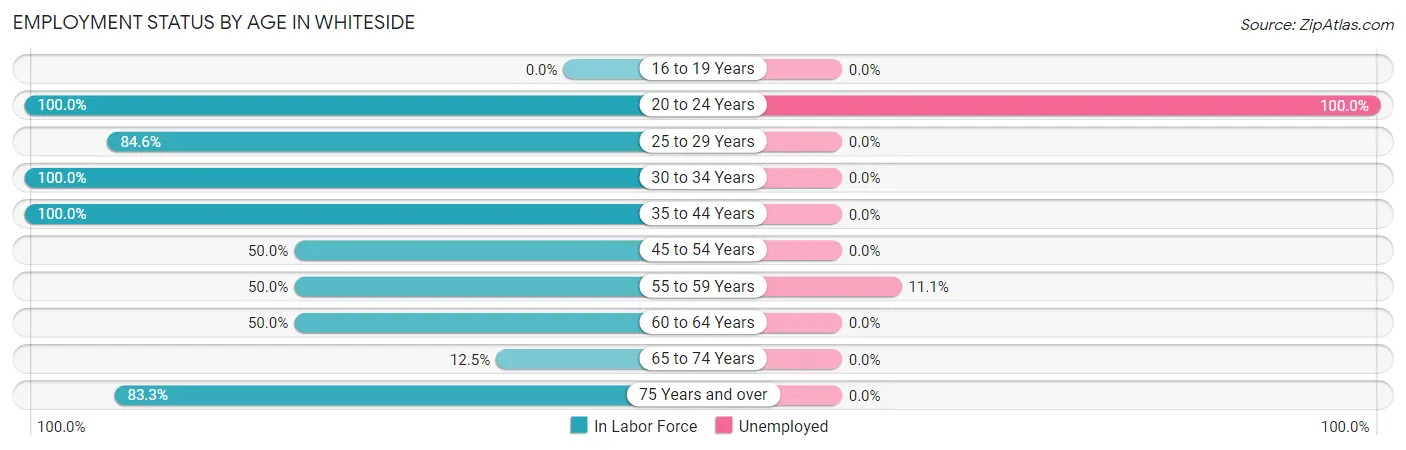
| Age Bracket | In Labor Force | Unemployed |
| 16 to 19 Years | 0 (0.0%) | 0 (0.0%) |
| 20 to 24 Years | 3 (100.0%) | 3 (100.0%) |
| 25 to 29 Years | 11 (84.6%) | 0 (0.0%) |
| 30 to 34 Years | 16 (100.0%) | 0 (0.0%) |
| 35 to 44 Years | 3 (100.0%) | 0 (0.0%) |
| 45 to 54 Years | 3 (50.0%) | 0 (0.0%) |
| 55 to 59 Years | 9 (50.0%) | 1 (11.1%) |
| 60 to 64 Years | 7 (50.0%) | 0 (0.0%) |
| 65 to 74 Years | 1 (12.5%) | 0 (0.0%) |
| 75 Years and over | 5 (83.3%) | 0 (0.0%) |
| Total | 58 (66.7%) | 4 (6.9%) |
Employment Status by Educational Attainment in Whiteside
According to labor force statistics for Whiteside, 70.0% of individuals (49) out of the total population between 25 and 64 years of age (70) are in the labor force, with 2.0% or 1 of them being unemployed. The group with the highest labor force participation rate are those with the educational attainment of college / associate degree, with 81.8% or 9 individuals in the labor force. Within the labor force, individuals with high school diploma education have the highest percentage of unemployment, with 3.0% or 1 of them being unemployed.
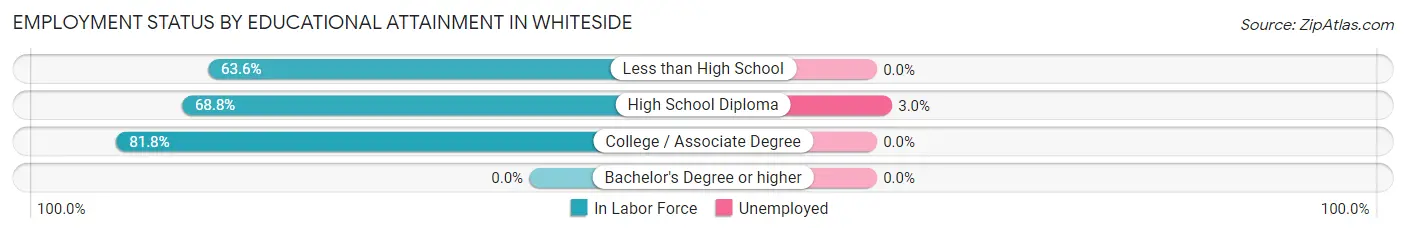
| Educational Attainment | In Labor Force | Unemployed |
| Less than High School | 7 (63.6%) | 0 (0.0%) |
| High School Diploma | 33 (68.8%) | 1 (3.0%) |
| College / Associate Degree | 9 (81.8%) | 0 (0.0%) |
| Bachelor's Degree or higher | 0 (0.0%) | 0 (0.0%) |
| Total | 49 (70.0%) | 1 (2.0%) |
Employment Occupations by Sex in Whiteside
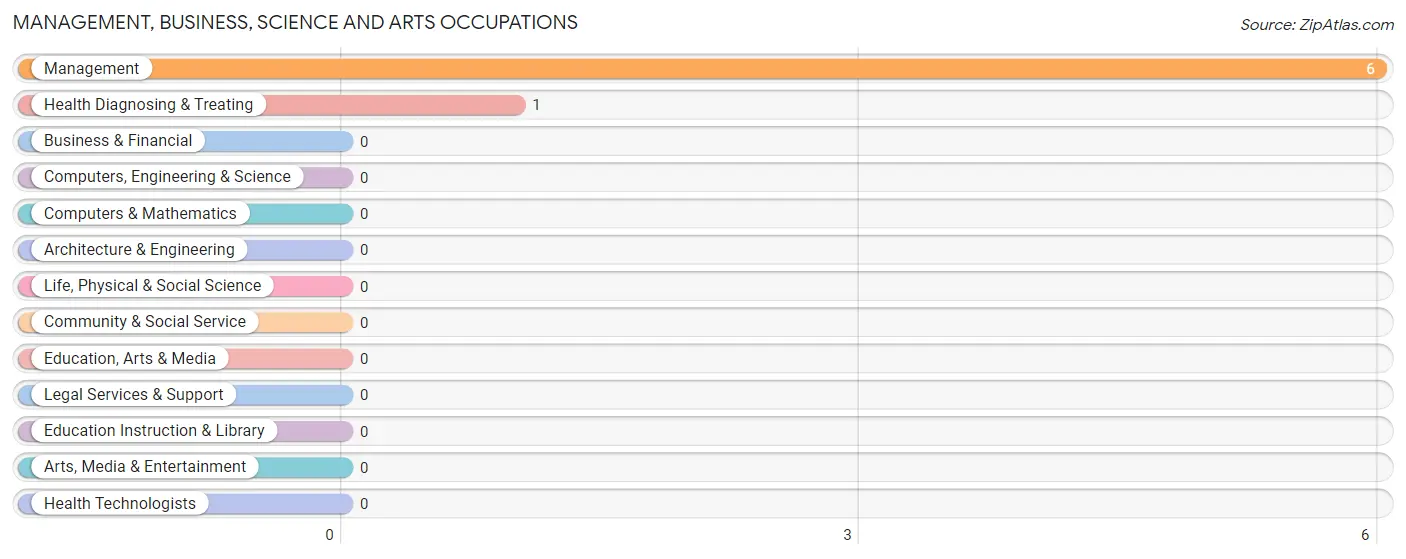
Management, Business, Science and Arts Occupations
The most common Management, Business, Science and Arts occupations in Whiteside are Management (6 | 11.1%), and Health Diagnosing & Treating (1 | 1.8%).
Management, Business, Science and Arts Occupations by Sex
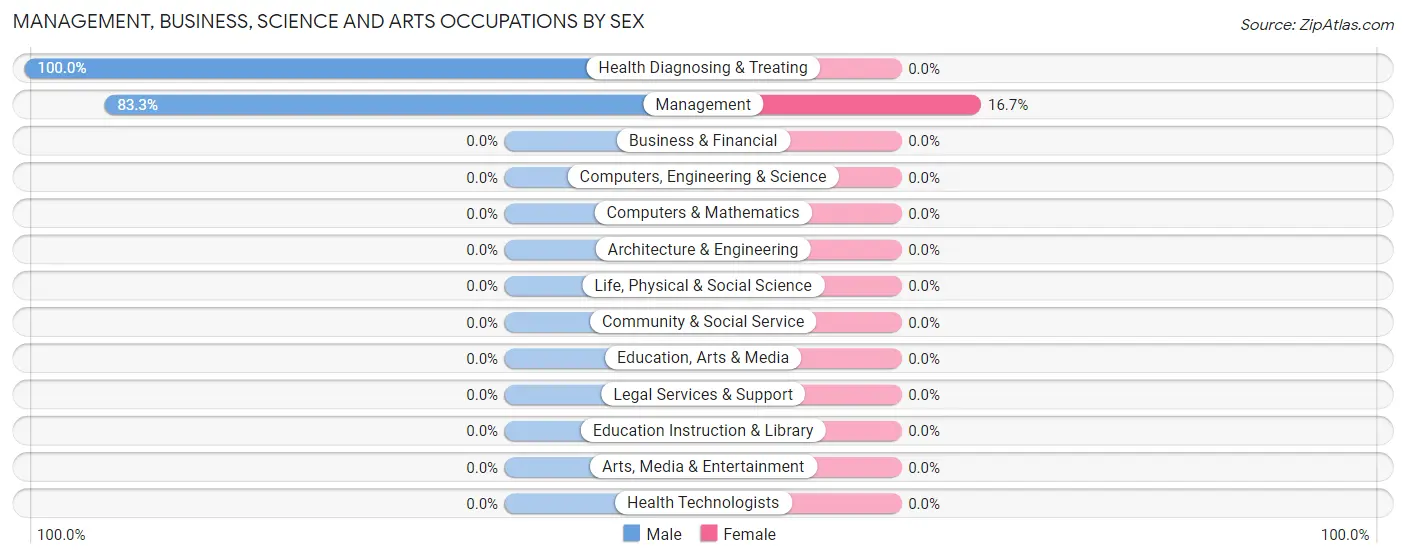
| Occupation | Male | Female |
| Management | 5 (83.3%) | 1 (16.7%) |
| Business & Financial | 0 (0.0%) | 0 (0.0%) |
| Computers, Engineering & Science | 0 (0.0%) | 0 (0.0%) |
| Computers & Mathematics | 0 (0.0%) | 0 (0.0%) |
| Architecture & Engineering | 0 (0.0%) | 0 (0.0%) |
| Life, Physical & Social Science | 0 (0.0%) | 0 (0.0%) |
| Community & Social Service | 0 (0.0%) | 0 (0.0%) |
| Education, Arts & Media | 0 (0.0%) | 0 (0.0%) |
| Legal Services & Support | 0 (0.0%) | 0 (0.0%) |
| Education Instruction & Library | 0 (0.0%) | 0 (0.0%) |
| Arts, Media & Entertainment | 0 (0.0%) | 0 (0.0%) |
| Health Diagnosing & Treating | 1 (100.0%) | 0 (0.0%) |
| Health Technologists | 0 (0.0%) | 0 (0.0%) |
| Total (Category) | 6 (85.7%) | 1 (14.3%) |
| Total (Overall) | 36 (66.7%) | 18 (33.3%) |
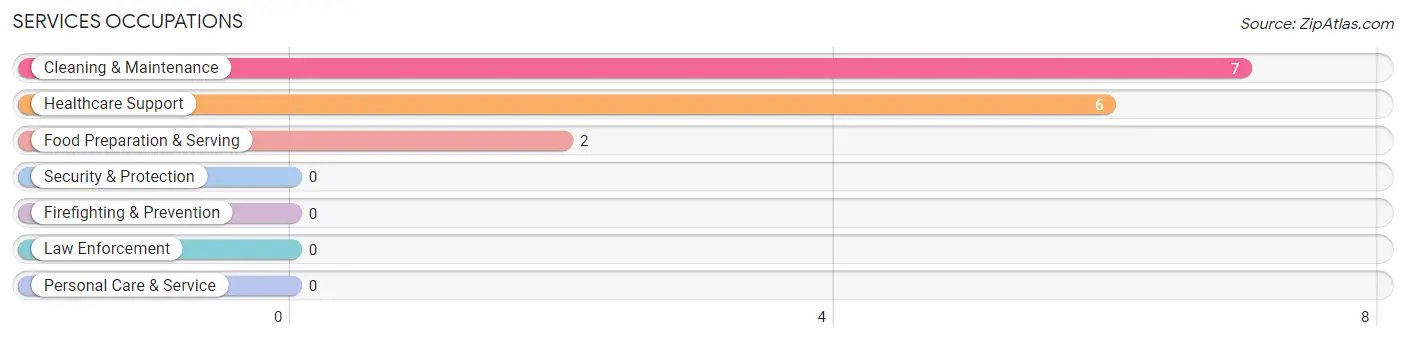
Services Occupations
The most common Services occupations in Whiteside are Cleaning & Maintenance (7 | 13.0%), Healthcare Support (6 | 11.1%), and Food Preparation & Serving (2 | 3.7%).
Services Occupations by Sex
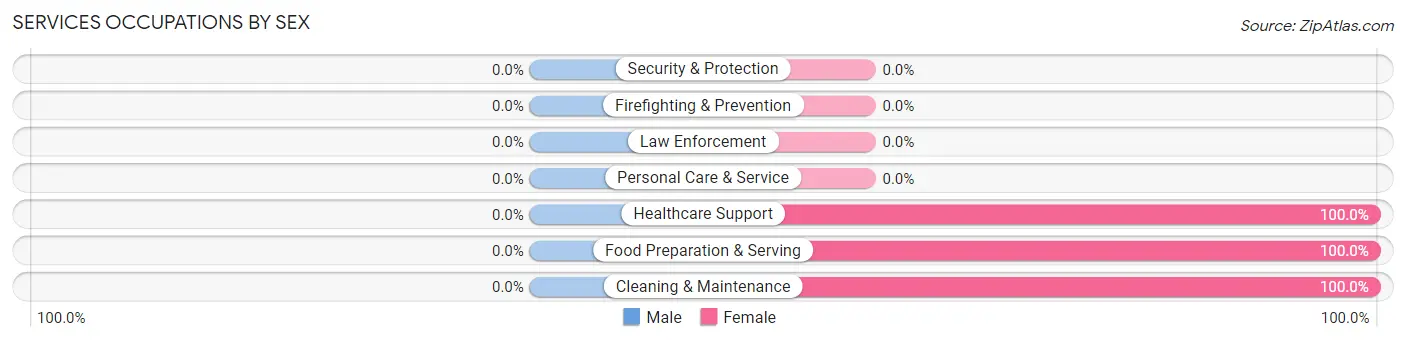
| Occupation | Male | Female |
| Healthcare Support | 0 (0.0%) | 6 (100.0%) |
| Security & Protection | 0 (0.0%) | 0 (0.0%) |
| Firefighting & Prevention | 0 (0.0%) | 0 (0.0%) |
| Law Enforcement | 0 (0.0%) | 0 (0.0%) |
| Food Preparation & Serving | 0 (0.0%) | 2 (100.0%) |
| Cleaning & Maintenance | 0 (0.0%) | 7 (100.0%) |
| Personal Care & Service | 0 (0.0%) | 0 (0.0%) |
| Total (Category) | 0 (0.0%) | 15 (100.0%) |
| Total (Overall) | 36 (66.7%) | 18 (33.3%) |
Sales and Office Occupations
The most common Sales and Office occupations in Whiteside are , and Sales & Related (4 | 7.4%).
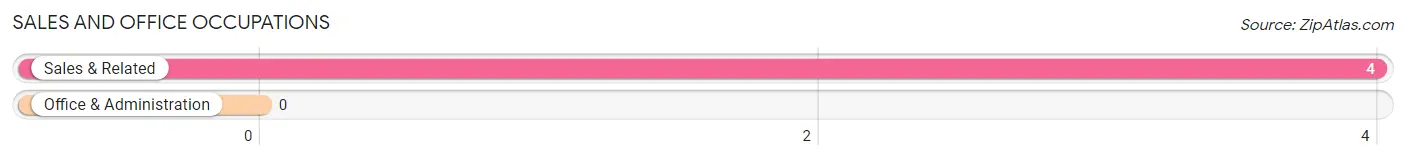
Sales and Office Occupations by Sex
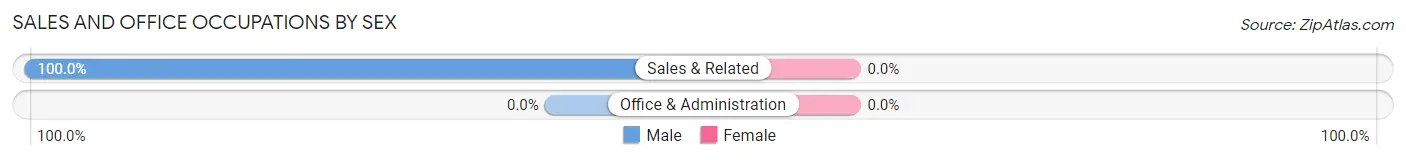
| Occupation | Male | Female |
| Sales & Related | 4 (100.0%) | 0 (0.0%) |
| Office & Administration | 0 (0.0%) | 0 (0.0%) |
| Total (Category) | 4 (100.0%) | 0 (0.0%) |
| Total (Overall) | 36 (66.7%) | 18 (33.3%) |
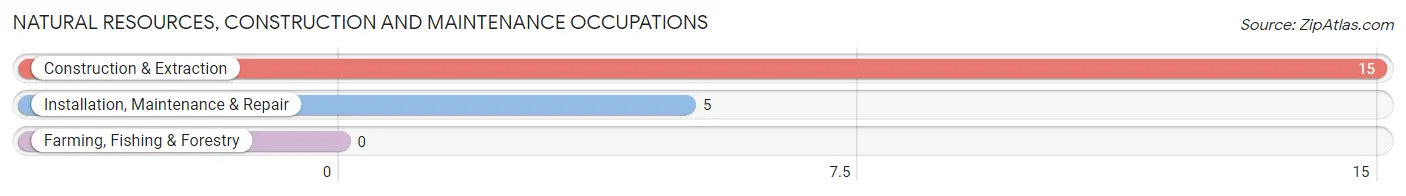
Natural Resources, Construction and Maintenance Occupations
The most common Natural Resources, Construction and Maintenance occupations in Whiteside are Construction & Extraction (15 | 27.8%), and Installation, Maintenance & Repair (5 | 9.3%).
Natural Resources, Construction and Maintenance Occupations by Sex
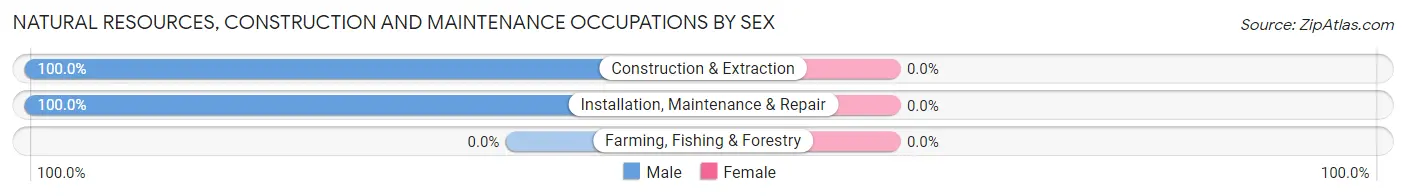
| Occupation | Male | Female |
| Farming, Fishing & Forestry | 0 (0.0%) | 0 (0.0%) |
| Construction & Extraction | 15 (100.0%) | 0 (0.0%) |
| Installation, Maintenance & Repair | 5 (100.0%) | 0 (0.0%) |
| Total (Category) | 20 (100.0%) | 0 (0.0%) |
| Total (Overall) | 36 (66.7%) | 18 (33.3%) |
Production, Transportation and Moving Occupations
The most common Production, Transportation and Moving occupations in Whiteside are Production (6 | 11.1%), Transportation (1 | 1.8%), and Material Moving (1 | 1.8%).
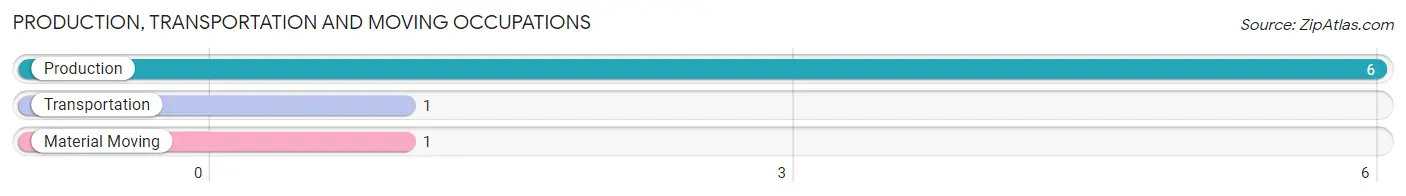
Production, Transportation and Moving Occupations by Sex
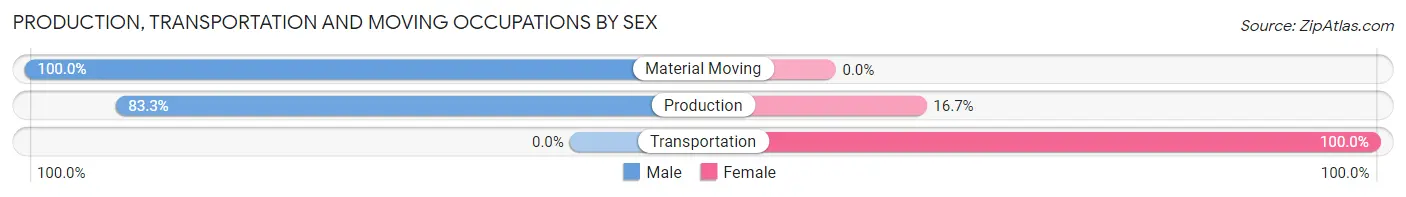
| Occupation | Male | Female |
| Production | 5 (83.3%) | 1 (16.7%) |
| Transportation | 0 (0.0%) | 1 (100.0%) |
| Material Moving | 1 (100.0%) | 0 (0.0%) |
| Total (Category) | 6 (75.0%) | 2 (25.0%) |
| Total (Overall) | 36 (66.7%) | 18 (33.3%) |
Employment Industries by Sex in Whiteside
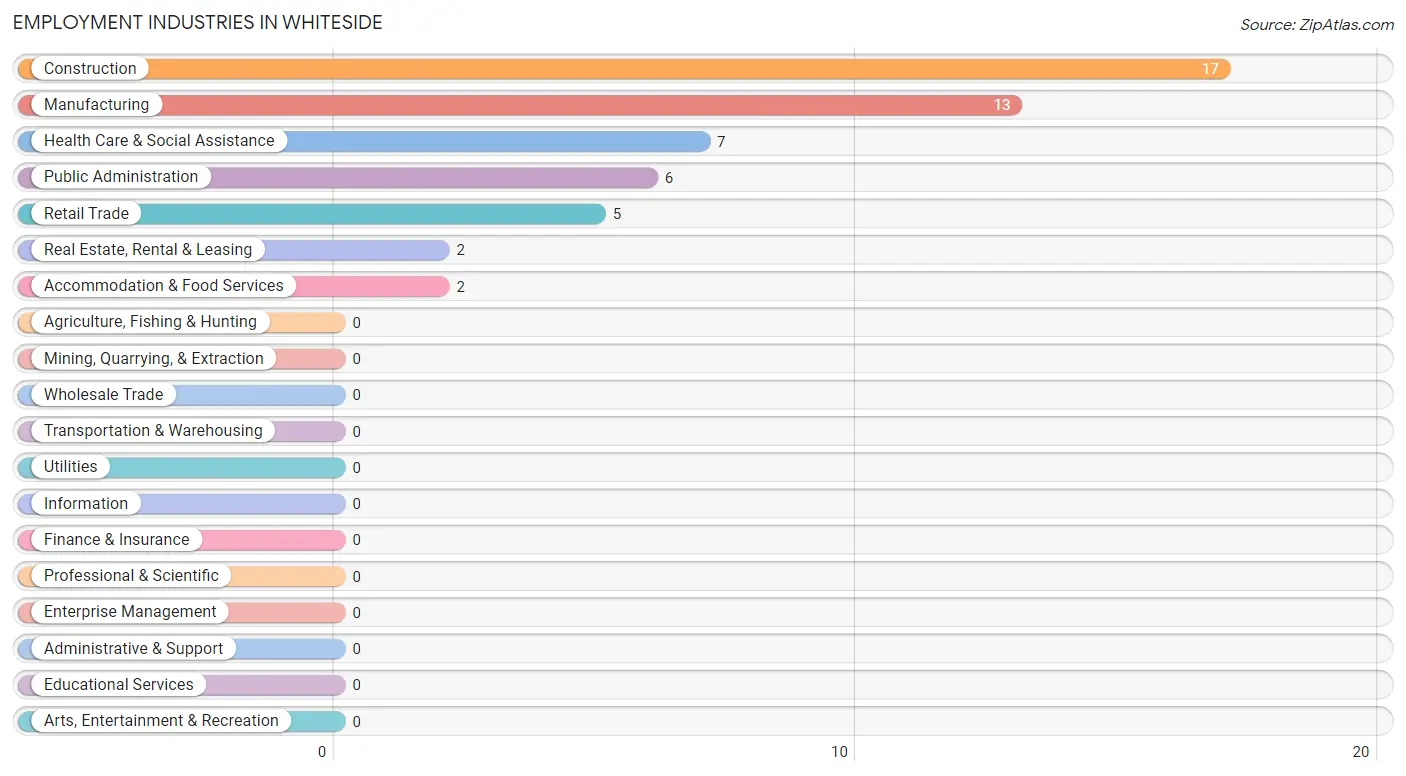
Employment Industries in Whiteside
The major employment industries in Whiteside include Construction (17 | 31.5%), Manufacturing (13 | 24.1%), Health Care & Social Assistance (7 | 13.0%), Public Administration (6 | 11.1%), and Retail Trade (5 | 9.3%).
Employment Industries by Sex in Whiteside
The Whiteside industries that see more men than women are Construction (100.0%), Retail Trade (100.0%), and Real Estate, Rental & Leasing (100.0%), whereas the industries that tend to have a higher number of women are Accommodation & Food Services (100.0%), Public Administration (100.0%), and Health Care & Social Assistance (85.7%).
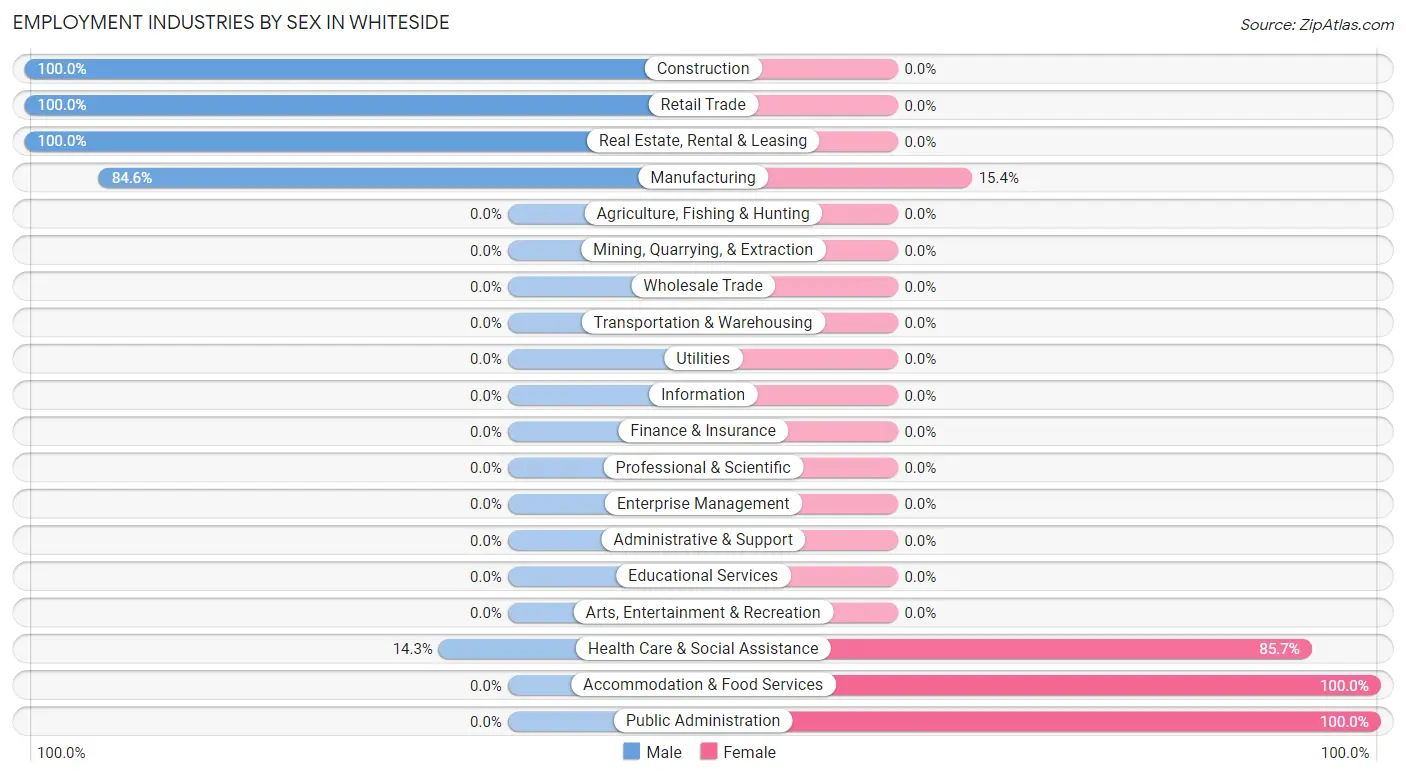
| Industry | Male | Female |
| Agriculture, Fishing & Hunting | 0 (0.0%) | 0 (0.0%) |
| Mining, Quarrying, & Extraction | 0 (0.0%) | 0 (0.0%) |
| Construction | 17 (100.0%) | 0 (0.0%) |
| Manufacturing | 11 (84.6%) | 2 (15.4%) |
| Wholesale Trade | 0 (0.0%) | 0 (0.0%) |
| Retail Trade | 5 (100.0%) | 0 (0.0%) |
| Transportation & Warehousing | 0 (0.0%) | 0 (0.0%) |
| Utilities | 0 (0.0%) | 0 (0.0%) |
| Information | 0 (0.0%) | 0 (0.0%) |
| Finance & Insurance | 0 (0.0%) | 0 (0.0%) |
| Real Estate, Rental & Leasing | 2 (100.0%) | 0 (0.0%) |
| Professional & Scientific | 0 (0.0%) | 0 (0.0%) |
| Enterprise Management | 0 (0.0%) | 0 (0.0%) |
| Administrative & Support | 0 (0.0%) | 0 (0.0%) |
| Educational Services | 0 (0.0%) | 0 (0.0%) |
| Health Care & Social Assistance | 1 (14.3%) | 6 (85.7%) |
| Arts, Entertainment & Recreation | 0 (0.0%) | 0 (0.0%) |
| Accommodation & Food Services | 0 (0.0%) | 2 (100.0%) |
| Public Administration | 0 (0.0%) | 6 (100.0%) |
| Total | 36 (66.7%) | 18 (33.3%) |
Education in Whiteside
School Enrollment in Whiteside
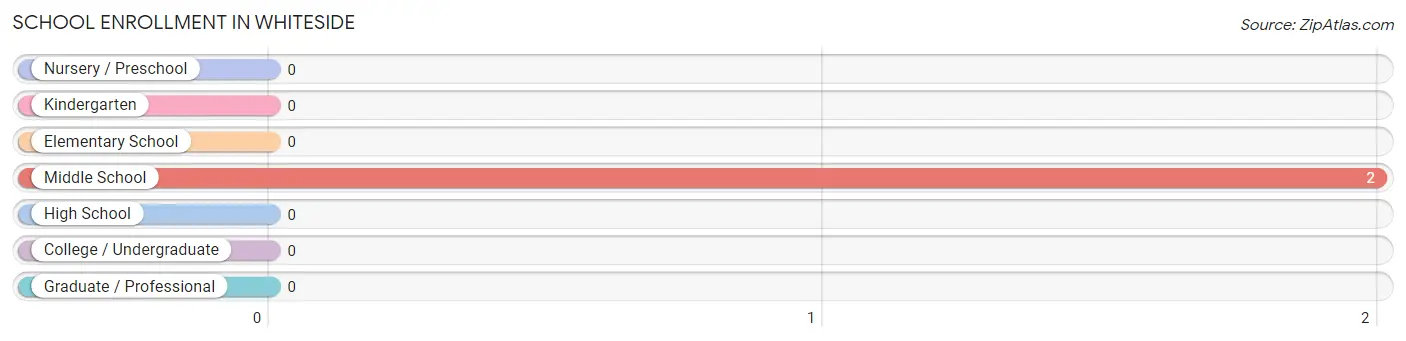
| School Level | # Students | % Students |
| Nursery / Preschool | 0 | 0.0% |
| Kindergarten | 0 | 0.0% |
| Elementary School | 0 | 0.0% |
| Middle School | 2 | 100.0% |
| High School | 0 | 0.0% |
| College / Undergraduate | 0 | 0.0% |
| Graduate / Professional | 0 | 0.0% |
| Total | 2 | 100.0% |
School Enrollment by Age by Funding Source in Whiteside
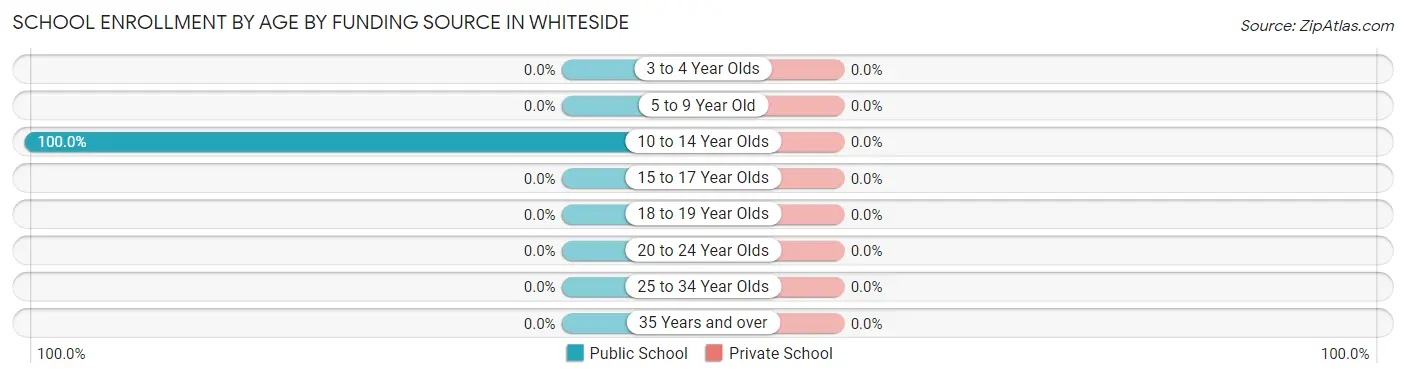
| Age Bracket | Public School | Private School |
| 3 to 4 Year Olds | 0 (0.0%) | 0 (0.0%) |
| 5 to 9 Year Old | 0 (0.0%) | 0 (0.0%) |
| 10 to 14 Year Olds | 2 (100.0%) | 0 (0.0%) |
| 15 to 17 Year Olds | 0 (0.0%) | 0 (0.0%) |
| 18 to 19 Year Olds | 0 (0.0%) | 0 (0.0%) |
| 20 to 24 Year Olds | 0 (0.0%) | 0 (0.0%) |
| 25 to 34 Year Olds | 0 (0.0%) | 0 (0.0%) |
| 35 Years and over | 0 (0.0%) | 0 (0.0%) |
| Total | 2 (100.0%) | 0 (0.0%) |
Educational Attainment by Field of Study in Whiteside
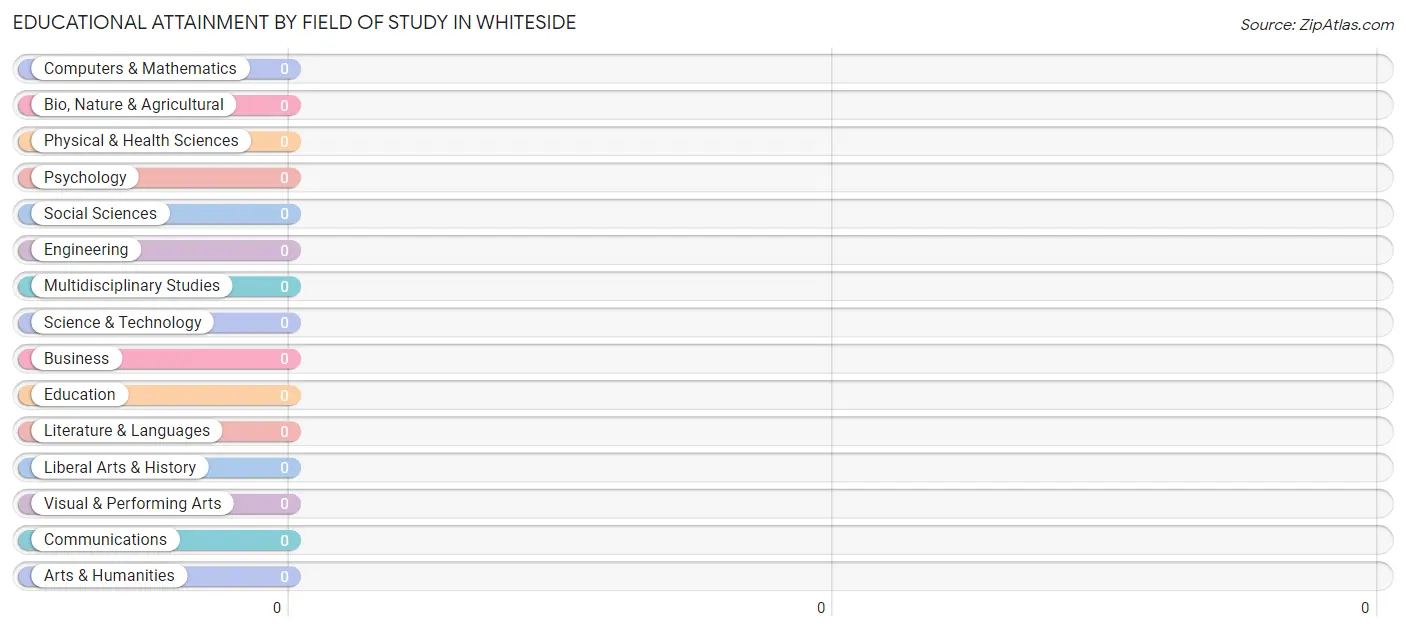
| Field of Study | # Graduates | % Graduates |
| Computers & Mathematics | 0 | 0.0% |
| Bio, Nature & Agricultural | 0 | 0.0% |
| Physical & Health Sciences | 0 | 0.0% |
| Psychology | 0 | 0.0% |
| Social Sciences | 0 | 0.0% |
| Engineering | 0 | 0.0% |
| Multidisciplinary Studies | 0 | 0.0% |
| Science & Technology | 0 | 0.0% |
| Business | 0 | 0.0% |
| Education | 0 | 0.0% |
| Literature & Languages | 0 | 0.0% |
| Liberal Arts & History | 0 | 0.0% |
| Visual & Performing Arts | 0 | 0.0% |
| Communications | 0 | 0.0% |
| Arts & Humanities | 0 | 0.0% |
| Total | 0 | 0.0% |
Transportation & Commute in Whiteside
Vehicle Availability by Sex in Whiteside
The most prevalent vehicle ownership categories in Whiteside are males with 3 vehicles (22, accounting for 61.1%) and females with 3 vehicles (12, making up 122.2%).
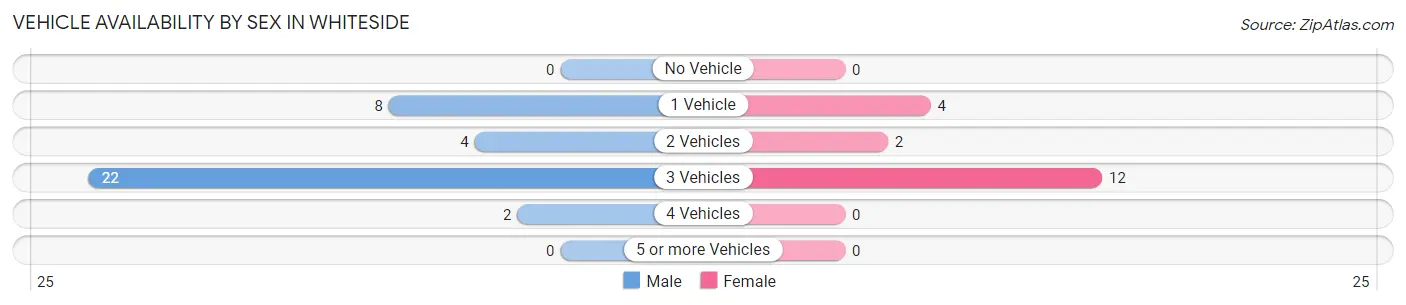
| Vehicles Available | Male | Female |
| No Vehicle | 0 (0.0%) | 0 (0.0%) |
| 1 Vehicle | 8 (22.2%) | 4 (22.2%) |
| 2 Vehicles | 4 (11.1%) | 2 (11.1%) |
| 3 Vehicles | 22 (61.1%) | 12 (66.7%) |
| 4 Vehicles | 2 (5.6%) | 0 (0.0%) |
| 5 or more Vehicles | 0 (0.0%) | 0 (0.0%) |
| Total | 36 (100.0%) | 18 (100.0%) |
Commute Time in Whiteside
The most frequently occuring commute durations in Whiteside are 30 to 34 minutes (19 commuters, 35.2%), 45 to 59 minutes (15 commuters, 27.8%), and 10 to 14 minutes (6 commuters, 11.1%).
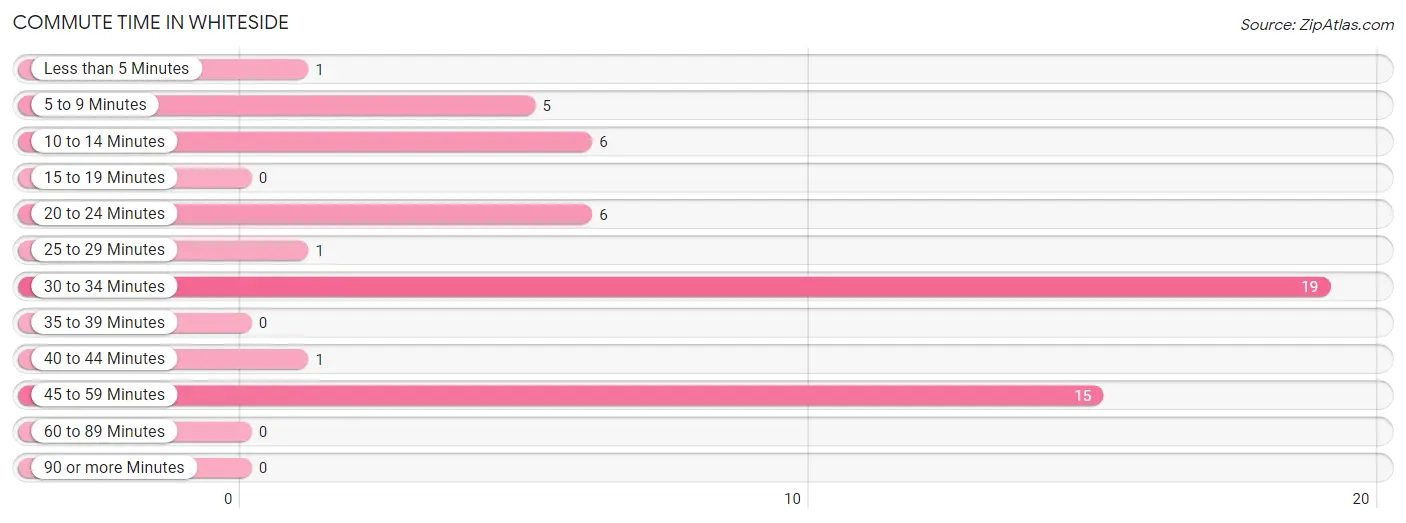
| Commute Time | # Commuters | % Commuters |
| Less than 5 Minutes | 1 | 1.8% |
| 5 to 9 Minutes | 5 | 9.3% |
| 10 to 14 Minutes | 6 | 11.1% |
| 15 to 19 Minutes | 0 | 0.0% |
| 20 to 24 Minutes | 6 | 11.1% |
| 25 to 29 Minutes | 1 | 1.8% |
| 30 to 34 Minutes | 19 | 35.2% |
| 35 to 39 Minutes | 0 | 0.0% |
| 40 to 44 Minutes | 1 | 1.8% |
| 45 to 59 Minutes | 15 | 27.8% |
| 60 to 89 Minutes | 0 | 0.0% |
| 90 or more Minutes | 0 | 0.0% |
Commute Time by Sex in Whiteside
The most common commute times in Whiteside are 30 to 34 minutes (13 commuters, 36.1%) for males and 30 to 34 minutes (6 commuters, 33.3%) for females.
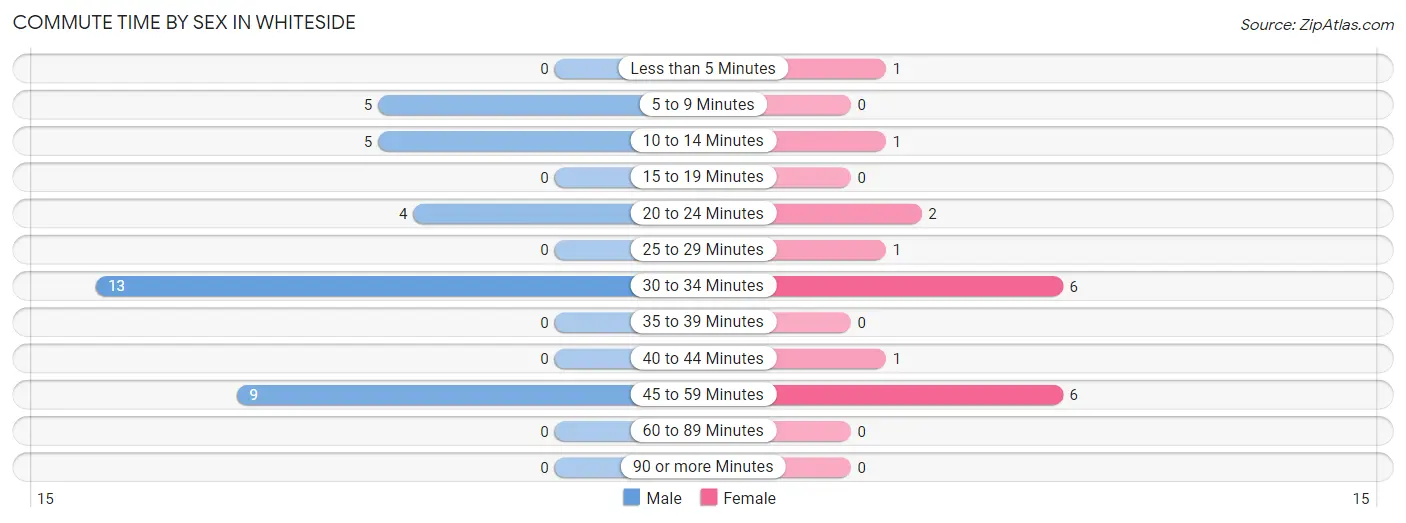
| Commute Time | Male | Female |
| Less than 5 Minutes | 0 (0.0%) | 1 (5.6%) |
| 5 to 9 Minutes | 5 (13.9%) | 0 (0.0%) |
| 10 to 14 Minutes | 5 (13.9%) | 1 (5.6%) |
| 15 to 19 Minutes | 0 (0.0%) | 0 (0.0%) |
| 20 to 24 Minutes | 4 (11.1%) | 2 (11.1%) |
| 25 to 29 Minutes | 0 (0.0%) | 1 (5.6%) |
| 30 to 34 Minutes | 13 (36.1%) | 6 (33.3%) |
| 35 to 39 Minutes | 0 (0.0%) | 0 (0.0%) |
| 40 to 44 Minutes | 0 (0.0%) | 1 (5.6%) |
| 45 to 59 Minutes | 9 (25.0%) | 6 (33.3%) |
| 60 to 89 Minutes | 0 (0.0%) | 0 (0.0%) |
| 90 or more Minutes | 0 (0.0%) | 0 (0.0%) |
Time of Departure to Work by Sex in Whiteside
The most frequent times of departure to work in Whiteside are 7:30 AM to 7:59 AM (14, 38.9%) for males and 7:30 AM to 7:59 AM (7, 38.9%) for females.
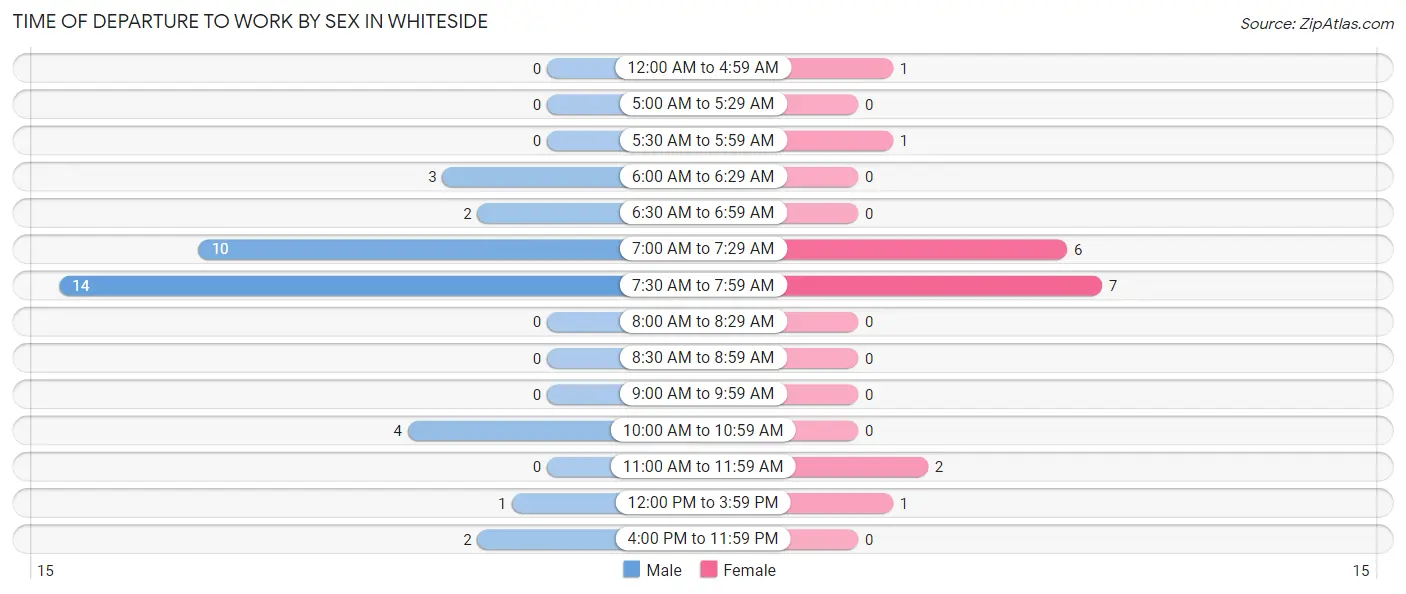
| Time of Departure | Male | Female |
| 12:00 AM to 4:59 AM | 0 (0.0%) | 1 (5.6%) |
| 5:00 AM to 5:29 AM | 0 (0.0%) | 0 (0.0%) |
| 5:30 AM to 5:59 AM | 0 (0.0%) | 1 (5.6%) |
| 6:00 AM to 6:29 AM | 3 (8.3%) | 0 (0.0%) |
| 6:30 AM to 6:59 AM | 2 (5.6%) | 0 (0.0%) |
| 7:00 AM to 7:29 AM | 10 (27.8%) | 6 (33.3%) |
| 7:30 AM to 7:59 AM | 14 (38.9%) | 7 (38.9%) |
| 8:00 AM to 8:29 AM | 0 (0.0%) | 0 (0.0%) |
| 8:30 AM to 8:59 AM | 0 (0.0%) | 0 (0.0%) |
| 9:00 AM to 9:59 AM | 0 (0.0%) | 0 (0.0%) |
| 10:00 AM to 10:59 AM | 4 (11.1%) | 0 (0.0%) |
| 11:00 AM to 11:59 AM | 0 (0.0%) | 2 (11.1%) |
| 12:00 PM to 3:59 PM | 1 (2.8%) | 1 (5.6%) |
| 4:00 PM to 11:59 PM | 2 (5.6%) | 0 (0.0%) |
| Total | 36 (100.0%) | 18 (100.0%) |
Housing Occupancy in Whiteside
Occupancy by Ownership in Whiteside
Of the total 44 dwellings in Whiteside, owner-occupied units account for 33 (75.0%), while renter-occupied units make up 11 (25.0%).
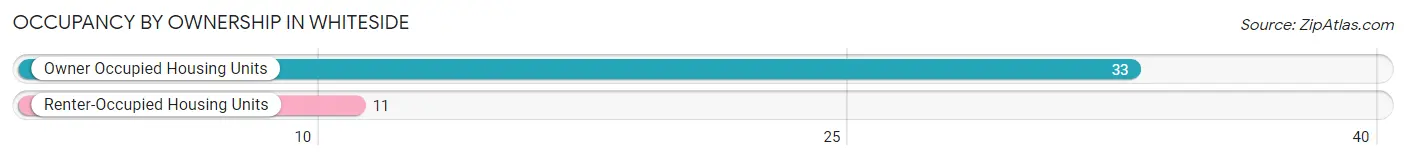
| Occupancy | # Housing Units | % Housing Units |
| Owner Occupied Housing Units | 33 | 75.0% |
| Renter-Occupied Housing Units | 11 | 25.0% |
| Total Occupied Housing Units | 44 | 100.0% |
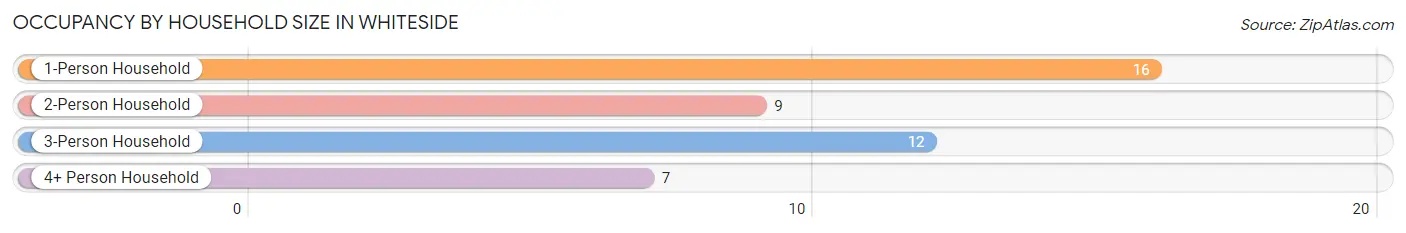
Occupancy by Household Size in Whiteside
| Household Size | # Housing Units | % Housing Units |
| 1-Person Household | 16 | 36.4% |
| 2-Person Household | 9 | 20.4% |
| 3-Person Household | 12 | 27.3% |
| 4+ Person Household | 7 | 15.9% |
| Total Housing Units | 44 | 100.0% |
Occupancy by Ownership by Household Size in Whiteside
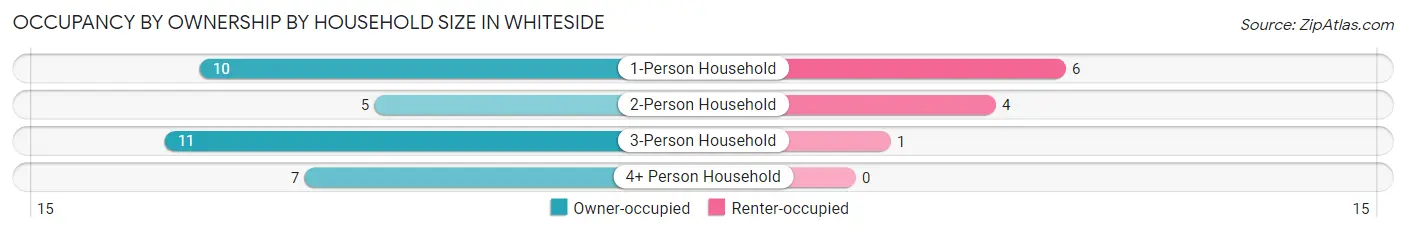
| Household Size | Owner-occupied | Renter-occupied |
| 1-Person Household | 10 (62.5%) | 6 (37.5%) |
| 2-Person Household | 5 (55.6%) | 4 (44.4%) |
| 3-Person Household | 11 (91.7%) | 1 (8.3%) |
| 4+ Person Household | 7 (100.0%) | 0 (0.0%) |
| Total Housing Units | 33 (75.0%) | 11 (25.0%) |
Occupancy by Educational Attainment in Whiteside
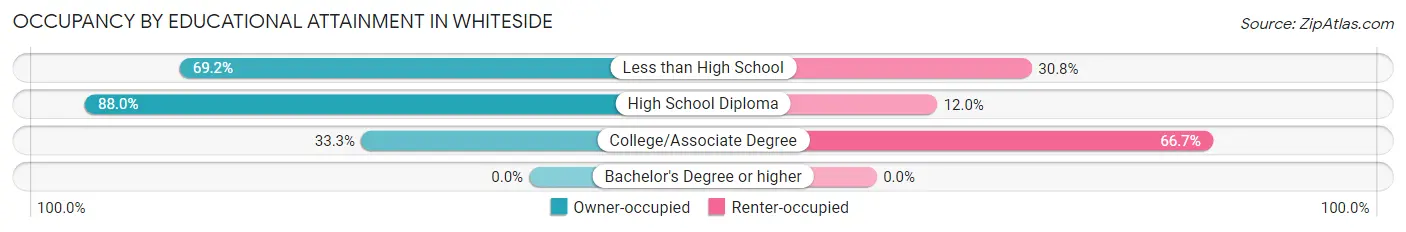
| Household Size | Owner-occupied | Renter-occupied |
| Less than High School | 9 (69.2%) | 4 (30.8%) |
| High School Diploma | 22 (88.0%) | 3 (12.0%) |
| College/Associate Degree | 2 (33.3%) | 4 (66.7%) |
| Bachelor's Degree or higher | 0 (0.0%) | 0 (0.0%) |
Occupancy by Age of Householder in Whiteside
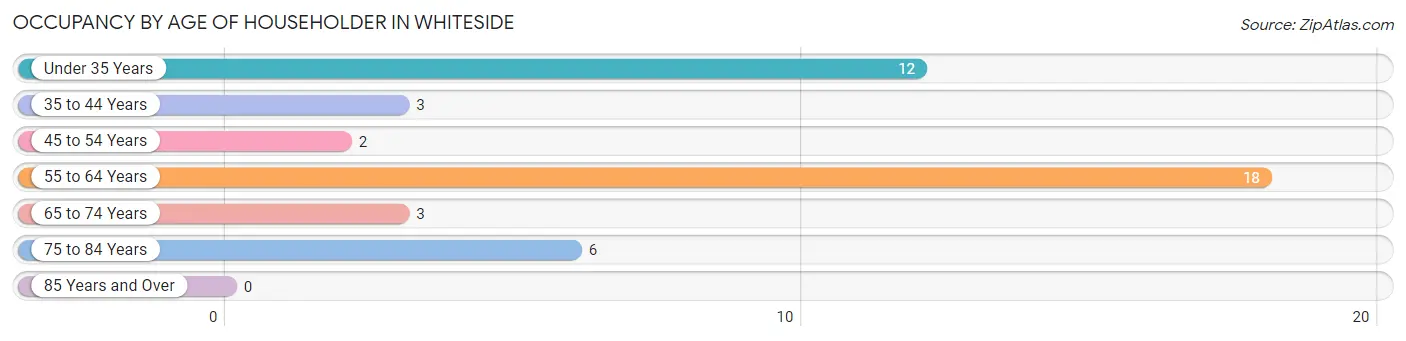
| Age Bracket | # Households | % Households |
| Under 35 Years | 12 | 27.3% |
| 35 to 44 Years | 3 | 6.8% |
| 45 to 54 Years | 2 | 4.5% |
| 55 to 64 Years | 18 | 40.9% |
| 65 to 74 Years | 3 | 6.8% |
| 75 to 84 Years | 6 | 13.6% |
| 85 Years and Over | 0 | 0.0% |
| Total | 44 | 100.0% |
Housing Finances in Whiteside
Median Income by Occupancy in Whiteside
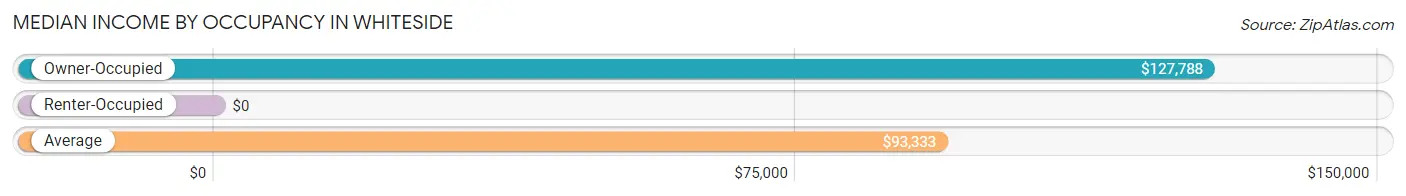
| Occupancy Type | # Households | Median Income |
| Owner-Occupied | 33 (75.0%) | $127,788 |
| Renter-Occupied | 11 (25.0%) | $0 |
| Average | 44 (100.0%) | $93,333 |
Occupancy by Householder Income Bracket in Whiteside
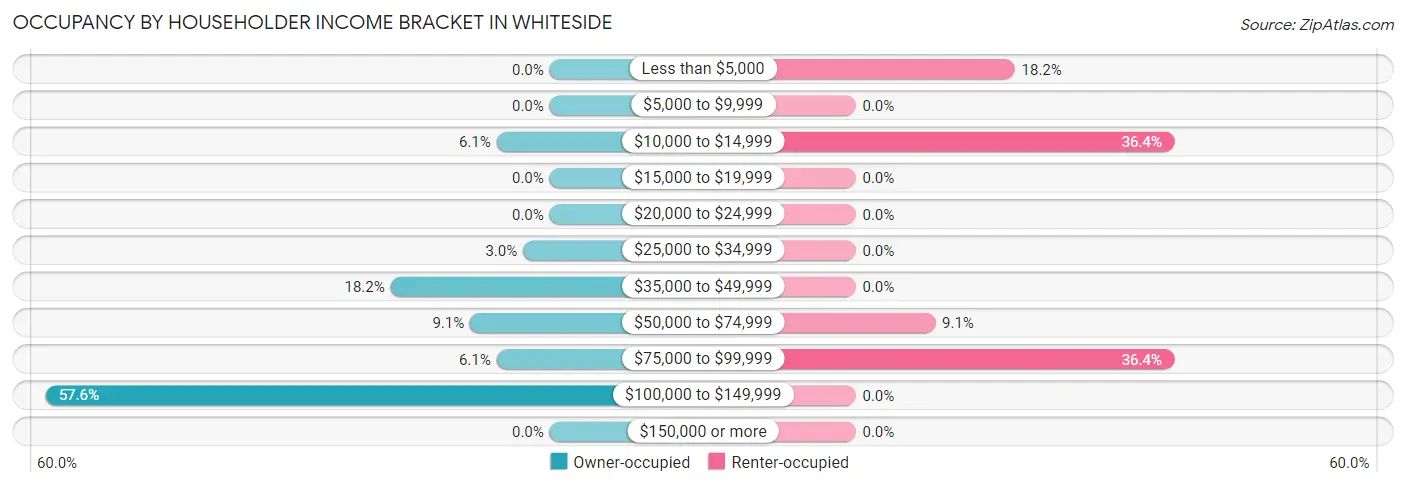
| Income Bracket | Owner-occupied | Renter-occupied |
| Less than $5,000 | 0 (0.0%) | 2 (18.2%) |
| $5,000 to $9,999 | 0 (0.0%) | 0 (0.0%) |
| $10,000 to $14,999 | 2 (6.1%) | 4 (36.4%) |
| $15,000 to $19,999 | 0 (0.0%) | 0 (0.0%) |
| $20,000 to $24,999 | 0 (0.0%) | 0 (0.0%) |
| $25,000 to $34,999 | 1 (3.0%) | 0 (0.0%) |
| $35,000 to $49,999 | 6 (18.2%) | 0 (0.0%) |
| $50,000 to $74,999 | 3 (9.1%) | 1 (9.1%) |
| $75,000 to $99,999 | 2 (6.1%) | 4 (36.4%) |
| $100,000 to $149,999 | 19 (57.6%) | 0 (0.0%) |
| $150,000 or more | 0 (0.0%) | 0 (0.0%) |
| Total | 33 (100.0%) | 11 (100.0%) |
Monthly Housing Cost Tiers in Whiteside
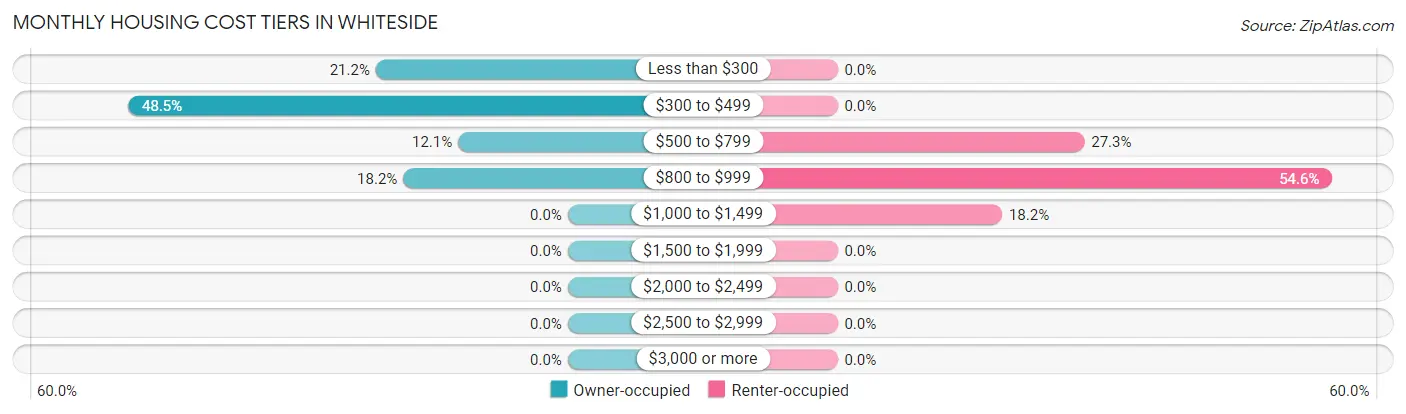
| Monthly Cost | Owner-occupied | Renter-occupied |
| Less than $300 | 7 (21.2%) | 0 (0.0%) |
| $300 to $499 | 16 (48.5%) | 0 (0.0%) |
| $500 to $799 | 4 (12.1%) | 3 (27.3%) |
| $800 to $999 | 6 (18.2%) | 6 (54.5%) |
| $1,000 to $1,499 | 0 (0.0%) | 2 (18.2%) |
| $1,500 to $1,999 | 0 (0.0%) | 0 (0.0%) |
| $2,000 to $2,499 | 0 (0.0%) | 0 (0.0%) |
| $2,500 to $2,999 | 0 (0.0%) | 0 (0.0%) |
| $3,000 or more | 0 (0.0%) | 0 (0.0%) |
| Total | 33 (100.0%) | 11 (100.0%) |
Physical Housing Characteristics in Whiteside
Housing Structures in Whiteside
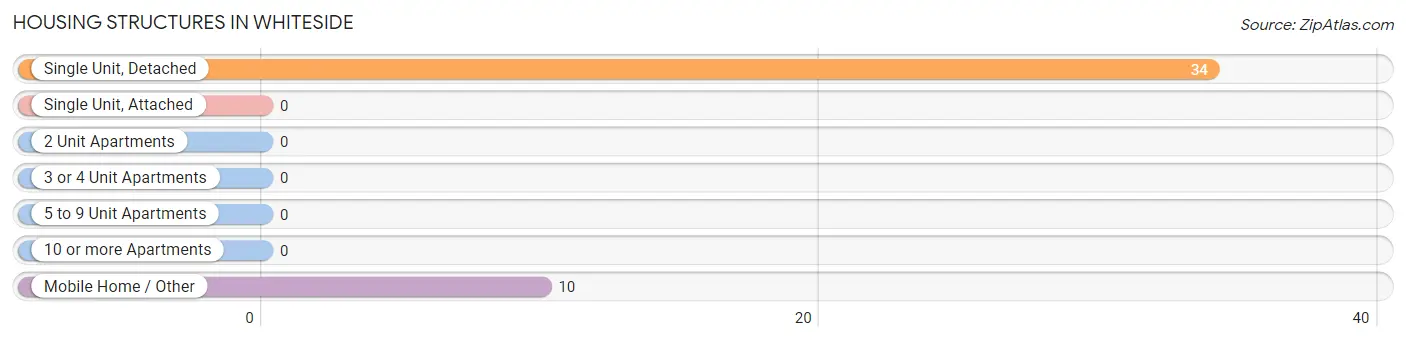
| Structure Type | # Housing Units | % Housing Units |
| Single Unit, Detached | 34 | 77.3% |
| Single Unit, Attached | 0 | 0.0% |
| 2 Unit Apartments | 0 | 0.0% |
| 3 or 4 Unit Apartments | 0 | 0.0% |
| 5 to 9 Unit Apartments | 0 | 0.0% |
| 10 or more Apartments | 0 | 0.0% |
| Mobile Home / Other | 10 | 22.7% |
| Total | 44 | 100.0% |
Housing Structures by Occupancy in Whiteside
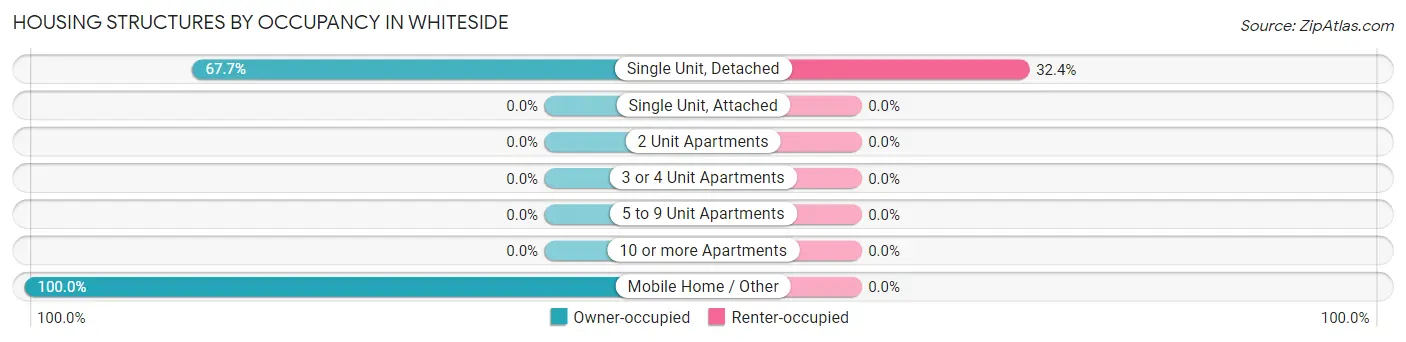
| Structure Type | Owner-occupied | Renter-occupied |
| Single Unit, Detached | 23 (67.6%) | 11 (32.4%) |
| Single Unit, Attached | 0 (0.0%) | 0 (0.0%) |
| 2 Unit Apartments | 0 (0.0%) | 0 (0.0%) |
| 3 or 4 Unit Apartments | 0 (0.0%) | 0 (0.0%) |
| 5 to 9 Unit Apartments | 0 (0.0%) | 0 (0.0%) |
| 10 or more Apartments | 0 (0.0%) | 0 (0.0%) |
| Mobile Home / Other | 10 (100.0%) | 0 (0.0%) |
| Total | 33 (75.0%) | 11 (25.0%) |
Housing Structures by Number of Rooms in Whiteside
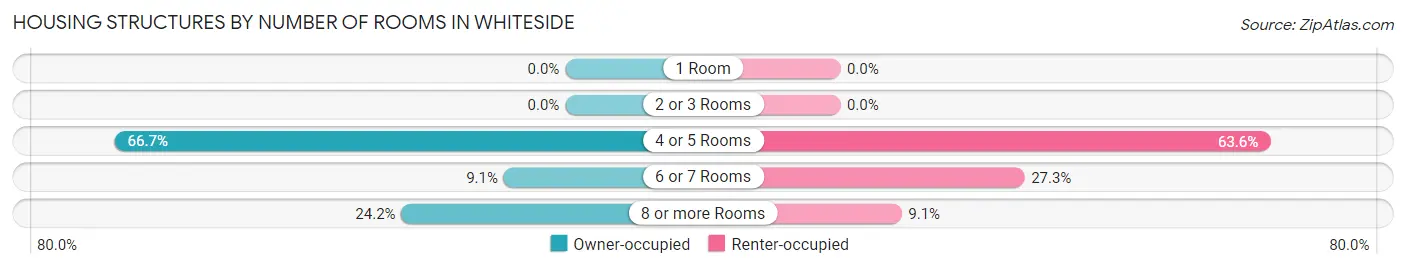
| Number of Rooms | Owner-occupied | Renter-occupied |
| 1 Room | 0 (0.0%) | 0 (0.0%) |
| 2 or 3 Rooms | 0 (0.0%) | 0 (0.0%) |
| 4 or 5 Rooms | 22 (66.7%) | 7 (63.6%) |
| 6 or 7 Rooms | 3 (9.1%) | 3 (27.3%) |
| 8 or more Rooms | 8 (24.2%) | 1 (9.1%) |
| Total | 33 (100.0%) | 11 (100.0%) |
Housing Structure by Heating Type in Whiteside
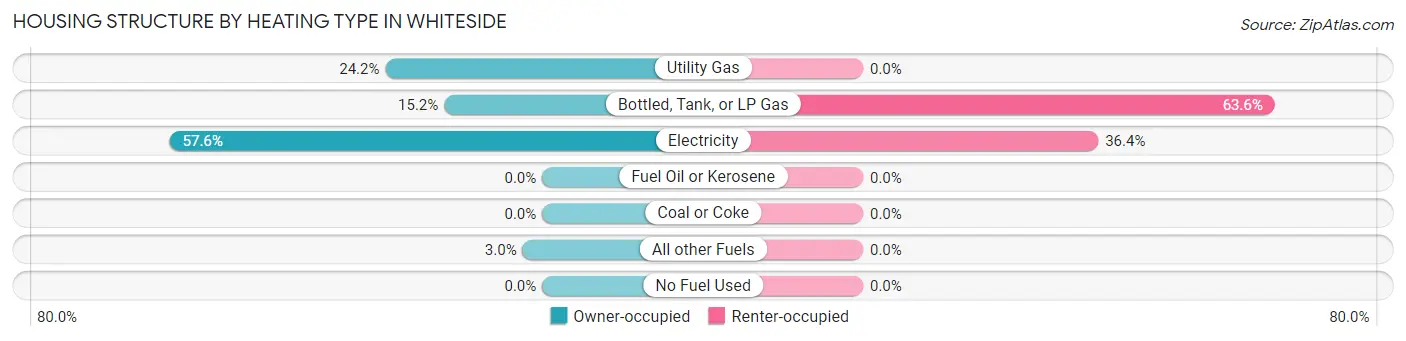
| Heating Type | Owner-occupied | Renter-occupied |
| Utility Gas | 8 (24.2%) | 0 (0.0%) |
| Bottled, Tank, or LP Gas | 5 (15.1%) | 7 (63.6%) |
| Electricity | 19 (57.6%) | 4 (36.4%) |
| Fuel Oil or Kerosene | 0 (0.0%) | 0 (0.0%) |
| Coal or Coke | 0 (0.0%) | 0 (0.0%) |
| All other Fuels | 1 (3.0%) | 0 (0.0%) |
| No Fuel Used | 0 (0.0%) | 0 (0.0%) |
| Total | 33 (100.0%) | 11 (100.0%) |
Household Vehicle Usage in Whiteside

| Vehicles per Household | Owner-occupied | Renter-occupied |
| No Vehicle | 0 (0.0%) | 4 (36.4%) |
| 1 Vehicle | 8 (24.2%) | 3 (27.3%) |
| 2 Vehicles | 1 (3.0%) | 4 (36.4%) |
| 3 or more Vehicles | 24 (72.7%) | 0 (0.0%) |
| Total | 33 (100.0%) | 11 (100.0%) |
Real Estate & Mortgages in Whiteside
Real Estate and Mortgage Overview in Whiteside
| Characteristic | Without Mortgage | With Mortgage |
| Housing Units | 23 | 10 |
| Median Property Value | - | - |
| Median Household Income | $127,788 | $0 |
| Monthly Housing Costs | $328 | $0 |
| Real Estate Taxes | $529 | $0 |
Property Value by Mortgage Status in Whiteside
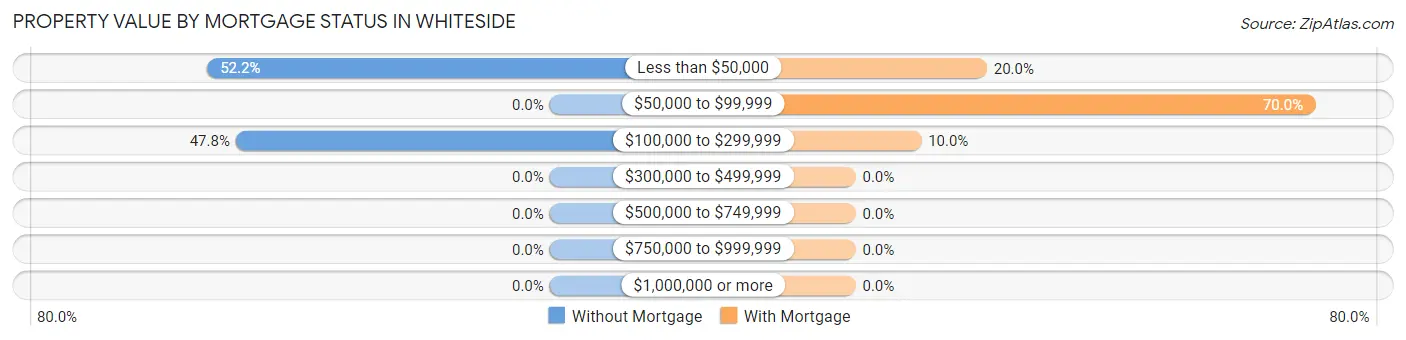
| Property Value | Without Mortgage | With Mortgage |
| Less than $50,000 | 12 (52.2%) | 2 (20.0%) |
| $50,000 to $99,999 | 0 (0.0%) | 7 (70.0%) |
| $100,000 to $299,999 | 11 (47.8%) | 1 (10.0%) |
| $300,000 to $499,999 | 0 (0.0%) | 0 (0.0%) |
| $500,000 to $749,999 | 0 (0.0%) | 0 (0.0%) |
| $750,000 to $999,999 | 0 (0.0%) | 0 (0.0%) |
| $1,000,000 or more | 0 (0.0%) | 0 (0.0%) |
| Total | 23 (100.0%) | 10 (100.0%) |
Household Income by Mortgage Status in Whiteside
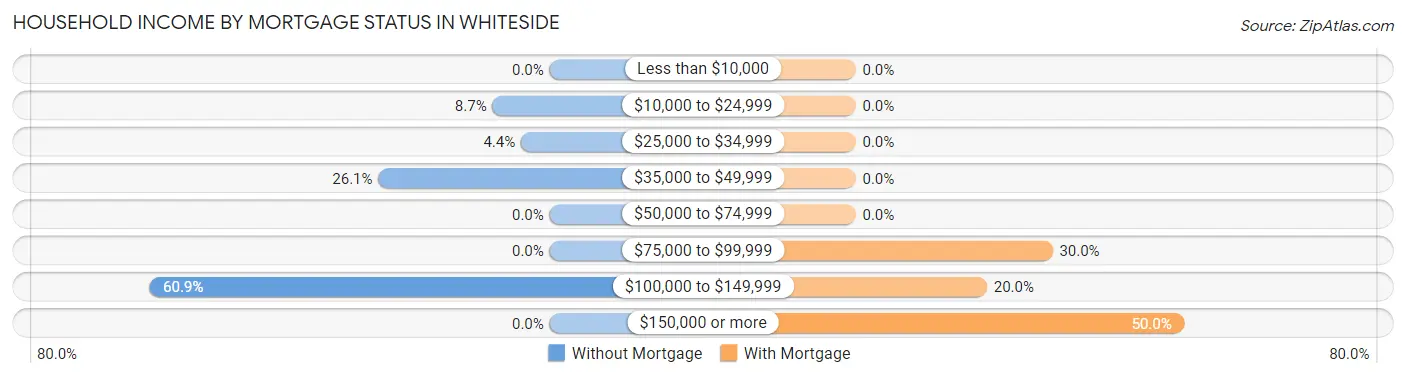
| Household Income | Without Mortgage | With Mortgage |
| Less than $10,000 | 0 (0.0%) | 0 (0.0%) |
| $10,000 to $24,999 | 2 (8.7%) | 0 (0.0%) |
| $25,000 to $34,999 | 1 (4.3%) | 0 (0.0%) |
| $35,000 to $49,999 | 6 (26.1%) | 0 (0.0%) |
| $50,000 to $74,999 | 0 (0.0%) | 0 (0.0%) |
| $75,000 to $99,999 | 0 (0.0%) | 3 (30.0%) |
| $100,000 to $149,999 | 14 (60.9%) | 2 (20.0%) |
| $150,000 or more | 0 (0.0%) | 5 (50.0%) |
| Total | 23 (100.0%) | 10 (100.0%) |
Property Value to Household Income Ratio in Whiteside
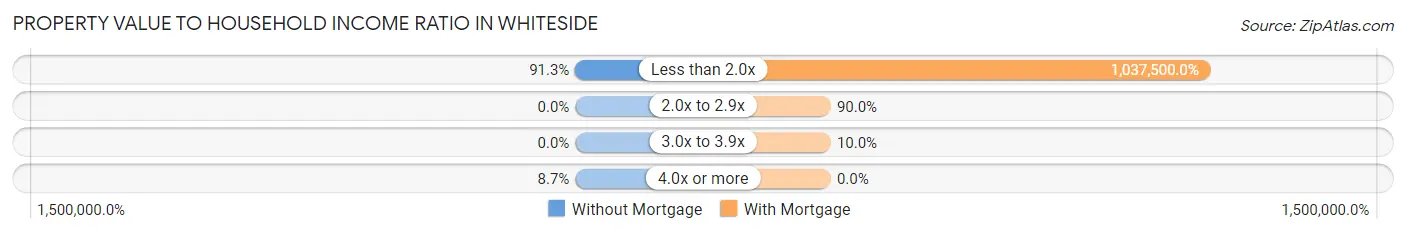
| Value-to-Income Ratio | Without Mortgage | With Mortgage |
| Less than 2.0x | 21 (91.3%) | 103,750 (1,037,500.0%) |
| 2.0x to 2.9x | 0 (0.0%) | 9 (90.0%) |
| 3.0x to 3.9x | 0 (0.0%) | 1 (10.0%) |
| 4.0x or more | 2 (8.7%) | 0 (0.0%) |
| Total | 23 (100.0%) | 10 (100.0%) |
Real Estate Taxes by Mortgage Status in Whiteside
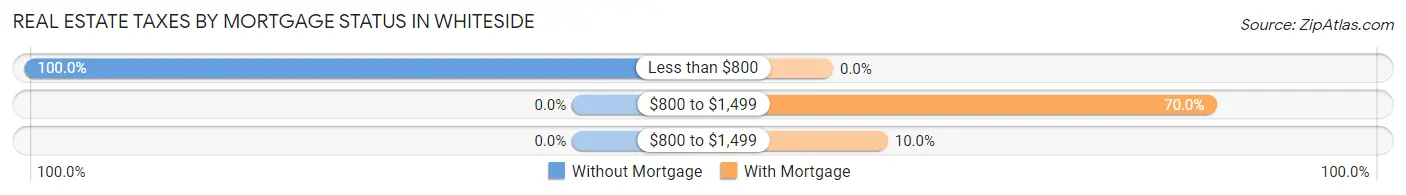
| Property Taxes | Without Mortgage | With Mortgage |
| Less than $800 | 23 (100.0%) | 0 (0.0%) |
| $800 to $1,499 | 0 (0.0%) | 7 (70.0%) |
| $800 to $1,499 | 0 (0.0%) | 1 (10.0%) |
| Total | 23 (100.0%) | 10 (100.0%) |
Health & Disability in Whiteside
Health Insurance Coverage by Age in Whiteside
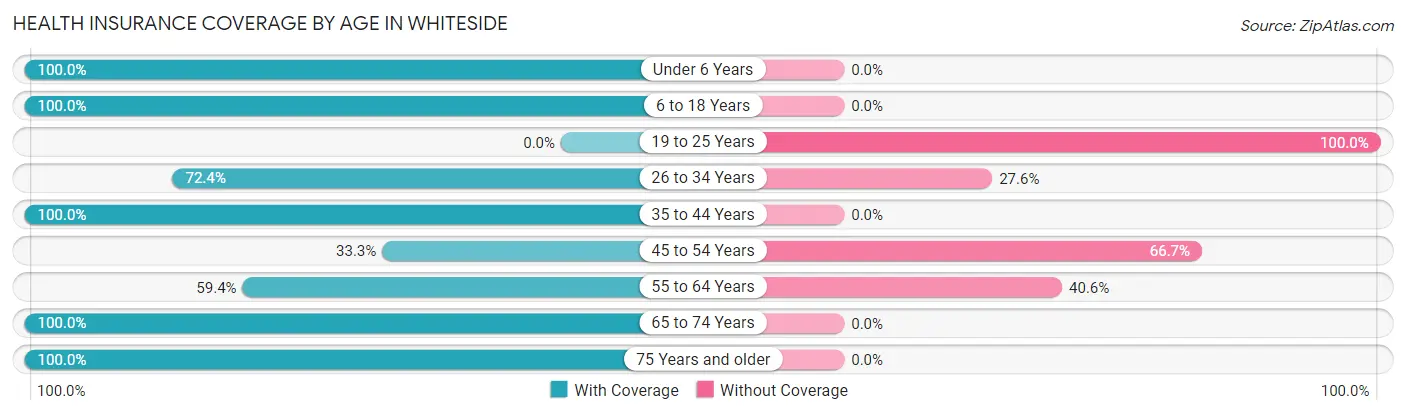
| Age Bracket | With Coverage | Without Coverage |
| Under 6 Years | 18 (100.0%) | 0 (0.0%) |
| 6 to 18 Years | 2 (100.0%) | 0 (0.0%) |
| 19 to 25 Years | 0 (0.0%) | 3 (100.0%) |
| 26 to 34 Years | 21 (72.4%) | 8 (27.6%) |
| 35 to 44 Years | 3 (100.0%) | 0 (0.0%) |
| 45 to 54 Years | 2 (33.3%) | 4 (66.7%) |
| 55 to 64 Years | 19 (59.4%) | 13 (40.6%) |
| 65 to 74 Years | 8 (100.0%) | 0 (0.0%) |
| 75 Years and older | 6 (100.0%) | 0 (0.0%) |
| Total | 79 (73.8%) | 28 (26.2%) |
Health Insurance Coverage by Citizenship Status in Whiteside
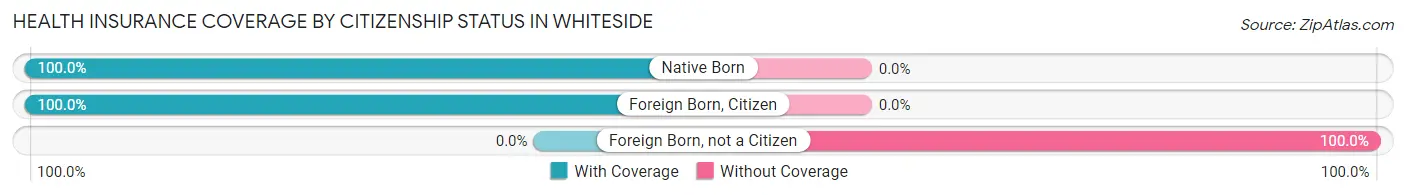
| Citizenship Status | With Coverage | Without Coverage |
| Native Born | 18 (100.0%) | 0 (0.0%) |
| Foreign Born, Citizen | 2 (100.0%) | 0 (0.0%) |
| Foreign Born, not a Citizen | 0 (0.0%) | 3 (100.0%) |
Health Insurance Coverage by Household Income in Whiteside
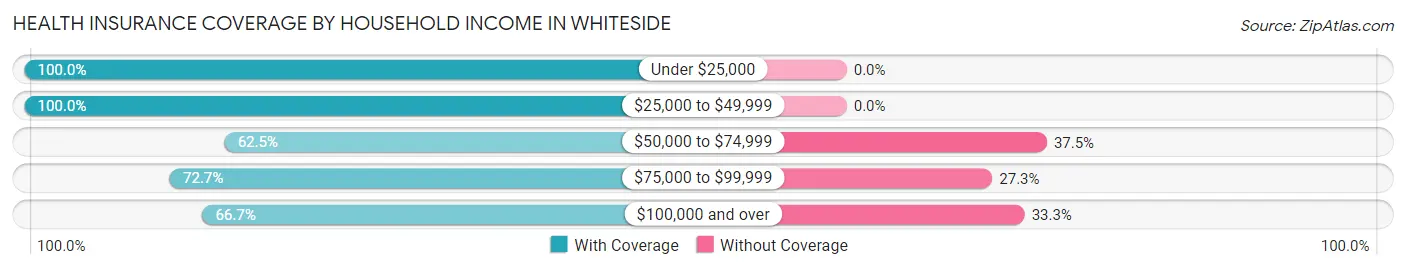
| Household Income | With Coverage | Without Coverage |
| Under $25,000 | 8 (100.0%) | 0 (0.0%) |
| $25,000 to $49,999 | 15 (100.0%) | 0 (0.0%) |
| $50,000 to $74,999 | 10 (62.5%) | 6 (37.5%) |
| $75,000 to $99,999 | 8 (72.7%) | 3 (27.3%) |
| $100,000 and over | 38 (66.7%) | 19 (33.3%) |
Public vs Private Health Insurance Coverage by Age in Whiteside
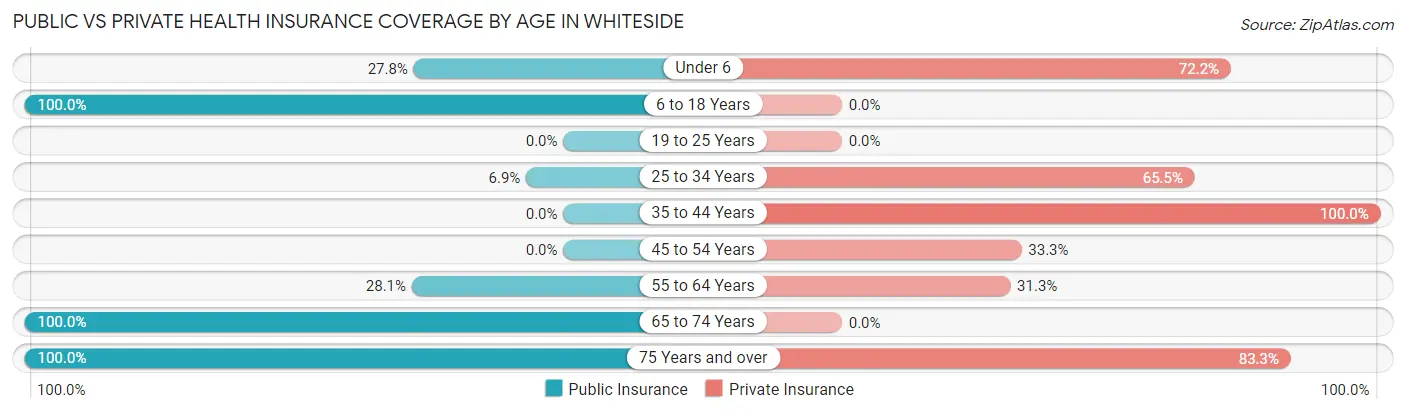
| Age Bracket | Public Insurance | Private Insurance |
| Under 6 | 5 (27.8%) | 13 (72.2%) |
| 6 to 18 Years | 2 (100.0%) | 0 (0.0%) |
| 19 to 25 Years | 0 (0.0%) | 0 (0.0%) |
| 25 to 34 Years | 2 (6.9%) | 19 (65.5%) |
| 35 to 44 Years | 0 (0.0%) | 3 (100.0%) |
| 45 to 54 Years | 0 (0.0%) | 2 (33.3%) |
| 55 to 64 Years | 9 (28.1%) | 10 (31.2%) |
| 65 to 74 Years | 8 (100.0%) | 0 (0.0%) |
| 75 Years and over | 6 (100.0%) | 5 (83.3%) |
| Total | 32 (29.9%) | 52 (48.6%) |
Disability Status by Sex by Age in Whiteside
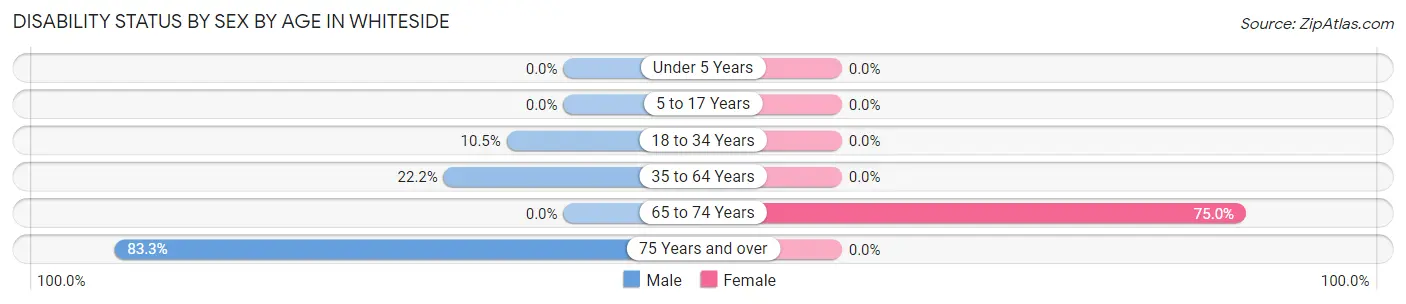
| Age Bracket | Male | Female |
| Under 5 Years | 0 (0.0%) | 0 (0.0%) |
| 5 to 17 Years | 0 (0.0%) | 0 (0.0%) |
| 18 to 34 Years | 2 (10.5%) | 0 (0.0%) |
| 35 to 64 Years | 6 (22.2%) | 0 (0.0%) |
| 65 to 74 Years | 0 (0.0%) | 3 (75.0%) |
| 75 Years and over | 5 (83.3%) | 0 (0.0%) |
Disability Class by Sex by Age in Whiteside
Disability Class: Hearing Difficulty
| Age Bracket | Male | Female |
| Under 5 Years | 0 (0.0%) | 0 (0.0%) |
| 5 to 17 Years | 0 (0.0%) | 0 (0.0%) |
| 18 to 34 Years | 0 (0.0%) | 0 (0.0%) |
| 35 to 64 Years | 0 (0.0%) | 0 (0.0%) |
| 65 to 74 Years | 0 (0.0%) | 0 (0.0%) |
| 75 Years and over | 0 (0.0%) | 0 (0.0%) |
Disability Class: Vision Difficulty
| Age Bracket | Male | Female |
| Under 5 Years | 0 (0.0%) | 0 (0.0%) |
| 5 to 17 Years | 0 (0.0%) | 0 (0.0%) |
| 18 to 34 Years | 0 (0.0%) | 0 (0.0%) |
| 35 to 64 Years | 2 (7.4%) | 0 (0.0%) |
| 65 to 74 Years | 0 (0.0%) | 0 (0.0%) |
| 75 Years and over | 0 (0.0%) | 0 (0.0%) |
Disability Class: Cognitive Difficulty
| Age Bracket | Male | Female |
| 5 to 17 Years | 0 (0.0%) | 0 (0.0%) |
| 18 to 34 Years | 2 (10.5%) | 0 (0.0%) |
| 35 to 64 Years | 2 (7.4%) | 0 (0.0%) |
| 65 to 74 Years | 0 (0.0%) | 0 (0.0%) |
| 75 Years and over | 0 (0.0%) | 0 (0.0%) |
Disability Class: Ambulatory Difficulty
| Age Bracket | Male | Female |
| 5 to 17 Years | 0 (0.0%) | 0 (0.0%) |
| 18 to 34 Years | 0 (0.0%) | 0 (0.0%) |
| 35 to 64 Years | 6 (22.2%) | 0 (0.0%) |
| 65 to 74 Years | 0 (0.0%) | 3 (75.0%) |
| 75 Years and over | 5 (83.3%) | 0 (0.0%) |
Disability Class: Self-Care Difficulty
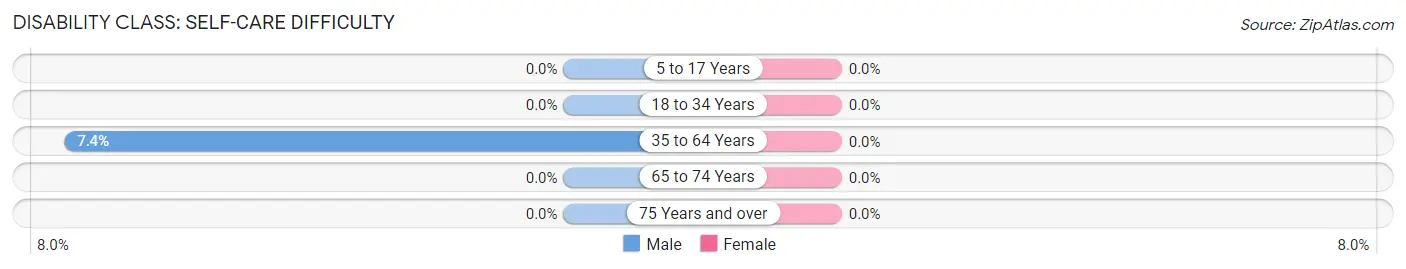
| Age Bracket | Male | Female |
| 5 to 17 Years | 0 (0.0%) | 0 (0.0%) |
| 18 to 34 Years | 0 (0.0%) | 0 (0.0%) |
| 35 to 64 Years | 2 (7.4%) | 0 (0.0%) |
| 65 to 74 Years | 0 (0.0%) | 0 (0.0%) |
| 75 Years and over | 0 (0.0%) | 0 (0.0%) |
Technology Access in Whiteside
Computing Device Access in Whiteside
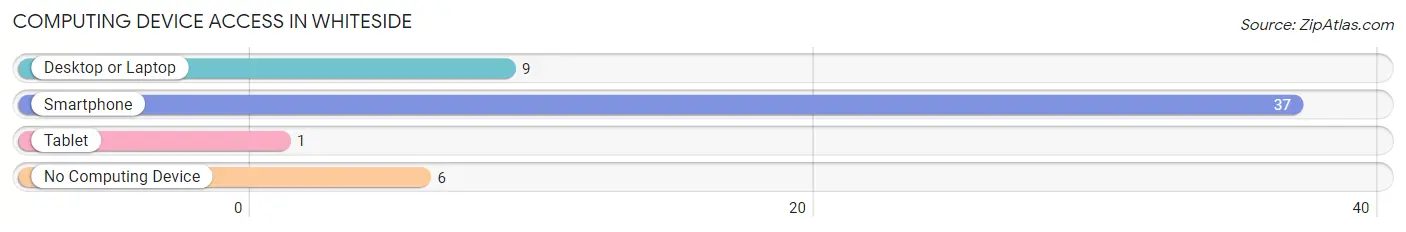
| Device Type | # Households | % Households |
| Desktop or Laptop | 9 | 20.4% |
| Smartphone | 37 | 84.1% |
| Tablet | 1 | 2.3% |
| No Computing Device | 6 | 13.6% |
| Total | 44 | 100.0% |
Internet Access in Whiteside
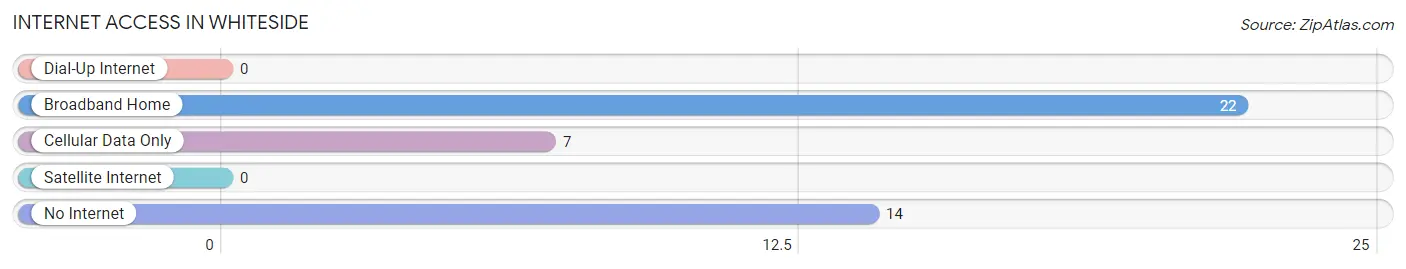
| Internet Type | # Households | % Households |
| Dial-Up Internet | 0 | 0.0% |
| Broadband Home | 22 | 50.0% |
| Cellular Data Only | 7 | 15.9% |
| Satellite Internet | 0 | 0.0% |
| No Internet | 14 | 31.8% |
| Total | 44 | 100.0% |
Whiteside Summary
Whiteside is a small unincorporated community located in the Ozark Mountains of southwestern Missouri. It is situated in Taney County, approximately 10 miles south of Branson and about 20 miles north of the Arkansas border. The community is named after the White family, who settled in the area in the late 1800s.
History
The first settlers in the area that would become Whiteside were the White family, who arrived in the late 1800s. The family built a log cabin and began farming the land. The area was sparsely populated until the early 1900s, when the White family began to sell off parcels of their land to other settlers. By the 1920s, the community had grown to include a general store, a post office, a school, and several churches.
In the 1950s, the area began to experience a population boom as people moved to the area to take advantage of the area’s natural beauty and recreational opportunities. The population of Whiteside peaked in the 1970s, when it had a population of around 500 people.
Geography
Whiteside is located in the Ozark Mountains of southwestern Missouri. It is situated in Taney County, approximately 10 miles south of Branson and about 20 miles north of the Arkansas border. The community is located in a hilly area, with elevations ranging from 1,000 to 1,500 feet above sea level. The area is heavily forested, with oak, hickory, and pine trees dominating the landscape.
The climate in Whiteside is humid subtropical, with hot, humid summers and mild winters. The average annual temperature is around 60 degrees Fahrenheit, with average highs in the summer reaching the mid-80s and average lows in the winter reaching the mid-30s. The area receives an average of 45 inches of precipitation per year, with most of it falling in the form of rain.
Economy
The economy of Whiteside is largely based on tourism and agriculture. The area is home to several small farms, which produce a variety of crops, including corn, soybeans, and hay. The area is also popular with tourists, who come to enjoy the area’s natural beauty and recreational opportunities.
The area is home to several small businesses, including a general store, a post office, a gas station, and a few restaurants. There are also several small bed and breakfast establishments in the area.
Demographics
As of the 2010 census, the population of Whiteside was 437 people. The racial makeup of the community was 97.3% White, 0.5% African American, 0.2% Native American, 0.2% Asian, and 1.8% from other races. The median household income was $35,000, and the median age was 44 years.
Whiteside is a small, rural community with a strong sense of community and a close-knit population. The area is known for its natural beauty and recreational opportunities, and it is a popular destination for tourists and outdoor enthusiasts.
Common Questions
What is Per Capita Income in Whiteside?
Per Capita income in Whiteside is $32,115.
What is the Median Family Income in Whiteside?
Median Family Income in Whiteside is $88,125.
What is the Median Household income in Whiteside?
Median Household Income in Whiteside is $93,333.
What is Income or Wage Gap in Whiteside?
Income or Wage Gap in Whiteside is 39.6%.
Women in Whiteside earn 60.4 cents for every dollar earned by a man.
What is Inequality or Gini Index in Whiteside?
Inequality or Gini Index in Whiteside is 0.32.
What is the Total Population of Whiteside?
Total Population of Whiteside is 107.
What is the Total Male Population of Whiteside?
Total Male Population of Whiteside is 76.
What is the Total Female Population of Whiteside?
Total Female Population of Whiteside is 31.
What is the Ratio of Males per 100 Females in Whiteside?
There are 245.16 Males per 100 Females in Whiteside.
What is the Ratio of Females per 100 Males in Whiteside?
There are 40.79 Females per 100 Males in Whiteside.
What is the Median Population Age in Whiteside?
Median Population Age in Whiteside is 43.5 Years.
What is the Average Family Size in Whiteside
Average Family Size in Whiteside is 3.0 People.
What is the Average Household Size in Whiteside
Average Household Size in Whiteside is 2.4 People.
How Large is the Labor Force in Whiteside?
There are 58 People in the Labor Forcein in Whiteside.
What is the Percentage of People in the Labor Force in Whiteside?
66.7% of People are in the Labor Force in Whiteside.
What is the Unemployment Rate in Whiteside?
Unemployment Rate in Whiteside is 6.9%.