West Sullivan, MO Map & Demographics
West Sullivan Map
West Sullivan Overview
$16,915
PER CAPITA INCOME
$45,833
AVG FAMILY INCOME
$38,750
AVG HOUSEHOLD INCOME
48.9%
WAGE / INCOME GAP [ % ]
51.1¢/ $1
WAGE / INCOME GAP [ $ ]
0.34
INEQUALITY / GINI INDEX
260
TOTAL POPULATION
131
MALE POPULATION
129
FEMALE POPULATION
101.55
MALES / 100 FEMALES
98.47
FEMALES / 100 MALES
26.1
MEDIAN AGE
2.5
AVG FAMILY SIZE
2.5
AVG HOUSEHOLD SIZE
112
LABOR FORCE [ PEOPLE ]
56.9%
PERCENT IN LABOR FORCE
13.4%
UNEMPLOYMENT RATE
Income in West Sullivan
Income Overview in West Sullivan
Per Capita Income in West Sullivan is $16,915, while median incomes of families and households are $45,833 and $38,750 respectively.
| Characteristic | Number | Measure |
| Per Capita Income | 260 | $16,915 |
| Median Family Income | 74 | $45,833 |
| Mean Family Income | 74 | $47,701 |
| Median Household Income | 104 | $38,750 |
| Mean Household Income | 104 | $45,451 |
| Income Deficit | 74 | $0 |
| Wage / Income Gap (%) | 260 | 48.94% |
| Wage / Income Gap ($) | 260 | 51.06¢ per $1 |
| Gini / Inequality Index | 260 | 0.34 |
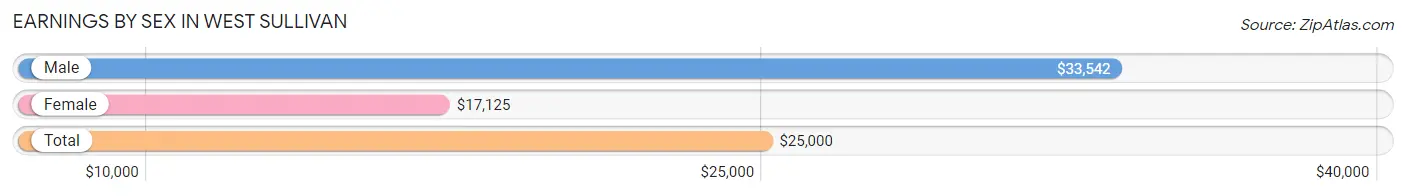
Earnings by Sex in West Sullivan
Average Earnings in West Sullivan are $25,000, $33,542 for men and $17,125 for women, a difference of 48.9%.
| Sex | Number | Average Earnings |
| Male | 67 (54.9%) | $33,542 |
| Female | 55 (45.1%) | $17,125 |
| Total | 122 (100.0%) | $25,000 |
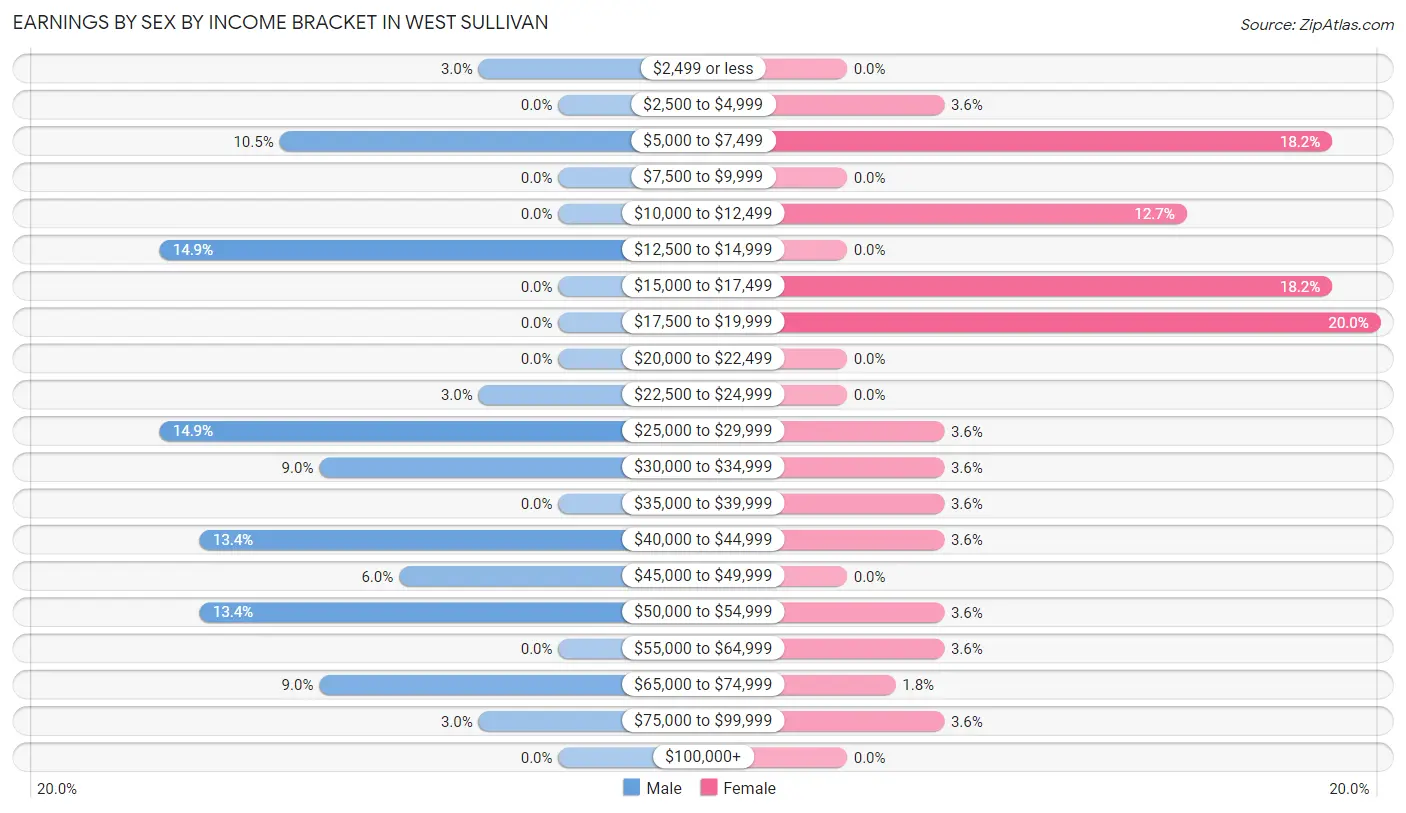
Earnings by Sex by Income Bracket in West Sullivan
The most common earnings brackets in West Sullivan are $12,500 to $14,999 for men (10 | 14.9%) and $17,500 to $19,999 for women (11 | 20.0%).
| Income | Male | Female |
| $2,499 or less | 2 (3.0%) | 0 (0.0%) |
| $2,500 to $4,999 | 0 (0.0%) | 2 (3.6%) |
| $5,000 to $7,499 | 7 (10.4%) | 10 (18.2%) |
| $7,500 to $9,999 | 0 (0.0%) | 0 (0.0%) |
| $10,000 to $12,499 | 0 (0.0%) | 7 (12.7%) |
| $12,500 to $14,999 | 10 (14.9%) | 0 (0.0%) |
| $15,000 to $17,499 | 0 (0.0%) | 10 (18.2%) |
| $17,500 to $19,999 | 0 (0.0%) | 11 (20.0%) |
| $20,000 to $22,499 | 0 (0.0%) | 0 (0.0%) |
| $22,500 to $24,999 | 2 (3.0%) | 0 (0.0%) |
| $25,000 to $29,999 | 10 (14.9%) | 2 (3.6%) |
| $30,000 to $34,999 | 6 (9.0%) | 2 (3.6%) |
| $35,000 to $39,999 | 0 (0.0%) | 2 (3.6%) |
| $40,000 to $44,999 | 9 (13.4%) | 2 (3.6%) |
| $45,000 to $49,999 | 4 (6.0%) | 0 (0.0%) |
| $50,000 to $54,999 | 9 (13.4%) | 2 (3.6%) |
| $55,000 to $64,999 | 0 (0.0%) | 2 (3.6%) |
| $65,000 to $74,999 | 6 (9.0%) | 1 (1.8%) |
| $75,000 to $99,999 | 2 (3.0%) | 2 (3.6%) |
| $100,000+ | 0 (0.0%) | 0 (0.0%) |
| Total | 67 (100.0%) | 55 (100.0%) |
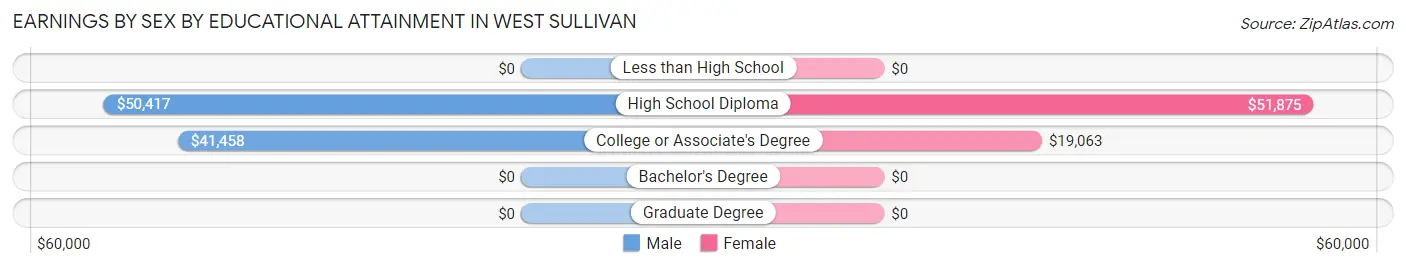
Earnings by Sex by Educational Attainment in West Sullivan
Average earnings in West Sullivan are $45,313 for men and $19,844 for women, a difference of 56.2%. Men with an educational attainment of high school diploma enjoy the highest average annual earnings of $50,417, while those with college or associate's degree education earn the least with $41,458. Women with an educational attainment of high school diploma earn the most with the average annual earnings of $51,875, while those with college or associate's degree education have the smallest earnings of $19,063.
| Educational Attainment | Male Income | Female Income |
| Less than High School | - | - |
| High School Diploma | $50,417 | $51,875 |
| College or Associate's Degree | $41,458 | $19,063 |
| Bachelor's Degree | - | - |
| Graduate Degree | - | - |
| Total | $45,313 | $19,844 |
Family Income in West Sullivan
Family Income Brackets in West Sullivan
According to the West Sullivan family income data, there are 26 families falling into the $50,000 to $74,999 income range, which is the most common income bracket and makes up 35.1% of all families.
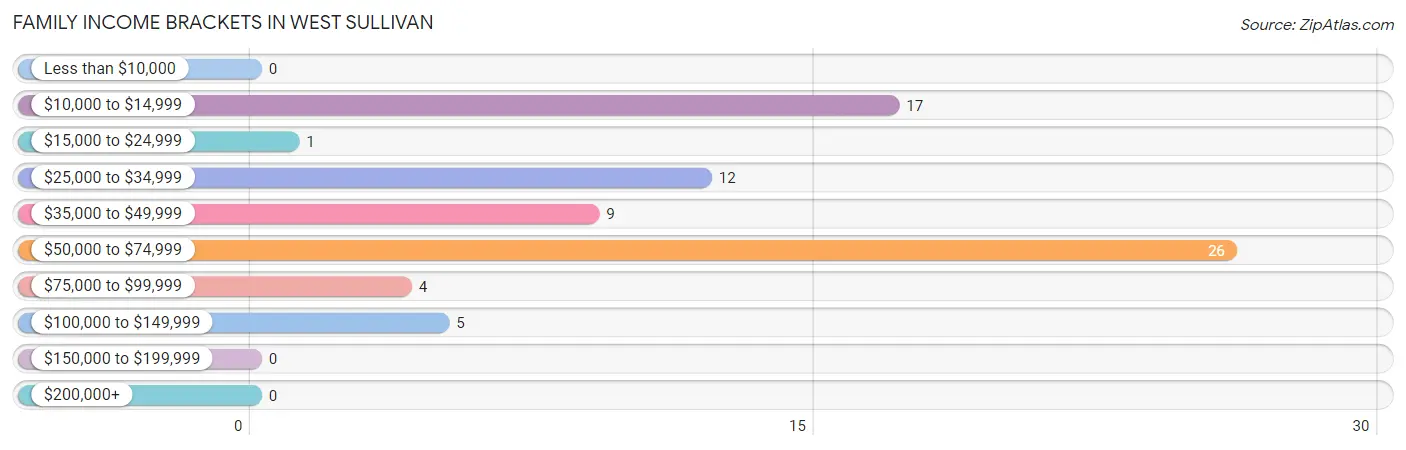
| Income Bracket | # Families | % Families |
| Less than $10,000 | 0 | 0.0% |
| $10,000 to $14,999 | 17 | 23.0% |
| $15,000 to $24,999 | 1 | 1.4% |
| $25,000 to $34,999 | 12 | 16.2% |
| $35,000 to $49,999 | 9 | 12.2% |
| $50,000 to $74,999 | 26 | 35.1% |
| $75,000 to $99,999 | 4 | 5.4% |
| $100,000 to $149,999 | 5 | 6.8% |
| $150,000 to $199,999 | 0 | 0.0% |
| $200,000+ | 0 | 0.0% |
Family Income by Famaliy Size in West Sullivan
2-person families (47 | 63.5%) account for the highest median family income in West Sullivan with $50,096 per family, while 2-person families (47 | 63.5%) have the highest median income of $25,048 per family member.
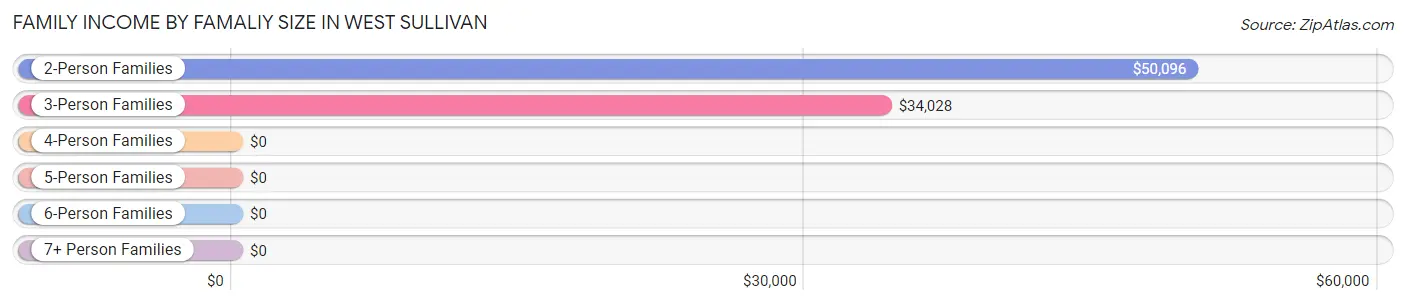
| Income Bracket | # Families | Median Income |
| 2-Person Families | 47 (63.5%) | $50,096 |
| 3-Person Families | 15 (20.3%) | $34,028 |
| 4-Person Families | 9 (12.2%) | $0 |
| 5-Person Families | 3 (4.1%) | $0 |
| 6-Person Families | 0 (0.0%) | $0 |
| 7+ Person Families | 0 (0.0%) | $0 |
| Total | 74 (100.0%) | $45,833 |
Family Income by Number of Earners in West Sullivan
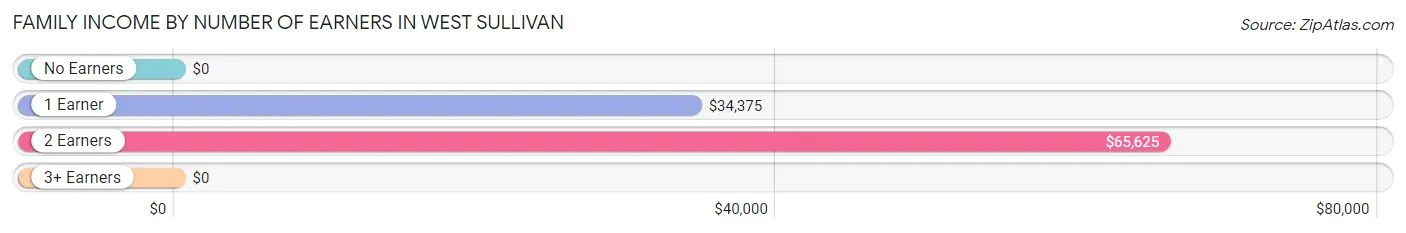
| Number of Earners | # Families | Median Income |
| No Earners | 10 (13.5%) | $0 |
| 1 Earner | 42 (56.8%) | $34,375 |
| 2 Earners | 22 (29.7%) | $65,625 |
| 3+ Earners | 0 (0.0%) | $0 |
| Total | 74 (100.0%) | $45,833 |
Household Income in West Sullivan
Household Income Brackets in West Sullivan
With 27 households falling in the category, the $50,000 to $74,999 income range is the most frequent in West Sullivan, accounting for 26.0% of all households.
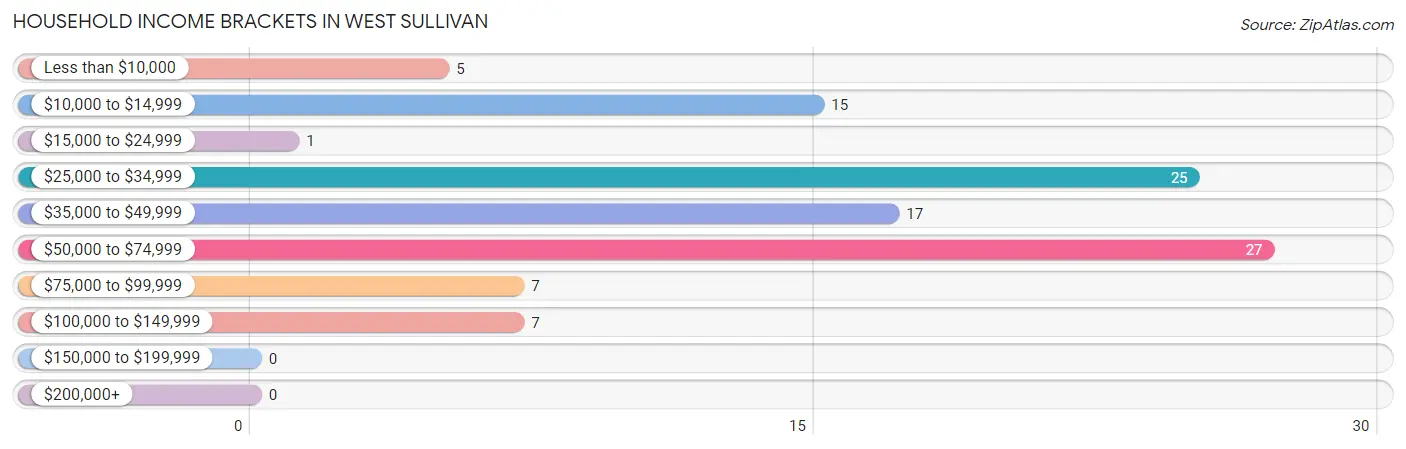
| Income Bracket | # Households | % Households |
| Less than $10,000 | 5 | 4.8% |
| $10,000 to $14,999 | 15 | 14.4% |
| $15,000 to $24,999 | 1 | 1.0% |
| $25,000 to $34,999 | 25 | 24.0% |
| $35,000 to $49,999 | 17 | 16.3% |
| $50,000 to $74,999 | 27 | 26.0% |
| $75,000 to $99,999 | 7 | 6.7% |
| $100,000 to $149,999 | 7 | 6.7% |
| $150,000 to $199,999 | 0 | 0.0% |
| $200,000+ | 0 | 0.0% |
Household Income by Householder Age in West Sullivan
The median household income in West Sullivan is $38,750, with the highest median household income of $90,625 found in the 45 to 64 years age bracket for the primary householder. A total of 17 households (16.4%) fall into this category. Meanwhile, the 65+ years age bracket for the primary householder has the lowest median household income of $0, with 30 households (28.8%) in this group.
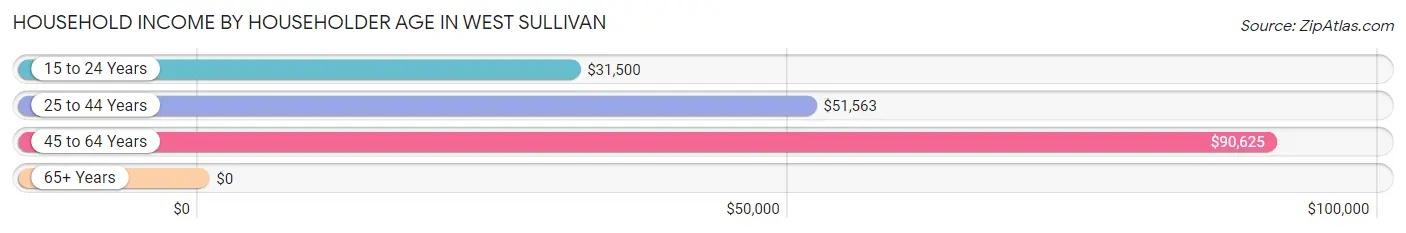
| Income Bracket | # Households | Median Income |
| 15 to 24 Years | 26 (25.0%) | $31,500 |
| 25 to 44 Years | 31 (29.8%) | $51,563 |
| 45 to 64 Years | 17 (16.4%) | $90,625 |
| 65+ Years | 30 (28.8%) | $0 |
| Total | 104 (100.0%) | $38,750 |
Poverty in West Sullivan
Income Below Poverty by Sex and Age in West Sullivan
With 25.8% poverty level for males and 25.2% for females among the residents of West Sullivan, 75 year old and over males and under 5 year old females are the most vulnerable to poverty, with 10 males (71.4%) and 11 females (52.4%) in their respective age groups living below the poverty level.
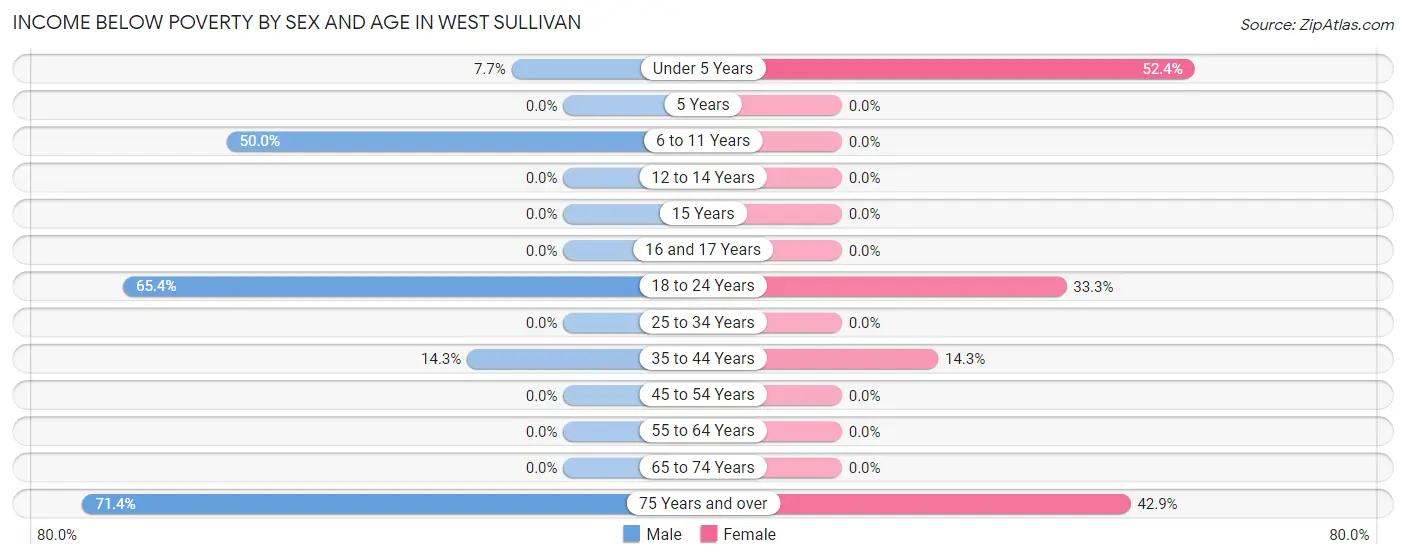
| Age Bracket | Male | Female |
| Under 5 Years | 1 (7.7%) | 11 (52.4%) |
| 5 Years | 0 (0.0%) | 0 (0.0%) |
| 6 to 11 Years | 2 (50.0%) | 0 (0.0%) |
| 12 to 14 Years | 0 (0.0%) | 0 (0.0%) |
| 15 Years | 0 (0.0%) | 0 (0.0%) |
| 16 and 17 Years | 0 (0.0%) | 0 (0.0%) |
| 18 to 24 Years | 17 (65.4%) | 12 (33.3%) |
| 25 to 34 Years | 0 (0.0%) | 0 (0.0%) |
| 35 to 44 Years | 2 (14.3%) | 2 (14.3%) |
| 45 to 54 Years | 0 (0.0%) | 0 (0.0%) |
| 55 to 64 Years | 0 (0.0%) | 0 (0.0%) |
| 65 to 74 Years | 0 (0.0%) | 0 (0.0%) |
| 75 Years and over | 10 (71.4%) | 6 (42.9%) |
| Total | 32 (25.8%) | 31 (25.2%) |
Income Above Poverty by Sex and Age in West Sullivan
According to the poverty statistics in West Sullivan, males aged 5 years and females aged 16 and 17 years are the age groups that are most secure financially, with 100.0% of males and 100.0% of females in these age groups living above the poverty line.
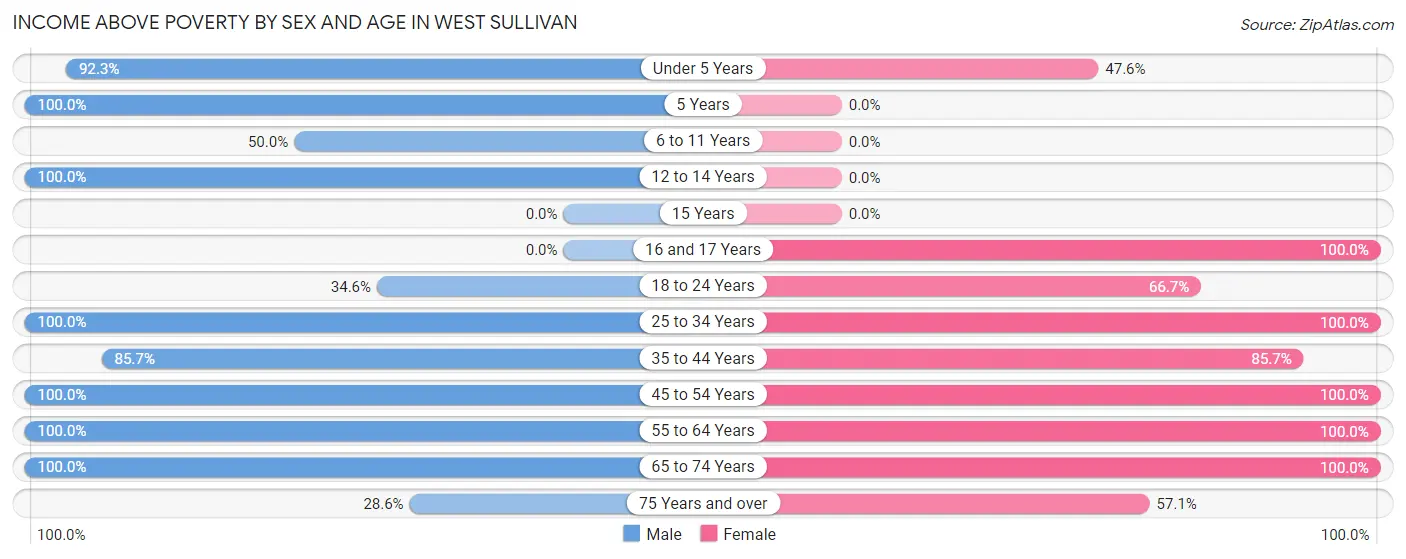
| Age Bracket | Male | Female |
| Under 5 Years | 12 (92.3%) | 10 (47.6%) |
| 5 Years | 4 (100.0%) | 0 (0.0%) |
| 6 to 11 Years | 2 (50.0%) | 0 (0.0%) |
| 12 to 14 Years | 8 (100.0%) | 0 (0.0%) |
| 15 Years | 0 (0.0%) | 0 (0.0%) |
| 16 and 17 Years | 0 (0.0%) | 3 (100.0%) |
| 18 to 24 Years | 9 (34.6%) | 24 (66.7%) |
| 25 to 34 Years | 12 (100.0%) | 9 (100.0%) |
| 35 to 44 Years | 12 (85.7%) | 12 (85.7%) |
| 45 to 54 Years | 14 (100.0%) | 7 (100.0%) |
| 55 to 64 Years | 5 (100.0%) | 5 (100.0%) |
| 65 to 74 Years | 10 (100.0%) | 14 (100.0%) |
| 75 Years and over | 4 (28.6%) | 8 (57.1%) |
| Total | 92 (74.2%) | 92 (74.8%) |
Income Below Poverty Among Married-Couple Families in West Sullivan
The poverty statistics for married-couple families in West Sullivan show that 9.3% or 5 of the total 54 families live below the poverty line. Families with no children have the highest poverty rate of 13.5%, comprising of 5 families. On the other hand, families with 1 or 2 children have the lowest poverty rate of 0.0%, which includes 0 families.
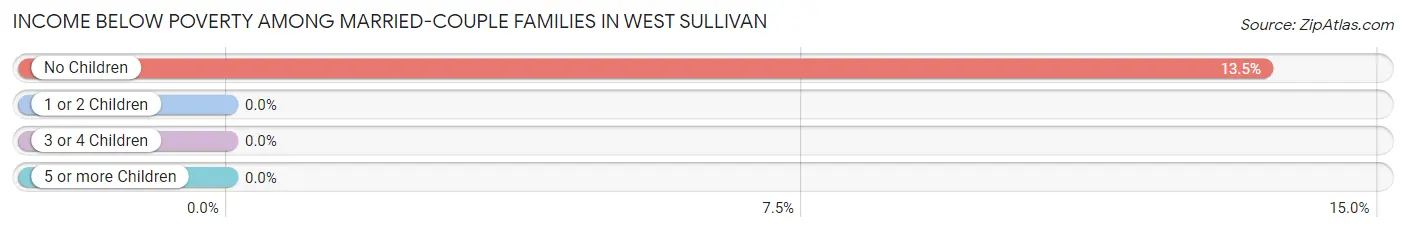
| Children | Above Poverty | Below Poverty |
| No Children | 32 (86.5%) | 5 (13.5%) |
| 1 or 2 Children | 14 (100.0%) | 0 (0.0%) |
| 3 or 4 Children | 3 (100.0%) | 0 (0.0%) |
| 5 or more Children | 0 (0.0%) | 0 (0.0%) |
| Total | 49 (90.7%) | 5 (9.3%) |
Income Below Poverty Among Single-Parent Households in West Sullivan
According to the poverty data in West Sullivan, 62.5% or 10 single-father households and 50.0% or 2 single-mother households are living below the poverty line. Among single-father households, those with 1 or 2 children have the highest poverty rate, with 10 households (62.5%) experiencing poverty. Likewise, among single-mother households, those with 1 or 2 children have the highest poverty rate, with 2 households (100.0%) falling below the poverty line.
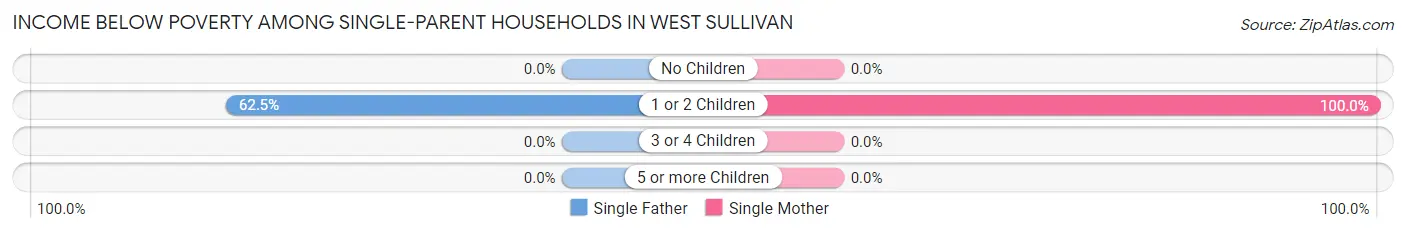
| Children | Single Father | Single Mother |
| No Children | 0 (0.0%) | 0 (0.0%) |
| 1 or 2 Children | 10 (62.5%) | 2 (100.0%) |
| 3 or 4 Children | 0 (0.0%) | 0 (0.0%) |
| 5 or more Children | 0 (0.0%) | 0 (0.0%) |
| Total | 10 (62.5%) | 2 (50.0%) |
Income Below Poverty Among Married-Couple vs Single-Parent Households in West Sullivan
The poverty data for West Sullivan shows that 5 of the married-couple family households (9.3%) and 12 of the single-parent households (60.0%) are living below the poverty level. Within the married-couple family households, those with no children have the highest poverty rate, with 5 households (13.5%) falling below the poverty line. Among the single-parent households, those with 1 or 2 children have the highest poverty rate, with 12 household (66.7%) living below poverty.
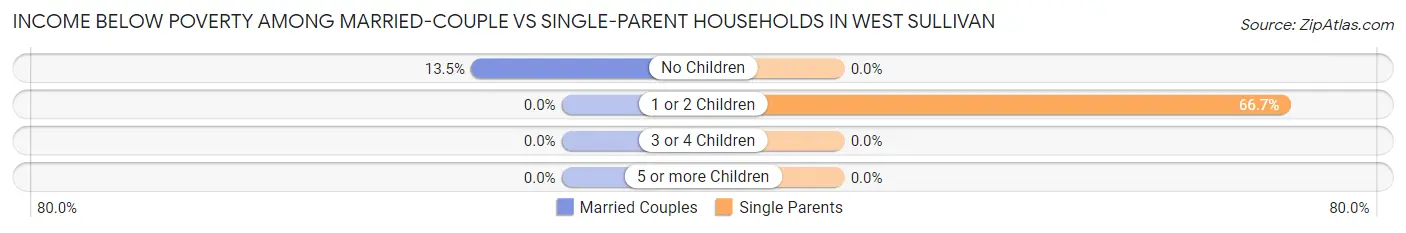
| Children | Married-Couple Families | Single-Parent Households |
| No Children | 5 (13.5%) | 0 (0.0%) |
| 1 or 2 Children | 0 (0.0%) | 12 (66.7%) |
| 3 or 4 Children | 0 (0.0%) | 0 (0.0%) |
| 5 or more Children | 0 (0.0%) | 0 (0.0%) |
| Total | 5 (9.3%) | 12 (60.0%) |
Race in West Sullivan
The most populous races in West Sullivan are White / Caucasian (237 | 91.1%), Two or more Races (23 | 8.8%), and Hispanic or Latino (20 | 7.7%).
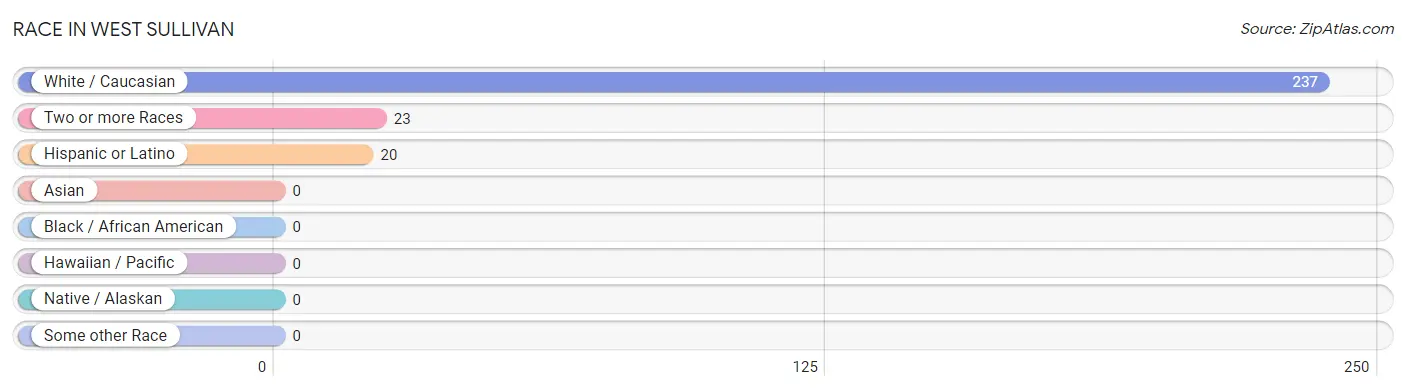
| Race | # Population | % Population |
| Asian | 0 | 0.0% |
| Black / African American | 0 | 0.0% |
| Hawaiian / Pacific | 0 | 0.0% |
| Hispanic or Latino | 20 | 7.7% |
| Native / Alaskan | 0 | 0.0% |
| White / Caucasian | 237 | 91.1% |
| Two or more Races | 23 | 8.8% |
| Some other Race | 0 | 0.0% |
| Total | 260 | 100.0% |
Ancestry in West Sullivan
The most populous ancestries reported in West Sullivan are English (39 | 15.0%), Irish (34 | 13.1%), American (28 | 10.8%), German (26 | 10.0%), and Cuban (20 | 7.7%), together accounting for 56.5% of all West Sullivan residents.
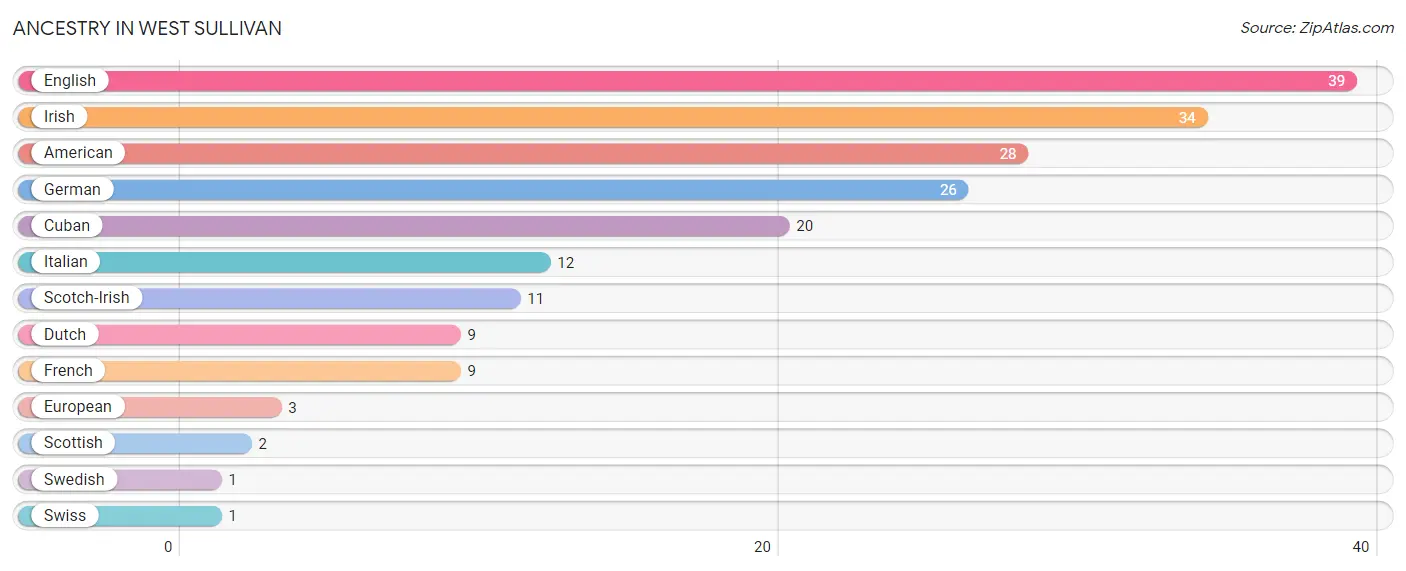
| Ancestry | # Population | % Population |
| American | 28 | 10.8% |
| Cuban | 20 | 7.7% |
| Dutch | 9 | 3.5% |
| English | 39 | 15.0% |
| European | 3 | 1.1% |
| French | 9 | 3.5% |
| German | 26 | 10.0% |
| Irish | 34 | 13.1% |
| Italian | 12 | 4.6% |
| Scotch-Irish | 11 | 4.2% |
| Scottish | 2 | 0.8% |
| Swedish | 1 | 0.4% |
| Swiss | 1 | 0.4% | View All 13 Rows |
Immigrants in West Sullivan

| Immigration Origin | # Population | % Population | View All 0 Rows |
Sex and Age in West Sullivan
Sex and Age in West Sullivan
The most populous age groups in West Sullivan are 20 to 24 Years (26 | 19.9%) for men and 20 to 24 Years (32 | 24.8%) for women.
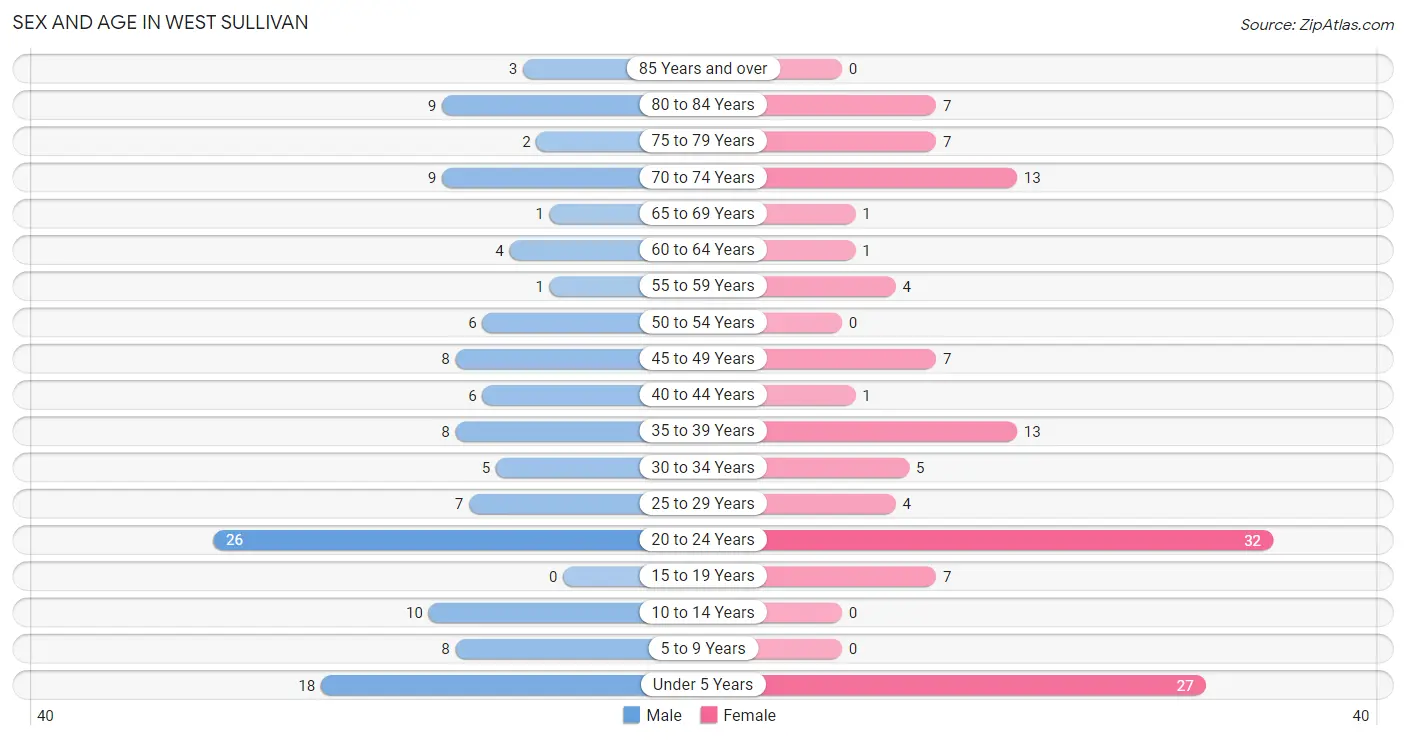
| Age Bracket | Male | Female |
| Under 5 Years | 18 (13.7%) | 27 (20.9%) |
| 5 to 9 Years | 8 (6.1%) | 0 (0.0%) |
| 10 to 14 Years | 10 (7.6%) | 0 (0.0%) |
| 15 to 19 Years | 0 (0.0%) | 7 (5.4%) |
| 20 to 24 Years | 26 (19.9%) | 32 (24.8%) |
| 25 to 29 Years | 7 (5.3%) | 4 (3.1%) |
| 30 to 34 Years | 5 (3.8%) | 5 (3.9%) |
| 35 to 39 Years | 8 (6.1%) | 13 (10.1%) |
| 40 to 44 Years | 6 (4.6%) | 1 (0.8%) |
| 45 to 49 Years | 8 (6.1%) | 7 (5.4%) |
| 50 to 54 Years | 6 (4.6%) | 0 (0.0%) |
| 55 to 59 Years | 1 (0.8%) | 4 (3.1%) |
| 60 to 64 Years | 4 (3.0%) | 1 (0.8%) |
| 65 to 69 Years | 1 (0.8%) | 1 (0.8%) |
| 70 to 74 Years | 9 (6.9%) | 13 (10.1%) |
| 75 to 79 Years | 2 (1.5%) | 7 (5.4%) |
| 80 to 84 Years | 9 (6.9%) | 7 (5.4%) |
| 85 Years and over | 3 (2.3%) | 0 (0.0%) |
| Total | 131 (100.0%) | 129 (100.0%) |
Families and Households in West Sullivan
Median Family Size in West Sullivan
The median family size in West Sullivan is 2.53 persons per family, with single female/mother families (4 | 5.4%) accounting for the largest median family size of 3.75 persons per family. On the other hand, single male/father families (16 | 21.6%) represent the smallest median family size with 2.38 persons per family.
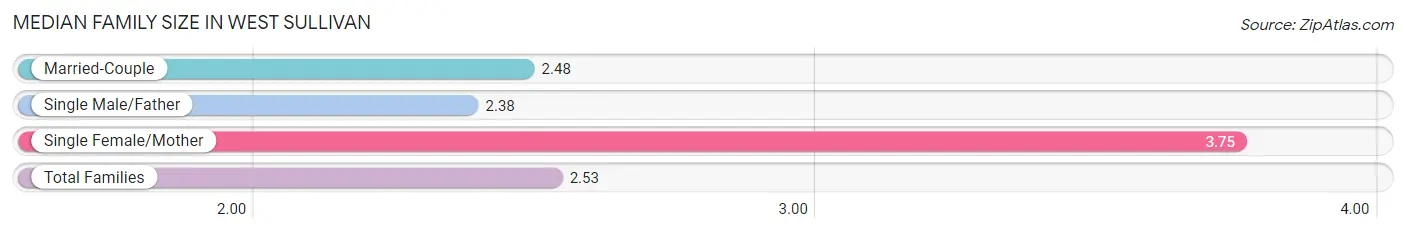
| Family Type | # Families | Family Size |
| Married-Couple | 54 (73.0%) | 2.48 |
| Single Male/Father | 16 (21.6%) | 2.38 |
| Single Female/Mother | 4 (5.4%) | 3.75 |
| Total Families | 74 (100.0%) | 2.53 |
Median Household Size in West Sullivan
The median household size in West Sullivan is 2.50 persons per household, with single female/mother households (4 | 3.8%) accounting for the largest median household size of 5 persons per household. non-family households (30 | 28.8%) represent the smallest median household size with 1.37 persons per household.
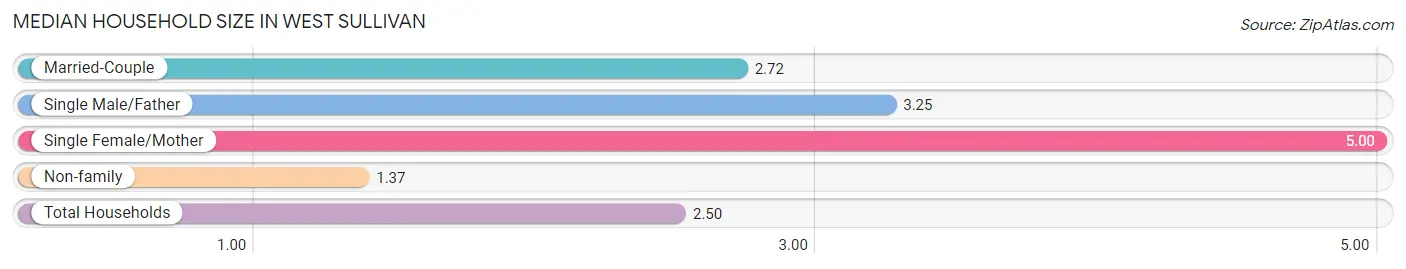
| Household Type | # Households | Household Size |
| Married-Couple | 54 (51.9%) | 2.72 |
| Single Male/Father | 16 (15.4%) | 3.25 |
| Single Female/Mother | 4 (3.8%) | 5.00 |
| Non-family | 30 (28.8%) | 1.37 |
| Total Households | 104 (100.0%) | 2.50 |
Household Size by Marriage Status in West Sullivan
Out of a total of 104 households in West Sullivan, 74 (71.2%) are family households, while 30 (28.8%) are nonfamily households. The most numerous type of family households are 2-person households, comprising 30, and the most common type of nonfamily households are 1-person households, comprising 20.
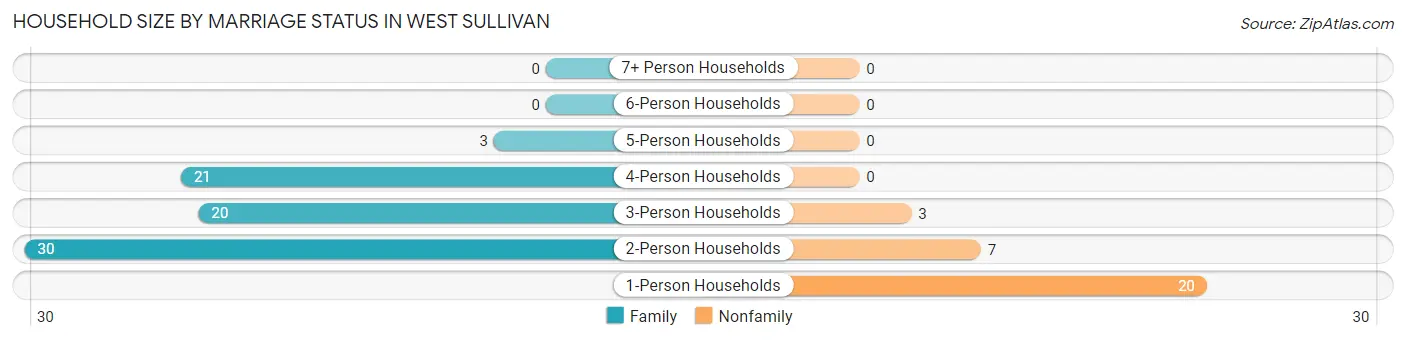
| Household Size | Family Households | Nonfamily Households |
| 1-Person Households | - | 20 (19.2%) |
| 2-Person Households | 30 (28.8%) | 7 (6.7%) |
| 3-Person Households | 20 (19.2%) | 3 (2.9%) |
| 4-Person Households | 21 (20.2%) | 0 (0.0%) |
| 5-Person Households | 3 (2.9%) | 0 (0.0%) |
| 6-Person Households | 0 (0.0%) | 0 (0.0%) |
| 7+ Person Households | 0 (0.0%) | 0 (0.0%) |
| Total | 74 (71.2%) | 30 (28.8%) |
Female Fertility in West Sullivan
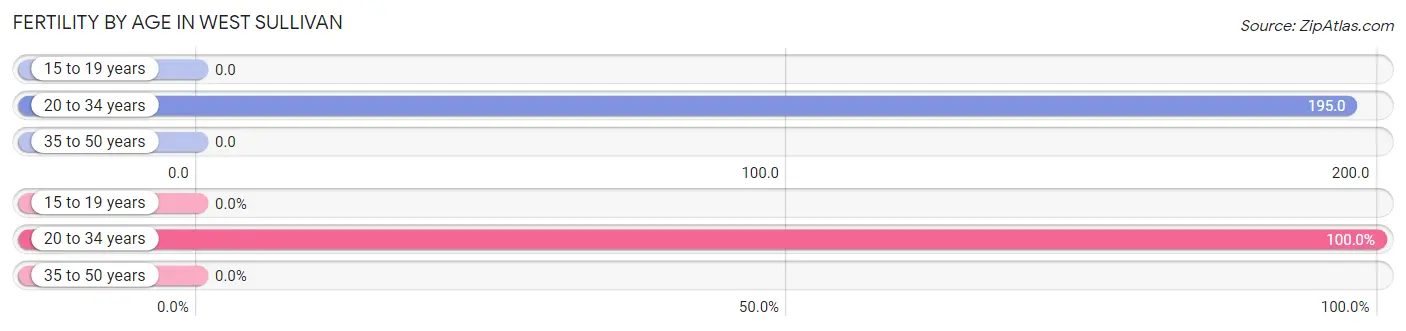
Fertility by Age in West Sullivan
Average fertility rate in West Sullivan is 116.0 births per 1,000 women. Women in the age bracket of 20 to 34 years have the highest fertility rate with 195.0 births per 1,000 women. Women in the age bracket of 20 to 34 years acount for 100.0% of all women with births.
| Age Bracket | Women with Births | Births / 1,000 Women |
| 15 to 19 years | 0 (0.0%) | 0.0 |
| 20 to 34 years | 8 (100.0%) | 195.0 |
| 35 to 50 years | 0 (0.0%) | 0.0 |
| Total | 8 (100.0%) | 116.0 |
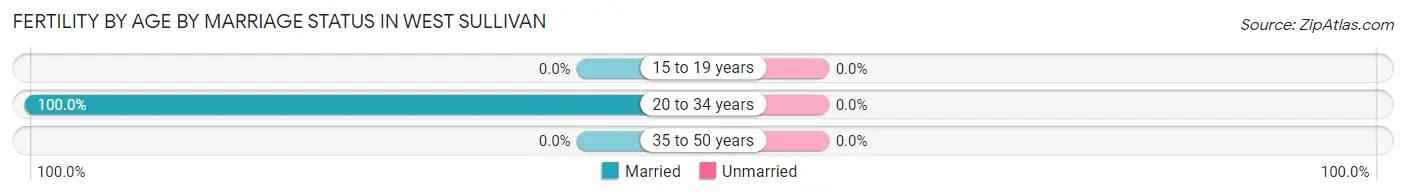
Fertility by Age by Marriage Status in West Sullivan
| Age Bracket | Married | Unmarried |
| 15 to 19 years | 0 (0.0%) | 0 (0.0%) |
| 20 to 34 years | 8 (100.0%) | 0 (0.0%) |
| 35 to 50 years | 0 (0.0%) | 0 (0.0%) |
| Total | 8 (100.0%) | 0 (0.0%) |
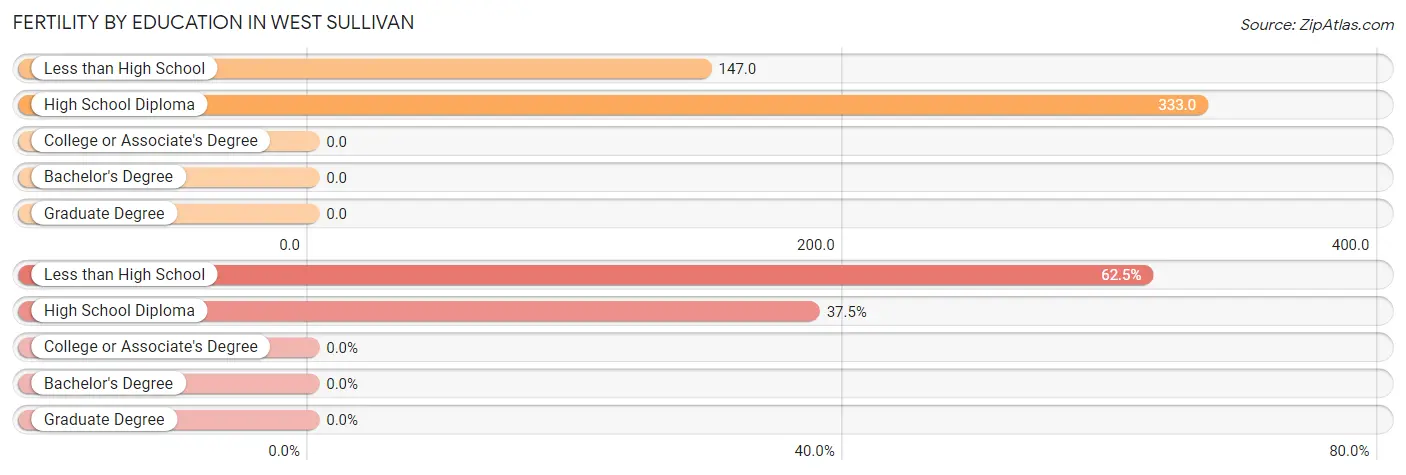
Fertility by Education in West Sullivan
| Educational Attainment | Women with Births | Births / 1,000 Women |
| Less than High School | 5 (62.5%) | 147.0 |
| High School Diploma | 3 (37.5%) | 333.0 |
| College or Associate's Degree | 0 (0.0%) | 0.0 |
| Bachelor's Degree | 0 (0.0%) | 0.0 |
| Graduate Degree | 0 (0.0%) | 0.0 |
| Total | 8 (100.0%) | 116.0 |
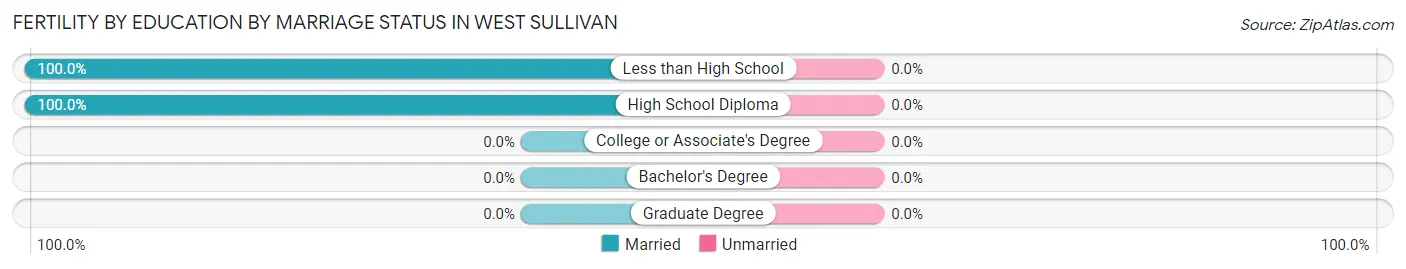
Fertility by Education by Marriage Status in West Sullivan
| Educational Attainment | Married | Unmarried |
| Less than High School | 5 (100.0%) | 0 (0.0%) |
| High School Diploma | 3 (100.0%) | 0 (0.0%) |
| College or Associate's Degree | 0 (0.0%) | 0 (0.0%) |
| Bachelor's Degree | 0 (0.0%) | 0 (0.0%) |
| Graduate Degree | 0 (0.0%) | 0 (0.0%) |
| Total | 8 (100.0%) | 0 (0.0%) |
Employment Characteristics in West Sullivan
Employment by Class of Employer in West Sullivan
Among the 97 employed individuals in West Sullivan, private company employees (62 | 63.9%), local government employees (15 | 15.5%), and self-employed (not incorporated) (10 | 10.3%) make up the most common classes of employment.
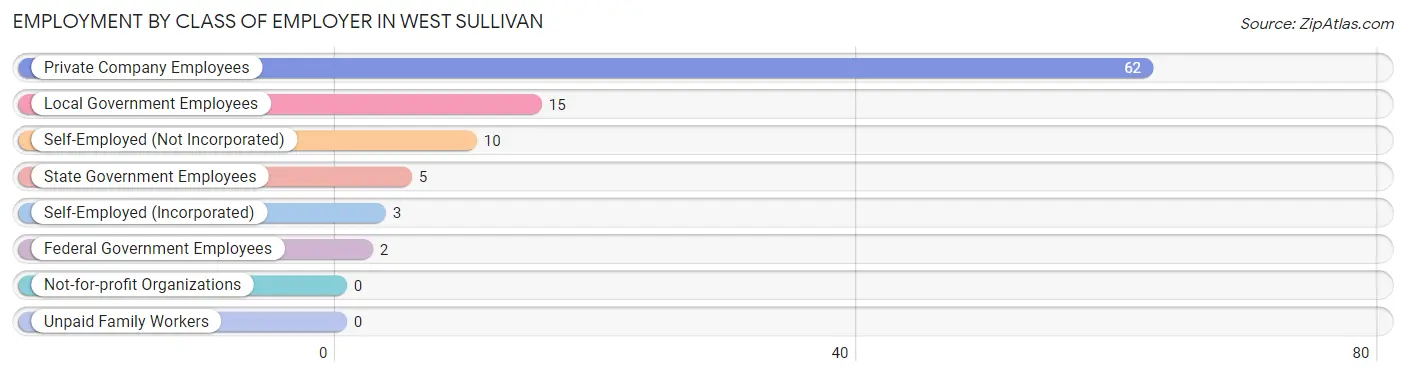
| Employer Class | # Employees | % Employees |
| Private Company Employees | 62 | 63.9% |
| Self-Employed (Incorporated) | 3 | 3.1% |
| Self-Employed (Not Incorporated) | 10 | 10.3% |
| Not-for-profit Organizations | 0 | 0.0% |
| Local Government Employees | 15 | 15.5% |
| State Government Employees | 5 | 5.1% |
| Federal Government Employees | 2 | 2.1% |
| Unpaid Family Workers | 0 | 0.0% |
| Total | 97 | 100.0% |
Employment Status by Age in West Sullivan
According to the labor force statistics for West Sullivan, out of the total population over 16 years of age (197), 56.9% or 112 individuals are in the labor force, with 13.4% or 15 of them unemployed. The age group with the highest labor force participation rate is 25 to 29 years, with 100.0% or 11 individuals in the labor force. Within the labor force, the 20 to 24 years age range has the highest percentage of unemployed individuals, with 25.5% or 12 of them being unemployed.
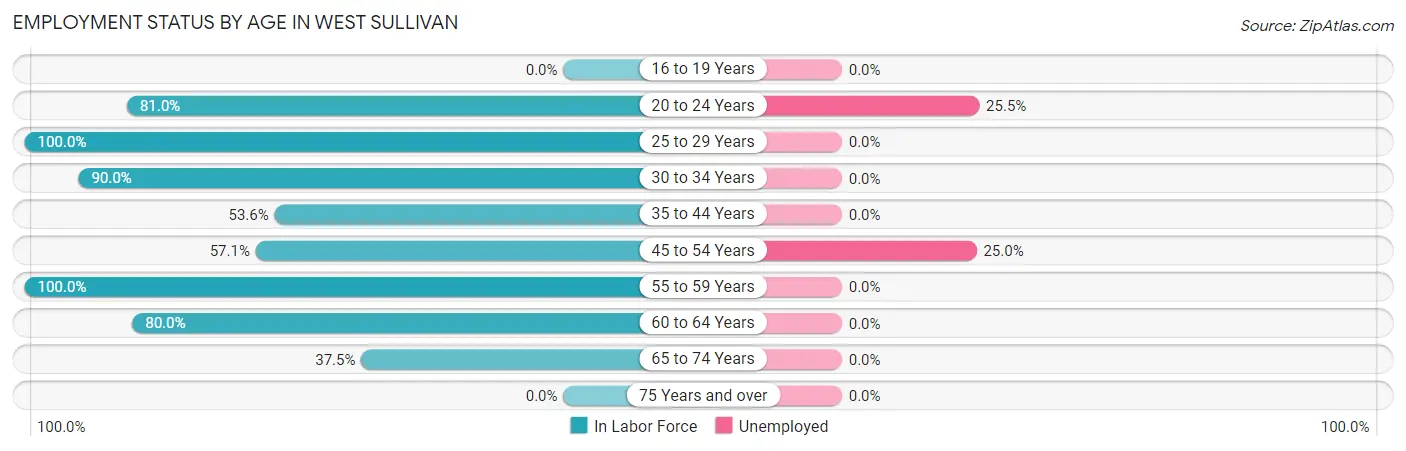
| Age Bracket | In Labor Force | Unemployed |
| 16 to 19 Years | 0 (0.0%) | 0 (0.0%) |
| 20 to 24 Years | 47 (81.0%) | 12 (25.5%) |
| 25 to 29 Years | 11 (100.0%) | 0 (0.0%) |
| 30 to 34 Years | 9 (90.0%) | 0 (0.0%) |
| 35 to 44 Years | 15 (53.6%) | 0 (0.0%) |
| 45 to 54 Years | 12 (57.1%) | 3 (25.0%) |
| 55 to 59 Years | 5 (100.0%) | 0 (0.0%) |
| 60 to 64 Years | 4 (80.0%) | 0 (0.0%) |
| 65 to 74 Years | 9 (37.5%) | 0 (0.0%) |
| 75 Years and over | 0 (0.0%) | 0 (0.0%) |
| Total | 112 (56.9%) | 15 (13.4%) |
Employment Status by Educational Attainment in West Sullivan
According to labor force statistics for West Sullivan, 70.0% of individuals (56) out of the total population between 25 and 64 years of age (80) are in the labor force, with 5.4% or 3 of them being unemployed. The group with the highest labor force participation rate are those with the educational attainment of bachelor's degree or higher, with 100.0% or 2 individuals in the labor force. Within the labor force, individuals with college / associate degree education have the highest percentage of unemployment, with 7.9% or 3 of them being unemployed.
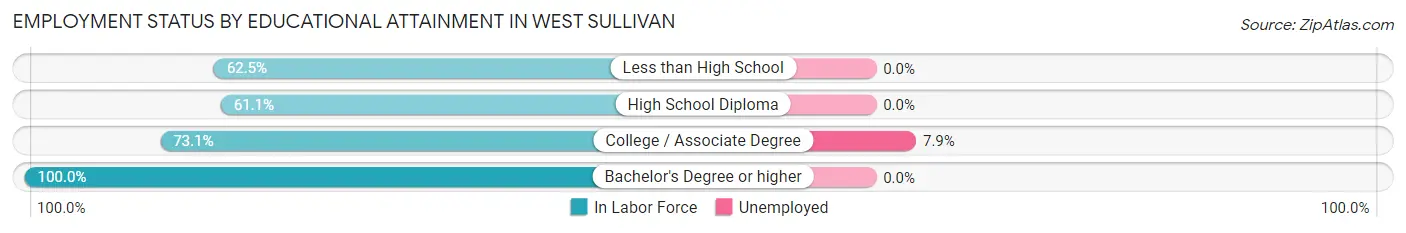
| Educational Attainment | In Labor Force | Unemployed |
| Less than High School | 5 (62.5%) | 0 (0.0%) |
| High School Diploma | 11 (61.1%) | 0 (0.0%) |
| College / Associate Degree | 38 (73.1%) | 4 (7.9%) |
| Bachelor's Degree or higher | 2 (100.0%) | 0 (0.0%) |
| Total | 56 (70.0%) | 4 (5.4%) |
Employment Occupations by Sex in West Sullivan
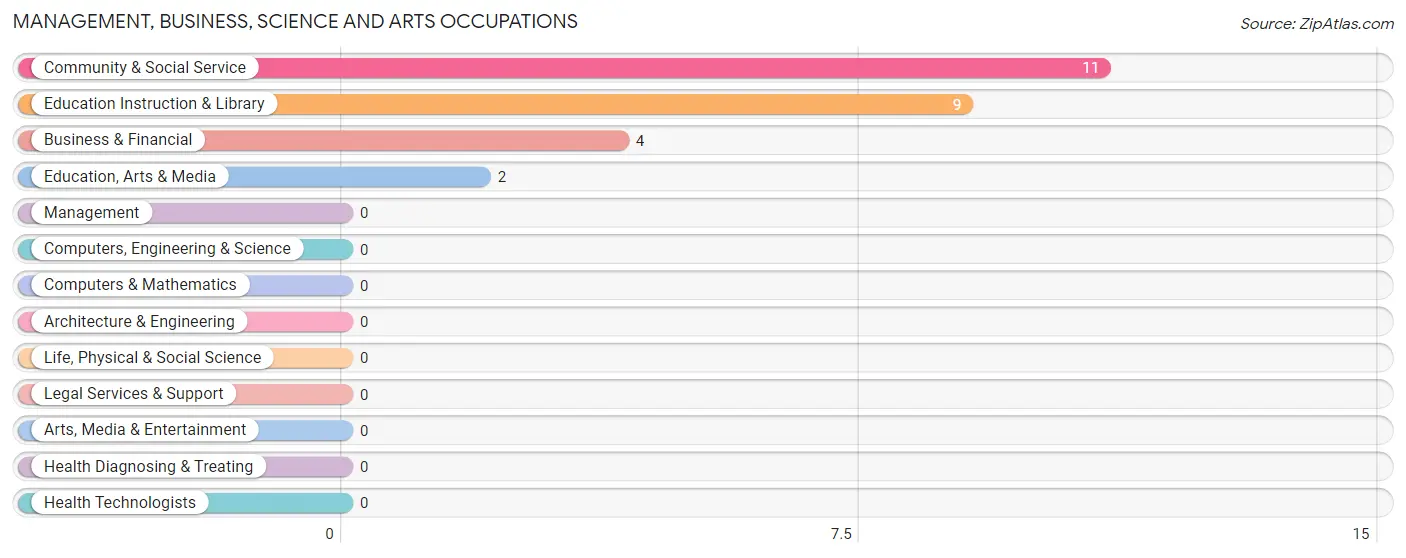
Management, Business, Science and Arts Occupations
The most common Management, Business, Science and Arts occupations in West Sullivan are Community & Social Service (11 | 11.3%), Education Instruction & Library (9 | 9.3%), Business & Financial (4 | 4.1%), and Education, Arts & Media (2 | 2.1%).
Management, Business, Science and Arts Occupations by Sex
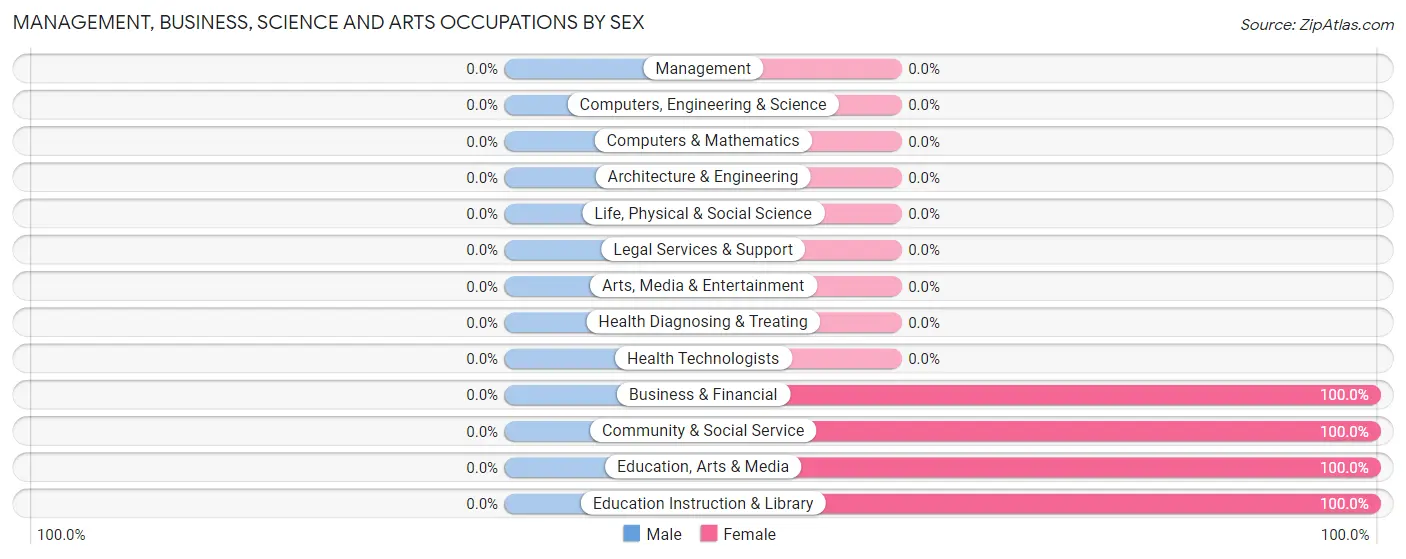
| Occupation | Male | Female |
| Management | 0 (0.0%) | 0 (0.0%) |
| Business & Financial | 0 (0.0%) | 4 (100.0%) |
| Computers, Engineering & Science | 0 (0.0%) | 0 (0.0%) |
| Computers & Mathematics | 0 (0.0%) | 0 (0.0%) |
| Architecture & Engineering | 0 (0.0%) | 0 (0.0%) |
| Life, Physical & Social Science | 0 (0.0%) | 0 (0.0%) |
| Community & Social Service | 0 (0.0%) | 11 (100.0%) |
| Education, Arts & Media | 0 (0.0%) | 2 (100.0%) |
| Legal Services & Support | 0 (0.0%) | 0 (0.0%) |
| Education Instruction & Library | 0 (0.0%) | 9 (100.0%) |
| Arts, Media & Entertainment | 0 (0.0%) | 0 (0.0%) |
| Health Diagnosing & Treating | 0 (0.0%) | 0 (0.0%) |
| Health Technologists | 0 (0.0%) | 0 (0.0%) |
| Total (Category) | 0 (0.0%) | 15 (100.0%) |
| Total (Overall) | 58 (59.8%) | 39 (40.2%) |
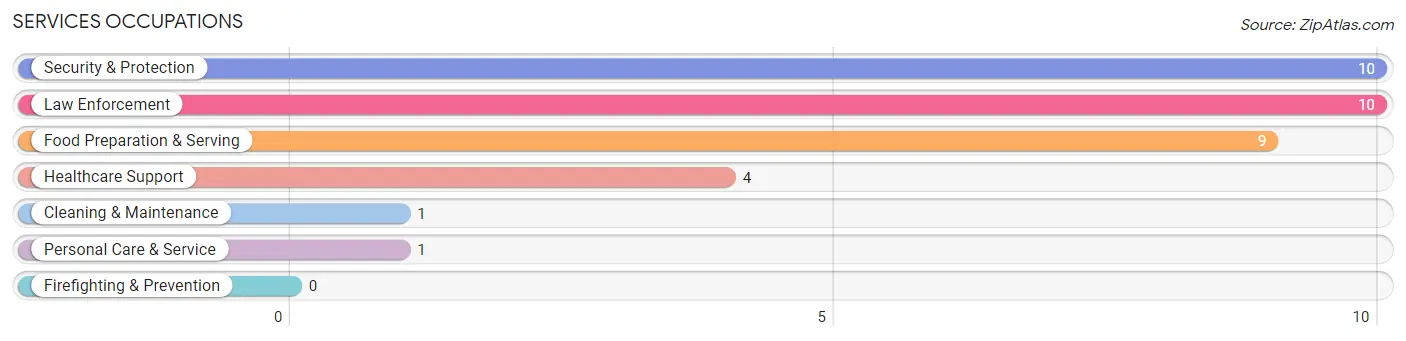
Services Occupations
The most common Services occupations in West Sullivan are Security & Protection (10 | 10.3%), Law Enforcement (10 | 10.3%), Food Preparation & Serving (9 | 9.3%), Healthcare Support (4 | 4.1%), and Cleaning & Maintenance (1 | 1.0%).
Services Occupations by Sex
Within the Services occupations in West Sullivan, the most male-oriented occupations are Security & Protection (100.0%), and Law Enforcement (100.0%), while the most female-oriented occupations are Healthcare Support (100.0%), Food Preparation & Serving (100.0%), and Cleaning & Maintenance (100.0%).
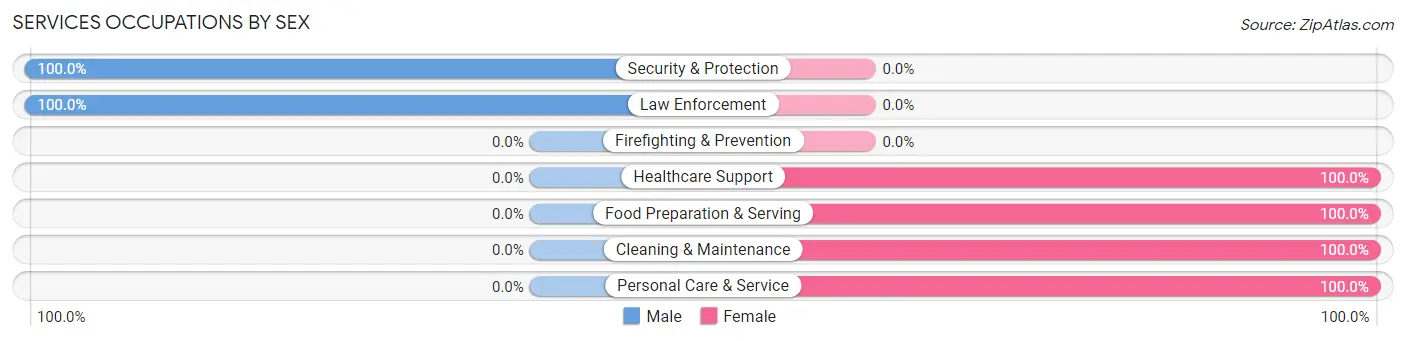
| Occupation | Male | Female |
| Healthcare Support | 0 (0.0%) | 4 (100.0%) |
| Security & Protection | 10 (100.0%) | 0 (0.0%) |
| Firefighting & Prevention | 0 (0.0%) | 0 (0.0%) |
| Law Enforcement | 10 (100.0%) | 0 (0.0%) |
| Food Preparation & Serving | 0 (0.0%) | 9 (100.0%) |
| Cleaning & Maintenance | 0 (0.0%) | 1 (100.0%) |
| Personal Care & Service | 0 (0.0%) | 1 (100.0%) |
| Total (Category) | 10 (40.0%) | 15 (60.0%) |
| Total (Overall) | 58 (59.8%) | 39 (40.2%) |
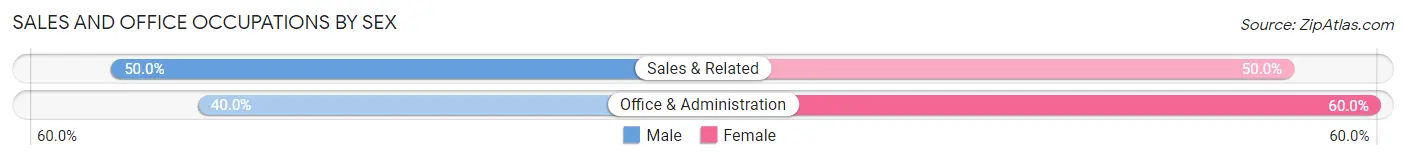
Sales and Office Occupations
The most common Sales and Office occupations in West Sullivan are Office & Administration (10 | 10.3%), and Sales & Related (2 | 2.1%).
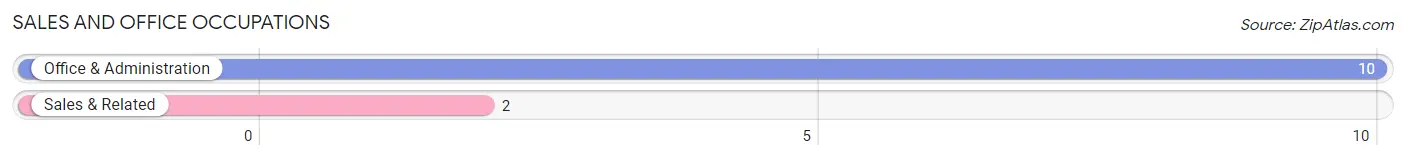
Sales and Office Occupations by Sex
| Occupation | Male | Female |
| Sales & Related | 1 (50.0%) | 1 (50.0%) |
| Office & Administration | 4 (40.0%) | 6 (60.0%) |
| Total (Category) | 5 (41.7%) | 7 (58.3%) |
| Total (Overall) | 58 (59.8%) | 39 (40.2%) |
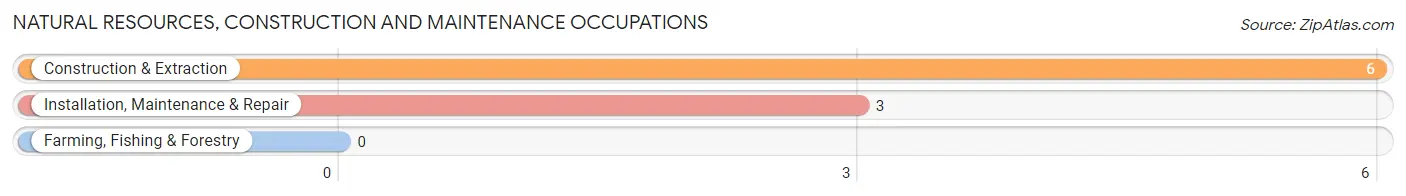
Natural Resources, Construction and Maintenance Occupations
The most common Natural Resources, Construction and Maintenance occupations in West Sullivan are Construction & Extraction (6 | 6.2%), and Installation, Maintenance & Repair (3 | 3.1%).
Natural Resources, Construction and Maintenance Occupations by Sex
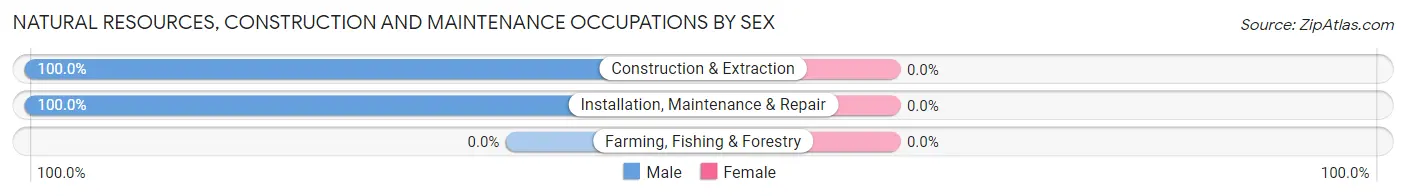
| Occupation | Male | Female |
| Farming, Fishing & Forestry | 0 (0.0%) | 0 (0.0%) |
| Construction & Extraction | 6 (100.0%) | 0 (0.0%) |
| Installation, Maintenance & Repair | 3 (100.0%) | 0 (0.0%) |
| Total (Category) | 9 (100.0%) | 0 (0.0%) |
| Total (Overall) | 58 (59.8%) | 39 (40.2%) |
Production, Transportation and Moving Occupations
The most common Production, Transportation and Moving occupations in West Sullivan are Material Moving (23 | 23.7%), Production (11 | 11.3%), and Transportation (2 | 2.1%).
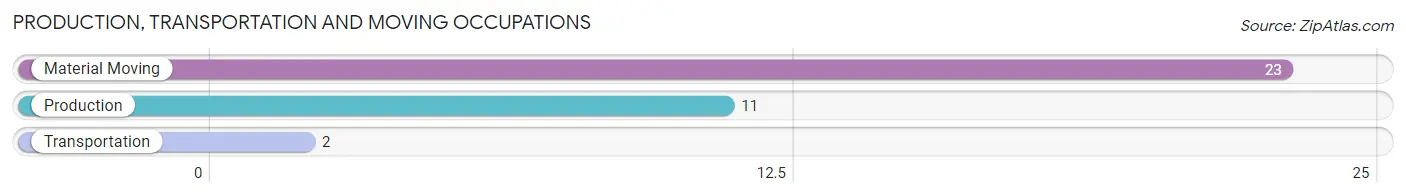
Production, Transportation and Moving Occupations by Sex
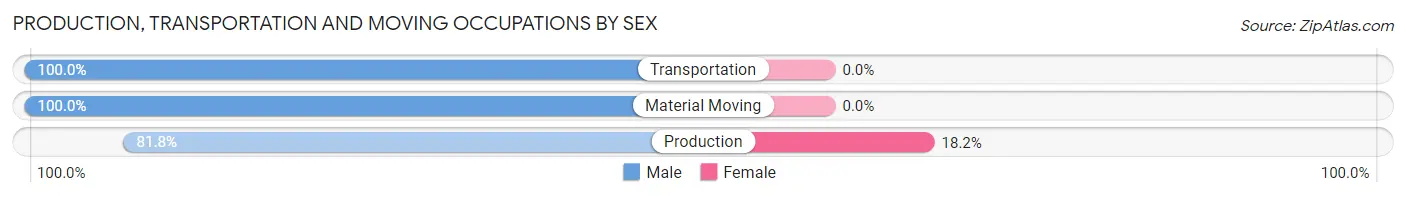
| Occupation | Male | Female |
| Production | 9 (81.8%) | 2 (18.2%) |
| Transportation | 2 (100.0%) | 0 (0.0%) |
| Material Moving | 23 (100.0%) | 0 (0.0%) |
| Total (Category) | 34 (94.4%) | 2 (5.6%) |
| Total (Overall) | 58 (59.8%) | 39 (40.2%) |
Employment Industries by Sex in West Sullivan
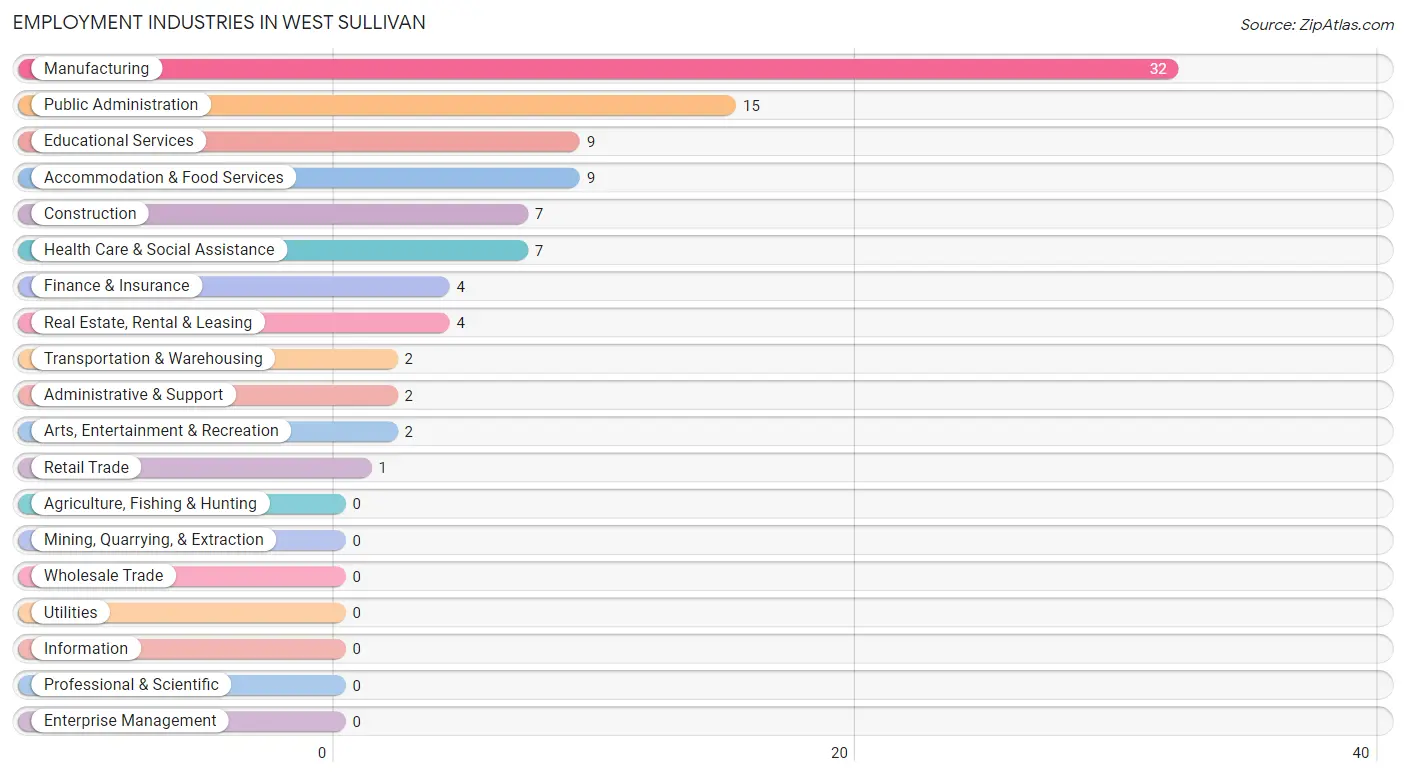
Employment Industries in West Sullivan
The major employment industries in West Sullivan include Manufacturing (32 | 33.0%), Public Administration (15 | 15.5%), Educational Services (9 | 9.3%), Accommodation & Food Services (9 | 9.3%), and Construction (7 | 7.2%).
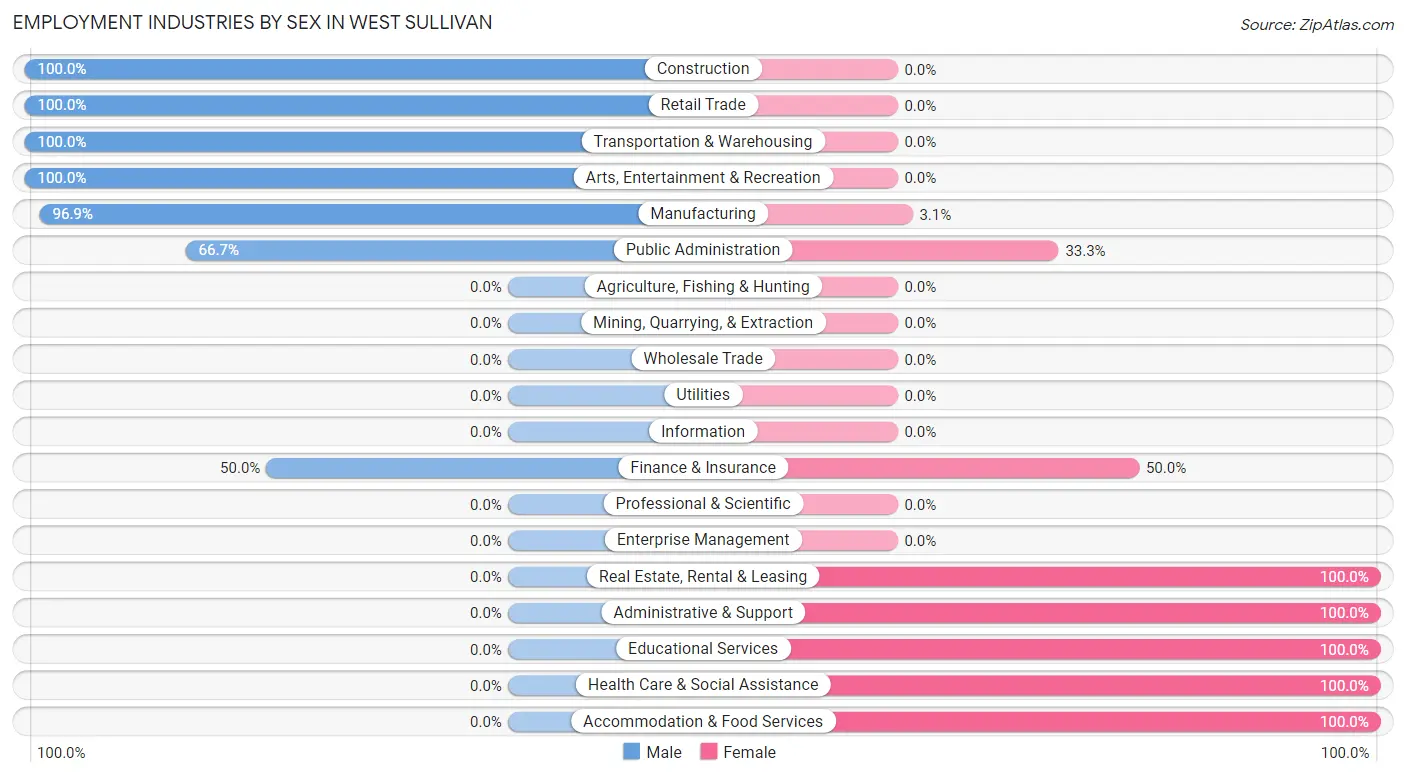
Employment Industries by Sex in West Sullivan
The West Sullivan industries that see more men than women are Construction (100.0%), Retail Trade (100.0%), and Transportation & Warehousing (100.0%), whereas the industries that tend to have a higher number of women are Real Estate, Rental & Leasing (100.0%), Administrative & Support (100.0%), and Educational Services (100.0%).
| Industry | Male | Female |
| Agriculture, Fishing & Hunting | 0 (0.0%) | 0 (0.0%) |
| Mining, Quarrying, & Extraction | 0 (0.0%) | 0 (0.0%) |
| Construction | 7 (100.0%) | 0 (0.0%) |
| Manufacturing | 31 (96.9%) | 1 (3.1%) |
| Wholesale Trade | 0 (0.0%) | 0 (0.0%) |
| Retail Trade | 1 (100.0%) | 0 (0.0%) |
| Transportation & Warehousing | 2 (100.0%) | 0 (0.0%) |
| Utilities | 0 (0.0%) | 0 (0.0%) |
| Information | 0 (0.0%) | 0 (0.0%) |
| Finance & Insurance | 2 (50.0%) | 2 (50.0%) |
| Real Estate, Rental & Leasing | 0 (0.0%) | 4 (100.0%) |
| Professional & Scientific | 0 (0.0%) | 0 (0.0%) |
| Enterprise Management | 0 (0.0%) | 0 (0.0%) |
| Administrative & Support | 0 (0.0%) | 2 (100.0%) |
| Educational Services | 0 (0.0%) | 9 (100.0%) |
| Health Care & Social Assistance | 0 (0.0%) | 7 (100.0%) |
| Arts, Entertainment & Recreation | 2 (100.0%) | 0 (0.0%) |
| Accommodation & Food Services | 0 (0.0%) | 9 (100.0%) |
| Public Administration | 10 (66.7%) | 5 (33.3%) |
| Total | 58 (59.8%) | 39 (40.2%) |
Education in West Sullivan
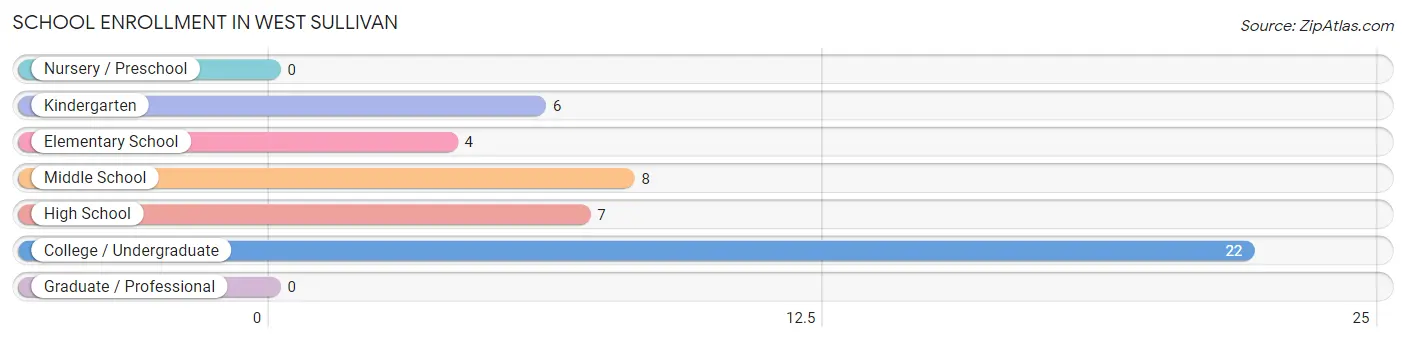
School Enrollment in West Sullivan
The most common levels of schooling among the 47 students in West Sullivan are college / undergraduate (22 | 46.8%), middle school (8 | 17.0%), and high school (7 | 14.9%).
| School Level | # Students | % Students |
| Nursery / Preschool | 0 | 0.0% |
| Kindergarten | 6 | 12.8% |
| Elementary School | 4 | 8.5% |
| Middle School | 8 | 17.0% |
| High School | 7 | 14.9% |
| College / Undergraduate | 22 | 46.8% |
| Graduate / Professional | 0 | 0.0% |
| Total | 47 | 100.0% |
School Enrollment by Age by Funding Source in West Sullivan
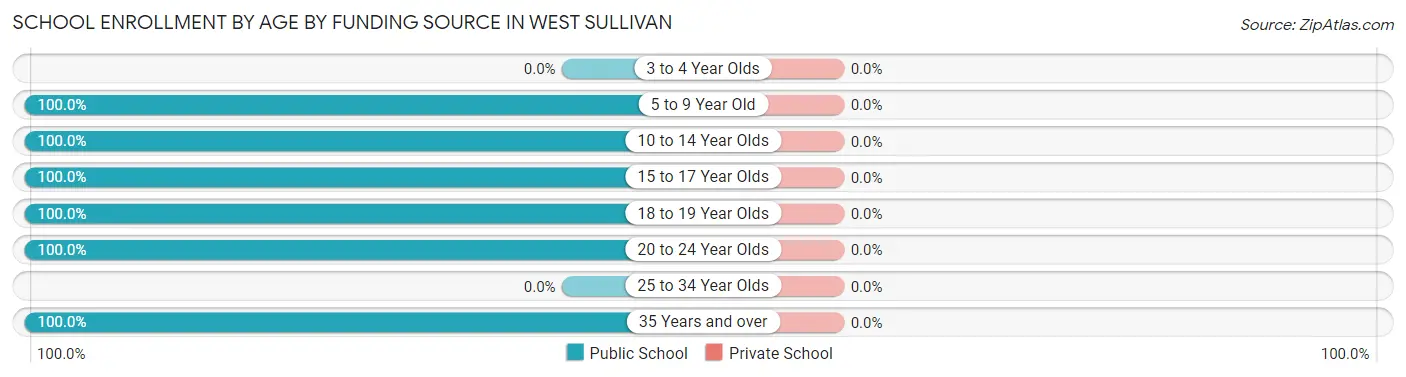
| Age Bracket | Public School | Private School |
| 3 to 4 Year Olds | 0 (0.0%) | 0 (0.0%) |
| 5 to 9 Year Old | 8 (100.0%) | 0 (0.0%) |
| 10 to 14 Year Olds | 10 (100.0%) | 0 (0.0%) |
| 15 to 17 Year Olds | 3 (100.0%) | 0 (0.0%) |
| 18 to 19 Year Olds | 4 (100.0%) | 0 (0.0%) |
| 20 to 24 Year Olds | 14 (100.0%) | 0 (0.0%) |
| 25 to 34 Year Olds | 0 (0.0%) | 0 (0.0%) |
| 35 Years and over | 8 (100.0%) | 0 (0.0%) |
| Total | 47 (100.0%) | 0 (0.0%) |
Educational Attainment by Field of Study in West Sullivan
, and education (2 | 100.0%) are the most common fields of study among 2 individuals in West Sullivan who have obtained a bachelor's degree or higher.
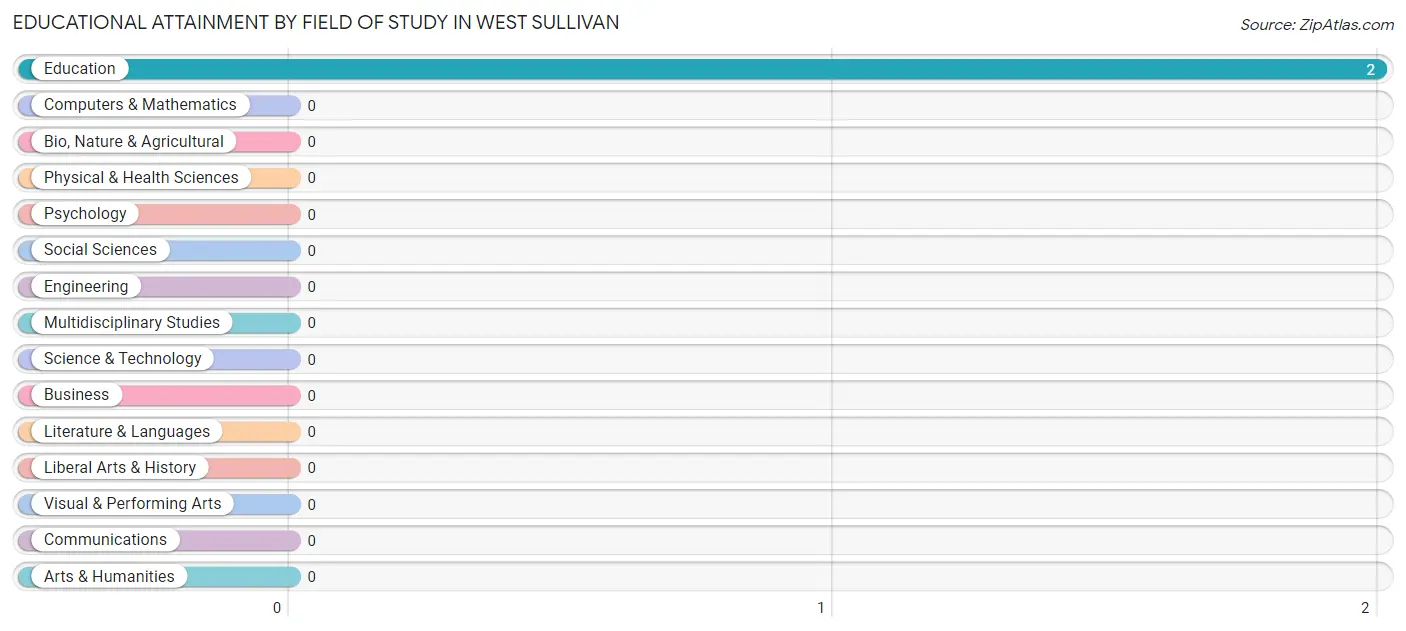
| Field of Study | # Graduates | % Graduates |
| Computers & Mathematics | 0 | 0.0% |
| Bio, Nature & Agricultural | 0 | 0.0% |
| Physical & Health Sciences | 0 | 0.0% |
| Psychology | 0 | 0.0% |
| Social Sciences | 0 | 0.0% |
| Engineering | 0 | 0.0% |
| Multidisciplinary Studies | 0 | 0.0% |
| Science & Technology | 0 | 0.0% |
| Business | 0 | 0.0% |
| Education | 2 | 100.0% |
| Literature & Languages | 0 | 0.0% |
| Liberal Arts & History | 0 | 0.0% |
| Visual & Performing Arts | 0 | 0.0% |
| Communications | 0 | 0.0% |
| Arts & Humanities | 0 | 0.0% |
| Total | 2 | 100.0% |
Transportation & Commute in West Sullivan
Vehicle Availability by Sex in West Sullivan
The most prevalent vehicle ownership categories in West Sullivan are males with 2 vehicles (39, accounting for 67.2%) and females with 2 vehicles (34, making up 100.0%).
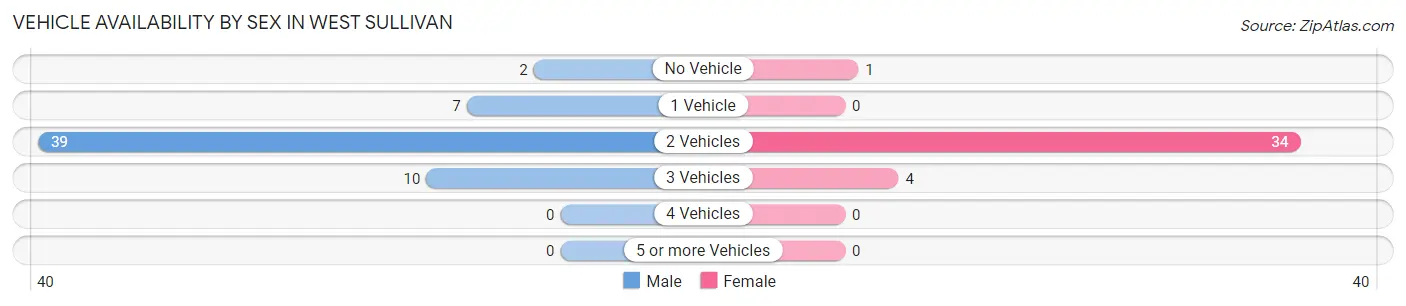
| Vehicles Available | Male | Female |
| No Vehicle | 2 (3.5%) | 1 (2.6%) |
| 1 Vehicle | 7 (12.1%) | 0 (0.0%) |
| 2 Vehicles | 39 (67.2%) | 34 (87.2%) |
| 3 Vehicles | 10 (17.2%) | 4 (10.3%) |
| 4 Vehicles | 0 (0.0%) | 0 (0.0%) |
| 5 or more Vehicles | 0 (0.0%) | 0 (0.0%) |
| Total | 58 (100.0%) | 39 (100.0%) |
Commute Time in West Sullivan
The most frequently occuring commute durations in West Sullivan are 5 to 9 minutes (21 commuters, 22.3%), 10 to 14 minutes (17 commuters, 18.1%), and 60 to 89 minutes (15 commuters, 16.0%).
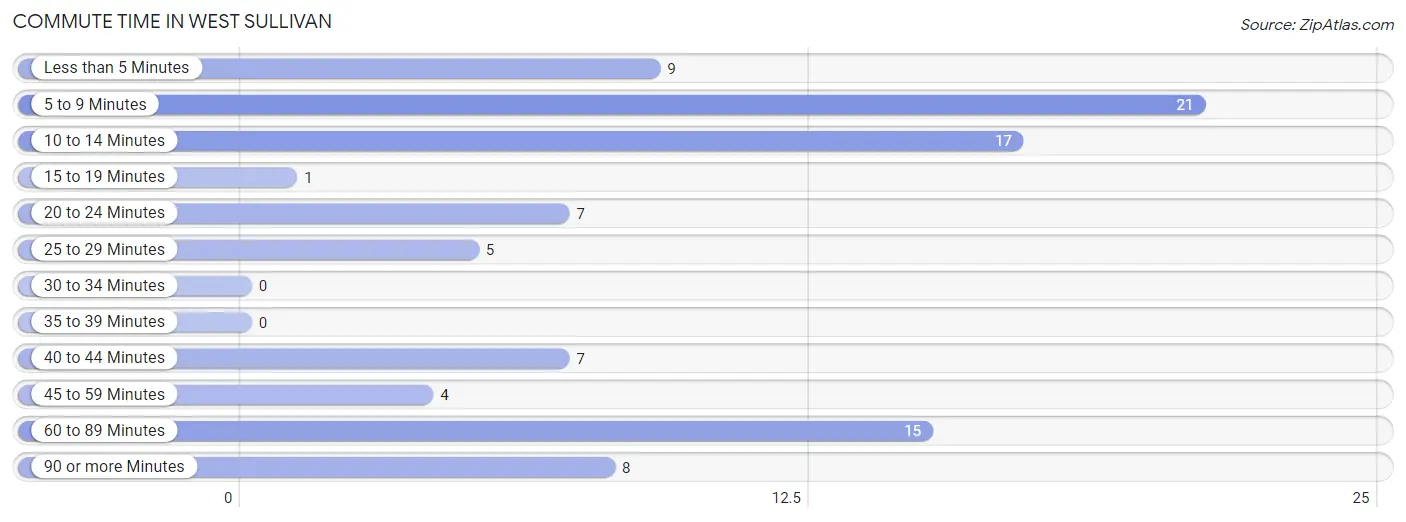
| Commute Time | # Commuters | % Commuters |
| Less than 5 Minutes | 9 | 9.6% |
| 5 to 9 Minutes | 21 | 22.3% |
| 10 to 14 Minutes | 17 | 18.1% |
| 15 to 19 Minutes | 1 | 1.1% |
| 20 to 24 Minutes | 7 | 7.4% |
| 25 to 29 Minutes | 5 | 5.3% |
| 30 to 34 Minutes | 0 | 0.0% |
| 35 to 39 Minutes | 0 | 0.0% |
| 40 to 44 Minutes | 7 | 7.4% |
| 45 to 59 Minutes | 4 | 4.3% |
| 60 to 89 Minutes | 15 | 16.0% |
| 90 or more Minutes | 8 | 8.5% |
Commute Time by Sex in West Sullivan
The most common commute times in West Sullivan are 60 to 89 minutes (13 commuters, 23.2%) for males and less than 5 minutes (9 commuters, 23.7%) for females.
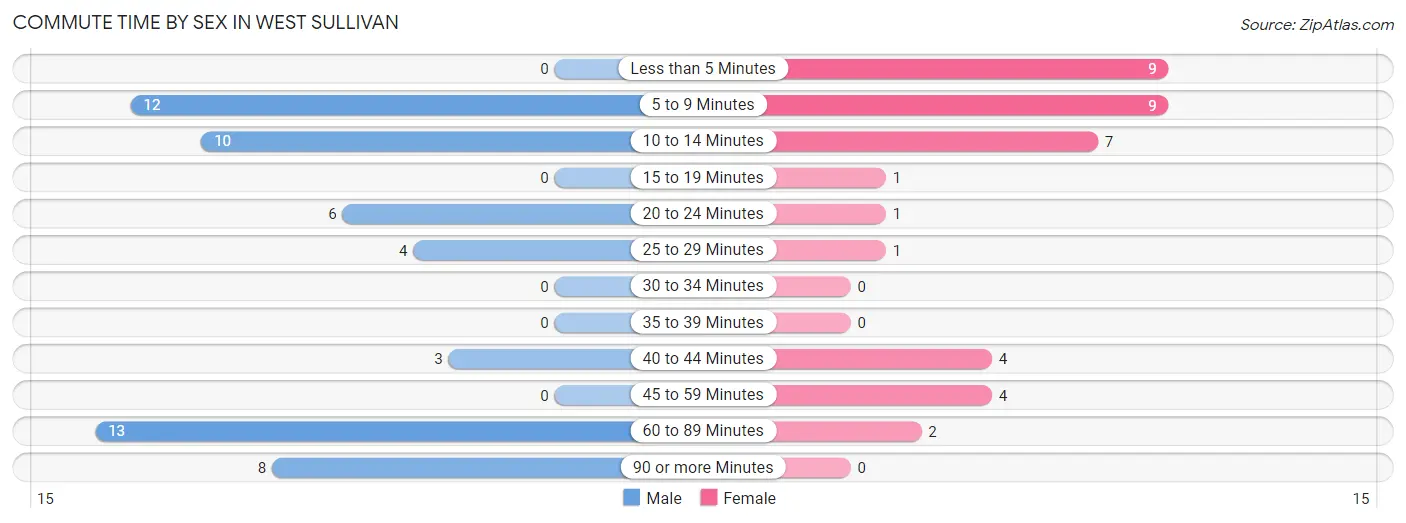
| Commute Time | Male | Female |
| Less than 5 Minutes | 0 (0.0%) | 9 (23.7%) |
| 5 to 9 Minutes | 12 (21.4%) | 9 (23.7%) |
| 10 to 14 Minutes | 10 (17.9%) | 7 (18.4%) |
| 15 to 19 Minutes | 0 (0.0%) | 1 (2.6%) |
| 20 to 24 Minutes | 6 (10.7%) | 1 (2.6%) |
| 25 to 29 Minutes | 4 (7.1%) | 1 (2.6%) |
| 30 to 34 Minutes | 0 (0.0%) | 0 (0.0%) |
| 35 to 39 Minutes | 0 (0.0%) | 0 (0.0%) |
| 40 to 44 Minutes | 3 (5.4%) | 4 (10.5%) |
| 45 to 59 Minutes | 0 (0.0%) | 4 (10.5%) |
| 60 to 89 Minutes | 13 (23.2%) | 2 (5.3%) |
| 90 or more Minutes | 8 (14.3%) | 0 (0.0%) |
Time of Departure to Work by Sex in West Sullivan
The most frequent times of departure to work in West Sullivan are 6:00 AM to 6:29 AM (16, 28.6%) for males and 6:30 AM to 6:59 AM (12, 31.6%) for females.
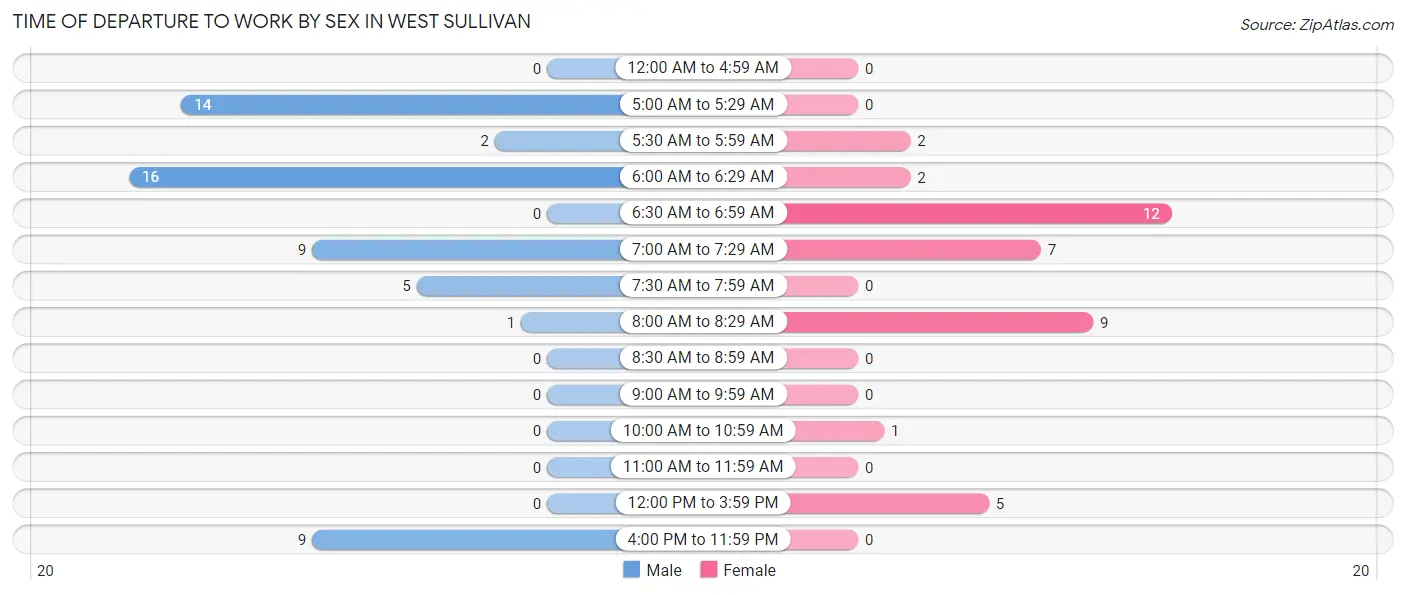
| Time of Departure | Male | Female |
| 12:00 AM to 4:59 AM | 0 (0.0%) | 0 (0.0%) |
| 5:00 AM to 5:29 AM | 14 (25.0%) | 0 (0.0%) |
| 5:30 AM to 5:59 AM | 2 (3.6%) | 2 (5.3%) |
| 6:00 AM to 6:29 AM | 16 (28.6%) | 2 (5.3%) |
| 6:30 AM to 6:59 AM | 0 (0.0%) | 12 (31.6%) |
| 7:00 AM to 7:29 AM | 9 (16.1%) | 7 (18.4%) |
| 7:30 AM to 7:59 AM | 5 (8.9%) | 0 (0.0%) |
| 8:00 AM to 8:29 AM | 1 (1.8%) | 9 (23.7%) |
| 8:30 AM to 8:59 AM | 0 (0.0%) | 0 (0.0%) |
| 9:00 AM to 9:59 AM | 0 (0.0%) | 0 (0.0%) |
| 10:00 AM to 10:59 AM | 0 (0.0%) | 1 (2.6%) |
| 11:00 AM to 11:59 AM | 0 (0.0%) | 0 (0.0%) |
| 12:00 PM to 3:59 PM | 0 (0.0%) | 5 (13.2%) |
| 4:00 PM to 11:59 PM | 9 (16.1%) | 0 (0.0%) |
| Total | 56 (100.0%) | 38 (100.0%) |
Housing Occupancy in West Sullivan
Occupancy by Ownership in West Sullivan
Of the total 104 dwellings in West Sullivan, owner-occupied units account for 11 (10.6%), while renter-occupied units make up 93 (89.4%).
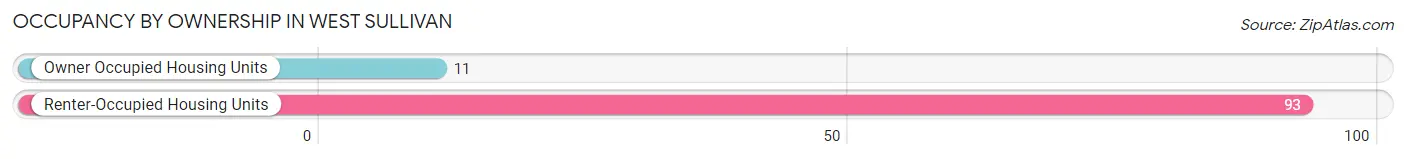
| Occupancy | # Housing Units | % Housing Units |
| Owner Occupied Housing Units | 11 | 10.6% |
| Renter-Occupied Housing Units | 93 | 89.4% |
| Total Occupied Housing Units | 104 | 100.0% |
Occupancy by Household Size in West Sullivan
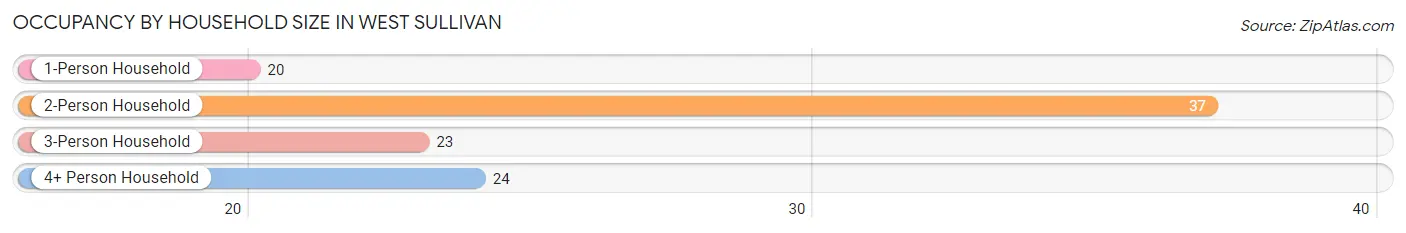
| Household Size | # Housing Units | % Housing Units |
| 1-Person Household | 20 | 19.2% |
| 2-Person Household | 37 | 35.6% |
| 3-Person Household | 23 | 22.1% |
| 4+ Person Household | 24 | 23.1% |
| Total Housing Units | 104 | 100.0% |
Occupancy by Ownership by Household Size in West Sullivan
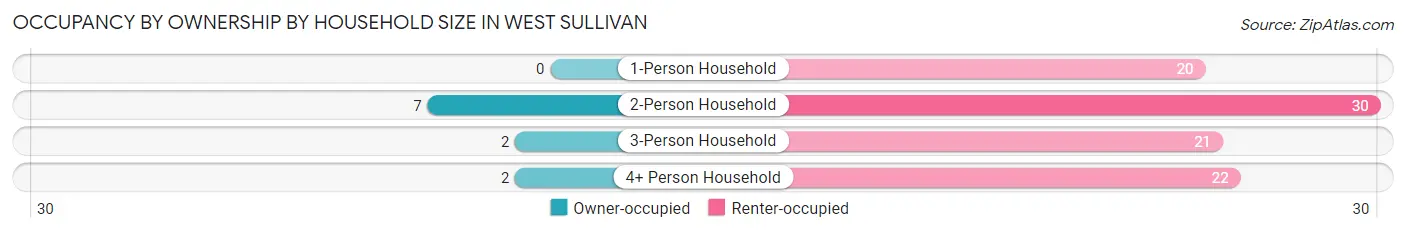
| Household Size | Owner-occupied | Renter-occupied |
| 1-Person Household | 0 (0.0%) | 20 (100.0%) |
| 2-Person Household | 7 (18.9%) | 30 (81.1%) |
| 3-Person Household | 2 (8.7%) | 21 (91.3%) |
| 4+ Person Household | 2 (8.3%) | 22 (91.7%) |
| Total Housing Units | 11 (10.6%) | 93 (89.4%) |
Occupancy by Educational Attainment in West Sullivan
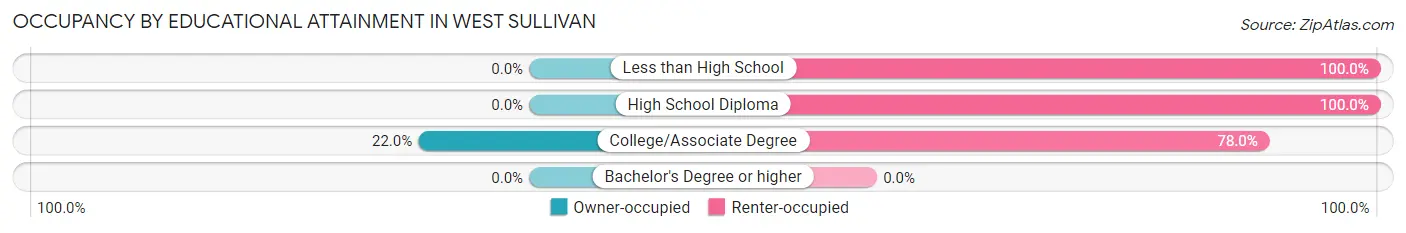
| Household Size | Owner-occupied | Renter-occupied |
| Less than High School | 0 (0.0%) | 18 (100.0%) |
| High School Diploma | 0 (0.0%) | 36 (100.0%) |
| College/Associate Degree | 11 (22.0%) | 39 (78.0%) |
| Bachelor's Degree or higher | 0 (0.0%) | 0 (0.0%) |
Occupancy by Age of Householder in West Sullivan
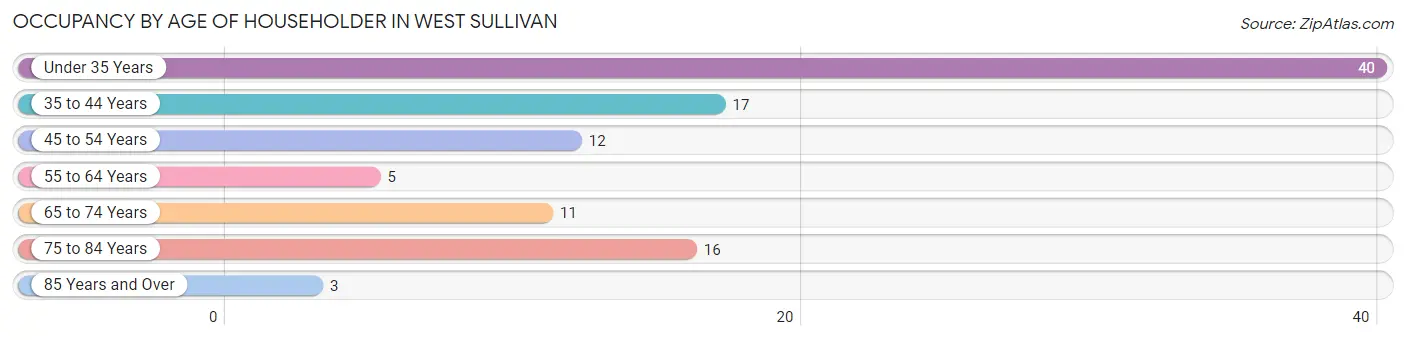
| Age Bracket | # Households | % Households |
| Under 35 Years | 40 | 38.5% |
| 35 to 44 Years | 17 | 16.4% |
| 45 to 54 Years | 12 | 11.5% |
| 55 to 64 Years | 5 | 4.8% |
| 65 to 74 Years | 11 | 10.6% |
| 75 to 84 Years | 16 | 15.4% |
| 85 Years and Over | 3 | 2.9% |
| Total | 104 | 100.0% |
Housing Finances in West Sullivan
Median Income by Occupancy in West Sullivan
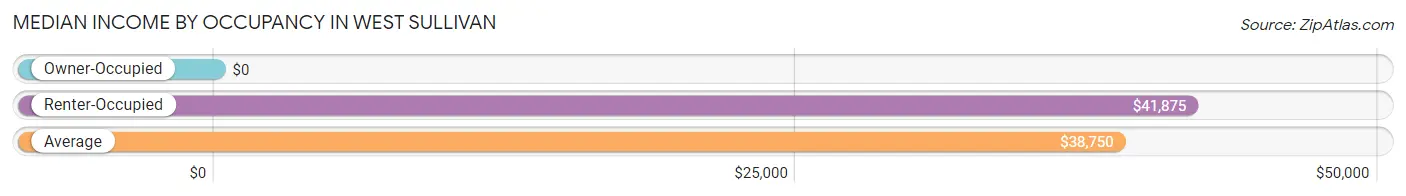
| Occupancy Type | # Households | Median Income |
| Owner-Occupied | 11 (10.6%) | $0 |
| Renter-Occupied | 93 (89.4%) | $41,875 |
| Average | 104 (100.0%) | $38,750 |
Occupancy by Householder Income Bracket in West Sullivan
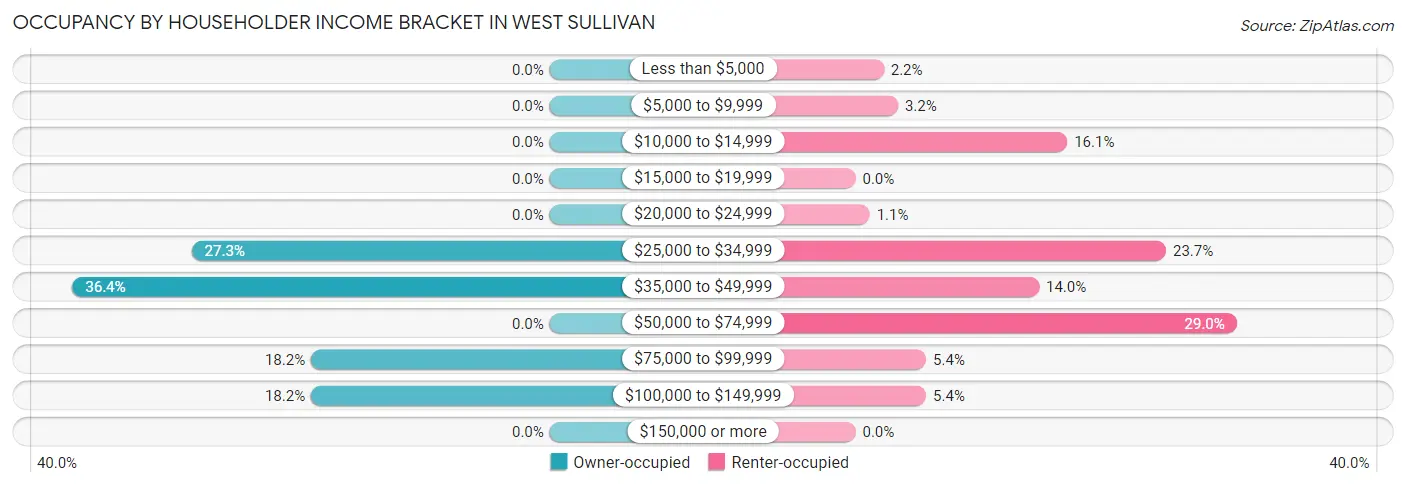
| Income Bracket | Owner-occupied | Renter-occupied |
| Less than $5,000 | 0 (0.0%) | 2 (2.1%) |
| $5,000 to $9,999 | 0 (0.0%) | 3 (3.2%) |
| $10,000 to $14,999 | 0 (0.0%) | 15 (16.1%) |
| $15,000 to $19,999 | 0 (0.0%) | 0 (0.0%) |
| $20,000 to $24,999 | 0 (0.0%) | 1 (1.1%) |
| $25,000 to $34,999 | 3 (27.3%) | 22 (23.7%) |
| $35,000 to $49,999 | 4 (36.4%) | 13 (14.0%) |
| $50,000 to $74,999 | 0 (0.0%) | 27 (29.0%) |
| $75,000 to $99,999 | 2 (18.2%) | 5 (5.4%) |
| $100,000 to $149,999 | 2 (18.2%) | 5 (5.4%) |
| $150,000 or more | 0 (0.0%) | 0 (0.0%) |
| Total | 11 (100.0%) | 93 (100.0%) |
Monthly Housing Cost Tiers in West Sullivan
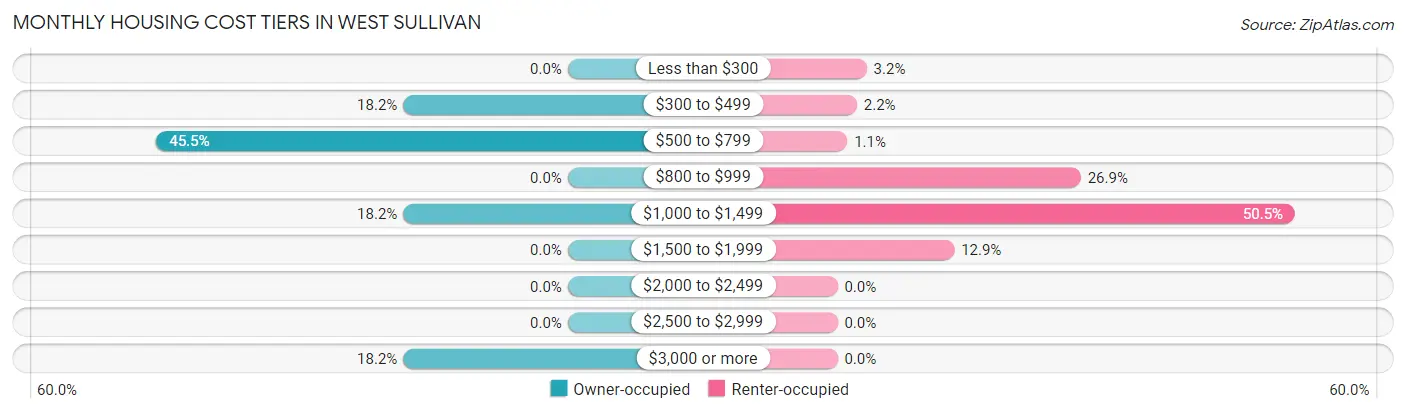
| Monthly Cost | Owner-occupied | Renter-occupied |
| Less than $300 | 0 (0.0%) | 3 (3.2%) |
| $300 to $499 | 2 (18.2%) | 2 (2.1%) |
| $500 to $799 | 5 (45.5%) | 1 (1.1%) |
| $800 to $999 | 0 (0.0%) | 25 (26.9%) |
| $1,000 to $1,499 | 2 (18.2%) | 47 (50.5%) |
| $1,500 to $1,999 | 0 (0.0%) | 12 (12.9%) |
| $2,000 to $2,499 | 0 (0.0%) | 0 (0.0%) |
| $2,500 to $2,999 | 0 (0.0%) | 0 (0.0%) |
| $3,000 or more | 2 (18.2%) | 0 (0.0%) |
| Total | 11 (100.0%) | 93 (100.0%) |
Physical Housing Characteristics in West Sullivan
Housing Structures in West Sullivan
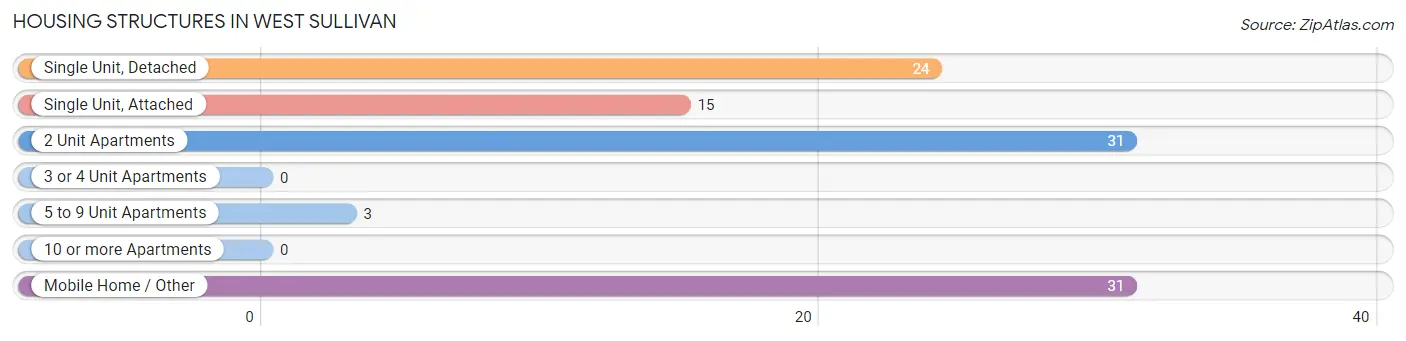
| Structure Type | # Housing Units | % Housing Units |
| Single Unit, Detached | 24 | 23.1% |
| Single Unit, Attached | 15 | 14.4% |
| 2 Unit Apartments | 31 | 29.8% |
| 3 or 4 Unit Apartments | 0 | 0.0% |
| 5 to 9 Unit Apartments | 3 | 2.9% |
| 10 or more Apartments | 0 | 0.0% |
| Mobile Home / Other | 31 | 29.8% |
| Total | 104 | 100.0% |
Housing Structures by Occupancy in West Sullivan
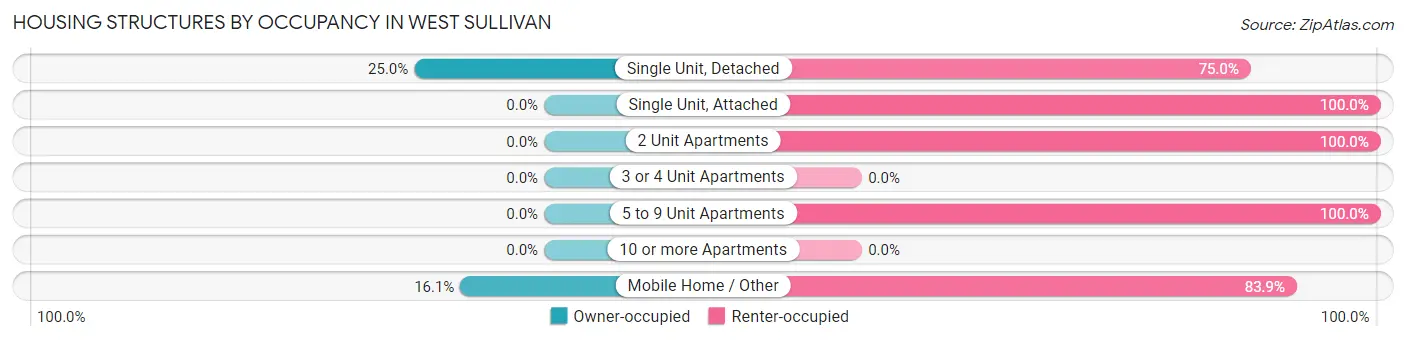
| Structure Type | Owner-occupied | Renter-occupied |
| Single Unit, Detached | 6 (25.0%) | 18 (75.0%) |
| Single Unit, Attached | 0 (0.0%) | 15 (100.0%) |
| 2 Unit Apartments | 0 (0.0%) | 31 (100.0%) |
| 3 or 4 Unit Apartments | 0 (0.0%) | 0 (0.0%) |
| 5 to 9 Unit Apartments | 0 (0.0%) | 3 (100.0%) |
| 10 or more Apartments | 0 (0.0%) | 0 (0.0%) |
| Mobile Home / Other | 5 (16.1%) | 26 (83.9%) |
| Total | 11 (10.6%) | 93 (89.4%) |
Housing Structures by Number of Rooms in West Sullivan
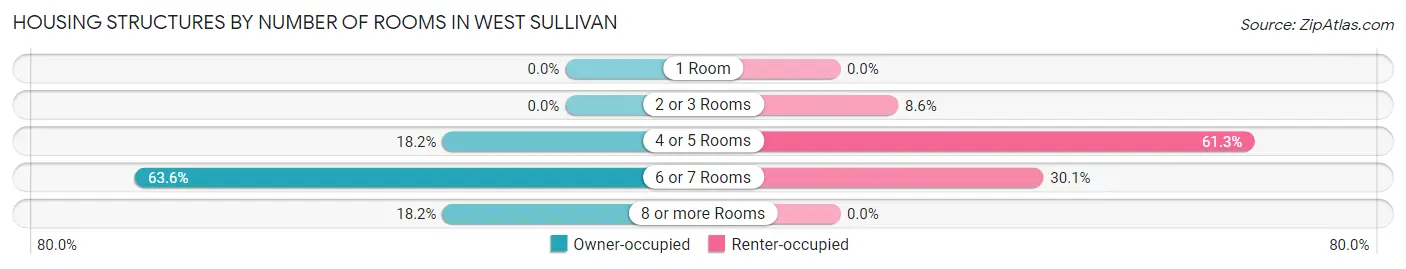
| Number of Rooms | Owner-occupied | Renter-occupied |
| 1 Room | 0 (0.0%) | 0 (0.0%) |
| 2 or 3 Rooms | 0 (0.0%) | 8 (8.6%) |
| 4 or 5 Rooms | 2 (18.2%) | 57 (61.3%) |
| 6 or 7 Rooms | 7 (63.6%) | 28 (30.1%) |
| 8 or more Rooms | 2 (18.2%) | 0 (0.0%) |
| Total | 11 (100.0%) | 93 (100.0%) |
Housing Structure by Heating Type in West Sullivan
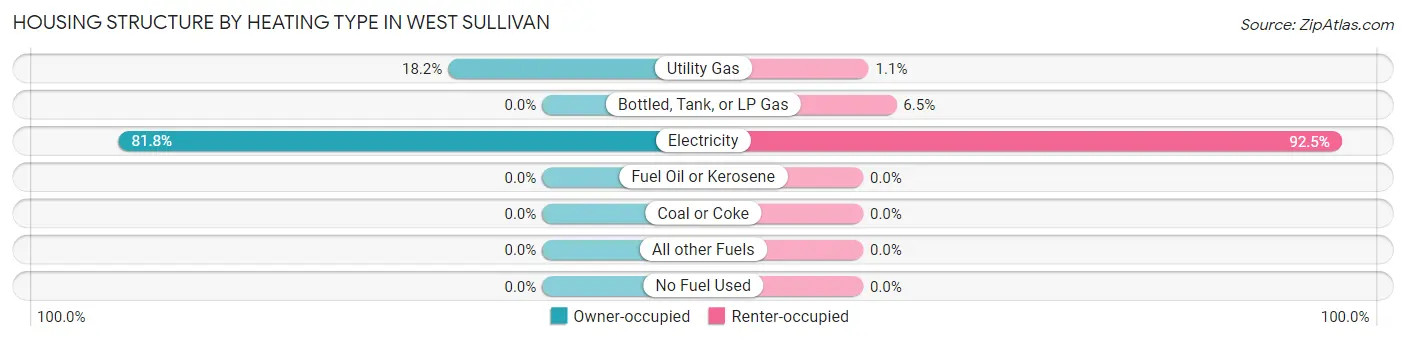
| Heating Type | Owner-occupied | Renter-occupied |
| Utility Gas | 2 (18.2%) | 1 (1.1%) |
| Bottled, Tank, or LP Gas | 0 (0.0%) | 6 (6.5%) |
| Electricity | 9 (81.8%) | 86 (92.5%) |
| Fuel Oil or Kerosene | 0 (0.0%) | 0 (0.0%) |
| Coal or Coke | 0 (0.0%) | 0 (0.0%) |
| All other Fuels | 0 (0.0%) | 0 (0.0%) |
| No Fuel Used | 0 (0.0%) | 0 (0.0%) |
| Total | 11 (100.0%) | 93 (100.0%) |
Household Vehicle Usage in West Sullivan
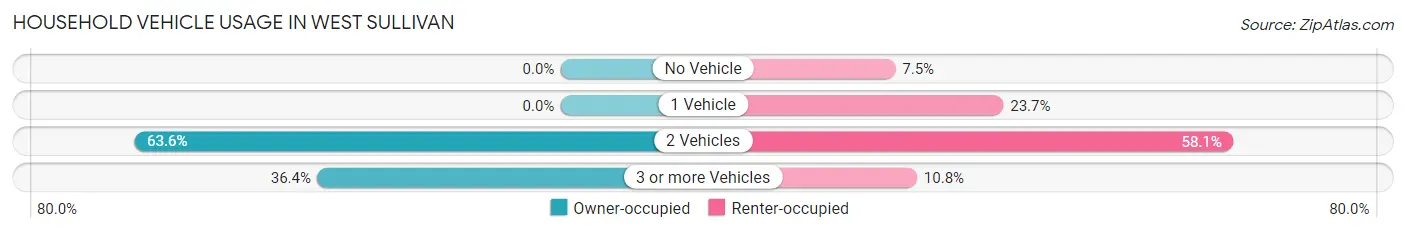
| Vehicles per Household | Owner-occupied | Renter-occupied |
| No Vehicle | 0 (0.0%) | 7 (7.5%) |
| 1 Vehicle | 0 (0.0%) | 22 (23.7%) |
| 2 Vehicles | 7 (63.6%) | 54 (58.1%) |
| 3 or more Vehicles | 4 (36.4%) | 10 (10.7%) |
| Total | 11 (100.0%) | 93 (100.0%) |
Real Estate & Mortgages in West Sullivan
Real Estate and Mortgage Overview in West Sullivan
| Characteristic | Without Mortgage | With Mortgage |
| Housing Units | 5 | 6 |
| Median Property Value | - | - |
| Median Household Income | - | - |
| Monthly Housing Costs | - | - |
| Real Estate Taxes | - | - |
Property Value by Mortgage Status in West Sullivan
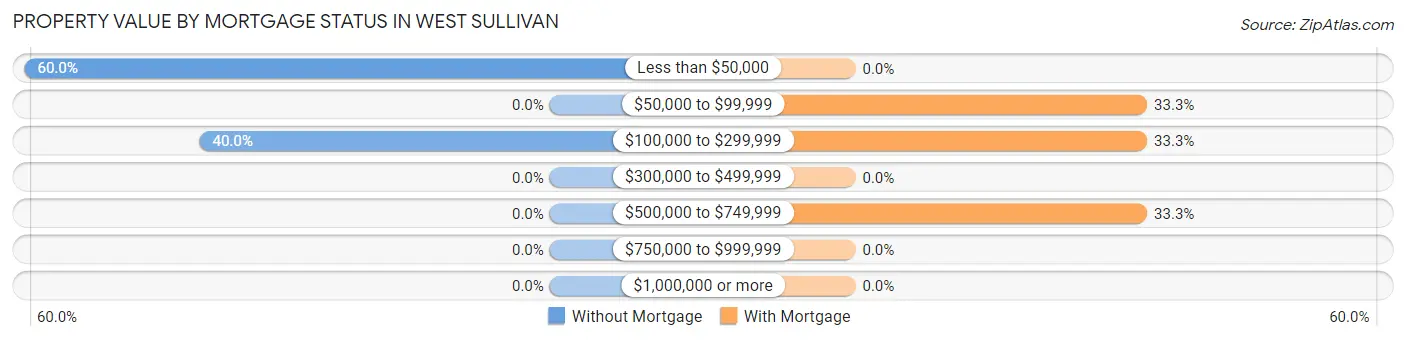
| Property Value | Without Mortgage | With Mortgage |
| Less than $50,000 | 3 (60.0%) | 0 (0.0%) |
| $50,000 to $99,999 | 0 (0.0%) | 2 (33.3%) |
| $100,000 to $299,999 | 2 (40.0%) | 2 (33.3%) |
| $300,000 to $499,999 | 0 (0.0%) | 0 (0.0%) |
| $500,000 to $749,999 | 0 (0.0%) | 2 (33.3%) |
| $750,000 to $999,999 | 0 (0.0%) | 0 (0.0%) |
| $1,000,000 or more | 0 (0.0%) | 0 (0.0%) |
| Total | 5 (100.0%) | 6 (100.0%) |
Household Income by Mortgage Status in West Sullivan
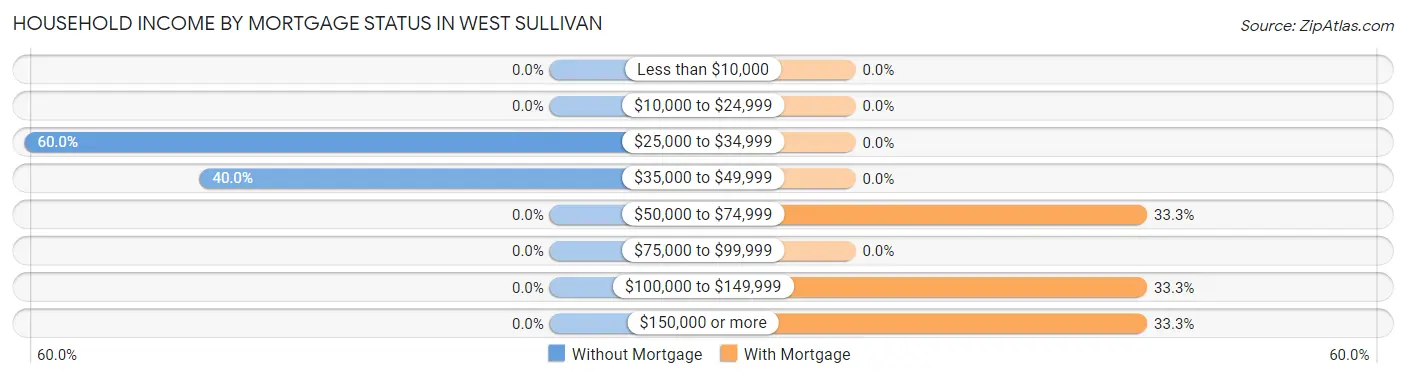
| Household Income | Without Mortgage | With Mortgage |
| Less than $10,000 | 0 (0.0%) | 0 (0.0%) |
| $10,000 to $24,999 | 0 (0.0%) | 0 (0.0%) |
| $25,000 to $34,999 | 3 (60.0%) | 0 (0.0%) |
| $35,000 to $49,999 | 2 (40.0%) | 0 (0.0%) |
| $50,000 to $74,999 | 0 (0.0%) | 2 (33.3%) |
| $75,000 to $99,999 | 0 (0.0%) | 0 (0.0%) |
| $100,000 to $149,999 | 0 (0.0%) | 2 (33.3%) |
| $150,000 or more | 0 (0.0%) | 2 (33.3%) |
| Total | 5 (100.0%) | 6 (100.0%) |
Property Value to Household Income Ratio in West Sullivan
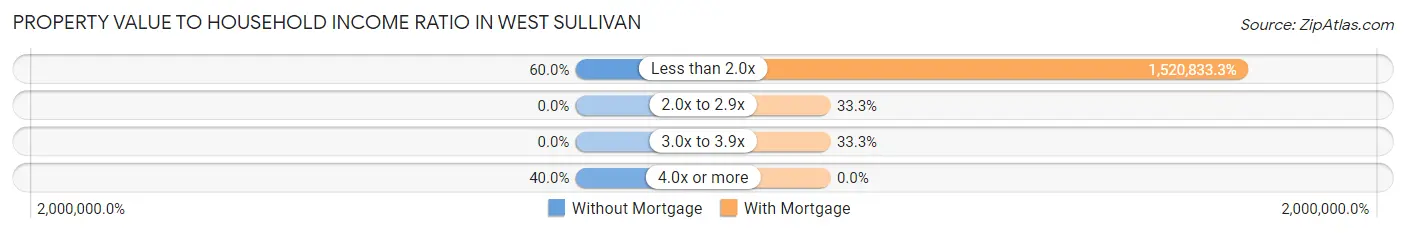
| Value-to-Income Ratio | Without Mortgage | With Mortgage |
| Less than 2.0x | 3 (60.0%) | 91,250 (1,520,833.3%) |
| 2.0x to 2.9x | 0 (0.0%) | 2 (33.3%) |
| 3.0x to 3.9x | 0 (0.0%) | 2 (33.3%) |
| 4.0x or more | 2 (40.0%) | 0 (0.0%) |
| Total | 5 (100.0%) | 6 (100.0%) |
Real Estate Taxes by Mortgage Status in West Sullivan
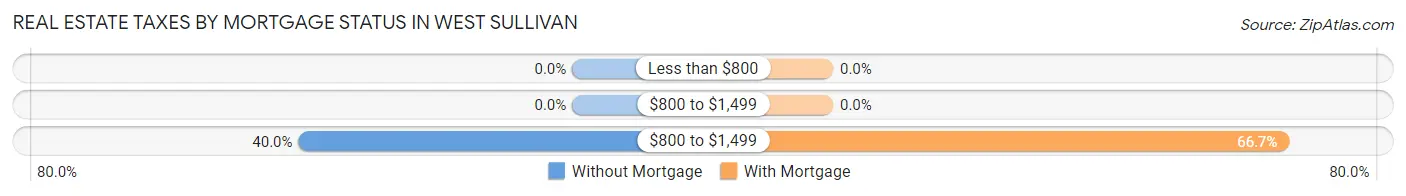
| Property Taxes | Without Mortgage | With Mortgage |
| Less than $800 | 0 (0.0%) | 0 (0.0%) |
| $800 to $1,499 | 0 (0.0%) | 0 (0.0%) |
| $800 to $1,499 | 2 (40.0%) | 4 (66.7%) |
| Total | 5 (100.0%) | 6 (100.0%) |
Health & Disability in West Sullivan
Health Insurance Coverage by Age in West Sullivan
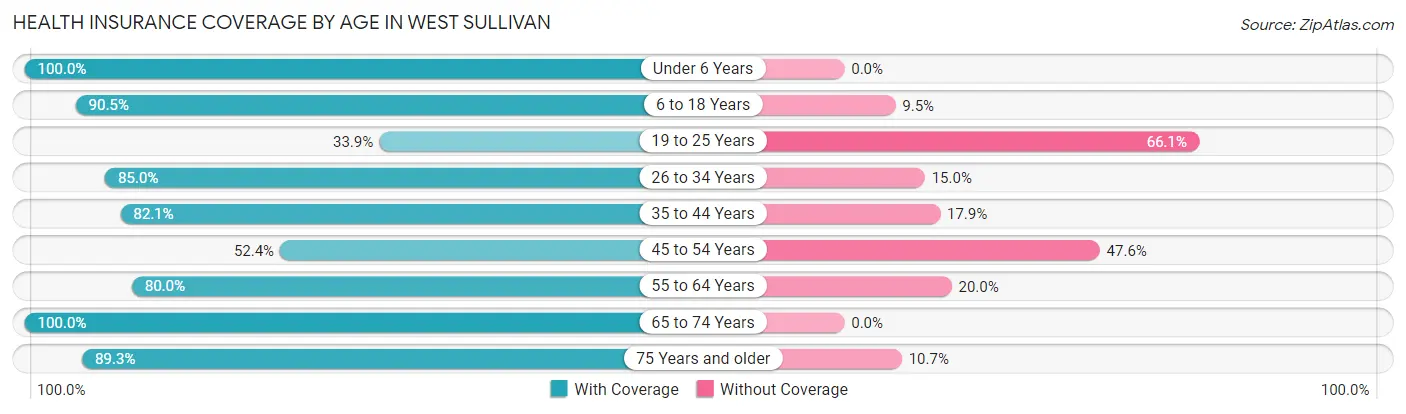
| Age Bracket | With Coverage | Without Coverage |
| Under 6 Years | 49 (100.0%) | 0 (0.0%) |
| 6 to 18 Years | 19 (90.5%) | 2 (9.5%) |
| 19 to 25 Years | 20 (33.9%) | 39 (66.1%) |
| 26 to 34 Years | 17 (85.0%) | 3 (15.0%) |
| 35 to 44 Years | 23 (82.1%) | 5 (17.9%) |
| 45 to 54 Years | 11 (52.4%) | 10 (47.6%) |
| 55 to 64 Years | 8 (80.0%) | 2 (20.0%) |
| 65 to 74 Years | 24 (100.0%) | 0 (0.0%) |
| 75 Years and older | 25 (89.3%) | 3 (10.7%) |
| Total | 196 (75.4%) | 64 (24.6%) |
Health Insurance Coverage by Citizenship Status in West Sullivan
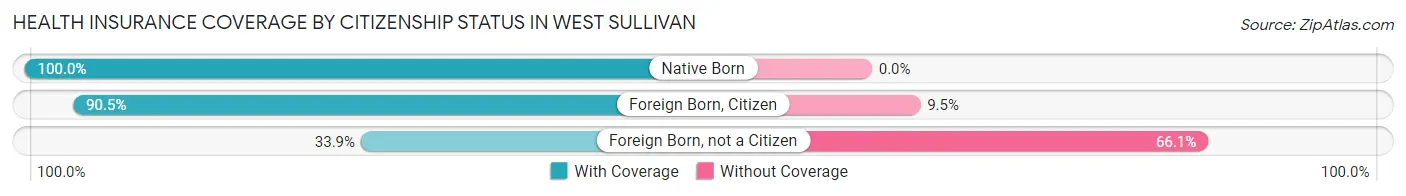
| Citizenship Status | With Coverage | Without Coverage |
| Native Born | 49 (100.0%) | 0 (0.0%) |
| Foreign Born, Citizen | 19 (90.5%) | 2 (9.5%) |
| Foreign Born, not a Citizen | 20 (33.9%) | 39 (66.1%) |
Health Insurance Coverage by Household Income in West Sullivan
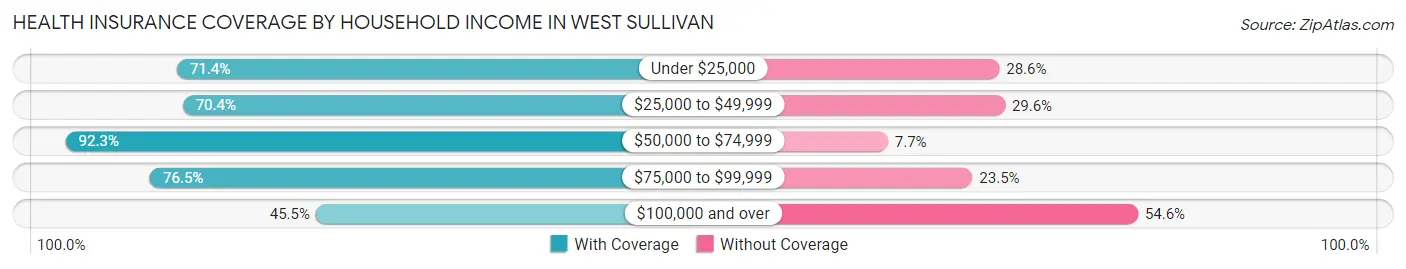
| Household Income | With Coverage | Without Coverage |
| Under $25,000 | 25 (71.4%) | 10 (28.6%) |
| $25,000 to $49,999 | 76 (70.4%) | 32 (29.6%) |
| $50,000 to $74,999 | 72 (92.3%) | 6 (7.7%) |
| $75,000 to $99,999 | 13 (76.5%) | 4 (23.5%) |
| $100,000 and over | 10 (45.5%) | 12 (54.5%) |
Public vs Private Health Insurance Coverage by Age in West Sullivan
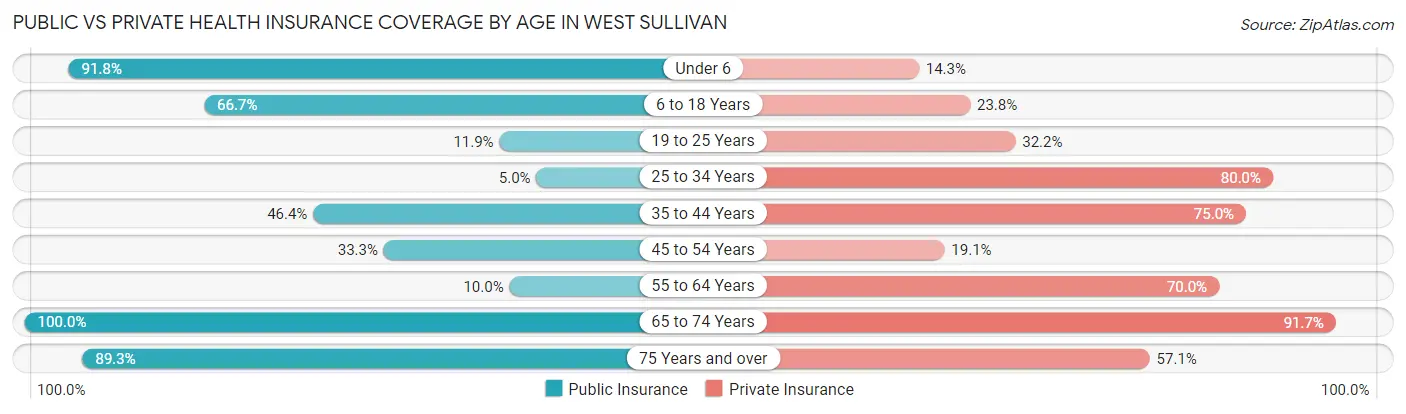
| Age Bracket | Public Insurance | Private Insurance |
| Under 6 | 45 (91.8%) | 7 (14.3%) |
| 6 to 18 Years | 14 (66.7%) | 5 (23.8%) |
| 19 to 25 Years | 7 (11.9%) | 19 (32.2%) |
| 25 to 34 Years | 1 (5.0%) | 16 (80.0%) |
| 35 to 44 Years | 13 (46.4%) | 21 (75.0%) |
| 45 to 54 Years | 7 (33.3%) | 4 (19.1%) |
| 55 to 64 Years | 1 (10.0%) | 7 (70.0%) |
| 65 to 74 Years | 24 (100.0%) | 22 (91.7%) |
| 75 Years and over | 25 (89.3%) | 16 (57.1%) |
| Total | 137 (52.7%) | 117 (45.0%) |
Disability Status by Sex by Age in West Sullivan
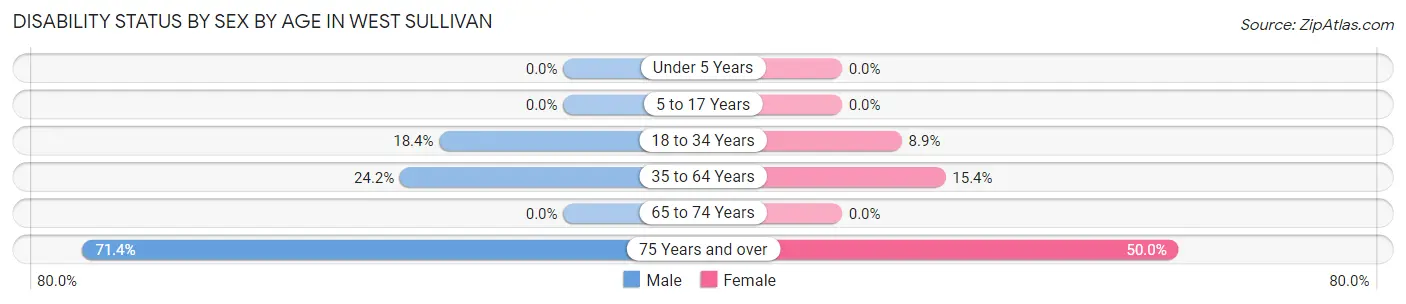
| Age Bracket | Male | Female |
| Under 5 Years | 0 (0.0%) | 0 (0.0%) |
| 5 to 17 Years | 0 (0.0%) | 0 (0.0%) |
| 18 to 34 Years | 7 (18.4%) | 4 (8.9%) |
| 35 to 64 Years | 8 (24.2%) | 4 (15.4%) |
| 65 to 74 Years | 0 (0.0%) | 0 (0.0%) |
| 75 Years and over | 10 (71.4%) | 7 (50.0%) |
Disability Class by Sex by Age in West Sullivan
Disability Class: Hearing Difficulty
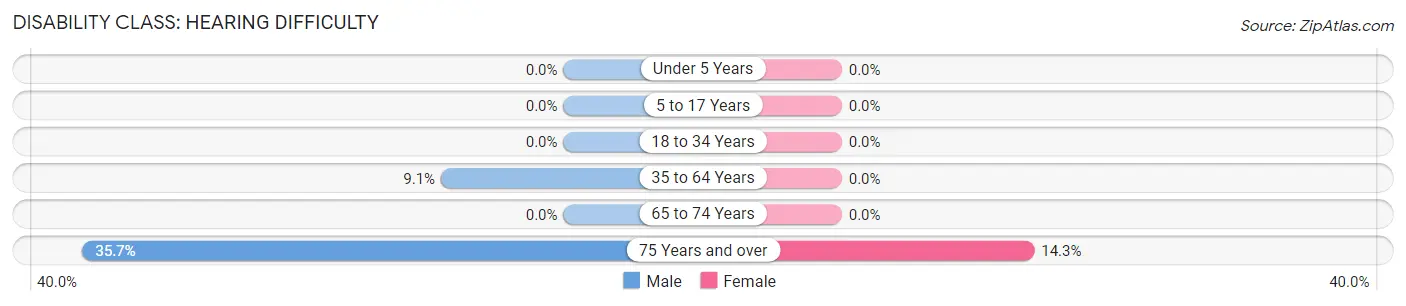
| Age Bracket | Male | Female |
| Under 5 Years | 0 (0.0%) | 0 (0.0%) |
| 5 to 17 Years | 0 (0.0%) | 0 (0.0%) |
| 18 to 34 Years | 0 (0.0%) | 0 (0.0%) |
| 35 to 64 Years | 3 (9.1%) | 0 (0.0%) |
| 65 to 74 Years | 0 (0.0%) | 0 (0.0%) |
| 75 Years and over | 5 (35.7%) | 2 (14.3%) |
Disability Class: Vision Difficulty
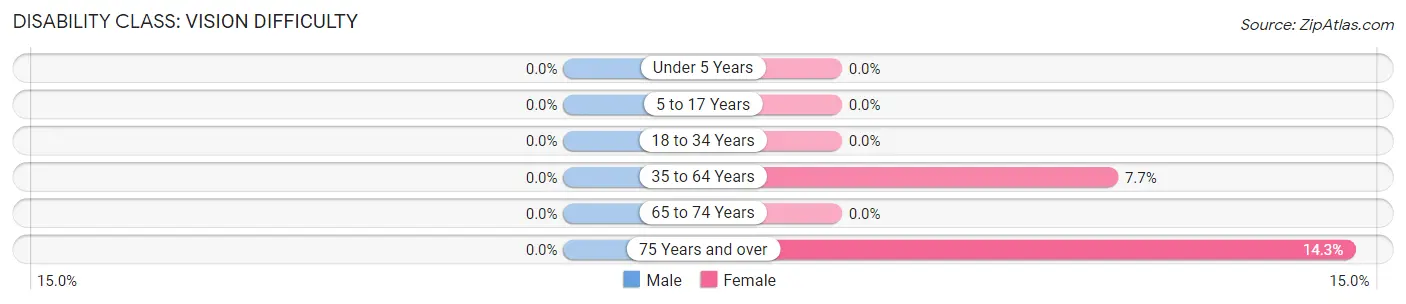
| Age Bracket | Male | Female |
| Under 5 Years | 0 (0.0%) | 0 (0.0%) |
| 5 to 17 Years | 0 (0.0%) | 0 (0.0%) |
| 18 to 34 Years | 0 (0.0%) | 0 (0.0%) |
| 35 to 64 Years | 0 (0.0%) | 2 (7.7%) |
| 65 to 74 Years | 0 (0.0%) | 0 (0.0%) |
| 75 Years and over | 0 (0.0%) | 2 (14.3%) |
Disability Class: Cognitive Difficulty
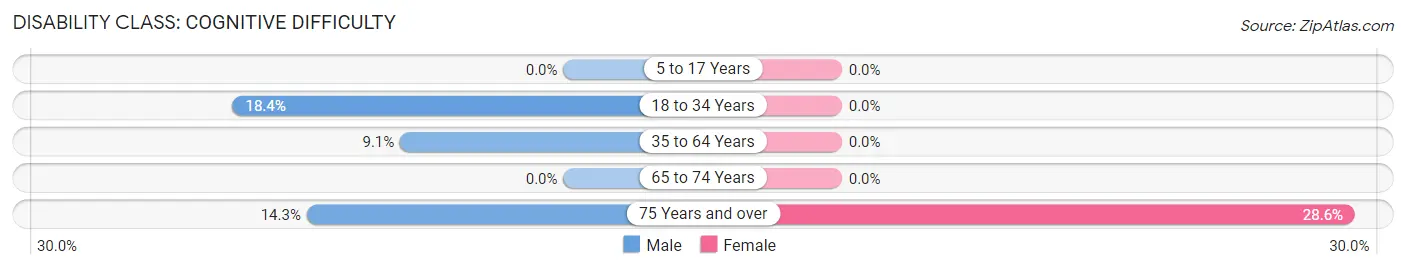
| Age Bracket | Male | Female |
| 5 to 17 Years | 0 (0.0%) | 0 (0.0%) |
| 18 to 34 Years | 7 (18.4%) | 0 (0.0%) |
| 35 to 64 Years | 3 (9.1%) | 0 (0.0%) |
| 65 to 74 Years | 0 (0.0%) | 0 (0.0%) |
| 75 Years and over | 2 (14.3%) | 4 (28.6%) |
Disability Class: Ambulatory Difficulty
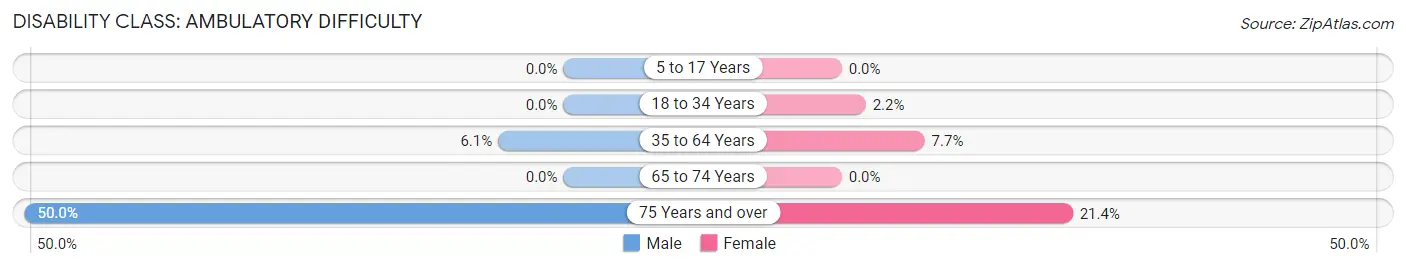
| Age Bracket | Male | Female |
| 5 to 17 Years | 0 (0.0%) | 0 (0.0%) |
| 18 to 34 Years | 0 (0.0%) | 1 (2.2%) |
| 35 to 64 Years | 2 (6.1%) | 2 (7.7%) |
| 65 to 74 Years | 0 (0.0%) | 0 (0.0%) |
| 75 Years and over | 7 (50.0%) | 3 (21.4%) |
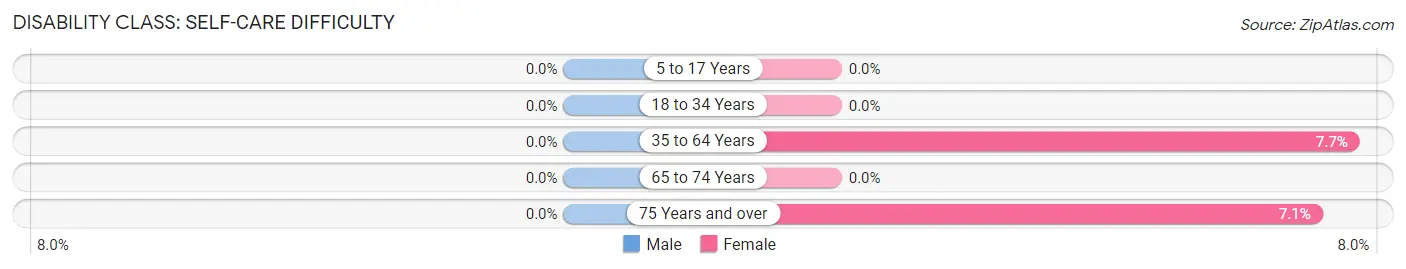
Disability Class: Self-Care Difficulty
| Age Bracket | Male | Female |
| 5 to 17 Years | 0 (0.0%) | 0 (0.0%) |
| 18 to 34 Years | 0 (0.0%) | 0 (0.0%) |
| 35 to 64 Years | 0 (0.0%) | 2 (7.7%) |
| 65 to 74 Years | 0 (0.0%) | 0 (0.0%) |
| 75 Years and over | 0 (0.0%) | 1 (7.1%) |
Technology Access in West Sullivan
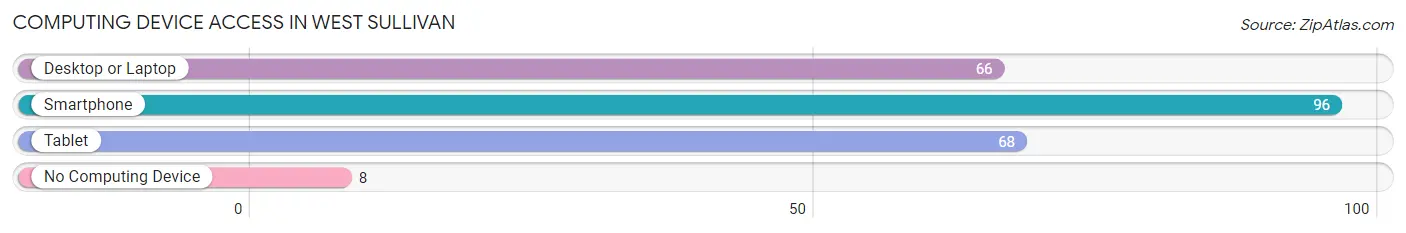
Computing Device Access in West Sullivan
| Device Type | # Households | % Households |
| Desktop or Laptop | 66 | 63.5% |
| Smartphone | 96 | 92.3% |
| Tablet | 68 | 65.4% |
| No Computing Device | 8 | 7.7% |
| Total | 104 | 100.0% |
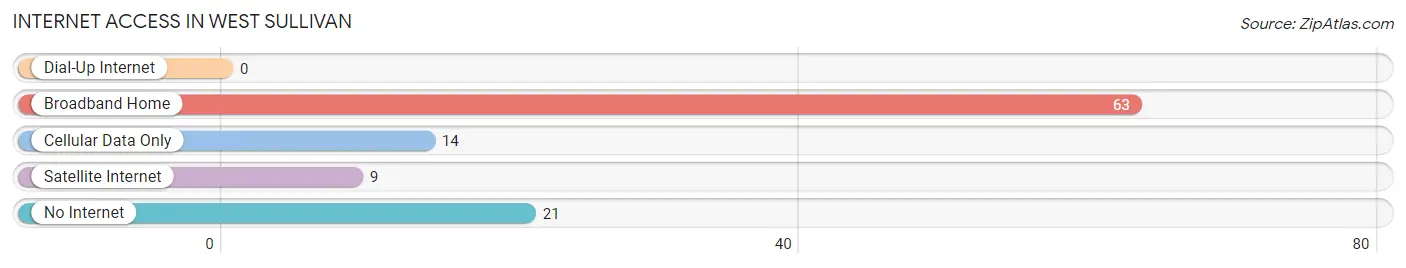
Internet Access in West Sullivan
| Internet Type | # Households | % Households |
| Dial-Up Internet | 0 | 0.0% |
| Broadband Home | 63 | 60.6% |
| Cellular Data Only | 14 | 13.5% |
| Satellite Internet | 9 | 8.6% |
| No Internet | 21 | 20.2% |
| Total | 104 | 100.0% |
West Sullivan Summary
Sullivan, Missouri is a small town located in the eastern part of the state, in Franklin County. It is situated on the banks of the Meramec River, and is part of the St. Louis metropolitan area. The town was founded in 1845 and has a population of approximately 2,500 people.
History
Sullivan was founded in 1845 by a group of settlers from Sullivan County, Tennessee. The town was named after the county in Tennessee, and was originally known as “New Sullivan”. The town was incorporated in 1851, and the first post office was established in 1852.
The town grew slowly, but steadily, and by the late 19th century, it had become a thriving agricultural center. The town was also home to several businesses, including a flour mill, a sawmill, a brickyard, and a furniture factory.
In the early 20th century, Sullivan began to experience a period of growth and prosperity. The town was connected to the St. Louis metropolitan area by the St. Louis and San Francisco Railroad, and the population began to increase. By the mid-20th century, Sullivan had become a popular tourist destination, and the town was home to several resorts and hotels.
Geography
Sullivan is located in the eastern part of Missouri, in Franklin County. It is situated on the banks of the Meramec River, and is part of the St. Louis metropolitan area. The town is located approximately 40 miles south of St. Louis, and is bordered by the towns of Union, Washington, and Pacific.
The town has a total area of 2.2 square miles, all of which is land. The terrain is mostly flat, with some rolling hills in the surrounding area. The climate is humid subtropical, with hot, humid summers and cold, wet winters.
Economy
Sullivan’s economy is largely based on agriculture and tourism. The town is home to several farms, and the surrounding area is known for its production of corn, soybeans, and hay. The town is also home to several businesses, including a furniture factory, a sawmill, and a brickyard.
Tourism is also an important part of the local economy. The town is home to several resorts and hotels, and is a popular destination for outdoor activities such as fishing, hunting, and camping.
Demographics
As of the 2010 census, Sullivan had a population of 2,500 people. The racial makeup of the town was 97.2% White, 0.8% African American, 0.4% Native American, 0.4% Asian, and 0.2% from other races. Hispanic or Latino of any race were 1.2% of the population.
The median household income in Sullivan was $37,500, and the median family income was $45,000. The per capita income was $19,000. About 11.2% of families and 14.2% of the population were below the poverty line, including 18.2% of those under age 18 and 8.2% of those age 65 or over.
Common Questions
What is Per Capita Income in West Sullivan?
Per Capita income in West Sullivan is $16,915.
What is the Median Family Income in West Sullivan?
Median Family Income in West Sullivan is $45,833.
What is the Median Household income in West Sullivan?
Median Household Income in West Sullivan is $38,750.
What is Income or Wage Gap in West Sullivan?
Income or Wage Gap in West Sullivan is 48.9%.
Women in West Sullivan earn 51.1 cents for every dollar earned by a man.
What is Inequality or Gini Index in West Sullivan?
Inequality or Gini Index in West Sullivan is 0.34.
What is the Total Population of West Sullivan?
Total Population of West Sullivan is 260.
What is the Total Male Population of West Sullivan?
Total Male Population of West Sullivan is 131.
What is the Total Female Population of West Sullivan?
Total Female Population of West Sullivan is 129.
What is the Ratio of Males per 100 Females in West Sullivan?
There are 101.55 Males per 100 Females in West Sullivan.
What is the Ratio of Females per 100 Males in West Sullivan?
There are 98.47 Females per 100 Males in West Sullivan.
What is the Median Population Age in West Sullivan?
Median Population Age in West Sullivan is 26.1 Years.
What is the Average Family Size in West Sullivan
Average Family Size in West Sullivan is 2.5 People.
What is the Average Household Size in West Sullivan
Average Household Size in West Sullivan is 2.5 People.
How Large is the Labor Force in West Sullivan?
There are 112 People in the Labor Forcein in West Sullivan.
What is the Percentage of People in the Labor Force in West Sullivan?
56.9% of People are in the Labor Force in West Sullivan.
What is the Unemployment Rate in West Sullivan?
Unemployment Rate in West Sullivan is 13.4%.