New Haven, MO Map & Demographics
New Haven Map
New Haven Overview
$31,171
PER CAPITA INCOME
$67,266
AVG FAMILY INCOME
$66,410
AVG HOUSEHOLD INCOME
31.9%
WAGE / INCOME GAP [ % ]
68.1¢/ $1
WAGE / INCOME GAP [ $ ]
0.44
INEQUALITY / GINI INDEX
3,363
TOTAL POPULATION
1,747
MALE POPULATION
1,616
FEMALE POPULATION
108.11
MALES / 100 FEMALES
92.50
FEMALES / 100 MALES
31.2
MEDIAN AGE
3.5
AVG FAMILY SIZE
3.1
AVG HOUSEHOLD SIZE
1,529
LABOR FORCE [ PEOPLE ]
61.8%
PERCENT IN LABOR FORCE
4.6%
UNEMPLOYMENT RATE
New Haven Zip Codes
Income in New Haven
Income Overview in New Haven
Per Capita Income in New Haven is $31,171, while median incomes of families and households are $67,266 and $66,410 respectively.
| Characteristic | Number | Measure |
| Per Capita Income | 3,363 | $31,171 |
| Median Family Income | 856 | $67,266 |
| Mean Family Income | 856 | $95,887 |
| Median Household Income | 1,028 | $66,410 |
| Mean Household Income | 1,028 | $91,173 |
| Income Deficit | 856 | $0 |
| Wage / Income Gap (%) | 3,363 | 31.89% |
| Wage / Income Gap ($) | 3,363 | 68.11¢ per $1 |
| Gini / Inequality Index | 3,363 | 0.44 |
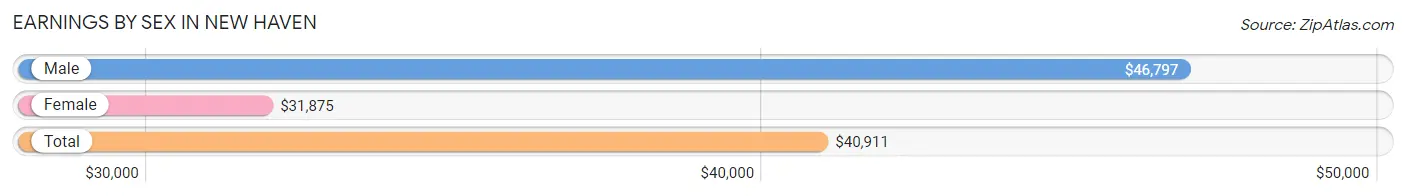
Earnings by Sex in New Haven
Average Earnings in New Haven are $40,911, $46,797 for men and $31,875 for women, a difference of 31.9%.
| Sex | Number | Average Earnings |
| Male | 815 (53.9%) | $46,797 |
| Female | 696 (46.1%) | $31,875 |
| Total | 1,511 (100.0%) | $40,911 |
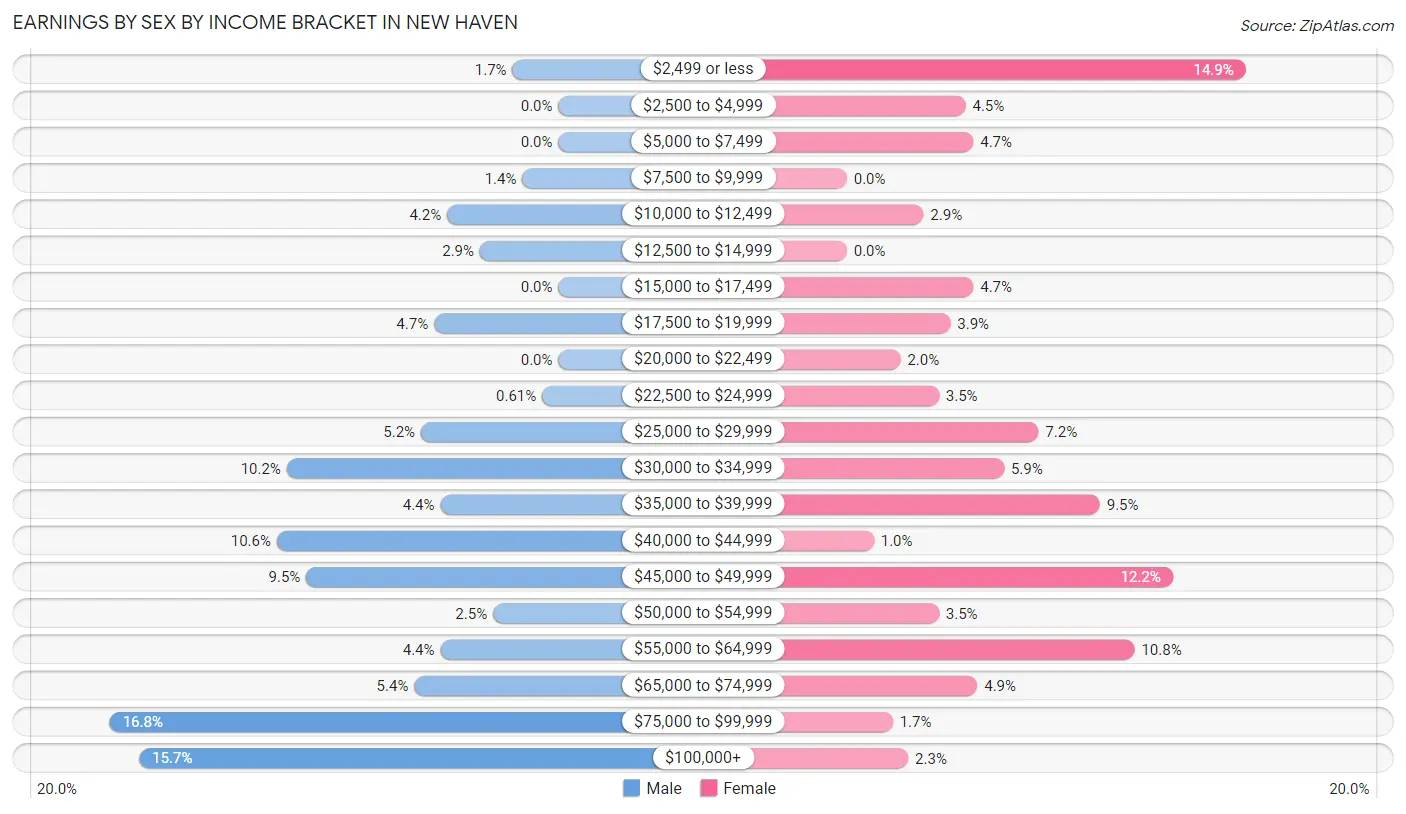
Earnings by Sex by Income Bracket in New Haven
The most common earnings brackets in New Haven are $75,000 to $99,999 for men (137 | 16.8%) and $2,499 or less for women (104 | 14.9%).
| Income | Male | Female |
| $2,499 or less | 14 (1.7%) | 104 (14.9%) |
| $2,500 to $4,999 | 0 (0.0%) | 31 (4.4%) |
| $5,000 to $7,499 | 0 (0.0%) | 33 (4.7%) |
| $7,500 to $9,999 | 11 (1.3%) | 0 (0.0%) |
| $10,000 to $12,499 | 34 (4.2%) | 20 (2.9%) |
| $12,500 to $14,999 | 24 (2.9%) | 0 (0.0%) |
| $15,000 to $17,499 | 0 (0.0%) | 33 (4.7%) |
| $17,500 to $19,999 | 38 (4.7%) | 27 (3.9%) |
| $20,000 to $22,499 | 0 (0.0%) | 14 (2.0%) |
| $22,500 to $24,999 | 5 (0.6%) | 24 (3.5%) |
| $25,000 to $29,999 | 42 (5.1%) | 50 (7.2%) |
| $30,000 to $34,999 | 83 (10.2%) | 41 (5.9%) |
| $35,000 to $39,999 | 36 (4.4%) | 66 (9.5%) |
| $40,000 to $44,999 | 86 (10.5%) | 7 (1.0%) |
| $45,000 to $49,999 | 77 (9.5%) | 85 (12.2%) |
| $50,000 to $54,999 | 20 (2.5%) | 24 (3.5%) |
| $55,000 to $64,999 | 36 (4.4%) | 75 (10.8%) |
| $65,000 to $74,999 | 44 (5.4%) | 34 (4.9%) |
| $75,000 to $99,999 | 137 (16.8%) | 12 (1.7%) |
| $100,000+ | 128 (15.7%) | 16 (2.3%) |
| Total | 815 (100.0%) | 696 (100.0%) |
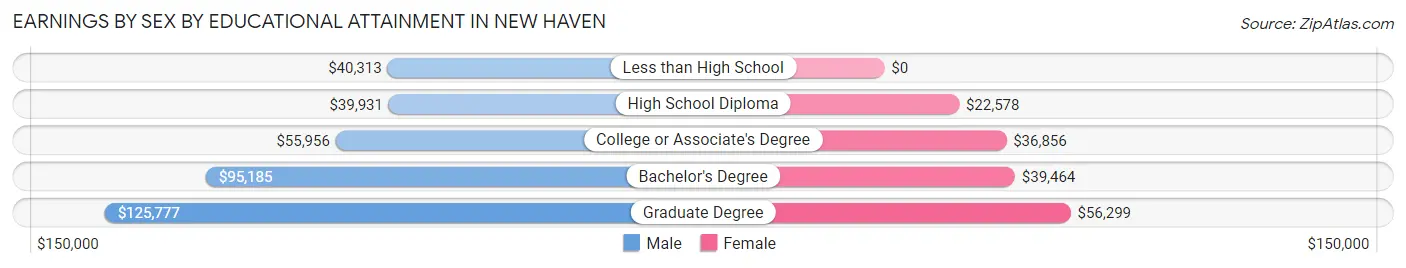
Earnings by Sex by Educational Attainment in New Haven
Average earnings in New Haven are $54,063 for men and $37,576 for women, a difference of 30.5%. Men with an educational attainment of graduate degree enjoy the highest average annual earnings of $125,777, while those with high school diploma education earn the least with $39,931. Women with an educational attainment of graduate degree earn the most with the average annual earnings of $56,299, while those with high school diploma education have the smallest earnings of $22,578.
| Educational Attainment | Male Income | Female Income |
| Less than High School | $40,313 | $0 |
| High School Diploma | $39,931 | $22,578 |
| College or Associate's Degree | $55,956 | $36,856 |
| Bachelor's Degree | $95,185 | $39,464 |
| Graduate Degree | $125,777 | $56,299 |
| Total | $54,063 | $37,576 |
Family Income in New Haven
Family Income Brackets in New Haven
According to the New Haven family income data, there are 240 families falling into the $50,000 to $74,999 income range, which is the most common income bracket and makes up 28.0% of all families.
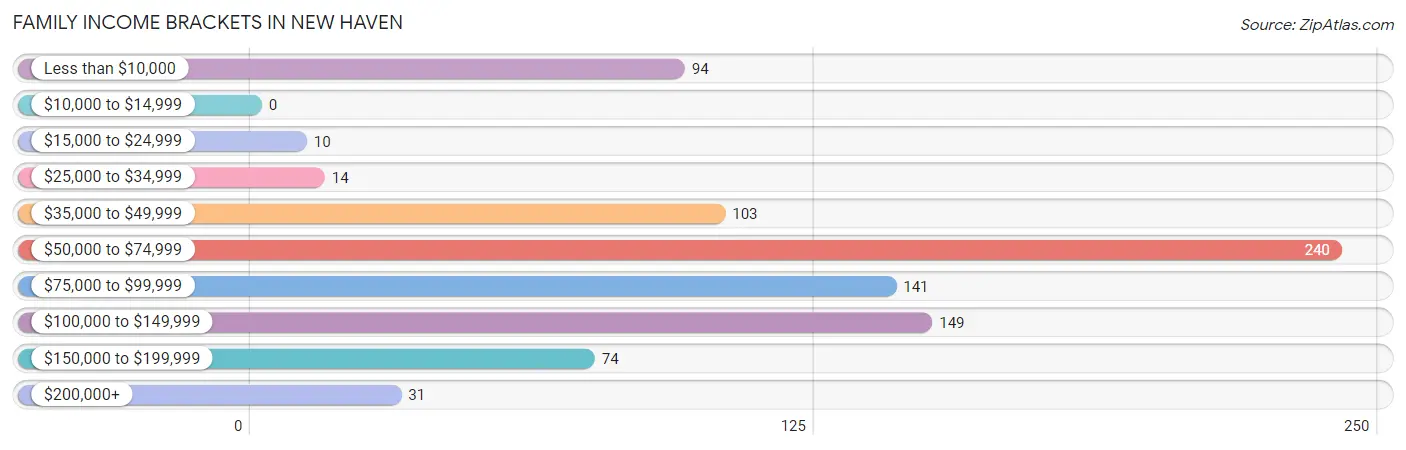
| Income Bracket | # Families | % Families |
| Less than $10,000 | 94 | 11.0% |
| $10,000 to $14,999 | 0 | 0.0% |
| $15,000 to $24,999 | 10 | 1.2% |
| $25,000 to $34,999 | 14 | 1.6% |
| $35,000 to $49,999 | 103 | 12.0% |
| $50,000 to $74,999 | 240 | 28.0% |
| $75,000 to $99,999 | 141 | 16.5% |
| $100,000 to $149,999 | 149 | 17.4% |
| $150,000 to $199,999 | 74 | 8.6% |
| $200,000+ | 31 | 3.6% |
Family Income by Famaliy Size in New Haven
4-person families (159 | 18.6%) account for the highest median family income in New Haven with $125,078 per family, while 2-person families (392 | 45.8%) have the highest median income of $33,138 per family member.
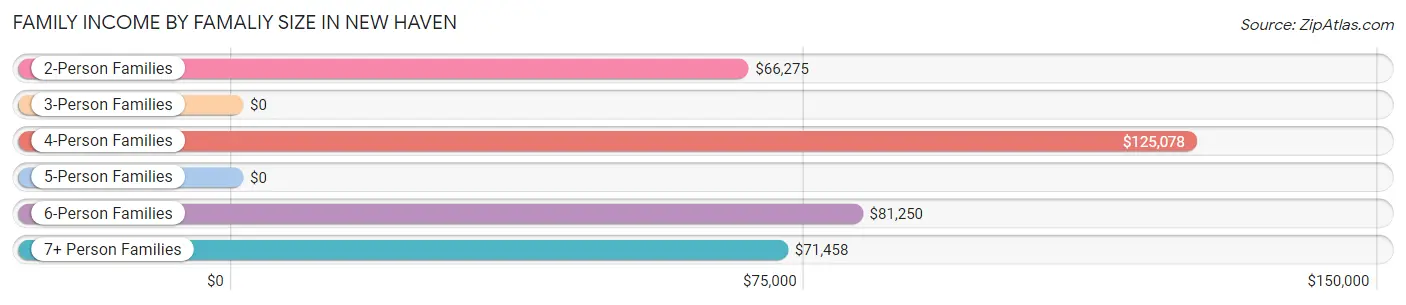
| Income Bracket | # Families | Median Income |
| 2-Person Families | 392 (45.8%) | $66,275 |
| 3-Person Families | 221 (25.8%) | $0 |
| 4-Person Families | 159 (18.6%) | $125,078 |
| 5-Person Families | 5 (0.6%) | $0 |
| 6-Person Families | 57 (6.7%) | $81,250 |
| 7+ Person Families | 22 (2.6%) | $71,458 |
| Total | 856 (100.0%) | $67,266 |
Family Income by Number of Earners in New Haven
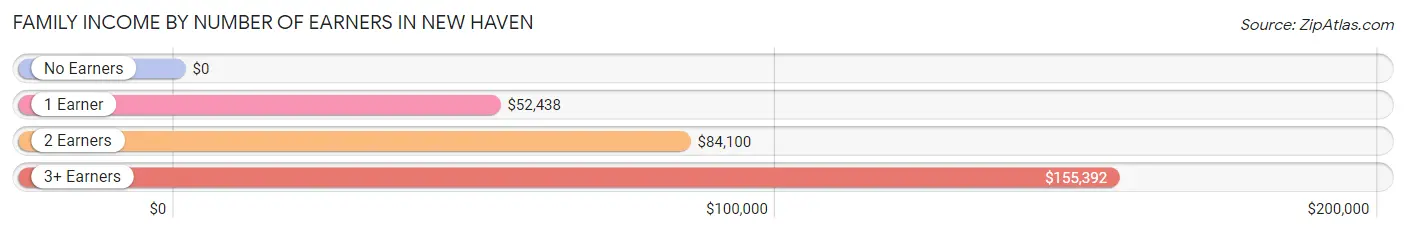
| Number of Earners | # Families | Median Income |
| No Earners | 207 (24.2%) | $0 |
| 1 Earner | 251 (29.3%) | $52,438 |
| 2 Earners | 292 (34.1%) | $84,100 |
| 3+ Earners | 106 (12.4%) | $155,392 |
| Total | 856 (100.0%) | $67,266 |
Household Income in New Haven
Household Income Brackets in New Haven
With 232 households falling in the category, the $50,000 to $74,999 income range is the most frequent in New Haven, accounting for 22.6% of all households. In contrast, only 7 households (0.7%) fall into the $10,000 to $14,999 income bracket, making it the least populous group.
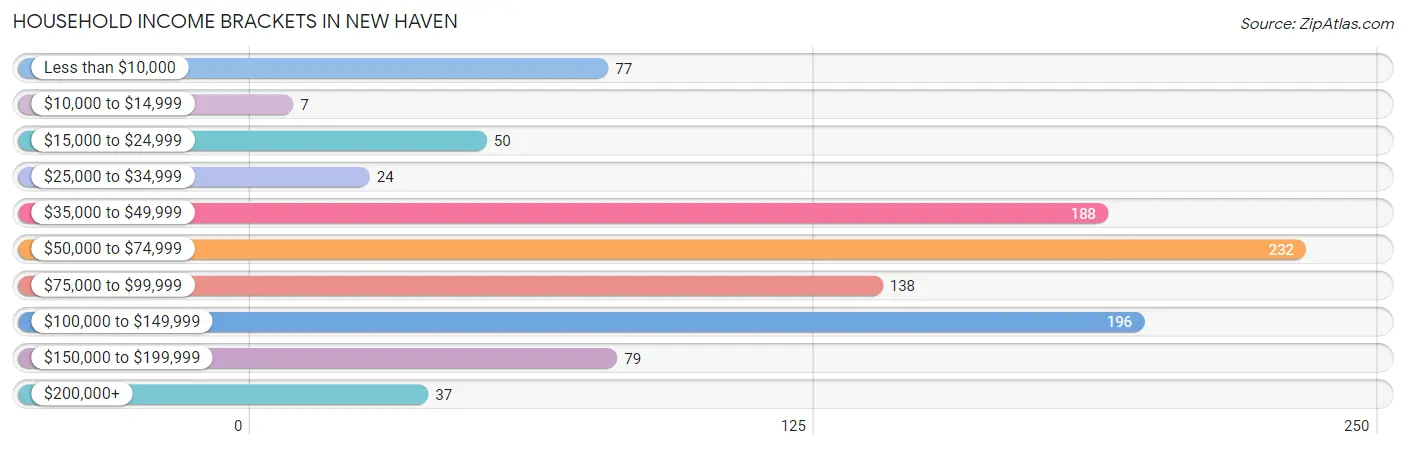
| Income Bracket | # Households | % Households |
| Less than $10,000 | 77 | 7.5% |
| $10,000 to $14,999 | 7 | 0.7% |
| $15,000 to $24,999 | 50 | 4.9% |
| $25,000 to $34,999 | 24 | 2.3% |
| $35,000 to $49,999 | 188 | 18.3% |
| $50,000 to $74,999 | 232 | 22.6% |
| $75,000 to $99,999 | 138 | 13.4% |
| $100,000 to $149,999 | 196 | 19.1% |
| $150,000 to $199,999 | 79 | 7.7% |
| $200,000+ | 37 | 3.6% |
Household Income by Householder Age in New Haven
The median household income in New Haven is $66,410, with the highest median household income of $67,614 found in the 45 to 64 years age bracket for the primary householder. A total of 425 households (41.3%) fall into this category.
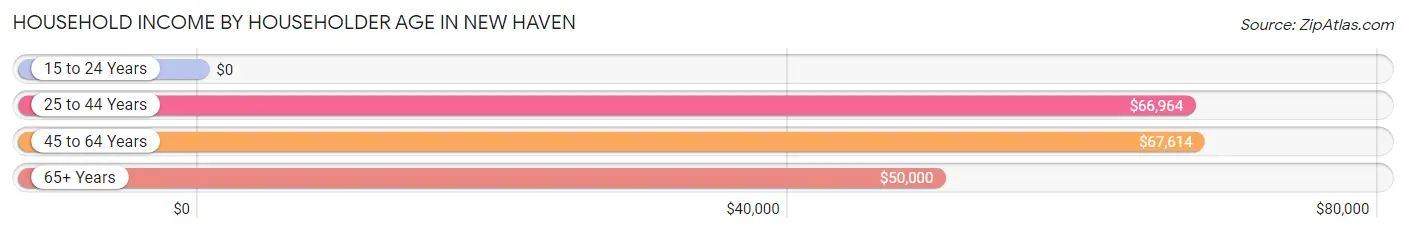
| Income Bracket | # Households | Median Income |
| 15 to 24 Years | 0 (0.0%) | $0 |
| 25 to 44 Years | 443 (43.1%) | $66,964 |
| 45 to 64 Years | 425 (41.3%) | $67,614 |
| 65+ Years | 160 (15.6%) | $50,000 |
| Total | 1,028 (100.0%) | $66,410 |
Poverty in New Haven
Income Below Poverty by Sex and Age in New Haven
With 13.7% poverty level for males and 12.8% for females among the residents of New Haven, 16 and 17 year old males and under 5 year old females are the most vulnerable to poverty, with 61 males (56.0%) and 37 females (30.3%) in their respective age groups living below the poverty level.
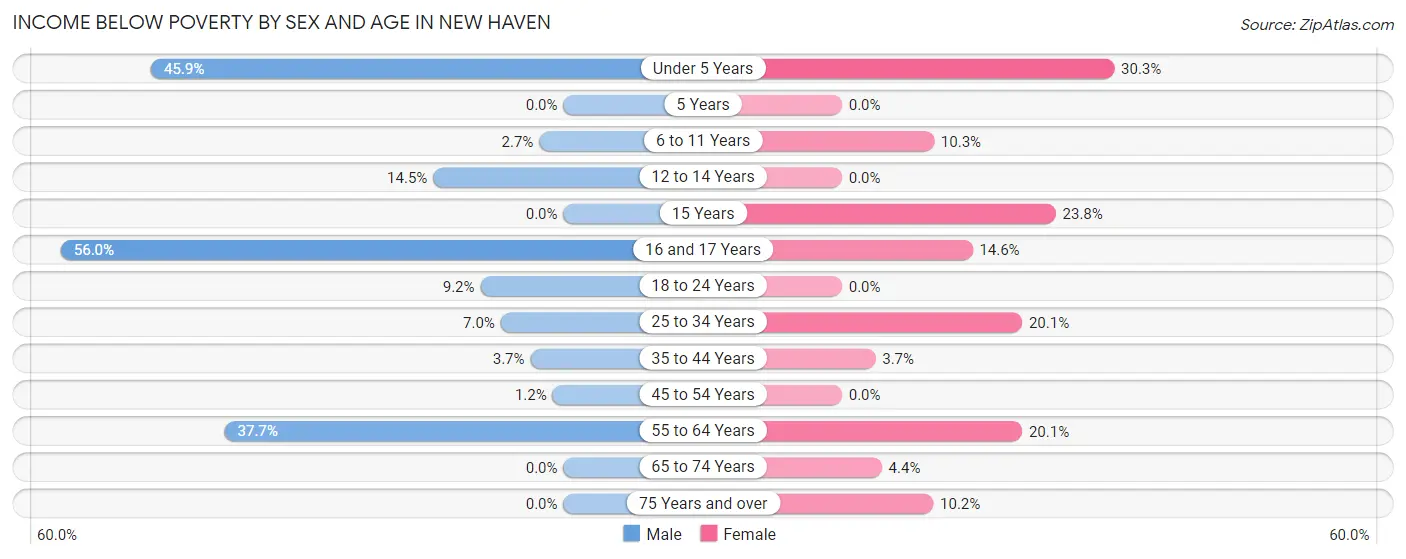
| Age Bracket | Male | Female |
| Under 5 Years | 45 (45.9%) | 37 (30.3%) |
| 5 Years | 0 (0.0%) | 0 (0.0%) |
| 6 to 11 Years | 7 (2.7%) | 16 (10.3%) |
| 12 to 14 Years | 19 (14.5%) | 0 (0.0%) |
| 15 Years | 0 (0.0%) | 5 (23.8%) |
| 16 and 17 Years | 61 (56.0%) | 8 (14.5%) |
| 18 to 24 Years | 11 (9.2%) | 0 (0.0%) |
| 25 to 34 Years | 15 (7.0%) | 61 (20.1%) |
| 35 to 44 Years | 9 (3.7%) | 6 (3.7%) |
| 45 to 54 Years | 2 (1.2%) | 0 (0.0%) |
| 55 to 64 Years | 63 (37.7%) | 56 (20.1%) |
| 65 to 74 Years | 0 (0.0%) | 4 (4.4%) |
| 75 Years and over | 0 (0.0%) | 6 (10.2%) |
| Total | 232 (13.7%) | 199 (12.8%) |
Income Above Poverty by Sex and Age in New Haven
According to the poverty statistics in New Haven, males aged 15 years and females aged 5 years are the age groups that are most secure financially, with 100.0% of males and 100.0% of females in these age groups living above the poverty line.
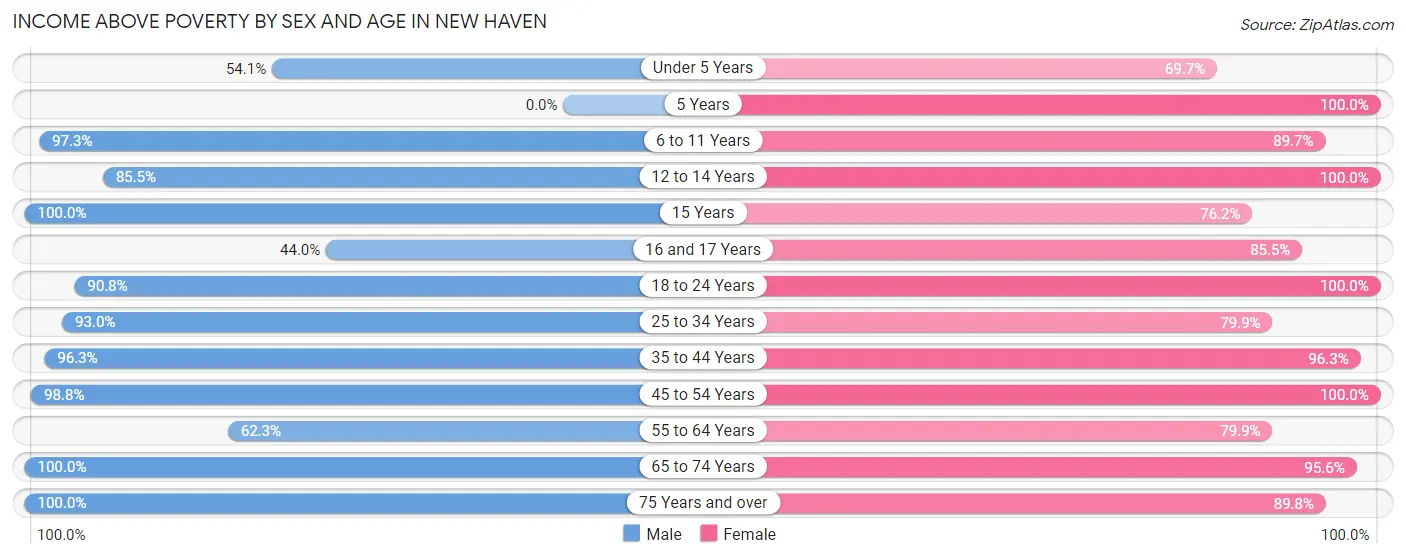
| Age Bracket | Male | Female |
| Under 5 Years | 53 (54.1%) | 85 (69.7%) |
| 5 Years | 0 (0.0%) | 10 (100.0%) |
| 6 to 11 Years | 253 (97.3%) | 140 (89.7%) |
| 12 to 14 Years | 112 (85.5%) | 56 (100.0%) |
| 15 Years | 35 (100.0%) | 16 (76.2%) |
| 16 and 17 Years | 48 (44.0%) | 47 (85.5%) |
| 18 to 24 Years | 108 (90.8%) | 136 (100.0%) |
| 25 to 34 Years | 200 (93.0%) | 243 (79.9%) |
| 35 to 44 Years | 236 (96.3%) | 155 (96.3%) |
| 45 to 54 Years | 164 (98.8%) | 104 (100.0%) |
| 55 to 64 Years | 104 (62.3%) | 223 (79.9%) |
| 65 to 74 Years | 123 (100.0%) | 86 (95.6%) |
| 75 Years and over | 22 (100.0%) | 53 (89.8%) |
| Total | 1,458 (86.3%) | 1,354 (87.2%) |
Income Below Poverty Among Married-Couple Families in New Haven
The poverty statistics for married-couple families in New Haven show that 11.2% or 75 of the total 671 families live below the poverty line. Families with 3 or 4 children have the highest poverty rate of 28.6%, comprising of 16 families. On the other hand, families with no children have the lowest poverty rate of 0.0%, which includes 0 families.
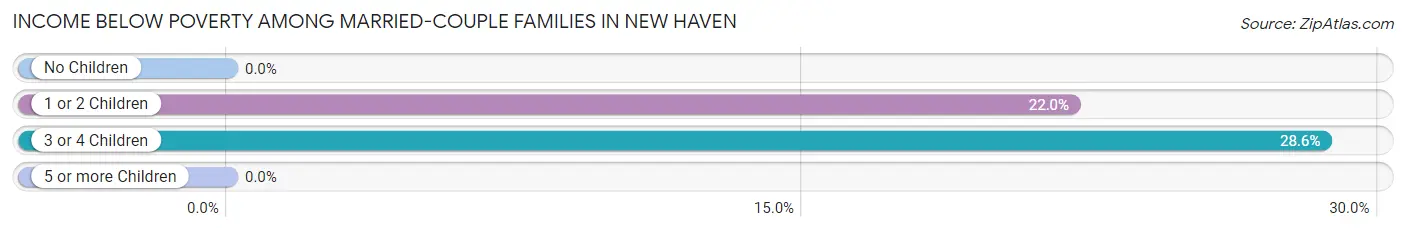
| Children | Above Poverty | Below Poverty |
| No Children | 335 (100.0%) | 0 (0.0%) |
| 1 or 2 Children | 209 (78.0%) | 59 (22.0%) |
| 3 or 4 Children | 40 (71.4%) | 16 (28.6%) |
| 5 or more Children | 12 (100.0%) | 0 (0.0%) |
| Total | 596 (88.8%) | 75 (11.2%) |
Income Below Poverty Among Single-Parent Households in New Haven
According to the poverty data in New Haven, 18.6% or 13 single-father households and 24.3% or 28 single-mother households are living below the poverty line. Among single-father households, those with 1 or 2 children have the highest poverty rate, with 9 households (25.0%) experiencing poverty. Likewise, among single-mother households, those with 1 or 2 children have the highest poverty rate, with 28 households (39.4%) falling below the poverty line.
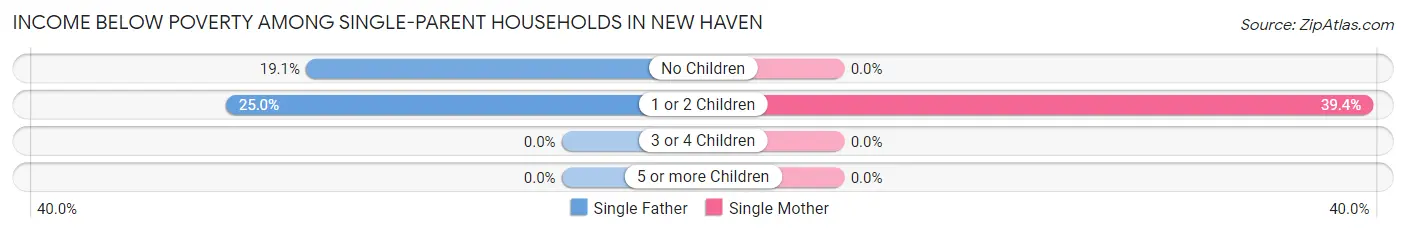
| Children | Single Father | Single Mother |
| No Children | 4 (19.1%) | 0 (0.0%) |
| 1 or 2 Children | 9 (25.0%) | 28 (39.4%) |
| 3 or 4 Children | 0 (0.0%) | 0 (0.0%) |
| 5 or more Children | 0 (0.0%) | 0 (0.0%) |
| Total | 13 (18.6%) | 28 (24.3%) |
Income Below Poverty Among Married-Couple vs Single-Parent Households in New Haven
The poverty data for New Haven shows that 75 of the married-couple family households (11.2%) and 41 of the single-parent households (22.2%) are living below the poverty level. Within the married-couple family households, those with 3 or 4 children have the highest poverty rate, with 16 households (28.6%) falling below the poverty line. Among the single-parent households, those with 1 or 2 children have the highest poverty rate, with 37 household (34.6%) living below poverty.
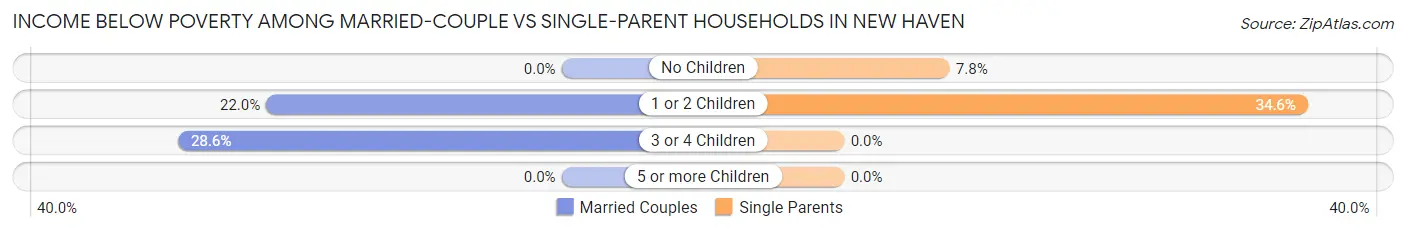
| Children | Married-Couple Families | Single-Parent Households |
| No Children | 0 (0.0%) | 4 (7.8%) |
| 1 or 2 Children | 59 (22.0%) | 37 (34.6%) |
| 3 or 4 Children | 16 (28.6%) | 0 (0.0%) |
| 5 or more Children | 0 (0.0%) | 0 (0.0%) |
| Total | 75 (11.2%) | 41 (22.2%) |
Race in New Haven
The most populous races in New Haven are White / Caucasian (2,866 | 85.2%), Hispanic or Latino (290 | 8.6%), and Two or more Races (254 | 7.5%).
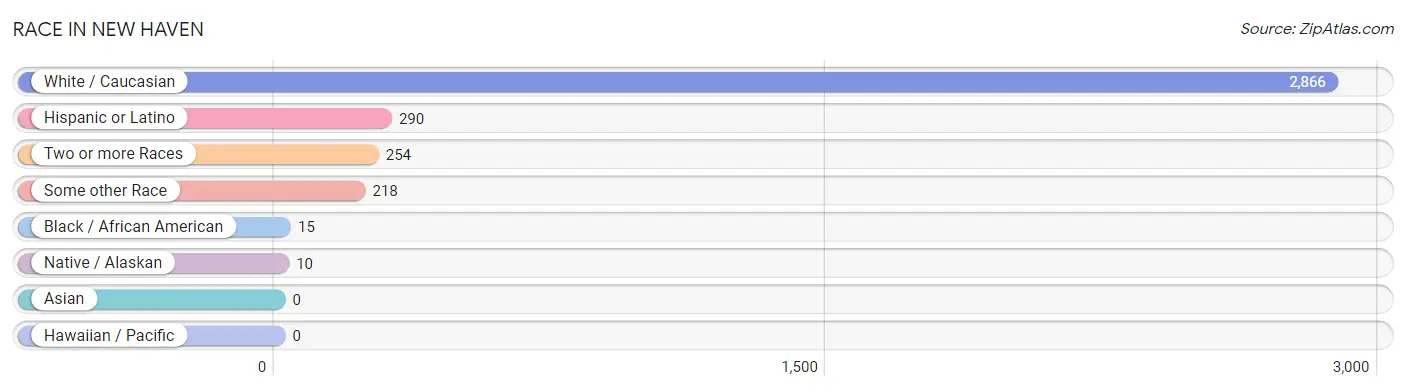
| Race | # Population | % Population |
| Asian | 0 | 0.0% |
| Black / African American | 15 | 0.4% |
| Hawaiian / Pacific | 0 | 0.0% |
| Hispanic or Latino | 290 | 8.6% |
| Native / Alaskan | 10 | 0.3% |
| White / Caucasian | 2,866 | 85.2% |
| Two or more Races | 254 | 7.5% |
| Some other Race | 218 | 6.5% |
| Total | 3,363 | 100.0% |
Ancestry in New Haven
The most populous ancestries reported in New Haven are German (1,394 | 41.4%), Irish (410 | 12.2%), English (372 | 11.1%), Mexican (266 | 7.9%), and Italian (69 | 2.1%), together accounting for 74.7% of all New Haven residents.
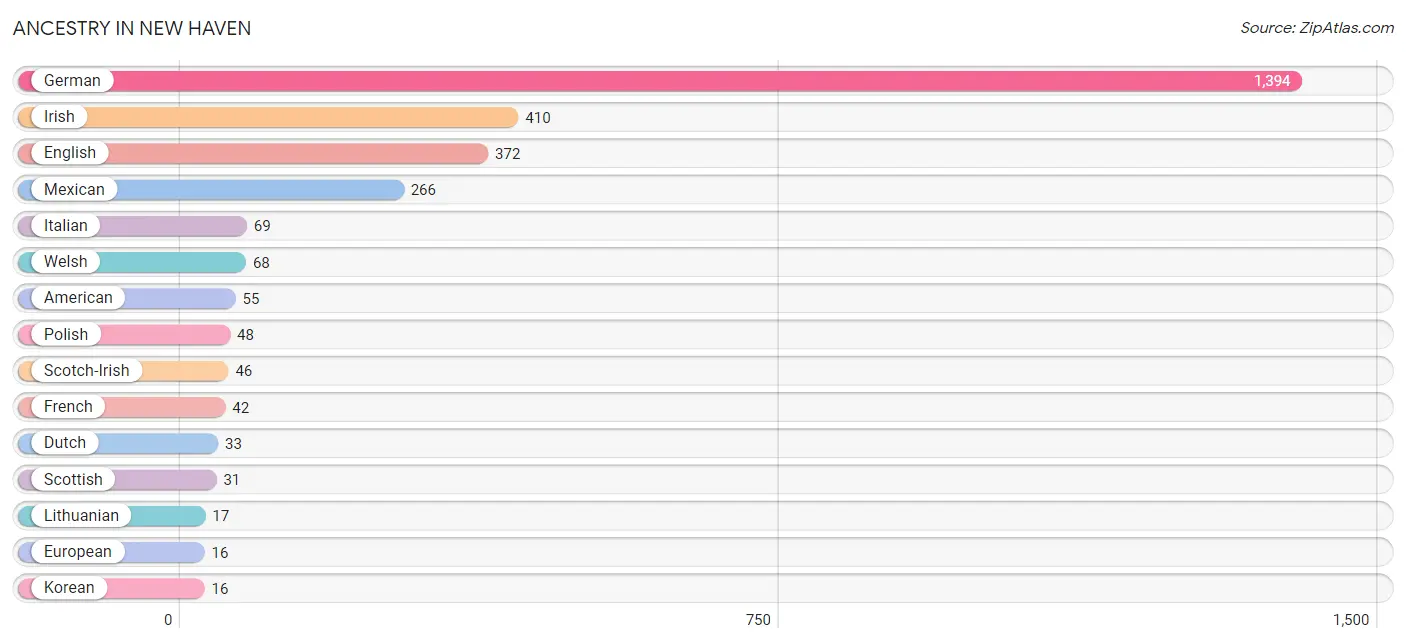
| Ancestry | # Population | % Population |
| American | 55 | 1.6% |
| Australian | 5 | 0.2% |
| Cherokee | 10 | 0.3% |
| Cuban | 12 | 0.4% |
| Czech | 15 | 0.4% |
| Danish | 6 | 0.2% |
| Dutch | 33 | 1.0% |
| English | 372 | 11.1% |
| European | 16 | 0.5% |
| French | 42 | 1.3% |
| German | 1,394 | 41.4% |
| Irish | 410 | 12.2% |
| Italian | 69 | 2.1% |
| Korean | 16 | 0.5% |
| Lithuanian | 17 | 0.5% |
| Mexican | 266 | 7.9% |
| Polish | 48 | 1.4% |
| Pueblo | 4 | 0.1% |
| Russian | 7 | 0.2% |
| Scandinavian | 5 | 0.2% |
| Scotch-Irish | 46 | 1.4% |
| Scottish | 31 | 0.9% |
| Sioux | 1 | 0.0% |
| Spanish | 12 | 0.4% |
| Tlingit-Haida | 5 | 0.2% |
| Welsh | 68 | 2.0% | View All 26 Rows |
Immigrants in New Haven
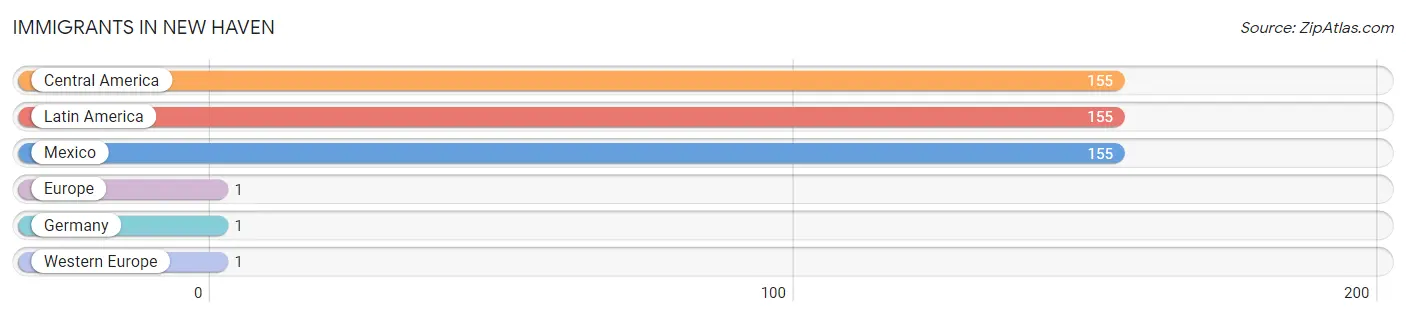
The most numerous immigrant groups reported in New Haven came from Central America (155 | 4.6%), Latin America (155 | 4.6%), Mexico (155 | 4.6%), Europe (1 | 0.0%), and Germany (1 | 0.0%), together accounting for 13.9% of all New Haven residents.
| Immigration Origin | # Population | % Population |
| Central America | 155 | 4.6% |
| Europe | 1 | 0.0% |
| Germany | 1 | 0.0% |
| Latin America | 155 | 4.6% |
| Mexico | 155 | 4.6% |
| Western Europe | 1 | 0.0% | View All 6 Rows |
Sex and Age in New Haven
Sex and Age in New Haven
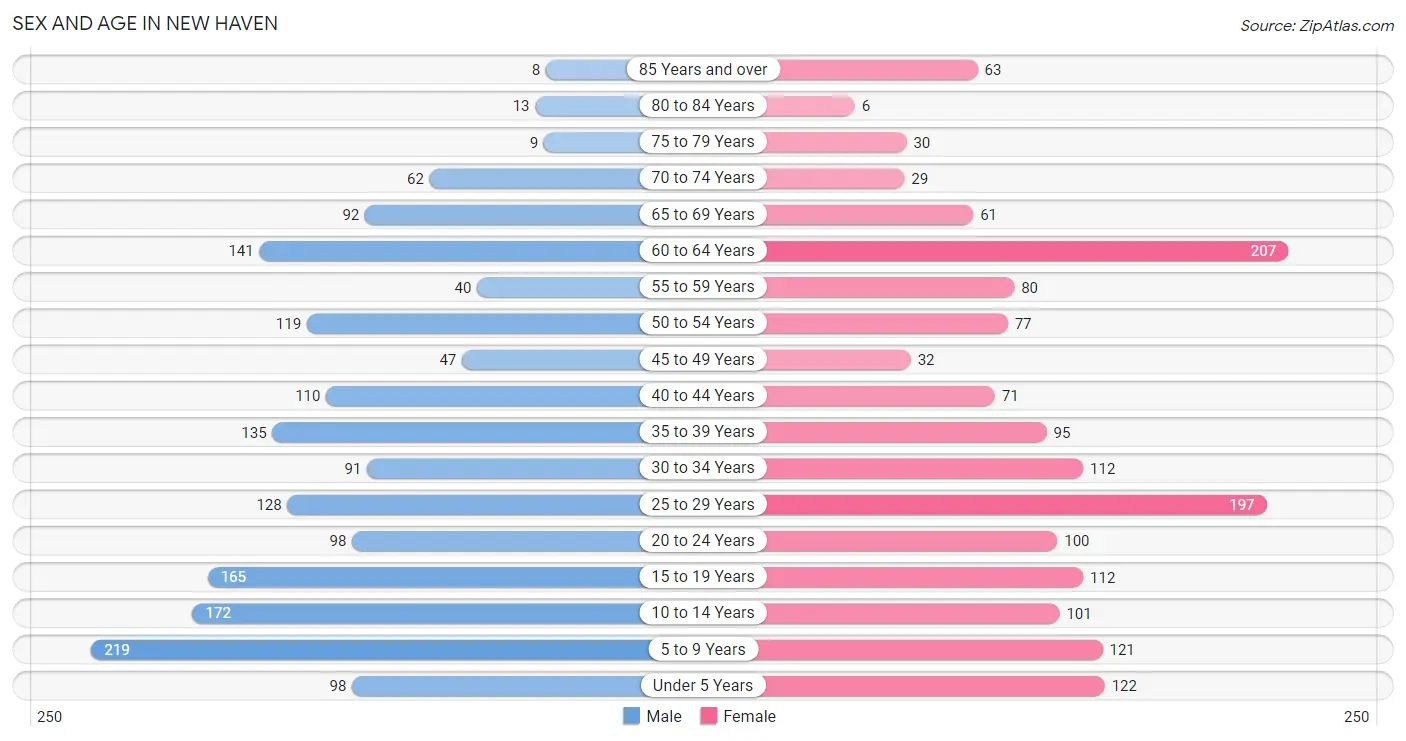
The most populous age groups in New Haven are 5 to 9 Years (219 | 12.5%) for men and 60 to 64 Years (207 | 12.8%) for women.
| Age Bracket | Male | Female |
| Under 5 Years | 98 (5.6%) | 122 (7.5%) |
| 5 to 9 Years | 219 (12.5%) | 121 (7.5%) |
| 10 to 14 Years | 172 (9.9%) | 101 (6.2%) |
| 15 to 19 Years | 165 (9.4%) | 112 (6.9%) |
| 20 to 24 Years | 98 (5.6%) | 100 (6.2%) |
| 25 to 29 Years | 128 (7.3%) | 197 (12.2%) |
| 30 to 34 Years | 91 (5.2%) | 112 (6.9%) |
| 35 to 39 Years | 135 (7.7%) | 95 (5.9%) |
| 40 to 44 Years | 110 (6.3%) | 71 (4.4%) |
| 45 to 49 Years | 47 (2.7%) | 32 (2.0%) |
| 50 to 54 Years | 119 (6.8%) | 77 (4.8%) |
| 55 to 59 Years | 40 (2.3%) | 80 (5.0%) |
| 60 to 64 Years | 141 (8.1%) | 207 (12.8%) |
| 65 to 69 Years | 92 (5.3%) | 61 (3.8%) |
| 70 to 74 Years | 62 (3.5%) | 29 (1.8%) |
| 75 to 79 Years | 9 (0.5%) | 30 (1.9%) |
| 80 to 84 Years | 13 (0.7%) | 6 (0.4%) |
| 85 Years and over | 8 (0.5%) | 63 (3.9%) |
| Total | 1,747 (100.0%) | 1,616 (100.0%) |
Families and Households in New Haven
Median Family Size in New Haven
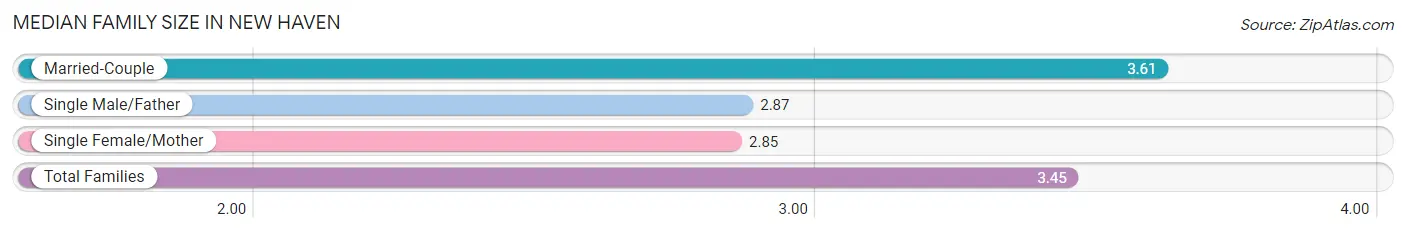
The median family size in New Haven is 3.45 persons per family, with married-couple families (671 | 78.4%) accounting for the largest median family size of 3.61 persons per family. On the other hand, single female/mother families (115 | 13.4%) represent the smallest median family size with 2.85 persons per family.
| Family Type | # Families | Family Size |
| Married-Couple | 671 (78.4%) | 3.61 |
| Single Male/Father | 70 (8.2%) | 2.87 |
| Single Female/Mother | 115 (13.4%) | 2.85 |
| Total Families | 856 (100.0%) | 3.45 |
Median Household Size in New Haven
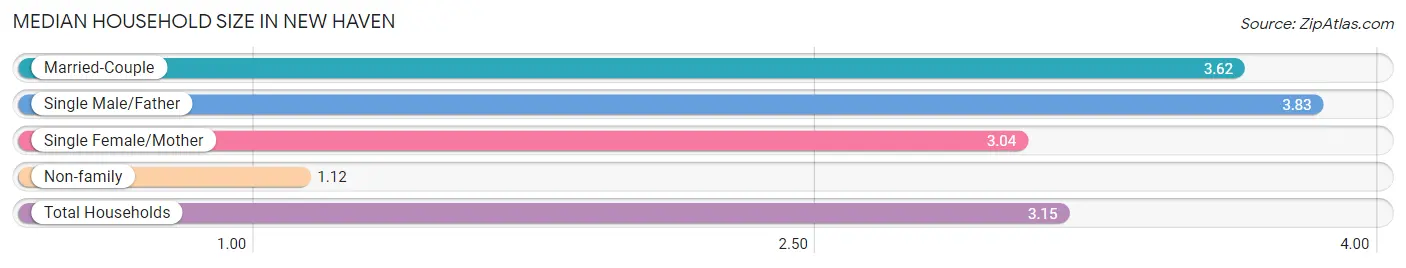
The median household size in New Haven is 3.15 persons per household, with single male/father households (70 | 6.8%) accounting for the largest median household size of 3.83 persons per household. non-family households (172 | 16.7%) represent the smallest median household size with 1.12 persons per household.
| Household Type | # Households | Household Size |
| Married-Couple | 671 (65.3%) | 3.62 |
| Single Male/Father | 70 (6.8%) | 3.83 |
| Single Female/Mother | 115 (11.2%) | 3.04 |
| Non-family | 172 (16.7%) | 1.12 |
| Total Households | 1,028 (100.0%) | 3.15 |
Household Size by Marriage Status in New Haven
Out of a total of 1,028 households in New Haven, 856 (83.3%) are family households, while 172 (16.7%) are nonfamily households. The most numerous type of family households are 2-person households, comprising 345, and the most common type of nonfamily households are 1-person households, comprising 147.
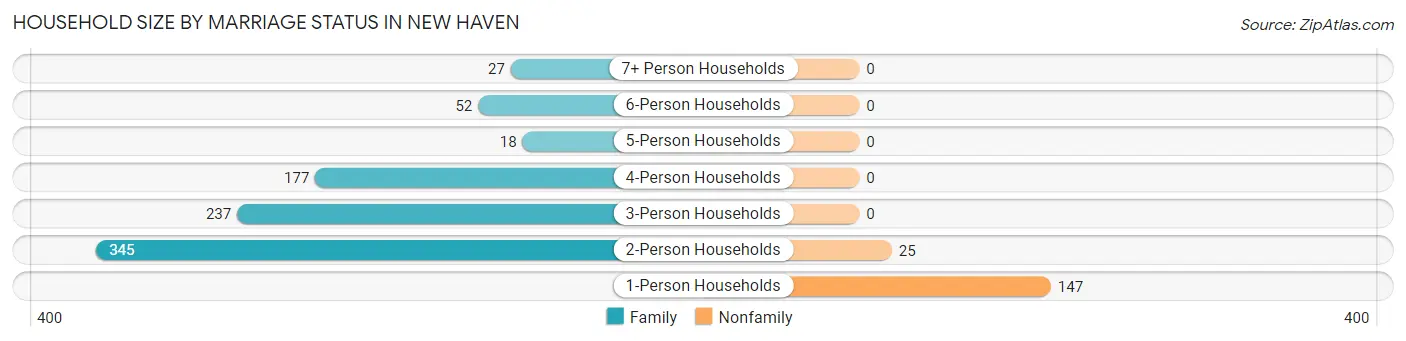
| Household Size | Family Households | Nonfamily Households |
| 1-Person Households | - | 147 (14.3%) |
| 2-Person Households | 345 (33.6%) | 25 (2.4%) |
| 3-Person Households | 237 (23.1%) | 0 (0.0%) |
| 4-Person Households | 177 (17.2%) | 0 (0.0%) |
| 5-Person Households | 18 (1.8%) | 0 (0.0%) |
| 6-Person Households | 52 (5.1%) | 0 (0.0%) |
| 7+ Person Households | 27 (2.6%) | 0 (0.0%) |
| Total | 856 (83.3%) | 172 (16.7%) |
Female Fertility in New Haven
Fertility by Age in New Haven
Average fertility rate in New Haven is 75.0 births per 1,000 women. Women in the age bracket of 20 to 34 years have the highest fertility rate with 90.0 births per 1,000 women. Women in the age bracket of 20 to 34 years acount for 68.5% of all women with births.
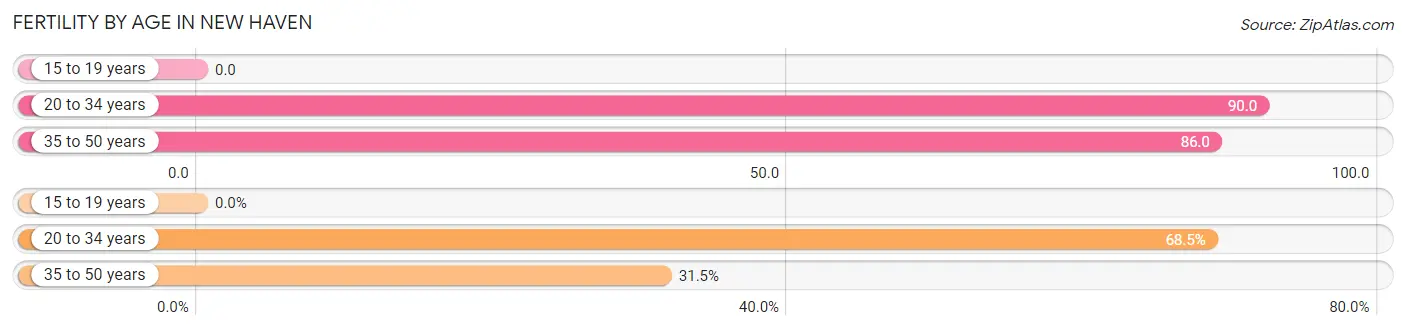
| Age Bracket | Women with Births | Births / 1,000 Women |
| 15 to 19 years | 0 (0.0%) | 0.0 |
| 20 to 34 years | 37 (68.5%) | 90.0 |
| 35 to 50 years | 17 (31.5%) | 86.0 |
| Total | 54 (100.0%) | 75.0 |
Fertility by Age by Marriage Status in New Haven
85.2% of women with births (54) in New Haven are married. The highest percentage of unmarried women with births falls into 20 to 34 years age bracket with 21.6% of them unmarried at the time of birth, while the lowest percentage of unmarried women with births belong to 35 to 50 years age bracket with 0.0% of them unmarried.
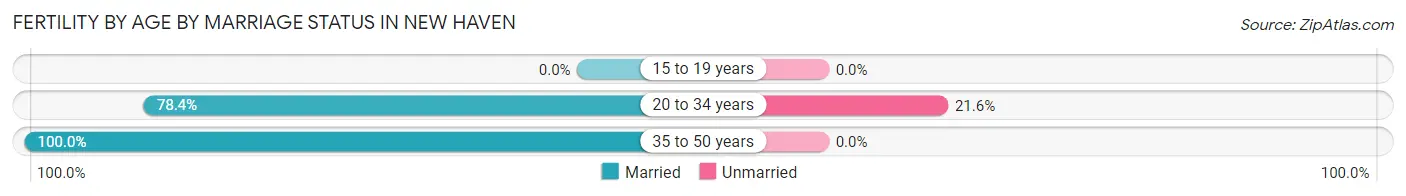
| Age Bracket | Married | Unmarried |
| 15 to 19 years | 0 (0.0%) | 0 (0.0%) |
| 20 to 34 years | 29 (78.4%) | 8 (21.6%) |
| 35 to 50 years | 17 (100.0%) | 0 (0.0%) |
| Total | 46 (85.2%) | 8 (14.8%) |
Fertility by Education in New Haven
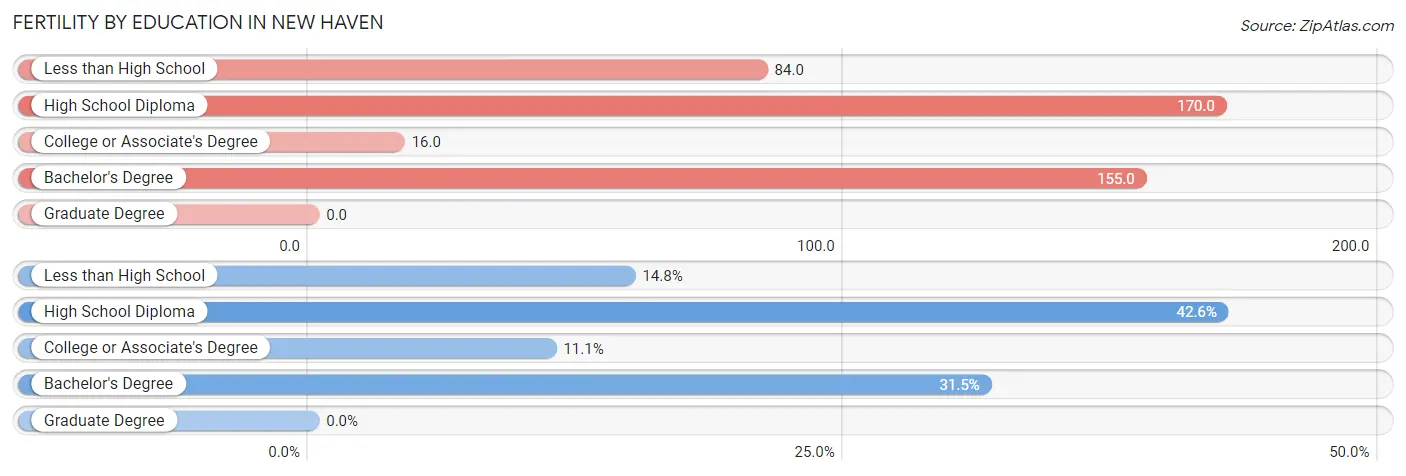
| Educational Attainment | Women with Births | Births / 1,000 Women |
| Less than High School | 8 (14.8%) | 84.0 |
| High School Diploma | 23 (42.6%) | 170.0 |
| College or Associate's Degree | 6 (11.1%) | 16.0 |
| Bachelor's Degree | 17 (31.5%) | 155.0 |
| Graduate Degree | 0 (0.0%) | 0.0 |
| Total | 54 (100.0%) | 75.0 |
Fertility by Education by Marriage Status in New Haven
14.8% of women with births in New Haven are unmarried. Women with the educational attainment of high school diploma are most likely to be married with 100.0% of them married at childbirth, while women with the educational attainment of less than high school are least likely to be married with 100.0% of them unmarried at childbirth.
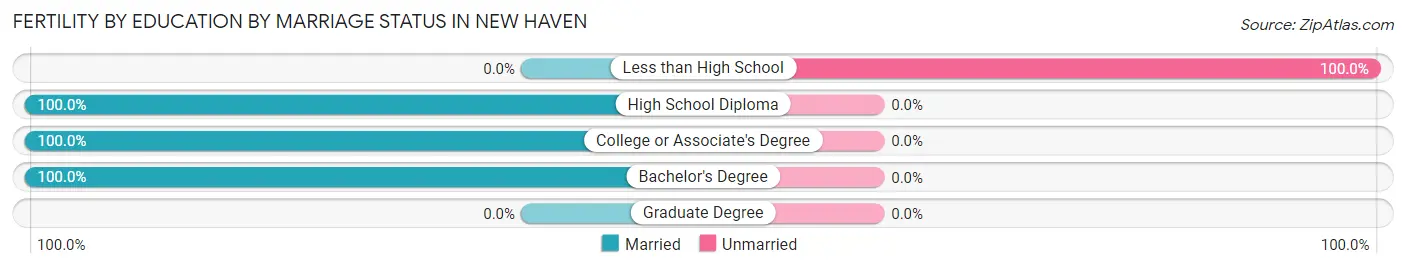
| Educational Attainment | Married | Unmarried |
| Less than High School | 0 (0.0%) | 8 (100.0%) |
| High School Diploma | 23 (100.0%) | 0 (0.0%) |
| College or Associate's Degree | 6 (100.0%) | 0 (0.0%) |
| Bachelor's Degree | 17 (100.0%) | 0 (0.0%) |
| Graduate Degree | 0 (0.0%) | 0 (0.0%) |
| Total | 46 (85.2%) | 8 (14.8%) |
Employment Characteristics in New Haven
Employment by Class of Employer in New Haven
Among the 1,442 employed individuals in New Haven, private company employees (955 | 66.2%), local government employees (179 | 12.4%), and self-employed (incorporated) (148 | 10.3%) make up the most common classes of employment.
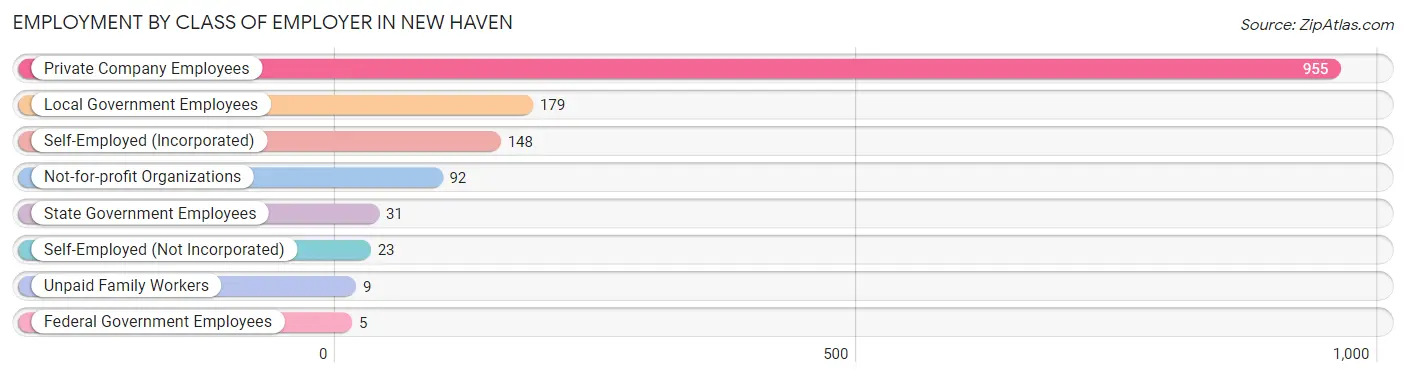
| Employer Class | # Employees | % Employees |
| Private Company Employees | 955 | 66.2% |
| Self-Employed (Incorporated) | 148 | 10.3% |
| Self-Employed (Not Incorporated) | 23 | 1.6% |
| Not-for-profit Organizations | 92 | 6.4% |
| Local Government Employees | 179 | 12.4% |
| State Government Employees | 31 | 2.1% |
| Federal Government Employees | 5 | 0.4% |
| Unpaid Family Workers | 9 | 0.6% |
| Total | 1,442 | 100.0% |
Employment Status by Age in New Haven
According to the labor force statistics for New Haven, out of the total population over 16 years of age (2,474), 61.8% or 1,529 individuals are in the labor force, with 4.6% or 70 of them unemployed. The age group with the highest labor force participation rate is 25 to 29 years, with 91.1% or 296 individuals in the labor force. Within the labor force, the 16 to 19 years age range has the highest percentage of unemployed individuals, with 38.2% or 29 of them being unemployed.
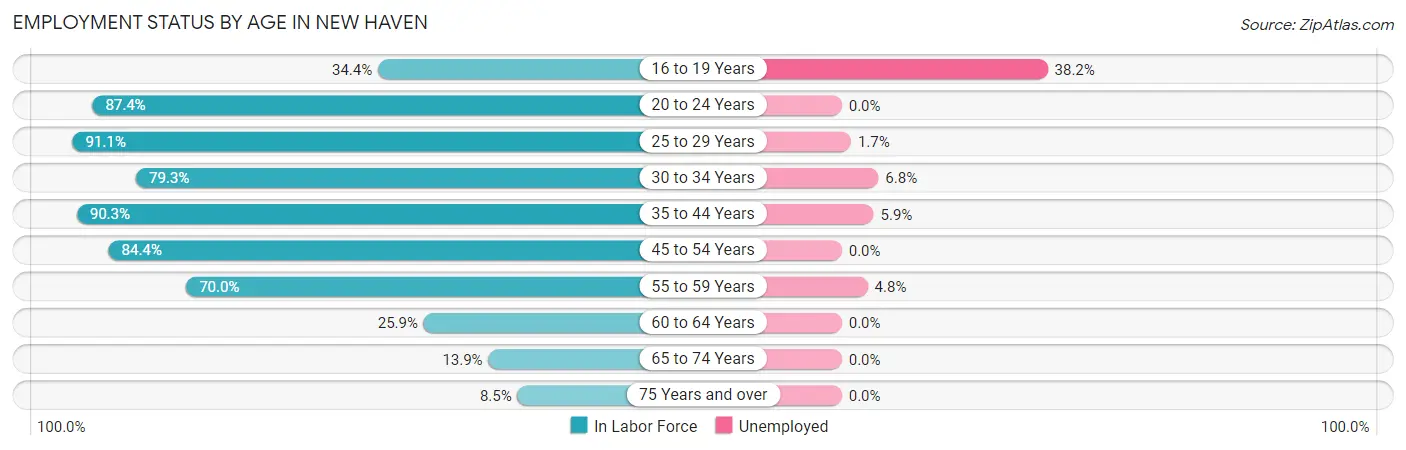
| Age Bracket | In Labor Force | Unemployed |
| 16 to 19 Years | 76 (34.4%) | 29 (38.2%) |
| 20 to 24 Years | 173 (87.4%) | 0 (0.0%) |
| 25 to 29 Years | 296 (91.1%) | 5 (1.7%) |
| 30 to 34 Years | 161 (79.3%) | 11 (6.8%) |
| 35 to 44 Years | 371 (90.3%) | 22 (5.9%) |
| 45 to 54 Years | 232 (84.4%) | 0 (0.0%) |
| 55 to 59 Years | 84 (70.0%) | 4 (4.8%) |
| 60 to 64 Years | 90 (25.9%) | 0 (0.0%) |
| 65 to 74 Years | 34 (13.9%) | 0 (0.0%) |
| 75 Years and over | 11 (8.5%) | 0 (0.0%) |
| Total | 1,529 (61.8%) | 70 (4.6%) |
Employment Status by Educational Attainment in New Haven
According to labor force statistics for New Haven, 73.4% of individuals (1,235) out of the total population between 25 and 64 years of age (1,682) are in the labor force, with 3.4% or 42 of them being unemployed. The group with the highest labor force participation rate are those with the educational attainment of bachelor's degree or higher, with 81.6% or 448 individuals in the labor force. Within the labor force, individuals with less than high school education have the highest percentage of unemployment, with 14.7% or 5 of them being unemployed.
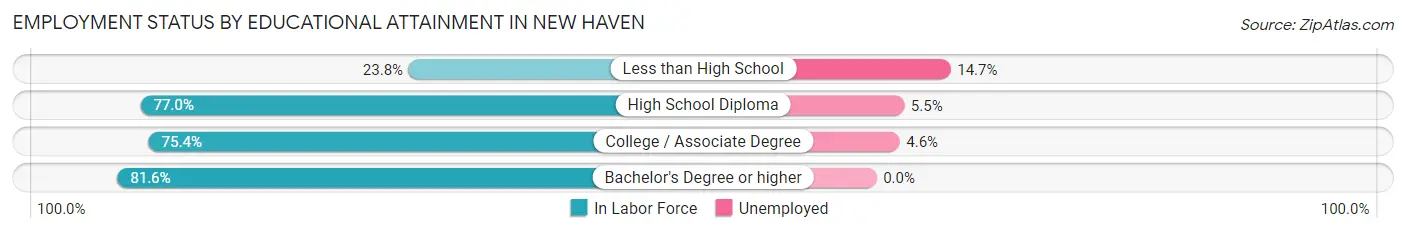
| Educational Attainment | In Labor Force | Unemployed |
| Less than High School | 34 (23.8%) | 21 (14.7%) |
| High School Diploma | 274 (77.0%) | 20 (5.5%) |
| College / Associate Degree | 478 (75.4%) | 29 (4.6%) |
| Bachelor's Degree or higher | 448 (81.6%) | 0 (0.0%) |
| Total | 1,235 (73.4%) | 57 (3.4%) |
Employment Occupations by Sex in New Haven
Management, Business, Science and Arts Occupations
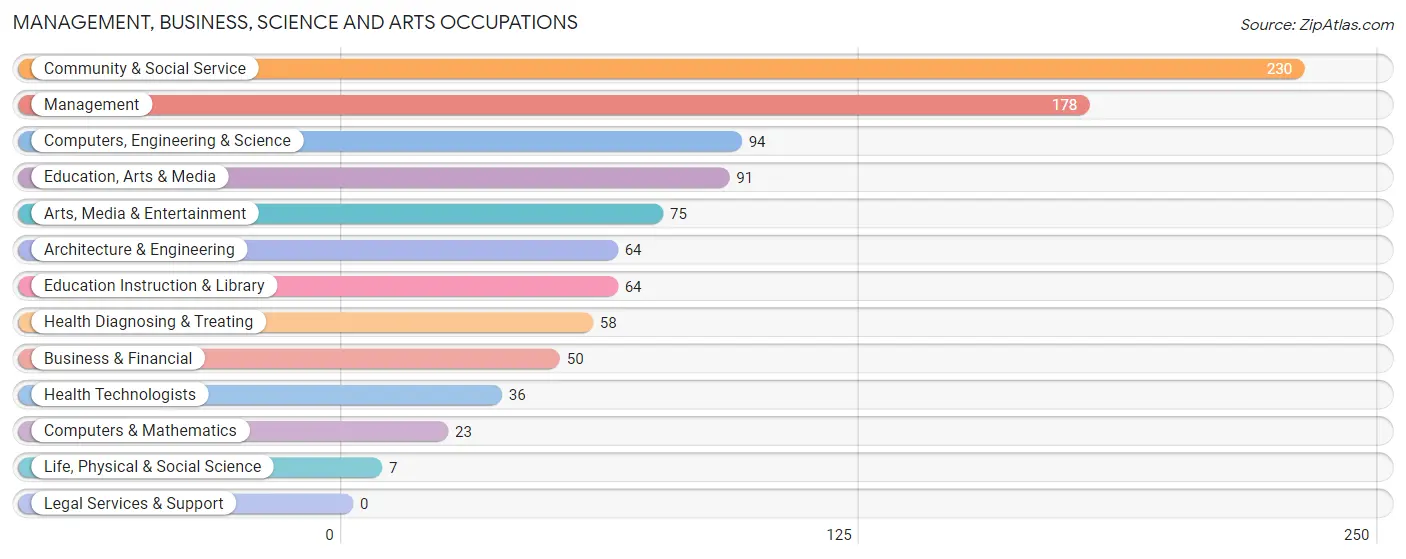
The most common Management, Business, Science and Arts occupations in New Haven are Community & Social Service (230 | 15.8%), Management (178 | 12.2%), Computers, Engineering & Science (94 | 6.5%), Education, Arts & Media (91 | 6.2%), and Arts, Media & Entertainment (75 | 5.1%).
Management, Business, Science and Arts Occupations by Sex
Within the Management, Business, Science and Arts occupations in New Haven, the most male-oriented occupations are Arts, Media & Entertainment (93.3%), Architecture & Engineering (89.1%), and Management (75.3%), while the most female-oriented occupations are Computers & Mathematics (100.0%), Life, Physical & Social Science (100.0%), and Health Diagnosing & Treating (100.0%).
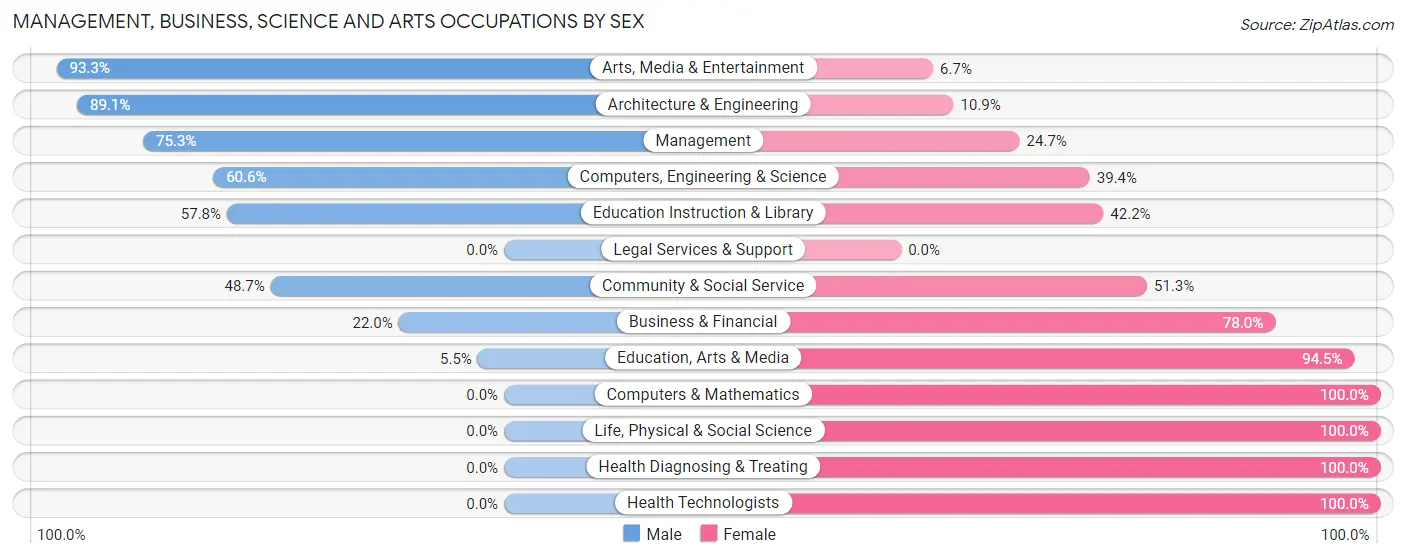
| Occupation | Male | Female |
| Management | 134 (75.3%) | 44 (24.7%) |
| Business & Financial | 11 (22.0%) | 39 (78.0%) |
| Computers, Engineering & Science | 57 (60.6%) | 37 (39.4%) |
| Computers & Mathematics | 0 (0.0%) | 23 (100.0%) |
| Architecture & Engineering | 57 (89.1%) | 7 (10.9%) |
| Life, Physical & Social Science | 0 (0.0%) | 7 (100.0%) |
| Community & Social Service | 112 (48.7%) | 118 (51.3%) |
| Education, Arts & Media | 5 (5.5%) | 86 (94.5%) |
| Legal Services & Support | 0 (0.0%) | 0 (0.0%) |
| Education Instruction & Library | 37 (57.8%) | 27 (42.2%) |
| Arts, Media & Entertainment | 70 (93.3%) | 5 (6.7%) |
| Health Diagnosing & Treating | 0 (0.0%) | 58 (100.0%) |
| Health Technologists | 0 (0.0%) | 36 (100.0%) |
| Total (Category) | 314 (51.5%) | 296 (48.5%) |
| Total (Overall) | 796 (54.6%) | 661 (45.4%) |
Services Occupations
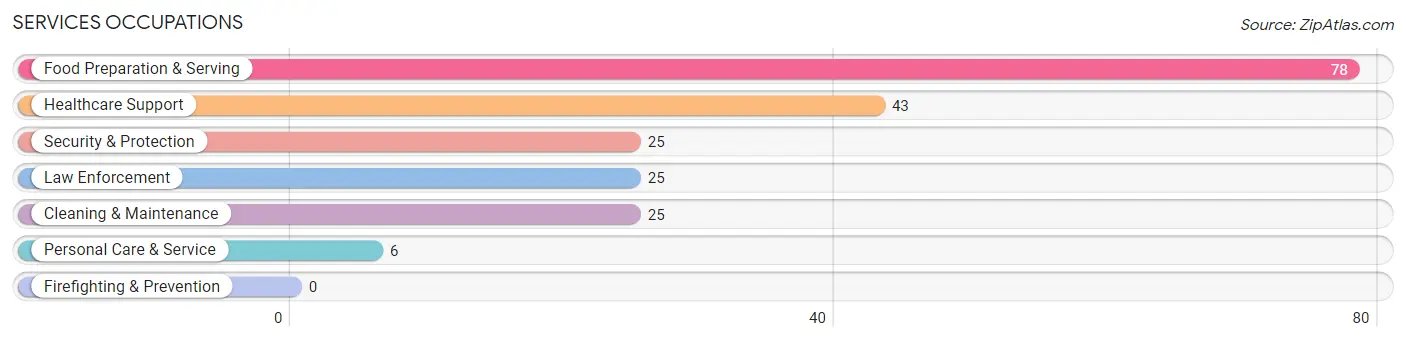
The most common Services occupations in New Haven are Food Preparation & Serving (78 | 5.3%), Healthcare Support (43 | 2.9%), Security & Protection (25 | 1.7%), Law Enforcement (25 | 1.7%), and Cleaning & Maintenance (25 | 1.7%).
Services Occupations by Sex
Within the Services occupations in New Haven, the most male-oriented occupations are Security & Protection (100.0%), Law Enforcement (100.0%), and Cleaning & Maintenance (84.0%), while the most female-oriented occupations are Healthcare Support (100.0%), Personal Care & Service (100.0%), and Food Preparation & Serving (43.6%).
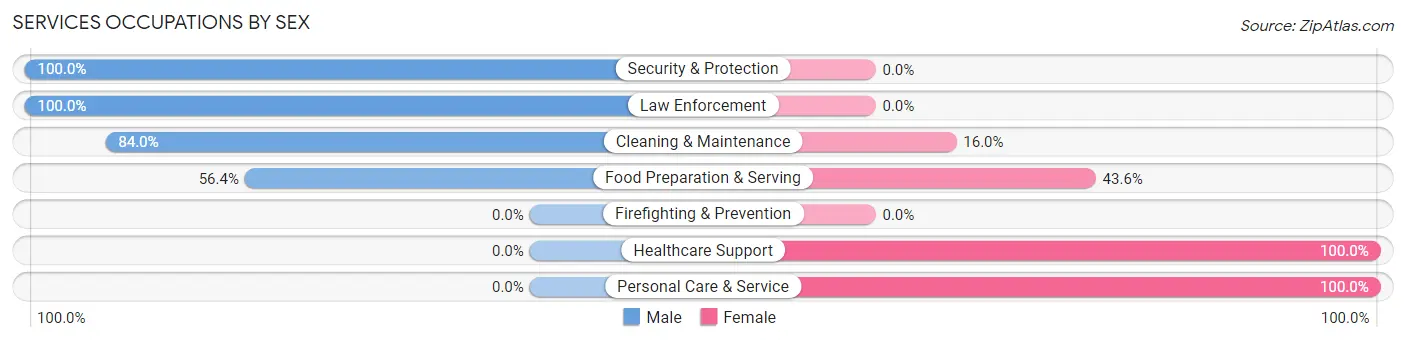
| Occupation | Male | Female |
| Healthcare Support | 0 (0.0%) | 43 (100.0%) |
| Security & Protection | 25 (100.0%) | 0 (0.0%) |
| Firefighting & Prevention | 0 (0.0%) | 0 (0.0%) |
| Law Enforcement | 25 (100.0%) | 0 (0.0%) |
| Food Preparation & Serving | 44 (56.4%) | 34 (43.6%) |
| Cleaning & Maintenance | 21 (84.0%) | 4 (16.0%) |
| Personal Care & Service | 0 (0.0%) | 6 (100.0%) |
| Total (Category) | 90 (50.8%) | 87 (49.1%) |
| Total (Overall) | 796 (54.6%) | 661 (45.4%) |
Sales and Office Occupations
The most common Sales and Office occupations in New Haven are Office & Administration (191 | 13.1%), and Sales & Related (103 | 7.1%).
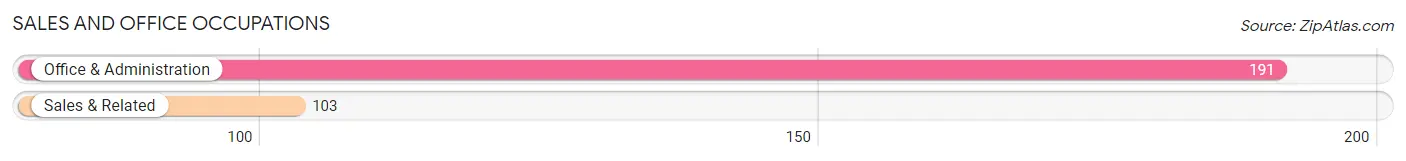
Sales and Office Occupations by Sex
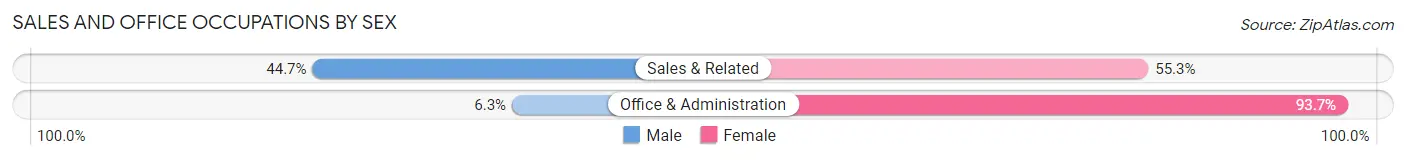
| Occupation | Male | Female |
| Sales & Related | 46 (44.7%) | 57 (55.3%) |
| Office & Administration | 12 (6.3%) | 179 (93.7%) |
| Total (Category) | 58 (19.7%) | 236 (80.3%) |
| Total (Overall) | 796 (54.6%) | 661 (45.4%) |
Natural Resources, Construction and Maintenance Occupations
The most common Natural Resources, Construction and Maintenance occupations in New Haven are Construction & Extraction (78 | 5.3%), and Installation, Maintenance & Repair (21 | 1.4%).
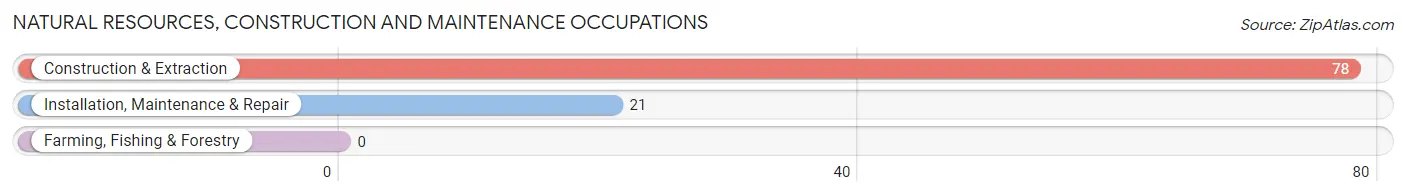
Natural Resources, Construction and Maintenance Occupations by Sex
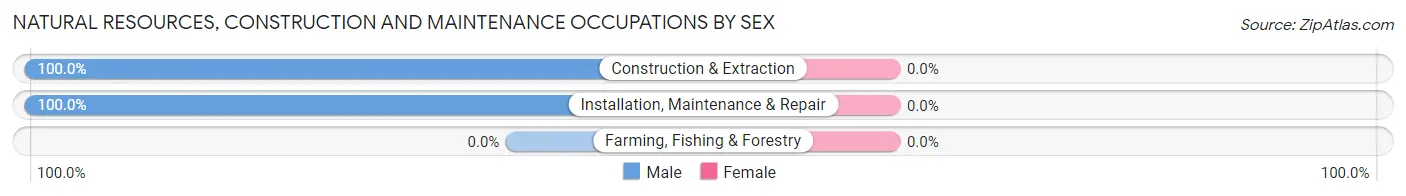
| Occupation | Male | Female |
| Farming, Fishing & Forestry | 0 (0.0%) | 0 (0.0%) |
| Construction & Extraction | 78 (100.0%) | 0 (0.0%) |
| Installation, Maintenance & Repair | 21 (100.0%) | 0 (0.0%) |
| Total (Category) | 99 (100.0%) | 0 (0.0%) |
| Total (Overall) | 796 (54.6%) | 661 (45.4%) |
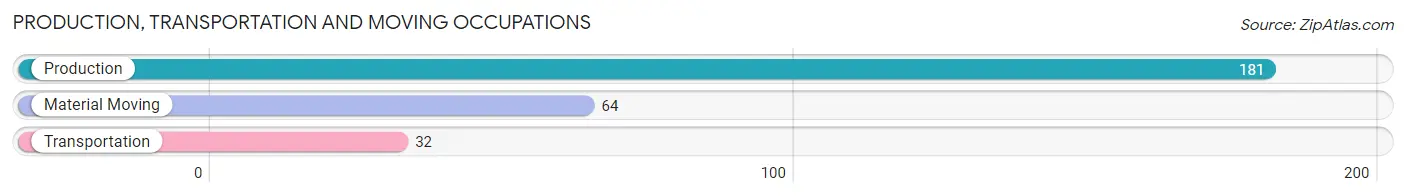
Production, Transportation and Moving Occupations
The most common Production, Transportation and Moving occupations in New Haven are Production (181 | 12.4%), Material Moving (64 | 4.4%), and Transportation (32 | 2.2%).
Production, Transportation and Moving Occupations by Sex
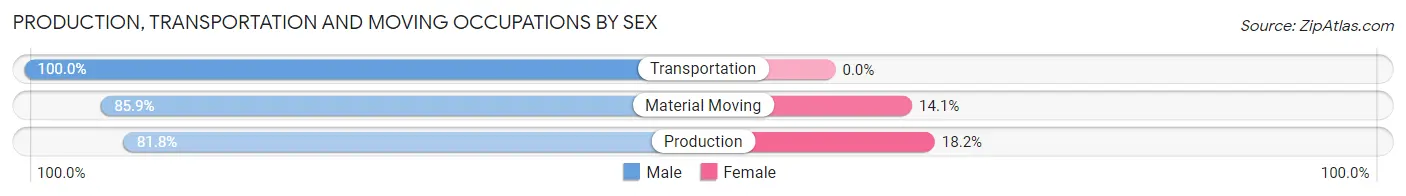
| Occupation | Male | Female |
| Production | 148 (81.8%) | 33 (18.2%) |
| Transportation | 32 (100.0%) | 0 (0.0%) |
| Material Moving | 55 (85.9%) | 9 (14.1%) |
| Total (Category) | 235 (84.8%) | 42 (15.2%) |
| Total (Overall) | 796 (54.6%) | 661 (45.4%) |
Employment Industries by Sex in New Haven
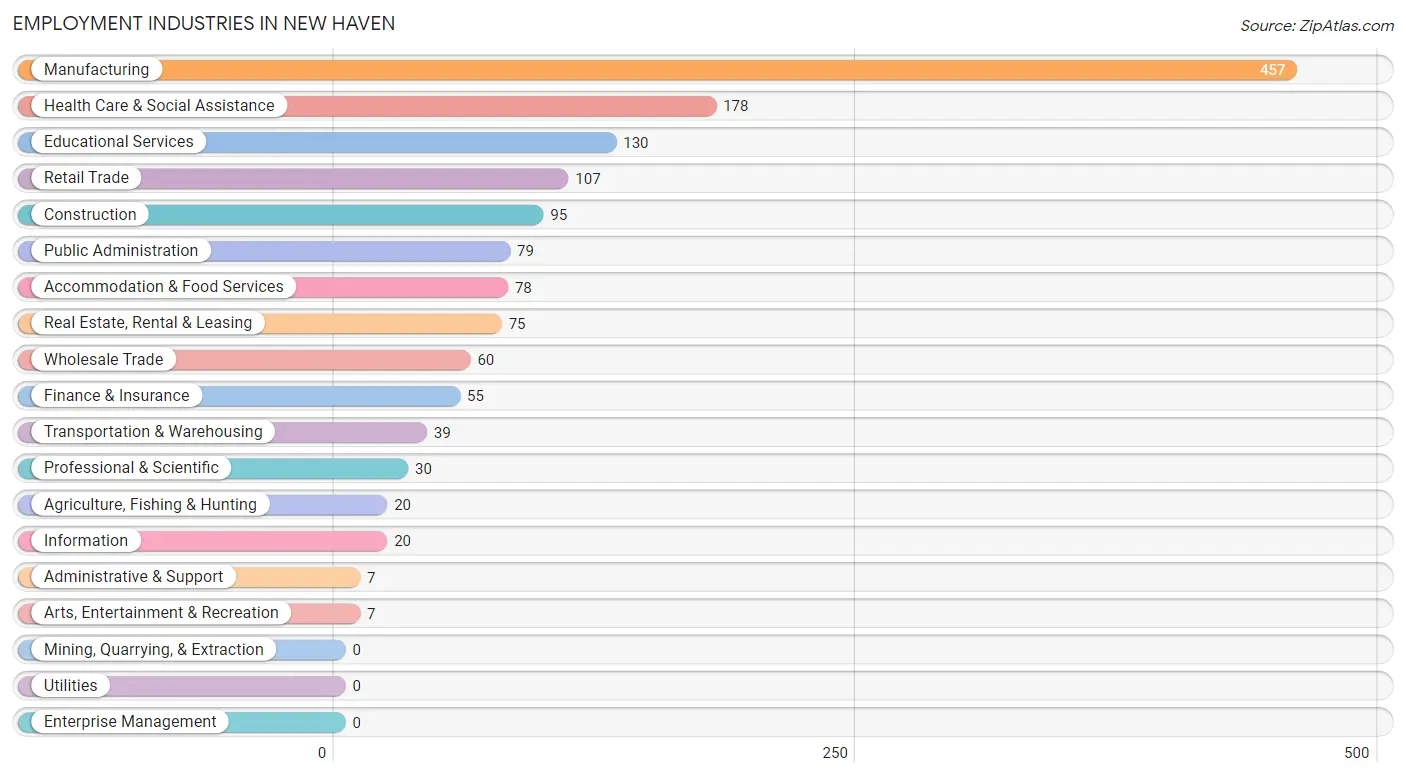
Employment Industries in New Haven
The major employment industries in New Haven include Manufacturing (457 | 31.4%), Health Care & Social Assistance (178 | 12.2%), Educational Services (130 | 8.9%), Retail Trade (107 | 7.3%), and Construction (95 | 6.5%).
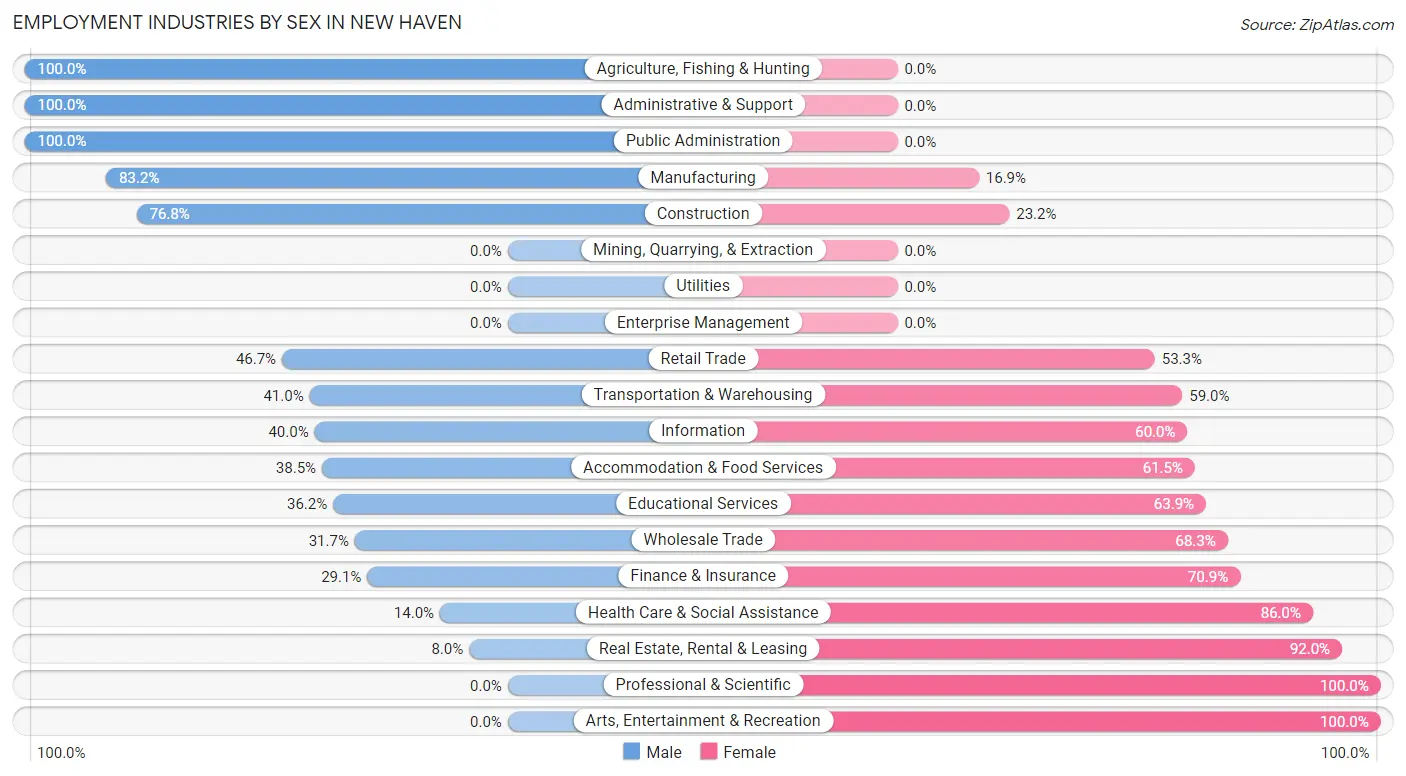
Employment Industries by Sex in New Haven
The New Haven industries that see more men than women are Agriculture, Fishing & Hunting (100.0%), Administrative & Support (100.0%), and Public Administration (100.0%), whereas the industries that tend to have a higher number of women are Professional & Scientific (100.0%), Arts, Entertainment & Recreation (100.0%), and Real Estate, Rental & Leasing (92.0%).
| Industry | Male | Female |
| Agriculture, Fishing & Hunting | 20 (100.0%) | 0 (0.0%) |
| Mining, Quarrying, & Extraction | 0 (0.0%) | 0 (0.0%) |
| Construction | 73 (76.8%) | 22 (23.2%) |
| Manufacturing | 380 (83.2%) | 77 (16.9%) |
| Wholesale Trade | 19 (31.7%) | 41 (68.3%) |
| Retail Trade | 50 (46.7%) | 57 (53.3%) |
| Transportation & Warehousing | 16 (41.0%) | 23 (59.0%) |
| Utilities | 0 (0.0%) | 0 (0.0%) |
| Information | 8 (40.0%) | 12 (60.0%) |
| Finance & Insurance | 16 (29.1%) | 39 (70.9%) |
| Real Estate, Rental & Leasing | 6 (8.0%) | 69 (92.0%) |
| Professional & Scientific | 0 (0.0%) | 30 (100.0%) |
| Enterprise Management | 0 (0.0%) | 0 (0.0%) |
| Administrative & Support | 7 (100.0%) | 0 (0.0%) |
| Educational Services | 47 (36.1%) | 83 (63.8%) |
| Health Care & Social Assistance | 25 (14.0%) | 153 (86.0%) |
| Arts, Entertainment & Recreation | 0 (0.0%) | 7 (100.0%) |
| Accommodation & Food Services | 30 (38.5%) | 48 (61.5%) |
| Public Administration | 79 (100.0%) | 0 (0.0%) |
| Total | 796 (54.6%) | 661 (45.4%) |
Education in New Haven
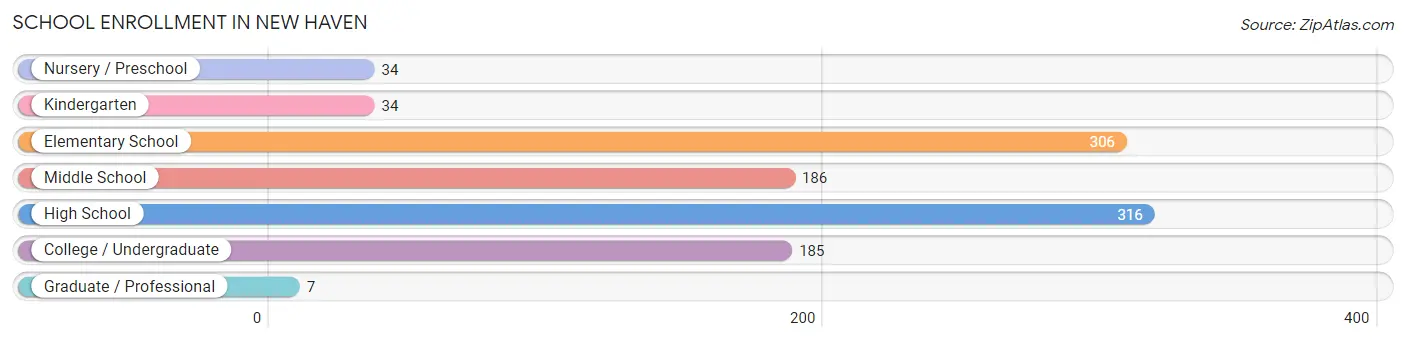
School Enrollment in New Haven
The most common levels of schooling among the 1,068 students in New Haven are high school (316 | 29.6%), elementary school (306 | 28.6%), and middle school (186 | 17.4%).
| School Level | # Students | % Students |
| Nursery / Preschool | 34 | 3.2% |
| Kindergarten | 34 | 3.2% |
| Elementary School | 306 | 28.6% |
| Middle School | 186 | 17.4% |
| High School | 316 | 29.6% |
| College / Undergraduate | 185 | 17.3% |
| Graduate / Professional | 7 | 0.7% |
| Total | 1,068 | 100.0% |
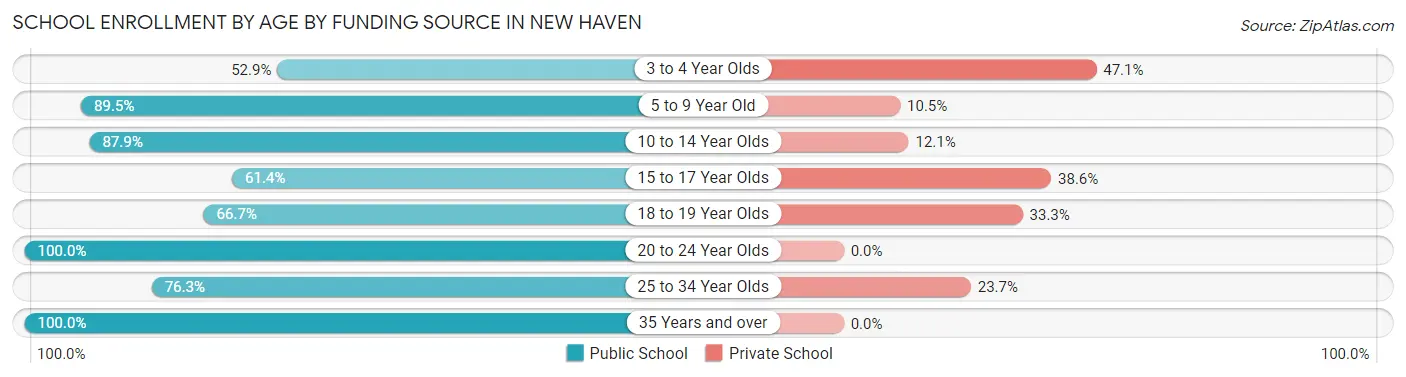
School Enrollment by Age by Funding Source in New Haven
Out of a total of 1,068 students who are enrolled in schools in New Haven, 195 (18.3%) attend a private institution, while the remaining 873 (81.7%) are enrolled in public schools. The age group of 3 to 4 year olds has the highest likelihood of being enrolled in private schools, with 16 (47.1% in the age bracket) enrolled. Conversely, the age group of 20 to 24 year olds has the lowest likelihood of being enrolled in a private school, with 78 (100.0% in the age bracket) attending a public institution.
| Age Bracket | Public School | Private School |
| 3 to 4 Year Olds | 18 (52.9%) | 16 (47.1%) |
| 5 to 9 Year Old | 298 (89.5%) | 35 (10.5%) |
| 10 to 14 Year Olds | 240 (87.9%) | 33 (12.1%) |
| 15 to 17 Year Olds | 135 (61.4%) | 85 (38.6%) |
| 18 to 19 Year Olds | 34 (66.7%) | 17 (33.3%) |
| 20 to 24 Year Olds | 78 (100.0%) | 0 (0.0%) |
| 25 to 34 Year Olds | 29 (76.3%) | 9 (23.7%) |
| 35 Years and over | 41 (100.0%) | 0 (0.0%) |
| Total | 873 (81.7%) | 195 (18.3%) |
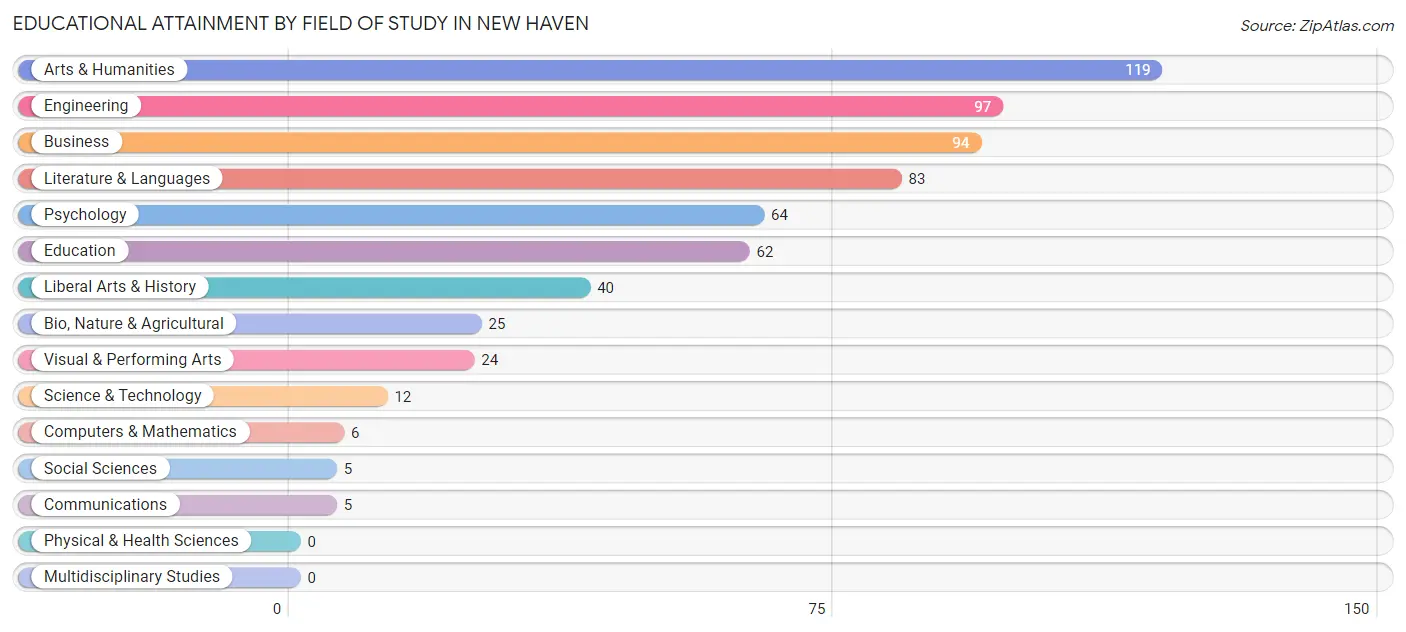
Educational Attainment by Field of Study in New Haven
Arts & humanities (119 | 18.7%), engineering (97 | 15.2%), business (94 | 14.8%), literature & languages (83 | 13.1%), and psychology (64 | 10.1%) are the most common fields of study among 636 individuals in New Haven who have obtained a bachelor's degree or higher.
| Field of Study | # Graduates | % Graduates |
| Computers & Mathematics | 6 | 0.9% |
| Bio, Nature & Agricultural | 25 | 3.9% |
| Physical & Health Sciences | 0 | 0.0% |
| Psychology | 64 | 10.1% |
| Social Sciences | 5 | 0.8% |
| Engineering | 97 | 15.2% |
| Multidisciplinary Studies | 0 | 0.0% |
| Science & Technology | 12 | 1.9% |
| Business | 94 | 14.8% |
| Education | 62 | 9.8% |
| Literature & Languages | 83 | 13.1% |
| Liberal Arts & History | 40 | 6.3% |
| Visual & Performing Arts | 24 | 3.8% |
| Communications | 5 | 0.8% |
| Arts & Humanities | 119 | 18.7% |
| Total | 636 | 100.0% |
Transportation & Commute in New Haven
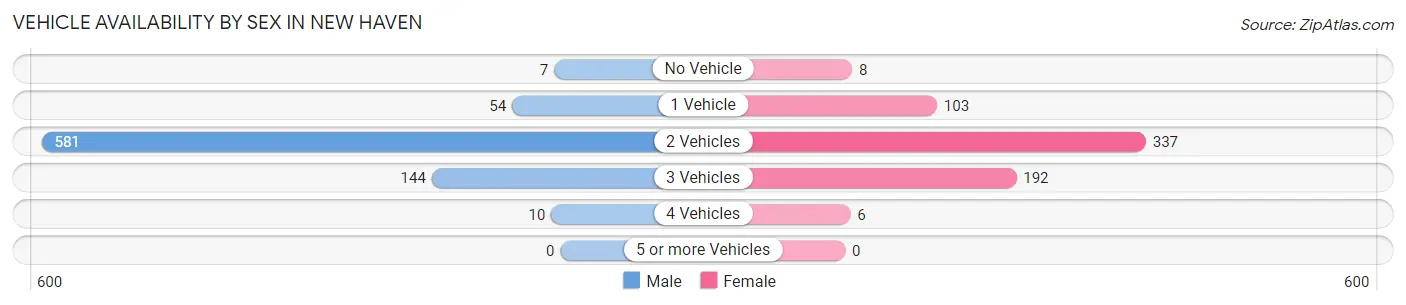
Vehicle Availability by Sex in New Haven
The most prevalent vehicle ownership categories in New Haven are males with 2 vehicles (581, accounting for 73.0%) and females with 2 vehicles (337, making up 89.9%).
| Vehicles Available | Male | Female |
| No Vehicle | 7 (0.9%) | 8 (1.2%) |
| 1 Vehicle | 54 (6.8%) | 103 (15.9%) |
| 2 Vehicles | 581 (73.0%) | 337 (52.2%) |
| 3 Vehicles | 144 (18.1%) | 192 (29.7%) |
| 4 Vehicles | 10 (1.3%) | 6 (0.9%) |
| 5 or more Vehicles | 0 (0.0%) | 0 (0.0%) |
| Total | 796 (100.0%) | 646 (100.0%) |
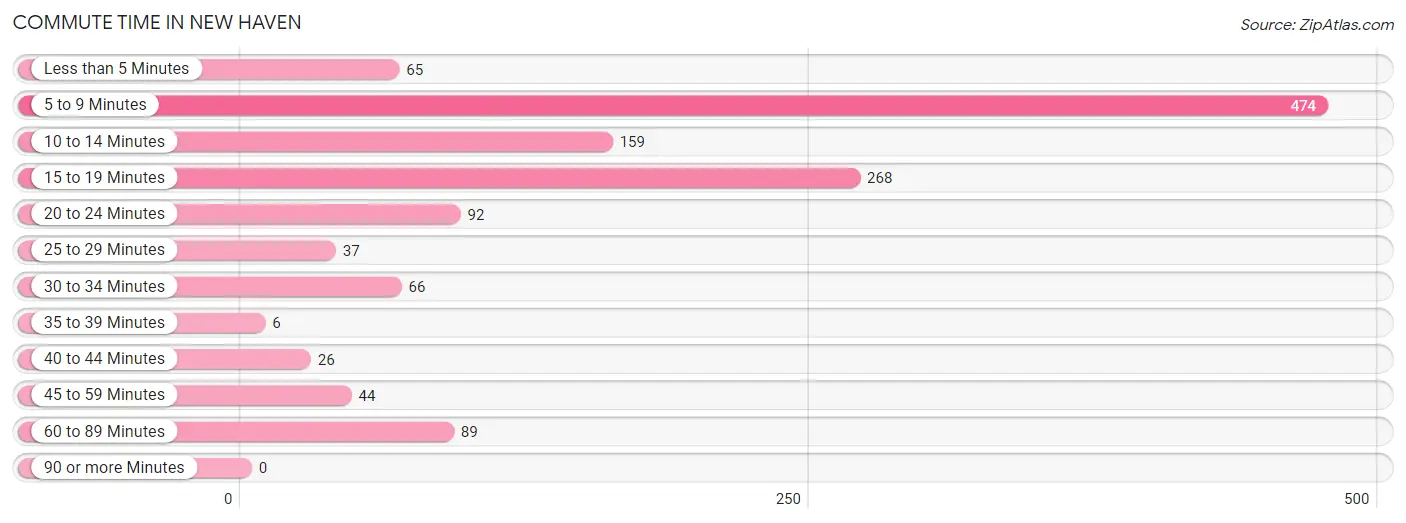
Commute Time in New Haven
The most frequently occuring commute durations in New Haven are 5 to 9 minutes (474 commuters, 35.7%), 15 to 19 minutes (268 commuters, 20.2%), and 10 to 14 minutes (159 commuters, 12.0%).
| Commute Time | # Commuters | % Commuters |
| Less than 5 Minutes | 65 | 4.9% |
| 5 to 9 Minutes | 474 | 35.7% |
| 10 to 14 Minutes | 159 | 12.0% |
| 15 to 19 Minutes | 268 | 20.2% |
| 20 to 24 Minutes | 92 | 6.9% |
| 25 to 29 Minutes | 37 | 2.8% |
| 30 to 34 Minutes | 66 | 5.0% |
| 35 to 39 Minutes | 6 | 0.4% |
| 40 to 44 Minutes | 26 | 2.0% |
| 45 to 59 Minutes | 44 | 3.3% |
| 60 to 89 Minutes | 89 | 6.7% |
| 90 or more Minutes | 0 | 0.0% |
Commute Time by Sex in New Haven
The most common commute times in New Haven are 5 to 9 minutes (201 commuters, 25.8%) for males and 5 to 9 minutes (273 commuters, 50.0%) for females.
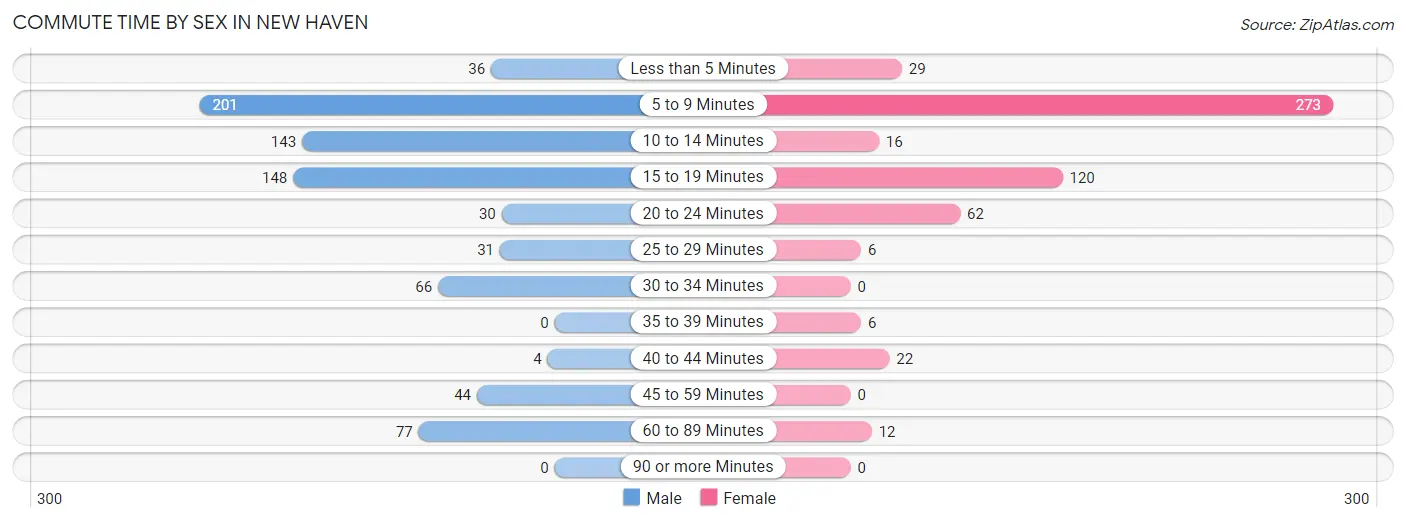
| Commute Time | Male | Female |
| Less than 5 Minutes | 36 (4.6%) | 29 (5.3%) |
| 5 to 9 Minutes | 201 (25.8%) | 273 (50.0%) |
| 10 to 14 Minutes | 143 (18.3%) | 16 (2.9%) |
| 15 to 19 Minutes | 148 (19.0%) | 120 (22.0%) |
| 20 to 24 Minutes | 30 (3.8%) | 62 (11.4%) |
| 25 to 29 Minutes | 31 (4.0%) | 6 (1.1%) |
| 30 to 34 Minutes | 66 (8.5%) | 0 (0.0%) |
| 35 to 39 Minutes | 0 (0.0%) | 6 (1.1%) |
| 40 to 44 Minutes | 4 (0.5%) | 22 (4.0%) |
| 45 to 59 Minutes | 44 (5.6%) | 0 (0.0%) |
| 60 to 89 Minutes | 77 (9.9%) | 12 (2.2%) |
| 90 or more Minutes | 0 (0.0%) | 0 (0.0%) |
Time of Departure to Work by Sex in New Haven
The most frequent times of departure to work in New Haven are 7:30 AM to 7:59 AM (184, 23.6%) for males and 7:00 AM to 7:29 AM (133, 24.4%) for females.
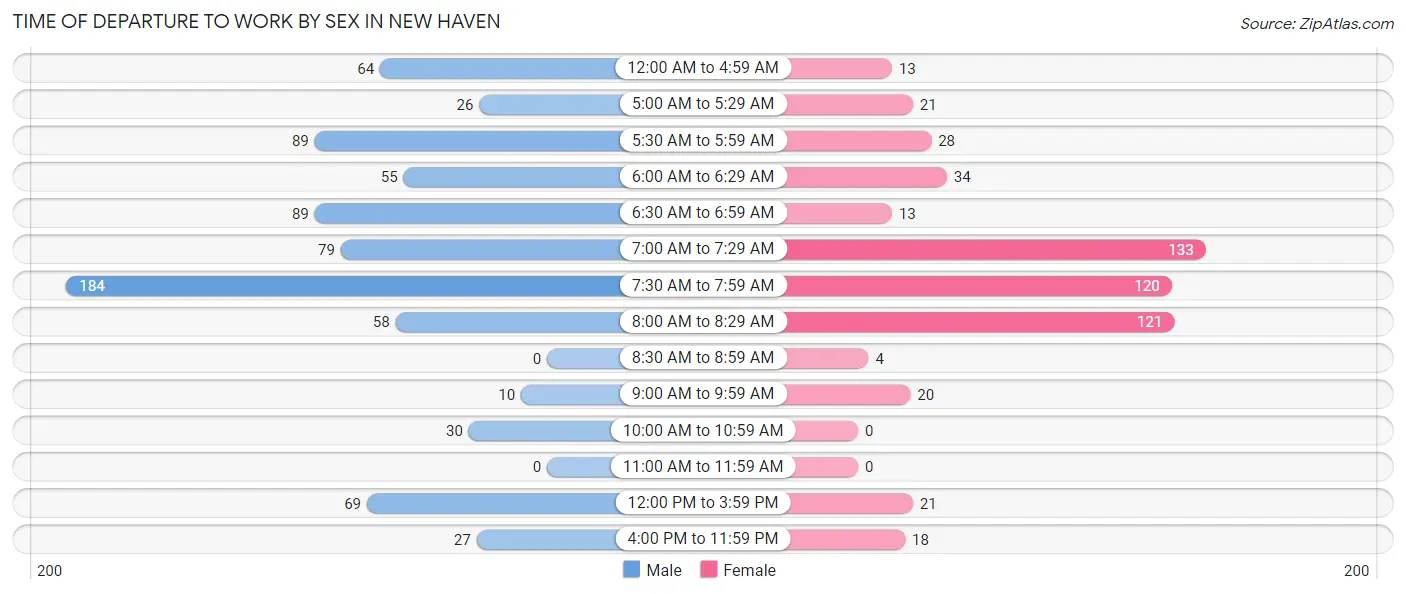
| Time of Departure | Male | Female |
| 12:00 AM to 4:59 AM | 64 (8.2%) | 13 (2.4%) |
| 5:00 AM to 5:29 AM | 26 (3.3%) | 21 (3.8%) |
| 5:30 AM to 5:59 AM | 89 (11.4%) | 28 (5.1%) |
| 6:00 AM to 6:29 AM | 55 (7.0%) | 34 (6.2%) |
| 6:30 AM to 6:59 AM | 89 (11.4%) | 13 (2.4%) |
| 7:00 AM to 7:29 AM | 79 (10.1%) | 133 (24.4%) |
| 7:30 AM to 7:59 AM | 184 (23.6%) | 120 (22.0%) |
| 8:00 AM to 8:29 AM | 58 (7.4%) | 121 (22.2%) |
| 8:30 AM to 8:59 AM | 0 (0.0%) | 4 (0.7%) |
| 9:00 AM to 9:59 AM | 10 (1.3%) | 20 (3.7%) |
| 10:00 AM to 10:59 AM | 30 (3.8%) | 0 (0.0%) |
| 11:00 AM to 11:59 AM | 0 (0.0%) | 0 (0.0%) |
| 12:00 PM to 3:59 PM | 69 (8.8%) | 21 (3.8%) |
| 4:00 PM to 11:59 PM | 27 (3.5%) | 18 (3.3%) |
| Total | 780 (100.0%) | 546 (100.0%) |
Housing Occupancy in New Haven
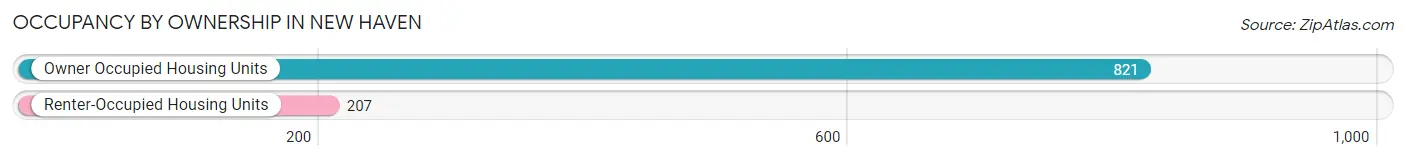
Occupancy by Ownership in New Haven
Of the total 1,028 dwellings in New Haven, owner-occupied units account for 821 (79.9%), while renter-occupied units make up 207 (20.1%).
| Occupancy | # Housing Units | % Housing Units |
| Owner Occupied Housing Units | 821 | 79.9% |
| Renter-Occupied Housing Units | 207 | 20.1% |
| Total Occupied Housing Units | 1,028 | 100.0% |
Occupancy by Household Size in New Haven
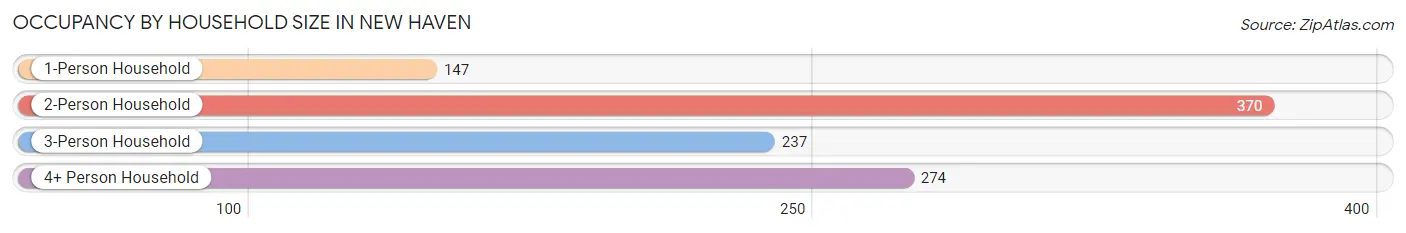
| Household Size | # Housing Units | % Housing Units |
| 1-Person Household | 147 | 14.3% |
| 2-Person Household | 370 | 36.0% |
| 3-Person Household | 237 | 23.1% |
| 4+ Person Household | 274 | 26.7% |
| Total Housing Units | 1,028 | 100.0% |
Occupancy by Ownership by Household Size in New Haven
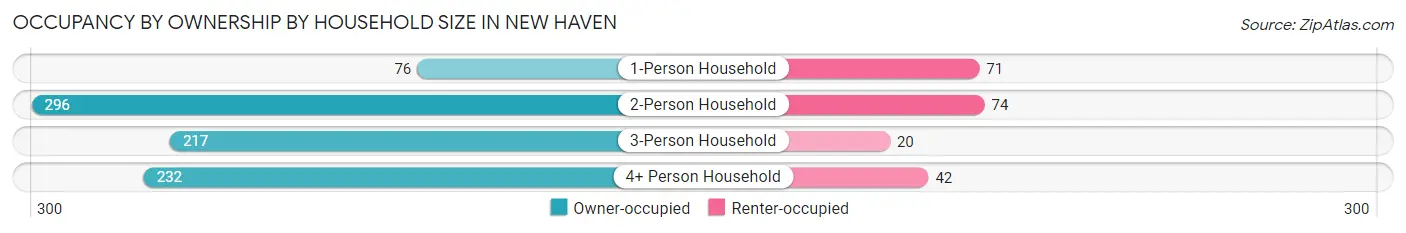
| Household Size | Owner-occupied | Renter-occupied |
| 1-Person Household | 76 (51.7%) | 71 (48.3%) |
| 2-Person Household | 296 (80.0%) | 74 (20.0%) |
| 3-Person Household | 217 (91.6%) | 20 (8.4%) |
| 4+ Person Household | 232 (84.7%) | 42 (15.3%) |
| Total Housing Units | 821 (79.9%) | 207 (20.1%) |
Occupancy by Educational Attainment in New Haven
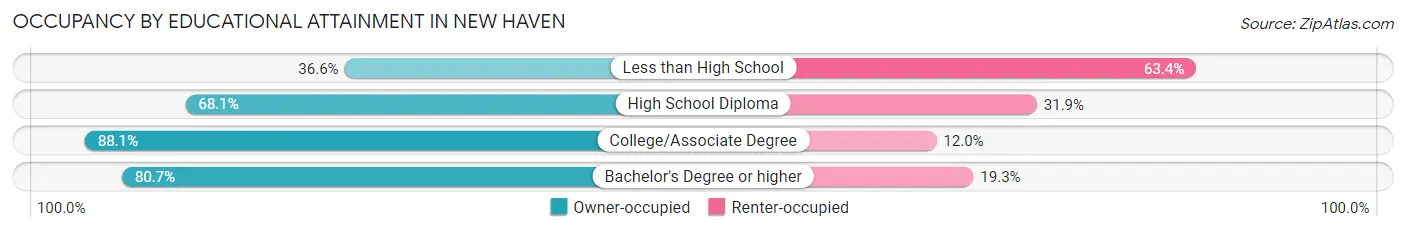
| Household Size | Owner-occupied | Renter-occupied |
| Less than High School | 15 (36.6%) | 26 (63.4%) |
| High School Diploma | 139 (68.1%) | 65 (31.9%) |
| College/Associate Degree | 420 (88.0%) | 57 (11.9%) |
| Bachelor's Degree or higher | 247 (80.7%) | 59 (19.3%) |
Occupancy by Age of Householder in New Haven
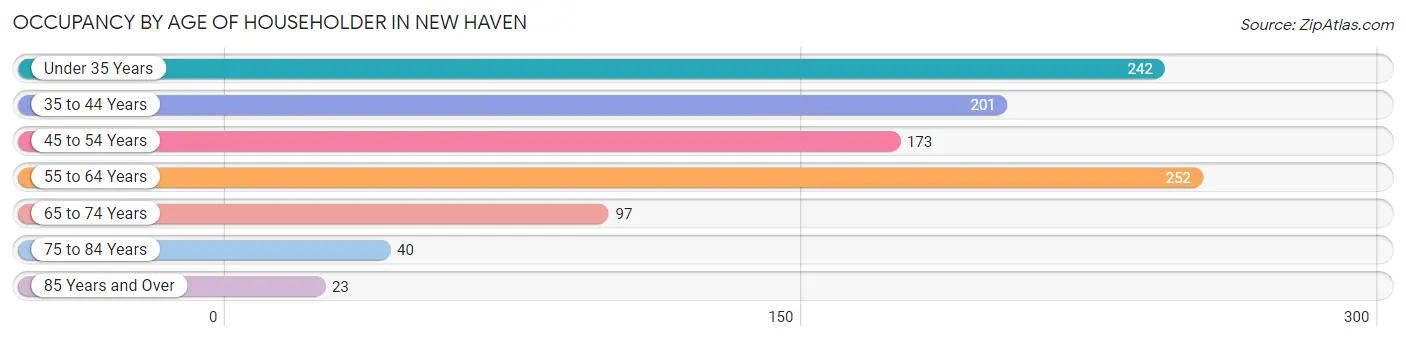
| Age Bracket | # Households | % Households |
| Under 35 Years | 242 | 23.5% |
| 35 to 44 Years | 201 | 19.6% |
| 45 to 54 Years | 173 | 16.8% |
| 55 to 64 Years | 252 | 24.5% |
| 65 to 74 Years | 97 | 9.4% |
| 75 to 84 Years | 40 | 3.9% |
| 85 Years and Over | 23 | 2.2% |
| Total | 1,028 | 100.0% |
Housing Finances in New Haven
Median Income by Occupancy in New Haven
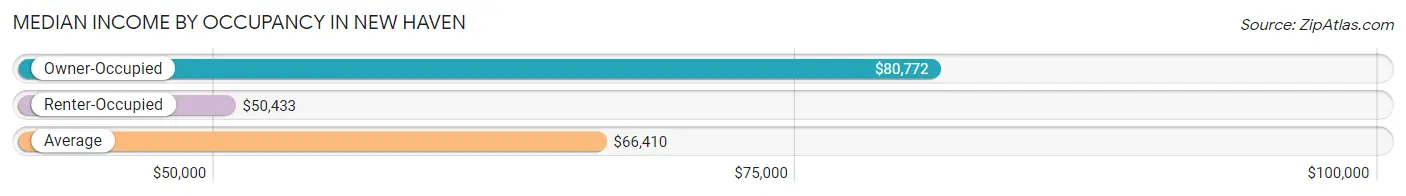
| Occupancy Type | # Households | Median Income |
| Owner-Occupied | 821 (79.9%) | $80,772 |
| Renter-Occupied | 207 (20.1%) | $50,433 |
| Average | 1,028 (100.0%) | $66,410 |
Occupancy by Householder Income Bracket in New Haven
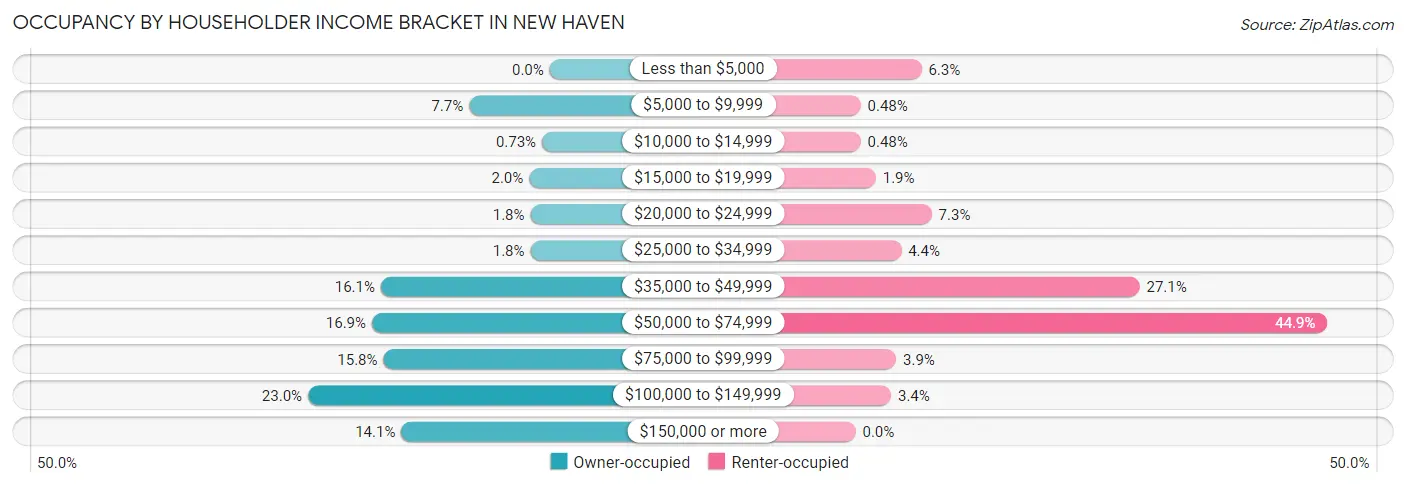
| Income Bracket | Owner-occupied | Renter-occupied |
| Less than $5,000 | 0 (0.0%) | 13 (6.3%) |
| $5,000 to $9,999 | 63 (7.7%) | 1 (0.5%) |
| $10,000 to $14,999 | 6 (0.7%) | 1 (0.5%) |
| $15,000 to $19,999 | 16 (1.9%) | 4 (1.9%) |
| $20,000 to $24,999 | 15 (1.8%) | 15 (7.2%) |
| $25,000 to $34,999 | 15 (1.8%) | 9 (4.3%) |
| $35,000 to $49,999 | 132 (16.1%) | 56 (27.1%) |
| $50,000 to $74,999 | 139 (16.9%) | 93 (44.9%) |
| $75,000 to $99,999 | 130 (15.8%) | 8 (3.9%) |
| $100,000 to $149,999 | 189 (23.0%) | 7 (3.4%) |
| $150,000 or more | 116 (14.1%) | 0 (0.0%) |
| Total | 821 (100.0%) | 207 (100.0%) |
Monthly Housing Cost Tiers in New Haven
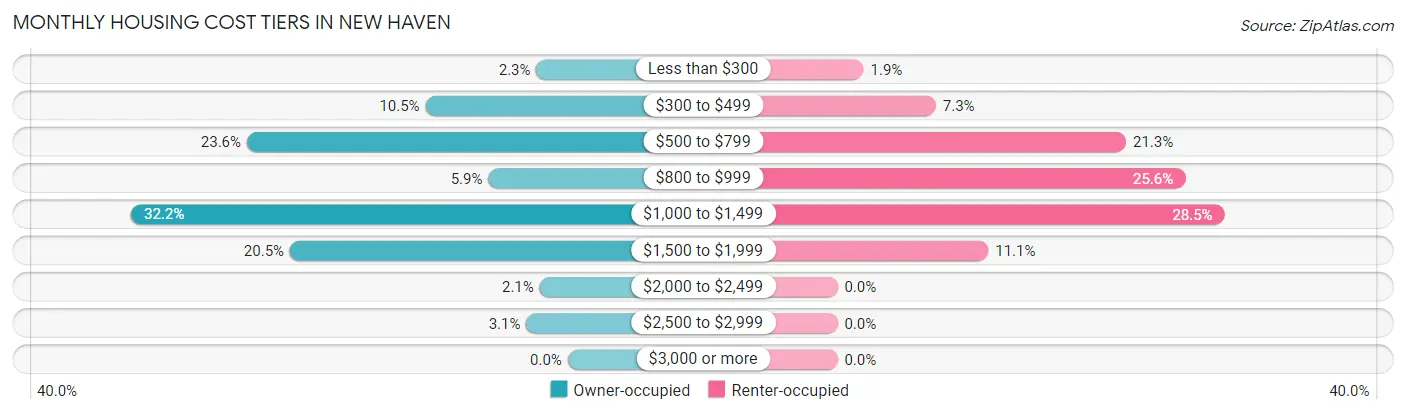
| Monthly Cost | Owner-occupied | Renter-occupied |
| Less than $300 | 19 (2.3%) | 4 (1.9%) |
| $300 to $499 | 86 (10.5%) | 15 (7.2%) |
| $500 to $799 | 194 (23.6%) | 44 (21.3%) |
| $800 to $999 | 48 (5.9%) | 53 (25.6%) |
| $1,000 to $1,499 | 264 (32.2%) | 59 (28.5%) |
| $1,500 to $1,999 | 168 (20.5%) | 23 (11.1%) |
| $2,000 to $2,499 | 17 (2.1%) | 0 (0.0%) |
| $2,500 to $2,999 | 25 (3.0%) | 0 (0.0%) |
| $3,000 or more | 0 (0.0%) | 0 (0.0%) |
| Total | 821 (100.0%) | 207 (100.0%) |
Physical Housing Characteristics in New Haven
Housing Structures in New Haven
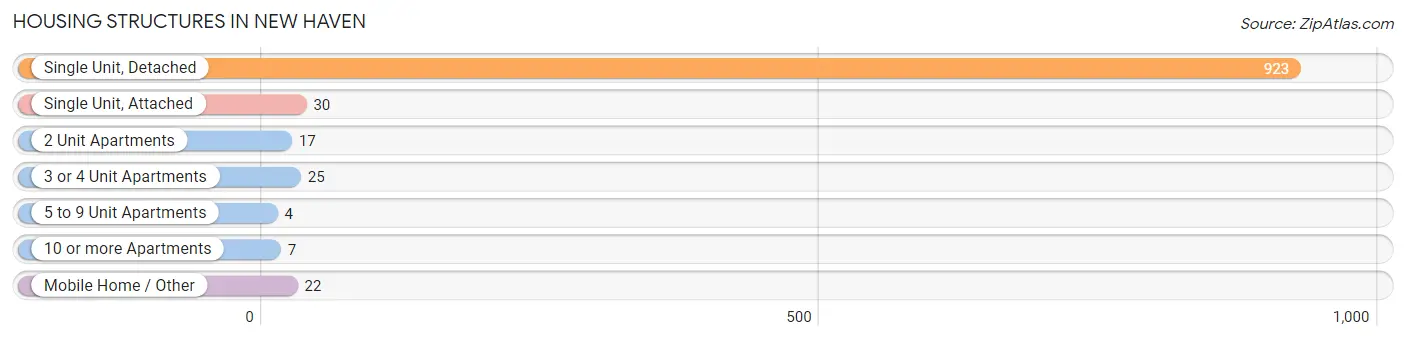
| Structure Type | # Housing Units | % Housing Units |
| Single Unit, Detached | 923 | 89.8% |
| Single Unit, Attached | 30 | 2.9% |
| 2 Unit Apartments | 17 | 1.7% |
| 3 or 4 Unit Apartments | 25 | 2.4% |
| 5 to 9 Unit Apartments | 4 | 0.4% |
| 10 or more Apartments | 7 | 0.7% |
| Mobile Home / Other | 22 | 2.1% |
| Total | 1,028 | 100.0% |
Housing Structures by Occupancy in New Haven
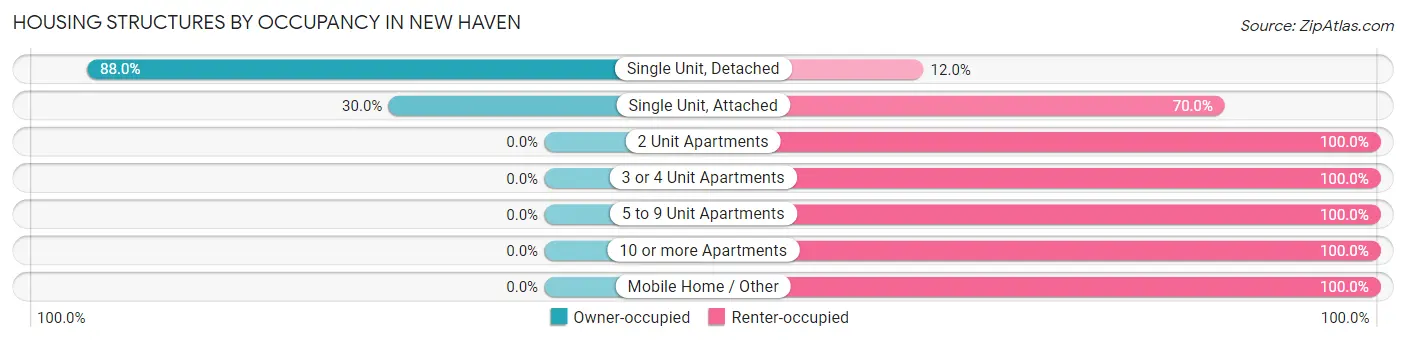
| Structure Type | Owner-occupied | Renter-occupied |
| Single Unit, Detached | 812 (88.0%) | 111 (12.0%) |
| Single Unit, Attached | 9 (30.0%) | 21 (70.0%) |
| 2 Unit Apartments | 0 (0.0%) | 17 (100.0%) |
| 3 or 4 Unit Apartments | 0 (0.0%) | 25 (100.0%) |
| 5 to 9 Unit Apartments | 0 (0.0%) | 4 (100.0%) |
| 10 or more Apartments | 0 (0.0%) | 7 (100.0%) |
| Mobile Home / Other | 0 (0.0%) | 22 (100.0%) |
| Total | 821 (79.9%) | 207 (20.1%) |
Housing Structures by Number of Rooms in New Haven
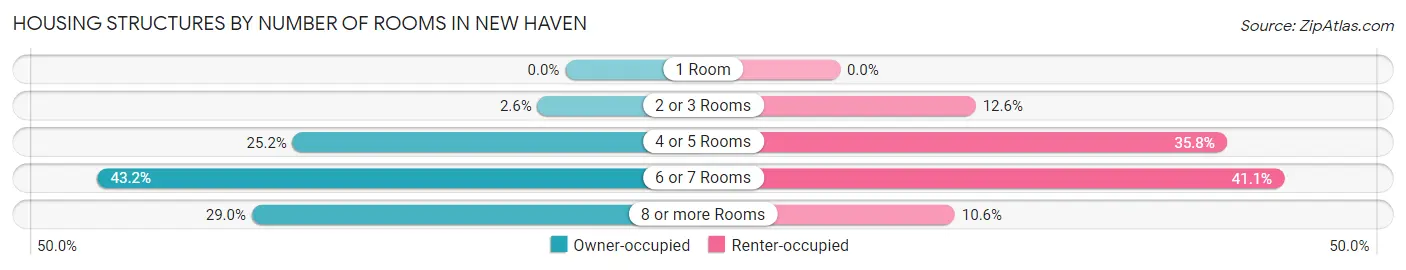
| Number of Rooms | Owner-occupied | Renter-occupied |
| 1 Room | 0 (0.0%) | 0 (0.0%) |
| 2 or 3 Rooms | 21 (2.6%) | 26 (12.6%) |
| 4 or 5 Rooms | 207 (25.2%) | 74 (35.7%) |
| 6 or 7 Rooms | 355 (43.2%) | 85 (41.1%) |
| 8 or more Rooms | 238 (29.0%) | 22 (10.6%) |
| Total | 821 (100.0%) | 207 (100.0%) |
Housing Structure by Heating Type in New Haven
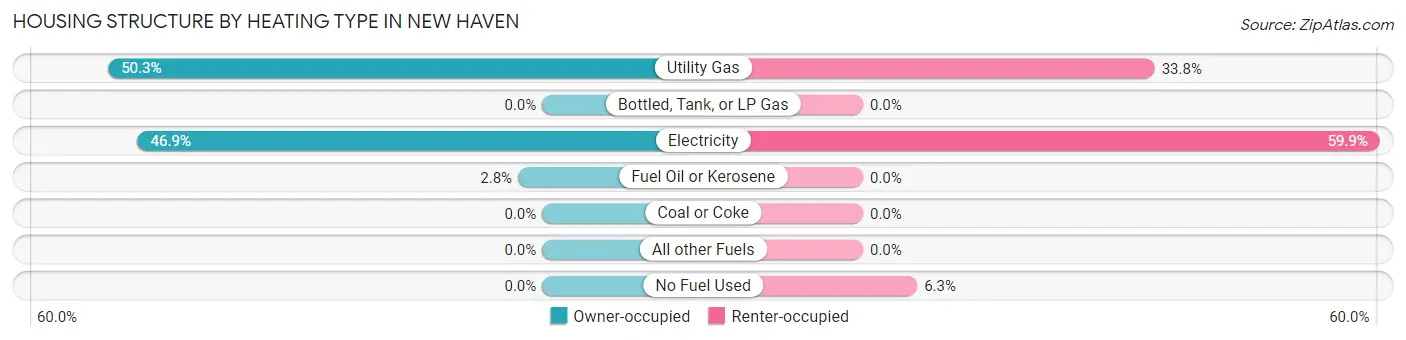
| Heating Type | Owner-occupied | Renter-occupied |
| Utility Gas | 413 (50.3%) | 70 (33.8%) |
| Bottled, Tank, or LP Gas | 0 (0.0%) | 0 (0.0%) |
| Electricity | 385 (46.9%) | 124 (59.9%) |
| Fuel Oil or Kerosene | 23 (2.8%) | 0 (0.0%) |
| Coal or Coke | 0 (0.0%) | 0 (0.0%) |
| All other Fuels | 0 (0.0%) | 0 (0.0%) |
| No Fuel Used | 0 (0.0%) | 13 (6.3%) |
| Total | 821 (100.0%) | 207 (100.0%) |
Household Vehicle Usage in New Haven
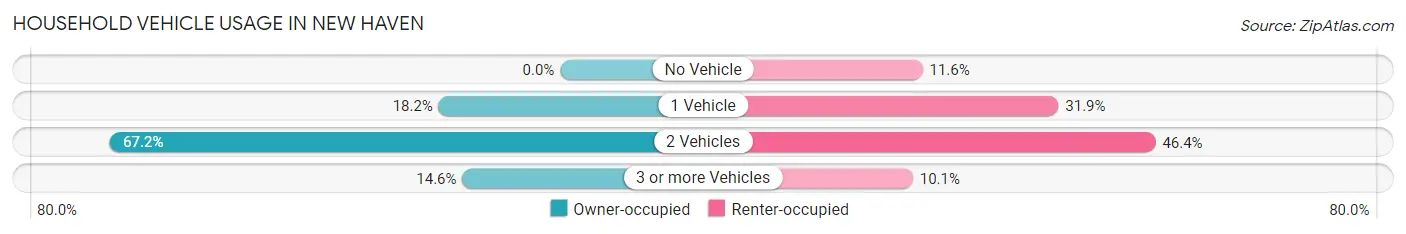
| Vehicles per Household | Owner-occupied | Renter-occupied |
| No Vehicle | 0 (0.0%) | 24 (11.6%) |
| 1 Vehicle | 149 (18.1%) | 66 (31.9%) |
| 2 Vehicles | 552 (67.2%) | 96 (46.4%) |
| 3 or more Vehicles | 120 (14.6%) | 21 (10.1%) |
| Total | 821 (100.0%) | 207 (100.0%) |
Real Estate & Mortgages in New Haven
Real Estate and Mortgage Overview in New Haven
| Characteristic | Without Mortgage | With Mortgage |
| Housing Units | 258 | 563 |
| Median Property Value | $161,600 | $189,000 |
| Median Household Income | $65,753 | $95 |
| Monthly Housing Costs | $569 | $0 |
| Real Estate Taxes | $1,980 | $0 |
Property Value by Mortgage Status in New Haven
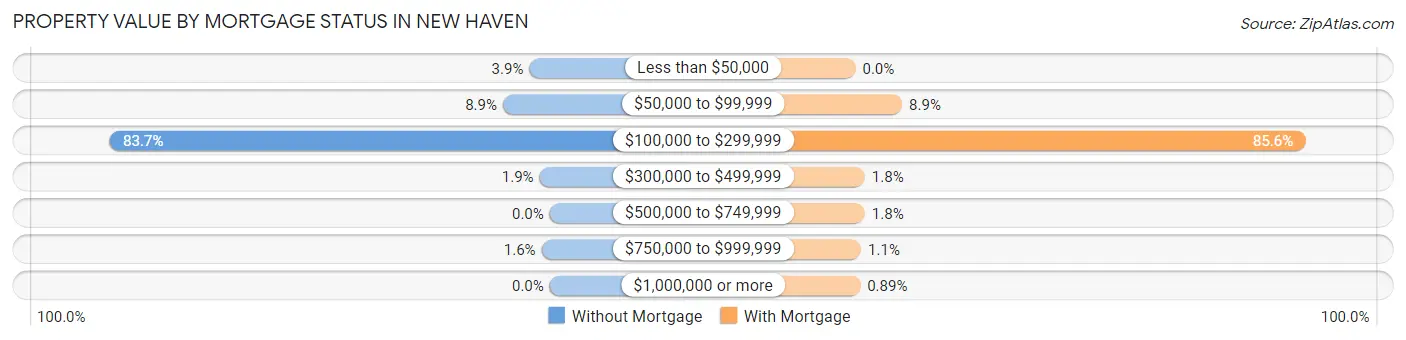
| Property Value | Without Mortgage | With Mortgage |
| Less than $50,000 | 10 (3.9%) | 0 (0.0%) |
| $50,000 to $99,999 | 23 (8.9%) | 50 (8.9%) |
| $100,000 to $299,999 | 216 (83.7%) | 482 (85.6%) |
| $300,000 to $499,999 | 5 (1.9%) | 10 (1.8%) |
| $500,000 to $749,999 | 0 (0.0%) | 10 (1.8%) |
| $750,000 to $999,999 | 4 (1.5%) | 6 (1.1%) |
| $1,000,000 or more | 0 (0.0%) | 5 (0.9%) |
| Total | 258 (100.0%) | 563 (100.0%) |
Household Income by Mortgage Status in New Haven
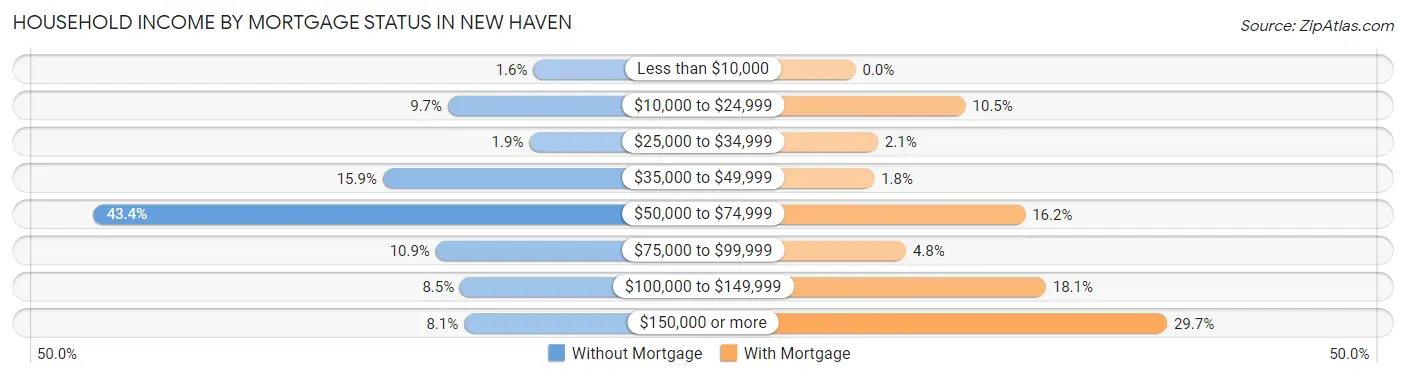
| Household Income | Without Mortgage | With Mortgage |
| Less than $10,000 | 4 (1.5%) | 0 (0.0%) |
| $10,000 to $24,999 | 25 (9.7%) | 59 (10.5%) |
| $25,000 to $34,999 | 5 (1.9%) | 12 (2.1%) |
| $35,000 to $49,999 | 41 (15.9%) | 10 (1.8%) |
| $50,000 to $74,999 | 112 (43.4%) | 91 (16.2%) |
| $75,000 to $99,999 | 28 (10.8%) | 27 (4.8%) |
| $100,000 to $149,999 | 22 (8.5%) | 102 (18.1%) |
| $150,000 or more | 21 (8.1%) | 167 (29.7%) |
| Total | 258 (100.0%) | 563 (100.0%) |
Property Value to Household Income Ratio in New Haven
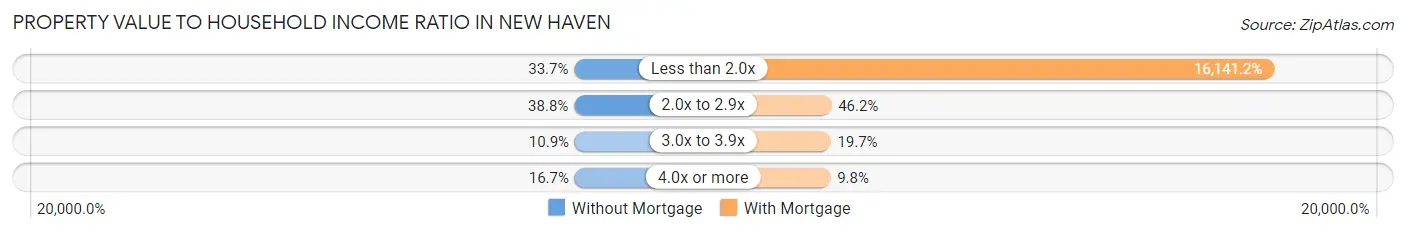
| Value-to-Income Ratio | Without Mortgage | With Mortgage |
| Less than 2.0x | 87 (33.7%) | 90,875 (16,141.2%) |
| 2.0x to 2.9x | 100 (38.8%) | 260 (46.2%) |
| 3.0x to 3.9x | 28 (10.8%) | 111 (19.7%) |
| 4.0x or more | 43 (16.7%) | 55 (9.8%) |
| Total | 258 (100.0%) | 563 (100.0%) |
Real Estate Taxes by Mortgage Status in New Haven
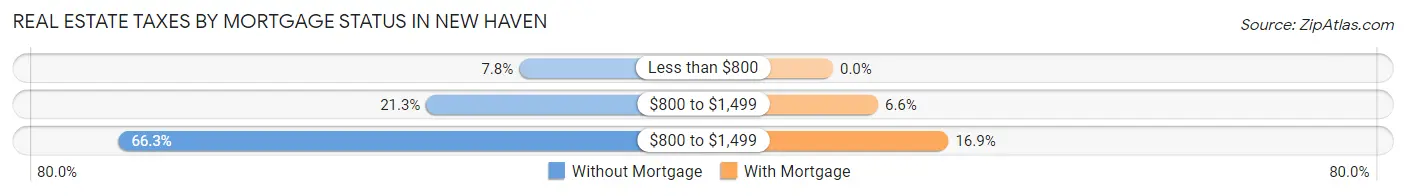
| Property Taxes | Without Mortgage | With Mortgage |
| Less than $800 | 20 (7.7%) | 0 (0.0%) |
| $800 to $1,499 | 55 (21.3%) | 37 (6.6%) |
| $800 to $1,499 | 171 (66.3%) | 95 (16.9%) |
| Total | 258 (100.0%) | 563 (100.0%) |
Health & Disability in New Haven
Health Insurance Coverage by Age in New Haven
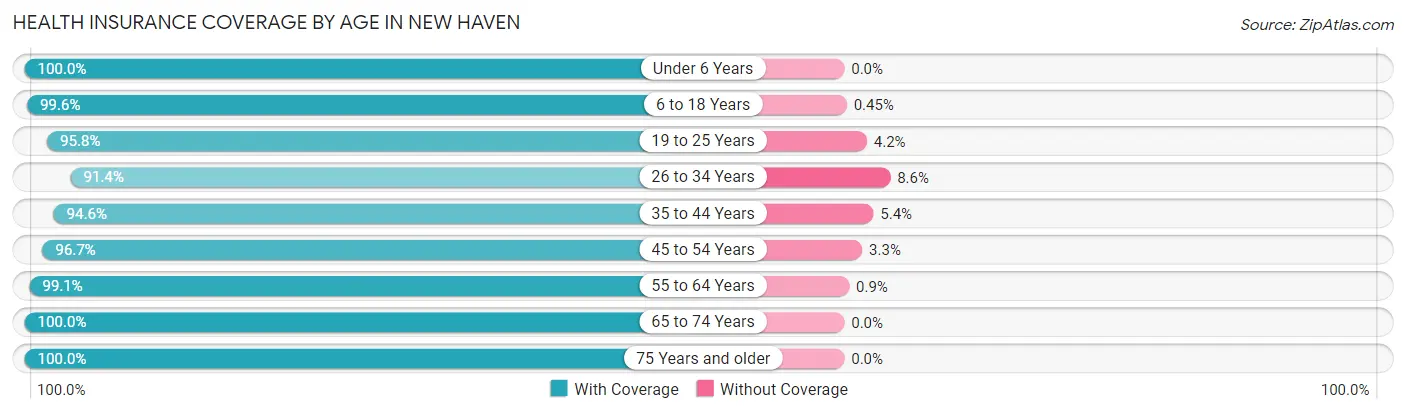
| Age Bracket | With Coverage | Without Coverage |
| Under 6 Years | 230 (100.0%) | 0 (0.0%) |
| 6 to 18 Years | 876 (99.6%) | 4 (0.4%) |
| 19 to 25 Years | 251 (95.8%) | 11 (4.2%) |
| 26 to 34 Years | 416 (91.4%) | 39 (8.6%) |
| 35 to 44 Years | 384 (94.6%) | 22 (5.4%) |
| 45 to 54 Years | 261 (96.7%) | 9 (3.3%) |
| 55 to 64 Years | 442 (99.1%) | 4 (0.9%) |
| 65 to 74 Years | 213 (100.0%) | 0 (0.0%) |
| 75 Years and older | 81 (100.0%) | 0 (0.0%) |
| Total | 3,154 (97.3%) | 89 (2.7%) |
Health Insurance Coverage by Citizenship Status in New Haven
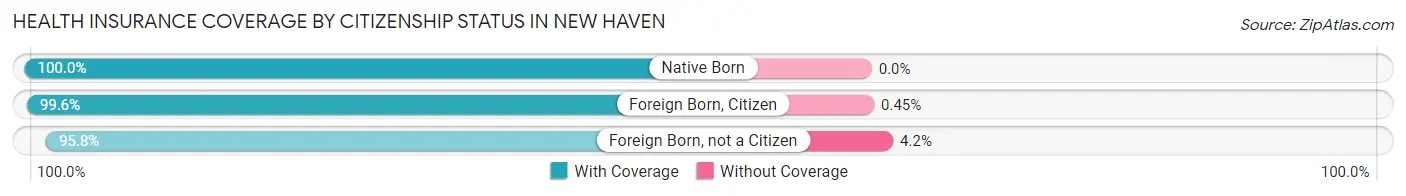
| Citizenship Status | With Coverage | Without Coverage |
| Native Born | 230 (100.0%) | 0 (0.0%) |
| Foreign Born, Citizen | 876 (99.6%) | 4 (0.4%) |
| Foreign Born, not a Citizen | 251 (95.8%) | 11 (4.2%) |
Health Insurance Coverage by Household Income in New Haven
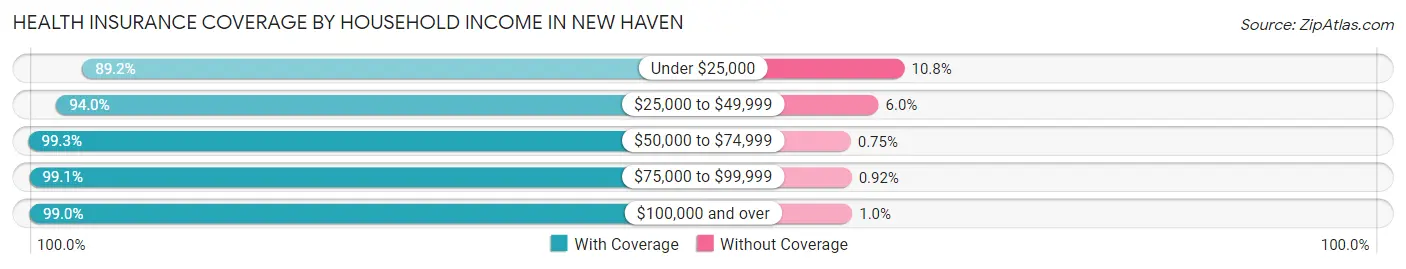
| Household Income | With Coverage | Without Coverage |
| Under $25,000 | 272 (89.2%) | 33 (10.8%) |
| $25,000 to $49,999 | 536 (94.0%) | 34 (6.0%) |
| $50,000 to $74,999 | 666 (99.3%) | 5 (0.7%) |
| $75,000 to $99,999 | 433 (99.1%) | 4 (0.9%) |
| $100,000 and over | 1,247 (99.0%) | 13 (1.0%) |
Public vs Private Health Insurance Coverage by Age in New Haven
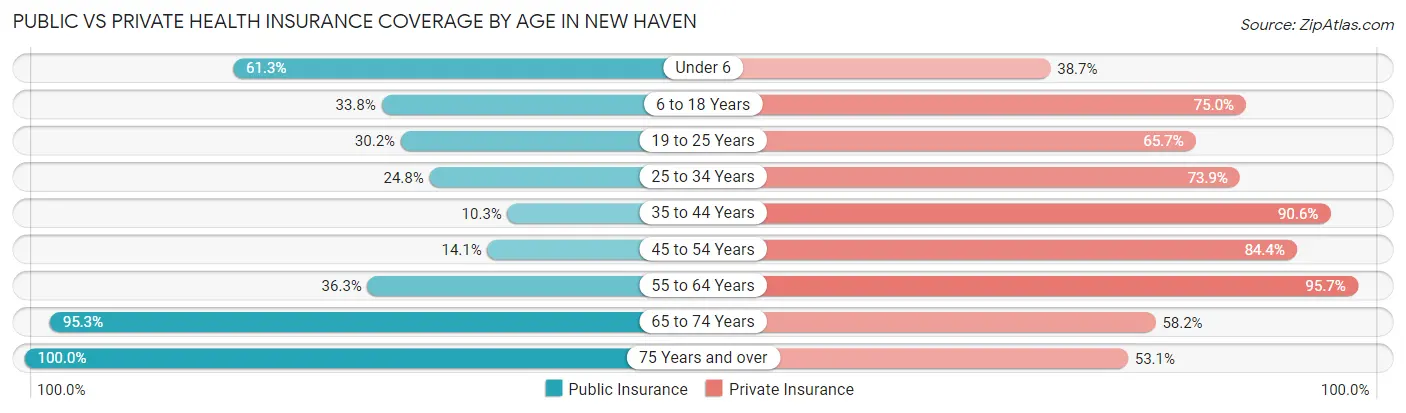
| Age Bracket | Public Insurance | Private Insurance |
| Under 6 | 141 (61.3%) | 89 (38.7%) |
| 6 to 18 Years | 297 (33.8%) | 660 (75.0%) |
| 19 to 25 Years | 79 (30.1%) | 172 (65.6%) |
| 25 to 34 Years | 113 (24.8%) | 336 (73.9%) |
| 35 to 44 Years | 42 (10.3%) | 368 (90.6%) |
| 45 to 54 Years | 38 (14.1%) | 228 (84.4%) |
| 55 to 64 Years | 162 (36.3%) | 427 (95.7%) |
| 65 to 74 Years | 203 (95.3%) | 124 (58.2%) |
| 75 Years and over | 81 (100.0%) | 43 (53.1%) |
| Total | 1,156 (35.6%) | 2,447 (75.4%) |
Disability Status by Sex by Age in New Haven
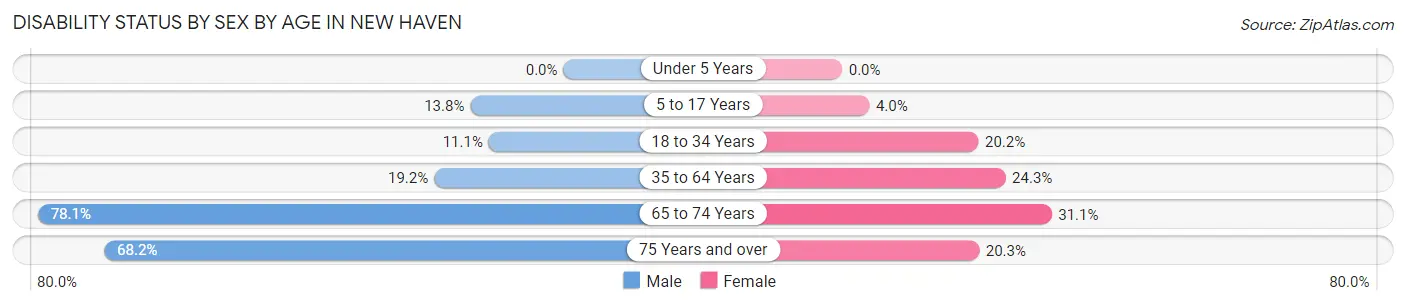
| Age Bracket | Male | Female |
| Under 5 Years | 0 (0.0%) | 0 (0.0%) |
| 5 to 17 Years | 74 (13.8%) | 12 (4.0%) |
| 18 to 34 Years | 37 (11.1%) | 89 (20.2%) |
| 35 to 64 Years | 111 (19.2%) | 132 (24.3%) |
| 65 to 74 Years | 96 (78.0%) | 28 (31.1%) |
| 75 Years and over | 15 (68.2%) | 12 (20.3%) |
Disability Class by Sex by Age in New Haven
Disability Class: Hearing Difficulty
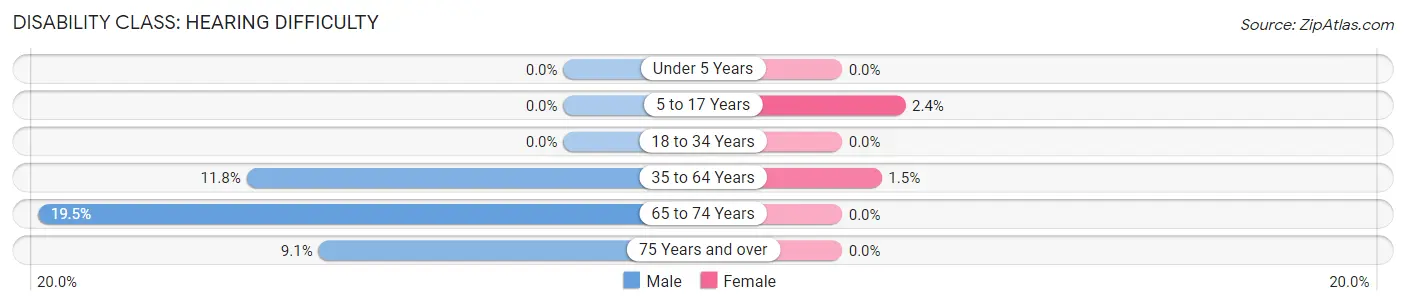
| Age Bracket | Male | Female |
| Under 5 Years | 0 (0.0%) | 0 (0.0%) |
| 5 to 17 Years | 0 (0.0%) | 7 (2.4%) |
| 18 to 34 Years | 0 (0.0%) | 0 (0.0%) |
| 35 to 64 Years | 68 (11.8%) | 8 (1.5%) |
| 65 to 74 Years | 24 (19.5%) | 0 (0.0%) |
| 75 Years and over | 2 (9.1%) | 0 (0.0%) |
Disability Class: Vision Difficulty
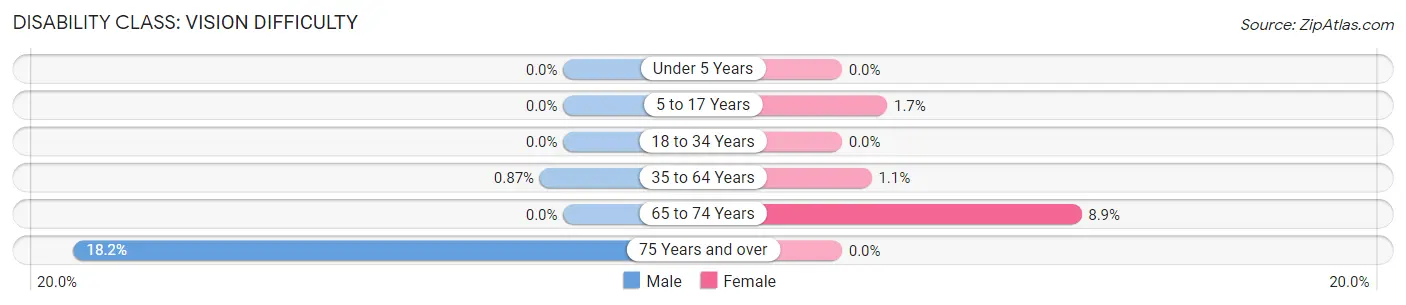
| Age Bracket | Male | Female |
| Under 5 Years | 0 (0.0%) | 0 (0.0%) |
| 5 to 17 Years | 0 (0.0%) | 5 (1.7%) |
| 18 to 34 Years | 0 (0.0%) | 0 (0.0%) |
| 35 to 64 Years | 5 (0.9%) | 6 (1.1%) |
| 65 to 74 Years | 0 (0.0%) | 8 (8.9%) |
| 75 Years and over | 4 (18.2%) | 0 (0.0%) |
Disability Class: Cognitive Difficulty
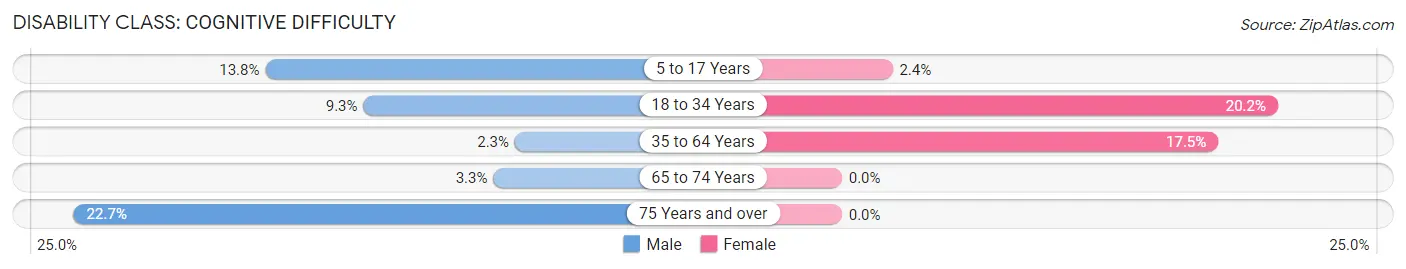
| Age Bracket | Male | Female |
| 5 to 17 Years | 74 (13.8%) | 7 (2.4%) |
| 18 to 34 Years | 31 (9.3%) | 89 (20.2%) |
| 35 to 64 Years | 13 (2.2%) | 95 (17.5%) |
| 65 to 74 Years | 4 (3.3%) | 0 (0.0%) |
| 75 Years and over | 5 (22.7%) | 0 (0.0%) |
Disability Class: Ambulatory Difficulty
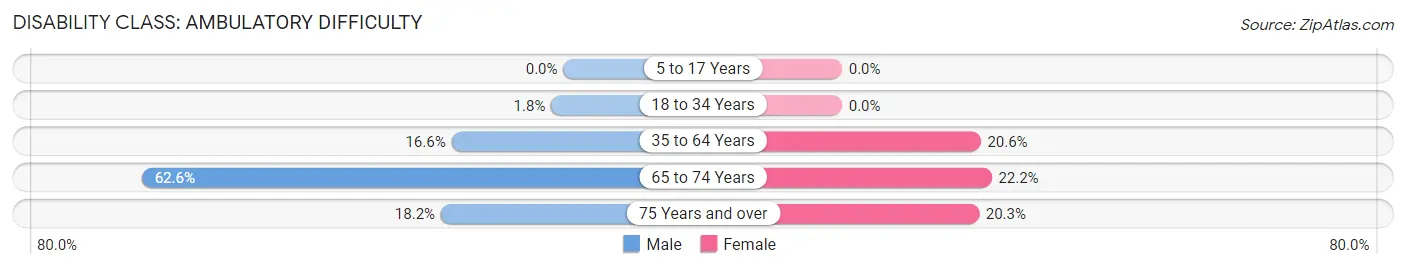
| Age Bracket | Male | Female |
| 5 to 17 Years | 0 (0.0%) | 0 (0.0%) |
| 18 to 34 Years | 6 (1.8%) | 0 (0.0%) |
| 35 to 64 Years | 96 (16.6%) | 112 (20.6%) |
| 65 to 74 Years | 77 (62.6%) | 20 (22.2%) |
| 75 Years and over | 4 (18.2%) | 12 (20.3%) |
Disability Class: Self-Care Difficulty
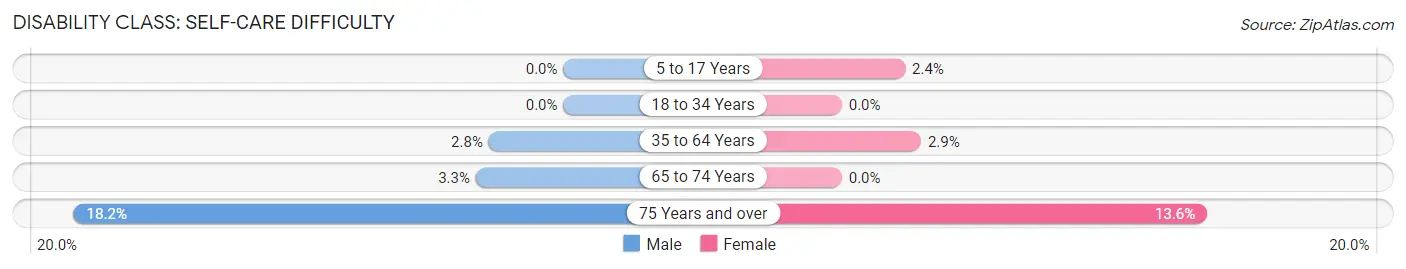
| Age Bracket | Male | Female |
| 5 to 17 Years | 0 (0.0%) | 7 (2.4%) |
| 18 to 34 Years | 0 (0.0%) | 0 (0.0%) |
| 35 to 64 Years | 16 (2.8%) | 16 (2.9%) |
| 65 to 74 Years | 4 (3.3%) | 0 (0.0%) |
| 75 Years and over | 4 (18.2%) | 8 (13.6%) |
Technology Access in New Haven
Computing Device Access in New Haven
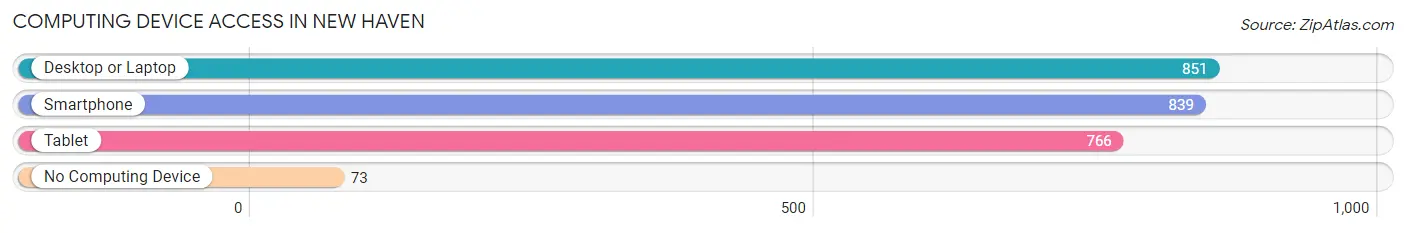
| Device Type | # Households | % Households |
| Desktop or Laptop | 851 | 82.8% |
| Smartphone | 839 | 81.6% |
| Tablet | 766 | 74.5% |
| No Computing Device | 73 | 7.1% |
| Total | 1,028 | 100.0% |
Internet Access in New Haven
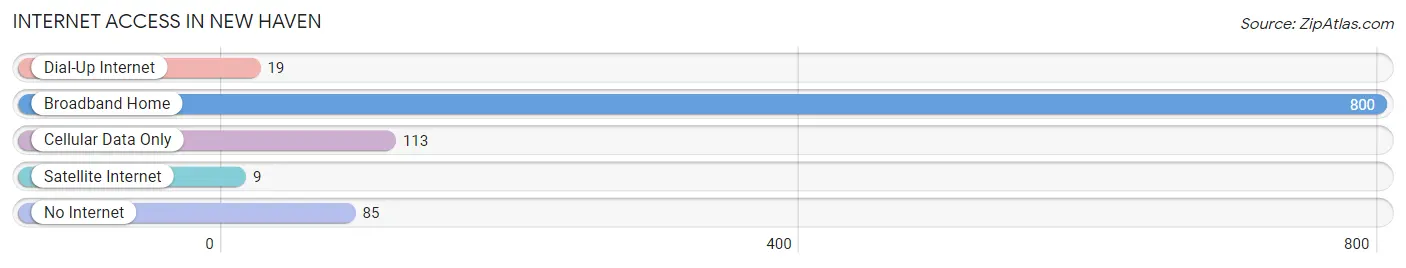
| Internet Type | # Households | % Households |
| Dial-Up Internet | 19 | 1.8% |
| Broadband Home | 800 | 77.8% |
| Cellular Data Only | 113 | 11.0% |
| Satellite Internet | 9 | 0.9% |
| No Internet | 85 | 8.3% |
| Total | 1,028 | 100.0% |
New Haven Summary
New Haven, Missouri is a small city located in Franklin County, Missouri. It is situated on the banks of the Missouri River, approximately 40 miles west of St. Louis. The city has a population of approximately 2,500 people and is the county seat of Franklin County.
History
New Haven was founded in 1819 by a group of German immigrants led by John Jacoby. The city was named after the German city of Neu-Haven, which was the birthplace of Jacoby. The city was originally a farming community, but it soon developed into a trading center for the surrounding area.
In 1821, the first post office was established in New Haven. The city was incorporated in 1872 and was designated as the county seat of Franklin County.
In the late 19th century, New Haven was a major stop on the St. Louis-San Francisco Railway. The city was also home to several manufacturing plants, including a brick factory, a flour mill, and a furniture factory.
Geography
New Haven is located in the Ozark Mountains region of Missouri. The city is situated on the banks of the Missouri River, approximately 40 miles west of St. Louis. The city has a total area of 2.2 square miles, all of which is land.
The climate in New Haven is humid subtropical, with hot, humid summers and cold, wet winters. The average annual temperature is around 54 degrees Fahrenheit.
Economy
The economy of New Haven is largely based on agriculture and manufacturing. The city is home to several manufacturing plants, including a brick factory, a flour mill, and a furniture factory.
The city is also home to several small businesses, including restaurants, retail stores, and service providers. The city is also home to a number of tourist attractions, including the historic New Haven Opera House and the Franklin County Museum.
Demographics
As of the 2010 census, the population of New Haven was 2,500. The racial makeup of the city was 97.2% White, 0.8% African American, 0.4% Native American, 0.2% Asian, and 1.4% from other races.
The median household income in New Haven was $37,500, and the median family income was $45,000. The per capita income in the city was $19,000. Approximately 16.2% of the population was below the poverty line.
New Haven is served by the Franklin County School District. The city is home to one elementary school, one middle school, and one high school. The city is also home to several private schools, including St. John's Lutheran School and New Haven Christian Academy.
New Haven is served by the Franklin County Public Library. The city is also home to several churches, including St. John's Lutheran Church, New Haven Baptist Church, and New Haven United Methodist Church.
Common Questions
What is Per Capita Income in New Haven?
Per Capita income in New Haven is $31,171.
What is the Median Family Income in New Haven?
Median Family Income in New Haven is $67,266.
What is the Median Household income in New Haven?
Median Household Income in New Haven is $66,410.
What is Income or Wage Gap in New Haven?
Income or Wage Gap in New Haven is 31.9%.
Women in New Haven earn 68.1 cents for every dollar earned by a man.
What is Inequality or Gini Index in New Haven?
Inequality or Gini Index in New Haven is 0.44.
What is the Total Population of New Haven?
Total Population of New Haven is 3,363.
What is the Total Male Population of New Haven?
Total Male Population of New Haven is 1,747.
What is the Total Female Population of New Haven?
Total Female Population of New Haven is 1,616.
What is the Ratio of Males per 100 Females in New Haven?
There are 108.11 Males per 100 Females in New Haven.
What is the Ratio of Females per 100 Males in New Haven?
There are 92.50 Females per 100 Males in New Haven.
What is the Median Population Age in New Haven?
Median Population Age in New Haven is 31.2 Years.
What is the Average Family Size in New Haven
Average Family Size in New Haven is 3.5 People.
What is the Average Household Size in New Haven
Average Household Size in New Haven is 3.1 People.
How Large is the Labor Force in New Haven?
There are 1,529 People in the Labor Forcein in New Haven.
What is the Percentage of People in the Labor Force in New Haven?
61.8% of People are in the Labor Force in New Haven.
What is the Unemployment Rate in New Haven?
Unemployment Rate in New Haven is 4.6%.