Calverton Park, MO Map & Demographics
Calverton Park Map

Calverton Park Overview
$28,993
PER CAPITA INCOME
$69,375
AVG FAMILY INCOME
$62,716
AVG HOUSEHOLD INCOME
7.3%
WAGE / INCOME GAP [ % ]
92.7¢/ $1
WAGE / INCOME GAP [ $ ]
0.42
INEQUALITY / GINI INDEX
1,295
TOTAL POPULATION
632
MALE POPULATION
663
FEMALE POPULATION
95.32
MALES / 100 FEMALES
104.91
FEMALES / 100 MALES
41.5
MEDIAN AGE
3.3
AVG FAMILY SIZE
2.6
AVG HOUSEHOLD SIZE
603
LABOR FORCE [ PEOPLE ]
60.1%
PERCENT IN LABOR FORCE
14.9%
UNEMPLOYMENT RATE
Income in Calverton Park
Income Overview in Calverton Park
Per Capita Income in Calverton Park is $28,993, while median incomes of families and households are $69,375 and $62,716 respectively.
| Characteristic | Number | Measure |
| Per Capita Income | 1,295 | $28,993 |
| Median Family Income | 304 | $69,375 |
| Mean Family Income | 304 | $86,559 |
| Median Household Income | 493 | $62,716 |
| Mean Household Income | 493 | $73,434 |
| Income Deficit | 304 | $0 |
| Wage / Income Gap (%) | 1,295 | 7.32% |
| Wage / Income Gap ($) | 1,295 | 92.68¢ per $1 |
| Gini / Inequality Index | 1,295 | 0.42 |
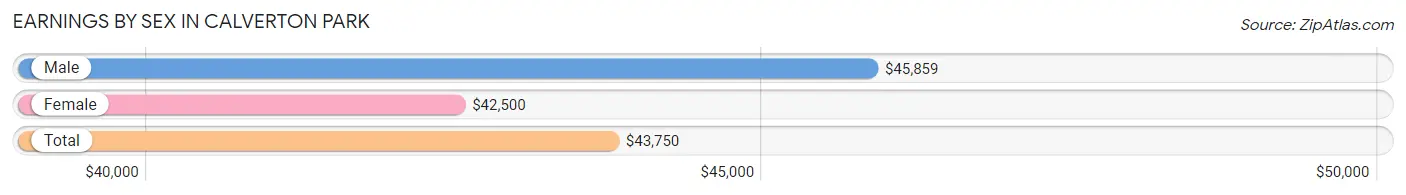
Earnings by Sex in Calverton Park
Average Earnings in Calverton Park are $43,750, $45,859 for men and $42,500 for women, a difference of 7.3%.
| Sex | Number | Average Earnings |
| Male | 305 (51.4%) | $45,859 |
| Female | 288 (48.6%) | $42,500 |
| Total | 593 (100.0%) | $43,750 |
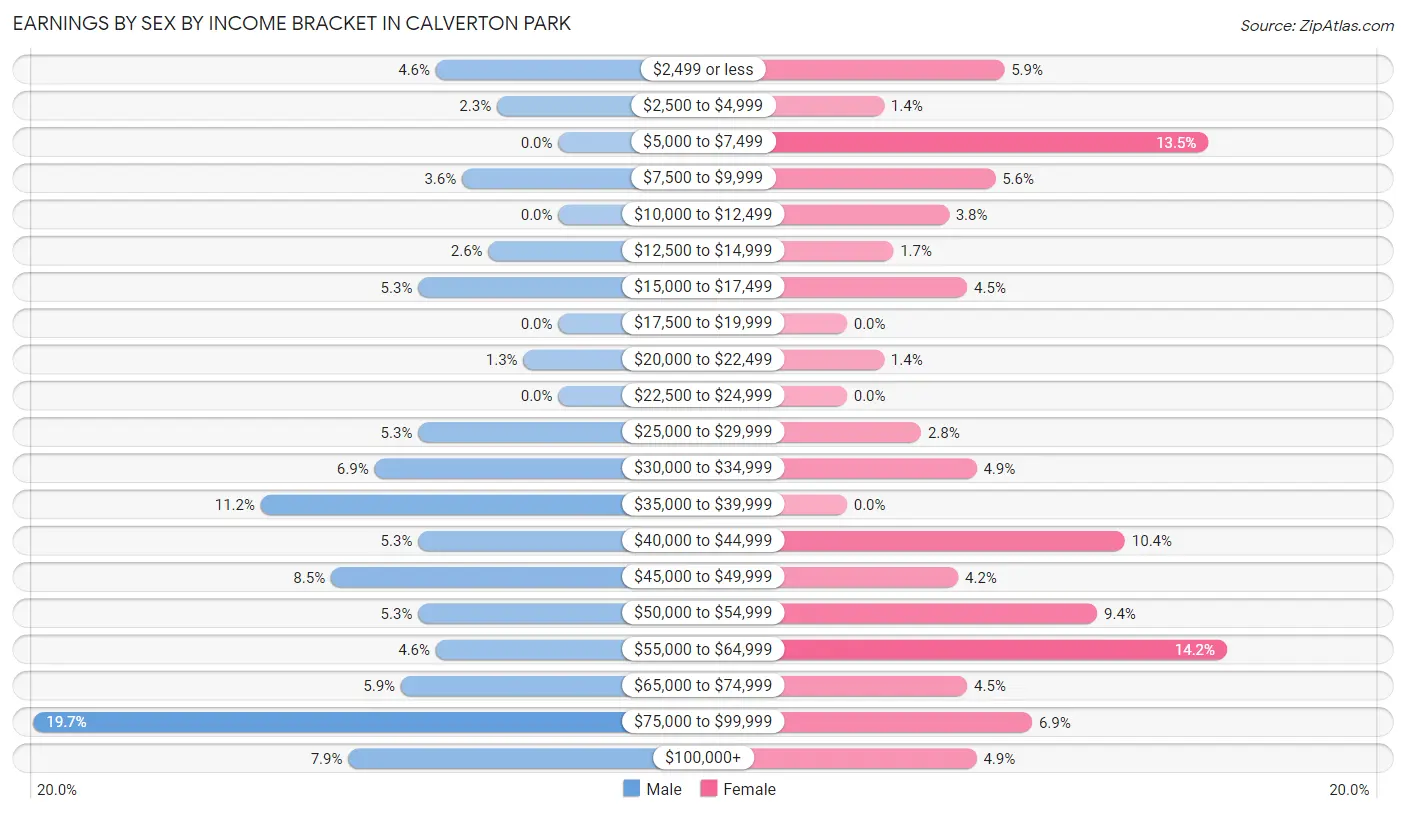
Earnings by Sex by Income Bracket in Calverton Park
The most common earnings brackets in Calverton Park are $75,000 to $99,999 for men (60 | 19.7%) and $55,000 to $64,999 for women (41 | 14.2%).
| Income | Male | Female |
| $2,499 or less | 14 (4.6%) | 17 (5.9%) |
| $2,500 to $4,999 | 7 (2.3%) | 4 (1.4%) |
| $5,000 to $7,499 | 0 (0.0%) | 39 (13.5%) |
| $7,500 to $9,999 | 11 (3.6%) | 16 (5.6%) |
| $10,000 to $12,499 | 0 (0.0%) | 11 (3.8%) |
| $12,500 to $14,999 | 8 (2.6%) | 5 (1.7%) |
| $15,000 to $17,499 | 16 (5.2%) | 13 (4.5%) |
| $17,500 to $19,999 | 0 (0.0%) | 0 (0.0%) |
| $20,000 to $22,499 | 4 (1.3%) | 4 (1.4%) |
| $22,500 to $24,999 | 0 (0.0%) | 0 (0.0%) |
| $25,000 to $29,999 | 16 (5.2%) | 8 (2.8%) |
| $30,000 to $34,999 | 21 (6.9%) | 14 (4.9%) |
| $35,000 to $39,999 | 34 (11.2%) | 0 (0.0%) |
| $40,000 to $44,999 | 16 (5.2%) | 30 (10.4%) |
| $45,000 to $49,999 | 26 (8.5%) | 12 (4.2%) |
| $50,000 to $54,999 | 16 (5.2%) | 27 (9.4%) |
| $55,000 to $64,999 | 14 (4.6%) | 41 (14.2%) |
| $65,000 to $74,999 | 18 (5.9%) | 13 (4.5%) |
| $75,000 to $99,999 | 60 (19.7%) | 20 (6.9%) |
| $100,000+ | 24 (7.9%) | 14 (4.9%) |
| Total | 305 (100.0%) | 288 (100.0%) |
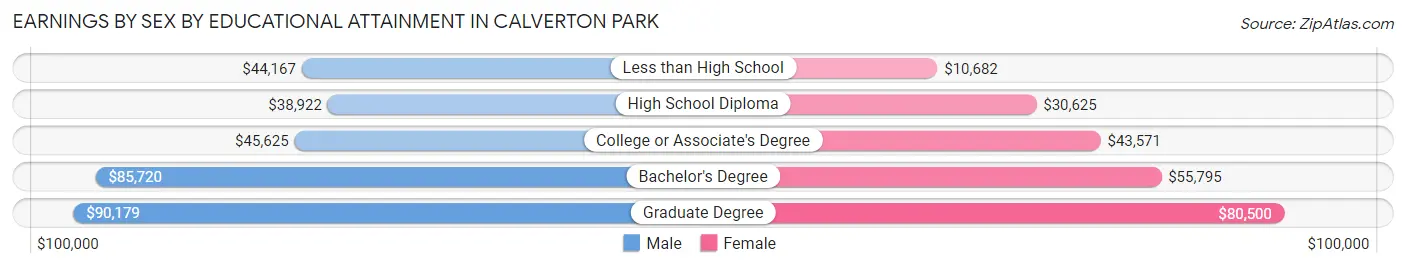
Earnings by Sex by Educational Attainment in Calverton Park
Average earnings in Calverton Park are $47,266 for men and $44,265 for women, a difference of 6.4%. Men with an educational attainment of graduate degree enjoy the highest average annual earnings of $90,179, while those with high school diploma education earn the least with $38,922. Women with an educational attainment of graduate degree earn the most with the average annual earnings of $80,500, while those with less than high school education have the smallest earnings of $10,682.
| Educational Attainment | Male Income | Female Income |
| Less than High School | $44,167 | $10,682 |
| High School Diploma | $38,922 | $30,625 |
| College or Associate's Degree | $45,625 | $43,571 |
| Bachelor's Degree | $85,720 | $55,795 |
| Graduate Degree | $90,179 | $80,500 |
| Total | $47,266 | $44,265 |
Family Income in Calverton Park
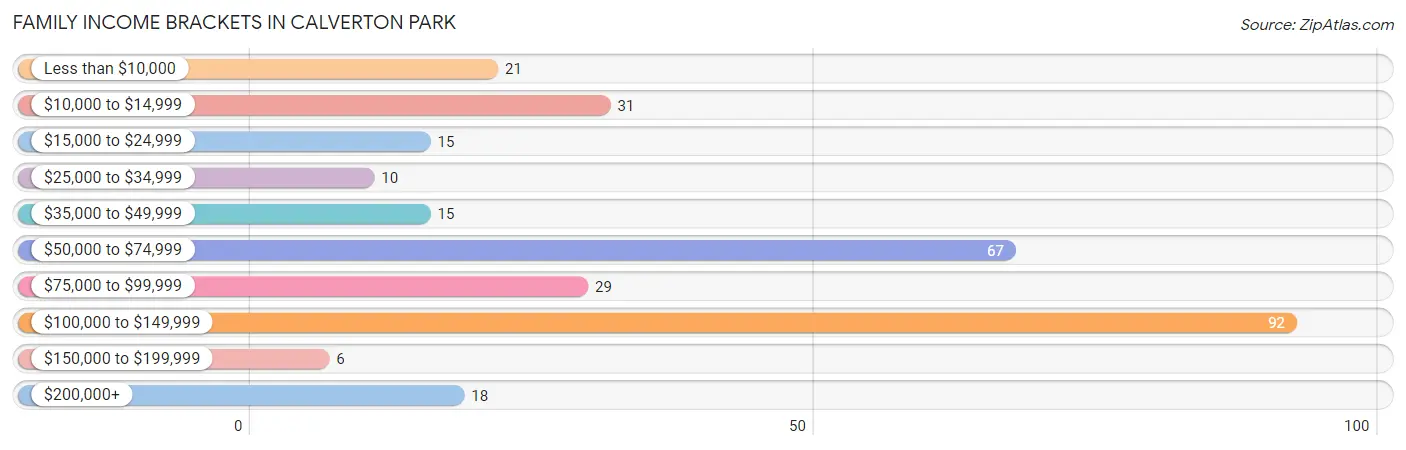
Family Income Brackets in Calverton Park
According to the Calverton Park family income data, there are 92 families falling into the $100,000 to $149,999 income range, which is the most common income bracket and makes up 30.3% of all families. Conversely, the $150,000 to $199,999 income bracket is the least frequent group with only 6 families (2.0%) belonging to this category.
| Income Bracket | # Families | % Families |
| Less than $10,000 | 21 | 6.9% |
| $10,000 to $14,999 | 31 | 10.2% |
| $15,000 to $24,999 | 15 | 4.9% |
| $25,000 to $34,999 | 10 | 3.3% |
| $35,000 to $49,999 | 15 | 4.9% |
| $50,000 to $74,999 | 67 | 22.0% |
| $75,000 to $99,999 | 29 | 9.5% |
| $100,000 to $149,999 | 92 | 30.3% |
| $150,000 to $199,999 | 6 | 2.0% |
| $200,000+ | 18 | 5.9% |
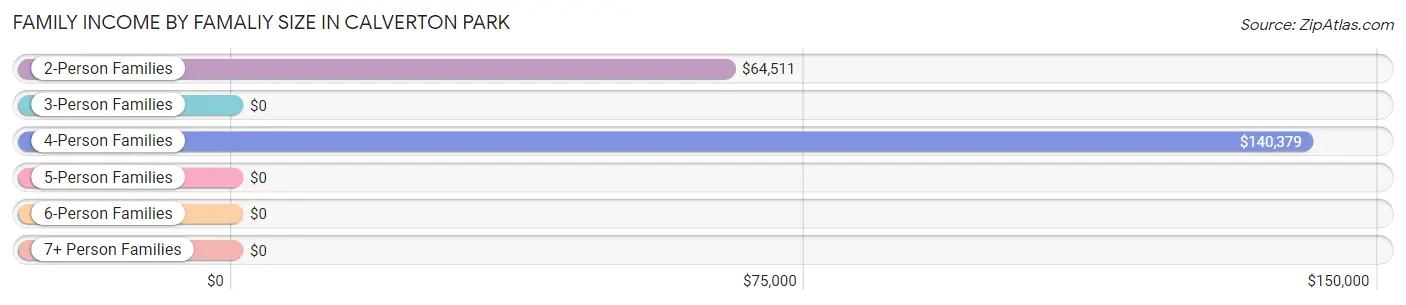
Family Income by Famaliy Size in Calverton Park
4-person families (72 | 23.7%) account for the highest median family income in Calverton Park with $140,379 per family, while 4-person families (72 | 23.7%) have the highest median income of $35,095 per family member.
| Income Bracket | # Families | Median Income |
| 2-Person Families | 137 (45.1%) | $64,511 |
| 3-Person Families | 68 (22.4%) | $0 |
| 4-Person Families | 72 (23.7%) | $140,379 |
| 5-Person Families | 14 (4.6%) | $0 |
| 6-Person Families | 13 (4.3%) | $0 |
| 7+ Person Families | 0 (0.0%) | $0 |
| Total | 304 (100.0%) | $69,375 |
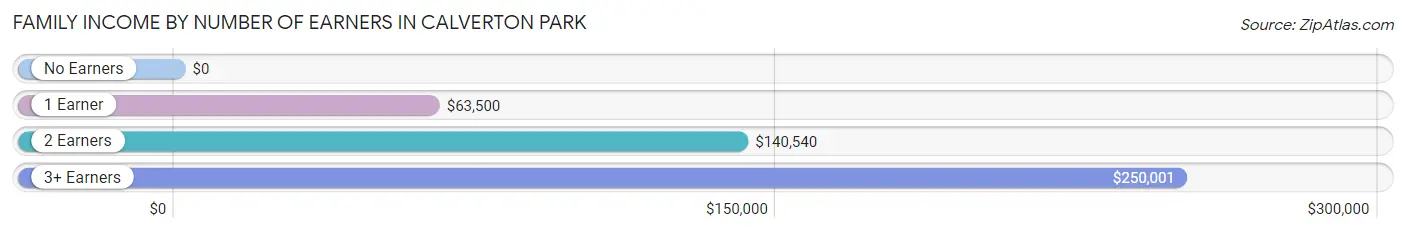
Family Income by Number of Earners in Calverton Park
| Number of Earners | # Families | Median Income |
| No Earners | 68 (22.4%) | $0 |
| 1 Earner | 96 (31.6%) | $63,500 |
| 2 Earners | 129 (42.4%) | $140,540 |
| 3+ Earners | 11 (3.6%) | $250,001 |
| Total | 304 (100.0%) | $69,375 |
Household Income in Calverton Park
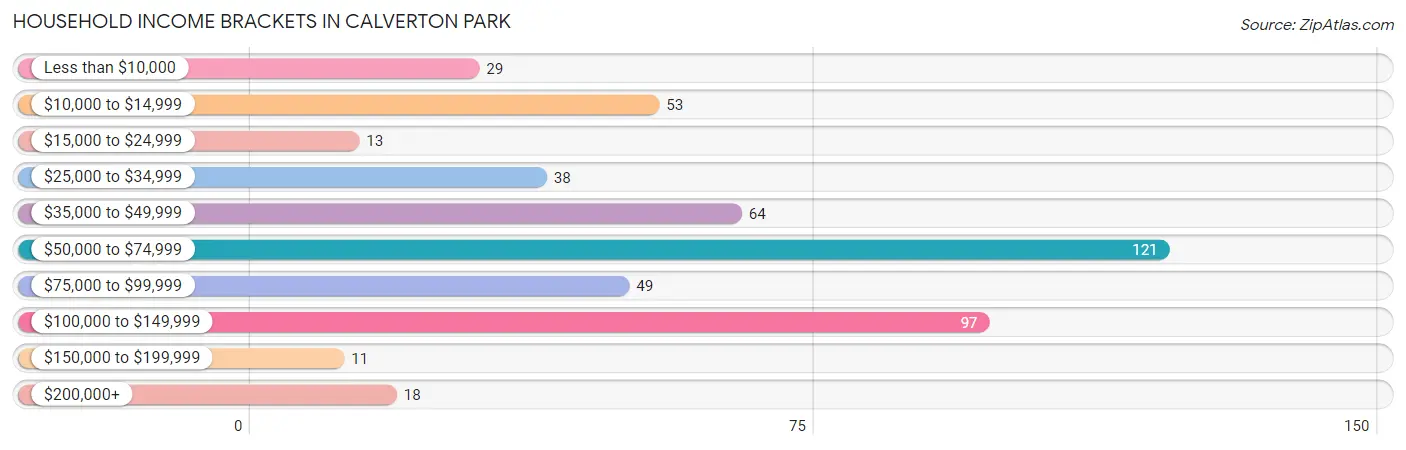
Household Income Brackets in Calverton Park
With 121 households falling in the category, the $50,000 to $74,999 income range is the most frequent in Calverton Park, accounting for 24.5% of all households. In contrast, only 11 households (2.2%) fall into the $150,000 to $199,999 income bracket, making it the least populous group.
| Income Bracket | # Households | % Households |
| Less than $10,000 | 29 | 5.9% |
| $10,000 to $14,999 | 53 | 10.8% |
| $15,000 to $24,999 | 13 | 2.6% |
| $25,000 to $34,999 | 38 | 7.7% |
| $35,000 to $49,999 | 64 | 13.0% |
| $50,000 to $74,999 | 121 | 24.5% |
| $75,000 to $99,999 | 49 | 9.9% |
| $100,000 to $149,999 | 97 | 19.7% |
| $150,000 to $199,999 | 11 | 2.2% |
| $200,000+ | 18 | 3.7% |
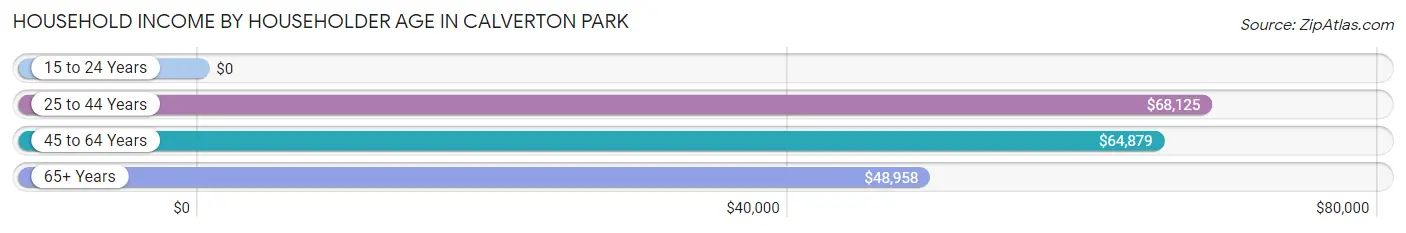
Household Income by Householder Age in Calverton Park
The median household income in Calverton Park is $62,716, with the highest median household income of $68,125 found in the 25 to 44 years age bracket for the primary householder. A total of 155 households (31.4%) fall into this category. Meanwhile, the 15 to 24 years age bracket for the primary householder has the lowest median household income of $0, with 8 households (1.6%) in this group.
| Income Bracket | # Households | Median Income |
| 15 to 24 Years | 8 (1.6%) | $0 |
| 25 to 44 Years | 155 (31.4%) | $68,125 |
| 45 to 64 Years | 163 (33.1%) | $64,879 |
| 65+ Years | 167 (33.9%) | $48,958 |
| Total | 493 (100.0%) | $62,716 |
Poverty in Calverton Park
Income Below Poverty by Sex and Age in Calverton Park
With 14.3% poverty level for males and 29.2% for females among the residents of Calverton Park, 18 to 24 year old males and 16 and 17 year old females are the most vulnerable to poverty, with 29 males (67.4%) and 17 females (100.0%) in their respective age groups living below the poverty level.
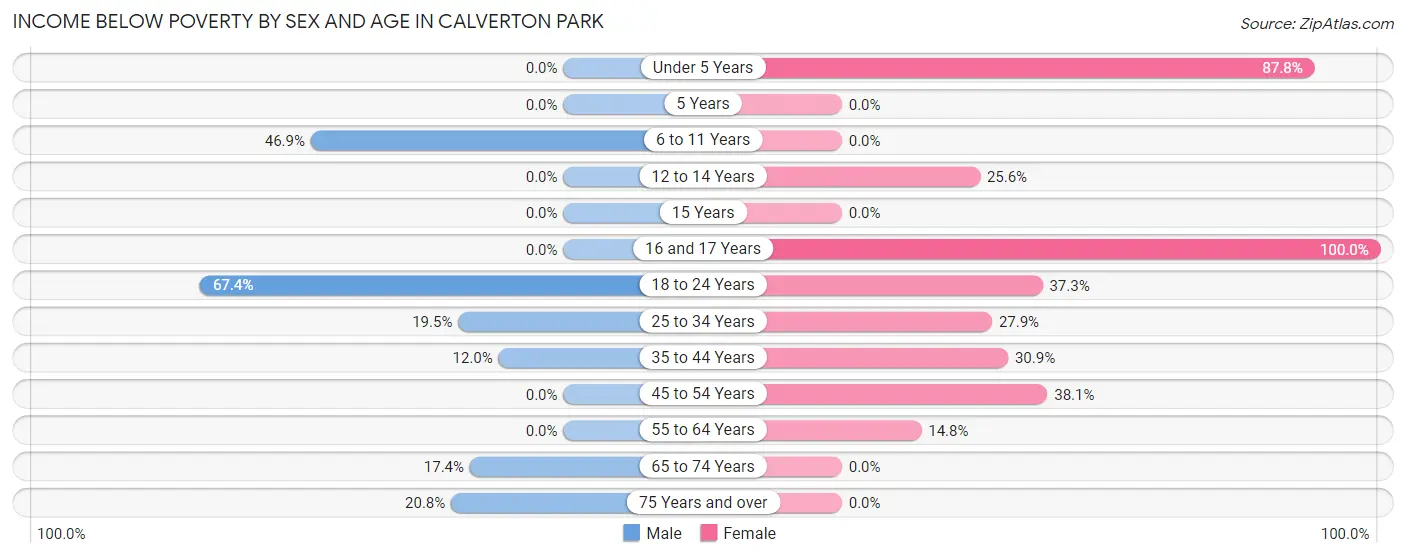
| Age Bracket | Male | Female |
| Under 5 Years | 0 (0.0%) | 43 (87.8%) |
| 5 Years | 0 (0.0%) | 0 (0.0%) |
| 6 to 11 Years | 15 (46.9%) | 0 (0.0%) |
| 12 to 14 Years | 0 (0.0%) | 20 (25.6%) |
| 15 Years | 0 (0.0%) | 0 (0.0%) |
| 16 and 17 Years | 0 (0.0%) | 17 (100.0%) |
| 18 to 24 Years | 29 (67.4%) | 19 (37.2%) |
| 25 to 34 Years | 8 (19.5%) | 17 (27.9%) |
| 35 to 44 Years | 16 (12.0%) | 29 (30.8%) |
| 45 to 54 Years | 0 (0.0%) | 37 (38.1%) |
| 55 to 64 Years | 0 (0.0%) | 9 (14.7%) |
| 65 to 74 Years | 17 (17.3%) | 0 (0.0%) |
| 75 Years and over | 5 (20.8%) | 0 (0.0%) |
| Total | 90 (14.3%) | 191 (29.2%) |
Income Above Poverty by Sex and Age in Calverton Park
According to the poverty statistics in Calverton Park, males aged under 5 years and females aged 5 years are the age groups that are most secure financially, with 100.0% of males and 100.0% of females in these age groups living above the poverty line.
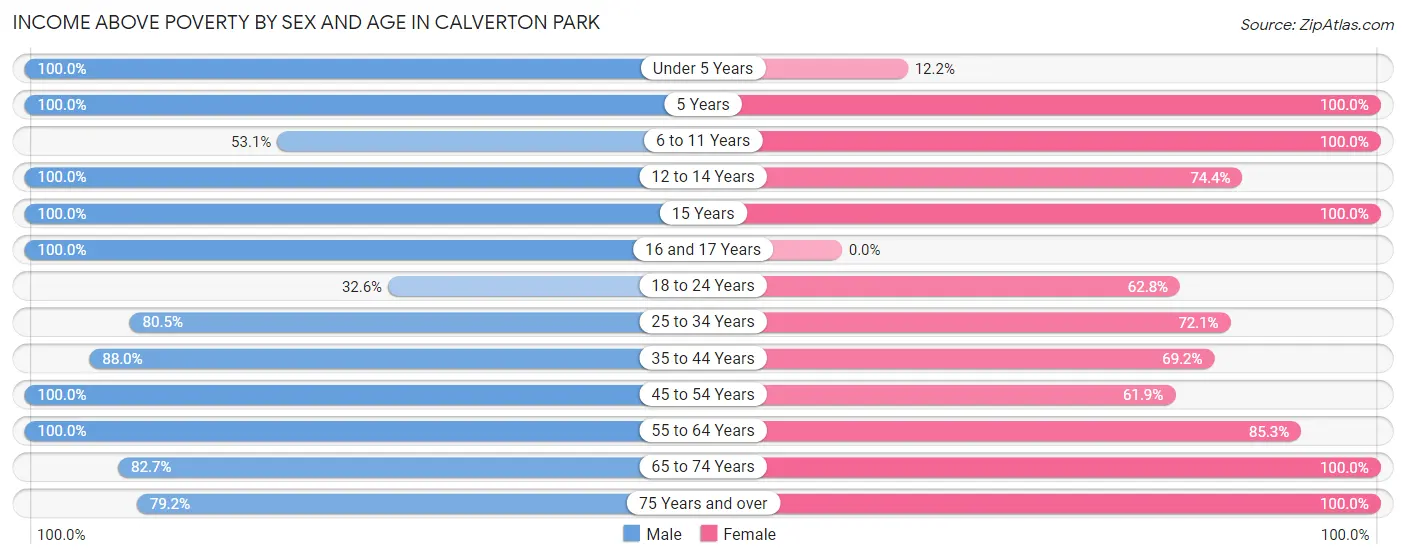
| Age Bracket | Male | Female |
| Under 5 Years | 64 (100.0%) | 6 (12.2%) |
| 5 Years | 5 (100.0%) | 4 (100.0%) |
| 6 to 11 Years | 17 (53.1%) | 16 (100.0%) |
| 12 to 14 Years | 8 (100.0%) | 58 (74.4%) |
| 15 Years | 10 (100.0%) | 11 (100.0%) |
| 16 and 17 Years | 19 (100.0%) | 0 (0.0%) |
| 18 to 24 Years | 14 (32.6%) | 32 (62.7%) |
| 25 to 34 Years | 33 (80.5%) | 44 (72.1%) |
| 35 to 44 Years | 117 (88.0%) | 65 (69.2%) |
| 45 to 54 Years | 82 (100.0%) | 60 (61.9%) |
| 55 to 64 Years | 68 (100.0%) | 52 (85.3%) |
| 65 to 74 Years | 81 (82.7%) | 55 (100.0%) |
| 75 Years and over | 19 (79.2%) | 60 (100.0%) |
| Total | 537 (85.7%) | 463 (70.8%) |
Income Below Poverty Among Married-Couple Families in Calverton Park
The poverty statistics for married-couple families in Calverton Park show that 4.1% or 6 of the total 148 families live below the poverty line. Families with no children have the highest poverty rate of 7.3%, comprising of 6 families. On the other hand, families with 1 or 2 children have the lowest poverty rate of 0.0%, which includes 0 families.
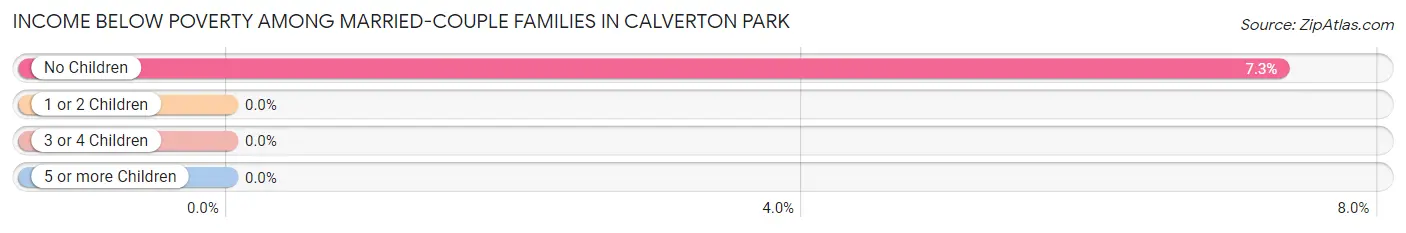
| Children | Above Poverty | Below Poverty |
| No Children | 76 (92.7%) | 6 (7.3%) |
| 1 or 2 Children | 48 (100.0%) | 0 (0.0%) |
| 3 or 4 Children | 18 (100.0%) | 0 (0.0%) |
| 5 or more Children | 0 (0.0%) | 0 (0.0%) |
| Total | 142 (96.0%) | 6 (4.1%) |
Income Below Poverty Among Single-Parent Households in Calverton Park
According to the poverty data in Calverton Park, 15.6% or 5 single-father households and 45.2% or 56 single-mother households are living below the poverty line. Among single-father households, those with 1 or 2 children have the highest poverty rate, with 5 households (100.0%) experiencing poverty. Likewise, among single-mother households, those with 1 or 2 children have the highest poverty rate, with 41 households (73.2%) falling below the poverty line.
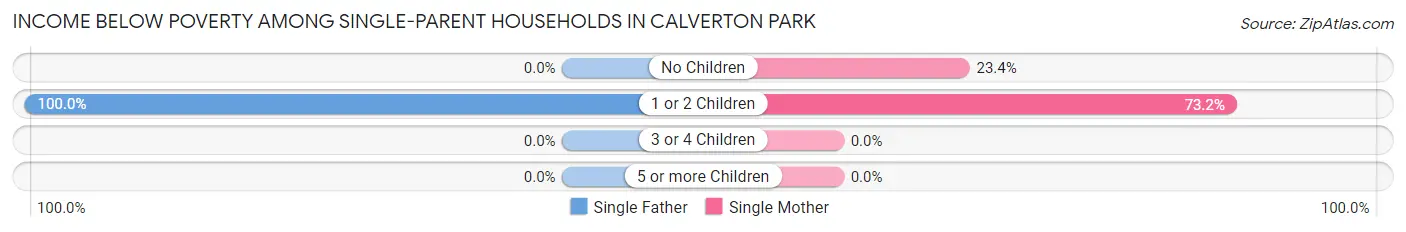
| Children | Single Father | Single Mother |
| No Children | 0 (0.0%) | 15 (23.4%) |
| 1 or 2 Children | 5 (100.0%) | 41 (73.2%) |
| 3 or 4 Children | 0 (0.0%) | 0 (0.0%) |
| 5 or more Children | 0 (0.0%) | 0 (0.0%) |
| Total | 5 (15.6%) | 56 (45.2%) |
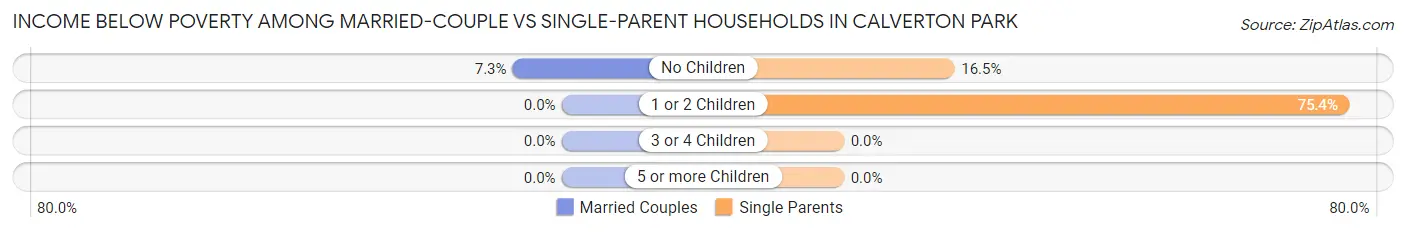
Income Below Poverty Among Married-Couple vs Single-Parent Households in Calverton Park
The poverty data for Calverton Park shows that 6 of the married-couple family households (4.1%) and 61 of the single-parent households (39.1%) are living below the poverty level. Within the married-couple family households, those with no children have the highest poverty rate, with 6 households (7.3%) falling below the poverty line. Among the single-parent households, those with 1 or 2 children have the highest poverty rate, with 46 household (75.4%) living below poverty.
| Children | Married-Couple Families | Single-Parent Households |
| No Children | 6 (7.3%) | 15 (16.5%) |
| 1 or 2 Children | 0 (0.0%) | 46 (75.4%) |
| 3 or 4 Children | 0 (0.0%) | 0 (0.0%) |
| 5 or more Children | 0 (0.0%) | 0 (0.0%) |
| Total | 6 (4.1%) | 61 (39.1%) |
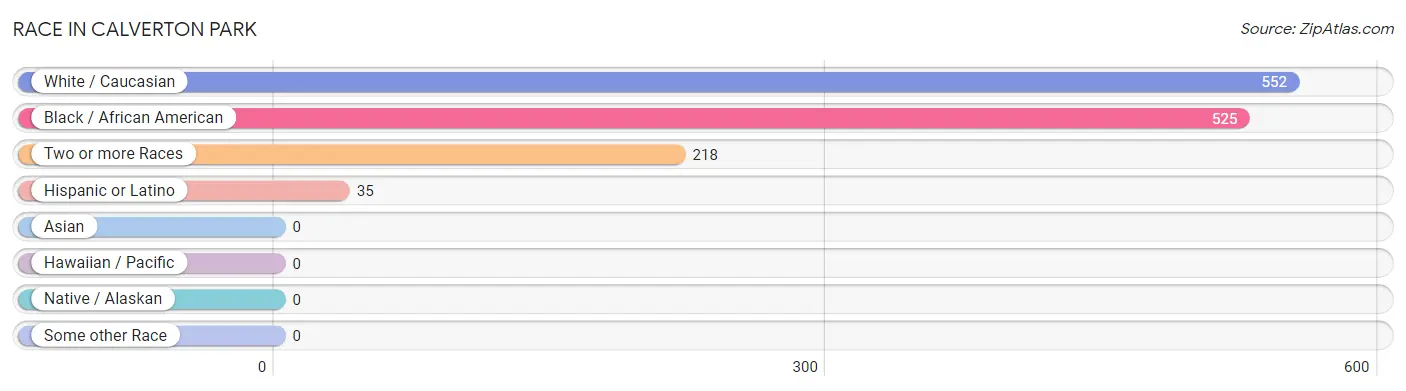
Race in Calverton Park
The most populous races in Calverton Park are White / Caucasian (552 | 42.6%), Black / African American (525 | 40.5%), and Two or more Races (218 | 16.8%).
| Race | # Population | % Population |
| Asian | 0 | 0.0% |
| Black / African American | 525 | 40.5% |
| Hawaiian / Pacific | 0 | 0.0% |
| Hispanic or Latino | 35 | 2.7% |
| Native / Alaskan | 0 | 0.0% |
| White / Caucasian | 552 | 42.6% |
| Two or more Races | 218 | 16.8% |
| Some other Race | 0 | 0.0% |
| Total | 1,295 | 100.0% |
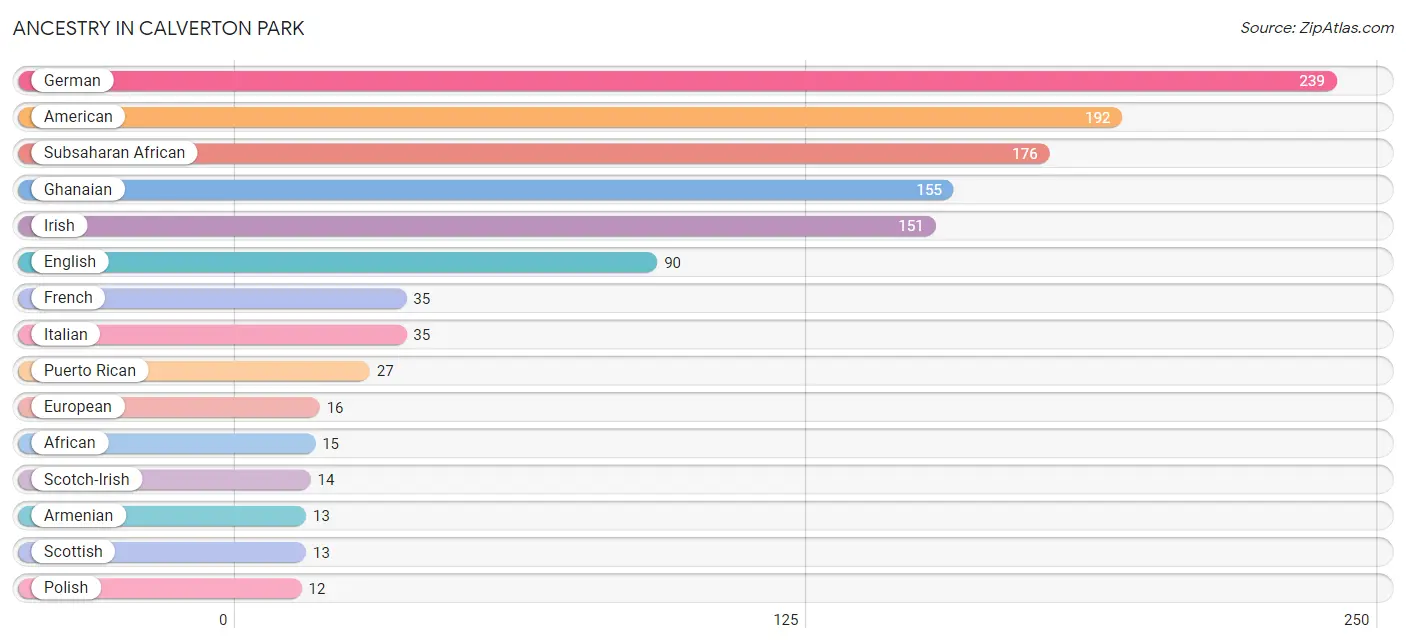
Ancestry in Calverton Park
The most populous ancestries reported in Calverton Park are German (239 | 18.5%), American (192 | 14.8%), Subsaharan African (176 | 13.6%), Ghanaian (155 | 12.0%), and Irish (151 | 11.7%), together accounting for 70.5% of all Calverton Park residents.
| Ancestry | # Population | % Population |
| African | 15 | 1.2% |
| American | 192 | 14.8% |
| Armenian | 13 | 1.0% |
| Bhutanese | 6 | 0.5% |
| Croatian | 6 | 0.5% |
| Czech | 3 | 0.2% |
| Dutch | 3 | 0.2% |
| Dutch West Indian | 6 | 0.5% |
| English | 90 | 7.0% |
| European | 16 | 1.2% |
| French | 35 | 2.7% |
| German | 239 | 18.5% |
| Ghanaian | 155 | 12.0% |
| Irish | 151 | 11.7% |
| Italian | 35 | 2.7% |
| Mexican | 8 | 0.6% |
| Nigerian | 6 | 0.5% |
| Northern European | 3 | 0.2% |
| Norwegian | 5 | 0.4% |
| Polish | 12 | 0.9% |
| Puerto Rican | 27 | 2.1% |
| Scotch-Irish | 14 | 1.1% |
| Scottish | 13 | 1.0% |
| Subsaharan African | 176 | 13.6% |
| Swiss | 3 | 0.2% |
| Welsh | 4 | 0.3% | View All 26 Rows |
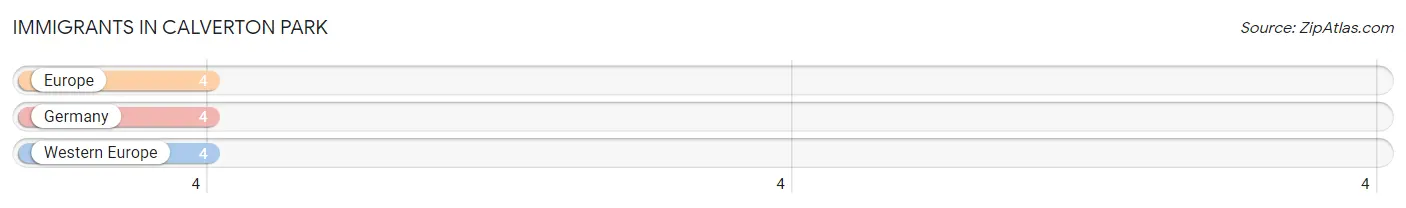
Immigrants in Calverton Park
The most numerous immigrant groups reported in Calverton Park came from Europe (4 | 0.3%), Germany (4 | 0.3%), and Western Europe (4 | 0.3%), together accounting for 0.9% of all Calverton Park residents.
| Immigration Origin | # Population | % Population |
| Europe | 4 | 0.3% |
| Germany | 4 | 0.3% |
| Western Europe | 4 | 0.3% | View All 3 Rows |
Sex and Age in Calverton Park
Sex and Age in Calverton Park
The most populous age groups in Calverton Park are 40 to 44 Years (100 | 15.8%) for men and 10 to 14 Years (89 | 13.4%) for women.
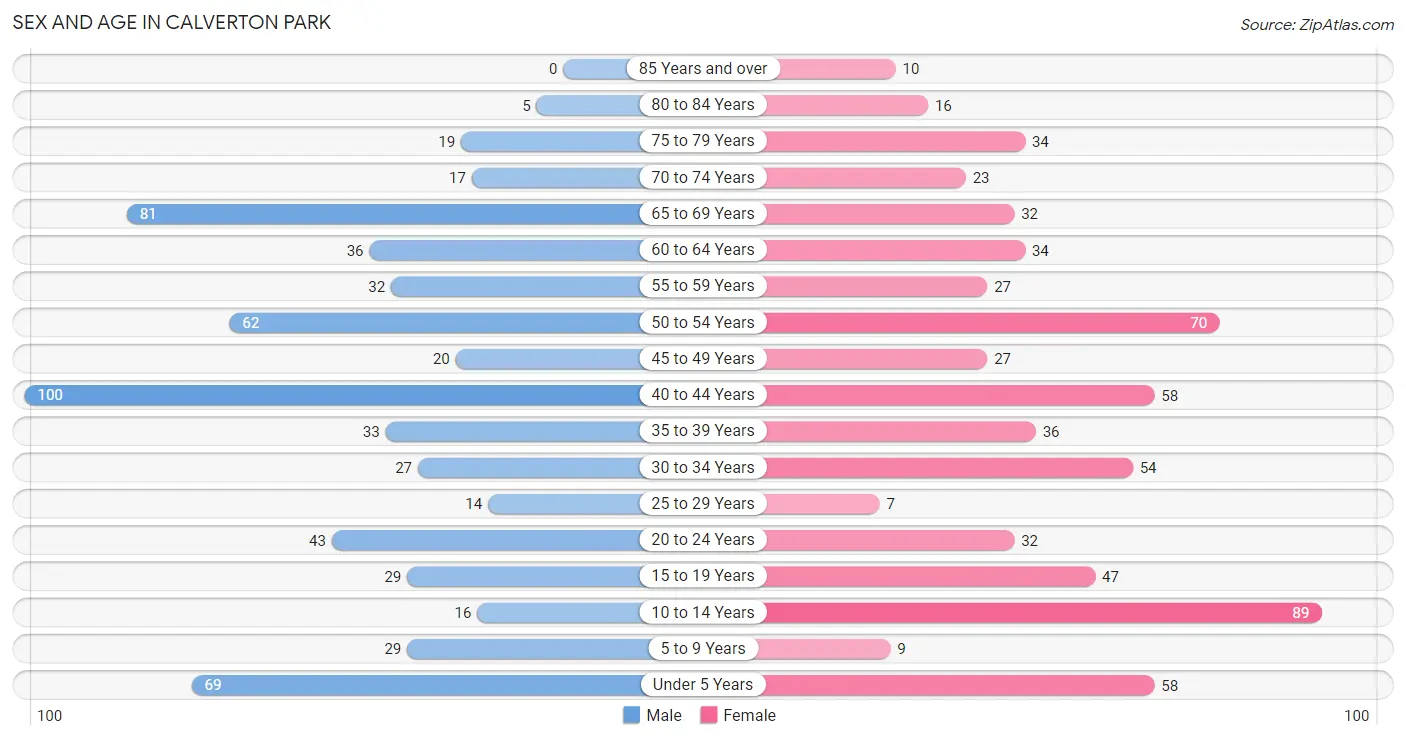
| Age Bracket | Male | Female |
| Under 5 Years | 69 (10.9%) | 58 (8.7%) |
| 5 to 9 Years | 29 (4.6%) | 9 (1.4%) |
| 10 to 14 Years | 16 (2.5%) | 89 (13.4%) |
| 15 to 19 Years | 29 (4.6%) | 47 (7.1%) |
| 20 to 24 Years | 43 (6.8%) | 32 (4.8%) |
| 25 to 29 Years | 14 (2.2%) | 7 (1.1%) |
| 30 to 34 Years | 27 (4.3%) | 54 (8.1%) |
| 35 to 39 Years | 33 (5.2%) | 36 (5.4%) |
| 40 to 44 Years | 100 (15.8%) | 58 (8.7%) |
| 45 to 49 Years | 20 (3.2%) | 27 (4.1%) |
| 50 to 54 Years | 62 (9.8%) | 70 (10.6%) |
| 55 to 59 Years | 32 (5.1%) | 27 (4.1%) |
| 60 to 64 Years | 36 (5.7%) | 34 (5.1%) |
| 65 to 69 Years | 81 (12.8%) | 32 (4.8%) |
| 70 to 74 Years | 17 (2.7%) | 23 (3.5%) |
| 75 to 79 Years | 19 (3.0%) | 34 (5.1%) |
| 80 to 84 Years | 5 (0.8%) | 16 (2.4%) |
| 85 Years and over | 0 (0.0%) | 10 (1.5%) |
| Total | 632 (100.0%) | 663 (100.0%) |
Families and Households in Calverton Park
Median Family Size in Calverton Park
The median family size in Calverton Park is 3.32 persons per family, with married-couple families (148 | 48.7%) accounting for the largest median family size of 3.55 persons per family. On the other hand, single male/father families (32 | 10.5%) represent the smallest median family size with 2.13 persons per family.
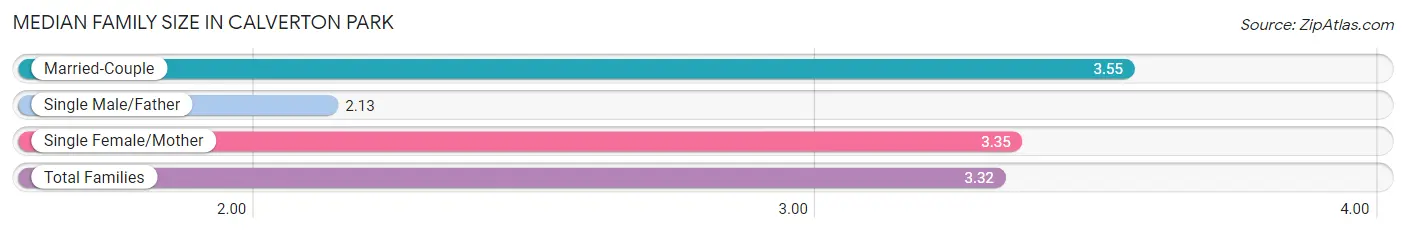
| Family Type | # Families | Family Size |
| Married-Couple | 148 (48.7%) | 3.55 |
| Single Male/Father | 32 (10.5%) | 2.13 |
| Single Female/Mother | 124 (40.8%) | 3.35 |
| Total Families | 304 (100.0%) | 3.32 |
Median Household Size in Calverton Park
The median household size in Calverton Park is 2.63 persons per household, with single female/mother households (124 | 25.2%) accounting for the largest median household size of 3.57 persons per household. non-family households (189 | 38.3%) represent the smallest median household size with 1.35 persons per household.
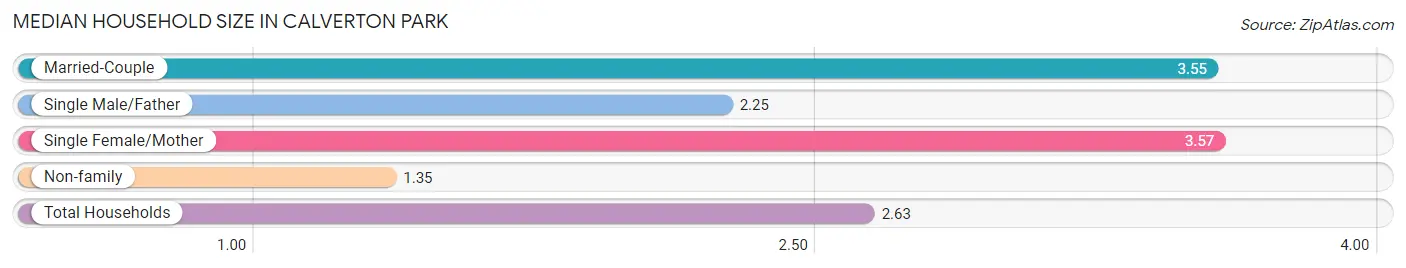
| Household Type | # Households | Household Size |
| Married-Couple | 148 (30.0%) | 3.55 |
| Single Male/Father | 32 (6.5%) | 2.25 |
| Single Female/Mother | 124 (25.2%) | 3.57 |
| Non-family | 189 (38.3%) | 1.35 |
| Total Households | 493 (100.0%) | 2.63 |
Household Size by Marriage Status in Calverton Park
Out of a total of 493 households in Calverton Park, 304 (61.7%) are family households, while 189 (38.3%) are nonfamily households. The most numerous type of family households are 2-person households, comprising 117, and the most common type of nonfamily households are 1-person households, comprising 140.
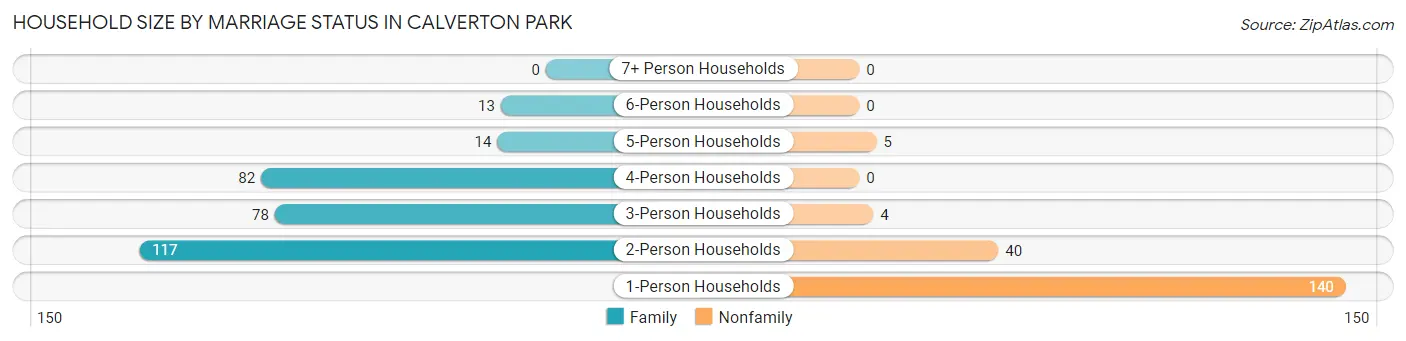
| Household Size | Family Households | Nonfamily Households |
| 1-Person Households | - | 140 (28.4%) |
| 2-Person Households | 117 (23.7%) | 40 (8.1%) |
| 3-Person Households | 78 (15.8%) | 4 (0.8%) |
| 4-Person Households | 82 (16.6%) | 0 (0.0%) |
| 5-Person Households | 14 (2.8%) | 5 (1.0%) |
| 6-Person Households | 13 (2.6%) | 0 (0.0%) |
| 7+ Person Households | 0 (0.0%) | 0 (0.0%) |
| Total | 304 (61.7%) | 189 (38.3%) |
Female Fertility in Calverton Park
Fertility by Age in Calverton Park
Average fertility rate in Calverton Park is 19.0 births per 1,000 women. Women in the age bracket of 20 to 34 years have the highest fertility rate with 54.0 births per 1,000 women. Women in the age bracket of 20 to 34 years acount for 100.0% of all women with births.
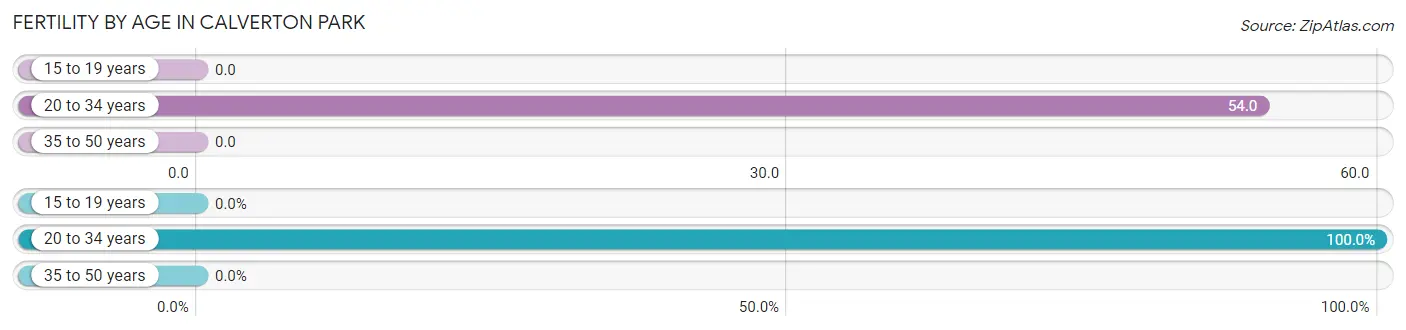
| Age Bracket | Women with Births | Births / 1,000 Women |
| 15 to 19 years | 0 (0.0%) | 0.0 |
| 20 to 34 years | 5 (100.0%) | 54.0 |
| 35 to 50 years | 0 (0.0%) | 0.0 |
| Total | 5 (100.0%) | 19.0 |
Fertility by Age by Marriage Status in Calverton Park
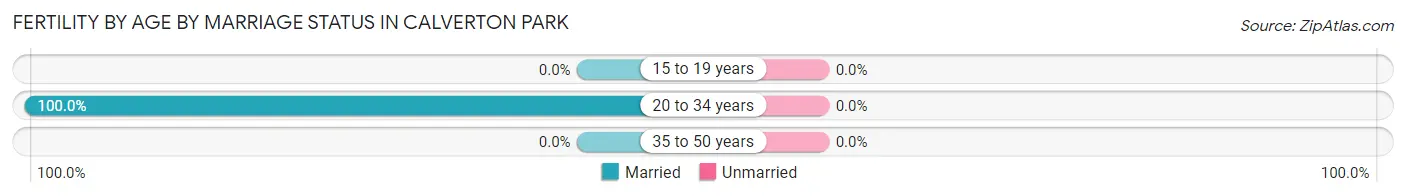
| Age Bracket | Married | Unmarried |
| 15 to 19 years | 0 (0.0%) | 0 (0.0%) |
| 20 to 34 years | 5 (100.0%) | 0 (0.0%) |
| 35 to 50 years | 0 (0.0%) | 0 (0.0%) |
| Total | 5 (100.0%) | 0 (0.0%) |
Fertility by Education in Calverton Park
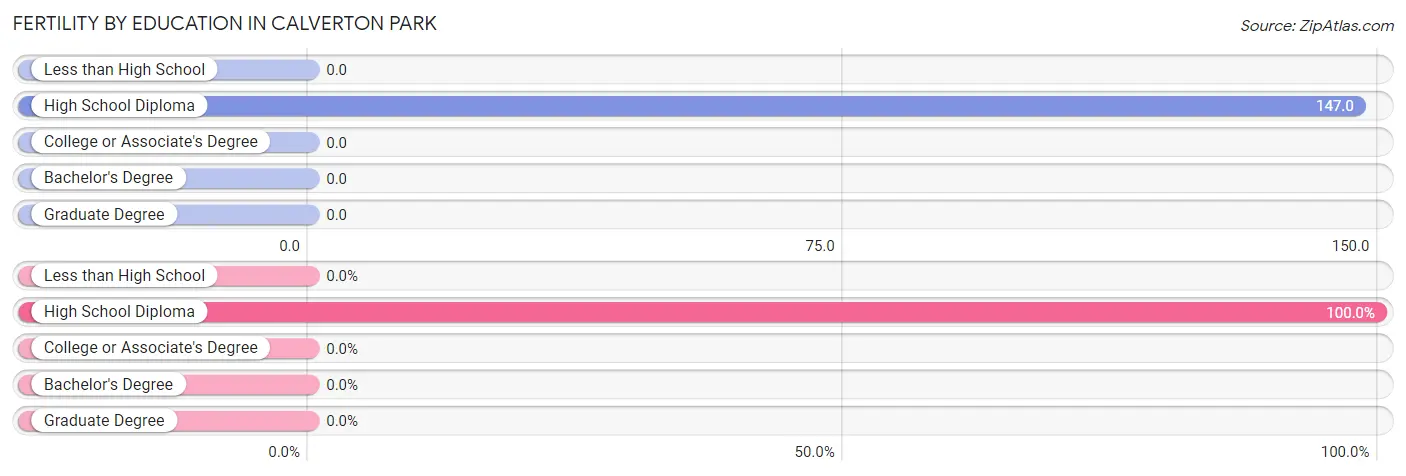
| Educational Attainment | Women with Births | Births / 1,000 Women |
| Less than High School | 0 (0.0%) | 0.0 |
| High School Diploma | 5 (100.0%) | 147.0 |
| College or Associate's Degree | 0 (0.0%) | 0.0 |
| Bachelor's Degree | 0 (0.0%) | 0.0 |
| Graduate Degree | 0 (0.0%) | 0.0 |
| Total | 5 (100.0%) | 19.0 |
Fertility by Education by Marriage Status in Calverton Park
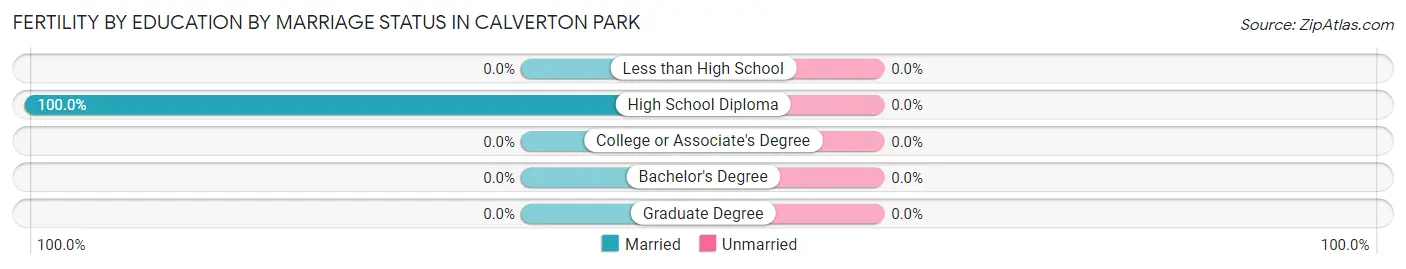
| Educational Attainment | Married | Unmarried |
| Less than High School | 0 (0.0%) | 0 (0.0%) |
| High School Diploma | 5 (100.0%) | 0 (0.0%) |
| College or Associate's Degree | 0 (0.0%) | 0 (0.0%) |
| Bachelor's Degree | 0 (0.0%) | 0 (0.0%) |
| Graduate Degree | 0 (0.0%) | 0 (0.0%) |
| Total | 5 (100.0%) | 0 (0.0%) |
Employment Characteristics in Calverton Park
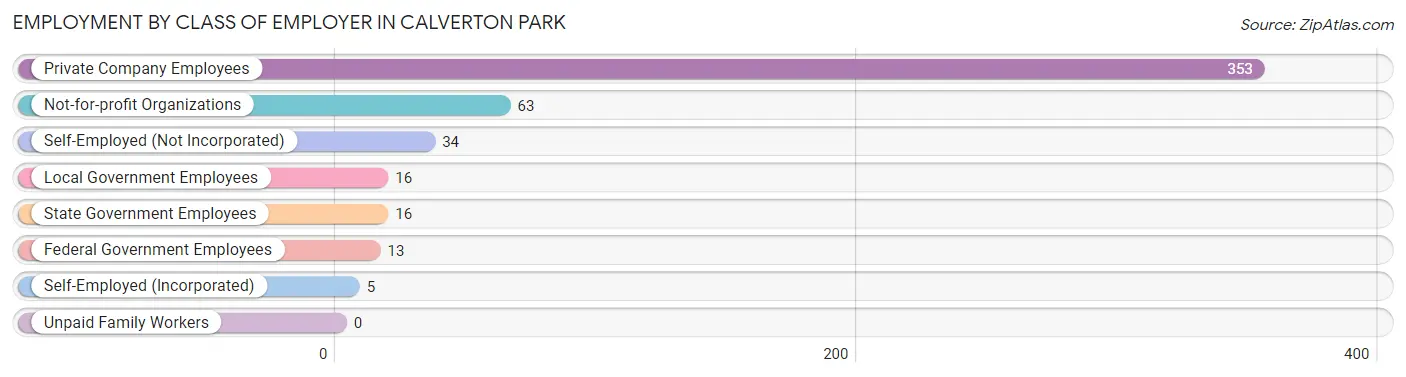
Employment by Class of Employer in Calverton Park
Among the 500 employed individuals in Calverton Park, private company employees (353 | 70.6%), not-for-profit organizations (63 | 12.6%), and self-employed (not incorporated) (34 | 6.8%) make up the most common classes of employment.
| Employer Class | # Employees | % Employees |
| Private Company Employees | 353 | 70.6% |
| Self-Employed (Incorporated) | 5 | 1.0% |
| Self-Employed (Not Incorporated) | 34 | 6.8% |
| Not-for-profit Organizations | 63 | 12.6% |
| Local Government Employees | 16 | 3.2% |
| State Government Employees | 16 | 3.2% |
| Federal Government Employees | 13 | 2.6% |
| Unpaid Family Workers | 0 | 0.0% |
| Total | 500 | 100.0% |
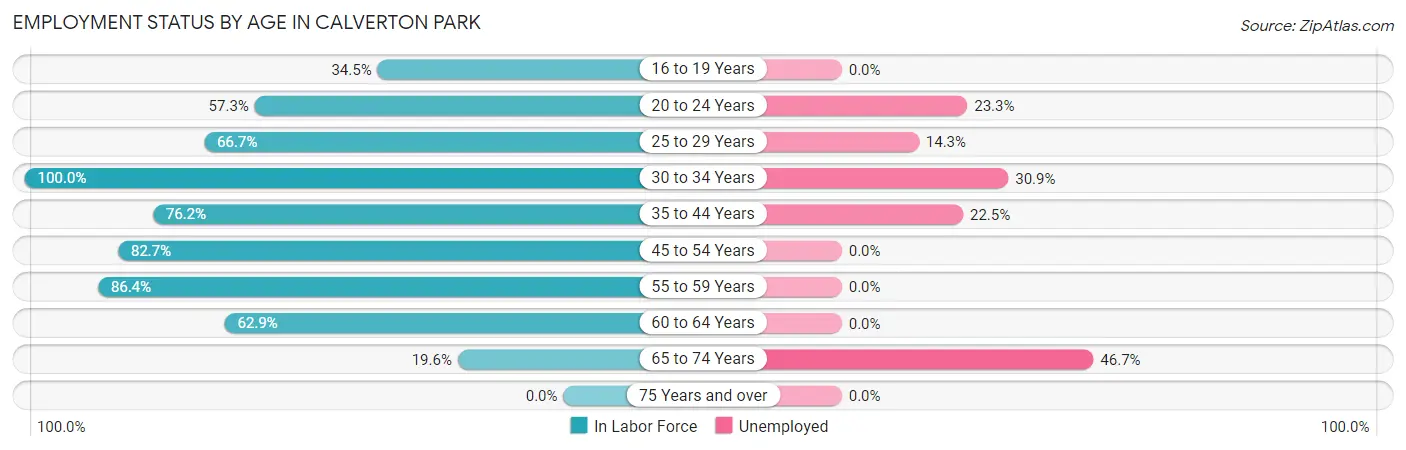
Employment Status by Age in Calverton Park
According to the labor force statistics for Calverton Park, out of the total population over 16 years of age (1,004), 60.1% or 603 individuals are in the labor force, with 14.9% or 90 of them unemployed. The age group with the highest labor force participation rate is 30 to 34 years, with 100.0% or 81 individuals in the labor force. Within the labor force, the 65 to 74 years age range has the highest percentage of unemployed individuals, with 46.7% or 14 of them being unemployed.
| Age Bracket | In Labor Force | Unemployed |
| 16 to 19 Years | 19 (34.5%) | 0 (0.0%) |
| 20 to 24 Years | 43 (57.3%) | 10 (23.3%) |
| 25 to 29 Years | 14 (66.7%) | 2 (14.3%) |
| 30 to 34 Years | 81 (100.0%) | 25 (30.9%) |
| 35 to 44 Years | 173 (76.2%) | 39 (22.5%) |
| 45 to 54 Years | 148 (82.7%) | 0 (0.0%) |
| 55 to 59 Years | 51 (86.4%) | 0 (0.0%) |
| 60 to 64 Years | 44 (62.9%) | 0 (0.0%) |
| 65 to 74 Years | 30 (19.6%) | 14 (46.7%) |
| 75 Years and over | 0 (0.0%) | 0 (0.0%) |
| Total | 603 (60.1%) | 90 (14.9%) |
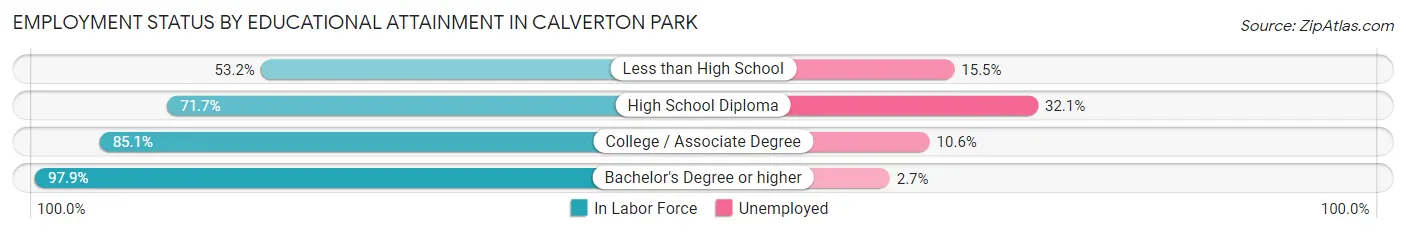
Employment Status by Educational Attainment in Calverton Park
According to labor force statistics for Calverton Park, 80.2% of individuals (511) out of the total population between 25 and 64 years of age (637) are in the labor force, with 12.9% or 66 of them being unemployed. The group with the highest labor force participation rate are those with the educational attainment of bachelor's degree or higher, with 97.9% or 184 individuals in the labor force. Within the labor force, individuals with high school diploma education have the highest percentage of unemployment, with 32.1% or 35 of them being unemployed.
| Educational Attainment | In Labor Force | Unemployed |
| Less than High School | 58 (53.2%) | 17 (15.5%) |
| High School Diploma | 109 (71.7%) | 49 (32.1%) |
| College / Associate Degree | 160 (85.1%) | 20 (10.6%) |
| Bachelor's Degree or higher | 184 (97.9%) | 5 (2.7%) |
| Total | 511 (80.2%) | 82 (12.9%) |
Employment Occupations by Sex in Calverton Park
Management, Business, Science and Arts Occupations
The most common Management, Business, Science and Arts occupations in Calverton Park are Community & Social Service (67 | 13.1%), Health Diagnosing & Treating (52 | 10.1%), Business & Financial (45 | 8.8%), Health Technologists (45 | 8.8%), and Education Instruction & Library (42 | 8.2%).
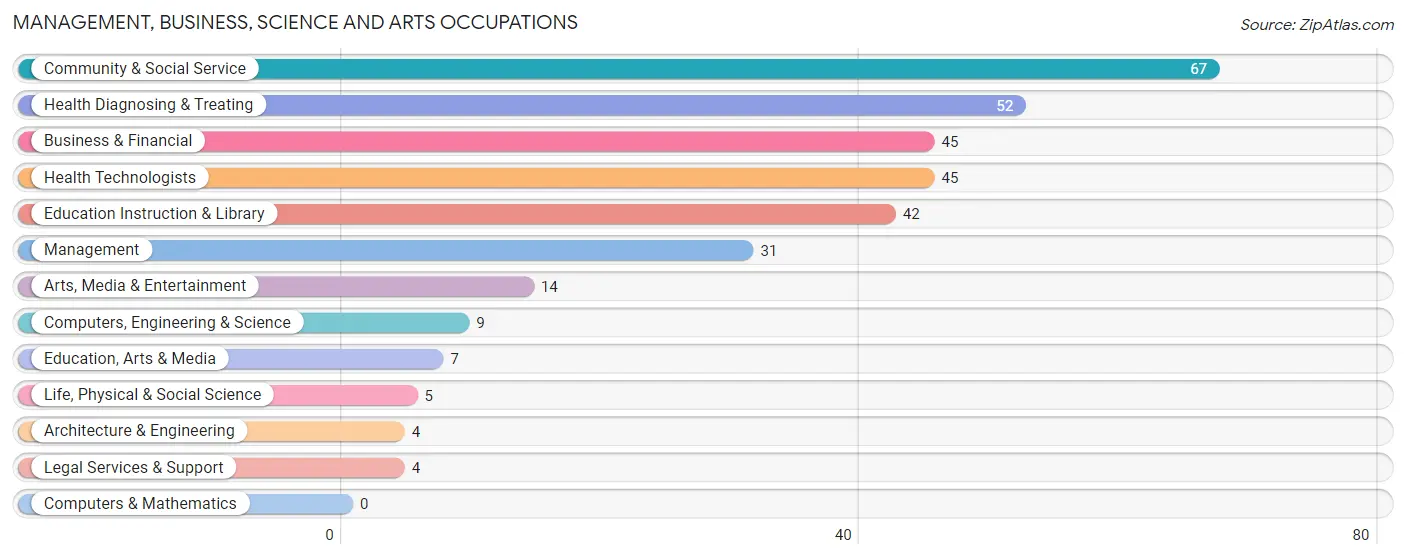
Management, Business, Science and Arts Occupations by Sex
Within the Management, Business, Science and Arts occupations in Calverton Park, the most male-oriented occupations are Architecture & Engineering (100.0%), Business & Financial (93.3%), and Health Technologists (73.3%), while the most female-oriented occupations are Life, Physical & Social Science (100.0%), Legal Services & Support (100.0%), and Education, Arts & Media (71.4%).
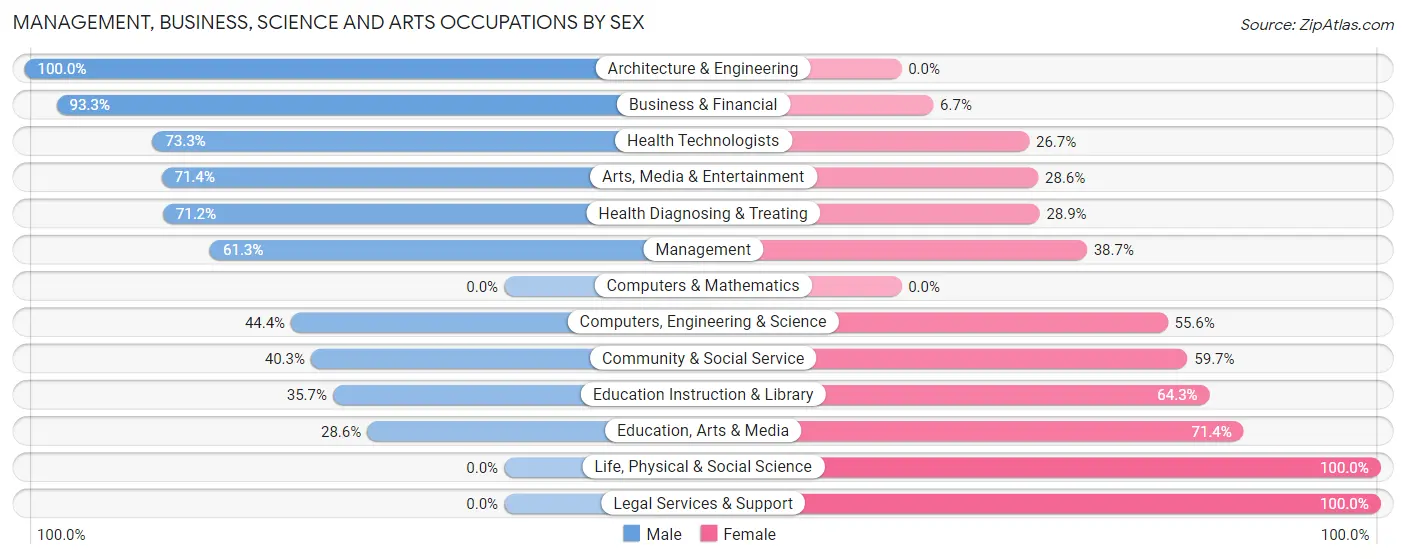
| Occupation | Male | Female |
| Management | 19 (61.3%) | 12 (38.7%) |
| Business & Financial | 42 (93.3%) | 3 (6.7%) |
| Computers, Engineering & Science | 4 (44.4%) | 5 (55.6%) |
| Computers & Mathematics | 0 (0.0%) | 0 (0.0%) |
| Architecture & Engineering | 4 (100.0%) | 0 (0.0%) |
| Life, Physical & Social Science | 0 (0.0%) | 5 (100.0%) |
| Community & Social Service | 27 (40.3%) | 40 (59.7%) |
| Education, Arts & Media | 2 (28.6%) | 5 (71.4%) |
| Legal Services & Support | 0 (0.0%) | 4 (100.0%) |
| Education Instruction & Library | 15 (35.7%) | 27 (64.3%) |
| Arts, Media & Entertainment | 10 (71.4%) | 4 (28.6%) |
| Health Diagnosing & Treating | 37 (71.2%) | 15 (28.8%) |
| Health Technologists | 33 (73.3%) | 12 (26.7%) |
| Total (Category) | 129 (63.2%) | 75 (36.8%) |
| Total (Overall) | 255 (49.7%) | 258 (50.3%) |
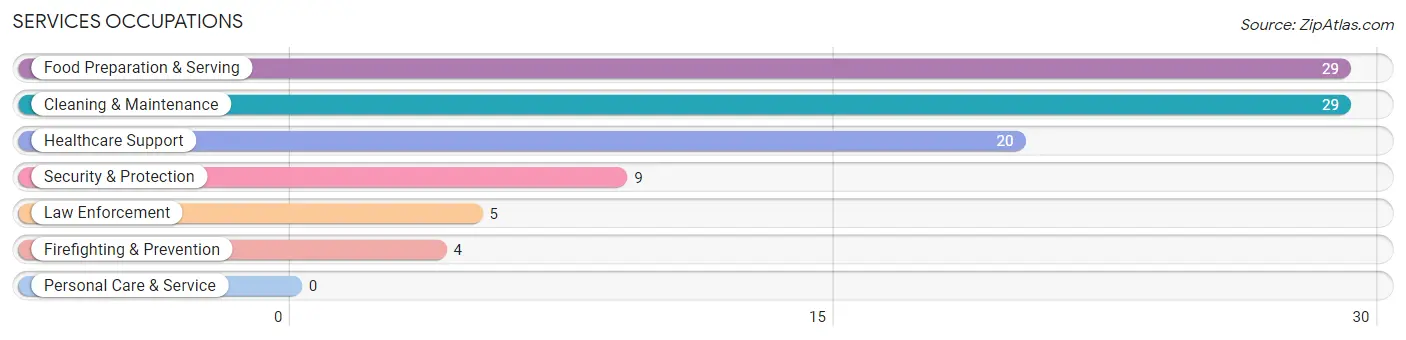
Services Occupations
The most common Services occupations in Calverton Park are Food Preparation & Serving (29 | 5.7%), Cleaning & Maintenance (29 | 5.7%), Healthcare Support (20 | 3.9%), Security & Protection (9 | 1.8%), and Law Enforcement (5 | 1.0%).
Services Occupations by Sex
Within the Services occupations in Calverton Park, the most male-oriented occupations are Security & Protection (100.0%), Firefighting & Prevention (100.0%), and Law Enforcement (100.0%), while the most female-oriented occupations are Healthcare Support (100.0%), Food Preparation & Serving (100.0%), and Cleaning & Maintenance (34.5%).
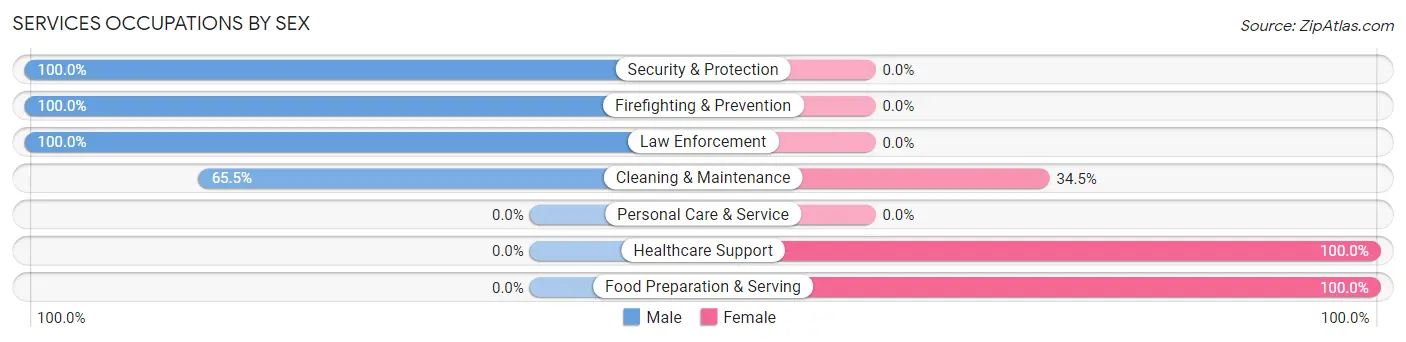
| Occupation | Male | Female |
| Healthcare Support | 0 (0.0%) | 20 (100.0%) |
| Security & Protection | 9 (100.0%) | 0 (0.0%) |
| Firefighting & Prevention | 4 (100.0%) | 0 (0.0%) |
| Law Enforcement | 5 (100.0%) | 0 (0.0%) |
| Food Preparation & Serving | 0 (0.0%) | 29 (100.0%) |
| Cleaning & Maintenance | 19 (65.5%) | 10 (34.5%) |
| Personal Care & Service | 0 (0.0%) | 0 (0.0%) |
| Total (Category) | 28 (32.2%) | 59 (67.8%) |
| Total (Overall) | 255 (49.7%) | 258 (50.3%) |
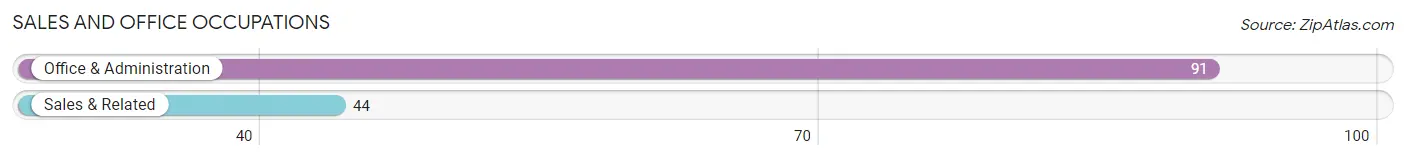
Sales and Office Occupations
The most common Sales and Office occupations in Calverton Park are Office & Administration (91 | 17.7%), and Sales & Related (44 | 8.6%).
Sales and Office Occupations by Sex
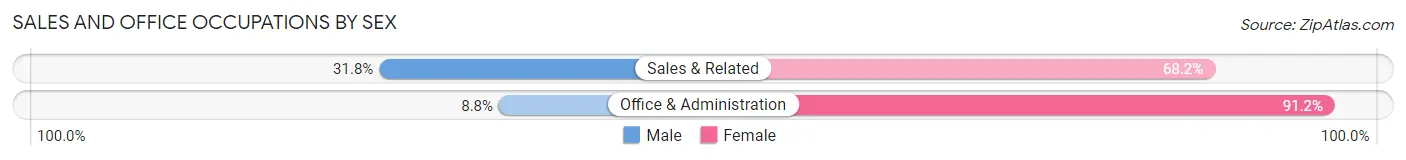
| Occupation | Male | Female |
| Sales & Related | 14 (31.8%) | 30 (68.2%) |
| Office & Administration | 8 (8.8%) | 83 (91.2%) |
| Total (Category) | 22 (16.3%) | 113 (83.7%) |
| Total (Overall) | 255 (49.7%) | 258 (50.3%) |
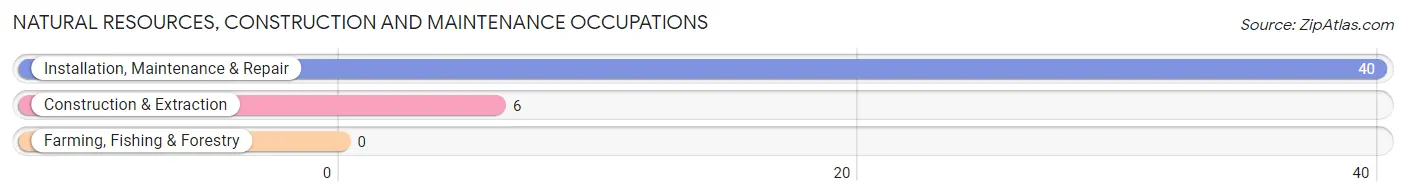
Natural Resources, Construction and Maintenance Occupations
The most common Natural Resources, Construction and Maintenance occupations in Calverton Park are Installation, Maintenance & Repair (40 | 7.8%), and Construction & Extraction (6 | 1.2%).
Natural Resources, Construction and Maintenance Occupations by Sex
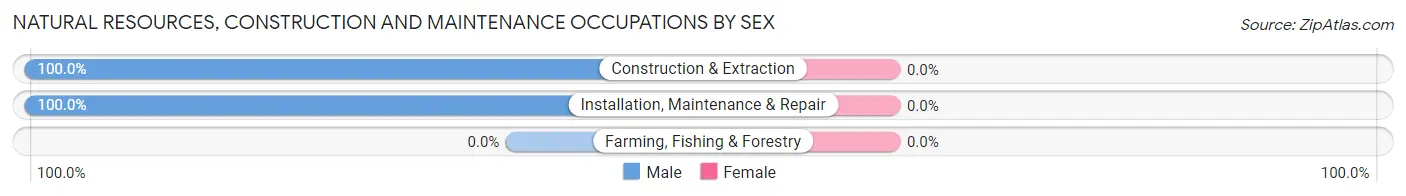
| Occupation | Male | Female |
| Farming, Fishing & Forestry | 0 (0.0%) | 0 (0.0%) |
| Construction & Extraction | 6 (100.0%) | 0 (0.0%) |
| Installation, Maintenance & Repair | 40 (100.0%) | 0 (0.0%) |
| Total (Category) | 46 (100.0%) | 0 (0.0%) |
| Total (Overall) | 255 (49.7%) | 258 (50.3%) |
Production, Transportation and Moving Occupations
The most common Production, Transportation and Moving occupations in Calverton Park are Production (26 | 5.1%), Material Moving (12 | 2.3%), and Transportation (3 | 0.6%).
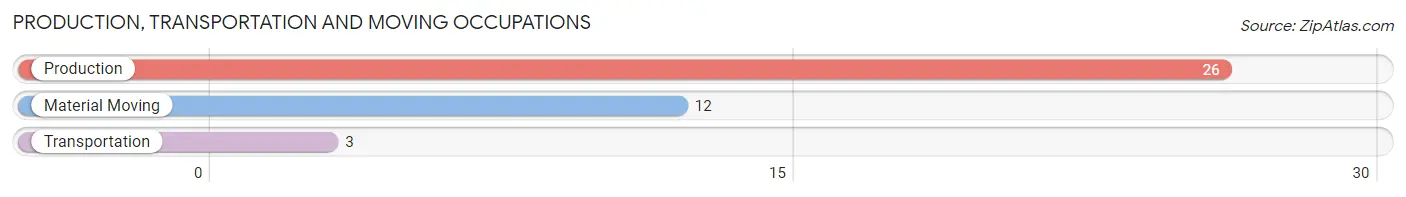
Production, Transportation and Moving Occupations by Sex
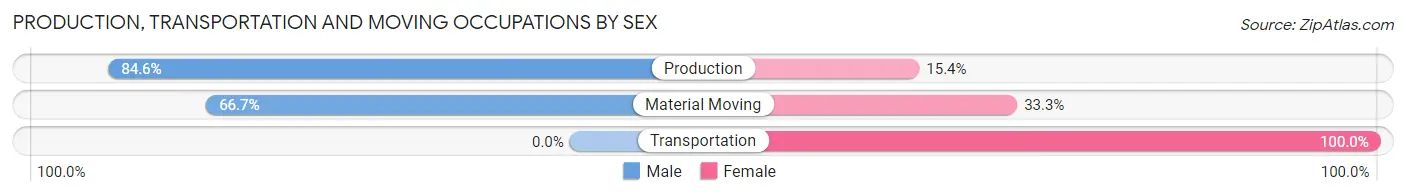
| Occupation | Male | Female |
| Production | 22 (84.6%) | 4 (15.4%) |
| Transportation | 0 (0.0%) | 3 (100.0%) |
| Material Moving | 8 (66.7%) | 4 (33.3%) |
| Total (Category) | 30 (73.2%) | 11 (26.8%) |
| Total (Overall) | 255 (49.7%) | 258 (50.3%) |
Employment Industries by Sex in Calverton Park
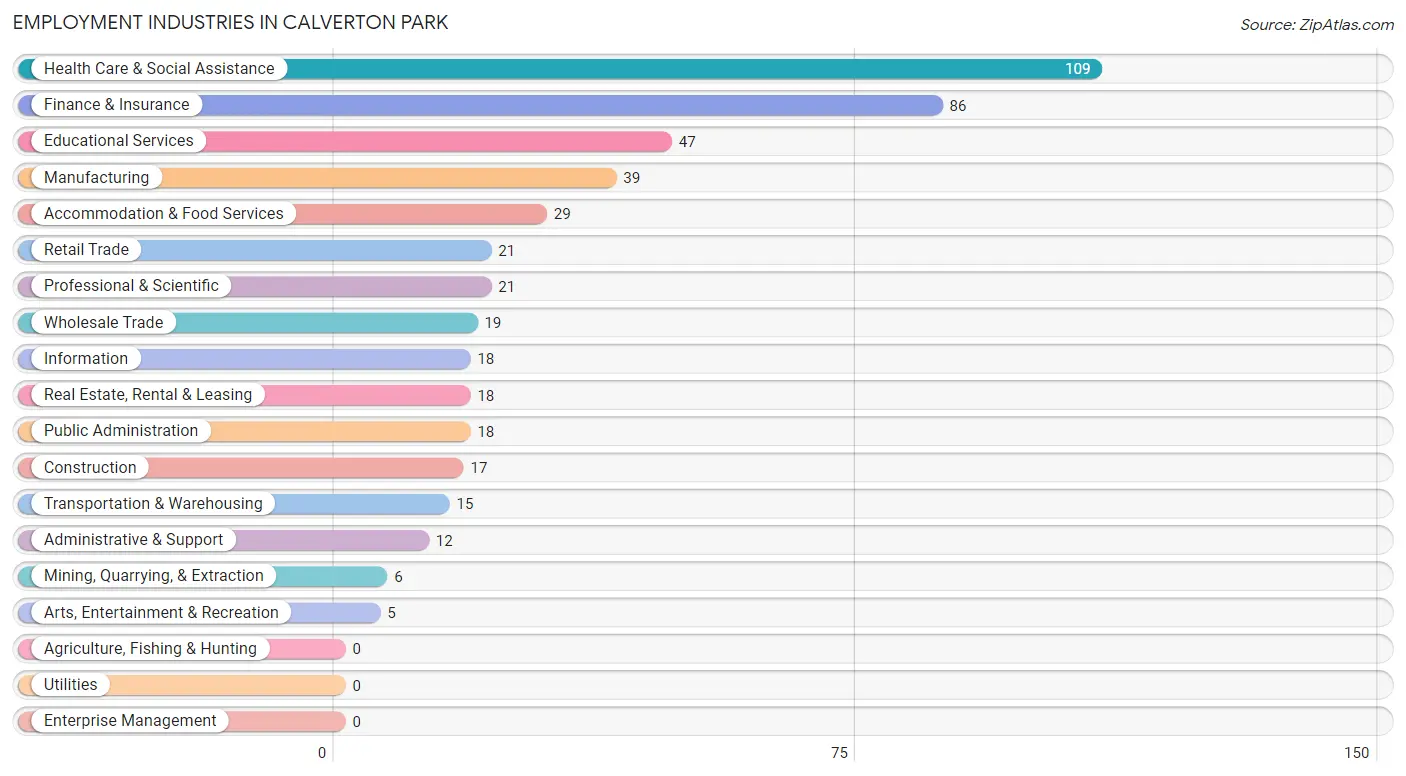
Employment Industries in Calverton Park
The major employment industries in Calverton Park include Health Care & Social Assistance (109 | 21.2%), Finance & Insurance (86 | 16.8%), Educational Services (47 | 9.2%), Manufacturing (39 | 7.6%), and Accommodation & Food Services (29 | 5.7%).
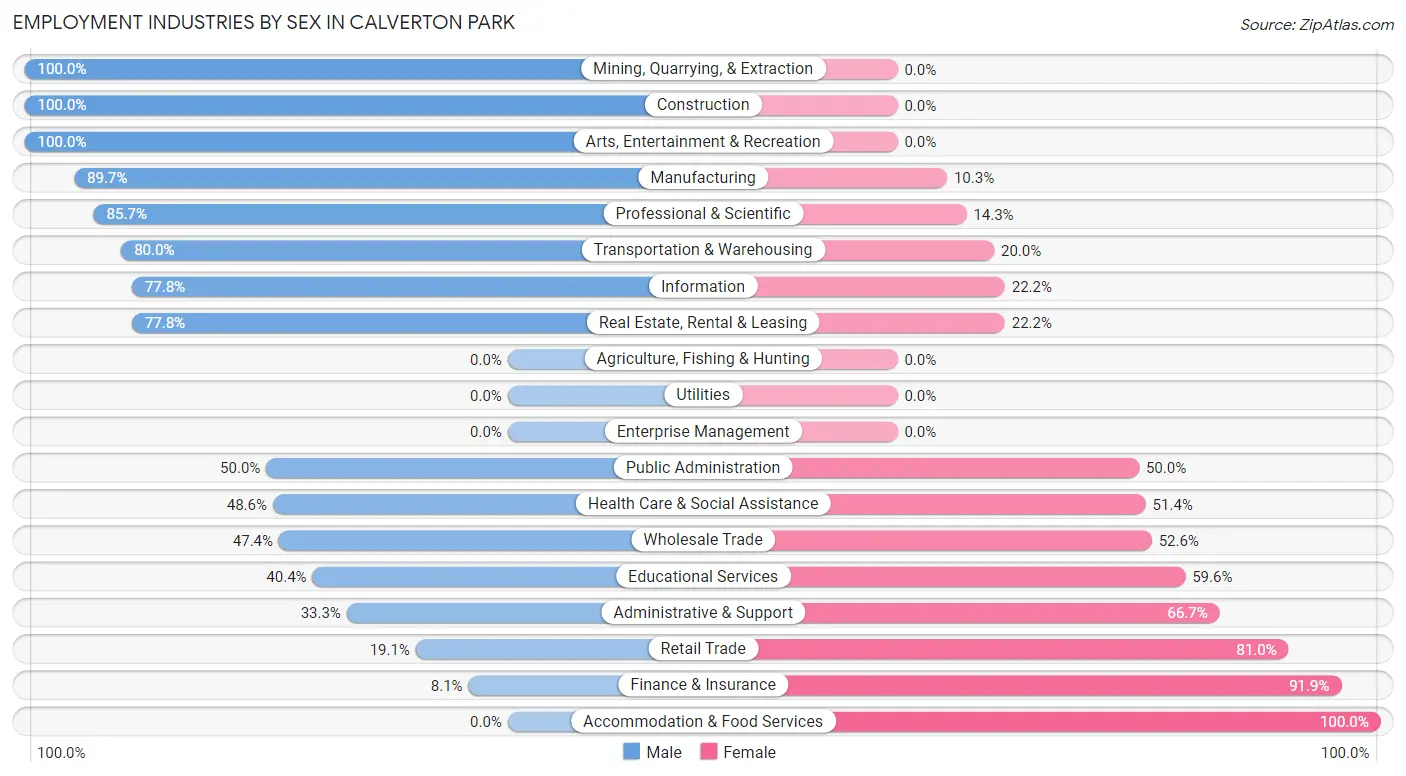
Employment Industries by Sex in Calverton Park
The Calverton Park industries that see more men than women are Mining, Quarrying, & Extraction (100.0%), Construction (100.0%), and Arts, Entertainment & Recreation (100.0%), whereas the industries that tend to have a higher number of women are Accommodation & Food Services (100.0%), Finance & Insurance (91.9%), and Retail Trade (80.9%).
| Industry | Male | Female |
| Agriculture, Fishing & Hunting | 0 (0.0%) | 0 (0.0%) |
| Mining, Quarrying, & Extraction | 6 (100.0%) | 0 (0.0%) |
| Construction | 17 (100.0%) | 0 (0.0%) |
| Manufacturing | 35 (89.7%) | 4 (10.3%) |
| Wholesale Trade | 9 (47.4%) | 10 (52.6%) |
| Retail Trade | 4 (19.1%) | 17 (80.9%) |
| Transportation & Warehousing | 12 (80.0%) | 3 (20.0%) |
| Utilities | 0 (0.0%) | 0 (0.0%) |
| Information | 14 (77.8%) | 4 (22.2%) |
| Finance & Insurance | 7 (8.1%) | 79 (91.9%) |
| Real Estate, Rental & Leasing | 14 (77.8%) | 4 (22.2%) |
| Professional & Scientific | 18 (85.7%) | 3 (14.3%) |
| Enterprise Management | 0 (0.0%) | 0 (0.0%) |
| Administrative & Support | 4 (33.3%) | 8 (66.7%) |
| Educational Services | 19 (40.4%) | 28 (59.6%) |
| Health Care & Social Assistance | 53 (48.6%) | 56 (51.4%) |
| Arts, Entertainment & Recreation | 5 (100.0%) | 0 (0.0%) |
| Accommodation & Food Services | 0 (0.0%) | 29 (100.0%) |
| Public Administration | 9 (50.0%) | 9 (50.0%) |
| Total | 255 (49.7%) | 258 (50.3%) |
Education in Calverton Park
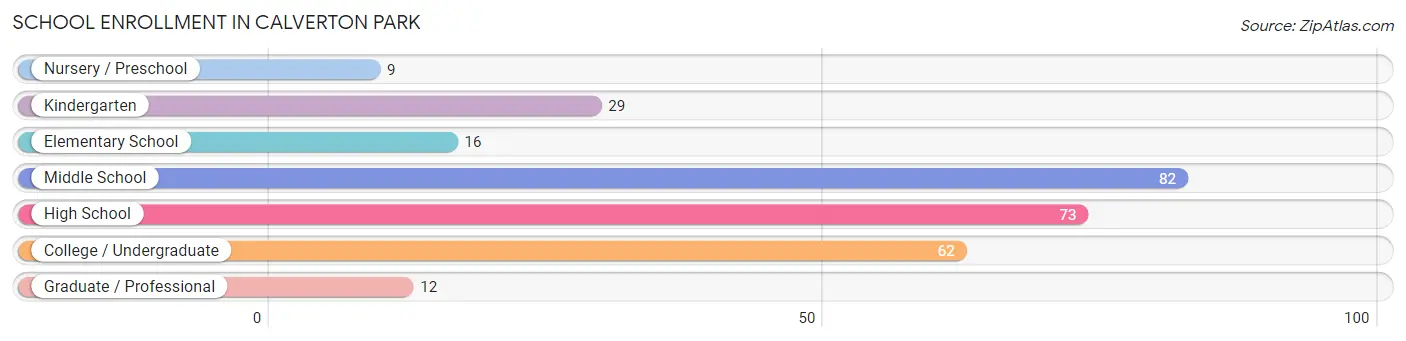
School Enrollment in Calverton Park
The most common levels of schooling among the 283 students in Calverton Park are middle school (82 | 29.0%), high school (73 | 25.8%), and college / undergraduate (62 | 21.9%).
| School Level | # Students | % Students |
| Nursery / Preschool | 9 | 3.2% |
| Kindergarten | 29 | 10.2% |
| Elementary School | 16 | 5.7% |
| Middle School | 82 | 29.0% |
| High School | 73 | 25.8% |
| College / Undergraduate | 62 | 21.9% |
| Graduate / Professional | 12 | 4.2% |
| Total | 283 | 100.0% |
School Enrollment by Age by Funding Source in Calverton Park
Out of a total of 283 students who are enrolled in schools in Calverton Park, 94 (33.2%) attend a private institution, while the remaining 189 (66.8%) are enrolled in public schools. The age group of 3 to 4 year olds has the highest likelihood of being enrolled in private schools, with 9 (100.0% in the age bracket) enrolled. Conversely, the age group of 25 to 34 year olds has the lowest likelihood of being enrolled in a private school, with 24 (100.0% in the age bracket) attending a public institution.
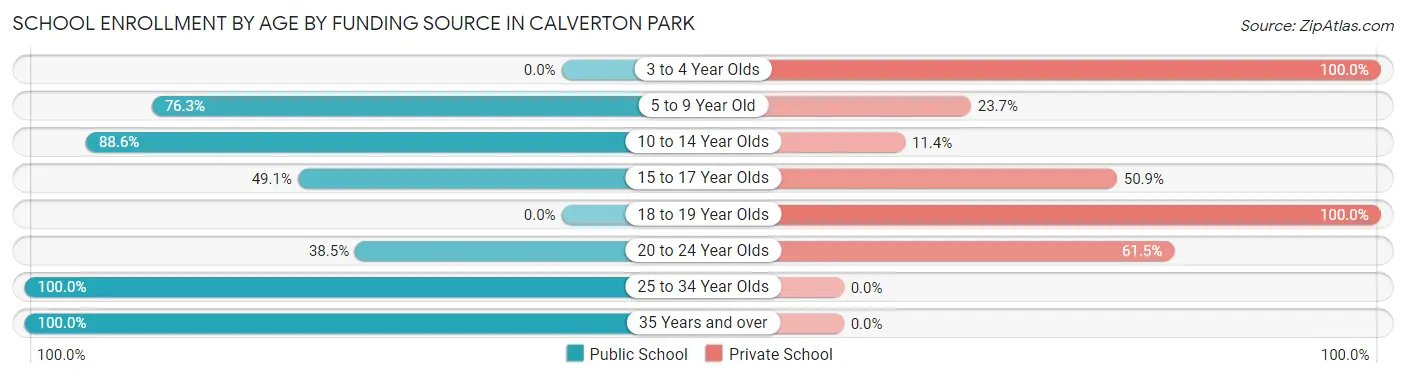
| Age Bracket | Public School | Private School |
| 3 to 4 Year Olds | 0 (0.0%) | 9 (100.0%) |
| 5 to 9 Year Old | 29 (76.3%) | 9 (23.7%) |
| 10 to 14 Year Olds | 93 (88.6%) | 12 (11.4%) |
| 15 to 17 Year Olds | 28 (49.1%) | 29 (50.9%) |
| 18 to 19 Year Olds | 0 (0.0%) | 19 (100.0%) |
| 20 to 24 Year Olds | 10 (38.5%) | 16 (61.5%) |
| 25 to 34 Year Olds | 24 (100.0%) | 0 (0.0%) |
| 35 Years and over | 5 (100.0%) | 0 (0.0%) |
| Total | 189 (66.8%) | 94 (33.2%) |
Educational Attainment by Field of Study in Calverton Park
Science & technology (55 | 21.6%), business (49 | 19.3%), education (47 | 18.5%), arts & humanities (28 | 11.0%), and liberal arts & history (17 | 6.7%) are the most common fields of study among 254 individuals in Calverton Park who have obtained a bachelor's degree or higher.
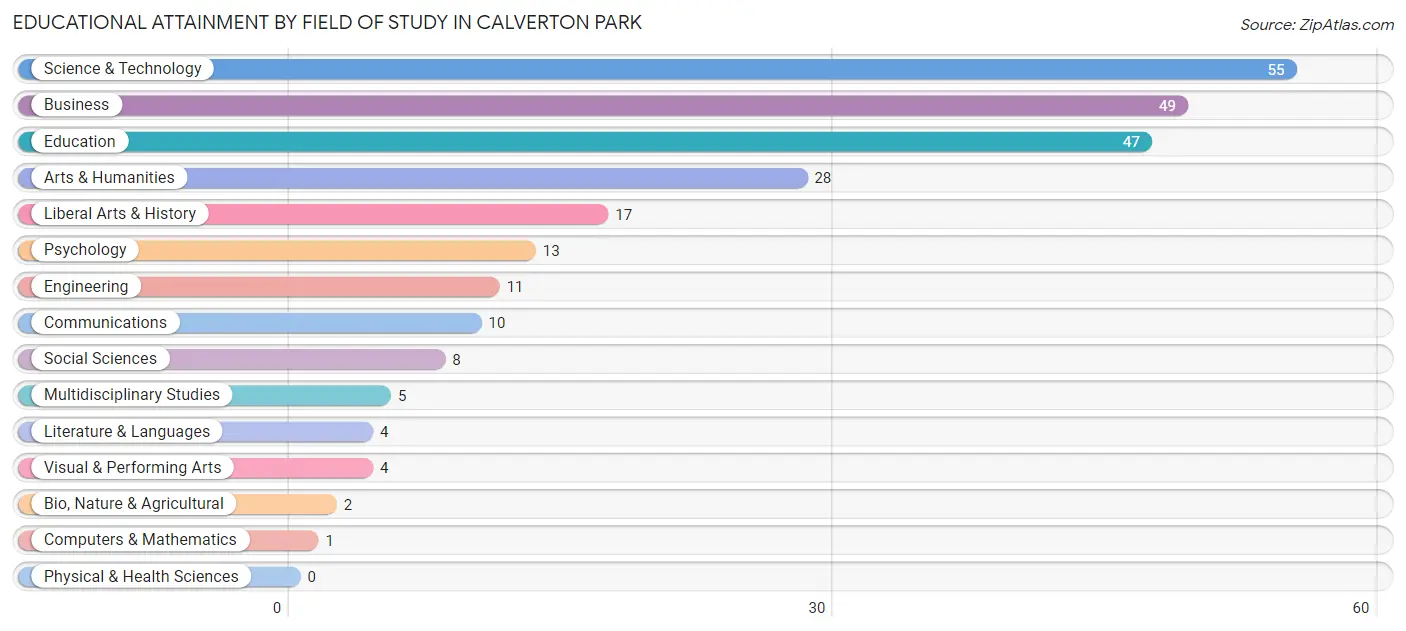
| Field of Study | # Graduates | % Graduates |
| Computers & Mathematics | 1 | 0.4% |
| Bio, Nature & Agricultural | 2 | 0.8% |
| Physical & Health Sciences | 0 | 0.0% |
| Psychology | 13 | 5.1% |
| Social Sciences | 8 | 3.2% |
| Engineering | 11 | 4.3% |
| Multidisciplinary Studies | 5 | 2.0% |
| Science & Technology | 55 | 21.6% |
| Business | 49 | 19.3% |
| Education | 47 | 18.5% |
| Literature & Languages | 4 | 1.6% |
| Liberal Arts & History | 17 | 6.7% |
| Visual & Performing Arts | 4 | 1.6% |
| Communications | 10 | 3.9% |
| Arts & Humanities | 28 | 11.0% |
| Total | 254 | 100.0% |
Transportation & Commute in Calverton Park
Vehicle Availability by Sex in Calverton Park
The most prevalent vehicle ownership categories in Calverton Park are males with 2 vehicles (156, accounting for 63.4%) and females with 2 vehicles (143, making up 61.4%).
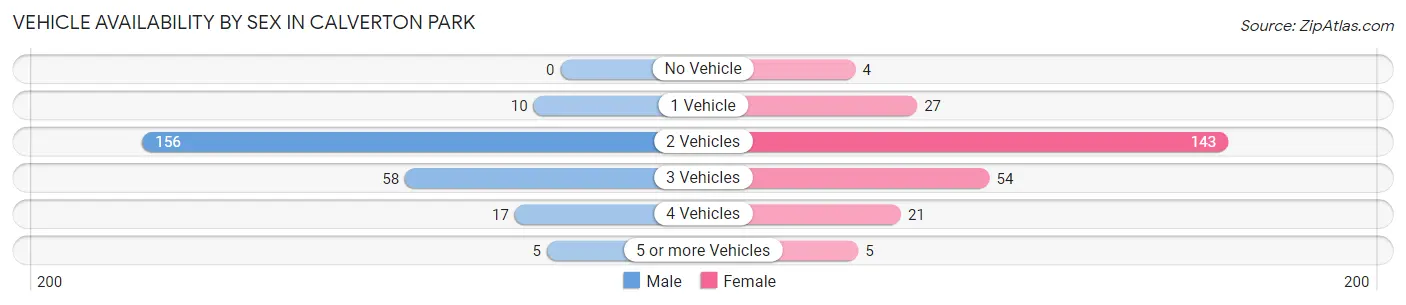
| Vehicles Available | Male | Female |
| No Vehicle | 0 (0.0%) | 4 (1.6%) |
| 1 Vehicle | 10 (4.1%) | 27 (10.6%) |
| 2 Vehicles | 156 (63.4%) | 143 (56.3%) |
| 3 Vehicles | 58 (23.6%) | 54 (21.3%) |
| 4 Vehicles | 17 (6.9%) | 21 (8.3%) |
| 5 or more Vehicles | 5 (2.0%) | 5 (2.0%) |
| Total | 246 (100.0%) | 254 (100.0%) |
Commute Time in Calverton Park
The most frequently occuring commute durations in Calverton Park are 30 to 34 minutes (113 commuters, 24.9%), 15 to 19 minutes (99 commuters, 21.8%), and 10 to 14 minutes (62 commuters, 13.7%).
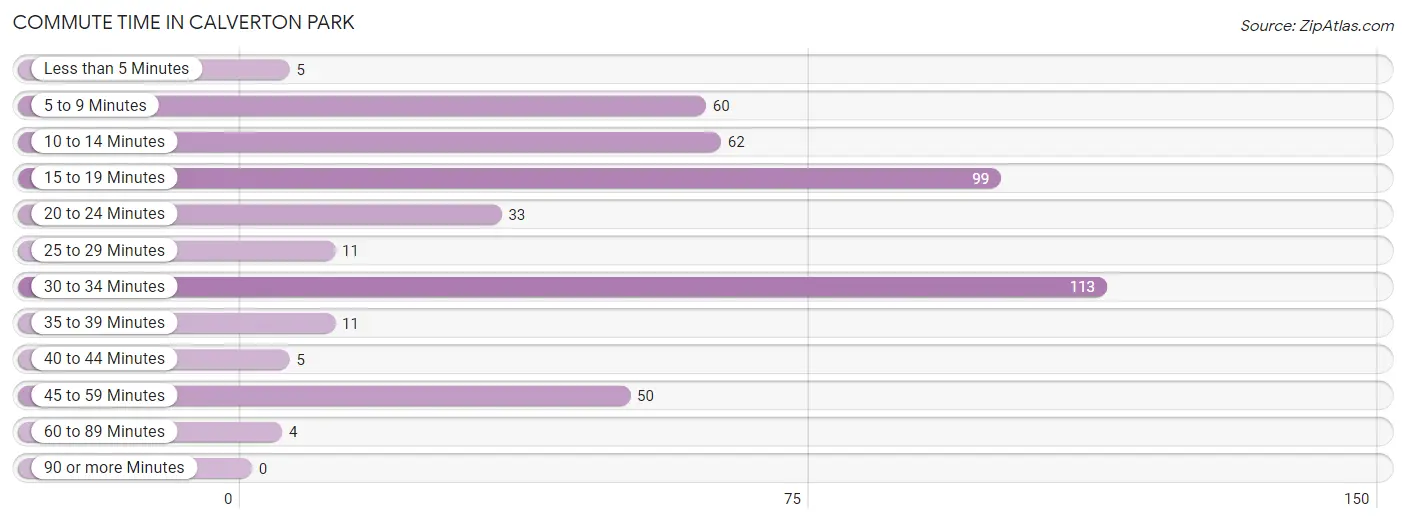
| Commute Time | # Commuters | % Commuters |
| Less than 5 Minutes | 5 | 1.1% |
| 5 to 9 Minutes | 60 | 13.3% |
| 10 to 14 Minutes | 62 | 13.7% |
| 15 to 19 Minutes | 99 | 21.8% |
| 20 to 24 Minutes | 33 | 7.3% |
| 25 to 29 Minutes | 11 | 2.4% |
| 30 to 34 Minutes | 113 | 24.9% |
| 35 to 39 Minutes | 11 | 2.4% |
| 40 to 44 Minutes | 5 | 1.1% |
| 45 to 59 Minutes | 50 | 11.0% |
| 60 to 89 Minutes | 4 | 0.9% |
| 90 or more Minutes | 0 | 0.0% |
Commute Time by Sex in Calverton Park
The most common commute times in Calverton Park are 30 to 34 minutes (59 commuters, 25.7%) for males and 30 to 34 minutes (54 commuters, 24.2%) for females.
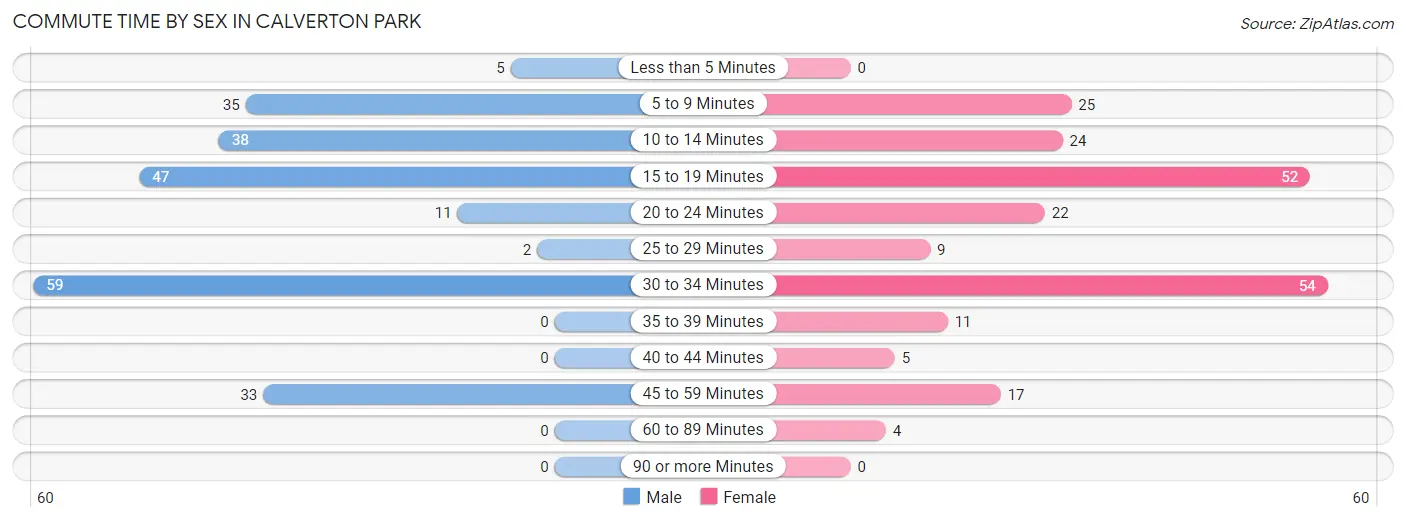
| Commute Time | Male | Female |
| Less than 5 Minutes | 5 (2.2%) | 0 (0.0%) |
| 5 to 9 Minutes | 35 (15.2%) | 25 (11.2%) |
| 10 to 14 Minutes | 38 (16.5%) | 24 (10.8%) |
| 15 to 19 Minutes | 47 (20.4%) | 52 (23.3%) |
| 20 to 24 Minutes | 11 (4.8%) | 22 (9.9%) |
| 25 to 29 Minutes | 2 (0.9%) | 9 (4.0%) |
| 30 to 34 Minutes | 59 (25.7%) | 54 (24.2%) |
| 35 to 39 Minutes | 0 (0.0%) | 11 (4.9%) |
| 40 to 44 Minutes | 0 (0.0%) | 5 (2.2%) |
| 45 to 59 Minutes | 33 (14.3%) | 17 (7.6%) |
| 60 to 89 Minutes | 0 (0.0%) | 4 (1.8%) |
| 90 or more Minutes | 0 (0.0%) | 0 (0.0%) |
Time of Departure to Work by Sex in Calverton Park
The most frequent times of departure to work in Calverton Park are 7:00 AM to 7:29 AM (35, 15.2%) for males and 7:30 AM to 7:59 AM (44, 19.7%) for females.
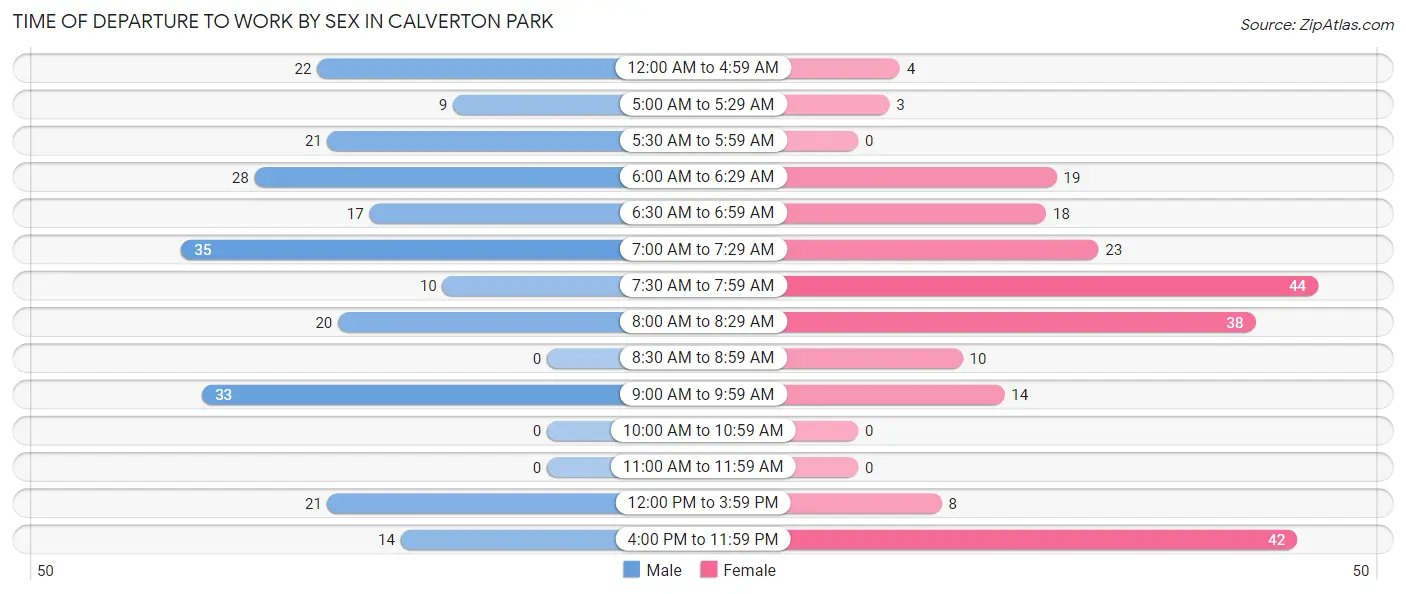
| Time of Departure | Male | Female |
| 12:00 AM to 4:59 AM | 22 (9.6%) | 4 (1.8%) |
| 5:00 AM to 5:29 AM | 9 (3.9%) | 3 (1.3%) |
| 5:30 AM to 5:59 AM | 21 (9.1%) | 0 (0.0%) |
| 6:00 AM to 6:29 AM | 28 (12.2%) | 19 (8.5%) |
| 6:30 AM to 6:59 AM | 17 (7.4%) | 18 (8.1%) |
| 7:00 AM to 7:29 AM | 35 (15.2%) | 23 (10.3%) |
| 7:30 AM to 7:59 AM | 10 (4.3%) | 44 (19.7%) |
| 8:00 AM to 8:29 AM | 20 (8.7%) | 38 (17.0%) |
| 8:30 AM to 8:59 AM | 0 (0.0%) | 10 (4.5%) |
| 9:00 AM to 9:59 AM | 33 (14.3%) | 14 (6.3%) |
| 10:00 AM to 10:59 AM | 0 (0.0%) | 0 (0.0%) |
| 11:00 AM to 11:59 AM | 0 (0.0%) | 0 (0.0%) |
| 12:00 PM to 3:59 PM | 21 (9.1%) | 8 (3.6%) |
| 4:00 PM to 11:59 PM | 14 (6.1%) | 42 (18.8%) |
| Total | 230 (100.0%) | 223 (100.0%) |
Housing Occupancy in Calverton Park
Occupancy by Ownership in Calverton Park
Of the total 493 dwellings in Calverton Park, owner-occupied units account for 350 (71.0%), while renter-occupied units make up 143 (29.0%).
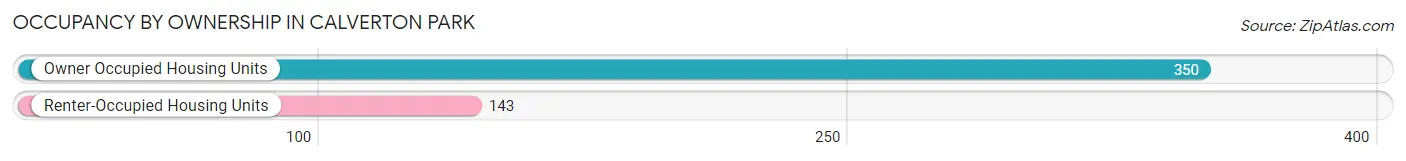
| Occupancy | # Housing Units | % Housing Units |
| Owner Occupied Housing Units | 350 | 71.0% |
| Renter-Occupied Housing Units | 143 | 29.0% |
| Total Occupied Housing Units | 493 | 100.0% |
Occupancy by Household Size in Calverton Park
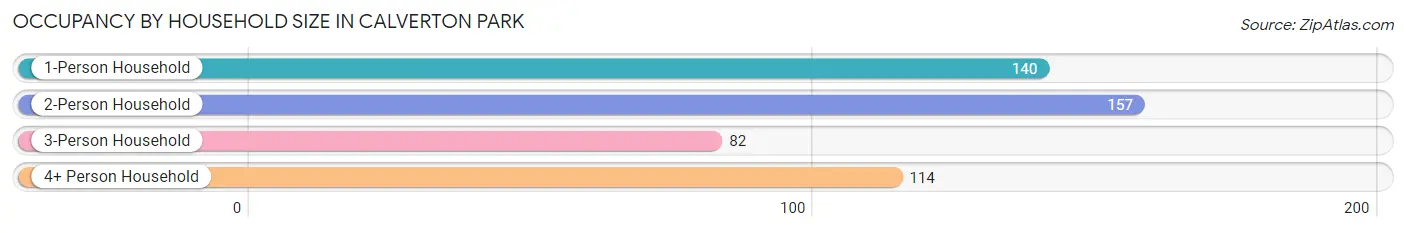
| Household Size | # Housing Units | % Housing Units |
| 1-Person Household | 140 | 28.4% |
| 2-Person Household | 157 | 31.9% |
| 3-Person Household | 82 | 16.6% |
| 4+ Person Household | 114 | 23.1% |
| Total Housing Units | 493 | 100.0% |
Occupancy by Ownership by Household Size in Calverton Park
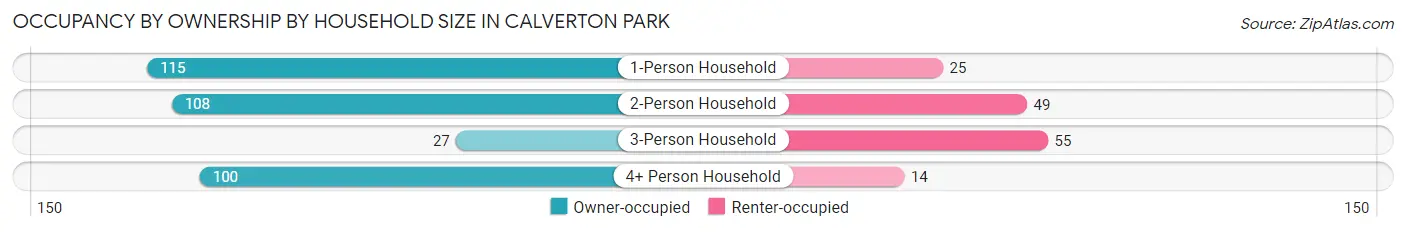
| Household Size | Owner-occupied | Renter-occupied |
| 1-Person Household | 115 (82.1%) | 25 (17.9%) |
| 2-Person Household | 108 (68.8%) | 49 (31.2%) |
| 3-Person Household | 27 (32.9%) | 55 (67.1%) |
| 4+ Person Household | 100 (87.7%) | 14 (12.3%) |
| Total Housing Units | 350 (71.0%) | 143 (29.0%) |
Occupancy by Educational Attainment in Calverton Park
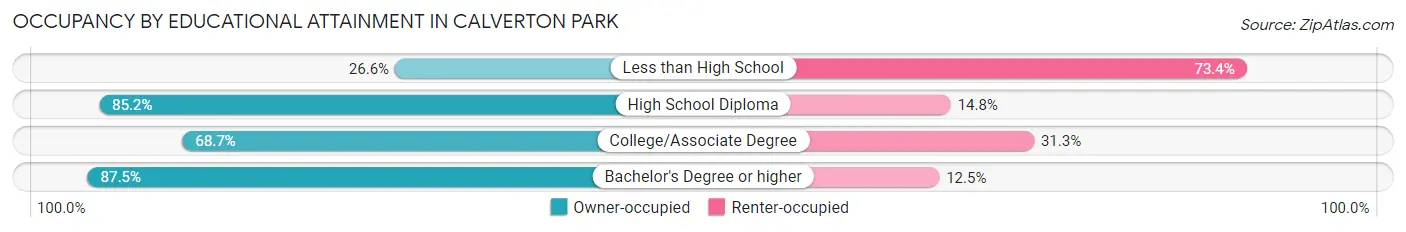
| Household Size | Owner-occupied | Renter-occupied |
| Less than High School | 21 (26.6%) | 58 (73.4%) |
| High School Diploma | 98 (85.2%) | 17 (14.8%) |
| College/Associate Degree | 112 (68.7%) | 51 (31.3%) |
| Bachelor's Degree or higher | 119 (87.5%) | 17 (12.5%) |
Occupancy by Age of Householder in Calverton Park
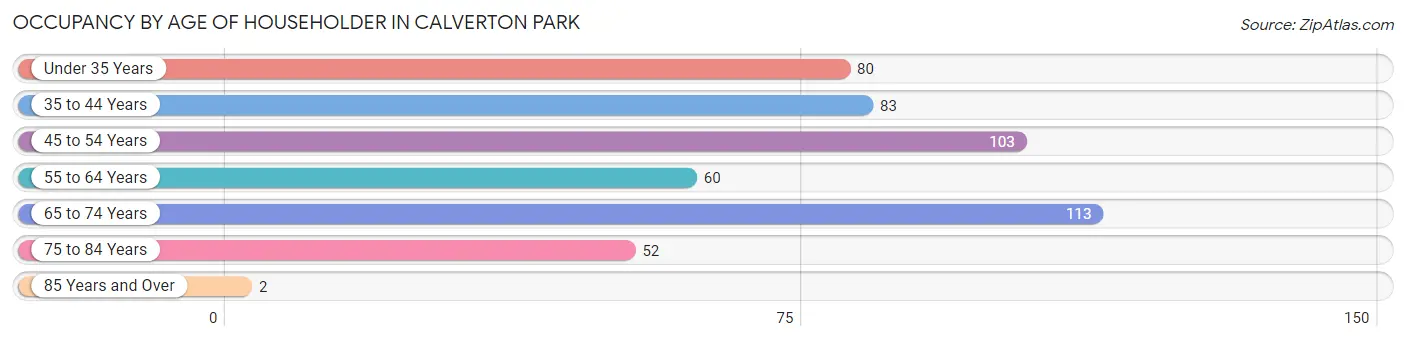
| Age Bracket | # Households | % Households |
| Under 35 Years | 80 | 16.2% |
| 35 to 44 Years | 83 | 16.8% |
| 45 to 54 Years | 103 | 20.9% |
| 55 to 64 Years | 60 | 12.2% |
| 65 to 74 Years | 113 | 22.9% |
| 75 to 84 Years | 52 | 10.5% |
| 85 Years and Over | 2 | 0.4% |
| Total | 493 | 100.0% |
Housing Finances in Calverton Park
Median Income by Occupancy in Calverton Park
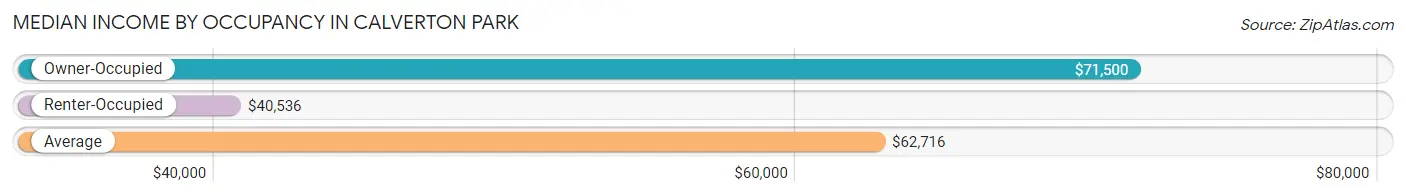
| Occupancy Type | # Households | Median Income |
| Owner-Occupied | 350 (71.0%) | $71,500 |
| Renter-Occupied | 143 (29.0%) | $40,536 |
| Average | 493 (100.0%) | $62,716 |
Occupancy by Householder Income Bracket in Calverton Park
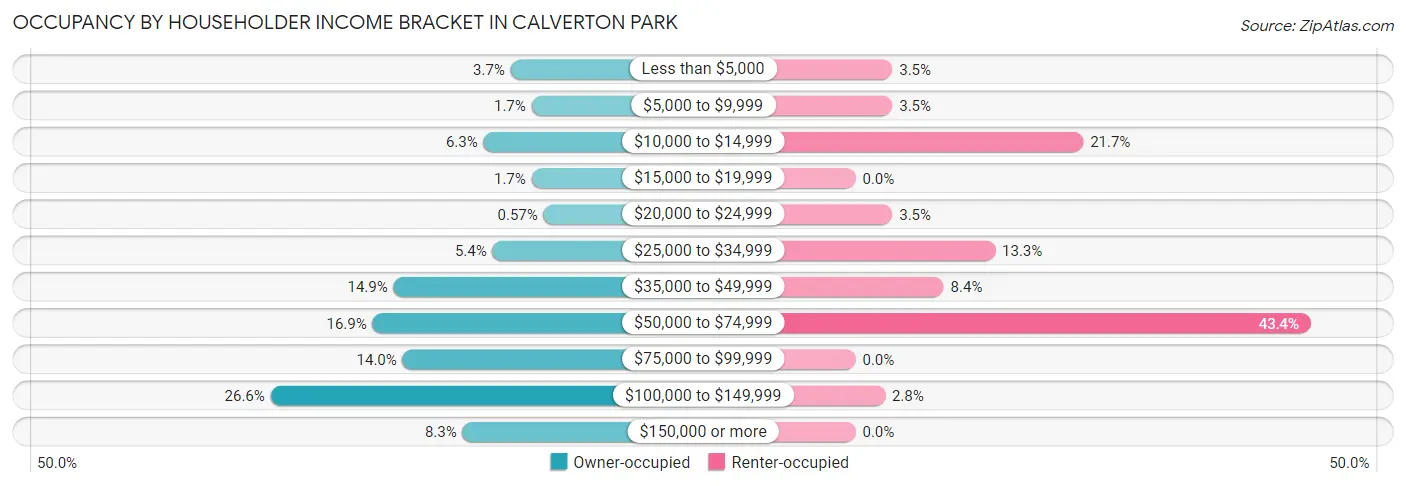
| Income Bracket | Owner-occupied | Renter-occupied |
| Less than $5,000 | 13 (3.7%) | 5 (3.5%) |
| $5,000 to $9,999 | 6 (1.7%) | 5 (3.5%) |
| $10,000 to $14,999 | 22 (6.3%) | 31 (21.7%) |
| $15,000 to $19,999 | 6 (1.7%) | 0 (0.0%) |
| $20,000 to $24,999 | 2 (0.6%) | 5 (3.5%) |
| $25,000 to $34,999 | 19 (5.4%) | 19 (13.3%) |
| $35,000 to $49,999 | 52 (14.9%) | 12 (8.4%) |
| $50,000 to $74,999 | 59 (16.9%) | 62 (43.4%) |
| $75,000 to $99,999 | 49 (14.0%) | 0 (0.0%) |
| $100,000 to $149,999 | 93 (26.6%) | 4 (2.8%) |
| $150,000 or more | 29 (8.3%) | 0 (0.0%) |
| Total | 350 (100.0%) | 143 (100.0%) |
Monthly Housing Cost Tiers in Calverton Park
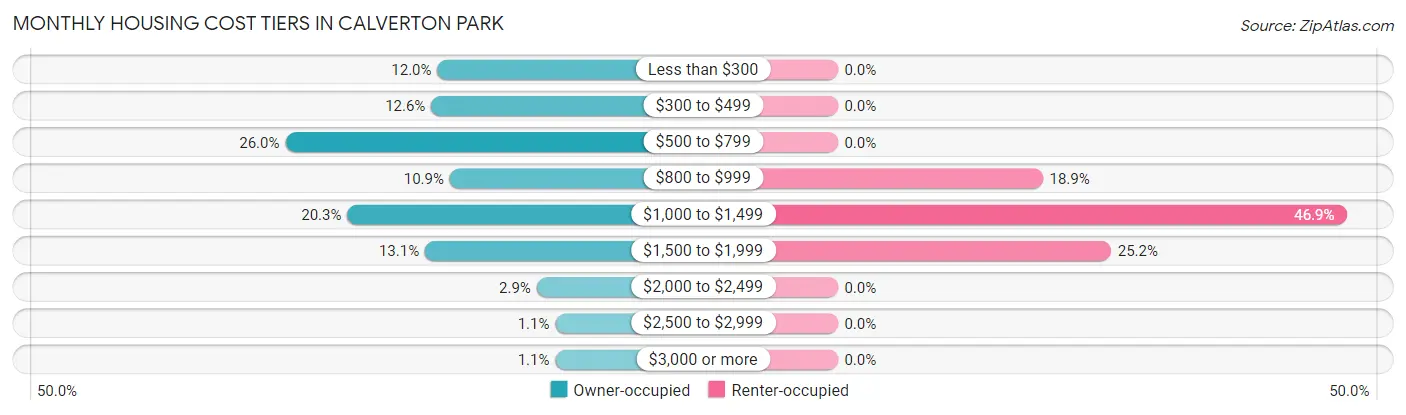
| Monthly Cost | Owner-occupied | Renter-occupied |
| Less than $300 | 42 (12.0%) | 0 (0.0%) |
| $300 to $499 | 44 (12.6%) | 0 (0.0%) |
| $500 to $799 | 91 (26.0%) | 0 (0.0%) |
| $800 to $999 | 38 (10.9%) | 27 (18.9%) |
| $1,000 to $1,499 | 71 (20.3%) | 67 (46.9%) |
| $1,500 to $1,999 | 46 (13.1%) | 36 (25.2%) |
| $2,000 to $2,499 | 10 (2.9%) | 0 (0.0%) |
| $2,500 to $2,999 | 4 (1.1%) | 0 (0.0%) |
| $3,000 or more | 4 (1.1%) | 0 (0.0%) |
| Total | 350 (100.0%) | 143 (100.0%) |
Physical Housing Characteristics in Calverton Park
Housing Structures in Calverton Park
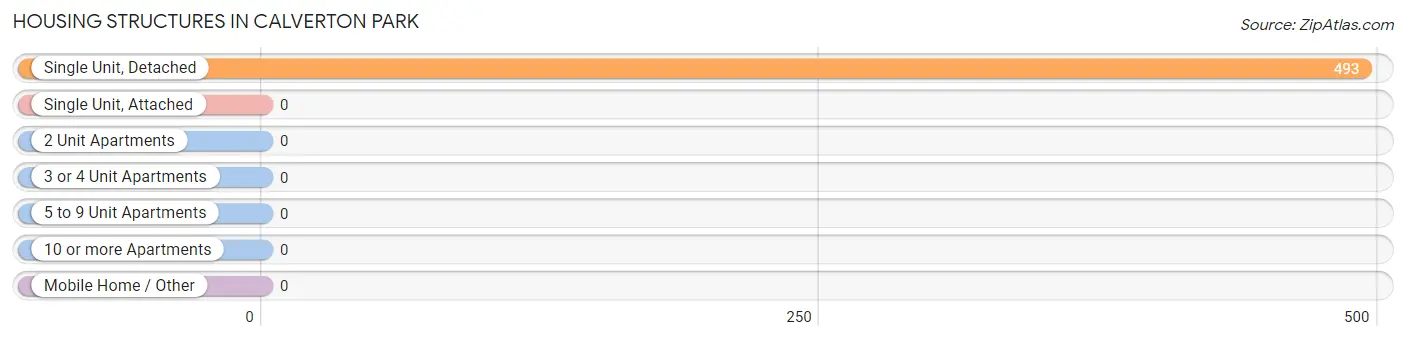
| Structure Type | # Housing Units | % Housing Units |
| Single Unit, Detached | 493 | 100.0% |
| Single Unit, Attached | 0 | 0.0% |
| 2 Unit Apartments | 0 | 0.0% |
| 3 or 4 Unit Apartments | 0 | 0.0% |
| 5 to 9 Unit Apartments | 0 | 0.0% |
| 10 or more Apartments | 0 | 0.0% |
| Mobile Home / Other | 0 | 0.0% |
| Total | 493 | 100.0% |
Housing Structures by Occupancy in Calverton Park
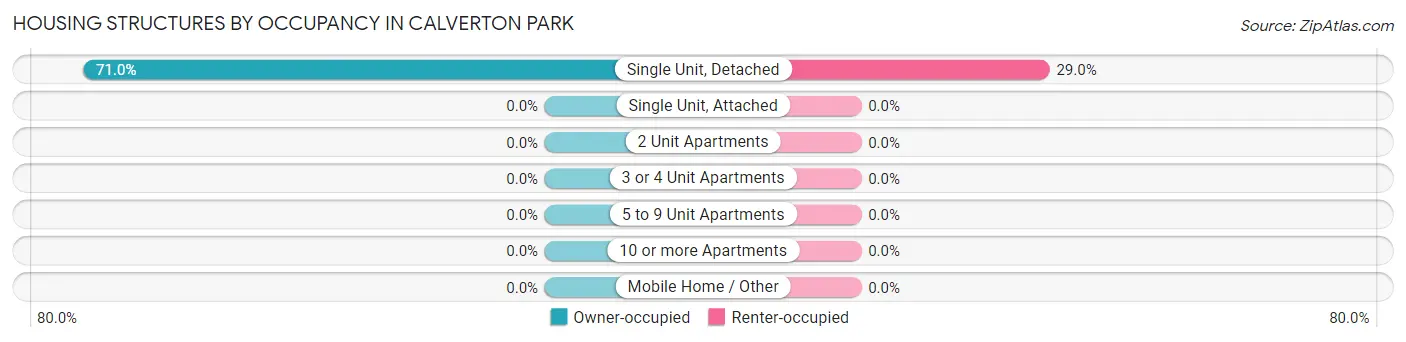
| Structure Type | Owner-occupied | Renter-occupied |
| Single Unit, Detached | 350 (71.0%) | 143 (29.0%) |
| Single Unit, Attached | 0 (0.0%) | 0 (0.0%) |
| 2 Unit Apartments | 0 (0.0%) | 0 (0.0%) |
| 3 or 4 Unit Apartments | 0 (0.0%) | 0 (0.0%) |
| 5 to 9 Unit Apartments | 0 (0.0%) | 0 (0.0%) |
| 10 or more Apartments | 0 (0.0%) | 0 (0.0%) |
| Mobile Home / Other | 0 (0.0%) | 0 (0.0%) |
| Total | 350 (71.0%) | 143 (29.0%) |
Housing Structures by Number of Rooms in Calverton Park
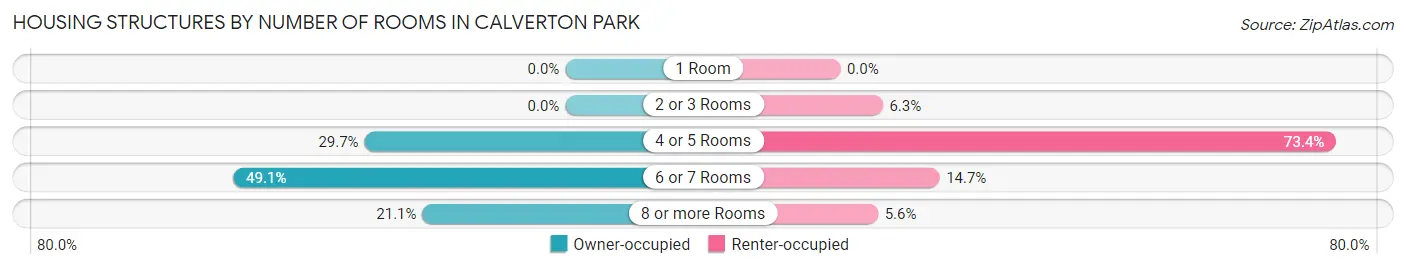
| Number of Rooms | Owner-occupied | Renter-occupied |
| 1 Room | 0 (0.0%) | 0 (0.0%) |
| 2 or 3 Rooms | 0 (0.0%) | 9 (6.3%) |
| 4 or 5 Rooms | 104 (29.7%) | 105 (73.4%) |
| 6 or 7 Rooms | 172 (49.1%) | 21 (14.7%) |
| 8 or more Rooms | 74 (21.1%) | 8 (5.6%) |
| Total | 350 (100.0%) | 143 (100.0%) |
Housing Structure by Heating Type in Calverton Park
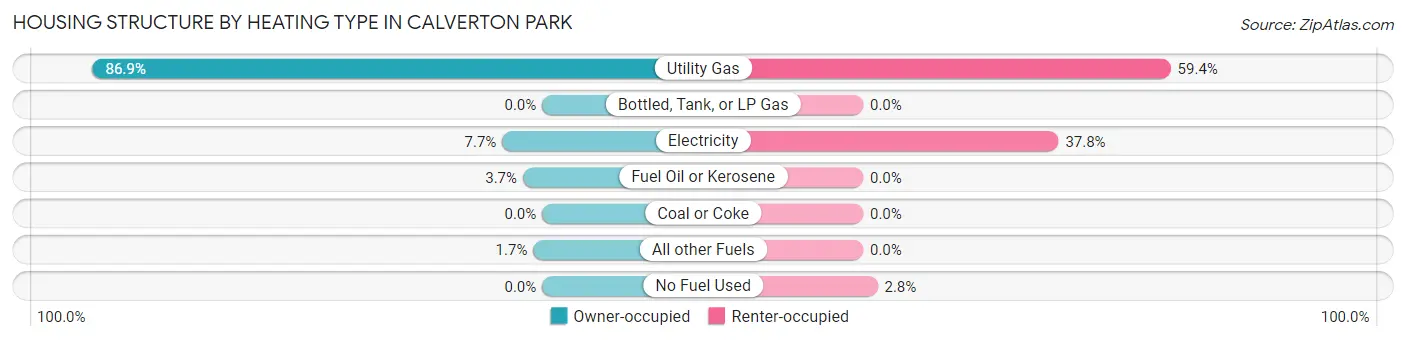
| Heating Type | Owner-occupied | Renter-occupied |
| Utility Gas | 304 (86.9%) | 85 (59.4%) |
| Bottled, Tank, or LP Gas | 0 (0.0%) | 0 (0.0%) |
| Electricity | 27 (7.7%) | 54 (37.8%) |
| Fuel Oil or Kerosene | 13 (3.7%) | 0 (0.0%) |
| Coal or Coke | 0 (0.0%) | 0 (0.0%) |
| All other Fuels | 6 (1.7%) | 0 (0.0%) |
| No Fuel Used | 0 (0.0%) | 4 (2.8%) |
| Total | 350 (100.0%) | 143 (100.0%) |
Household Vehicle Usage in Calverton Park
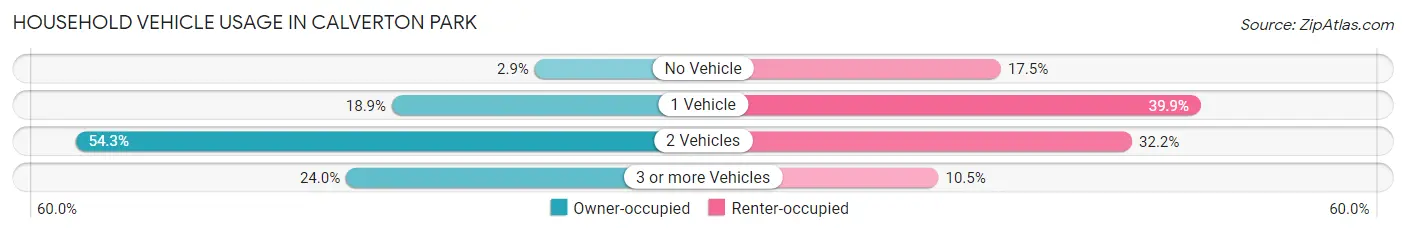
| Vehicles per Household | Owner-occupied | Renter-occupied |
| No Vehicle | 10 (2.9%) | 25 (17.5%) |
| 1 Vehicle | 66 (18.9%) | 57 (39.9%) |
| 2 Vehicles | 190 (54.3%) | 46 (32.2%) |
| 3 or more Vehicles | 84 (24.0%) | 15 (10.5%) |
| Total | 350 (100.0%) | 143 (100.0%) |
Real Estate & Mortgages in Calverton Park
Real Estate and Mortgage Overview in Calverton Park
| Characteristic | Without Mortgage | With Mortgage |
| Housing Units | 186 | 164 |
| Median Property Value | $85,500 | $137,700 |
| Median Household Income | $48,750 | $25 |
| Monthly Housing Costs | $516 | $4 |
| Real Estate Taxes | $1,328 | $0 |
Property Value by Mortgage Status in Calverton Park
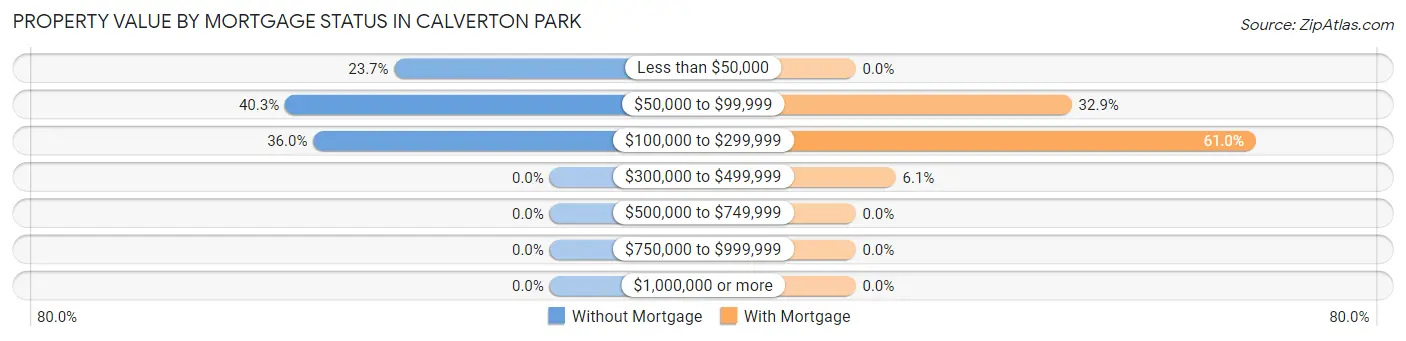
| Property Value | Without Mortgage | With Mortgage |
| Less than $50,000 | 44 (23.7%) | 0 (0.0%) |
| $50,000 to $99,999 | 75 (40.3%) | 54 (32.9%) |
| $100,000 to $299,999 | 67 (36.0%) | 100 (61.0%) |
| $300,000 to $499,999 | 0 (0.0%) | 10 (6.1%) |
| $500,000 to $749,999 | 0 (0.0%) | 0 (0.0%) |
| $750,000 to $999,999 | 0 (0.0%) | 0 (0.0%) |
| $1,000,000 or more | 0 (0.0%) | 0 (0.0%) |
| Total | 186 (100.0%) | 164 (100.0%) |
Household Income by Mortgage Status in Calverton Park
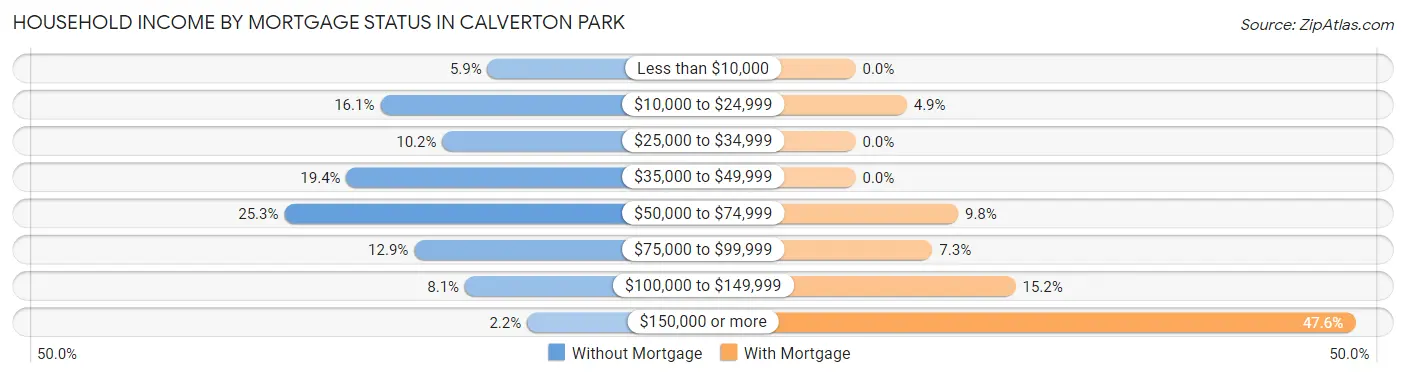
| Household Income | Without Mortgage | With Mortgage |
| Less than $10,000 | 11 (5.9%) | 0 (0.0%) |
| $10,000 to $24,999 | 30 (16.1%) | 8 (4.9%) |
| $25,000 to $34,999 | 19 (10.2%) | 0 (0.0%) |
| $35,000 to $49,999 | 36 (19.4%) | 0 (0.0%) |
| $50,000 to $74,999 | 47 (25.3%) | 16 (9.8%) |
| $75,000 to $99,999 | 24 (12.9%) | 12 (7.3%) |
| $100,000 to $149,999 | 15 (8.1%) | 25 (15.2%) |
| $150,000 or more | 4 (2.1%) | 78 (47.6%) |
| Total | 186 (100.0%) | 164 (100.0%) |
Property Value to Household Income Ratio in Calverton Park
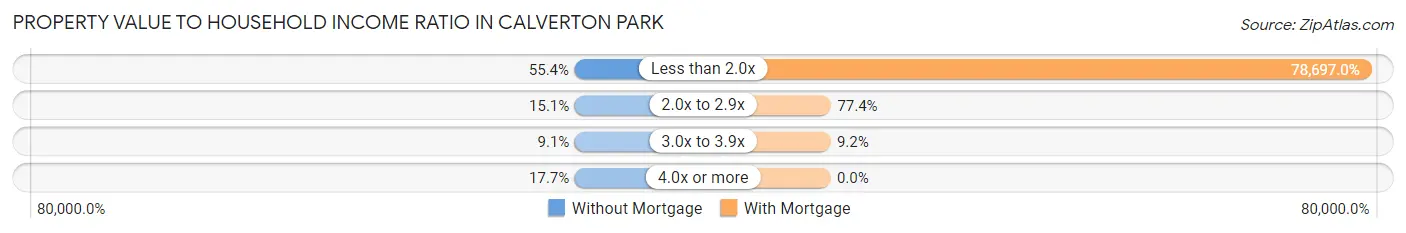
| Value-to-Income Ratio | Without Mortgage | With Mortgage |
| Less than 2.0x | 103 (55.4%) | 129,063 (78,697.0%) |
| 2.0x to 2.9x | 28 (15.0%) | 127 (77.4%) |
| 3.0x to 3.9x | 17 (9.1%) | 15 (9.1%) |
| 4.0x or more | 33 (17.7%) | 0 (0.0%) |
| Total | 186 (100.0%) | 164 (100.0%) |
Real Estate Taxes by Mortgage Status in Calverton Park
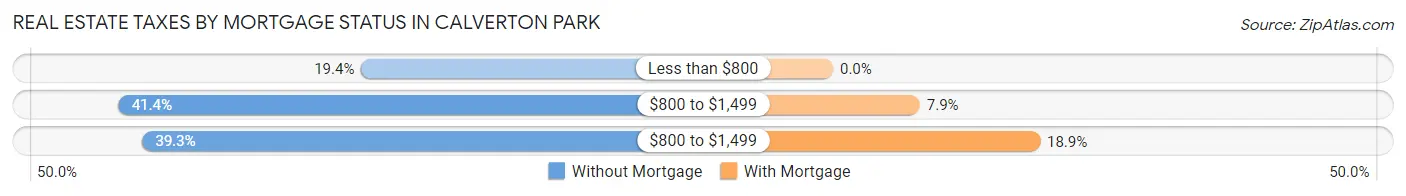
| Property Taxes | Without Mortgage | With Mortgage |
| Less than $800 | 36 (19.4%) | 0 (0.0%) |
| $800 to $1,499 | 77 (41.4%) | 13 (7.9%) |
| $800 to $1,499 | 73 (39.3%) | 31 (18.9%) |
| Total | 186 (100.0%) | 164 (100.0%) |
Health & Disability in Calverton Park
Health Insurance Coverage by Age in Calverton Park
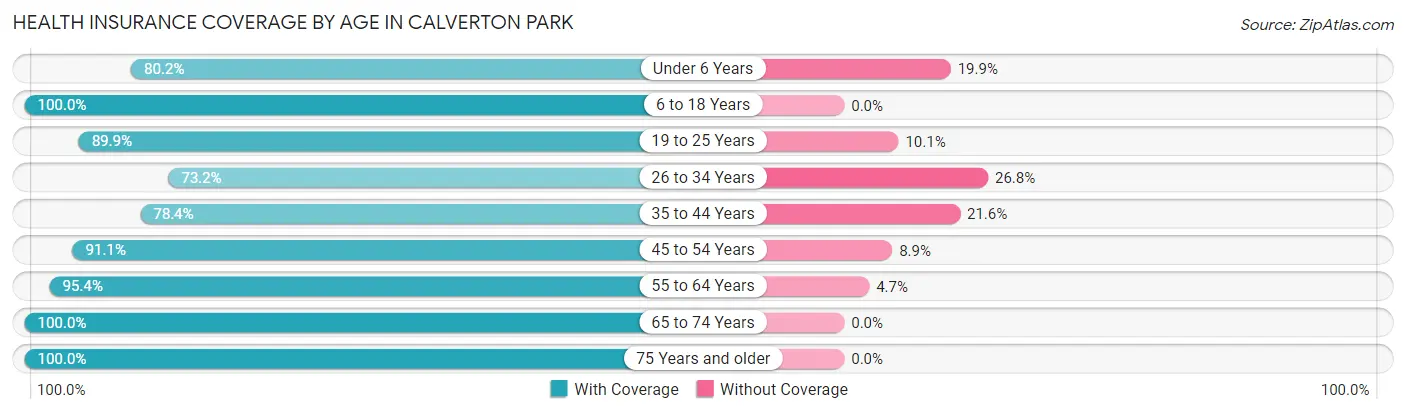
| Age Bracket | With Coverage | Without Coverage |
| Under 6 Years | 109 (80.1%) | 27 (19.9%) |
| 6 to 18 Years | 191 (100.0%) | 0 (0.0%) |
| 19 to 25 Years | 89 (89.9%) | 10 (10.1%) |
| 26 to 34 Years | 71 (73.2%) | 26 (26.8%) |
| 35 to 44 Years | 178 (78.4%) | 49 (21.6%) |
| 45 to 54 Years | 163 (91.1%) | 16 (8.9%) |
| 55 to 64 Years | 123 (95.4%) | 6 (4.6%) |
| 65 to 74 Years | 153 (100.0%) | 0 (0.0%) |
| 75 Years and older | 84 (100.0%) | 0 (0.0%) |
| Total | 1,161 (89.6%) | 134 (10.3%) |
Health Insurance Coverage by Citizenship Status in Calverton Park
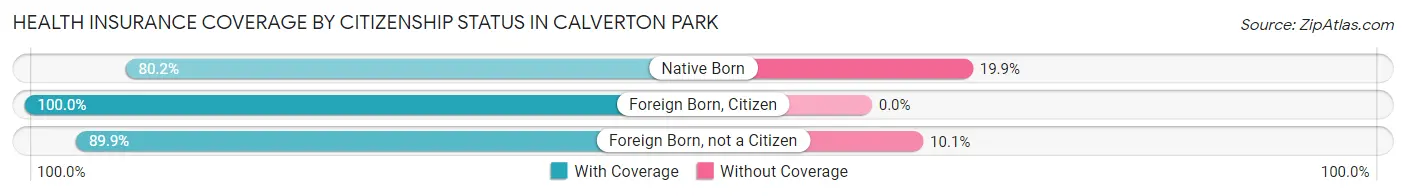
| Citizenship Status | With Coverage | Without Coverage |
| Native Born | 109 (80.1%) | 27 (19.9%) |
| Foreign Born, Citizen | 191 (100.0%) | 0 (0.0%) |
| Foreign Born, not a Citizen | 89 (89.9%) | 10 (10.1%) |
Health Insurance Coverage by Household Income in Calverton Park
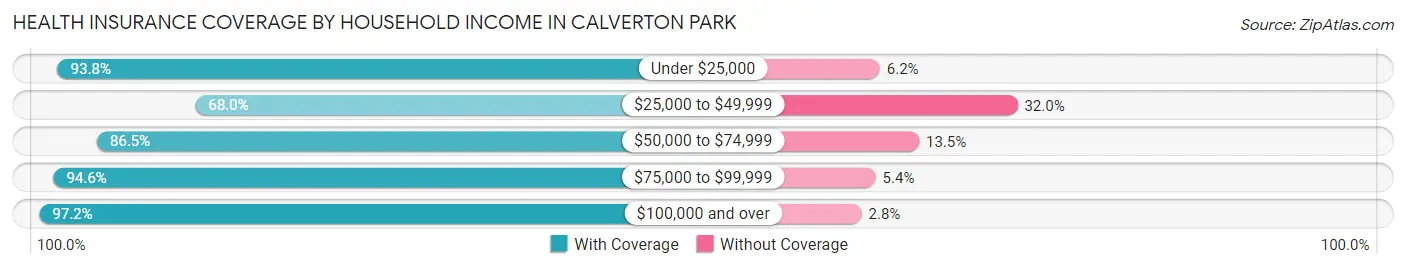
| Household Income | With Coverage | Without Coverage |
| Under $25,000 | 182 (93.8%) | 12 (6.2%) |
| $25,000 to $49,999 | 134 (68.0%) | 63 (32.0%) |
| $50,000 to $74,999 | 249 (86.5%) | 39 (13.5%) |
| $75,000 to $99,999 | 105 (94.6%) | 6 (5.4%) |
| $100,000 and over | 491 (97.2%) | 14 (2.8%) |
Public vs Private Health Insurance Coverage by Age in Calverton Park
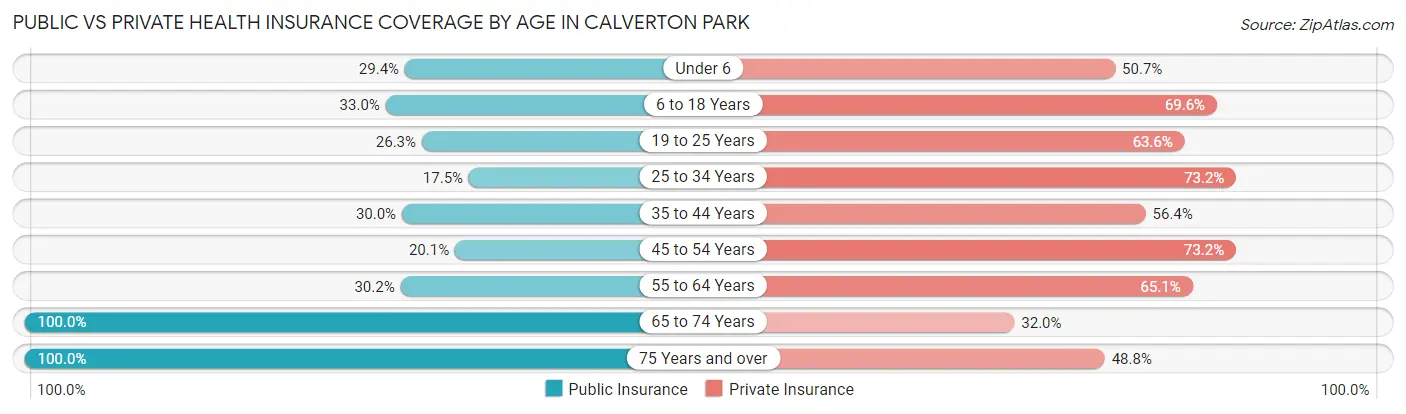
| Age Bracket | Public Insurance | Private Insurance |
| Under 6 | 40 (29.4%) | 69 (50.7%) |
| 6 to 18 Years | 63 (33.0%) | 133 (69.6%) |
| 19 to 25 Years | 26 (26.3%) | 63 (63.6%) |
| 25 to 34 Years | 17 (17.5%) | 71 (73.2%) |
| 35 to 44 Years | 68 (30.0%) | 128 (56.4%) |
| 45 to 54 Years | 36 (20.1%) | 131 (73.2%) |
| 55 to 64 Years | 39 (30.2%) | 84 (65.1%) |
| 65 to 74 Years | 153 (100.0%) | 49 (32.0%) |
| 75 Years and over | 84 (100.0%) | 41 (48.8%) |
| Total | 526 (40.6%) | 769 (59.4%) |
Disability Status by Sex by Age in Calverton Park
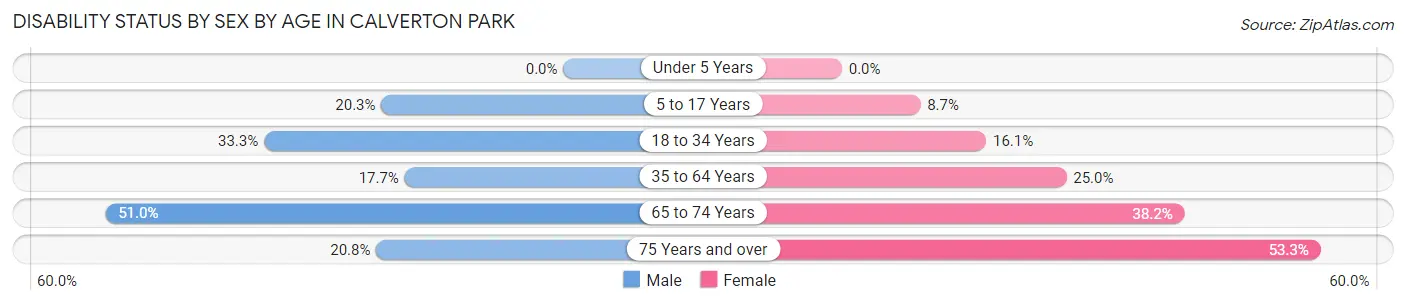
| Age Bracket | Male | Female |
| Under 5 Years | 0 (0.0%) | 0 (0.0%) |
| 5 to 17 Years | 15 (20.3%) | 11 (8.7%) |
| 18 to 34 Years | 28 (33.3%) | 18 (16.1%) |
| 35 to 64 Years | 50 (17.7%) | 63 (25.0%) |
| 65 to 74 Years | 50 (51.0%) | 21 (38.2%) |
| 75 Years and over | 5 (20.8%) | 32 (53.3%) |
Disability Class by Sex by Age in Calverton Park
Disability Class: Hearing Difficulty
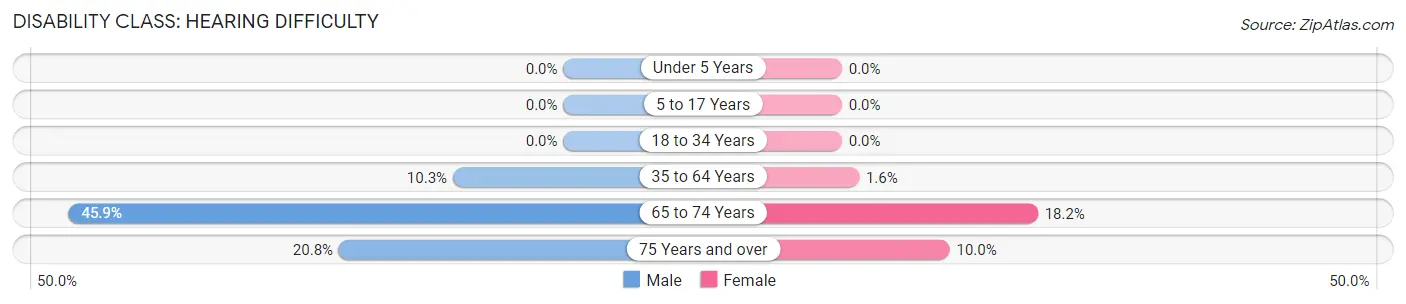
| Age Bracket | Male | Female |
| Under 5 Years | 0 (0.0%) | 0 (0.0%) |
| 5 to 17 Years | 0 (0.0%) | 0 (0.0%) |
| 18 to 34 Years | 0 (0.0%) | 0 (0.0%) |
| 35 to 64 Years | 29 (10.2%) | 4 (1.6%) |
| 65 to 74 Years | 45 (45.9%) | 10 (18.2%) |
| 75 Years and over | 5 (20.8%) | 6 (10.0%) |
Disability Class: Vision Difficulty
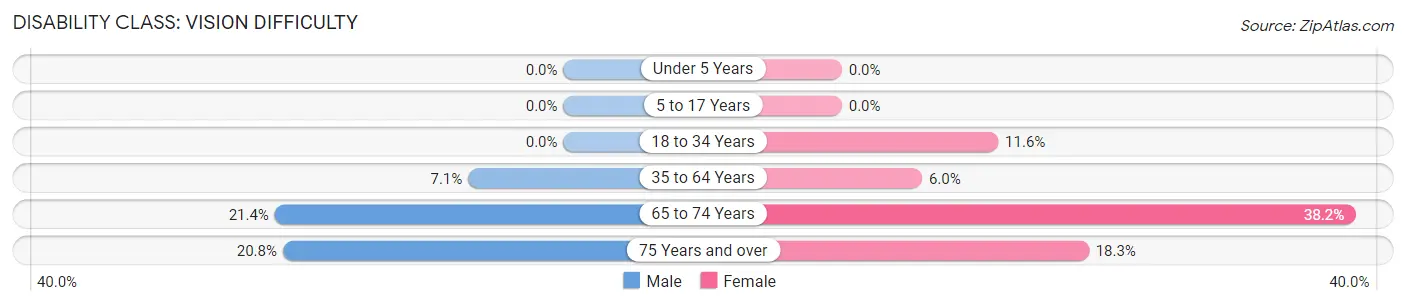
| Age Bracket | Male | Female |
| Under 5 Years | 0 (0.0%) | 0 (0.0%) |
| 5 to 17 Years | 0 (0.0%) | 0 (0.0%) |
| 18 to 34 Years | 0 (0.0%) | 13 (11.6%) |
| 35 to 64 Years | 20 (7.1%) | 15 (5.9%) |
| 65 to 74 Years | 21 (21.4%) | 21 (38.2%) |
| 75 Years and over | 5 (20.8%) | 11 (18.3%) |
Disability Class: Cognitive Difficulty
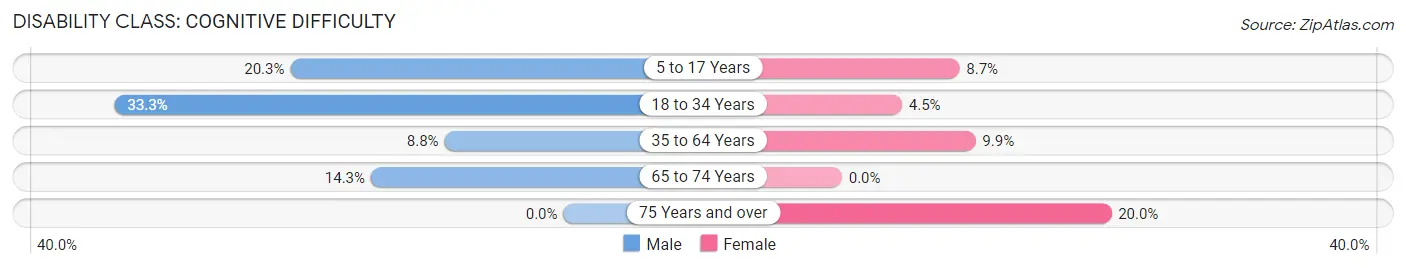
| Age Bracket | Male | Female |
| 5 to 17 Years | 15 (20.3%) | 11 (8.7%) |
| 18 to 34 Years | 28 (33.3%) | 5 (4.5%) |
| 35 to 64 Years | 25 (8.8%) | 25 (9.9%) |
| 65 to 74 Years | 14 (14.3%) | 0 (0.0%) |
| 75 Years and over | 0 (0.0%) | 12 (20.0%) |
Disability Class: Ambulatory Difficulty
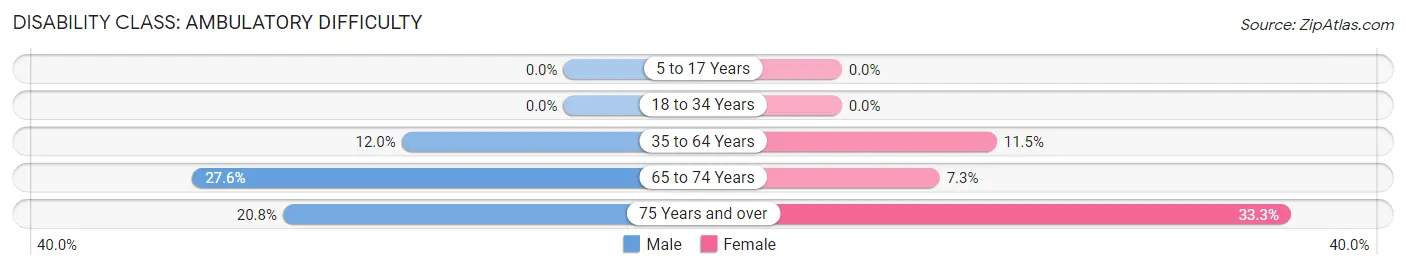
| Age Bracket | Male | Female |
| 5 to 17 Years | 0 (0.0%) | 0 (0.0%) |
| 18 to 34 Years | 0 (0.0%) | 0 (0.0%) |
| 35 to 64 Years | 34 (12.0%) | 29 (11.5%) |
| 65 to 74 Years | 27 (27.6%) | 4 (7.3%) |
| 75 Years and over | 5 (20.8%) | 20 (33.3%) |
Disability Class: Self-Care Difficulty
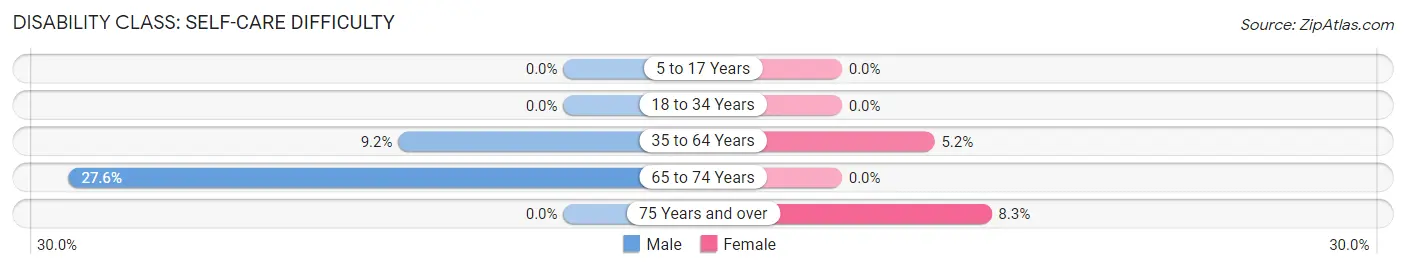
| Age Bracket | Male | Female |
| 5 to 17 Years | 0 (0.0%) | 0 (0.0%) |
| 18 to 34 Years | 0 (0.0%) | 0 (0.0%) |
| 35 to 64 Years | 26 (9.2%) | 13 (5.2%) |
| 65 to 74 Years | 27 (27.6%) | 0 (0.0%) |
| 75 Years and over | 0 (0.0%) | 5 (8.3%) |
Technology Access in Calverton Park
Computing Device Access in Calverton Park
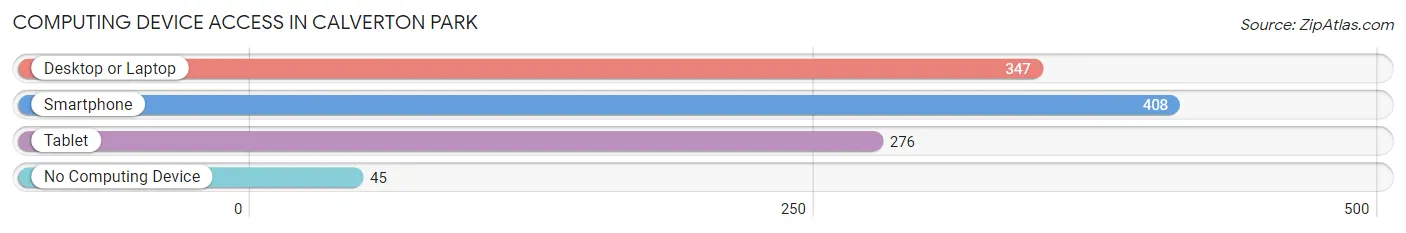
| Device Type | # Households | % Households |
| Desktop or Laptop | 347 | 70.4% |
| Smartphone | 408 | 82.8% |
| Tablet | 276 | 56.0% |
| No Computing Device | 45 | 9.1% |
| Total | 493 | 100.0% |
Internet Access in Calverton Park
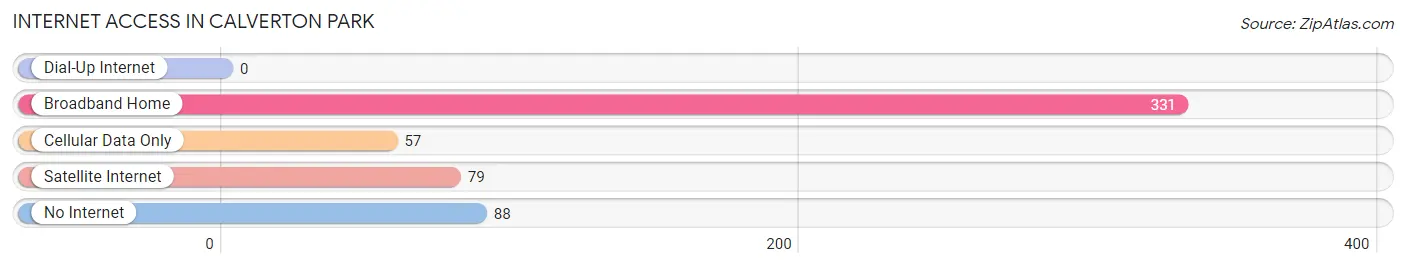
| Internet Type | # Households | % Households |
| Dial-Up Internet | 0 | 0.0% |
| Broadband Home | 331 | 67.1% |
| Cellular Data Only | 57 | 11.6% |
| Satellite Internet | 79 | 16.0% |
| No Internet | 88 | 17.8% |
| Total | 493 | 100.0% |
Calverton Park Summary
Calverton Park is a small city located in St. Louis County, Missouri. It is situated in the northern part of the county, just south of the city of St. Louis. The city has a population of approximately 4,000 people and covers an area of 1.2 square miles.
History
Calverton Park was founded in the early 1900s as a small farming community. The city was named after the Calverton family, who were among the first settlers in the area. The city was incorporated in 1947 and has since grown to become a small city.
Geography
Calverton Park is located in the northern part of St. Louis County, just south of the city of St. Louis. The city is situated on the banks of the Missouri River and is bordered by the cities of St. Louis, Jennings, and Normandy. The city has a total area of 1.2 square miles, all of which is land.
Economy
Calverton Park has a diverse economy, with a variety of businesses and industries located in the city. The city is home to several manufacturing companies, including a plastics manufacturer, a metal fabricator, and a printing company. The city also has a number of retail stores, restaurants, and other businesses.
Demographics
As of the 2010 census, Calverton Park had a population of 4,000 people. The racial makeup of the city was 79.3% White, 15.2% African American, 0.3% Native American, 0.7% Asian, 0.1% Pacific Islander, and 4.4% from other races. The median household income in the city was $37,500, and the median family income was $45,000.
Conclusion
Calverton Park is a small city located in St. Louis County, Missouri. It has a population of approximately 4,000 people and covers an area of 1.2 square miles. The city was founded in the early 1900s and has since grown to become a small city with a diverse economy. The city has a population that is mostly White, with a small percentage of African Americans, Native Americans, Asians, and Pacific Islanders. The median household income in the city is $37,500, and the median family income is $45,000.
Common Questions
What is Per Capita Income in Calverton Park?
Per Capita income in Calverton Park is $28,993.
What is the Median Family Income in Calverton Park?
Median Family Income in Calverton Park is $69,375.
What is the Median Household income in Calverton Park?
Median Household Income in Calverton Park is $62,716.
What is Income or Wage Gap in Calverton Park?
Income or Wage Gap in Calverton Park is 7.3%.
Women in Calverton Park earn 92.7 cents for every dollar earned by a man.
What is Inequality or Gini Index in Calverton Park?
Inequality or Gini Index in Calverton Park is 0.42.
What is the Total Population of Calverton Park?
Total Population of Calverton Park is 1,295.
What is the Total Male Population of Calverton Park?
Total Male Population of Calverton Park is 632.
What is the Total Female Population of Calverton Park?
Total Female Population of Calverton Park is 663.
What is the Ratio of Males per 100 Females in Calverton Park?
There are 95.32 Males per 100 Females in Calverton Park.
What is the Ratio of Females per 100 Males in Calverton Park?
There are 104.91 Females per 100 Males in Calverton Park.
What is the Median Population Age in Calverton Park?
Median Population Age in Calverton Park is 41.5 Years.
What is the Average Family Size in Calverton Park
Average Family Size in Calverton Park is 3.3 People.
What is the Average Household Size in Calverton Park
Average Household Size in Calverton Park is 2.6 People.
How Large is the Labor Force in Calverton Park?
There are 603 People in the Labor Forcein in Calverton Park.
What is the Percentage of People in the Labor Force in Calverton Park?
60.1% of People are in the Labor Force in Calverton Park.
What is the Unemployment Rate in Calverton Park?
Unemployment Rate in Calverton Park is 14.9%.