Zip Codes with the Highest Percentage of Population Employed in Real Estate, Rental & Leasing in Florissant, MO
RELATED REPORTS & OPTIONS
Real Estate, Rental & Leasing
Florissant
Compare Zip Codes
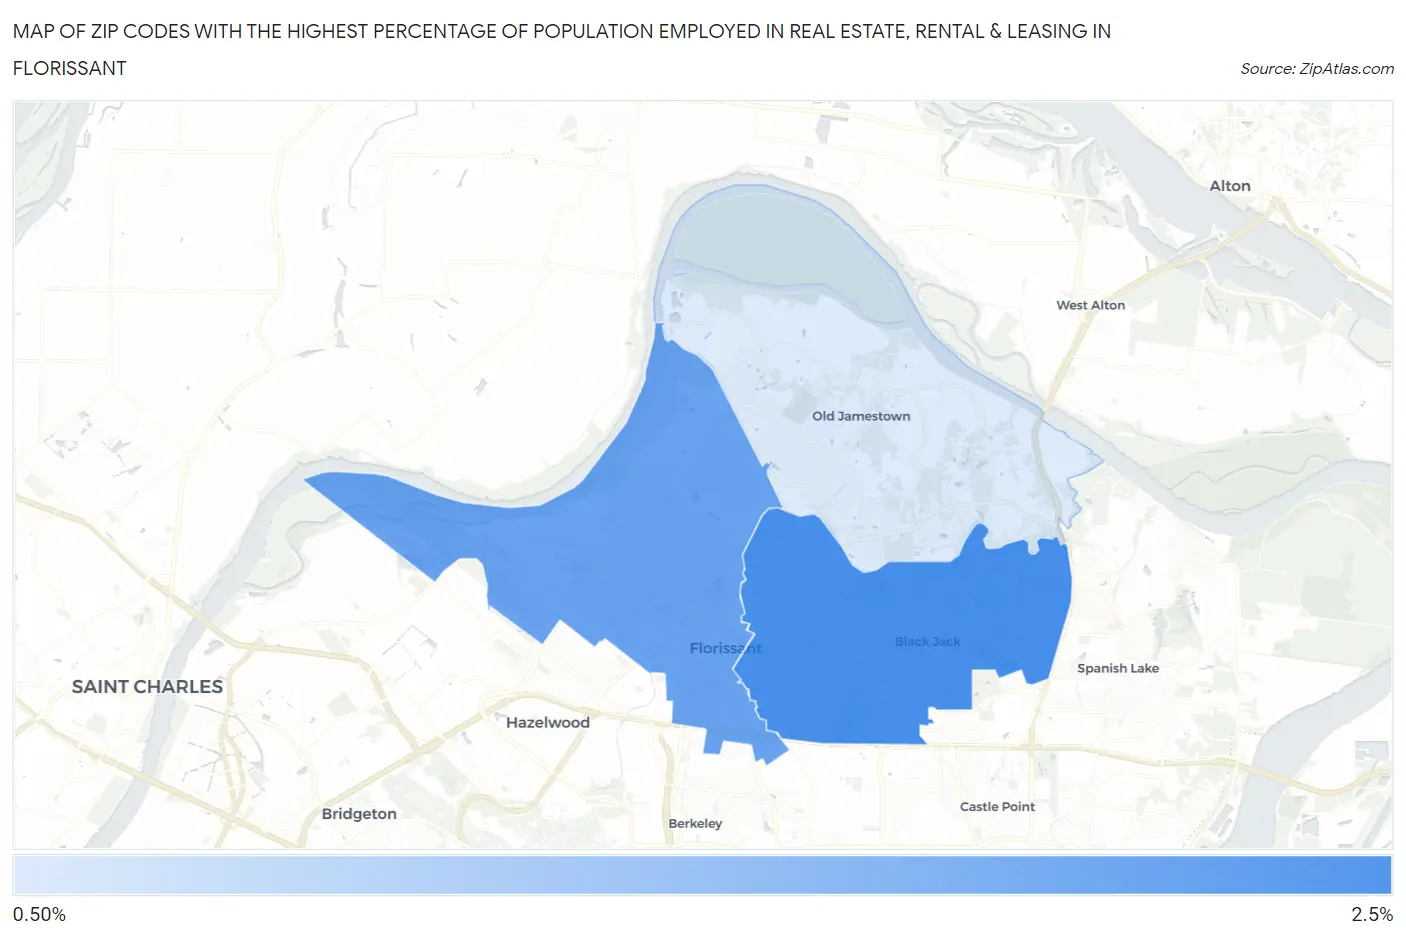
Map of Zip Codes with the Highest Percentage of Population Employed in Real Estate, Rental & Leasing in Florissant
0.94%
2.2%
Zip Codes with the Highest Percentage of Population Employed in Real Estate, Rental & Leasing in Florissant, MO
| Zip Code | % Employed | vs State | vs National | |
| 1. | 63033 | 2.2% | 1.6%(+0.541)#166 | 1.9%(+0.280)#6,949 |
| 2. | 63031 | 1.9% | 1.6%(+0.277)#195 | 1.9%(+0.017)#8,406 |
| 3. | 63034 | 0.94% | 1.6%(-0.691)#374 | 1.9%(-0.952)#15,640 |
1
Common Questions
What are the Top Zip Codes with the Highest Percentage of Population Employed in Real Estate, Rental & Leasing in Florissant, MO?
Top Zip Codes with the Highest Percentage of Population Employed in Real Estate, Rental & Leasing in Florissant, MO are:
What zip code has the Highest Percentage of Population Employed in Real Estate, Rental & Leasing in Florissant, MO?
63033 has the Highest Percentage of Population Employed in Real Estate, Rental & Leasing in Florissant, MO with 2.2%.
What is the Percentage of Population Employed in Real Estate, Rental & Leasing in Florissant, MO?
Percentage of Population Employed in Real Estate, Rental & Leasing in Florissant is 2.0%.
What is the Percentage of Population Employed in Real Estate, Rental & Leasing in Missouri?
Percentage of Population Employed in Real Estate, Rental & Leasing in Missouri is 1.6%.
What is the Percentage of Population Employed in Real Estate, Rental & Leasing in the United States?
Percentage of Population Employed in Real Estate, Rental & Leasing in the United States is 1.9%.