Paynesville, MN Map & Demographics
Paynesville Map
Paynesville Overview
$33,622
PER CAPITA INCOME
$79,087
AVG FAMILY INCOME
$67,768
AVG HOUSEHOLD INCOME
19.8%
WAGE / INCOME GAP [ % ]
80.2¢/ $1
WAGE / INCOME GAP [ $ ]
0.38
INEQUALITY / GINI INDEX
2,432
TOTAL POPULATION
1,217
MALE POPULATION
1,215
FEMALE POPULATION
100.16
MALES / 100 FEMALES
99.84
FEMALES / 100 MALES
46.9
MEDIAN AGE
2.9
AVG FAMILY SIZE
2.3
AVG HOUSEHOLD SIZE
1,206
LABOR FORCE [ PEOPLE ]
60.0%
PERCENT IN LABOR FORCE
3.0%
UNEMPLOYMENT RATE
Paynesville Zip Codes
Paynesville Area Codes
Income in Paynesville
Income Overview in Paynesville
Per Capita Income in Paynesville is $33,622, while median incomes of families and households are $79,087 and $67,768 respectively.
| Characteristic | Number | Measure |
| Per Capita Income | 2,432 | $33,622 |
| Median Family Income | 611 | $79,087 |
| Mean Family Income | 611 | $91,264 |
| Median Household Income | 1,047 | $67,768 |
| Mean Household Income | 1,047 | $76,130 |
| Income Deficit | 611 | $0 |
| Wage / Income Gap (%) | 2,432 | 19.78% |
| Wage / Income Gap ($) | 2,432 | 80.22¢ per $1 |
| Gini / Inequality Index | 2,432 | 0.38 |
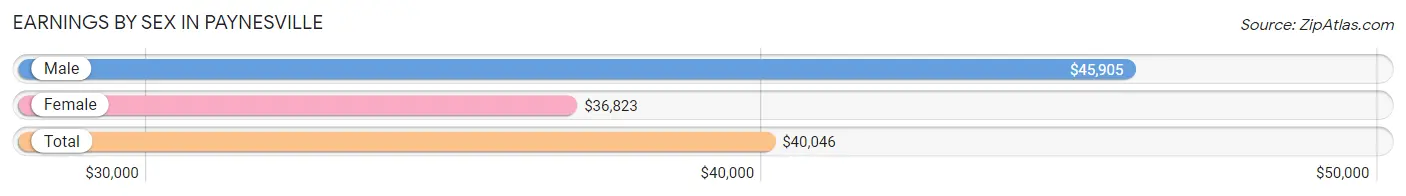
Earnings by Sex in Paynesville
Average Earnings in Paynesville are $40,046, $45,905 for men and $36,823 for women, a difference of 19.8%.
| Sex | Number | Average Earnings |
| Male | 653 (50.4%) | $45,905 |
| Female | 643 (49.6%) | $36,823 |
| Total | 1,296 (100.0%) | $40,046 |
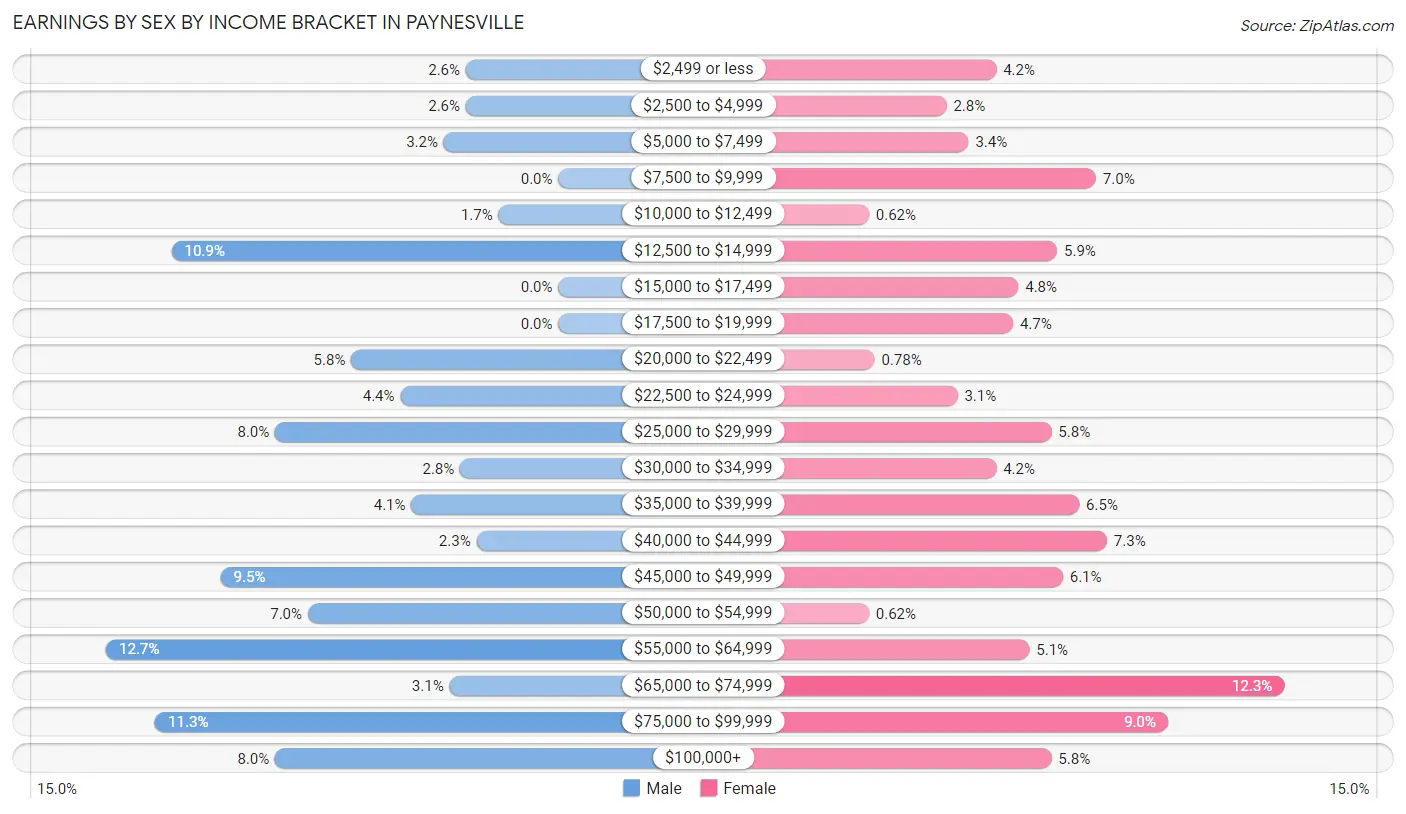
Earnings by Sex by Income Bracket in Paynesville
The most common earnings brackets in Paynesville are $55,000 to $64,999 for men (83 | 12.7%) and $65,000 to $74,999 for women (79 | 12.3%).
| Income | Male | Female |
| $2,499 or less | 17 (2.6%) | 27 (4.2%) |
| $2,500 to $4,999 | 17 (2.6%) | 18 (2.8%) |
| $5,000 to $7,499 | 21 (3.2%) | 22 (3.4%) |
| $7,500 to $9,999 | 0 (0.0%) | 45 (7.0%) |
| $10,000 to $12,499 | 11 (1.7%) | 4 (0.6%) |
| $12,500 to $14,999 | 71 (10.9%) | 38 (5.9%) |
| $15,000 to $17,499 | 0 (0.0%) | 31 (4.8%) |
| $17,500 to $19,999 | 0 (0.0%) | 30 (4.7%) |
| $20,000 to $22,499 | 38 (5.8%) | 5 (0.8%) |
| $22,500 to $24,999 | 29 (4.4%) | 20 (3.1%) |
| $25,000 to $29,999 | 52 (8.0%) | 37 (5.8%) |
| $30,000 to $34,999 | 18 (2.8%) | 27 (4.2%) |
| $35,000 to $39,999 | 27 (4.1%) | 42 (6.5%) |
| $40,000 to $44,999 | 15 (2.3%) | 47 (7.3%) |
| $45,000 to $49,999 | 62 (9.5%) | 39 (6.1%) |
| $50,000 to $54,999 | 46 (7.0%) | 4 (0.6%) |
| $55,000 to $64,999 | 83 (12.7%) | 33 (5.1%) |
| $65,000 to $74,999 | 20 (3.1%) | 79 (12.3%) |
| $75,000 to $99,999 | 74 (11.3%) | 58 (9.0%) |
| $100,000+ | 52 (8.0%) | 37 (5.8%) |
| Total | 653 (100.0%) | 643 (100.0%) |
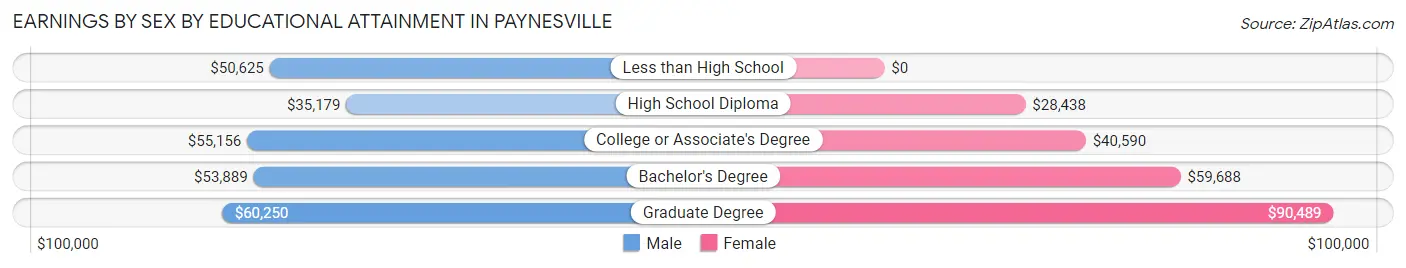
Earnings by Sex by Educational Attainment in Paynesville
Average earnings in Paynesville are $50,625 for men and $42,012 for women, a difference of 17.0%. Men with an educational attainment of graduate degree enjoy the highest average annual earnings of $60,250, while those with high school diploma education earn the least with $35,179. Women with an educational attainment of graduate degree earn the most with the average annual earnings of $90,489, while those with high school diploma education have the smallest earnings of $28,438.
| Educational Attainment | Male Income | Female Income |
| Less than High School | $50,625 | $0 |
| High School Diploma | $35,179 | $28,438 |
| College or Associate's Degree | $55,156 | $40,590 |
| Bachelor's Degree | $53,889 | $59,688 |
| Graduate Degree | $60,250 | $90,489 |
| Total | $50,625 | $42,012 |
Family Income in Paynesville
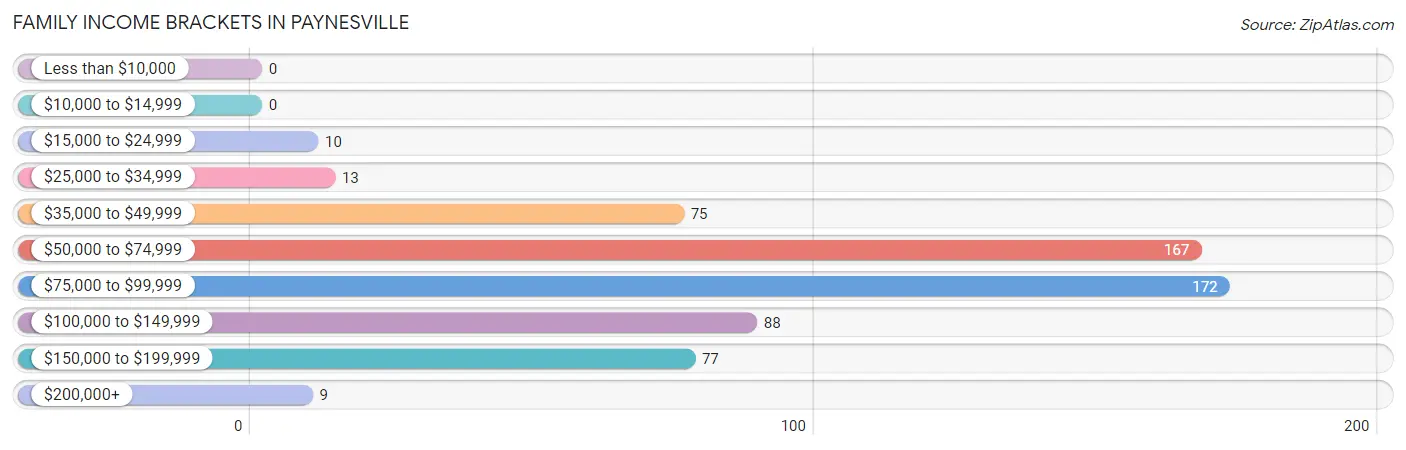
Family Income Brackets in Paynesville
According to the Paynesville family income data, there are 172 families falling into the $75,000 to $99,999 income range, which is the most common income bracket and makes up 28.1% of all families.
| Income Bracket | # Families | % Families |
| Less than $10,000 | 0 | 0.0% |
| $10,000 to $14,999 | 0 | 0.0% |
| $15,000 to $24,999 | 10 | 1.6% |
| $25,000 to $34,999 | 13 | 2.1% |
| $35,000 to $49,999 | 75 | 12.3% |
| $50,000 to $74,999 | 167 | 27.3% |
| $75,000 to $99,999 | 172 | 28.2% |
| $100,000 to $149,999 | 88 | 14.4% |
| $150,000 to $199,999 | 77 | 12.6% |
| $200,000+ | 9 | 1.5% |
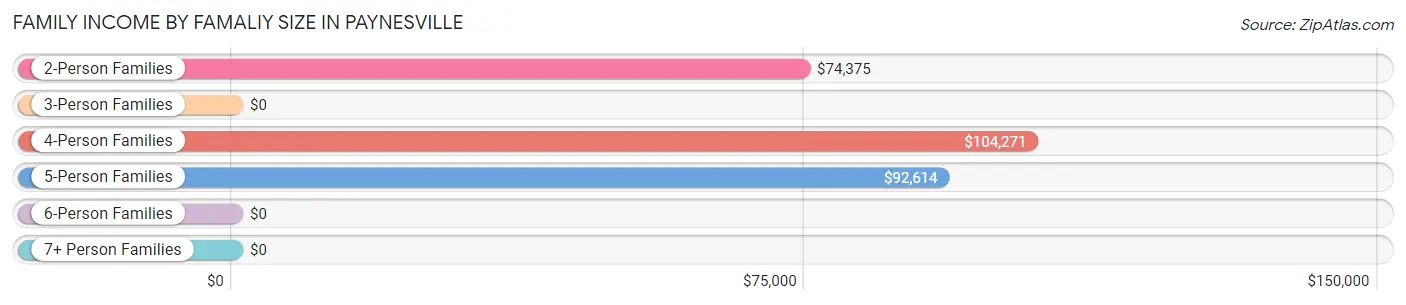
Family Income by Famaliy Size in Paynesville
4-person families (97 | 15.9%) account for the highest median family income in Paynesville with $104,271 per family, while 2-person families (367 | 60.1%) have the highest median income of $37,188 per family member.
| Income Bracket | # Families | Median Income |
| 2-Person Families | 367 (60.1%) | $74,375 |
| 3-Person Families | 114 (18.7%) | $0 |
| 4-Person Families | 97 (15.9%) | $104,271 |
| 5-Person Families | 33 (5.4%) | $92,614 |
| 6-Person Families | 0 (0.0%) | $0 |
| 7+ Person Families | 0 (0.0%) | $0 |
| Total | 611 (100.0%) | $79,087 |
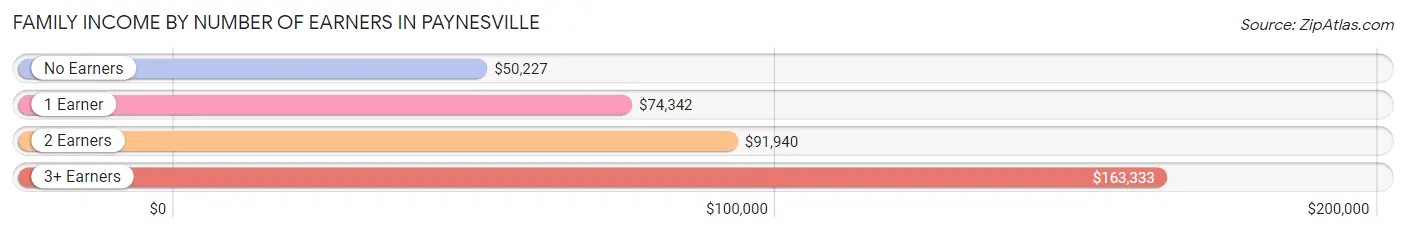
Family Income by Number of Earners in Paynesville
The median family income in Paynesville is $79,087, with families comprising 3+ earners (68) having the highest median family income of $163,333, while families with no earners (140) have the lowest median family income of $50,227, accounting for 11.1% and 22.9% of families, respectively.
| Number of Earners | # Families | Median Income |
| No Earners | 140 (22.9%) | $50,227 |
| 1 Earner | 166 (27.2%) | $74,342 |
| 2 Earners | 237 (38.8%) | $91,940 |
| 3+ Earners | 68 (11.1%) | $163,333 |
| Total | 611 (100.0%) | $79,087 |
Household Income in Paynesville
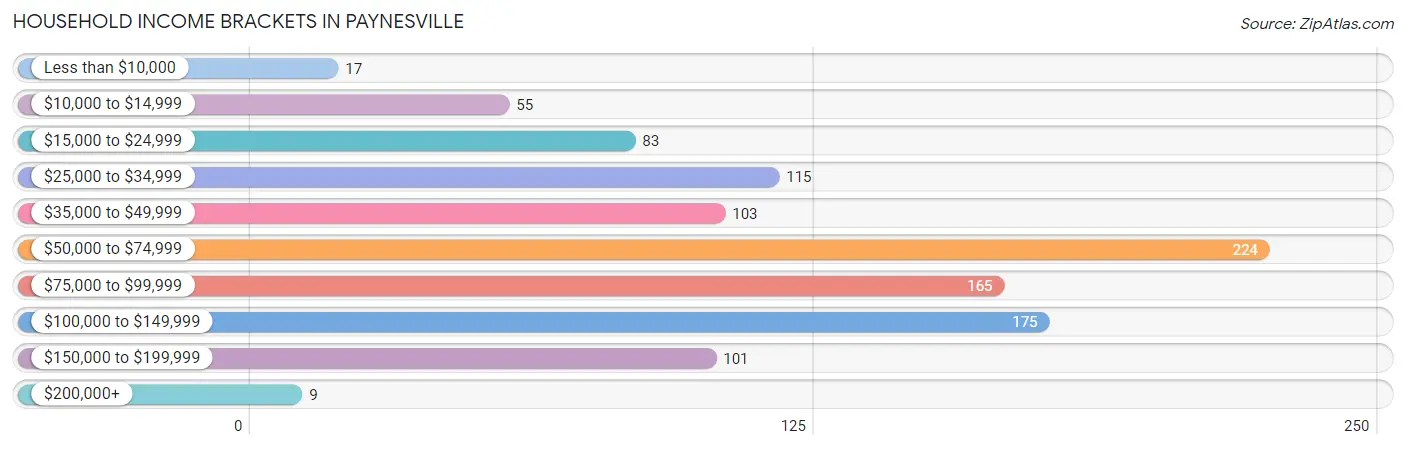
Household Income Brackets in Paynesville
With 224 households falling in the category, the $50,000 to $74,999 income range is the most frequent in Paynesville, accounting for 21.4% of all households. In contrast, only 9 households (0.9%) fall into the $200,000+ income bracket, making it the least populous group.
| Income Bracket | # Households | % Households |
| Less than $10,000 | 17 | 1.6% |
| $10,000 to $14,999 | 55 | 5.3% |
| $15,000 to $24,999 | 83 | 7.9% |
| $25,000 to $34,999 | 115 | 11.0% |
| $35,000 to $49,999 | 103 | 9.8% |
| $50,000 to $74,999 | 224 | 21.4% |
| $75,000 to $99,999 | 165 | 15.8% |
| $100,000 to $149,999 | 175 | 16.7% |
| $150,000 to $199,999 | 101 | 9.6% |
| $200,000+ | 9 | 0.9% |
Household Income by Householder Age in Paynesville
The median household income in Paynesville is $67,768, with the highest median household income of $96,354 found in the 25 to 44 years age bracket for the primary householder. A total of 266 households (25.4%) fall into this category. Meanwhile, the 15 to 24 years age bracket for the primary householder has the lowest median household income of $0, with 18 households (1.7%) in this group.
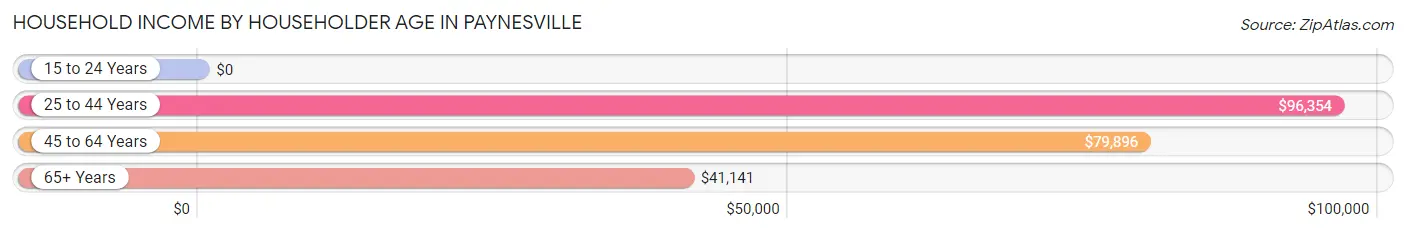
| Income Bracket | # Households | Median Income |
| 15 to 24 Years | 18 (1.7%) | $0 |
| 25 to 44 Years | 266 (25.4%) | $96,354 |
| 45 to 64 Years | 342 (32.7%) | $79,896 |
| 65+ Years | 421 (40.2%) | $41,141 |
| Total | 1,047 (100.0%) | $67,768 |
Poverty in Paynesville
Income Below Poverty by Sex and Age in Paynesville
With 3.3% poverty level for males and 7.4% for females among the residents of Paynesville, 15 year old males and 45 to 54 year old females are the most vulnerable to poverty, with 22 males (71.0%) and 19 females (15.2%) in their respective age groups living below the poverty level.
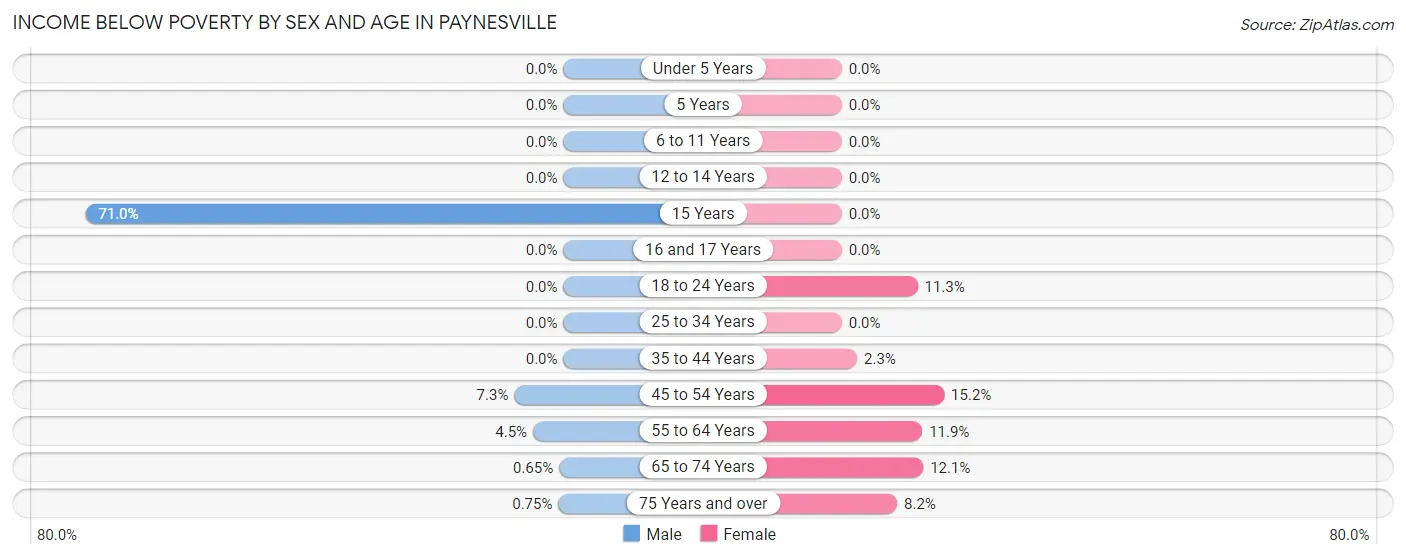
| Age Bracket | Male | Female |
| Under 5 Years | 0 (0.0%) | 0 (0.0%) |
| 5 Years | 0 (0.0%) | 0 (0.0%) |
| 6 to 11 Years | 0 (0.0%) | 0 (0.0%) |
| 12 to 14 Years | 0 (0.0%) | 0 (0.0%) |
| 15 Years | 22 (71.0%) | 0 (0.0%) |
| 16 and 17 Years | 0 (0.0%) | 0 (0.0%) |
| 18 to 24 Years | 0 (0.0%) | 9 (11.3%) |
| 25 to 34 Years | 0 (0.0%) | 0 (0.0%) |
| 35 to 44 Years | 0 (0.0%) | 3 (2.3%) |
| 45 to 54 Years | 7 (7.3%) | 19 (15.2%) |
| 55 to 64 Years | 8 (4.5%) | 16 (11.9%) |
| 65 to 74 Years | 1 (0.6%) | 22 (12.1%) |
| 75 Years and over | 1 (0.7%) | 17 (8.2%) |
| Total | 39 (3.3%) | 86 (7.4%) |
Income Above Poverty by Sex and Age in Paynesville
According to the poverty statistics in Paynesville, males aged under 5 years and females aged under 5 years are the age groups that are most secure financially, with 100.0% of males and 100.0% of females in these age groups living above the poverty line.
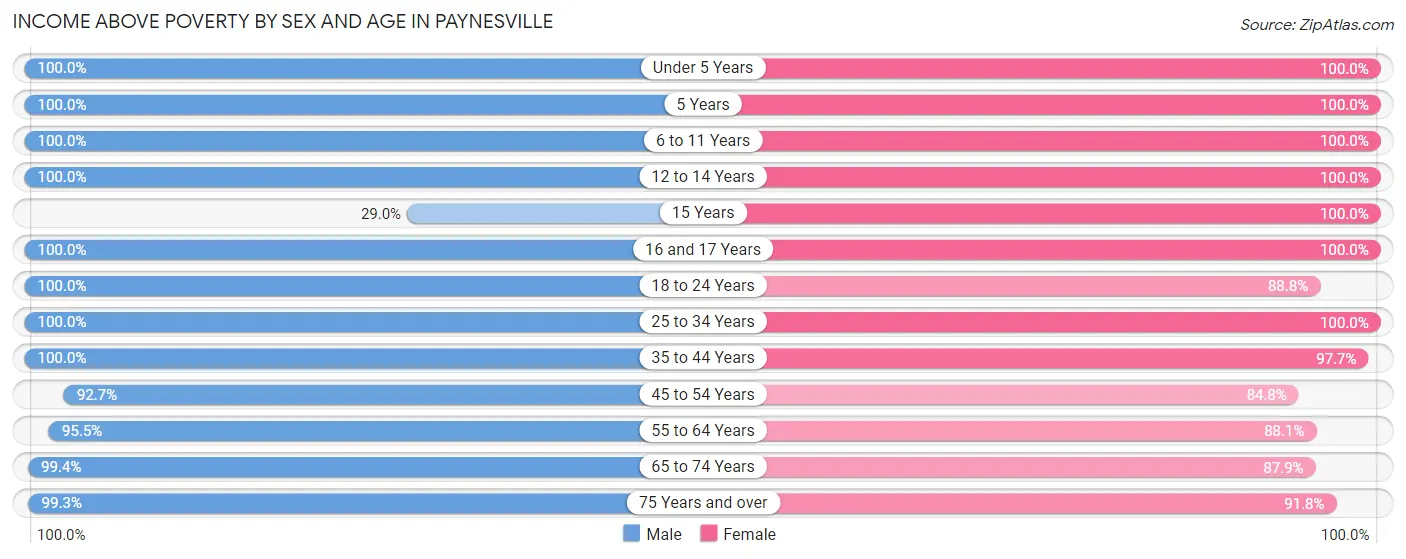
| Age Bracket | Male | Female |
| Under 5 Years | 127 (100.0%) | 32 (100.0%) |
| 5 Years | 11 (100.0%) | 10 (100.0%) |
| 6 to 11 Years | 80 (100.0%) | 34 (100.0%) |
| 12 to 14 Years | 39 (100.0%) | 6 (100.0%) |
| 15 Years | 9 (29.0%) | 27 (100.0%) |
| 16 and 17 Years | 5 (100.0%) | 43 (100.0%) |
| 18 to 24 Years | 133 (100.0%) | 71 (88.7%) |
| 25 to 34 Years | 92 (100.0%) | 155 (100.0%) |
| 35 to 44 Years | 105 (100.0%) | 129 (97.7%) |
| 45 to 54 Years | 89 (92.7%) | 106 (84.8%) |
| 55 to 64 Years | 169 (95.5%) | 118 (88.1%) |
| 65 to 74 Years | 154 (99.4%) | 160 (87.9%) |
| 75 Years and over | 133 (99.3%) | 190 (91.8%) |
| Total | 1,146 (96.7%) | 1,081 (92.6%) |
Income Below Poverty Among Married-Couple Families in Paynesville
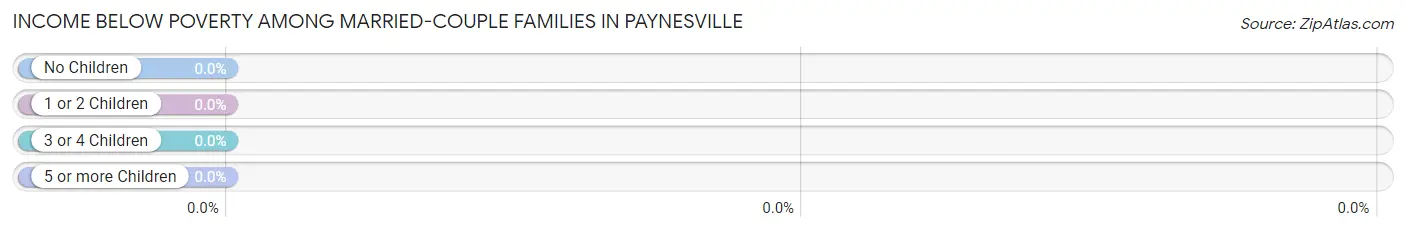
| Children | Above Poverty | Below Poverty |
| No Children | 323 (100.0%) | 0 (0.0%) |
| 1 or 2 Children | 153 (100.0%) | 0 (0.0%) |
| 3 or 4 Children | 10 (100.0%) | 0 (0.0%) |
| 5 or more Children | 0 (0.0%) | 0 (0.0%) |
| Total | 486 (100.0%) | 0 (0.0%) |
Income Below Poverty Among Single-Parent Households in Paynesville
| Children | Single Father | Single Mother |
| No Children | 0 (0.0%) | 0 (0.0%) |
| 1 or 2 Children | 0 (0.0%) | 0 (0.0%) |
| 3 or 4 Children | 0 (0.0%) | 0 (0.0%) |
| 5 or more Children | 0 (0.0%) | 0 (0.0%) |
| Total | 0 (0.0%) | 0 (0.0%) |
Income Below Poverty Among Married-Couple vs Single-Parent Households in Paynesville
| Children | Married-Couple Families | Single-Parent Households |
| No Children | 0 (0.0%) | 0 (0.0%) |
| 1 or 2 Children | 0 (0.0%) | 0 (0.0%) |
| 3 or 4 Children | 0 (0.0%) | 0 (0.0%) |
| 5 or more Children | 0 (0.0%) | 0 (0.0%) |
| Total | 0 (0.0%) | 0 (0.0%) |
Race in Paynesville
The most populous races in Paynesville are White / Caucasian (2,223 | 91.4%), Two or more Races (161 | 6.6%), and Hispanic or Latino (117 | 4.8%).
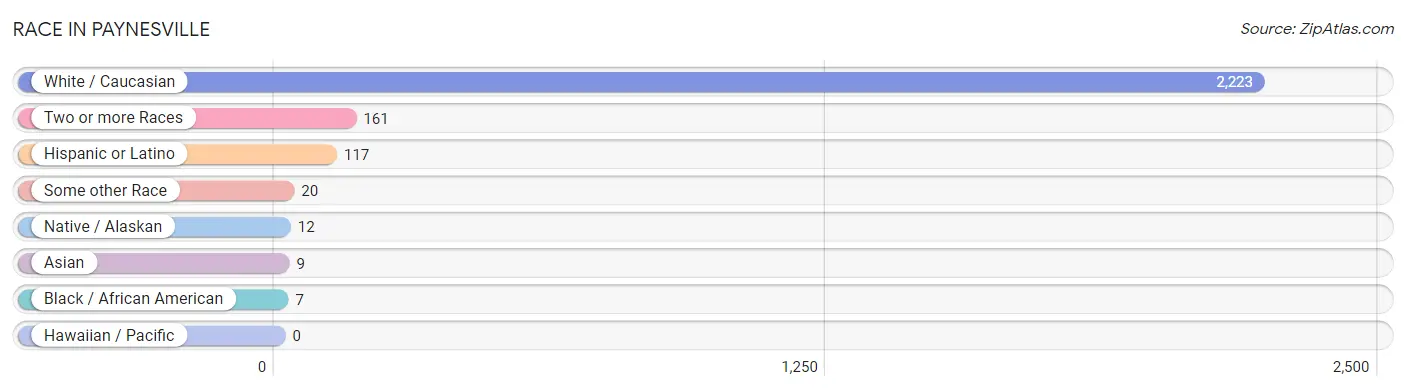
| Race | # Population | % Population |
| Asian | 9 | 0.4% |
| Black / African American | 7 | 0.3% |
| Hawaiian / Pacific | 0 | 0.0% |
| Hispanic or Latino | 117 | 4.8% |
| Native / Alaskan | 12 | 0.5% |
| White / Caucasian | 2,223 | 91.4% |
| Two or more Races | 161 | 6.6% |
| Some other Race | 20 | 0.8% |
| Total | 2,432 | 100.0% |
Ancestry in Paynesville
The most populous ancestries reported in Paynesville are German (1,259 | 51.8%), Norwegian (310 | 12.8%), Swedish (305 | 12.5%), Irish (218 | 9.0%), and English (112 | 4.6%), together accounting for 90.6% of all Paynesville residents.
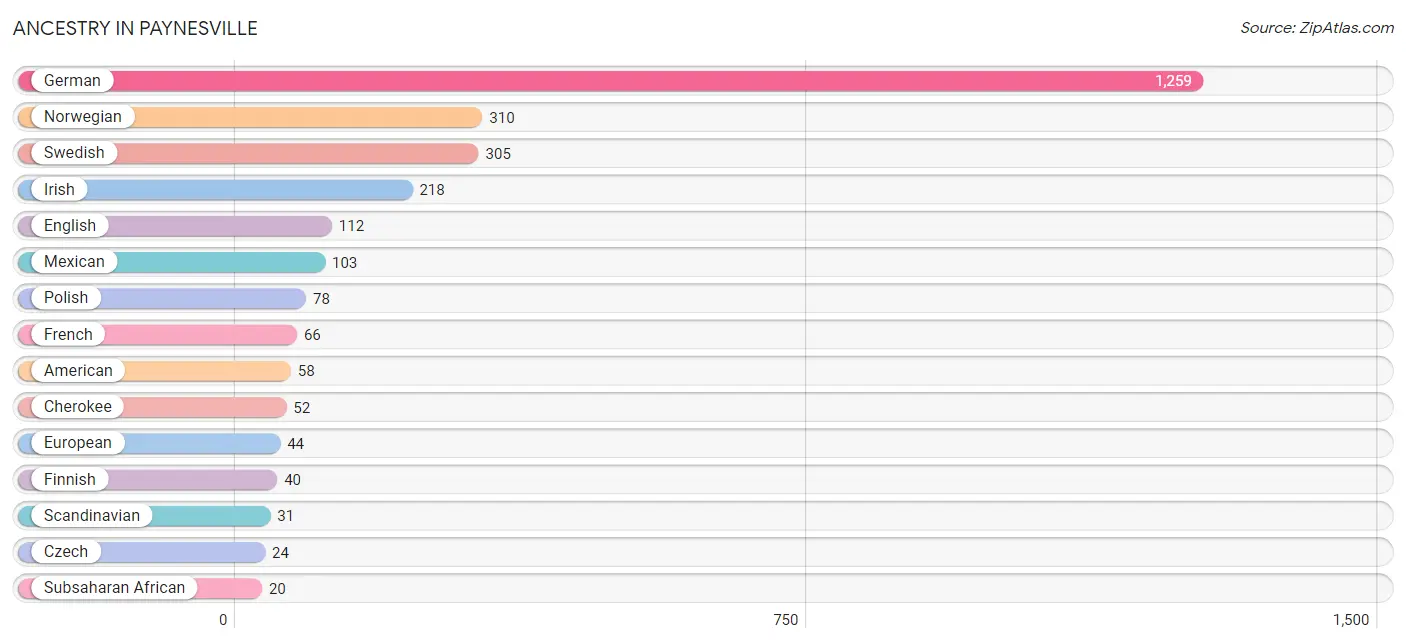
| Ancestry | # Population | % Population |
| American | 58 | 2.4% |
| Burmese | 3 | 0.1% |
| Cherokee | 52 | 2.1% |
| Choctaw | 13 | 0.5% |
| Croatian | 3 | 0.1% |
| Cuban | 14 | 0.6% |
| Czech | 24 | 1.0% |
| Danish | 5 | 0.2% |
| Dutch | 12 | 0.5% |
| Eastern European | 19 | 0.8% |
| English | 112 | 4.6% |
| European | 44 | 1.8% |
| Finnish | 40 | 1.6% |
| French | 66 | 2.7% |
| French Canadian | 19 | 0.8% |
| German | 1,259 | 51.8% |
| Irish | 218 | 9.0% |
| Lithuanian | 4 | 0.2% |
| Mexican | 103 | 4.2% |
| Norwegian | 310 | 12.8% |
| Polish | 78 | 3.2% |
| Russian | 16 | 0.7% |
| Scandinavian | 31 | 1.3% |
| Scottish | 4 | 0.2% |
| Slovak | 7 | 0.3% |
| Sri Lankan | 13 | 0.5% |
| Subsaharan African | 20 | 0.8% |
| Swedish | 305 | 12.5% |
| Zimbabwean | 20 | 0.8% | View All 29 Rows |
Immigrants in Paynesville
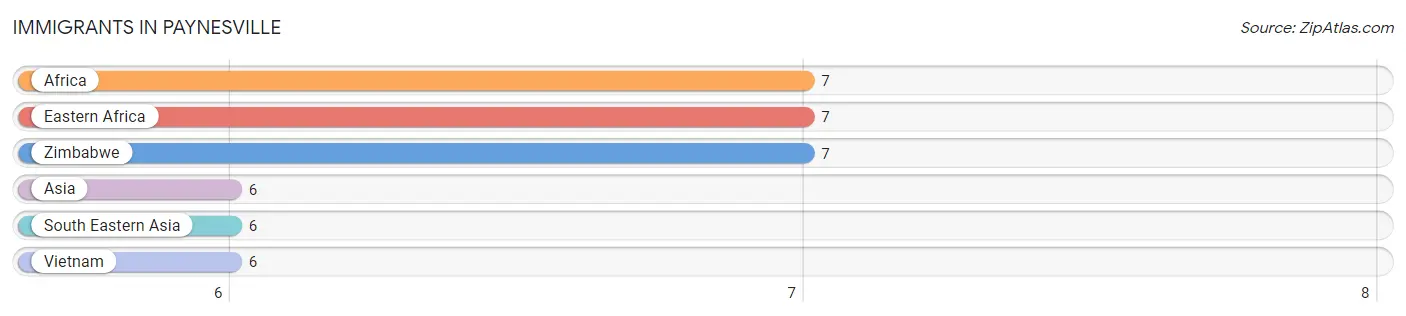
The most numerous immigrant groups reported in Paynesville came from Africa (7 | 0.3%), Eastern Africa (7 | 0.3%), Zimbabwe (7 | 0.3%), Asia (6 | 0.3%), and South Eastern Asia (6 | 0.3%), together accounting for 1.4% of all Paynesville residents.
| Immigration Origin | # Population | % Population |
| Africa | 7 | 0.3% |
| Asia | 6 | 0.3% |
| Eastern Africa | 7 | 0.3% |
| South Eastern Asia | 6 | 0.3% |
| Vietnam | 6 | 0.3% |
| Zimbabwe | 7 | 0.3% | View All 6 Rows |
Sex and Age in Paynesville
Sex and Age in Paynesville
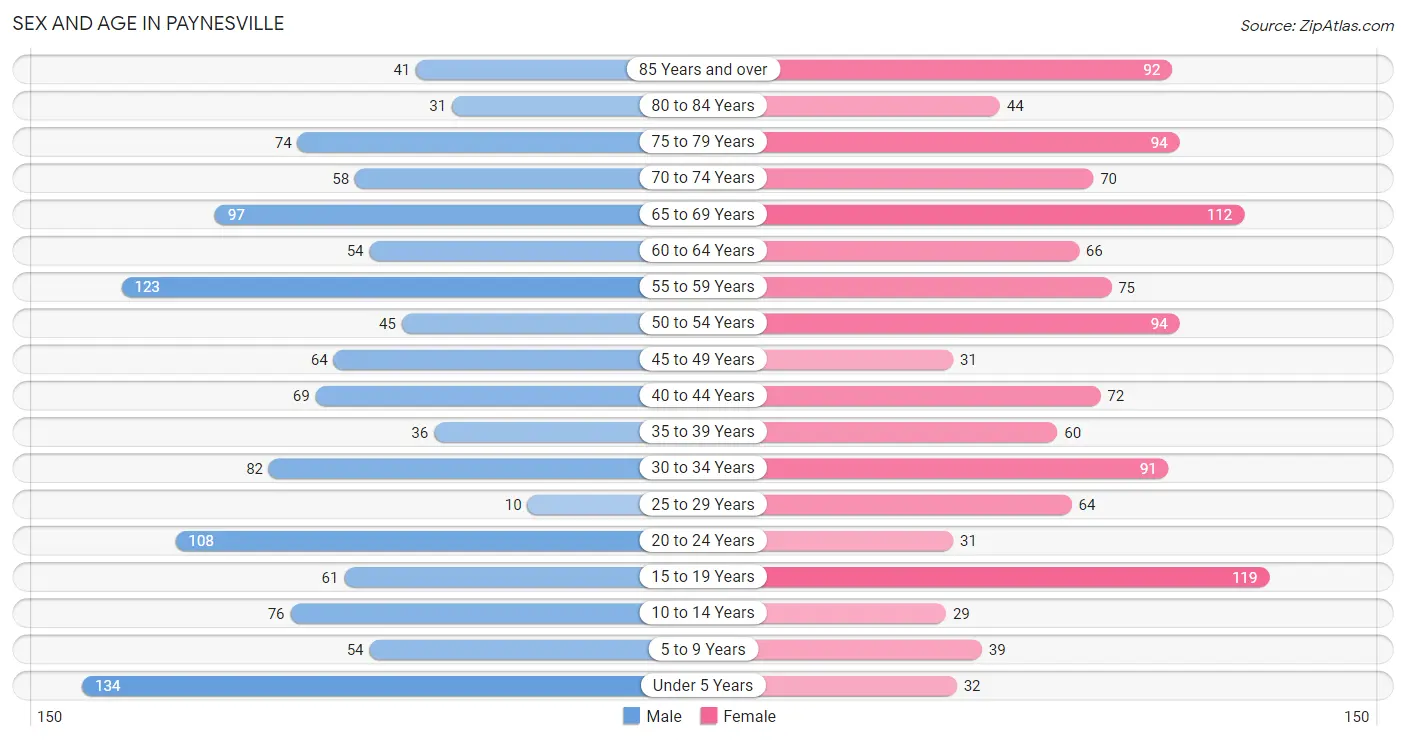
The most populous age groups in Paynesville are Under 5 Years (134 | 11.0%) for men and 15 to 19 Years (119 | 9.8%) for women.
| Age Bracket | Male | Female |
| Under 5 Years | 134 (11.0%) | 32 (2.6%) |
| 5 to 9 Years | 54 (4.4%) | 39 (3.2%) |
| 10 to 14 Years | 76 (6.2%) | 29 (2.4%) |
| 15 to 19 Years | 61 (5.0%) | 119 (9.8%) |
| 20 to 24 Years | 108 (8.9%) | 31 (2.5%) |
| 25 to 29 Years | 10 (0.8%) | 64 (5.3%) |
| 30 to 34 Years | 82 (6.7%) | 91 (7.5%) |
| 35 to 39 Years | 36 (3.0%) | 60 (4.9%) |
| 40 to 44 Years | 69 (5.7%) | 72 (5.9%) |
| 45 to 49 Years | 64 (5.3%) | 31 (2.5%) |
| 50 to 54 Years | 45 (3.7%) | 94 (7.7%) |
| 55 to 59 Years | 123 (10.1%) | 75 (6.2%) |
| 60 to 64 Years | 54 (4.4%) | 66 (5.4%) |
| 65 to 69 Years | 97 (8.0%) | 112 (9.2%) |
| 70 to 74 Years | 58 (4.8%) | 70 (5.8%) |
| 75 to 79 Years | 74 (6.1%) | 94 (7.7%) |
| 80 to 84 Years | 31 (2.5%) | 44 (3.6%) |
| 85 Years and over | 41 (3.4%) | 92 (7.6%) |
| Total | 1,217 (100.0%) | 1,215 (100.0%) |
Families and Households in Paynesville
Median Family Size in Paynesville
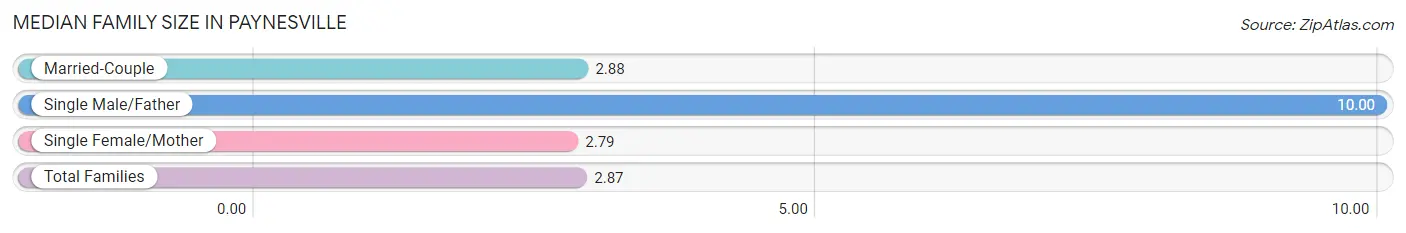
The median family size in Paynesville is 2.87 persons per family, with single male/father families (1 | 0.2%) accounting for the largest median family size of 10 persons per family. On the other hand, single female/mother families (124 | 20.3%) represent the smallest median family size with 2.79 persons per family.
| Family Type | # Families | Family Size |
| Married-Couple | 486 (79.5%) | 2.88 |
| Single Male/Father | 1 (0.2%) | 10.00 |
| Single Female/Mother | 124 (20.3%) | 2.79 |
| Total Families | 611 (100.0%) | 2.87 |
Median Household Size in Paynesville
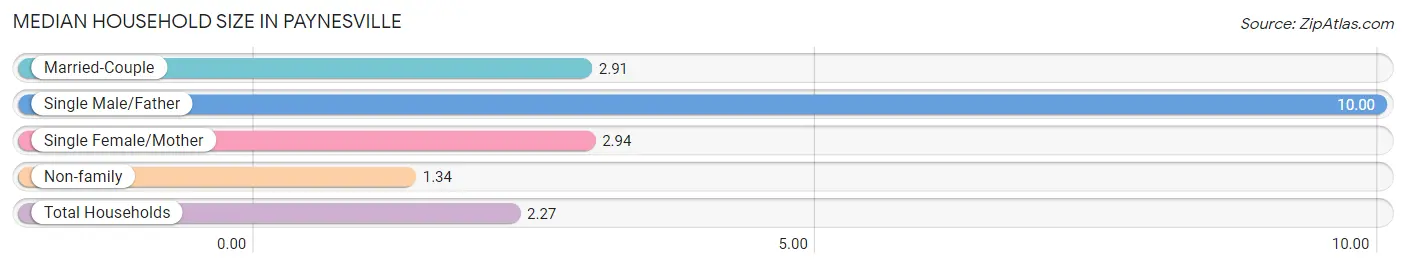
The median household size in Paynesville is 2.27 persons per household, with single male/father households (1 | 0.1%) accounting for the largest median household size of 10 persons per household. non-family households (436 | 41.6%) represent the smallest median household size with 1.34 persons per household.
| Household Type | # Households | Household Size |
| Married-Couple | 486 (46.4%) | 2.91 |
| Single Male/Father | 1 (0.1%) | 10.00 |
| Single Female/Mother | 124 (11.8%) | 2.94 |
| Non-family | 436 (41.6%) | 1.34 |
| Total Households | 1,047 (100.0%) | 2.27 |
Household Size by Marriage Status in Paynesville
Out of a total of 1,047 households in Paynesville, 611 (58.4%) are family households, while 436 (41.6%) are nonfamily households. The most numerous type of family households are 2-person households, comprising 338, and the most common type of nonfamily households are 1-person households, comprising 336.
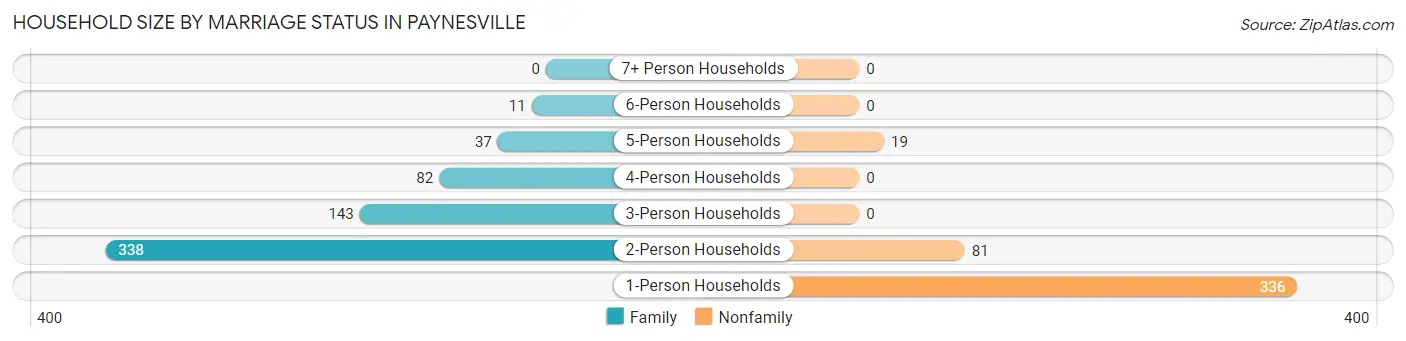
| Household Size | Family Households | Nonfamily Households |
| 1-Person Households | - | 336 (32.1%) |
| 2-Person Households | 338 (32.3%) | 81 (7.7%) |
| 3-Person Households | 143 (13.7%) | 0 (0.0%) |
| 4-Person Households | 82 (7.8%) | 0 (0.0%) |
| 5-Person Households | 37 (3.5%) | 19 (1.8%) |
| 6-Person Households | 11 (1.1%) | 0 (0.0%) |
| 7+ Person Households | 0 (0.0%) | 0 (0.0%) |
| Total | 611 (58.4%) | 436 (41.6%) |
Female Fertility in Paynesville
Fertility by Age in Paynesville
Average fertility rate in Paynesville is 21.0 births per 1,000 women. Women in the age bracket of 20 to 34 years have the highest fertility rate with 54.0 births per 1,000 women. Women in the age bracket of 20 to 34 years acount for 100.0% of all women with births.
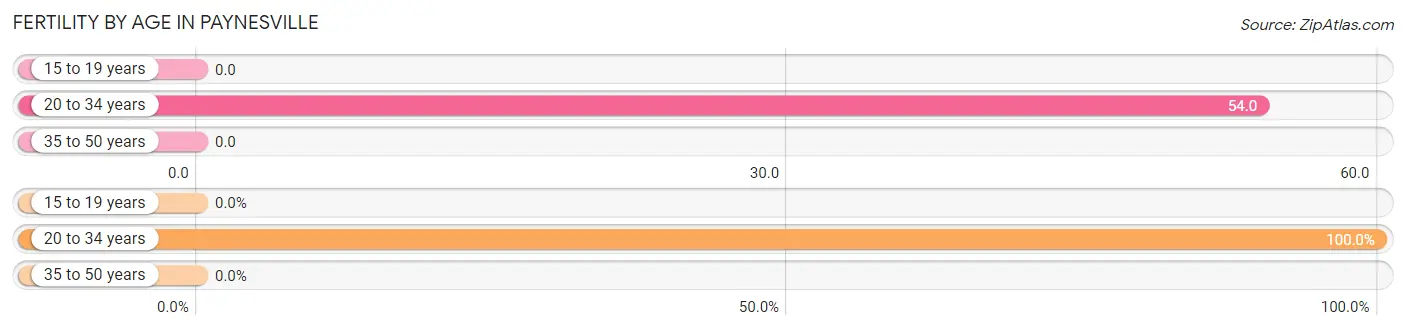
| Age Bracket | Women with Births | Births / 1,000 Women |
| 15 to 19 years | 0 (0.0%) | 0.0 |
| 20 to 34 years | 10 (100.0%) | 54.0 |
| 35 to 50 years | 0 (0.0%) | 0.0 |
| Total | 10 (100.0%) | 21.0 |
Fertility by Age by Marriage Status in Paynesville
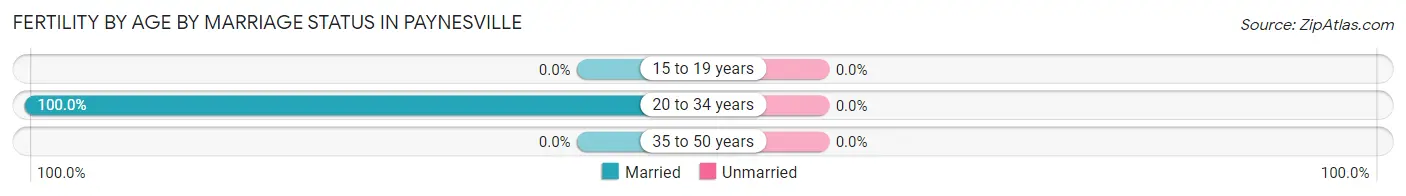
| Age Bracket | Married | Unmarried |
| 15 to 19 years | 0 (0.0%) | 0 (0.0%) |
| 20 to 34 years | 10 (100.0%) | 0 (0.0%) |
| 35 to 50 years | 0 (0.0%) | 0 (0.0%) |
| Total | 10 (100.0%) | 0 (0.0%) |
Fertility by Education in Paynesville
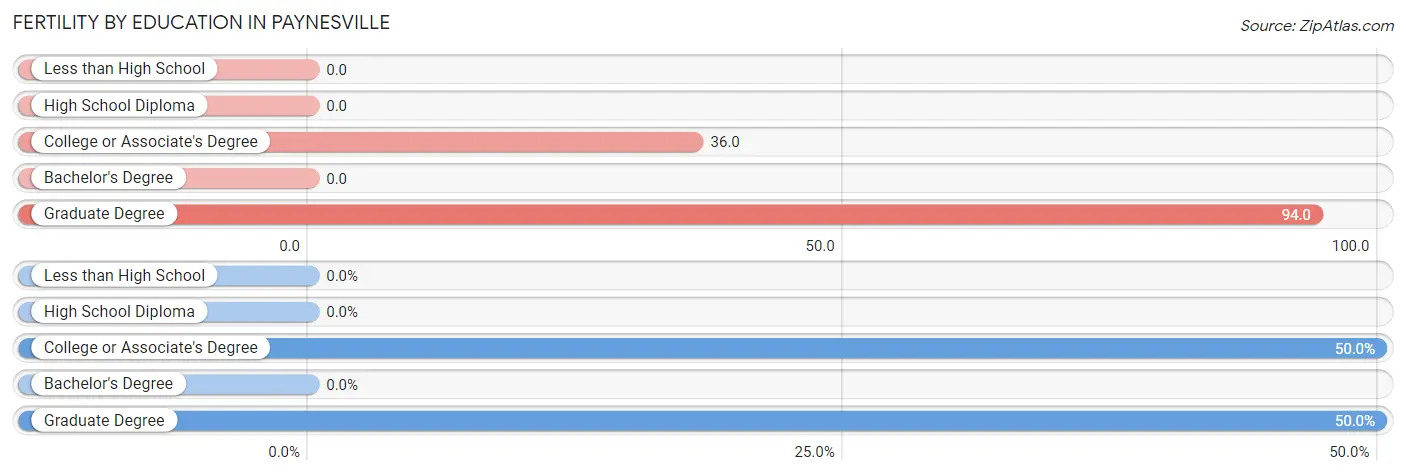
| Educational Attainment | Women with Births | Births / 1,000 Women |
| Less than High School | 0 (0.0%) | 0.0 |
| High School Diploma | 0 (0.0%) | 0.0 |
| College or Associate's Degree | 5 (50.0%) | 36.0 |
| Bachelor's Degree | 0 (0.0%) | 0.0 |
| Graduate Degree | 5 (50.0%) | 94.0 |
| Total | 10 (100.0%) | 21.0 |
Fertility by Education by Marriage Status in Paynesville
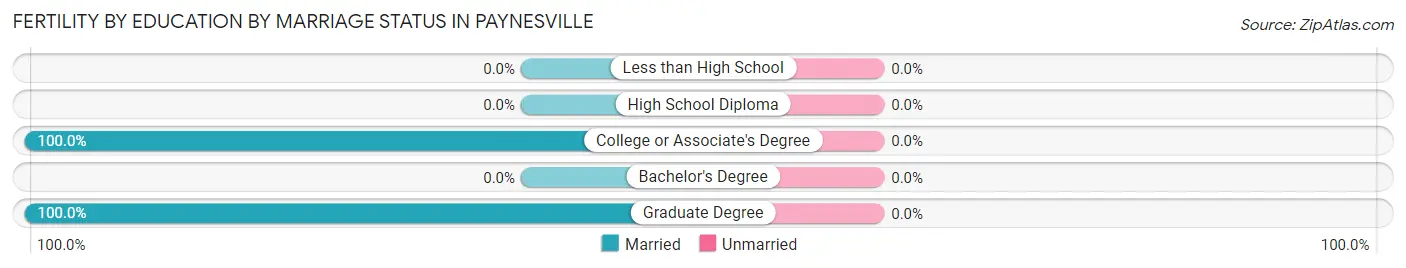
| Educational Attainment | Married | Unmarried |
| Less than High School | 0 (0.0%) | 0 (0.0%) |
| High School Diploma | 0 (0.0%) | 0 (0.0%) |
| College or Associate's Degree | 5 (100.0%) | 0 (0.0%) |
| Bachelor's Degree | 0 (0.0%) | 0 (0.0%) |
| Graduate Degree | 5 (100.0%) | 0 (0.0%) |
| Total | 10 (100.0%) | 0 (0.0%) |
Employment Characteristics in Paynesville
Employment by Class of Employer in Paynesville
Among the 1,149 employed individuals in Paynesville, private company employees (726 | 63.2%), not-for-profit organizations (159 | 13.8%), and local government employees (124 | 10.8%) make up the most common classes of employment.
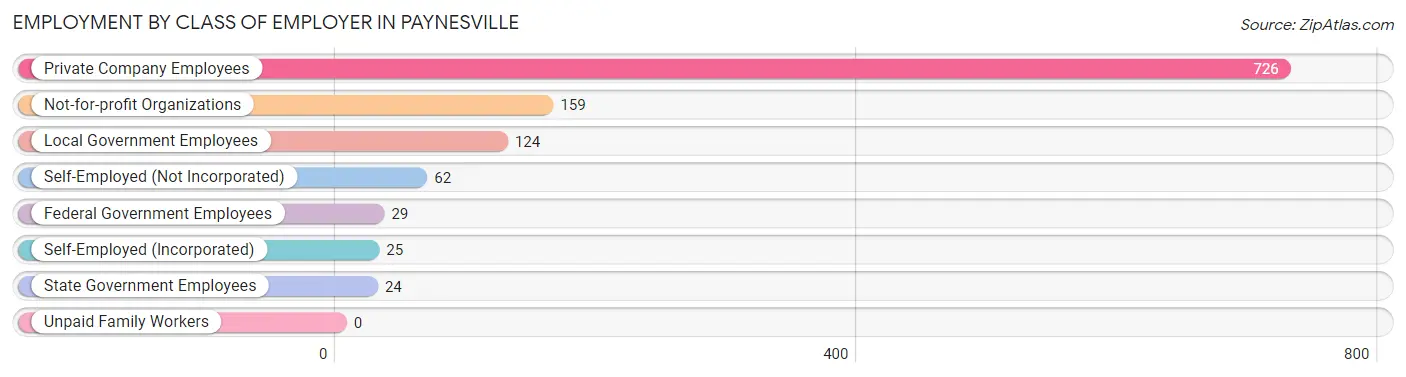
| Employer Class | # Employees | % Employees |
| Private Company Employees | 726 | 63.2% |
| Self-Employed (Incorporated) | 25 | 2.2% |
| Self-Employed (Not Incorporated) | 62 | 5.4% |
| Not-for-profit Organizations | 159 | 13.8% |
| Local Government Employees | 124 | 10.8% |
| State Government Employees | 24 | 2.1% |
| Federal Government Employees | 29 | 2.5% |
| Unpaid Family Workers | 0 | 0.0% |
| Total | 1,149 | 100.0% |
Employment Status by Age in Paynesville
According to the labor force statistics for Paynesville, out of the total population over 16 years of age (2,010), 60.0% or 1,206 individuals are in the labor force, with 3.0% or 36 of them unemployed. The age group with the highest labor force participation rate is 55 to 59 years, with 94.4% or 187 individuals in the labor force. Within the labor force, the 20 to 24 years age range has the highest percentage of unemployed individuals, with 12.1% or 15 of them being unemployed.
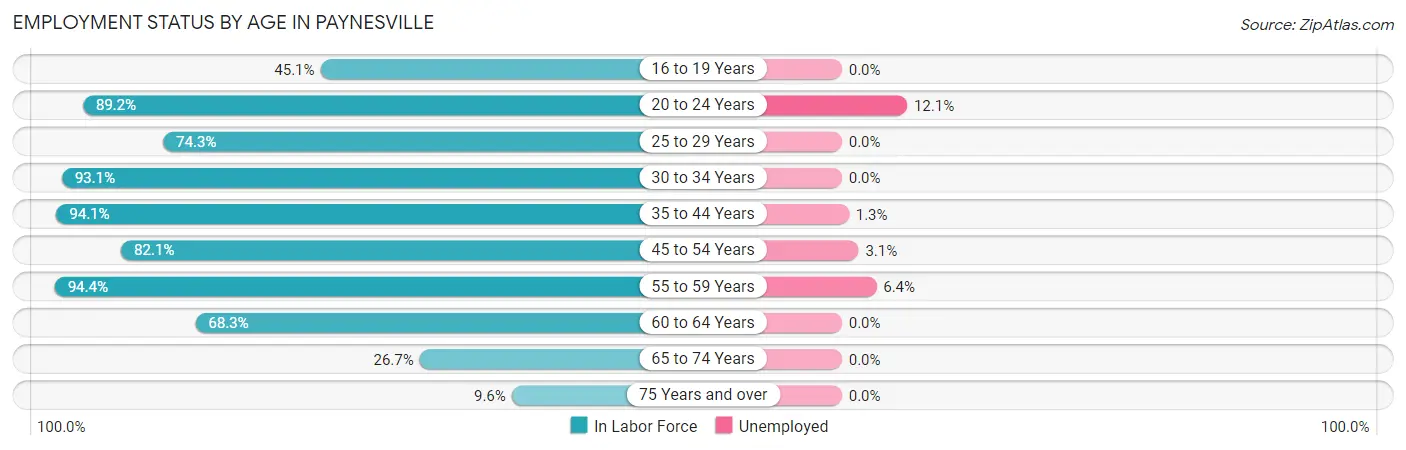
| Age Bracket | In Labor Force | Unemployed |
| 16 to 19 Years | 55 (45.1%) | 0 (0.0%) |
| 20 to 24 Years | 124 (89.2%) | 15 (12.1%) |
| 25 to 29 Years | 55 (74.3%) | 0 (0.0%) |
| 30 to 34 Years | 161 (93.1%) | 0 (0.0%) |
| 35 to 44 Years | 223 (94.1%) | 3 (1.3%) |
| 45 to 54 Years | 192 (82.1%) | 6 (3.1%) |
| 55 to 59 Years | 187 (94.4%) | 12 (6.4%) |
| 60 to 64 Years | 82 (68.3%) | 0 (0.0%) |
| 65 to 74 Years | 90 (26.7%) | 0 (0.0%) |
| 75 Years and over | 36 (9.6%) | 0 (0.0%) |
| Total | 1,206 (60.0%) | 36 (3.0%) |
Employment Status by Educational Attainment in Paynesville
According to labor force statistics for Paynesville, 86.9% of individuals (900) out of the total population between 25 and 64 years of age (1,036) are in the labor force, with 2.3% or 21 of them being unemployed. The group with the highest labor force participation rate are those with the educational attainment of bachelor's degree or higher, with 93.2% or 300 individuals in the labor force. Within the labor force, individuals with college / associate degree education have the highest percentage of unemployment, with 5.8% or 21 of them being unemployed.
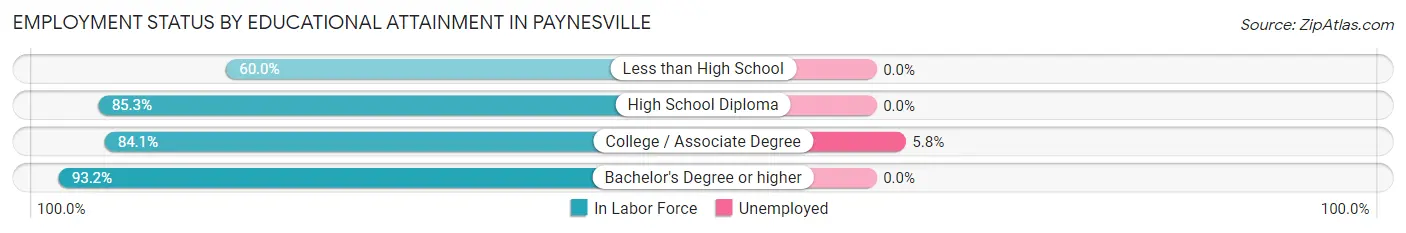
| Educational Attainment | In Labor Force | Unemployed |
| Less than High School | 9 (60.0%) | 0 (0.0%) |
| High School Diploma | 227 (85.3%) | 0 (0.0%) |
| College / Associate Degree | 364 (84.1%) | 25 (5.8%) |
| Bachelor's Degree or higher | 300 (93.2%) | 0 (0.0%) |
| Total | 900 (86.9%) | 24 (2.3%) |
Employment Occupations by Sex in Paynesville
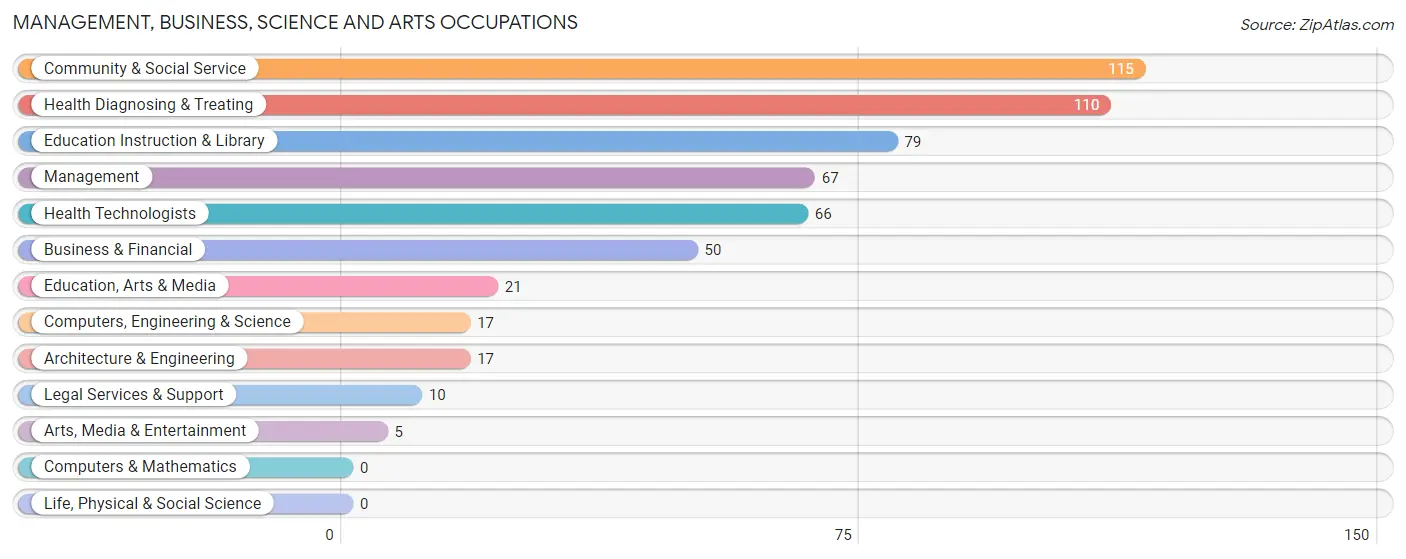
Management, Business, Science and Arts Occupations
The most common Management, Business, Science and Arts occupations in Paynesville are Community & Social Service (115 | 9.8%), Health Diagnosing & Treating (110 | 9.4%), Education Instruction & Library (79 | 6.8%), Management (67 | 5.7%), and Health Technologists (66 | 5.7%).
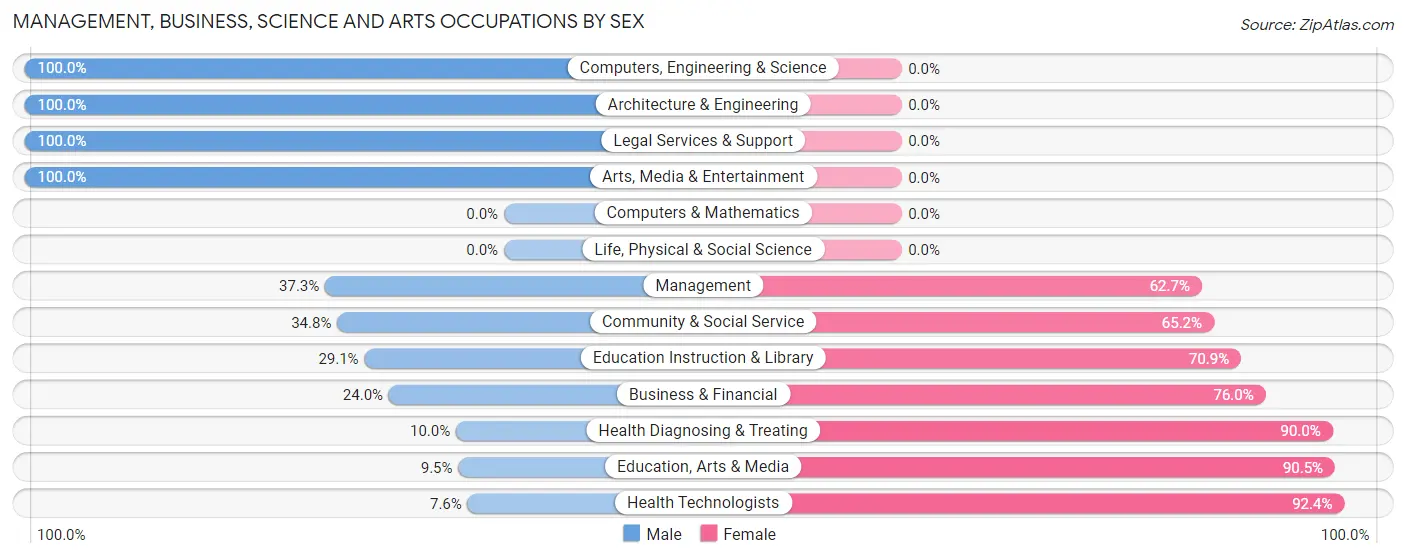
Management, Business, Science and Arts Occupations by Sex
Within the Management, Business, Science and Arts occupations in Paynesville, the most male-oriented occupations are Computers, Engineering & Science (100.0%), Architecture & Engineering (100.0%), and Legal Services & Support (100.0%), while the most female-oriented occupations are Health Technologists (92.4%), Education, Arts & Media (90.5%), and Health Diagnosing & Treating (90.0%).
| Occupation | Male | Female |
| Management | 25 (37.3%) | 42 (62.7%) |
| Business & Financial | 12 (24.0%) | 38 (76.0%) |
| Computers, Engineering & Science | 17 (100.0%) | 0 (0.0%) |
| Computers & Mathematics | 0 (0.0%) | 0 (0.0%) |
| Architecture & Engineering | 17 (100.0%) | 0 (0.0%) |
| Life, Physical & Social Science | 0 (0.0%) | 0 (0.0%) |
| Community & Social Service | 40 (34.8%) | 75 (65.2%) |
| Education, Arts & Media | 2 (9.5%) | 19 (90.5%) |
| Legal Services & Support | 10 (100.0%) | 0 (0.0%) |
| Education Instruction & Library | 23 (29.1%) | 56 (70.9%) |
| Arts, Media & Entertainment | 5 (100.0%) | 0 (0.0%) |
| Health Diagnosing & Treating | 11 (10.0%) | 99 (90.0%) |
| Health Technologists | 5 (7.6%) | 61 (92.4%) |
| Total (Category) | 105 (29.2%) | 254 (70.8%) |
| Total (Overall) | 589 (50.4%) | 580 (49.6%) |
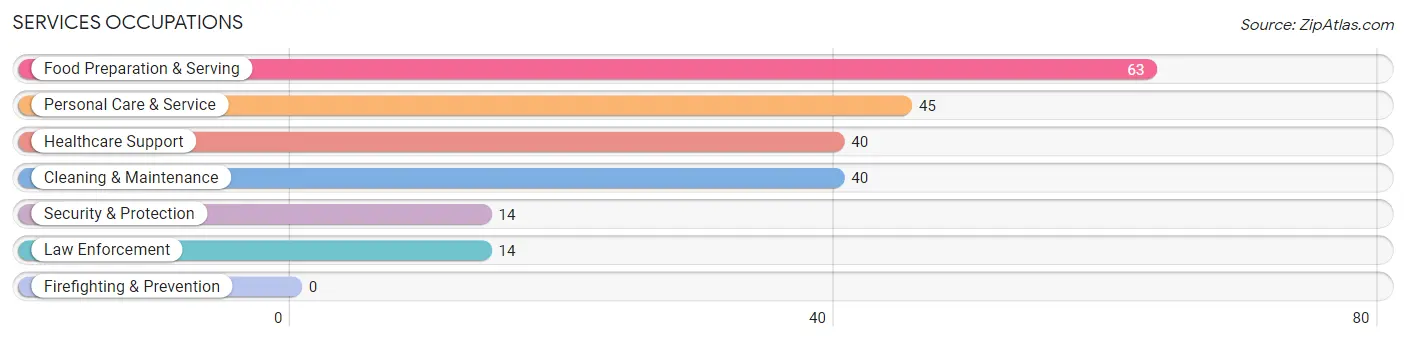
Services Occupations
The most common Services occupations in Paynesville are Food Preparation & Serving (63 | 5.4%), Personal Care & Service (45 | 3.8%), Healthcare Support (40 | 3.4%), Cleaning & Maintenance (40 | 3.4%), and Security & Protection (14 | 1.2%).
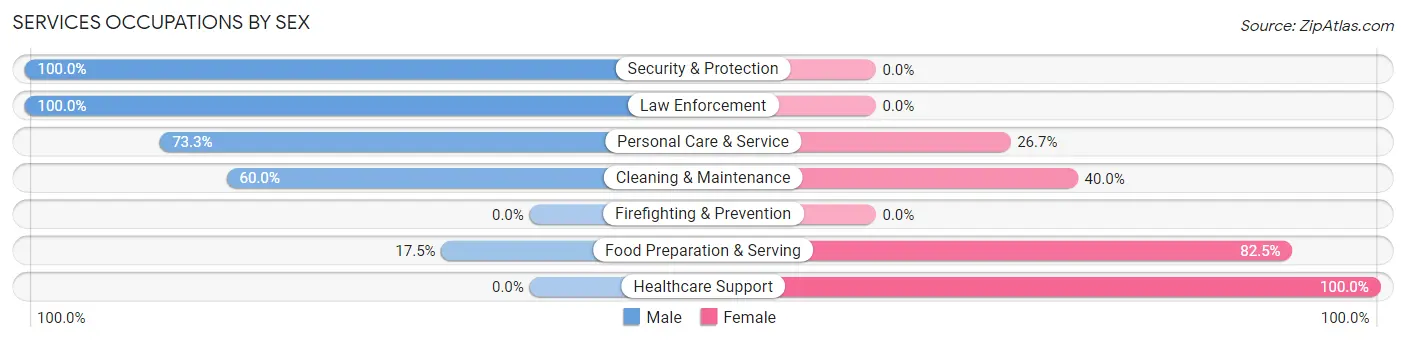
Services Occupations by Sex
Within the Services occupations in Paynesville, the most male-oriented occupations are Security & Protection (100.0%), Law Enforcement (100.0%), and Personal Care & Service (73.3%), while the most female-oriented occupations are Healthcare Support (100.0%), Food Preparation & Serving (82.5%), and Cleaning & Maintenance (40.0%).
| Occupation | Male | Female |
| Healthcare Support | 0 (0.0%) | 40 (100.0%) |
| Security & Protection | 14 (100.0%) | 0 (0.0%) |
| Firefighting & Prevention | 0 (0.0%) | 0 (0.0%) |
| Law Enforcement | 14 (100.0%) | 0 (0.0%) |
| Food Preparation & Serving | 11 (17.5%) | 52 (82.5%) |
| Cleaning & Maintenance | 24 (60.0%) | 16 (40.0%) |
| Personal Care & Service | 33 (73.3%) | 12 (26.7%) |
| Total (Category) | 82 (40.6%) | 120 (59.4%) |
| Total (Overall) | 589 (50.4%) | 580 (49.6%) |
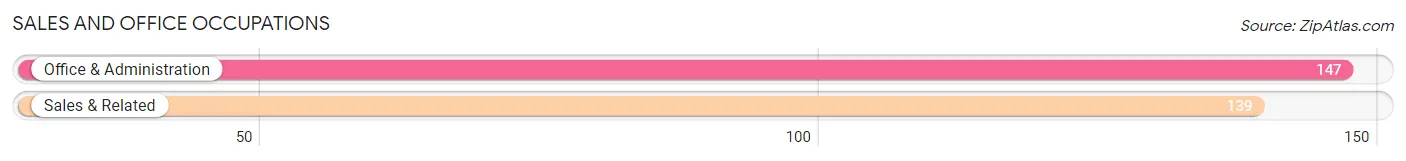
Sales and Office Occupations
The most common Sales and Office occupations in Paynesville are Office & Administration (147 | 12.6%), and Sales & Related (139 | 11.9%).
Sales and Office Occupations by Sex
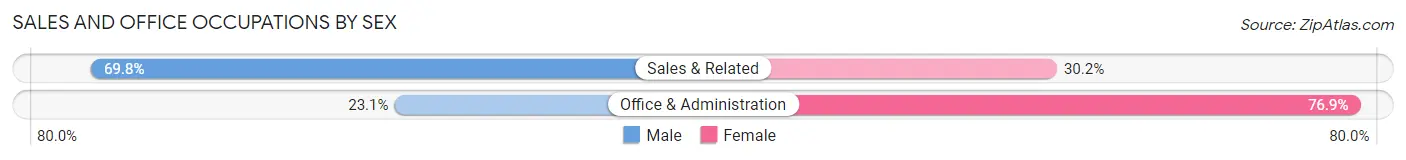
| Occupation | Male | Female |
| Sales & Related | 97 (69.8%) | 42 (30.2%) |
| Office & Administration | 34 (23.1%) | 113 (76.9%) |
| Total (Category) | 131 (45.8%) | 155 (54.2%) |
| Total (Overall) | 589 (50.4%) | 580 (49.6%) |
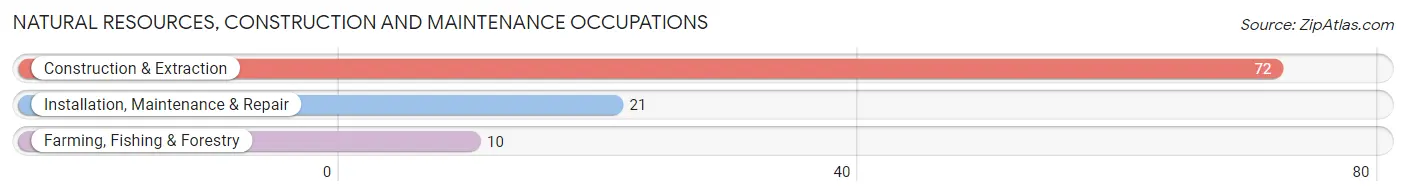
Natural Resources, Construction and Maintenance Occupations
The most common Natural Resources, Construction and Maintenance occupations in Paynesville are Construction & Extraction (72 | 6.2%), Installation, Maintenance & Repair (21 | 1.8%), and Farming, Fishing & Forestry (10 | 0.9%).
Natural Resources, Construction and Maintenance Occupations by Sex
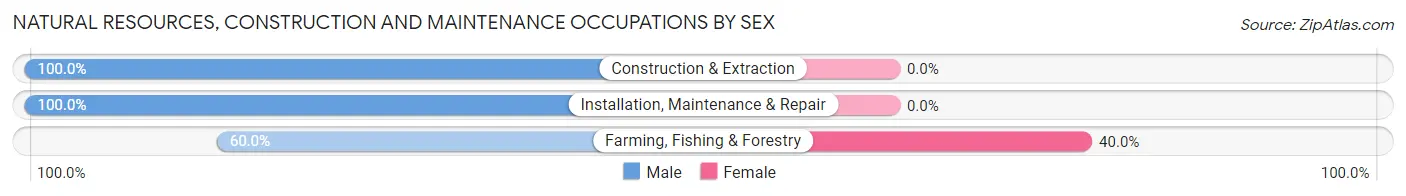
| Occupation | Male | Female |
| Farming, Fishing & Forestry | 6 (60.0%) | 4 (40.0%) |
| Construction & Extraction | 72 (100.0%) | 0 (0.0%) |
| Installation, Maintenance & Repair | 21 (100.0%) | 0 (0.0%) |
| Total (Category) | 99 (96.1%) | 4 (3.9%) |
| Total (Overall) | 589 (50.4%) | 580 (49.6%) |
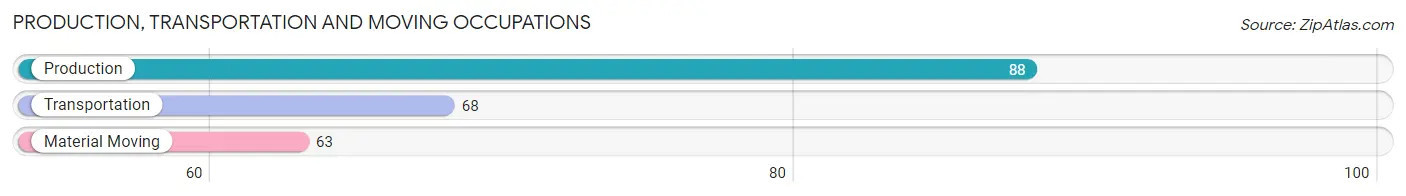
Production, Transportation and Moving Occupations
The most common Production, Transportation and Moving occupations in Paynesville are Production (88 | 7.5%), Transportation (68 | 5.8%), and Material Moving (63 | 5.4%).
Production, Transportation and Moving Occupations by Sex
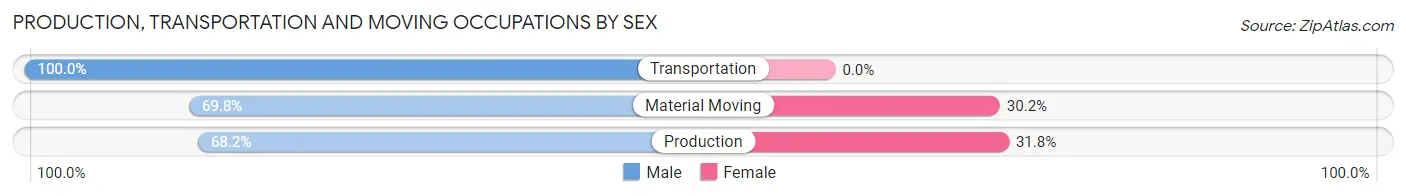
| Occupation | Male | Female |
| Production | 60 (68.2%) | 28 (31.8%) |
| Transportation | 68 (100.0%) | 0 (0.0%) |
| Material Moving | 44 (69.8%) | 19 (30.2%) |
| Total (Category) | 172 (78.5%) | 47 (21.5%) |
| Total (Overall) | 589 (50.4%) | 580 (49.6%) |
Employment Industries by Sex in Paynesville
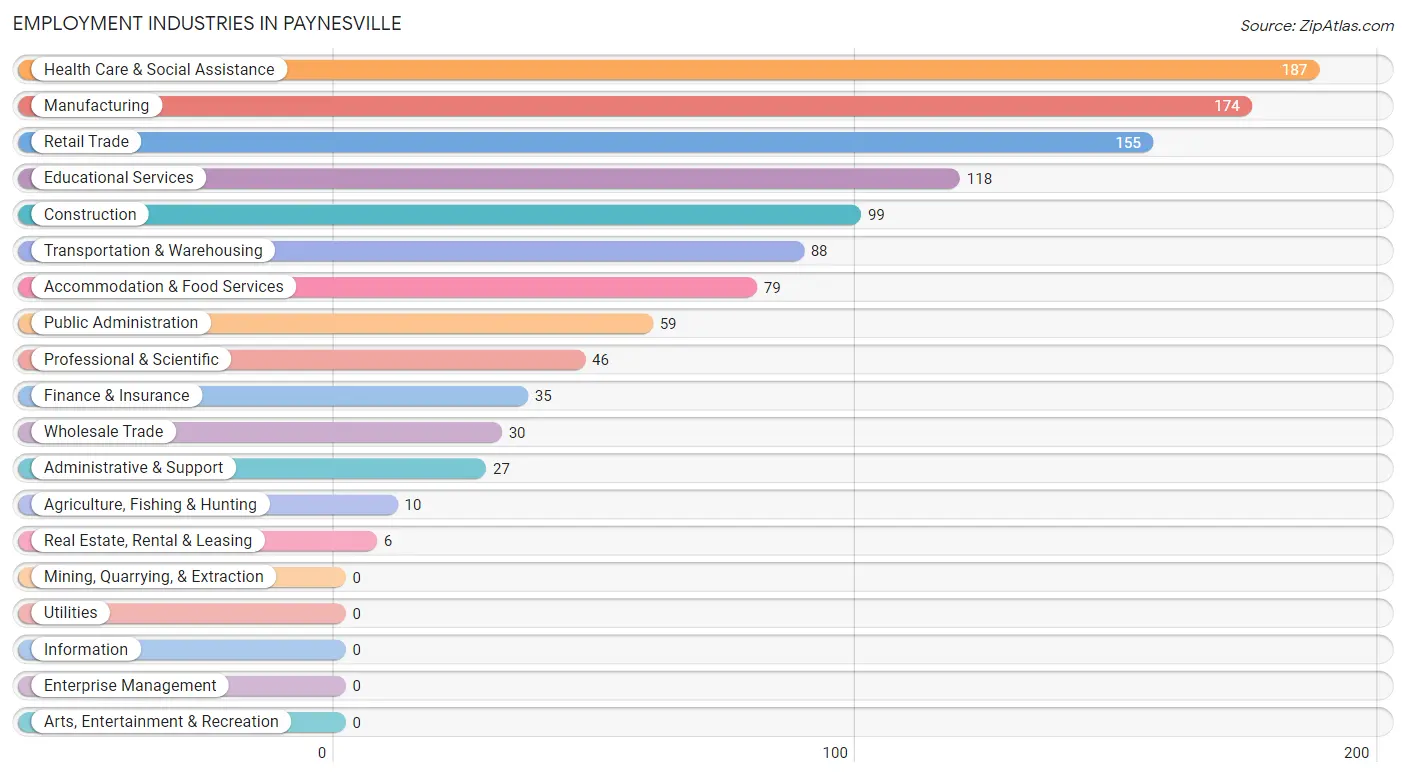
Employment Industries in Paynesville
The major employment industries in Paynesville include Health Care & Social Assistance (187 | 16.0%), Manufacturing (174 | 14.9%), Retail Trade (155 | 13.3%), Educational Services (118 | 10.1%), and Construction (99 | 8.5%).
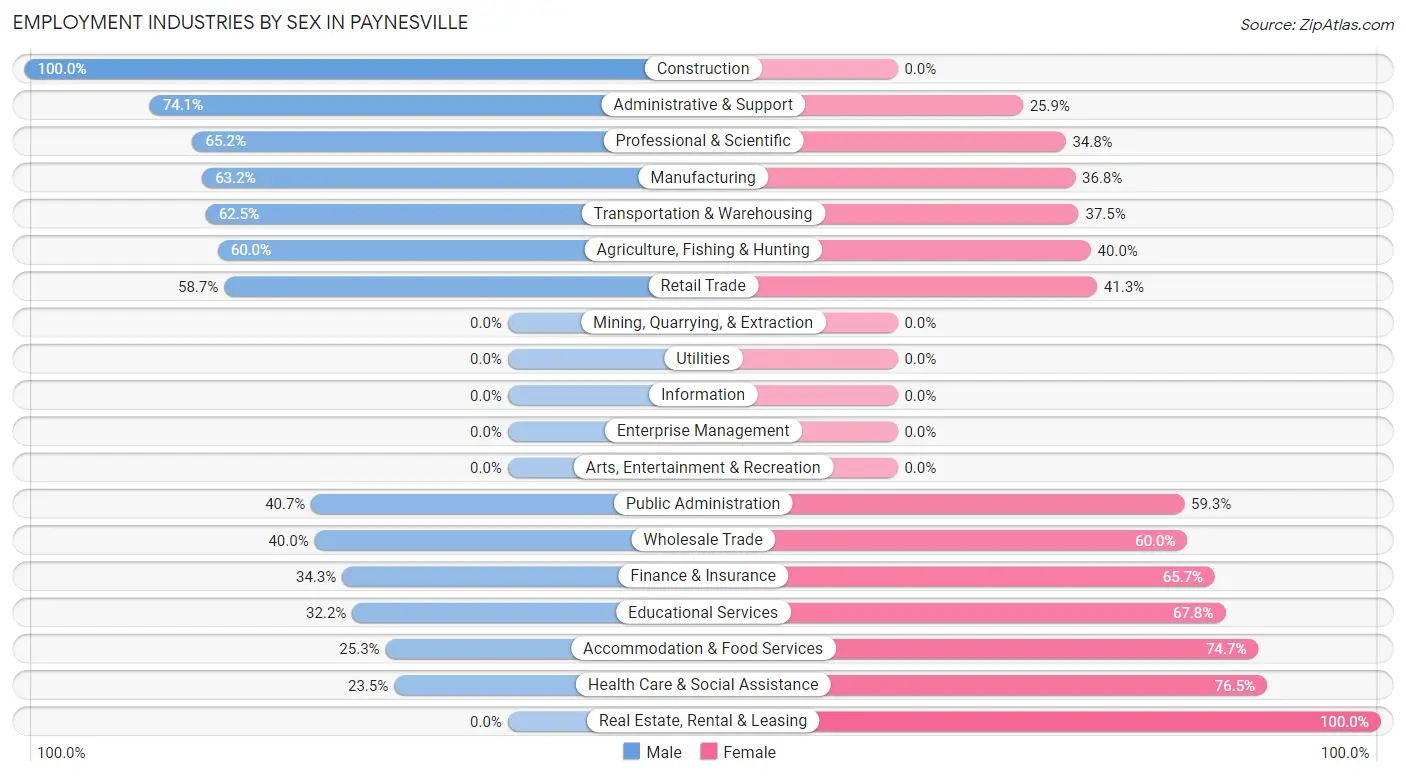
Employment Industries by Sex in Paynesville
The Paynesville industries that see more men than women are Construction (100.0%), Administrative & Support (74.1%), and Professional & Scientific (65.2%), whereas the industries that tend to have a higher number of women are Real Estate, Rental & Leasing (100.0%), Health Care & Social Assistance (76.5%), and Accommodation & Food Services (74.7%).
| Industry | Male | Female |
| Agriculture, Fishing & Hunting | 6 (60.0%) | 4 (40.0%) |
| Mining, Quarrying, & Extraction | 0 (0.0%) | 0 (0.0%) |
| Construction | 99 (100.0%) | 0 (0.0%) |
| Manufacturing | 110 (63.2%) | 64 (36.8%) |
| Wholesale Trade | 12 (40.0%) | 18 (60.0%) |
| Retail Trade | 91 (58.7%) | 64 (41.3%) |
| Transportation & Warehousing | 55 (62.5%) | 33 (37.5%) |
| Utilities | 0 (0.0%) | 0 (0.0%) |
| Information | 0 (0.0%) | 0 (0.0%) |
| Finance & Insurance | 12 (34.3%) | 23 (65.7%) |
| Real Estate, Rental & Leasing | 0 (0.0%) | 6 (100.0%) |
| Professional & Scientific | 30 (65.2%) | 16 (34.8%) |
| Enterprise Management | 0 (0.0%) | 0 (0.0%) |
| Administrative & Support | 20 (74.1%) | 7 (25.9%) |
| Educational Services | 38 (32.2%) | 80 (67.8%) |
| Health Care & Social Assistance | 44 (23.5%) | 143 (76.5%) |
| Arts, Entertainment & Recreation | 0 (0.0%) | 0 (0.0%) |
| Accommodation & Food Services | 20 (25.3%) | 59 (74.7%) |
| Public Administration | 24 (40.7%) | 35 (59.3%) |
| Total | 589 (50.4%) | 580 (49.6%) |
Education in Paynesville
School Enrollment in Paynesville
The most common levels of schooling among the 513 students in Paynesville are high school (167 | 32.6%), college / undergraduate (105 | 20.5%), and middle school (92 | 17.9%).
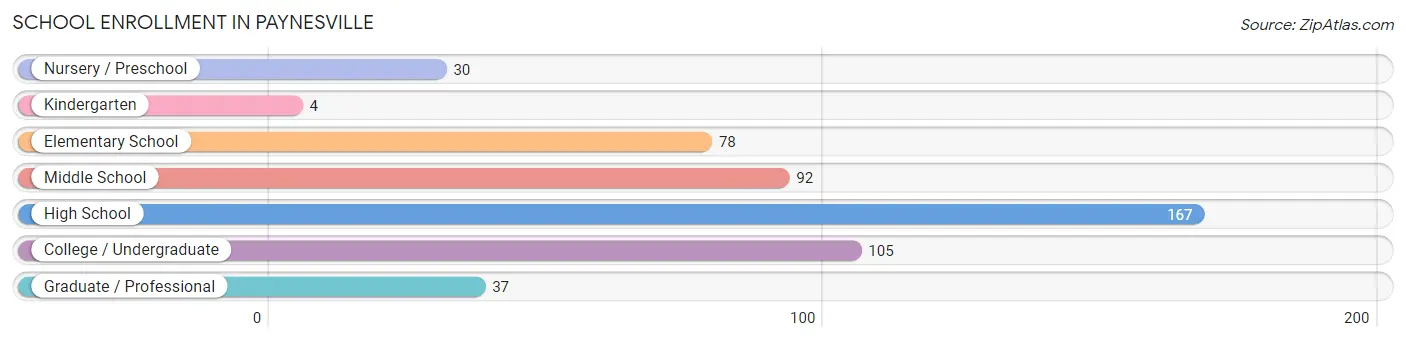
| School Level | # Students | % Students |
| Nursery / Preschool | 30 | 5.9% |
| Kindergarten | 4 | 0.8% |
| Elementary School | 78 | 15.2% |
| Middle School | 92 | 17.9% |
| High School | 167 | 32.6% |
| College / Undergraduate | 105 | 20.5% |
| Graduate / Professional | 37 | 7.2% |
| Total | 513 | 100.0% |
School Enrollment by Age by Funding Source in Paynesville
Out of a total of 513 students who are enrolled in schools in Paynesville, 26 (5.1%) attend a private institution, while the remaining 487 (94.9%) are enrolled in public schools. The age group of 25 to 34 year olds has the highest likelihood of being enrolled in private schools, with 14 (100.0% in the age bracket) enrolled. Conversely, the age group of 3 to 4 year olds has the lowest likelihood of being enrolled in a private school, with 13 (100.0% in the age bracket) attending a public institution.
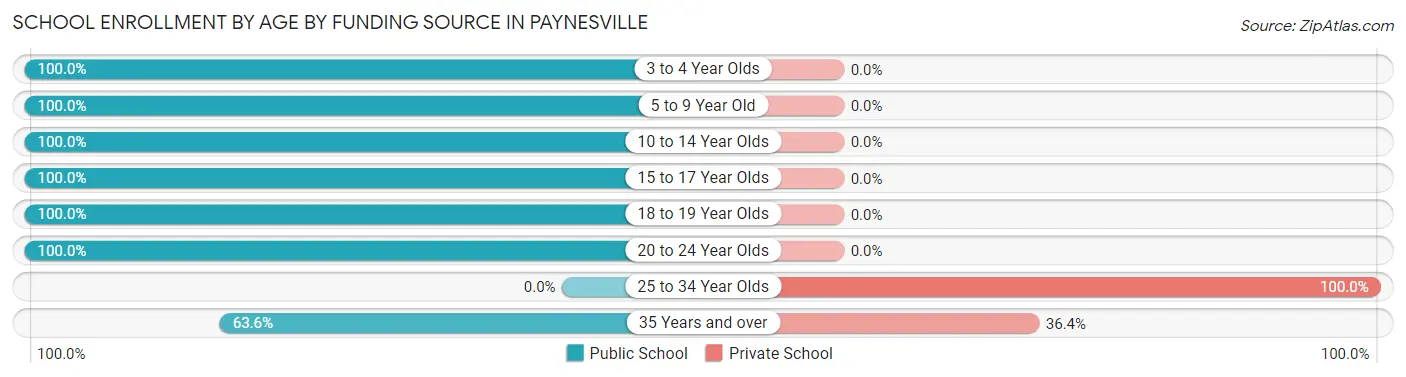
| Age Bracket | Public School | Private School |
| 3 to 4 Year Olds | 13 (100.0%) | 0 (0.0%) |
| 5 to 9 Year Old | 93 (100.0%) | 0 (0.0%) |
| 10 to 14 Year Olds | 105 (100.0%) | 0 (0.0%) |
| 15 to 17 Year Olds | 106 (100.0%) | 0 (0.0%) |
| 18 to 19 Year Olds | 74 (100.0%) | 0 (0.0%) |
| 20 to 24 Year Olds | 75 (100.0%) | 0 (0.0%) |
| 25 to 34 Year Olds | 0 (0.0%) | 14 (100.0%) |
| 35 Years and over | 21 (63.6%) | 12 (36.4%) |
| Total | 487 (94.9%) | 26 (5.1%) |
Educational Attainment by Field of Study in Paynesville
Education (132 | 26.8%), business (113 | 23.0%), science & technology (96 | 19.5%), arts & humanities (33 | 6.7%), and liberal arts & history (24 | 4.9%) are the most common fields of study among 492 individuals in Paynesville who have obtained a bachelor's degree or higher.
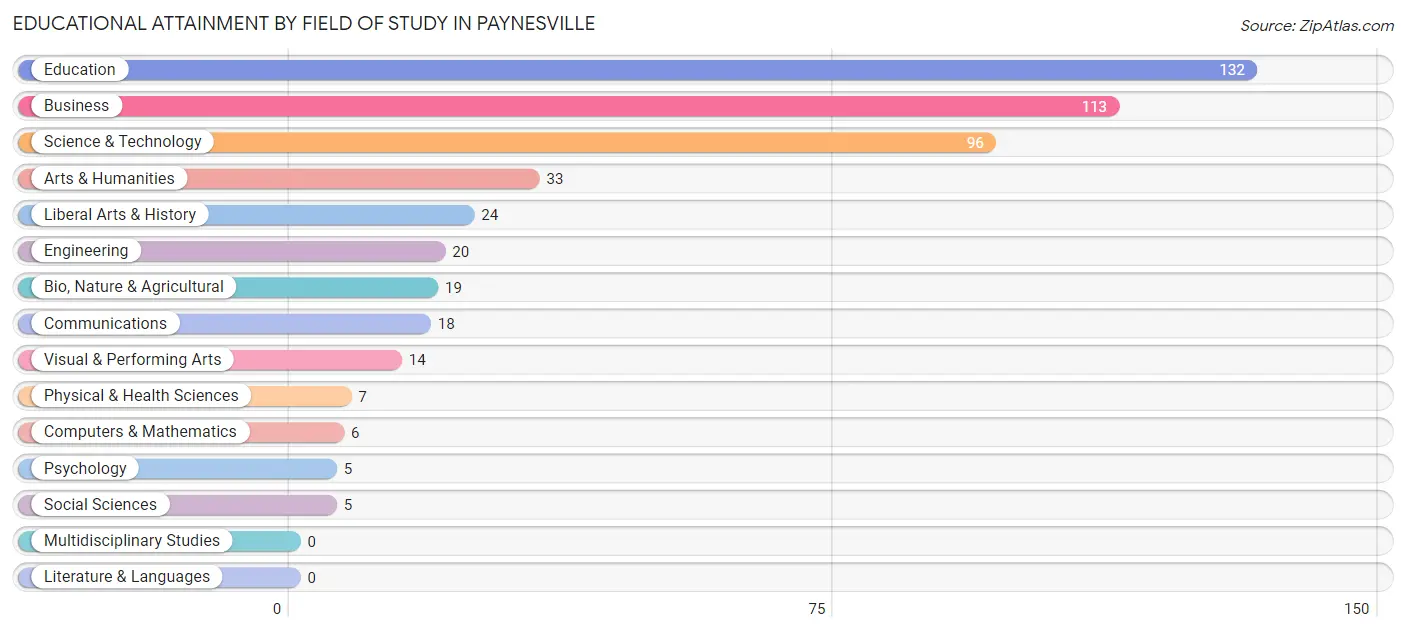
| Field of Study | # Graduates | % Graduates |
| Computers & Mathematics | 6 | 1.2% |
| Bio, Nature & Agricultural | 19 | 3.9% |
| Physical & Health Sciences | 7 | 1.4% |
| Psychology | 5 | 1.0% |
| Social Sciences | 5 | 1.0% |
| Engineering | 20 | 4.1% |
| Multidisciplinary Studies | 0 | 0.0% |
| Science & Technology | 96 | 19.5% |
| Business | 113 | 23.0% |
| Education | 132 | 26.8% |
| Literature & Languages | 0 | 0.0% |
| Liberal Arts & History | 24 | 4.9% |
| Visual & Performing Arts | 14 | 2.9% |
| Communications | 18 | 3.7% |
| Arts & Humanities | 33 | 6.7% |
| Total | 492 | 100.0% |
Transportation & Commute in Paynesville
Vehicle Availability by Sex in Paynesville
The most prevalent vehicle ownership categories in Paynesville are males with 3 vehicles (222, accounting for 38.6%) and females with 3 vehicles (178, making up 38.7%).
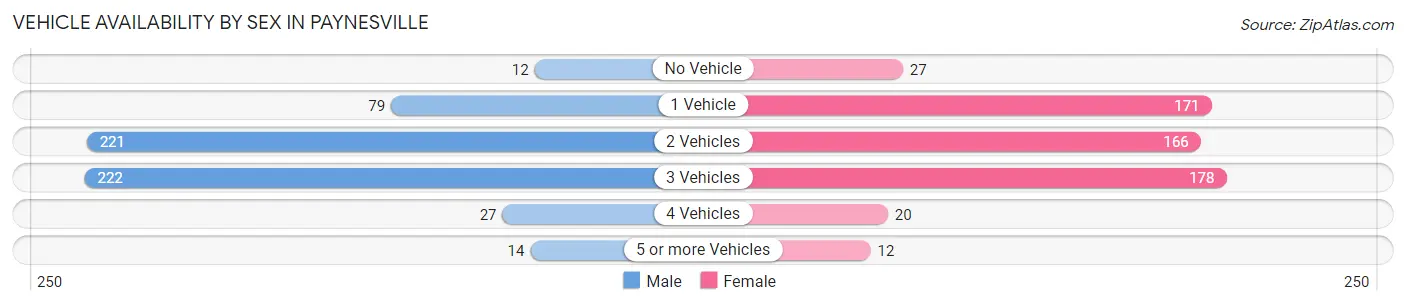
| Vehicles Available | Male | Female |
| No Vehicle | 12 (2.1%) | 27 (4.7%) |
| 1 Vehicle | 79 (13.7%) | 171 (29.8%) |
| 2 Vehicles | 221 (38.4%) | 166 (28.9%) |
| 3 Vehicles | 222 (38.6%) | 178 (31.0%) |
| 4 Vehicles | 27 (4.7%) | 20 (3.5%) |
| 5 or more Vehicles | 14 (2.4%) | 12 (2.1%) |
| Total | 575 (100.0%) | 574 (100.0%) |
Commute Time in Paynesville
The most frequently occuring commute durations in Paynesville are 5 to 9 minutes (235 commuters, 22.3%), 20 to 24 minutes (124 commuters, 11.8%), and 30 to 34 minutes (118 commuters, 11.2%).
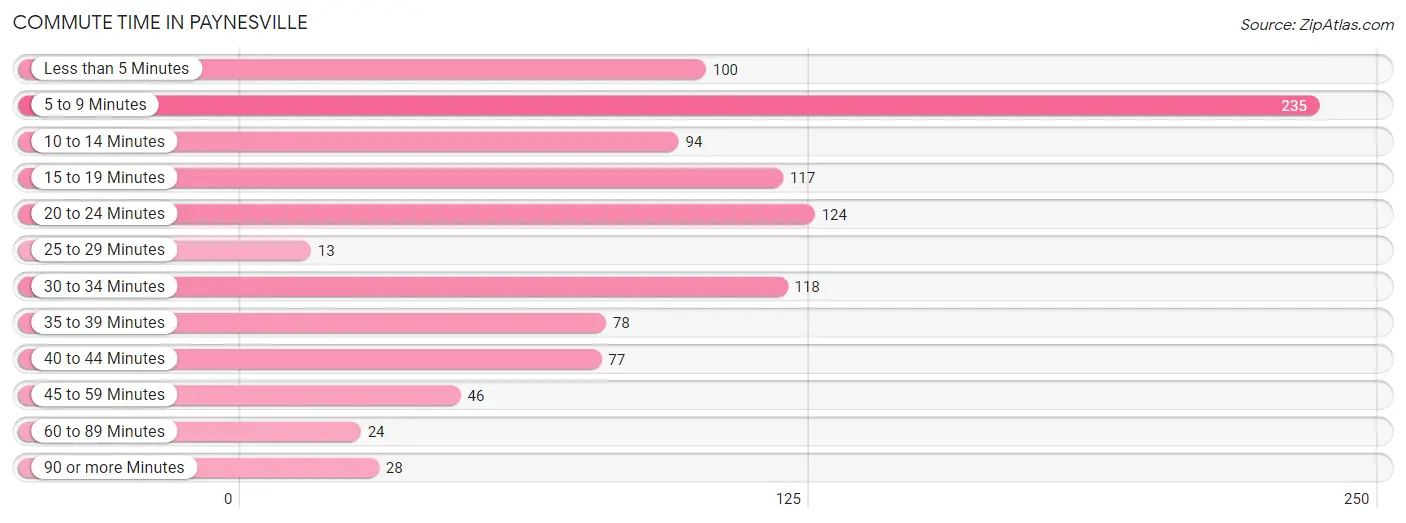
| Commute Time | # Commuters | % Commuters |
| Less than 5 Minutes | 100 | 9.5% |
| 5 to 9 Minutes | 235 | 22.3% |
| 10 to 14 Minutes | 94 | 8.9% |
| 15 to 19 Minutes | 117 | 11.1% |
| 20 to 24 Minutes | 124 | 11.8% |
| 25 to 29 Minutes | 13 | 1.2% |
| 30 to 34 Minutes | 118 | 11.2% |
| 35 to 39 Minutes | 78 | 7.4% |
| 40 to 44 Minutes | 77 | 7.3% |
| 45 to 59 Minutes | 46 | 4.4% |
| 60 to 89 Minutes | 24 | 2.3% |
| 90 or more Minutes | 28 | 2.7% |
Commute Time by Sex in Paynesville
The most common commute times in Paynesville are 15 to 19 minutes (96 commuters, 17.7%) for males and 5 to 9 minutes (168 commuters, 32.8%) for females.
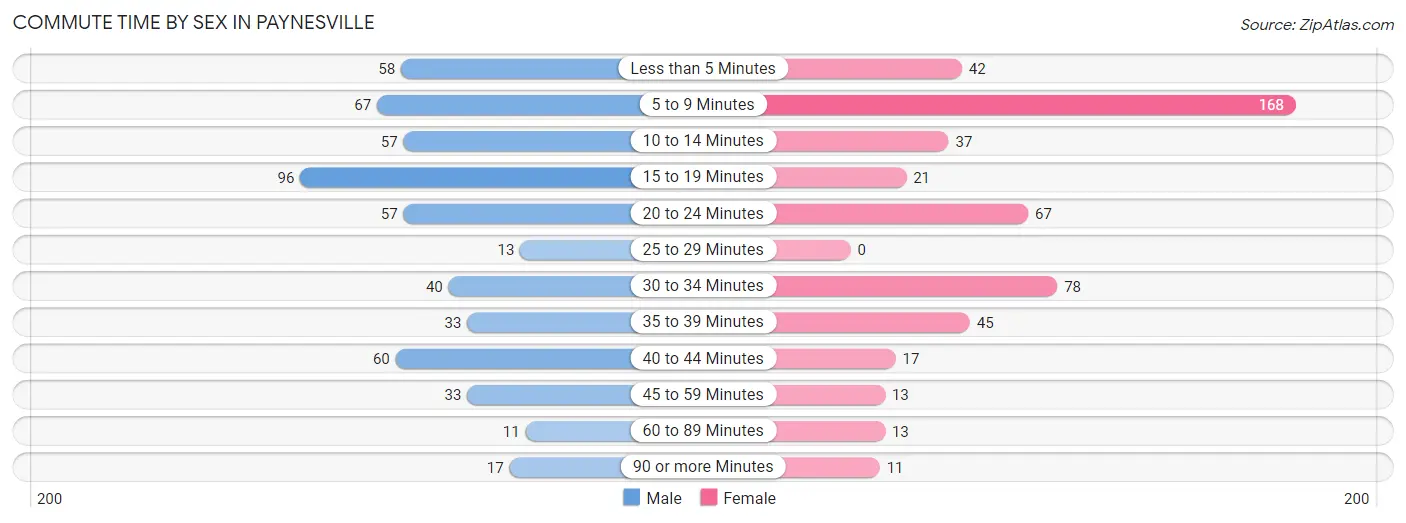
| Commute Time | Male | Female |
| Less than 5 Minutes | 58 (10.7%) | 42 (8.2%) |
| 5 to 9 Minutes | 67 (12.4%) | 168 (32.8%) |
| 10 to 14 Minutes | 57 (10.5%) | 37 (7.2%) |
| 15 to 19 Minutes | 96 (17.7%) | 21 (4.1%) |
| 20 to 24 Minutes | 57 (10.5%) | 67 (13.1%) |
| 25 to 29 Minutes | 13 (2.4%) | 0 (0.0%) |
| 30 to 34 Minutes | 40 (7.4%) | 78 (15.2%) |
| 35 to 39 Minutes | 33 (6.1%) | 45 (8.8%) |
| 40 to 44 Minutes | 60 (11.1%) | 17 (3.3%) |
| 45 to 59 Minutes | 33 (6.1%) | 13 (2.5%) |
| 60 to 89 Minutes | 11 (2.0%) | 13 (2.5%) |
| 90 or more Minutes | 17 (3.1%) | 11 (2.1%) |
Time of Departure to Work by Sex in Paynesville
The most frequent times of departure to work in Paynesville are 12:00 PM to 3:59 PM (91, 16.8%) for males and 7:30 AM to 7:59 AM (148, 28.9%) for females.
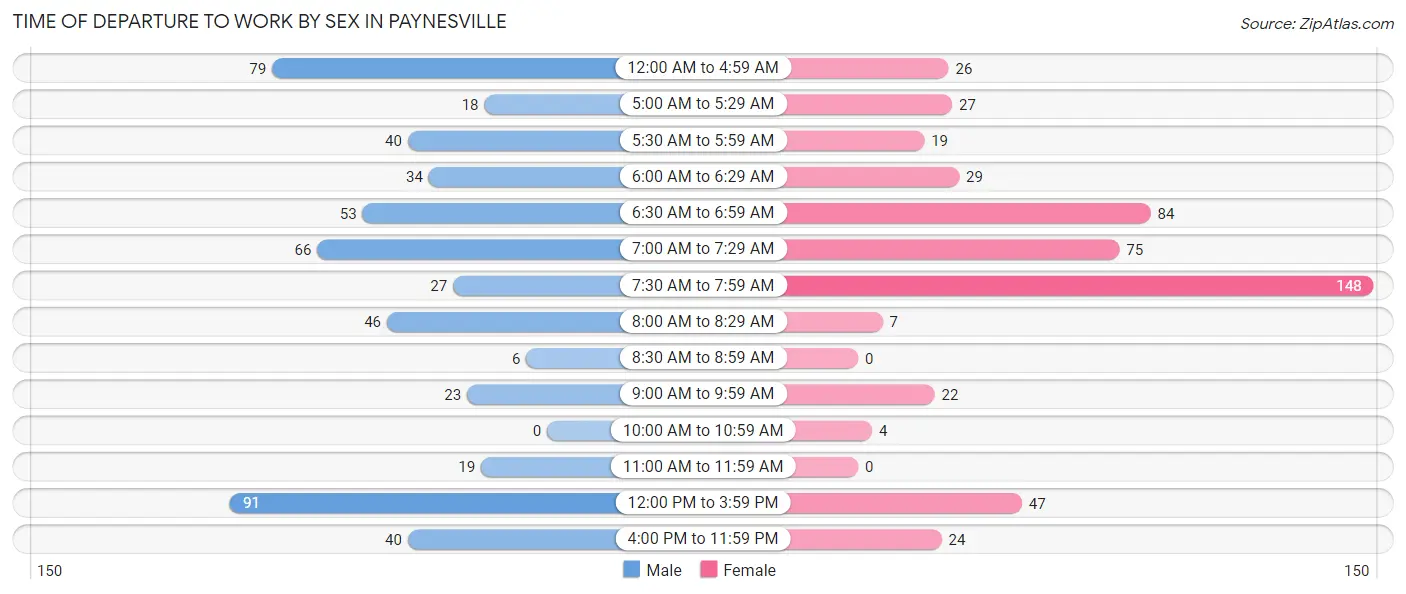
| Time of Departure | Male | Female |
| 12:00 AM to 4:59 AM | 79 (14.6%) | 26 (5.1%) |
| 5:00 AM to 5:29 AM | 18 (3.3%) | 27 (5.3%) |
| 5:30 AM to 5:59 AM | 40 (7.4%) | 19 (3.7%) |
| 6:00 AM to 6:29 AM | 34 (6.3%) | 29 (5.7%) |
| 6:30 AM to 6:59 AM | 53 (9.8%) | 84 (16.4%) |
| 7:00 AM to 7:29 AM | 66 (12.2%) | 75 (14.6%) |
| 7:30 AM to 7:59 AM | 27 (5.0%) | 148 (28.9%) |
| 8:00 AM to 8:29 AM | 46 (8.5%) | 7 (1.4%) |
| 8:30 AM to 8:59 AM | 6 (1.1%) | 0 (0.0%) |
| 9:00 AM to 9:59 AM | 23 (4.2%) | 22 (4.3%) |
| 10:00 AM to 10:59 AM | 0 (0.0%) | 4 (0.8%) |
| 11:00 AM to 11:59 AM | 19 (3.5%) | 0 (0.0%) |
| 12:00 PM to 3:59 PM | 91 (16.8%) | 47 (9.2%) |
| 4:00 PM to 11:59 PM | 40 (7.4%) | 24 (4.7%) |
| Total | 542 (100.0%) | 512 (100.0%) |
Housing Occupancy in Paynesville
Occupancy by Ownership in Paynesville
Of the total 1,047 dwellings in Paynesville, owner-occupied units account for 753 (71.9%), while renter-occupied units make up 294 (28.1%).
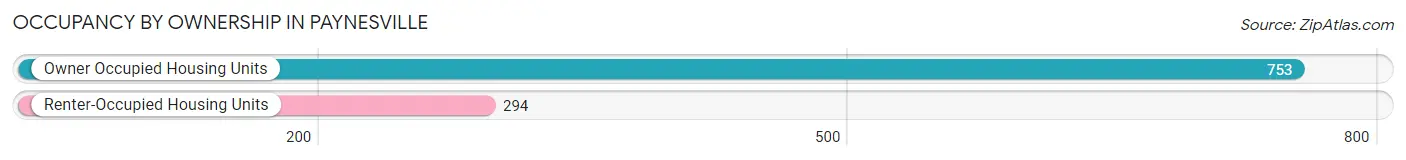
| Occupancy | # Housing Units | % Housing Units |
| Owner Occupied Housing Units | 753 | 71.9% |
| Renter-Occupied Housing Units | 294 | 28.1% |
| Total Occupied Housing Units | 1,047 | 100.0% |
Occupancy by Household Size in Paynesville
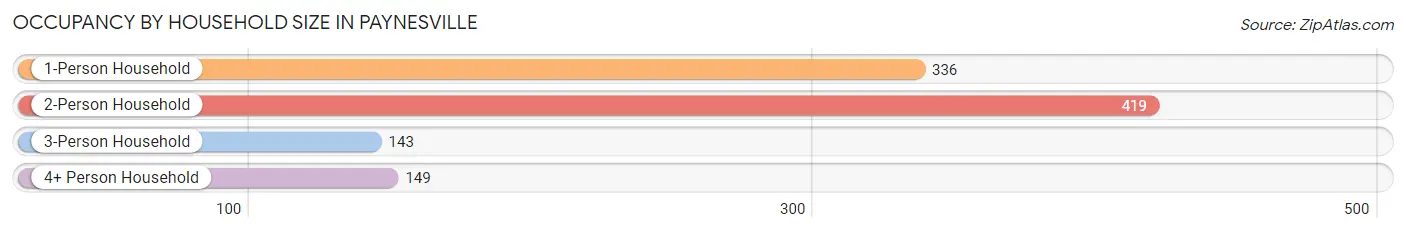
| Household Size | # Housing Units | % Housing Units |
| 1-Person Household | 336 | 32.1% |
| 2-Person Household | 419 | 40.0% |
| 3-Person Household | 143 | 13.7% |
| 4+ Person Household | 149 | 14.2% |
| Total Housing Units | 1,047 | 100.0% |
Occupancy by Ownership by Household Size in Paynesville
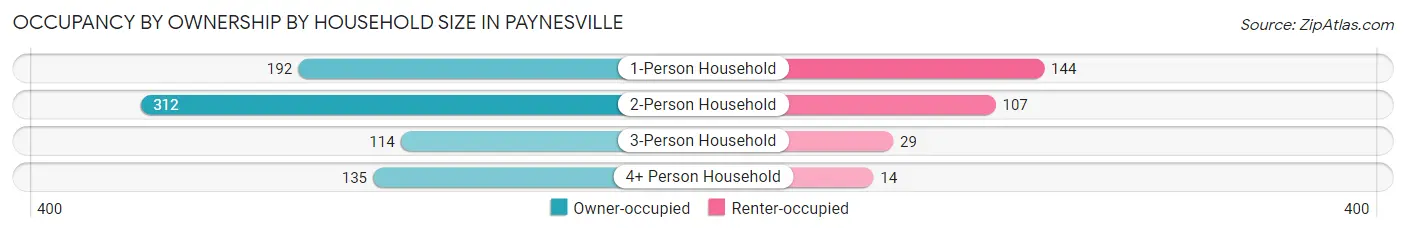
| Household Size | Owner-occupied | Renter-occupied |
| 1-Person Household | 192 (57.1%) | 144 (42.9%) |
| 2-Person Household | 312 (74.5%) | 107 (25.5%) |
| 3-Person Household | 114 (79.7%) | 29 (20.3%) |
| 4+ Person Household | 135 (90.6%) | 14 (9.4%) |
| Total Housing Units | 753 (71.9%) | 294 (28.1%) |
Occupancy by Educational Attainment in Paynesville
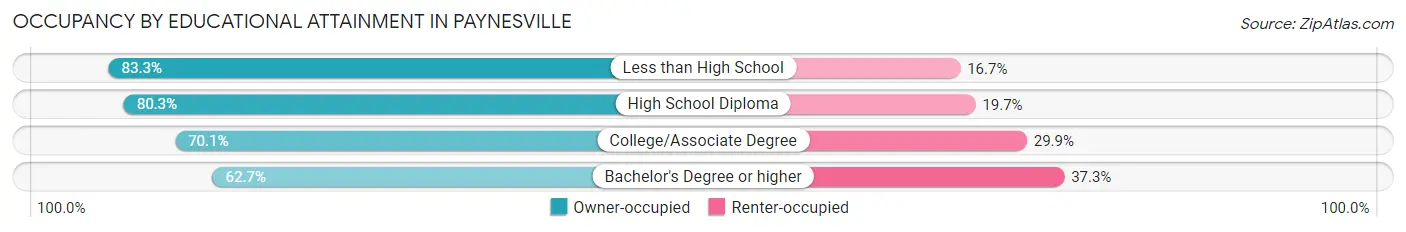
| Household Size | Owner-occupied | Renter-occupied |
| Less than High School | 50 (83.3%) | 10 (16.7%) |
| High School Diploma | 253 (80.3%) | 62 (19.7%) |
| College/Associate Degree | 270 (70.1%) | 115 (29.9%) |
| Bachelor's Degree or higher | 180 (62.7%) | 107 (37.3%) |
Occupancy by Age of Householder in Paynesville
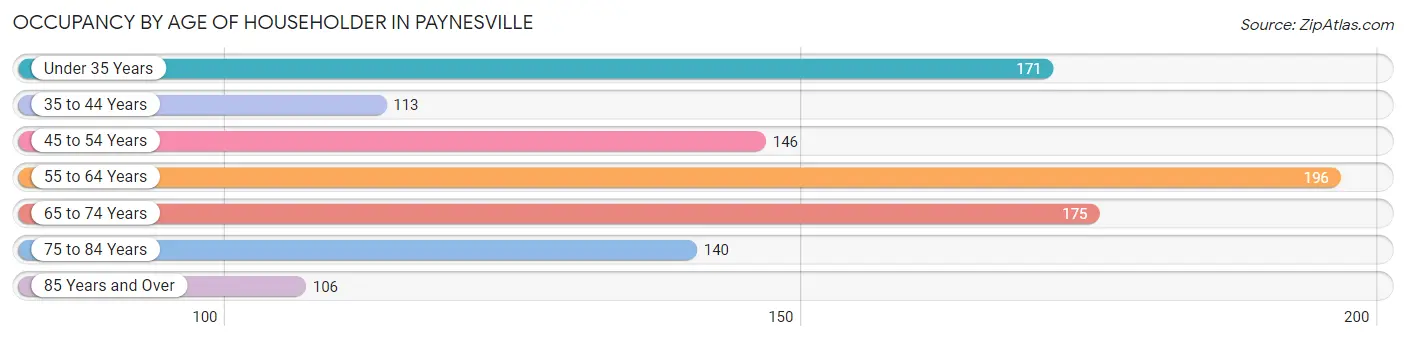
| Age Bracket | # Households | % Households |
| Under 35 Years | 171 | 16.3% |
| 35 to 44 Years | 113 | 10.8% |
| 45 to 54 Years | 146 | 13.9% |
| 55 to 64 Years | 196 | 18.7% |
| 65 to 74 Years | 175 | 16.7% |
| 75 to 84 Years | 140 | 13.4% |
| 85 Years and Over | 106 | 10.1% |
| Total | 1,047 | 100.0% |
Housing Finances in Paynesville
Median Income by Occupancy in Paynesville
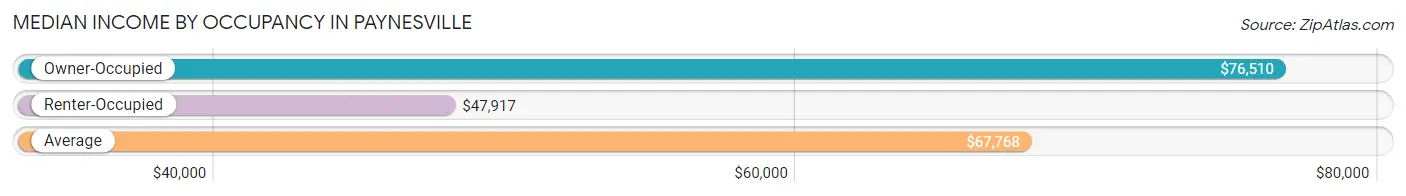
| Occupancy Type | # Households | Median Income |
| Owner-Occupied | 753 (71.9%) | $76,510 |
| Renter-Occupied | 294 (28.1%) | $47,917 |
| Average | 1,047 (100.0%) | $67,768 |
Occupancy by Householder Income Bracket in Paynesville
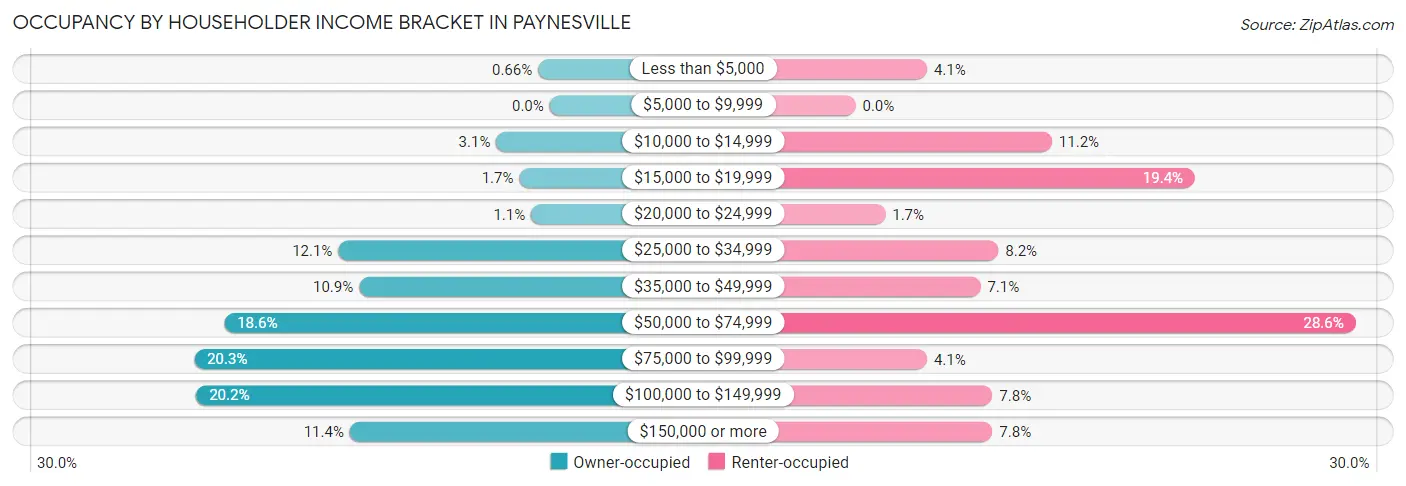
| Income Bracket | Owner-occupied | Renter-occupied |
| Less than $5,000 | 5 (0.7%) | 12 (4.1%) |
| $5,000 to $9,999 | 0 (0.0%) | 0 (0.0%) |
| $10,000 to $14,999 | 23 (3.0%) | 33 (11.2%) |
| $15,000 to $19,999 | 13 (1.7%) | 57 (19.4%) |
| $20,000 to $24,999 | 8 (1.1%) | 5 (1.7%) |
| $25,000 to $34,999 | 91 (12.1%) | 24 (8.2%) |
| $35,000 to $49,999 | 82 (10.9%) | 21 (7.1%) |
| $50,000 to $74,999 | 140 (18.6%) | 84 (28.6%) |
| $75,000 to $99,999 | 153 (20.3%) | 12 (4.1%) |
| $100,000 to $149,999 | 152 (20.2%) | 23 (7.8%) |
| $150,000 or more | 86 (11.4%) | 23 (7.8%) |
| Total | 753 (100.0%) | 294 (100.0%) |
Monthly Housing Cost Tiers in Paynesville
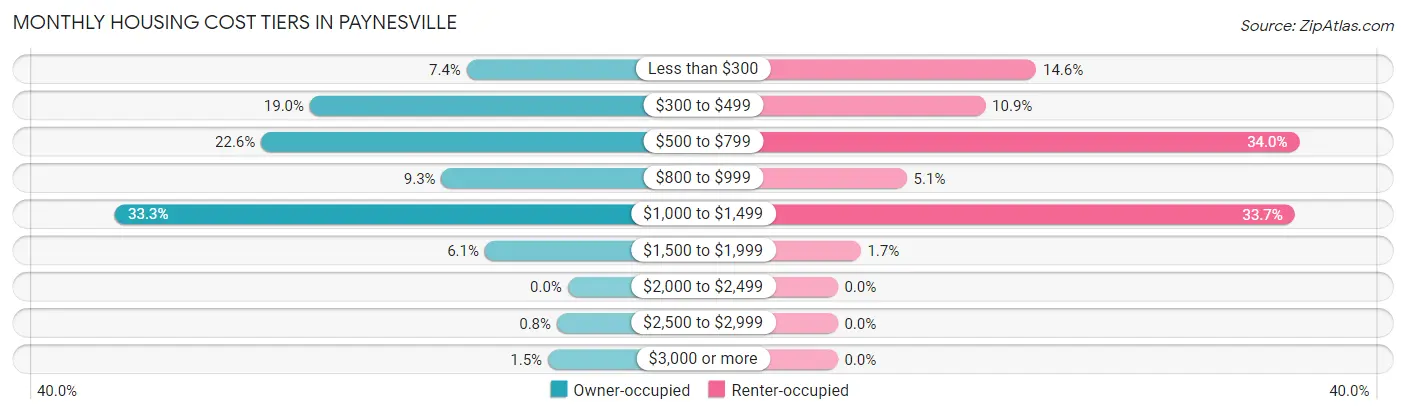
| Monthly Cost | Owner-occupied | Renter-occupied |
| Less than $300 | 56 (7.4%) | 43 (14.6%) |
| $300 to $499 | 143 (19.0%) | 32 (10.9%) |
| $500 to $799 | 170 (22.6%) | 100 (34.0%) |
| $800 to $999 | 70 (9.3%) | 15 (5.1%) |
| $1,000 to $1,499 | 251 (33.3%) | 99 (33.7%) |
| $1,500 to $1,999 | 46 (6.1%) | 5 (1.7%) |
| $2,000 to $2,499 | 0 (0.0%) | 0 (0.0%) |
| $2,500 to $2,999 | 6 (0.8%) | 0 (0.0%) |
| $3,000 or more | 11 (1.5%) | 0 (0.0%) |
| Total | 753 (100.0%) | 294 (100.0%) |
Physical Housing Characteristics in Paynesville
Housing Structures in Paynesville
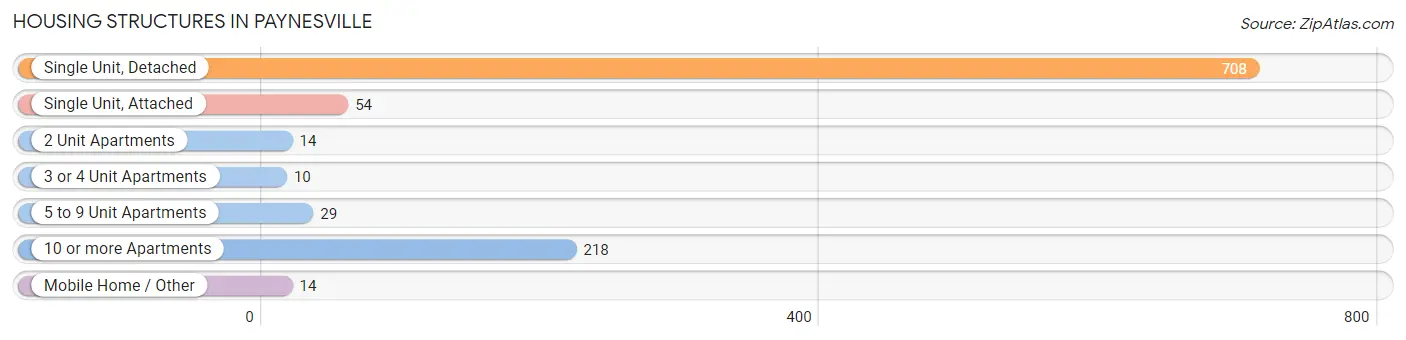
| Structure Type | # Housing Units | % Housing Units |
| Single Unit, Detached | 708 | 67.6% |
| Single Unit, Attached | 54 | 5.2% |
| 2 Unit Apartments | 14 | 1.3% |
| 3 or 4 Unit Apartments | 10 | 1.0% |
| 5 to 9 Unit Apartments | 29 | 2.8% |
| 10 or more Apartments | 218 | 20.8% |
| Mobile Home / Other | 14 | 1.3% |
| Total | 1,047 | 100.0% |
Housing Structures by Occupancy in Paynesville
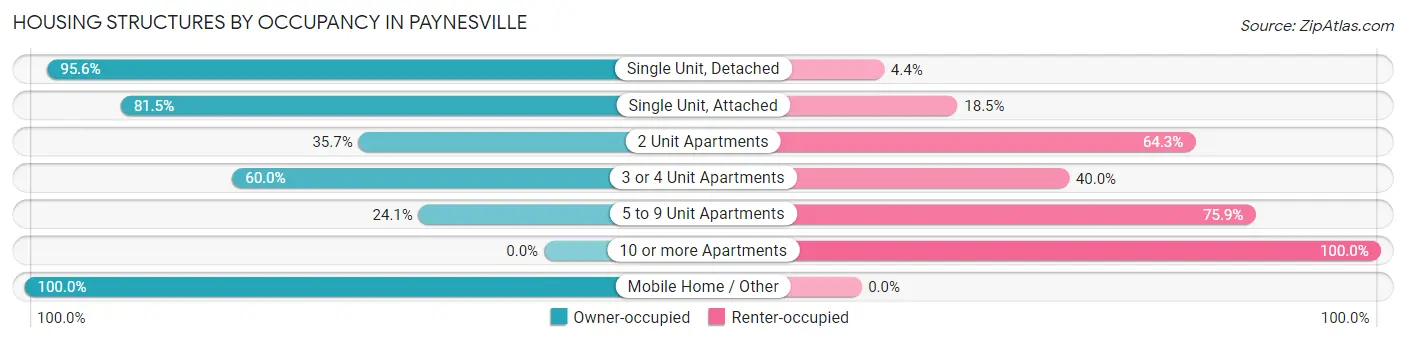
| Structure Type | Owner-occupied | Renter-occupied |
| Single Unit, Detached | 677 (95.6%) | 31 (4.4%) |
| Single Unit, Attached | 44 (81.5%) | 10 (18.5%) |
| 2 Unit Apartments | 5 (35.7%) | 9 (64.3%) |
| 3 or 4 Unit Apartments | 6 (60.0%) | 4 (40.0%) |
| 5 to 9 Unit Apartments | 7 (24.1%) | 22 (75.9%) |
| 10 or more Apartments | 0 (0.0%) | 218 (100.0%) |
| Mobile Home / Other | 14 (100.0%) | 0 (0.0%) |
| Total | 753 (71.9%) | 294 (28.1%) |
Housing Structures by Number of Rooms in Paynesville
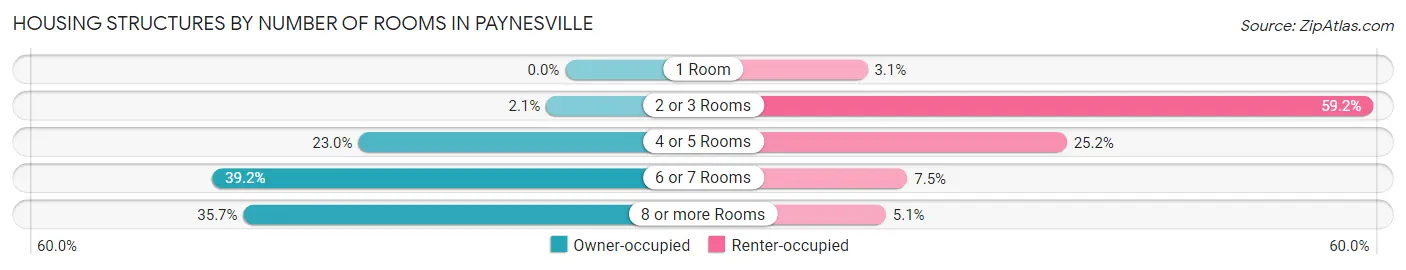
| Number of Rooms | Owner-occupied | Renter-occupied |
| 1 Room | 0 (0.0%) | 9 (3.1%) |
| 2 or 3 Rooms | 16 (2.1%) | 174 (59.2%) |
| 4 or 5 Rooms | 173 (23.0%) | 74 (25.2%) |
| 6 or 7 Rooms | 295 (39.2%) | 22 (7.5%) |
| 8 or more Rooms | 269 (35.7%) | 15 (5.1%) |
| Total | 753 (100.0%) | 294 (100.0%) |
Housing Structure by Heating Type in Paynesville
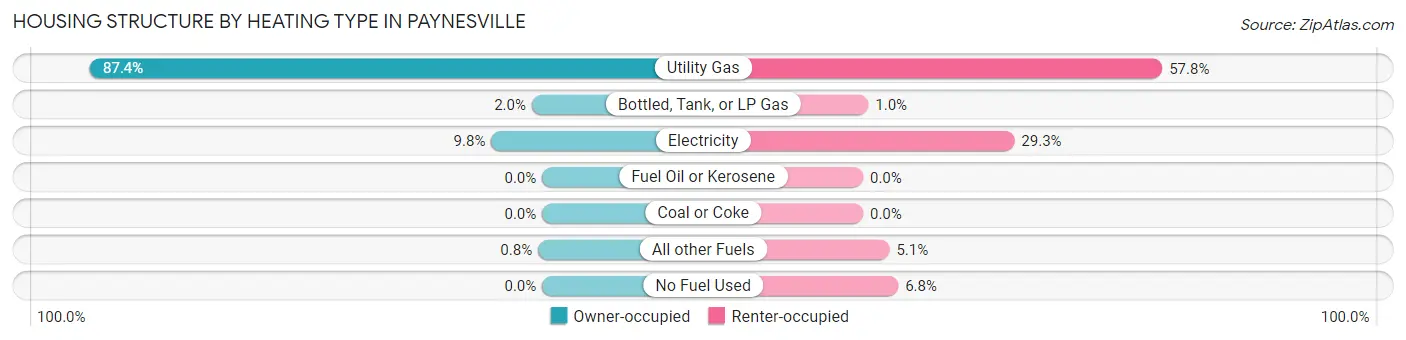
| Heating Type | Owner-occupied | Renter-occupied |
| Utility Gas | 658 (87.4%) | 170 (57.8%) |
| Bottled, Tank, or LP Gas | 15 (2.0%) | 3 (1.0%) |
| Electricity | 74 (9.8%) | 86 (29.2%) |
| Fuel Oil or Kerosene | 0 (0.0%) | 0 (0.0%) |
| Coal or Coke | 0 (0.0%) | 0 (0.0%) |
| All other Fuels | 6 (0.8%) | 15 (5.1%) |
| No Fuel Used | 0 (0.0%) | 20 (6.8%) |
| Total | 753 (100.0%) | 294 (100.0%) |
Household Vehicle Usage in Paynesville
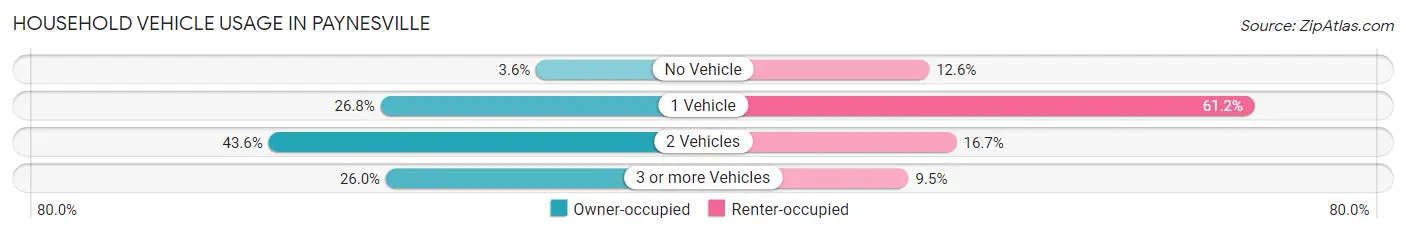
| Vehicles per Household | Owner-occupied | Renter-occupied |
| No Vehicle | 27 (3.6%) | 37 (12.6%) |
| 1 Vehicle | 202 (26.8%) | 180 (61.2%) |
| 2 Vehicles | 328 (43.6%) | 49 (16.7%) |
| 3 or more Vehicles | 196 (26.0%) | 28 (9.5%) |
| Total | 753 (100.0%) | 294 (100.0%) |
Real Estate & Mortgages in Paynesville
Real Estate and Mortgage Overview in Paynesville
| Characteristic | Without Mortgage | With Mortgage |
| Housing Units | 328 | 425 |
| Median Property Value | $159,500 | $161,200 |
| Median Household Income | $54,259 | $50 |
| Monthly Housing Costs | $464 | $11 |
| Real Estate Taxes | $1,621 | $0 |
Property Value by Mortgage Status in Paynesville
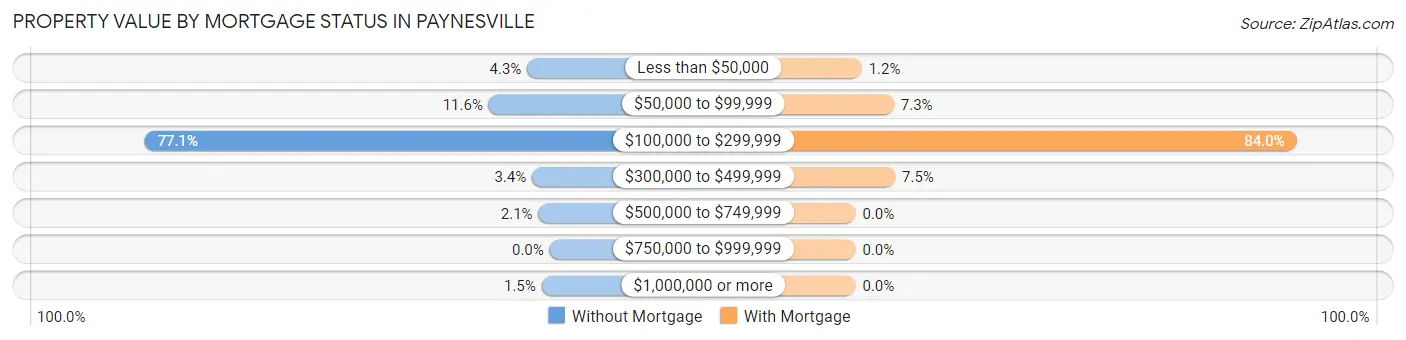
| Property Value | Without Mortgage | With Mortgage |
| Less than $50,000 | 14 (4.3%) | 5 (1.2%) |
| $50,000 to $99,999 | 38 (11.6%) | 31 (7.3%) |
| $100,000 to $299,999 | 253 (77.1%) | 357 (84.0%) |
| $300,000 to $499,999 | 11 (3.4%) | 32 (7.5%) |
| $500,000 to $749,999 | 7 (2.1%) | 0 (0.0%) |
| $750,000 to $999,999 | 0 (0.0%) | 0 (0.0%) |
| $1,000,000 or more | 5 (1.5%) | 0 (0.0%) |
| Total | 328 (100.0%) | 425 (100.0%) |
Household Income by Mortgage Status in Paynesville
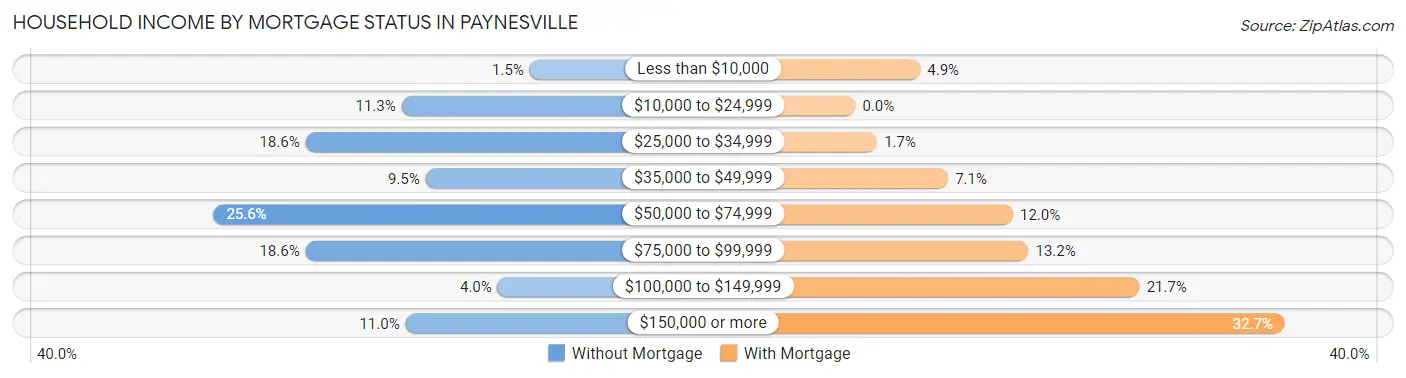
| Household Income | Without Mortgage | With Mortgage |
| Less than $10,000 | 5 (1.5%) | 21 (4.9%) |
| $10,000 to $24,999 | 37 (11.3%) | 0 (0.0%) |
| $25,000 to $34,999 | 61 (18.6%) | 7 (1.7%) |
| $35,000 to $49,999 | 31 (9.5%) | 30 (7.1%) |
| $50,000 to $74,999 | 84 (25.6%) | 51 (12.0%) |
| $75,000 to $99,999 | 61 (18.6%) | 56 (13.2%) |
| $100,000 to $149,999 | 13 (4.0%) | 92 (21.6%) |
| $150,000 or more | 36 (11.0%) | 139 (32.7%) |
| Total | 328 (100.0%) | 425 (100.0%) |
Property Value to Household Income Ratio in Paynesville
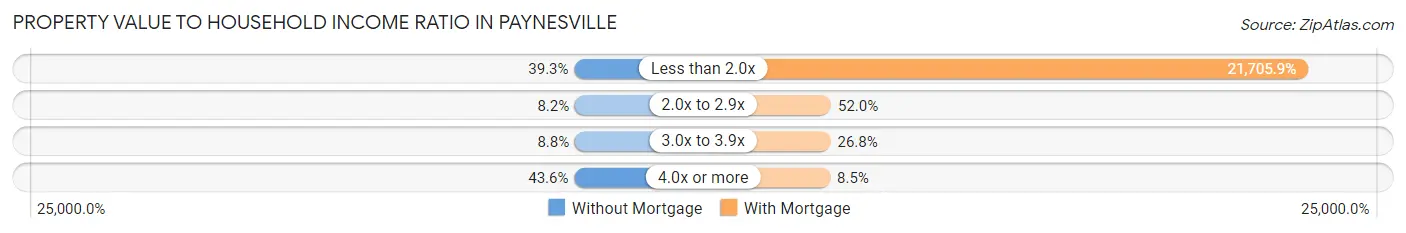
| Value-to-Income Ratio | Without Mortgage | With Mortgage |
| Less than 2.0x | 129 (39.3%) | 92,250 (21,705.9%) |
| 2.0x to 2.9x | 27 (8.2%) | 221 (52.0%) |
| 3.0x to 3.9x | 29 (8.8%) | 114 (26.8%) |
| 4.0x or more | 143 (43.6%) | 36 (8.5%) |
| Total | 328 (100.0%) | 425 (100.0%) |
Real Estate Taxes by Mortgage Status in Paynesville
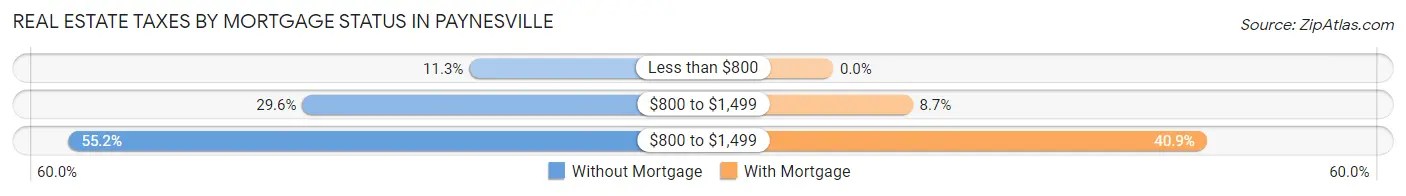
| Property Taxes | Without Mortgage | With Mortgage |
| Less than $800 | 37 (11.3%) | 0 (0.0%) |
| $800 to $1,499 | 97 (29.6%) | 37 (8.7%) |
| $800 to $1,499 | 181 (55.2%) | 174 (40.9%) |
| Total | 328 (100.0%) | 425 (100.0%) |
Health & Disability in Paynesville
Health Insurance Coverage by Age in Paynesville
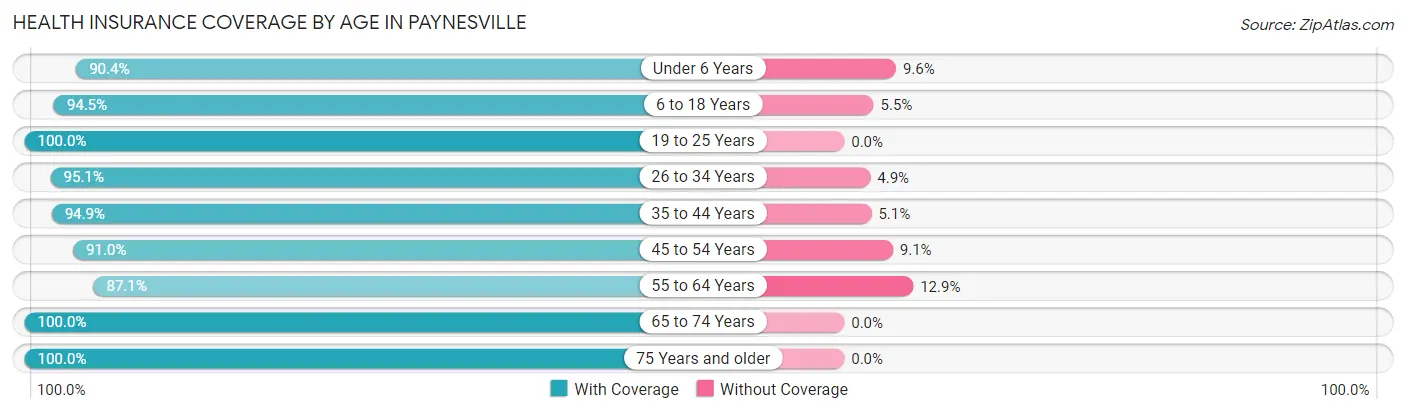
| Age Bracket | With Coverage | Without Coverage |
| Under 6 Years | 169 (90.4%) | 18 (9.6%) |
| 6 to 18 Years | 329 (94.5%) | 19 (5.5%) |
| 19 to 25 Years | 148 (100.0%) | 0 (0.0%) |
| 26 to 34 Years | 235 (95.1%) | 12 (4.9%) |
| 35 to 44 Years | 225 (94.9%) | 12 (5.1%) |
| 45 to 54 Years | 201 (90.9%) | 20 (9.0%) |
| 55 to 64 Years | 271 (87.1%) | 40 (12.9%) |
| 65 to 74 Years | 337 (100.0%) | 0 (0.0%) |
| 75 Years and older | 341 (100.0%) | 0 (0.0%) |
| Total | 2,256 (94.9%) | 121 (5.1%) |
Health Insurance Coverage by Citizenship Status in Paynesville
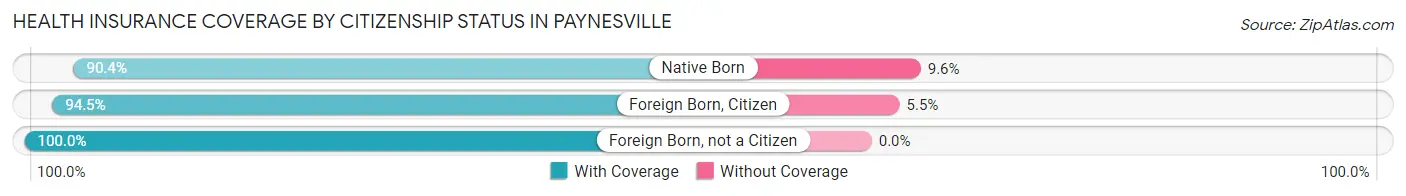
| Citizenship Status | With Coverage | Without Coverage |
| Native Born | 169 (90.4%) | 18 (9.6%) |
| Foreign Born, Citizen | 329 (94.5%) | 19 (5.5%) |
| Foreign Born, not a Citizen | 148 (100.0%) | 0 (0.0%) |
Health Insurance Coverage by Household Income in Paynesville
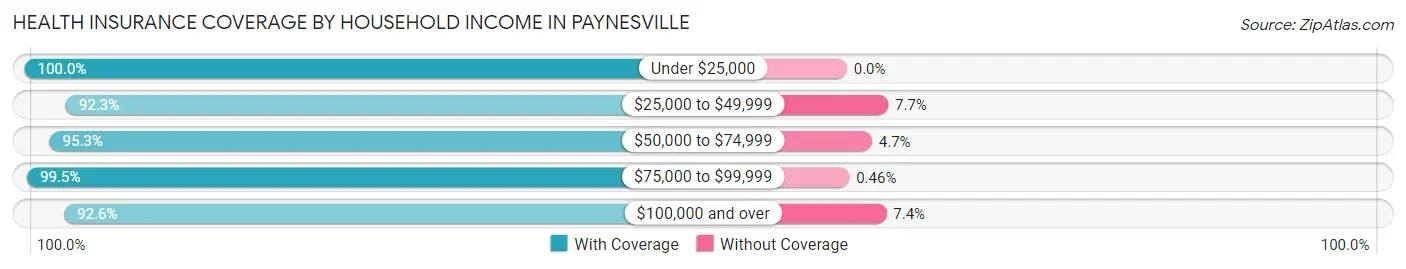
| Household Income | With Coverage | Without Coverage |
| Under $25,000 | 166 (100.0%) | 0 (0.0%) |
| $25,000 to $49,999 | 310 (92.3%) | 26 (7.7%) |
| $50,000 to $74,999 | 467 (95.3%) | 23 (4.7%) |
| $75,000 to $99,999 | 433 (99.5%) | 2 (0.5%) |
| $100,000 and over | 875 (92.6%) | 70 (7.4%) |
Public vs Private Health Insurance Coverage by Age in Paynesville
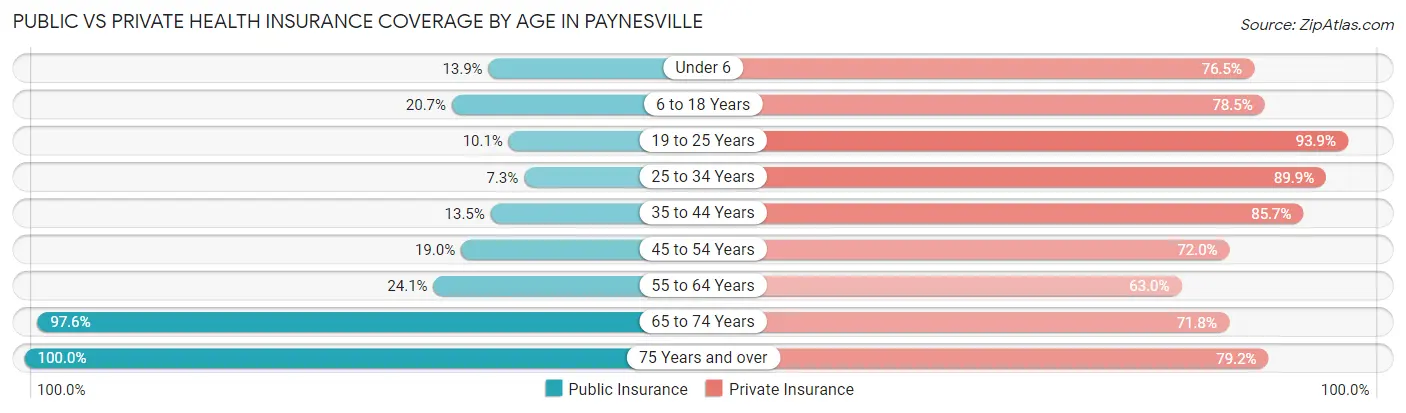
| Age Bracket | Public Insurance | Private Insurance |
| Under 6 | 26 (13.9%) | 143 (76.5%) |
| 6 to 18 Years | 72 (20.7%) | 273 (78.4%) |
| 19 to 25 Years | 15 (10.1%) | 139 (93.9%) |
| 25 to 34 Years | 18 (7.3%) | 222 (89.9%) |
| 35 to 44 Years | 32 (13.5%) | 203 (85.7%) |
| 45 to 54 Years | 42 (19.0%) | 159 (72.0%) |
| 55 to 64 Years | 75 (24.1%) | 196 (63.0%) |
| 65 to 74 Years | 329 (97.6%) | 242 (71.8%) |
| 75 Years and over | 341 (100.0%) | 270 (79.2%) |
| Total | 950 (40.0%) | 1,847 (77.7%) |
Disability Status by Sex by Age in Paynesville
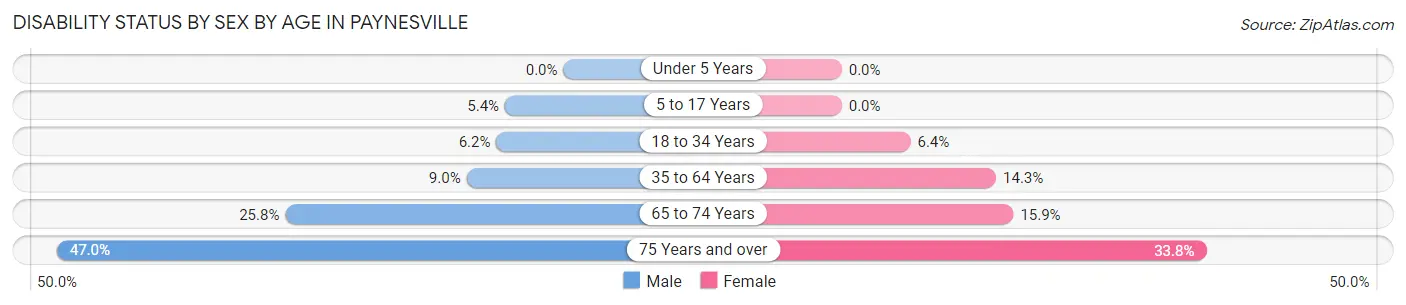
| Age Bracket | Male | Female |
| Under 5 Years | 0 (0.0%) | 0 (0.0%) |
| 5 to 17 Years | 9 (5.4%) | 0 (0.0%) |
| 18 to 34 Years | 14 (6.2%) | 15 (6.4%) |
| 35 to 64 Years | 34 (9.0%) | 56 (14.3%) |
| 65 to 74 Years | 40 (25.8%) | 29 (15.9%) |
| 75 Years and over | 63 (47.0%) | 70 (33.8%) |
Disability Class by Sex by Age in Paynesville
Disability Class: Hearing Difficulty
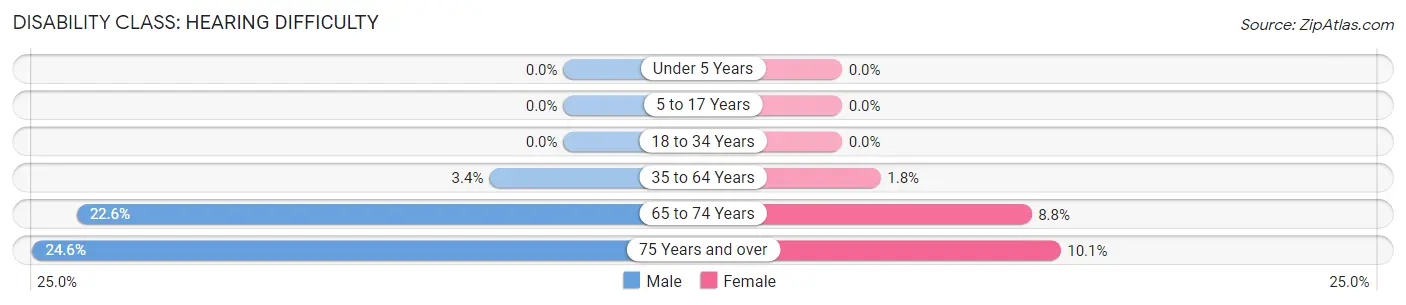
| Age Bracket | Male | Female |
| Under 5 Years | 0 (0.0%) | 0 (0.0%) |
| 5 to 17 Years | 0 (0.0%) | 0 (0.0%) |
| 18 to 34 Years | 0 (0.0%) | 0 (0.0%) |
| 35 to 64 Years | 13 (3.4%) | 7 (1.8%) |
| 65 to 74 Years | 35 (22.6%) | 16 (8.8%) |
| 75 Years and over | 33 (24.6%) | 21 (10.1%) |
Disability Class: Vision Difficulty
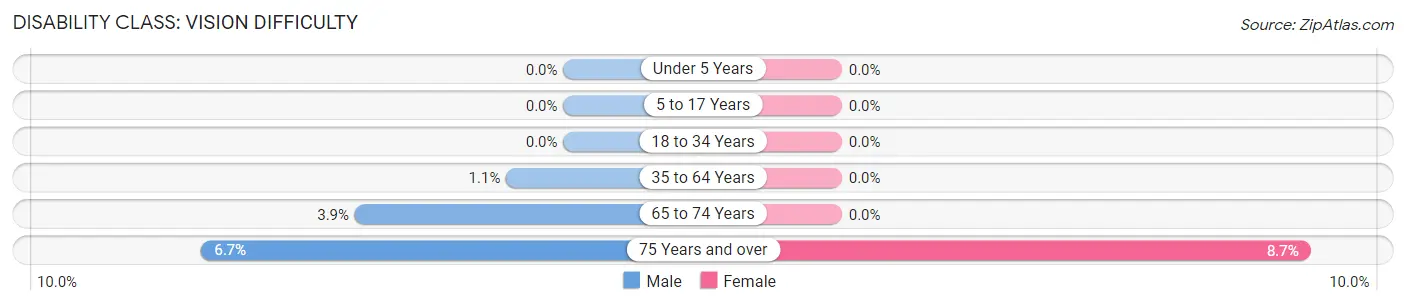
| Age Bracket | Male | Female |
| Under 5 Years | 0 (0.0%) | 0 (0.0%) |
| 5 to 17 Years | 0 (0.0%) | 0 (0.0%) |
| 18 to 34 Years | 0 (0.0%) | 0 (0.0%) |
| 35 to 64 Years | 4 (1.1%) | 0 (0.0%) |
| 65 to 74 Years | 6 (3.9%) | 0 (0.0%) |
| 75 Years and over | 9 (6.7%) | 18 (8.7%) |
Disability Class: Cognitive Difficulty
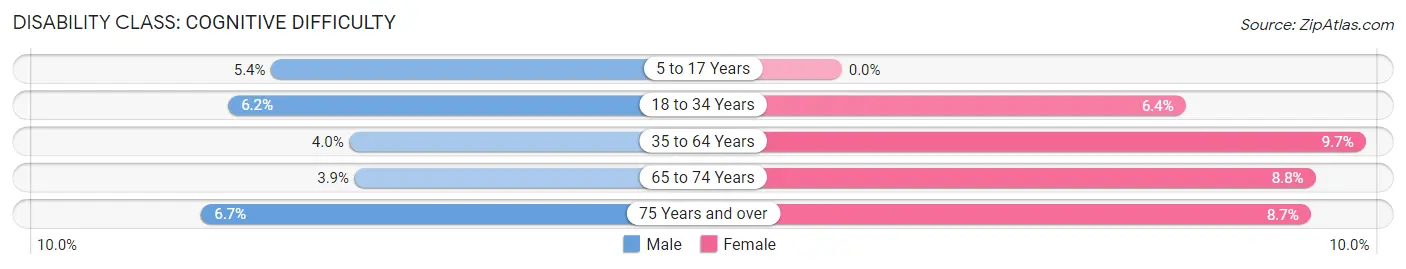
| Age Bracket | Male | Female |
| 5 to 17 Years | 9 (5.4%) | 0 (0.0%) |
| 18 to 34 Years | 14 (6.2%) | 15 (6.4%) |
| 35 to 64 Years | 15 (4.0%) | 38 (9.7%) |
| 65 to 74 Years | 6 (3.9%) | 16 (8.8%) |
| 75 Years and over | 9 (6.7%) | 18 (8.7%) |
Disability Class: Ambulatory Difficulty
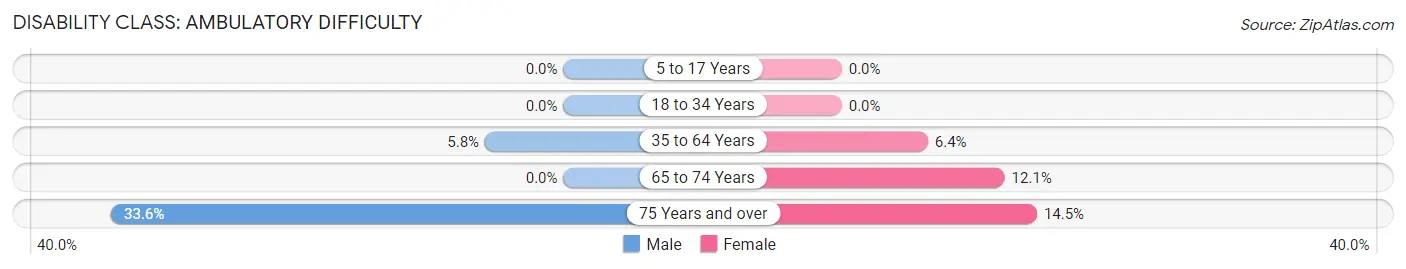
| Age Bracket | Male | Female |
| 5 to 17 Years | 0 (0.0%) | 0 (0.0%) |
| 18 to 34 Years | 0 (0.0%) | 0 (0.0%) |
| 35 to 64 Years | 22 (5.8%) | 25 (6.4%) |
| 65 to 74 Years | 0 (0.0%) | 22 (12.1%) |
| 75 Years and over | 45 (33.6%) | 30 (14.5%) |
Disability Class: Self-Care Difficulty
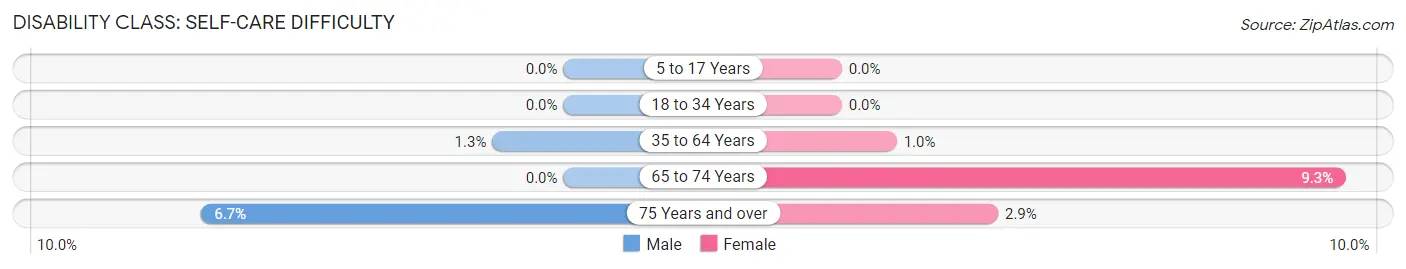
| Age Bracket | Male | Female |
| 5 to 17 Years | 0 (0.0%) | 0 (0.0%) |
| 18 to 34 Years | 0 (0.0%) | 0 (0.0%) |
| 35 to 64 Years | 5 (1.3%) | 4 (1.0%) |
| 65 to 74 Years | 0 (0.0%) | 17 (9.3%) |
| 75 Years and over | 9 (6.7%) | 6 (2.9%) |
Technology Access in Paynesville
Computing Device Access in Paynesville
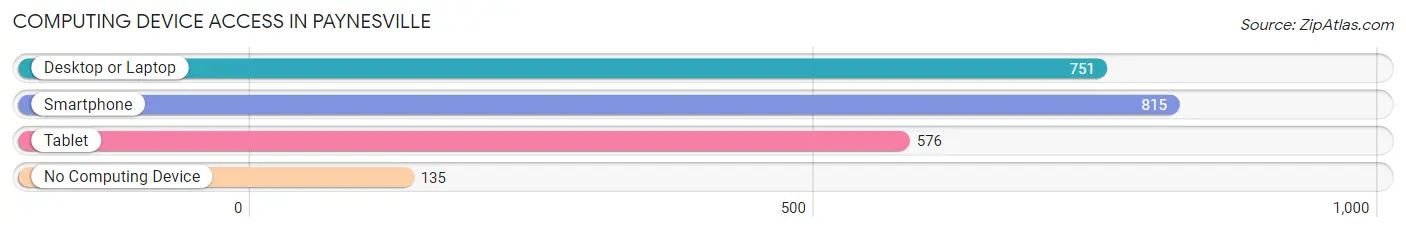
| Device Type | # Households | % Households |
| Desktop or Laptop | 751 | 71.7% |
| Smartphone | 815 | 77.8% |
| Tablet | 576 | 55.0% |
| No Computing Device | 135 | 12.9% |
| Total | 1,047 | 100.0% |
Internet Access in Paynesville
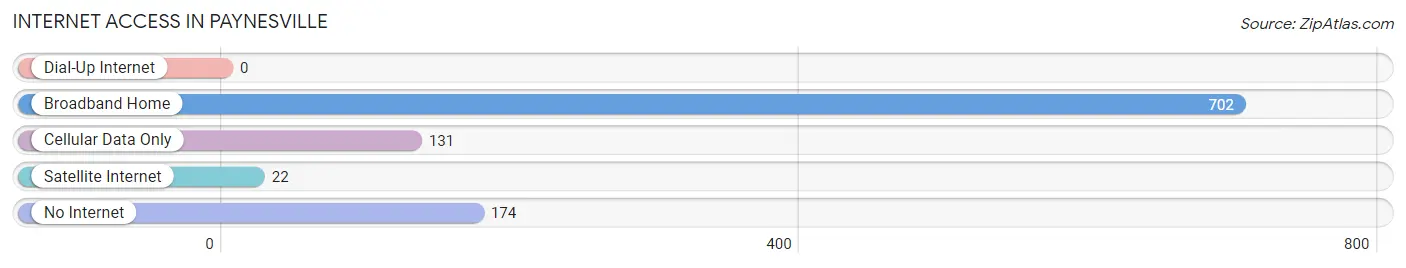
| Internet Type | # Households | % Households |
| Dial-Up Internet | 0 | 0.0% |
| Broadband Home | 702 | 67.0% |
| Cellular Data Only | 131 | 12.5% |
| Satellite Internet | 22 | 2.1% |
| No Internet | 174 | 16.6% |
| Total | 1,047 | 100.0% |
Paynesville Summary
Paynesville, Minnesota is a small city located in Stearns County, in the central part of the state. It is situated on the banks of the Sauk River, and is part of the St. Cloud Metropolitan Statistical Area. The city has a population of approximately 3,000 people, and is known for its small-town charm and friendly atmosphere.
History
Paynesville was founded in 1856 by William Payne, a settler from Ohio. He named the town after himself, and it quickly grew into a thriving community. The town was incorporated in 1887, and the first mayor was elected in 1888.
In the early 1900s, Paynesville was a bustling agricultural center, with many farms and businesses. The town was also home to a number of churches, including the First Presbyterian Church, which was founded in 1887.
In the 1950s, Paynesville began to experience a population boom, as many people moved to the area to take advantage of the growing economy. The town was also home to a number of manufacturing businesses, including a canning factory and a furniture factory.
Geography
Paynesville is located in the central part of Minnesota, in Stearns County. It is situated on the banks of the Sauk River, and is part of the St. Cloud Metropolitan Statistical Area. The city has a total area of 2.2 square miles, all of which is land.
The city is located in a region of rolling hills and wooded areas, and is surrounded by several lakes, including Lake Koronis, Lake Osakis, and Lake Wobegon. The climate in Paynesville is humid continental, with cold winters and warm summers.
Economy
Paynesville’s economy is largely based on agriculture and manufacturing. The city is home to several large farms, as well as a number of small businesses. The city is also home to a number of manufacturing businesses, including a canning factory and a furniture factory.
The city is also home to a number of retail stores, restaurants, and other businesses. The city is served by the Paynesville Municipal Airport, which provides air service to the surrounding area.
Demographics
As of the 2010 census, Paynesville had a population of 3,000 people. The racial makeup of the city was 97.2% White, 0.7% African American, 0.3% Native American, 0.3% Asian, 0.1% Pacific Islander, 0.3% from other races, and 1.3% from two or more races. Hispanic or Latino of any race were 1.3% of the population.
The median income for a household in Paynesville was $41,250, and the median income for a family was $50,000. The per capita income for the city was $20,845. About 8.2% of families and 10.2% of the population were below the poverty line, including 14.3% of those under age 18 and 8.2% of those age 65 or over.
Paynesville is a small city with a rich history and a friendly atmosphere. The city is home to a number of businesses, and is a great place to live and work. The city is also home to a number of churches, and is a great place to raise a family.
Common Questions
What is Per Capita Income in Paynesville?
Per Capita income in Paynesville is $33,622.
What is the Median Family Income in Paynesville?
Median Family Income in Paynesville is $79,087.
What is the Median Household income in Paynesville?
Median Household Income in Paynesville is $67,768.
What is Income or Wage Gap in Paynesville?
Income or Wage Gap in Paynesville is 19.8%.
Women in Paynesville earn 80.2 cents for every dollar earned by a man.
What is Inequality or Gini Index in Paynesville?
Inequality or Gini Index in Paynesville is 0.38.
What is the Total Population of Paynesville?
Total Population of Paynesville is 2,432.
What is the Total Male Population of Paynesville?
Total Male Population of Paynesville is 1,217.
What is the Total Female Population of Paynesville?
Total Female Population of Paynesville is 1,215.
What is the Ratio of Males per 100 Females in Paynesville?
There are 100.16 Males per 100 Females in Paynesville.
What is the Ratio of Females per 100 Males in Paynesville?
There are 99.84 Females per 100 Males in Paynesville.
What is the Median Population Age in Paynesville?
Median Population Age in Paynesville is 46.9 Years.
What is the Average Family Size in Paynesville
Average Family Size in Paynesville is 2.9 People.
What is the Average Household Size in Paynesville
Average Household Size in Paynesville is 2.3 People.
How Large is the Labor Force in Paynesville?
There are 1,206 People in the Labor Forcein in Paynesville.
What is the Percentage of People in the Labor Force in Paynesville?
60.0% of People are in the Labor Force in Paynesville.
What is the Unemployment Rate in Paynesville?
Unemployment Rate in Paynesville is 3.0%.