Borup, MN Map & Demographics
Borup Map
Borup Overview
$20,321
PER CAPITA INCOME
$60,250
AVG FAMILY INCOME
$60,167
AVG HOUSEHOLD INCOME
51.3%
WAGE / INCOME GAP [ % ]
48.7¢/ $1
WAGE / INCOME GAP [ $ ]
0.24
INEQUALITY / GINI INDEX
154
TOTAL POPULATION
67
MALE POPULATION
87
FEMALE POPULATION
77.01
MALES / 100 FEMALES
129.85
FEMALES / 100 MALES
55.2
MEDIAN AGE
2.9
AVG FAMILY SIZE
2.9
AVG HOUSEHOLD SIZE
40
LABOR FORCE [ PEOPLE ]
33.9%
PERCENT IN LABOR FORCE
Borup Zip Codes
Borup Area Codes
Income in Borup
Income Overview in Borup
Per Capita Income in Borup is $20,321, while median incomes of families and households are $60,250 and $60,167 respectively.
| Characteristic | Number | Measure |
| Per Capita Income | 154 | $20,321 |
| Median Family Income | 53 | $60,250 |
| Mean Family Income | 53 | $55,438 |
| Median Household Income | 54 | $60,167 |
| Mean Household Income | 54 | $55,107 |
| Income Deficit | 53 | $0 |
| Wage / Income Gap (%) | 154 | 51.25% |
| Wage / Income Gap ($) | 154 | 48.75¢ per $1 |
| Gini / Inequality Index | 154 | 0.24 |
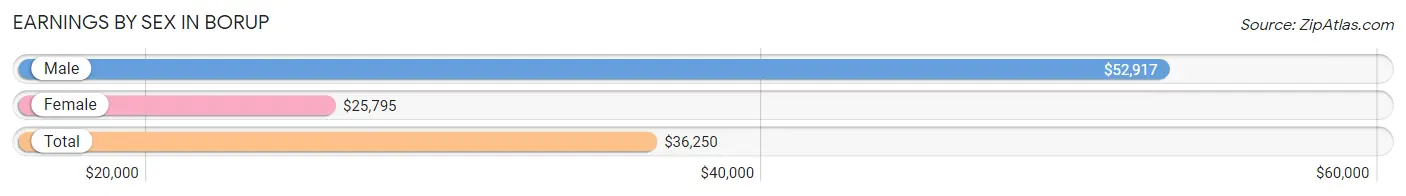
Earnings by Sex in Borup
Average Earnings in Borup are $36,250, $52,917 for men and $25,795 for women, a difference of 51.2%.
| Sex | Number | Average Earnings |
| Male | 21 (52.5%) | $52,917 |
| Female | 19 (47.5%) | $25,795 |
| Total | 40 (100.0%) | $36,250 |
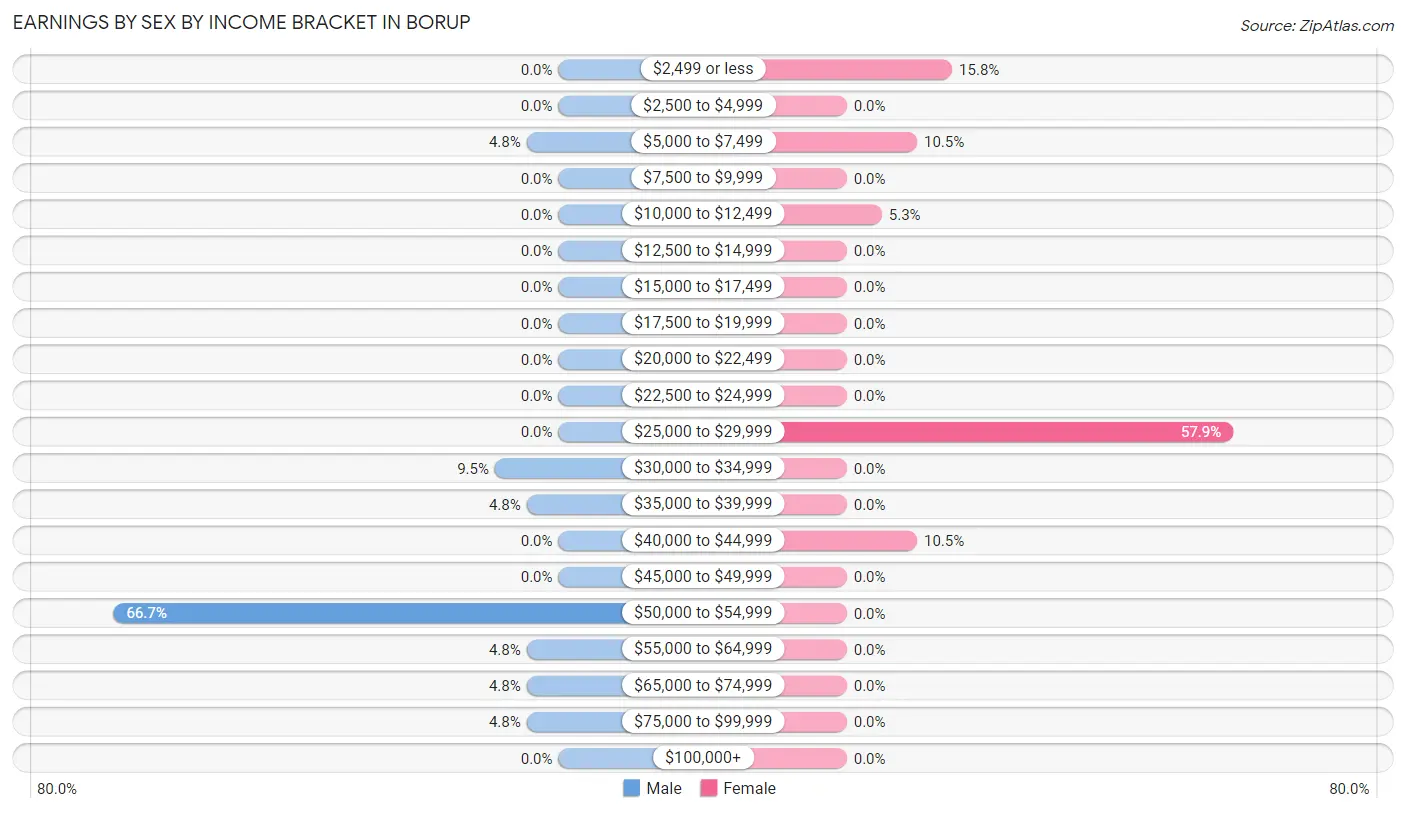
Earnings by Sex by Income Bracket in Borup
The most common earnings brackets in Borup are $50,000 to $54,999 for men (14 | 66.7%) and $25,000 to $29,999 for women (11 | 57.9%).
| Income | Male | Female |
| $2,499 or less | 0 (0.0%) | 3 (15.8%) |
| $2,500 to $4,999 | 0 (0.0%) | 0 (0.0%) |
| $5,000 to $7,499 | 1 (4.8%) | 2 (10.5%) |
| $7,500 to $9,999 | 0 (0.0%) | 0 (0.0%) |
| $10,000 to $12,499 | 0 (0.0%) | 1 (5.3%) |
| $12,500 to $14,999 | 0 (0.0%) | 0 (0.0%) |
| $15,000 to $17,499 | 0 (0.0%) | 0 (0.0%) |
| $17,500 to $19,999 | 0 (0.0%) | 0 (0.0%) |
| $20,000 to $22,499 | 0 (0.0%) | 0 (0.0%) |
| $22,500 to $24,999 | 0 (0.0%) | 0 (0.0%) |
| $25,000 to $29,999 | 0 (0.0%) | 11 (57.9%) |
| $30,000 to $34,999 | 2 (9.5%) | 0 (0.0%) |
| $35,000 to $39,999 | 1 (4.8%) | 0 (0.0%) |
| $40,000 to $44,999 | 0 (0.0%) | 2 (10.5%) |
| $45,000 to $49,999 | 0 (0.0%) | 0 (0.0%) |
| $50,000 to $54,999 | 14 (66.7%) | 0 (0.0%) |
| $55,000 to $64,999 | 1 (4.8%) | 0 (0.0%) |
| $65,000 to $74,999 | 1 (4.8%) | 0 (0.0%) |
| $75,000 to $99,999 | 1 (4.8%) | 0 (0.0%) |
| $100,000+ | 0 (0.0%) | 0 (0.0%) |
| Total | 21 (100.0%) | 19 (100.0%) |
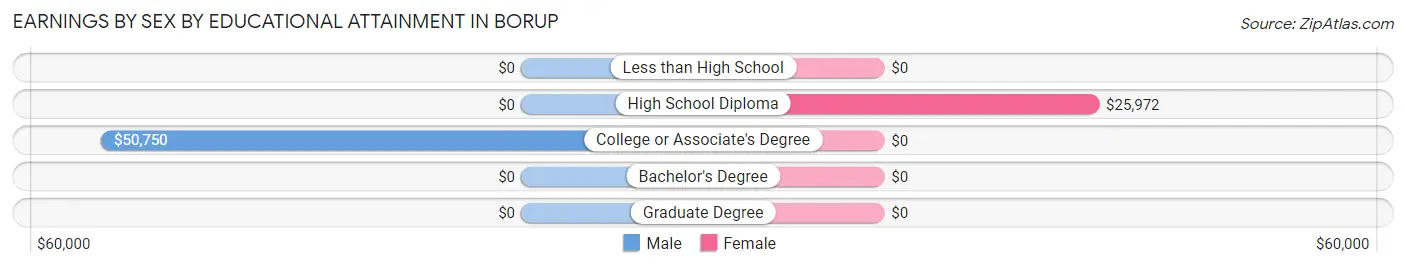
Earnings by Sex by Educational Attainment in Borup
Average earnings in Borup are $52,917 for men and $25,795 for women, a difference of 51.2%. Men with an educational attainment of college or associate's degree enjoy the highest average annual earnings of $50,750, while those with college or associate's degree education earn the least with $50,750. Women with an educational attainment of high school diploma earn the most with the average annual earnings of $25,972, while those with high school diploma education have the smallest earnings of $25,972.
| Educational Attainment | Male Income | Female Income |
| Less than High School | - | - |
| High School Diploma | - | - |
| College or Associate's Degree | $50,750 | $0 |
| Bachelor's Degree | - | - |
| Graduate Degree | - | - |
| Total | $52,917 | $25,795 |
Family Income in Borup
Family Income Brackets in Borup
According to the Borup family income data, there are 22 families falling into the $50,000 to $74,999 income range, which is the most common income bracket and makes up 41.5% of all families.
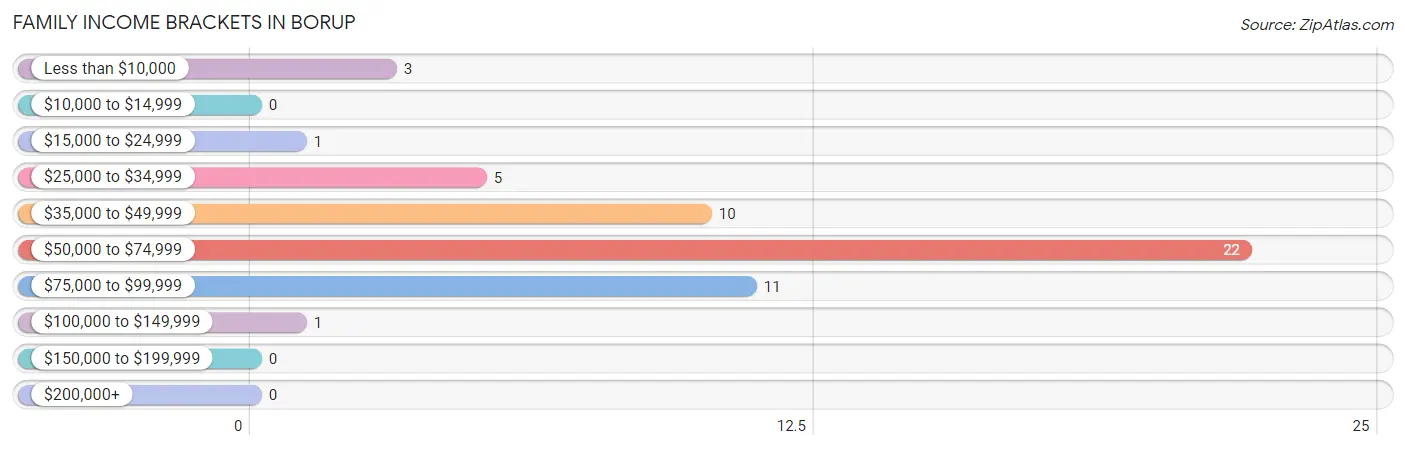
| Income Bracket | # Families | % Families |
| Less than $10,000 | 3 | 5.7% |
| $10,000 to $14,999 | 0 | 0.0% |
| $15,000 to $24,999 | 1 | 1.9% |
| $25,000 to $34,999 | 5 | 9.4% |
| $35,000 to $49,999 | 10 | 18.9% |
| $50,000 to $74,999 | 22 | 41.5% |
| $75,000 to $99,999 | 11 | 20.8% |
| $100,000 to $149,999 | 1 | 1.9% |
| $150,000 to $199,999 | 0 | 0.0% |
| $200,000+ | 0 | 0.0% |
Family Income by Famaliy Size in Borup
2-person families (40 | 75.5%) account for the highest median family income in Borup with $61,000 per family, while 2-person families (40 | 75.5%) have the highest median income of $30,500 per family member.
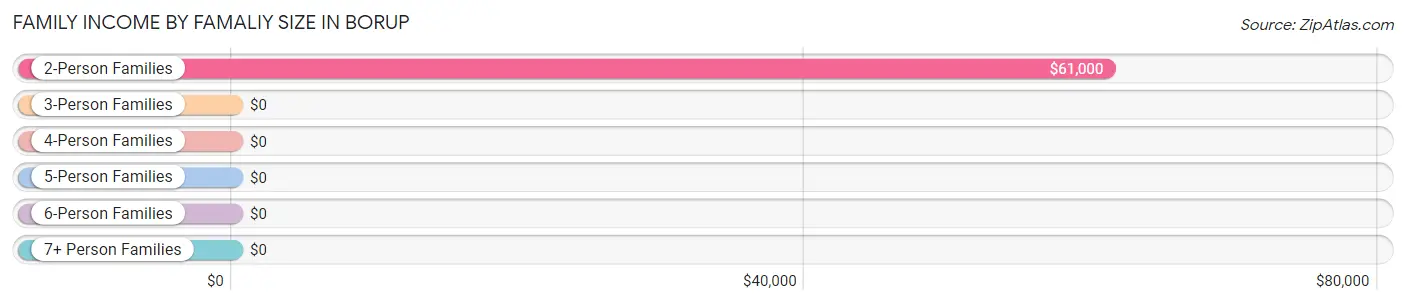
| Income Bracket | # Families | Median Income |
| 2-Person Families | 40 (75.5%) | $61,000 |
| 3-Person Families | 7 (13.2%) | $0 |
| 4-Person Families | 0 (0.0%) | $0 |
| 5-Person Families | 0 (0.0%) | $0 |
| 6-Person Families | 5 (9.4%) | $0 |
| 7+ Person Families | 1 (1.9%) | $0 |
| Total | 53 (100.0%) | $60,250 |
Family Income by Number of Earners in Borup
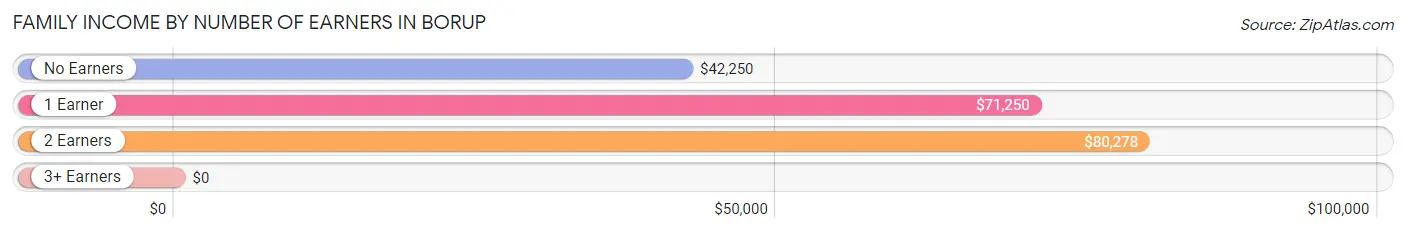
| Number of Earners | # Families | Median Income |
| No Earners | 31 (58.5%) | $42,250 |
| 1 Earner | 5 (9.4%) | $71,250 |
| 2 Earners | 16 (30.2%) | $80,278 |
| 3+ Earners | 1 (1.9%) | $0 |
| Total | 53 (100.0%) | $60,250 |
Household Income in Borup
Household Income Brackets in Borup
With 22 households falling in the category, the $50,000 to $74,999 income range is the most frequent in Borup, accounting for 40.7% of all households.
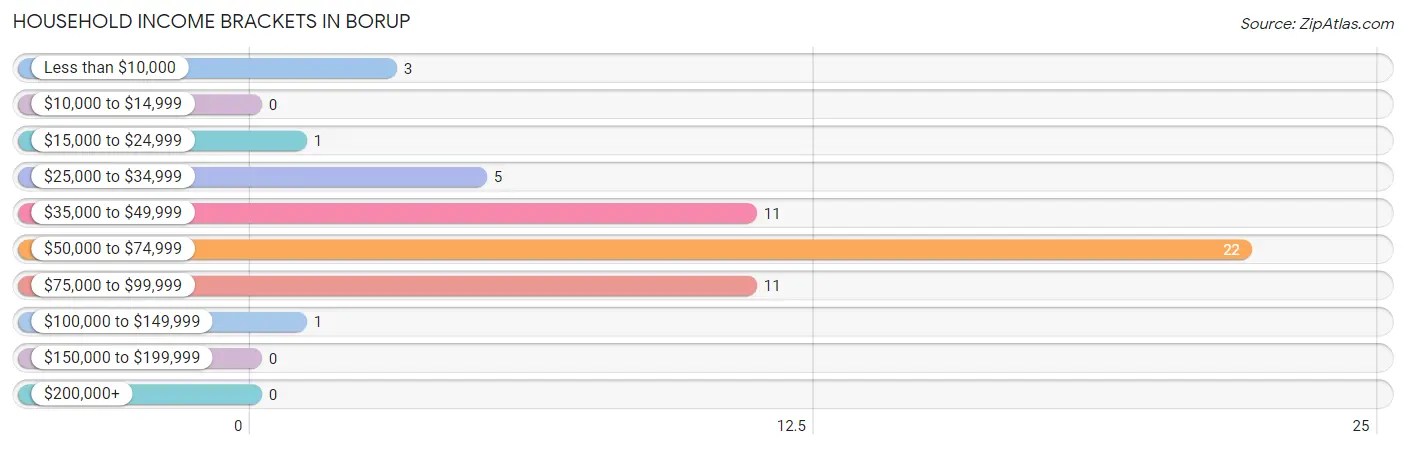
| Income Bracket | # Households | % Households |
| Less than $10,000 | 3 | 5.6% |
| $10,000 to $14,999 | 0 | 0.0% |
| $15,000 to $24,999 | 1 | 1.9% |
| $25,000 to $34,999 | 5 | 9.3% |
| $35,000 to $49,999 | 11 | 20.4% |
| $50,000 to $74,999 | 22 | 40.7% |
| $75,000 to $99,999 | 11 | 20.4% |
| $100,000 to $149,999 | 1 | 1.9% |
| $150,000 to $199,999 | 0 | 0.0% |
| $200,000+ | 0 | 0.0% |
Household Income by Householder Age in Borup
The median household income in Borup is $60,167, with the highest median household income of $80,556 found in the 45 to 64 years age bracket for the primary householder. A total of 18 households (33.3%) fall into this category.
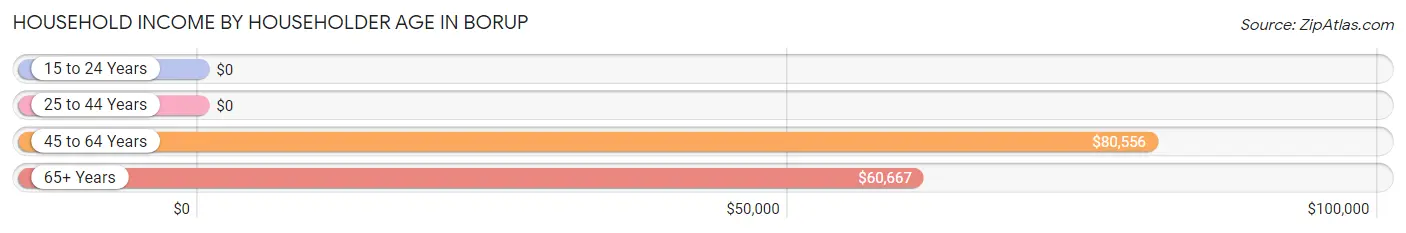
| Income Bracket | # Households | Median Income |
| 15 to 24 Years | 0 (0.0%) | $0 |
| 25 to 44 Years | 10 (18.5%) | $0 |
| 45 to 64 Years | 18 (33.3%) | $80,556 |
| 65+ Years | 26 (48.1%) | $60,667 |
| Total | 54 (100.0%) | $60,167 |
Poverty in Borup
Income Below Poverty by Sex and Age in Borup
With 9.0% poverty level for males and 13.8% for females among the residents of Borup, under 5 year old males and 6 to 11 year old females are the most vulnerable to poverty, with 2 males (100.0%) and 2 females (100.0%) in their respective age groups living below the poverty level.
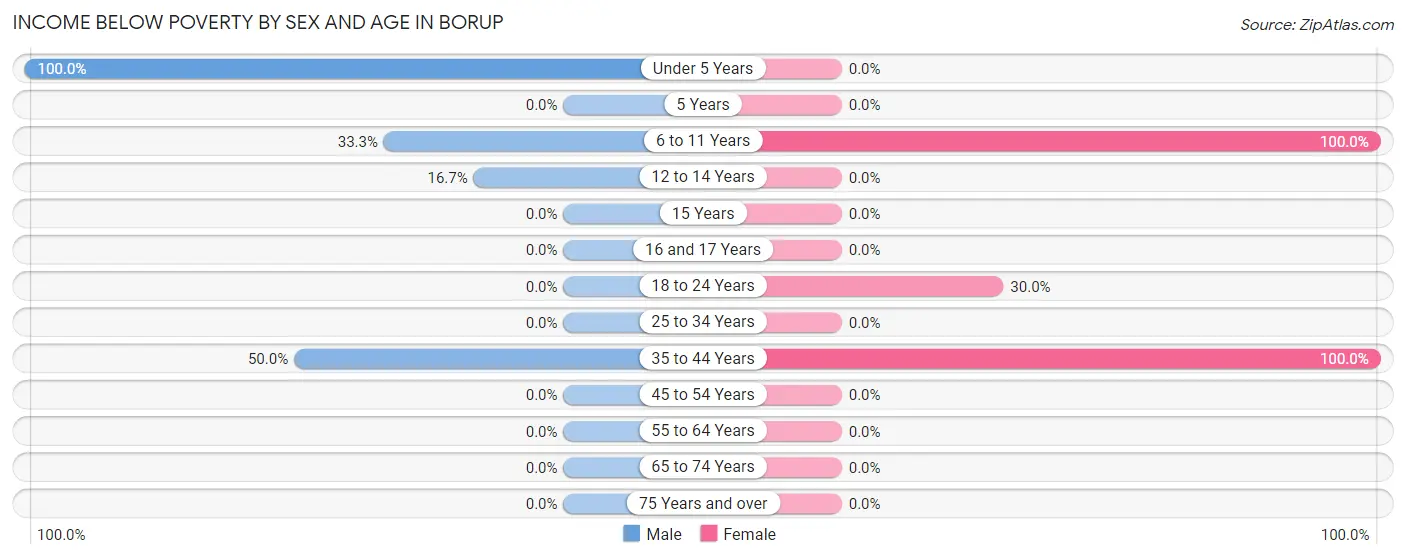
| Age Bracket | Male | Female |
| Under 5 Years | 2 (100.0%) | 0 (0.0%) |
| 5 Years | 0 (0.0%) | 0 (0.0%) |
| 6 to 11 Years | 2 (33.3%) | 2 (100.0%) |
| 12 to 14 Years | 1 (16.7%) | 0 (0.0%) |
| 15 Years | 0 (0.0%) | 0 (0.0%) |
| 16 and 17 Years | 0 (0.0%) | 0 (0.0%) |
| 18 to 24 Years | 0 (0.0%) | 6 (30.0%) |
| 25 to 34 Years | 0 (0.0%) | 0 (0.0%) |
| 35 to 44 Years | 1 (50.0%) | 4 (100.0%) |
| 45 to 54 Years | 0 (0.0%) | 0 (0.0%) |
| 55 to 64 Years | 0 (0.0%) | 0 (0.0%) |
| 65 to 74 Years | 0 (0.0%) | 0 (0.0%) |
| 75 Years and over | 0 (0.0%) | 0 (0.0%) |
| Total | 6 (9.0%) | 12 (13.8%) |
Income Above Poverty by Sex and Age in Borup
According to the poverty statistics in Borup, males aged 25 to 34 years and females aged 12 to 14 years are the age groups that are most secure financially, with 100.0% of males and 100.0% of females in these age groups living above the poverty line.
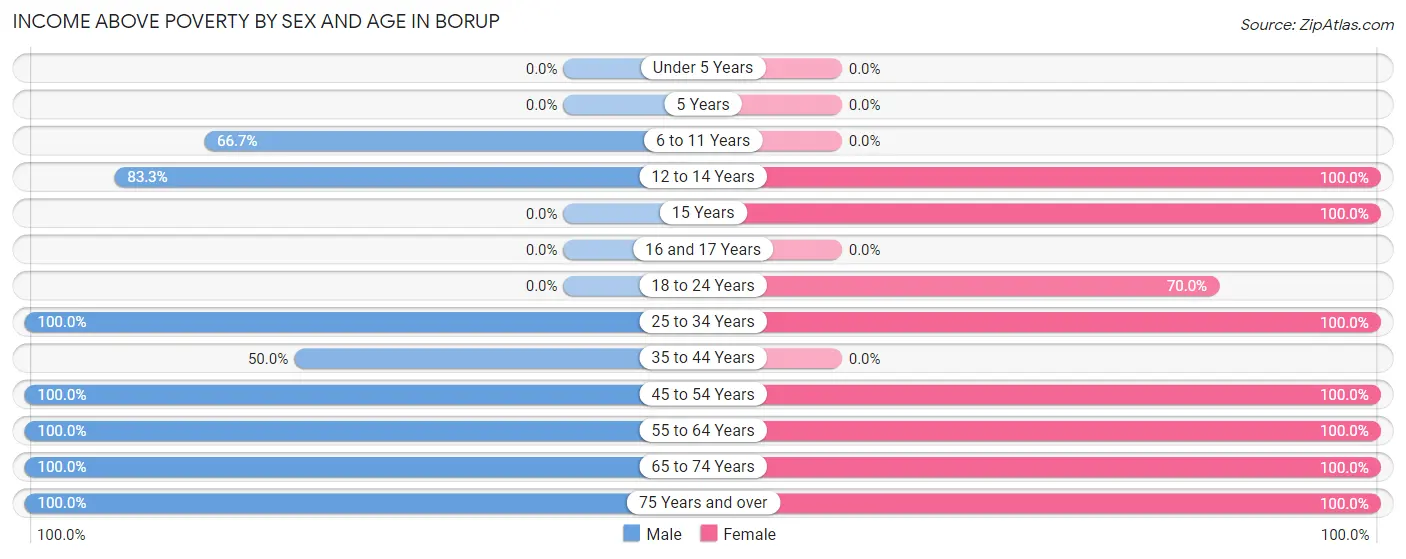
| Age Bracket | Male | Female |
| Under 5 Years | 0 (0.0%) | 0 (0.0%) |
| 5 Years | 0 (0.0%) | 0 (0.0%) |
| 6 to 11 Years | 4 (66.7%) | 0 (0.0%) |
| 12 to 14 Years | 5 (83.3%) | 7 (100.0%) |
| 15 Years | 0 (0.0%) | 13 (100.0%) |
| 16 and 17 Years | 0 (0.0%) | 0 (0.0%) |
| 18 to 24 Years | 0 (0.0%) | 14 (70.0%) |
| 25 to 34 Years | 9 (100.0%) | 2 (100.0%) |
| 35 to 44 Years | 1 (50.0%) | 0 (0.0%) |
| 45 to 54 Years | 1 (100.0%) | 2 (100.0%) |
| 55 to 64 Years | 15 (100.0%) | 16 (100.0%) |
| 65 to 74 Years | 21 (100.0%) | 16 (100.0%) |
| 75 Years and over | 5 (100.0%) | 5 (100.0%) |
| Total | 61 (91.0%) | 75 (86.2%) |
Income Below Poverty Among Married-Couple Families in Borup
The poverty statistics for married-couple families in Borup show that 2.1% or 1 of the total 48 families live below the poverty line. Families with 5 or more children have the highest poverty rate of 100.0%, comprising of 1 families. On the other hand, families with no children have the lowest poverty rate of 0.0%, which includes 0 families.
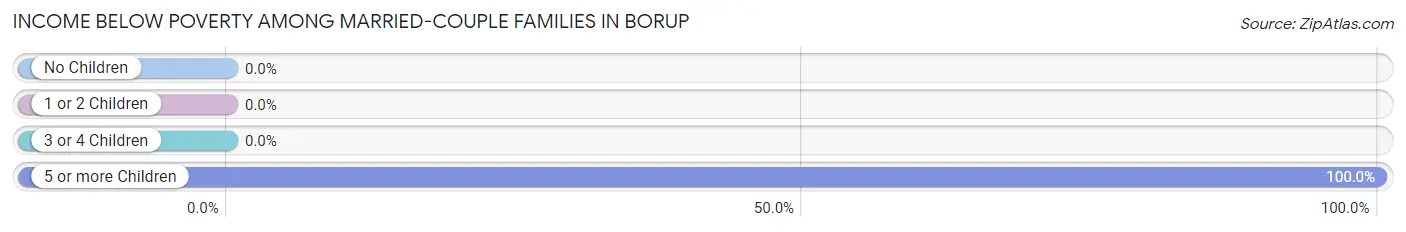
| Children | Above Poverty | Below Poverty |
| No Children | 42 (100.0%) | 0 (0.0%) |
| 1 or 2 Children | 0 (0.0%) | 0 (0.0%) |
| 3 or 4 Children | 5 (100.0%) | 0 (0.0%) |
| 5 or more Children | 0 (0.0%) | 1 (100.0%) |
| Total | 47 (97.9%) | 1 (2.1%) |
Income Below Poverty Among Single-Parent Households in Borup
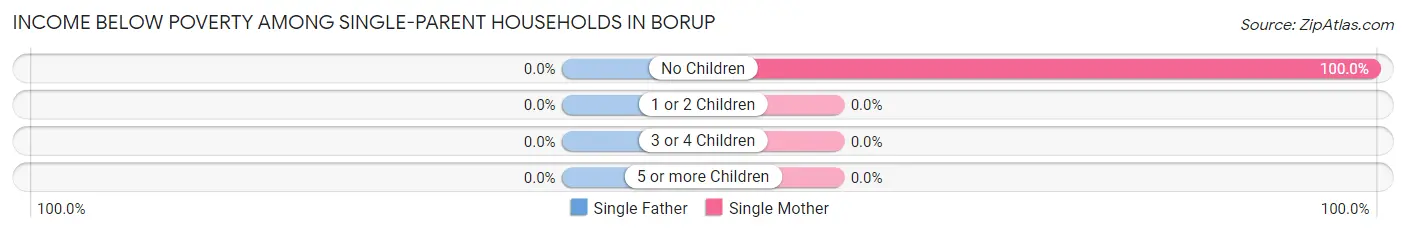
| Children | Single Father | Single Mother |
| No Children | 0 (0.0%) | 3 (100.0%) |
| 1 or 2 Children | 0 (0.0%) | 0 (0.0%) |
| 3 or 4 Children | 0 (0.0%) | 0 (0.0%) |
| 5 or more Children | 0 (0.0%) | 0 (0.0%) |
| Total | 0 (0.0%) | 3 (60.0%) |
Income Below Poverty Among Married-Couple vs Single-Parent Households in Borup
The poverty data for Borup shows that 1 of the married-couple family households (2.1%) and 3 of the single-parent households (60.0%) are living below the poverty level. Within the married-couple family households, those with 5 or more children have the highest poverty rate, with 1 households (100.0%) falling below the poverty line. Among the single-parent households, those with no children have the highest poverty rate, with 3 household (100.0%) living below poverty.
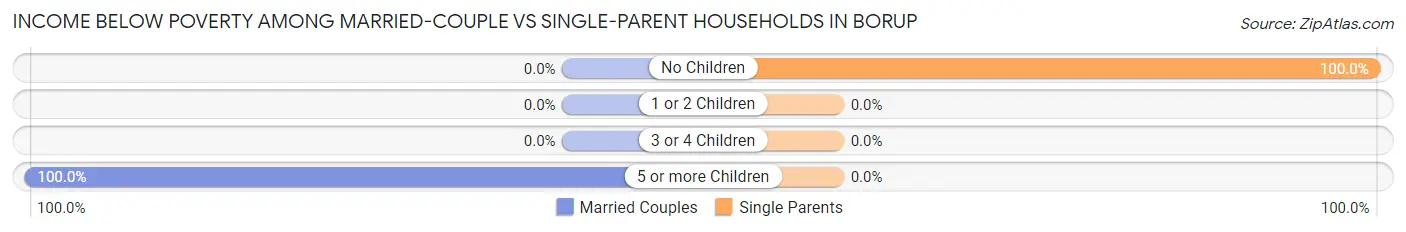
| Children | Married-Couple Families | Single-Parent Households |
| No Children | 0 (0.0%) | 3 (100.0%) |
| 1 or 2 Children | 0 (0.0%) | 0 (0.0%) |
| 3 or 4 Children | 0 (0.0%) | 0 (0.0%) |
| 5 or more Children | 1 (100.0%) | 0 (0.0%) |
| Total | 1 (2.1%) | 3 (60.0%) |
Race in Borup
The most populous races in Borup are White / Caucasian (104 | 67.5%), Two or more Races (50 | 32.5%), and Hispanic or Latino (39 | 25.3%).
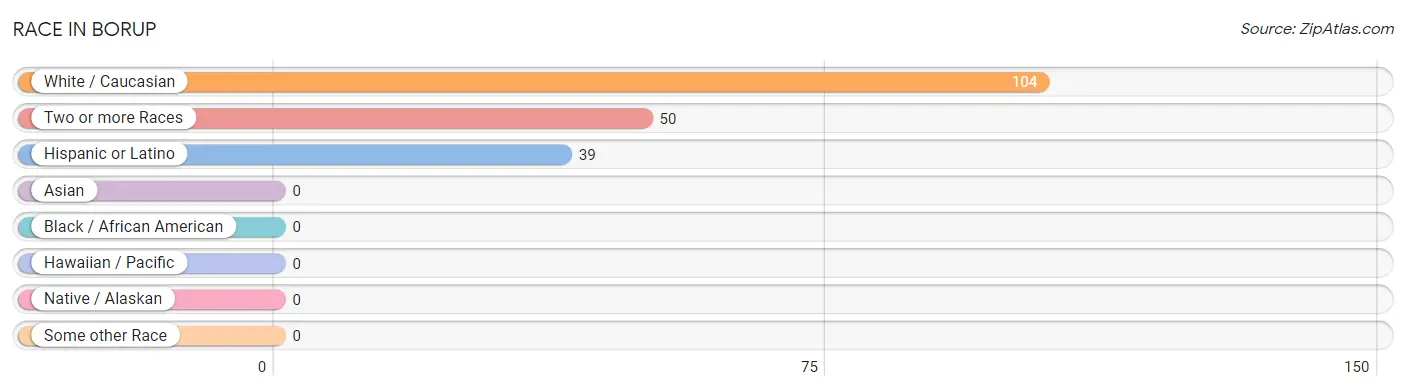
| Race | # Population | % Population |
| Asian | 0 | 0.0% |
| Black / African American | 0 | 0.0% |
| Hawaiian / Pacific | 0 | 0.0% |
| Hispanic or Latino | 39 | 25.3% |
| Native / Alaskan | 0 | 0.0% |
| White / Caucasian | 104 | 67.5% |
| Two or more Races | 50 | 32.5% |
| Some other Race | 0 | 0.0% |
| Total | 154 | 100.0% |
Ancestry in Borup
The most populous ancestries reported in Borup are German (69 | 44.8%), Norwegian (66 | 42.9%), Mexican (39 | 25.3%), Sioux (29 | 18.8%), and Dutch (15 | 9.7%), together accounting for 141.6% of all Borup residents.
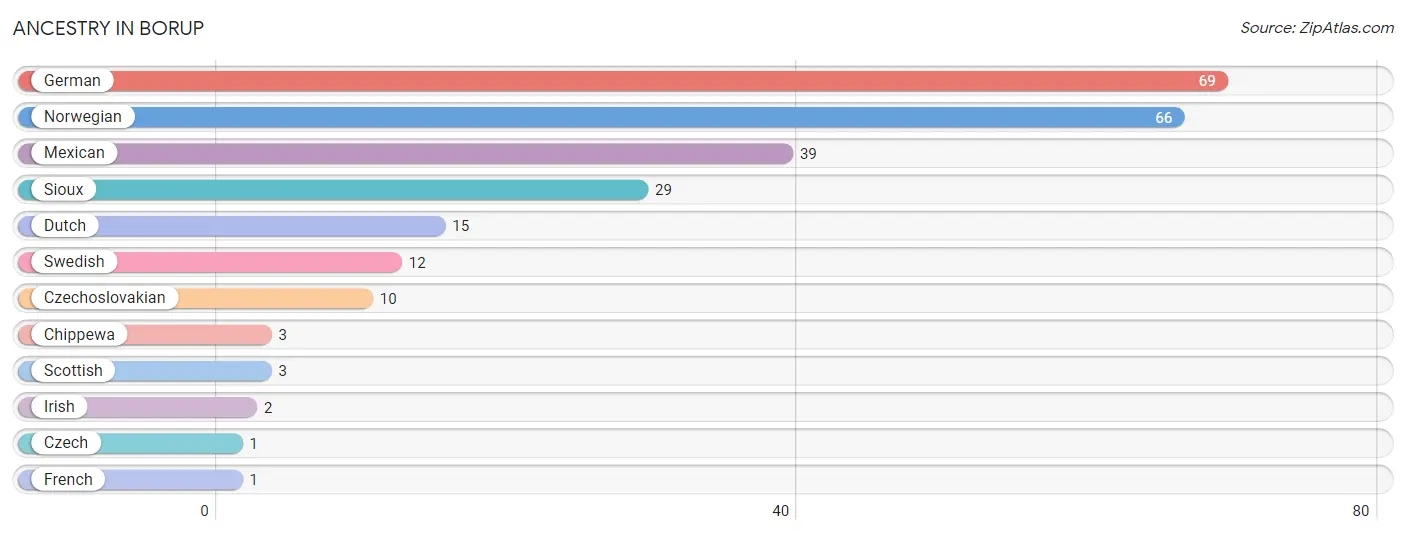
| Ancestry | # Population | % Population |
| Chippewa | 3 | 1.9% |
| Czech | 1 | 0.6% |
| Czechoslovakian | 10 | 6.5% |
| Dutch | 15 | 9.7% |
| French | 1 | 0.6% |
| German | 69 | 44.8% |
| Irish | 2 | 1.3% |
| Mexican | 39 | 25.3% |
| Norwegian | 66 | 42.9% |
| Scottish | 3 | 1.9% |
| Sioux | 29 | 18.8% |
| Swedish | 12 | 7.8% | View All 12 Rows |
Immigrants in Borup

| Immigration Origin | # Population | % Population | View All 0 Rows |
Sex and Age in Borup
Sex and Age in Borup
The most populous age groups in Borup are 70 to 74 Years (20 | 29.8%) for men and 15 to 19 Years (19 | 21.8%) for women.
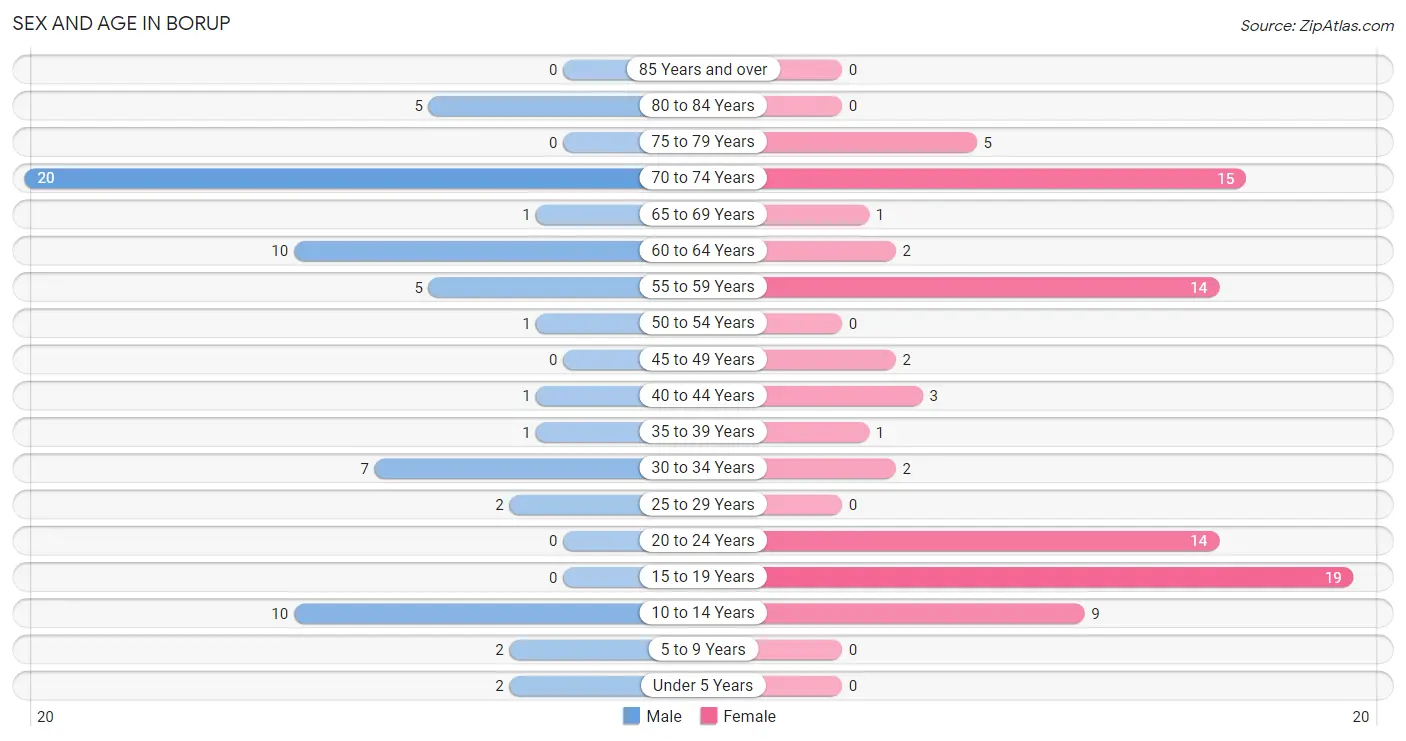
| Age Bracket | Male | Female |
| Under 5 Years | 2 (3.0%) | 0 (0.0%) |
| 5 to 9 Years | 2 (3.0%) | 0 (0.0%) |
| 10 to 14 Years | 10 (14.9%) | 9 (10.3%) |
| 15 to 19 Years | 0 (0.0%) | 19 (21.8%) |
| 20 to 24 Years | 0 (0.0%) | 14 (16.1%) |
| 25 to 29 Years | 2 (3.0%) | 0 (0.0%) |
| 30 to 34 Years | 7 (10.4%) | 2 (2.3%) |
| 35 to 39 Years | 1 (1.5%) | 1 (1.1%) |
| 40 to 44 Years | 1 (1.5%) | 3 (3.5%) |
| 45 to 49 Years | 0 (0.0%) | 2 (2.3%) |
| 50 to 54 Years | 1 (1.5%) | 0 (0.0%) |
| 55 to 59 Years | 5 (7.5%) | 14 (16.1%) |
| 60 to 64 Years | 10 (14.9%) | 2 (2.3%) |
| 65 to 69 Years | 1 (1.5%) | 1 (1.1%) |
| 70 to 74 Years | 20 (29.8%) | 15 (17.2%) |
| 75 to 79 Years | 0 (0.0%) | 5 (5.8%) |
| 80 to 84 Years | 5 (7.5%) | 0 (0.0%) |
| 85 Years and over | 0 (0.0%) | 0 (0.0%) |
| Total | 67 (100.0%) | 87 (100.0%) |
Families and Households in Borup
Median Family Size in Borup
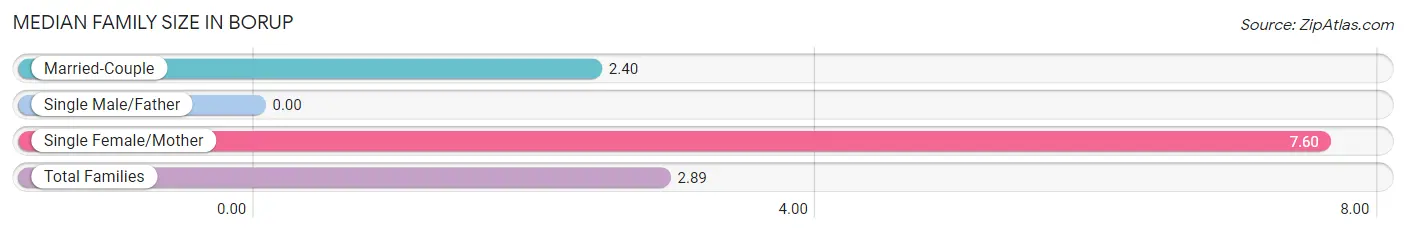
| Family Type | # Families | Family Size |
| Married-Couple | 48 (90.6%) | 2.40 |
| Single Male/Father | 0 (0.0%) | - |
| Single Female/Mother | 5 (9.4%) | 7.60 |
| Total Families | 53 (100.0%) | 2.89 |
Median Household Size in Borup
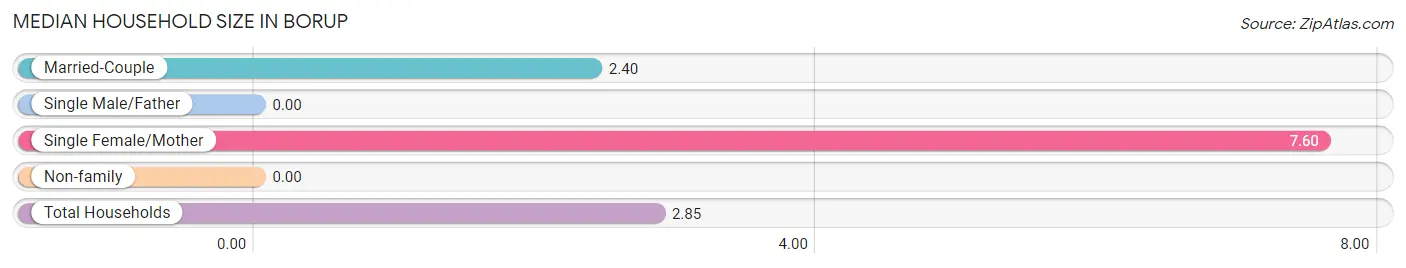
| Household Type | # Households | Household Size |
| Married-Couple | 48 (88.9%) | 2.40 |
| Single Male/Father | 0 (0.0%) | - |
| Single Female/Mother | 5 (9.3%) | 7.60 |
| Non-family | 1 (1.8%) | - |
| Total Households | 54 (100.0%) | 2.85 |
Household Size by Marriage Status in Borup
Out of a total of 54 households in Borup, 53 (98.2%) are family households, while 1 (1.8%) are nonfamily households. The most numerous type of family households are 2-person households, comprising 40, and the most common type of nonfamily households are 1-person households, comprising 1.
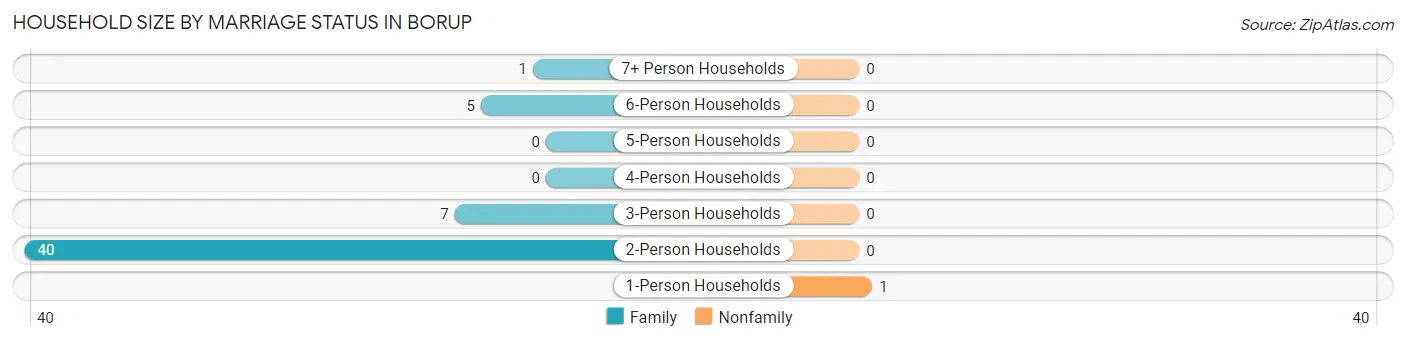
| Household Size | Family Households | Nonfamily Households |
| 1-Person Households | - | 1 (1.8%) |
| 2-Person Households | 40 (74.1%) | 0 (0.0%) |
| 3-Person Households | 7 (13.0%) | 0 (0.0%) |
| 4-Person Households | 0 (0.0%) | 0 (0.0%) |
| 5-Person Households | 0 (0.0%) | 0 (0.0%) |
| 6-Person Households | 5 (9.3%) | 0 (0.0%) |
| 7+ Person Households | 1 (1.8%) | 0 (0.0%) |
| Total | 53 (98.2%) | 1 (1.8%) |
Female Fertility in Borup
Fertility by Age in Borup
| Age Bracket | Women with Births | Births / 1,000 Women |
| 15 to 19 years | 0 (0.0%) | 0.0 |
| 20 to 34 years | 0 (0.0%) | 0.0 |
| 35 to 50 years | 0 (0.0%) | 0.0 |
| Total | 0 (0.0%) | 0.0 |
Fertility by Age by Marriage Status in Borup
| Age Bracket | Married | Unmarried |
| 15 to 19 years | 0 (0.0%) | 0 (0.0%) |
| 20 to 34 years | 0 (0.0%) | 0 (0.0%) |
| 35 to 50 years | 0 (0.0%) | 0 (0.0%) |
| Total | 0 (0.0%) | 0 (0.0%) |
Fertility by Education in Borup
| Educational Attainment | Women with Births | Births / 1,000 Women |
| Less than High School | 0 (0.0%) | 0.0 |
| High School Diploma | 0 (0.0%) | 0.0 |
| College or Associate's Degree | 0 (0.0%) | 0.0 |
| Bachelor's Degree | 0 (0.0%) | 0.0 |
| Graduate Degree | 0 (0.0%) | 0.0 |
| Total | 0 (0.0%) | 0.0 |
Fertility by Education by Marriage Status in Borup
| Educational Attainment | Married | Unmarried |
| Less than High School | 0 (0.0%) | 0 (0.0%) |
| High School Diploma | 0 (0.0%) | 0 (0.0%) |
| College or Associate's Degree | 0 (0.0%) | 0 (0.0%) |
| Bachelor's Degree | 0 (0.0%) | 0 (0.0%) |
| Graduate Degree | 0 (0.0%) | 0 (0.0%) |
| Total | 0 (0.0%) | 0 (0.0%) |
Employment Characteristics in Borup
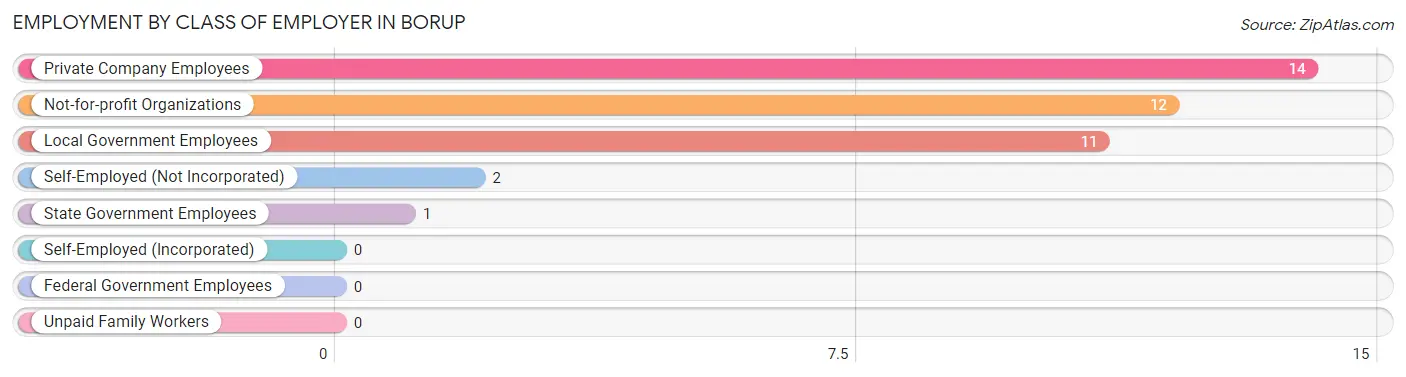
Employment by Class of Employer in Borup
Among the 40 employed individuals in Borup, private company employees (14 | 35.0%), not-for-profit organizations (12 | 30.0%), and local government employees (11 | 27.5%) make up the most common classes of employment.
| Employer Class | # Employees | % Employees |
| Private Company Employees | 14 | 35.0% |
| Self-Employed (Incorporated) | 0 | 0.0% |
| Self-Employed (Not Incorporated) | 2 | 5.0% |
| Not-for-profit Organizations | 12 | 30.0% |
| Local Government Employees | 11 | 27.5% |
| State Government Employees | 1 | 2.5% |
| Federal Government Employees | 0 | 0.0% |
| Unpaid Family Workers | 0 | 0.0% |
| Total | 40 | 100.0% |
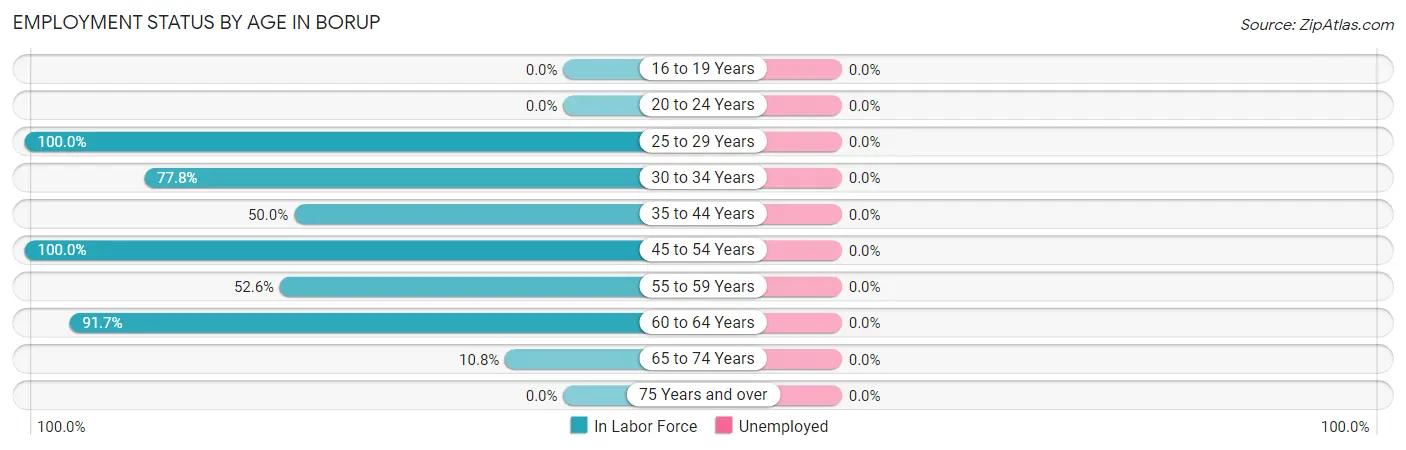
Employment Status by Age in Borup
| Age Bracket | In Labor Force | Unemployed |
| 16 to 19 Years | 0 (0.0%) | 0 (0.0%) |
| 20 to 24 Years | 0 (0.0%) | 0 (0.0%) |
| 25 to 29 Years | 2 (100.0%) | 0 (0.0%) |
| 30 to 34 Years | 7 (77.8%) | 0 (0.0%) |
| 35 to 44 Years | 3 (50.0%) | 0 (0.0%) |
| 45 to 54 Years | 3 (100.0%) | 0 (0.0%) |
| 55 to 59 Years | 10 (52.6%) | 0 (0.0%) |
| 60 to 64 Years | 11 (91.7%) | 0 (0.0%) |
| 65 to 74 Years | 4 (10.8%) | 0 (0.0%) |
| 75 Years and over | 0 (0.0%) | 0 (0.0%) |
| Total | 40 (33.9%) | 0 (0.0%) |
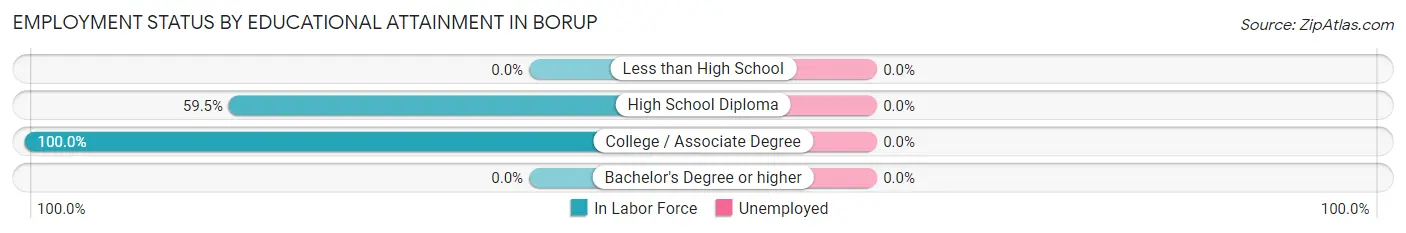
Employment Status by Educational Attainment in Borup
| Educational Attainment | In Labor Force | Unemployed |
| Less than High School | 0 (0.0%) | 0 (0.0%) |
| High School Diploma | 22 (59.5%) | 0 (0.0%) |
| College / Associate Degree | 14 (100.0%) | 0 (0.0%) |
| Bachelor's Degree or higher | 0 (0.0%) | 0 (0.0%) |
| Total | 36 (70.6%) | 0 (0.0%) |
Employment Occupations by Sex in Borup
Management, Business, Science and Arts Occupations
The most common Management, Business, Science and Arts occupations in Borup are Community & Social Service (13 | 32.5%), Education Instruction & Library (11 | 27.5%), Business & Financial (2 | 5.0%), Education, Arts & Media (2 | 5.0%), and Management (1 | 2.5%).
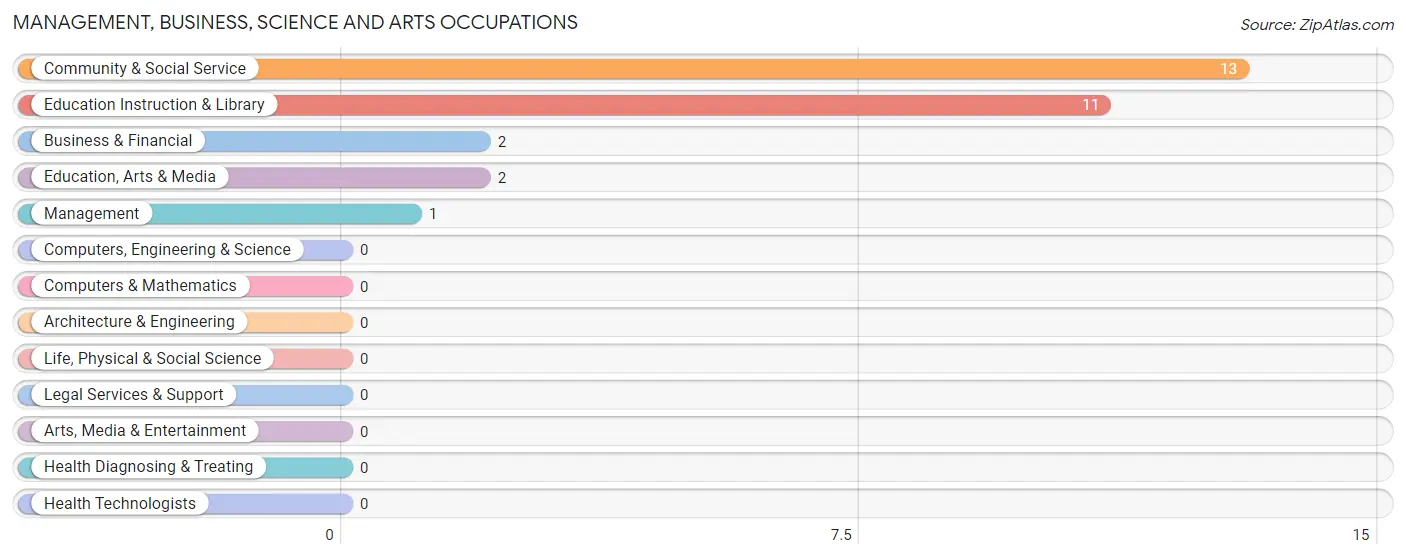
Management, Business, Science and Arts Occupations by Sex
Within the Management, Business, Science and Arts occupations in Borup, the most male-oriented occupations are Management (100.0%), and Business & Financial (50.0%), while the most female-oriented occupations are Community & Social Service (100.0%), Education, Arts & Media (100.0%), and Education Instruction & Library (100.0%).
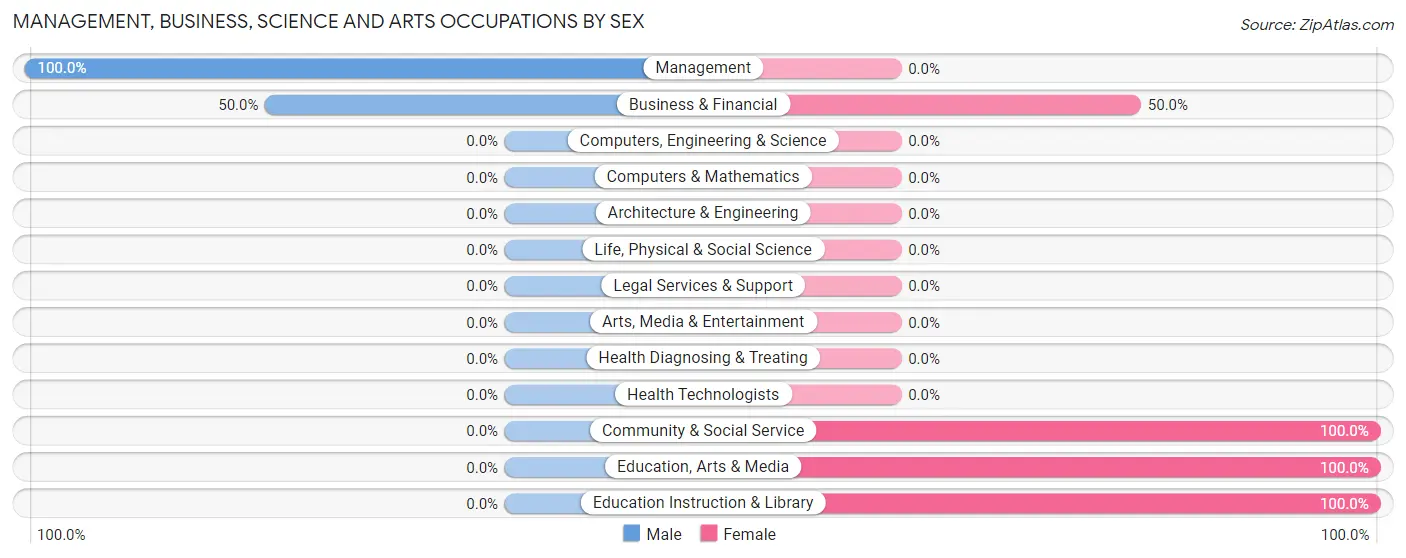
| Occupation | Male | Female |
| Management | 1 (100.0%) | 0 (0.0%) |
| Business & Financial | 1 (50.0%) | 1 (50.0%) |
| Computers, Engineering & Science | 0 (0.0%) | 0 (0.0%) |
| Computers & Mathematics | 0 (0.0%) | 0 (0.0%) |
| Architecture & Engineering | 0 (0.0%) | 0 (0.0%) |
| Life, Physical & Social Science | 0 (0.0%) | 0 (0.0%) |
| Community & Social Service | 0 (0.0%) | 13 (100.0%) |
| Education, Arts & Media | 0 (0.0%) | 2 (100.0%) |
| Legal Services & Support | 0 (0.0%) | 0 (0.0%) |
| Education Instruction & Library | 0 (0.0%) | 11 (100.0%) |
| Arts, Media & Entertainment | 0 (0.0%) | 0 (0.0%) |
| Health Diagnosing & Treating | 0 (0.0%) | 0 (0.0%) |
| Health Technologists | 0 (0.0%) | 0 (0.0%) |
| Total (Category) | 2 (12.5%) | 14 (87.5%) |
| Total (Overall) | 21 (52.5%) | 19 (47.5%) |
Services Occupations
Services Occupations by Sex
| Occupation | Male | Female |
| Healthcare Support | 0 (0.0%) | 0 (0.0%) |
| Security & Protection | 0 (0.0%) | 0 (0.0%) |
| Firefighting & Prevention | 0 (0.0%) | 0 (0.0%) |
| Law Enforcement | 0 (0.0%) | 0 (0.0%) |
| Food Preparation & Serving | 0 (0.0%) | 0 (0.0%) |
| Cleaning & Maintenance | 0 (0.0%) | 0 (0.0%) |
| Personal Care & Service | 0 (0.0%) | 0 (0.0%) |
| Total (Category) | 0 (0.0%) | 0 (0.0%) |
| Total (Overall) | 21 (52.5%) | 19 (47.5%) |
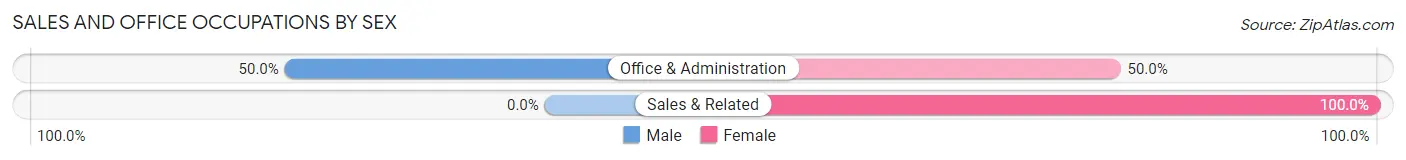
Sales and Office Occupations
The most common Sales and Office occupations in Borup are Sales & Related (4 | 10.0%), and Office & Administration (2 | 5.0%).
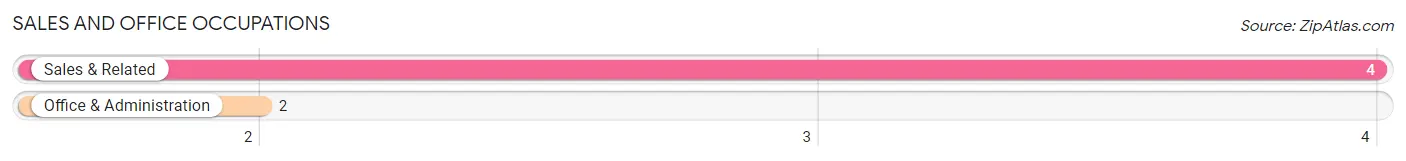
Sales and Office Occupations by Sex
| Occupation | Male | Female |
| Sales & Related | 0 (0.0%) | 4 (100.0%) |
| Office & Administration | 1 (50.0%) | 1 (50.0%) |
| Total (Category) | 1 (16.7%) | 5 (83.3%) |
| Total (Overall) | 21 (52.5%) | 19 (47.5%) |
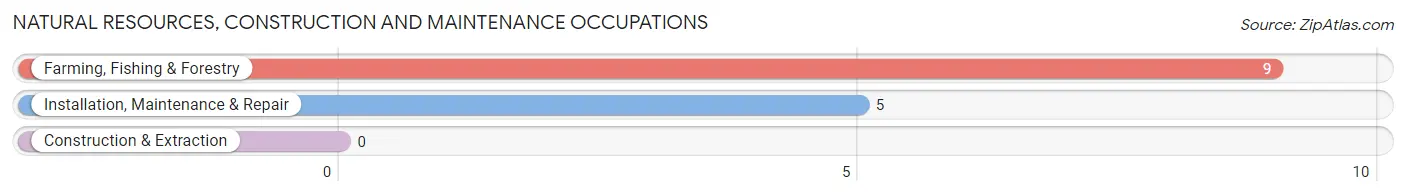
Natural Resources, Construction and Maintenance Occupations
The most common Natural Resources, Construction and Maintenance occupations in Borup are Farming, Fishing & Forestry (9 | 22.5%), and Installation, Maintenance & Repair (5 | 12.5%).
Natural Resources, Construction and Maintenance Occupations by Sex
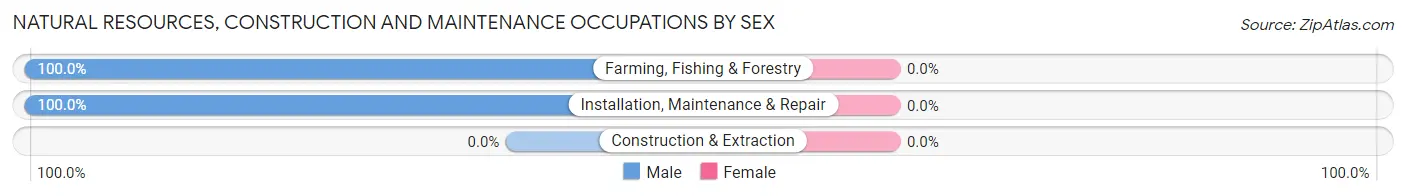
| Occupation | Male | Female |
| Farming, Fishing & Forestry | 9 (100.0%) | 0 (0.0%) |
| Construction & Extraction | 0 (0.0%) | 0 (0.0%) |
| Installation, Maintenance & Repair | 5 (100.0%) | 0 (0.0%) |
| Total (Category) | 14 (100.0%) | 0 (0.0%) |
| Total (Overall) | 21 (52.5%) | 19 (47.5%) |
Production, Transportation and Moving Occupations
The most common Production, Transportation and Moving occupations in Borup are Material Moving (3 | 7.5%), and Transportation (1 | 2.5%).
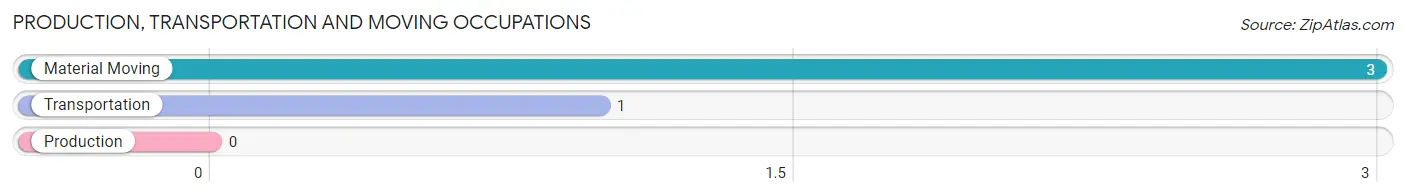
Production, Transportation and Moving Occupations by Sex
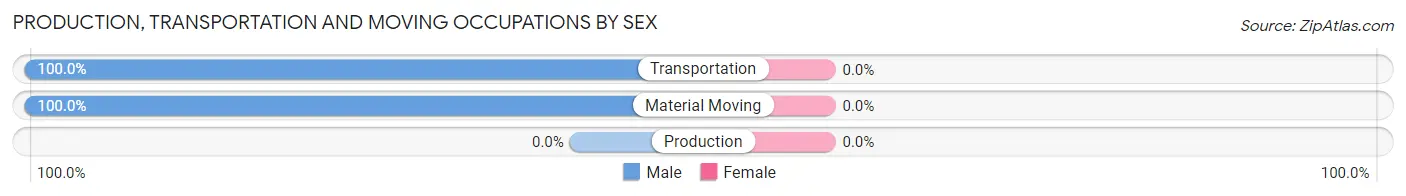
| Occupation | Male | Female |
| Production | 0 (0.0%) | 0 (0.0%) |
| Transportation | 1 (100.0%) | 0 (0.0%) |
| Material Moving | 3 (100.0%) | 0 (0.0%) |
| Total (Category) | 4 (100.0%) | 0 (0.0%) |
| Total (Overall) | 21 (52.5%) | 19 (47.5%) |
Employment Industries by Sex in Borup
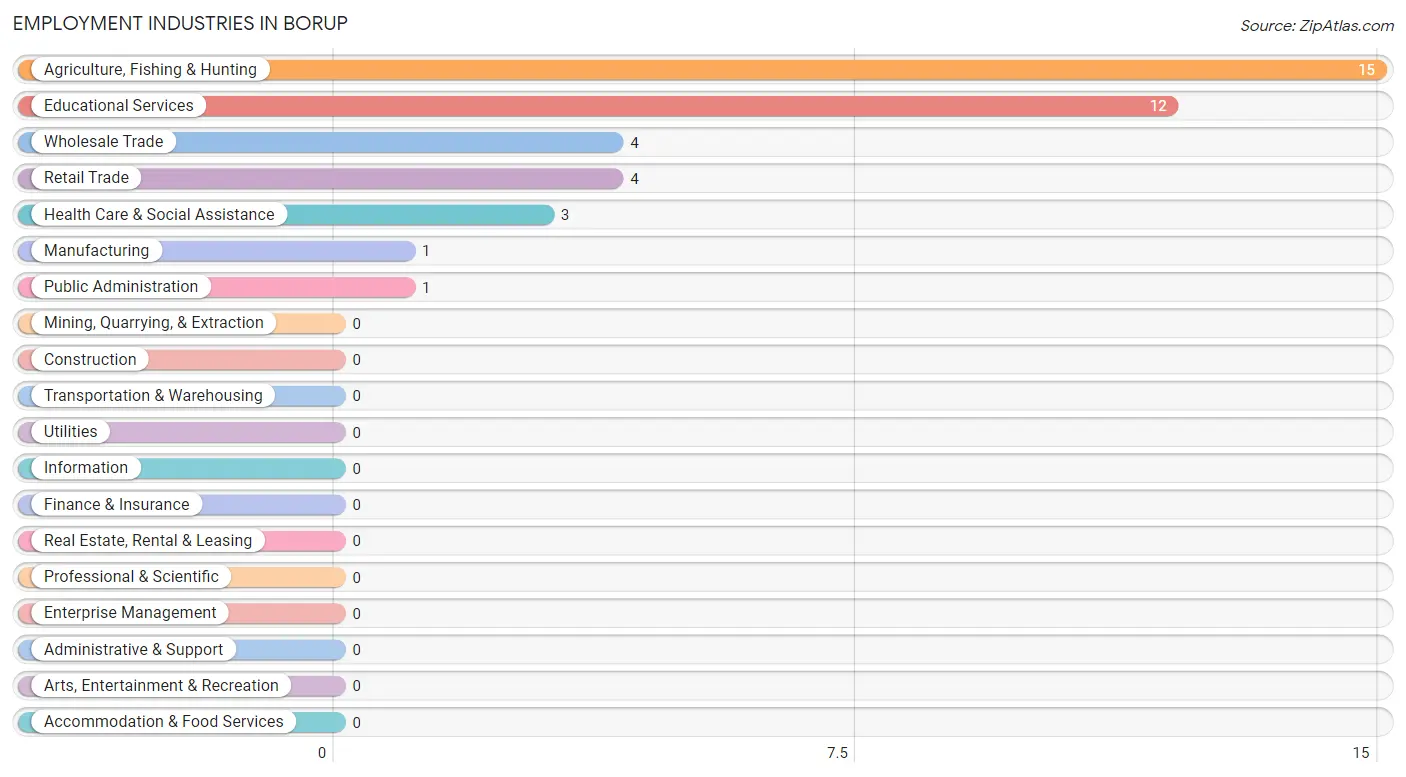
Employment Industries in Borup
The major employment industries in Borup include Agriculture, Fishing & Hunting (15 | 37.5%), Educational Services (12 | 30.0%), Wholesale Trade (4 | 10.0%), Retail Trade (4 | 10.0%), and Health Care & Social Assistance (3 | 7.5%).
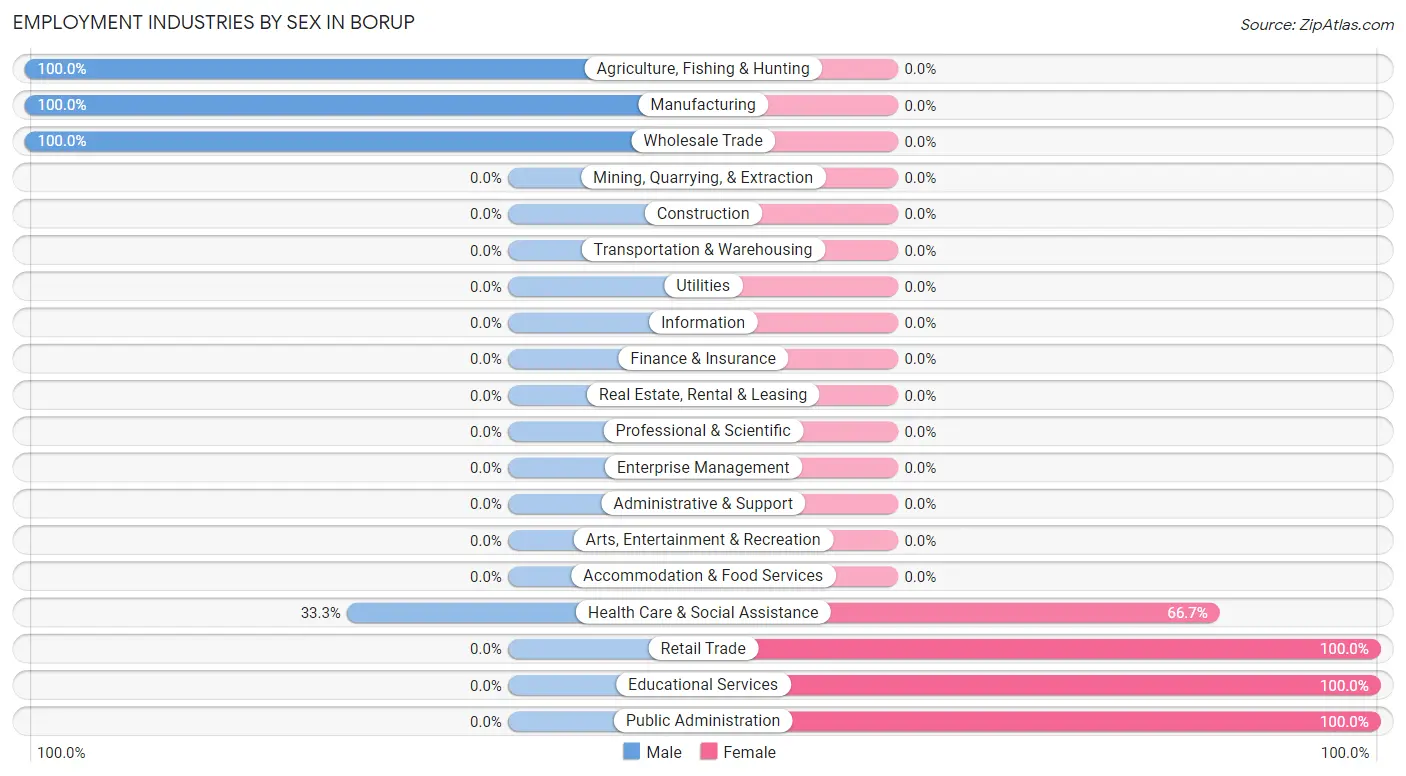
Employment Industries by Sex in Borup
The Borup industries that see more men than women are Agriculture, Fishing & Hunting (100.0%), Manufacturing (100.0%), and Wholesale Trade (100.0%), whereas the industries that tend to have a higher number of women are Retail Trade (100.0%), Educational Services (100.0%), and Public Administration (100.0%).
| Industry | Male | Female |
| Agriculture, Fishing & Hunting | 15 (100.0%) | 0 (0.0%) |
| Mining, Quarrying, & Extraction | 0 (0.0%) | 0 (0.0%) |
| Construction | 0 (0.0%) | 0 (0.0%) |
| Manufacturing | 1 (100.0%) | 0 (0.0%) |
| Wholesale Trade | 4 (100.0%) | 0 (0.0%) |
| Retail Trade | 0 (0.0%) | 4 (100.0%) |
| Transportation & Warehousing | 0 (0.0%) | 0 (0.0%) |
| Utilities | 0 (0.0%) | 0 (0.0%) |
| Information | 0 (0.0%) | 0 (0.0%) |
| Finance & Insurance | 0 (0.0%) | 0 (0.0%) |
| Real Estate, Rental & Leasing | 0 (0.0%) | 0 (0.0%) |
| Professional & Scientific | 0 (0.0%) | 0 (0.0%) |
| Enterprise Management | 0 (0.0%) | 0 (0.0%) |
| Administrative & Support | 0 (0.0%) | 0 (0.0%) |
| Educational Services | 0 (0.0%) | 12 (100.0%) |
| Health Care & Social Assistance | 1 (33.3%) | 2 (66.7%) |
| Arts, Entertainment & Recreation | 0 (0.0%) | 0 (0.0%) |
| Accommodation & Food Services | 0 (0.0%) | 0 (0.0%) |
| Public Administration | 0 (0.0%) | 1 (100.0%) |
| Total | 21 (52.5%) | 19 (47.5%) |
Education in Borup
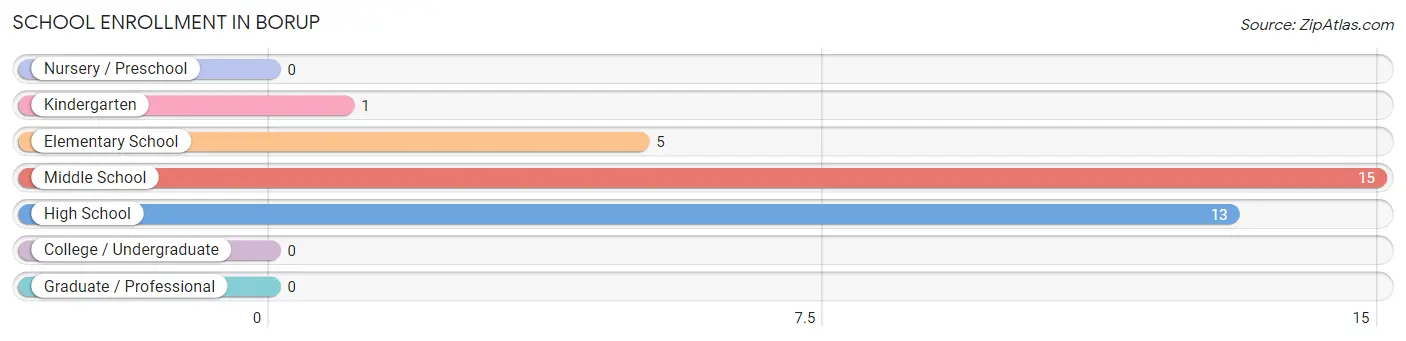
School Enrollment in Borup
The most common levels of schooling among the 34 students in Borup are middle school (15 | 44.1%), high school (13 | 38.2%), and elementary school (5 | 14.7%).
| School Level | # Students | % Students |
| Nursery / Preschool | 0 | 0.0% |
| Kindergarten | 1 | 2.9% |
| Elementary School | 5 | 14.7% |
| Middle School | 15 | 44.1% |
| High School | 13 | 38.2% |
| College / Undergraduate | 0 | 0.0% |
| Graduate / Professional | 0 | 0.0% |
| Total | 34 | 100.0% |
School Enrollment by Age by Funding Source in Borup
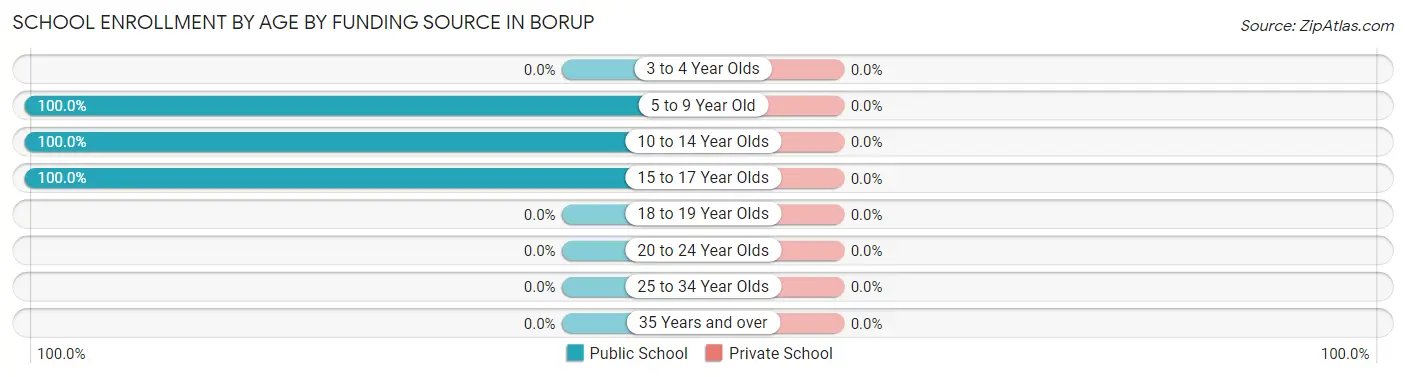
| Age Bracket | Public School | Private School |
| 3 to 4 Year Olds | 0 (0.0%) | 0 (0.0%) |
| 5 to 9 Year Old | 2 (100.0%) | 0 (0.0%) |
| 10 to 14 Year Olds | 19 (100.0%) | 0 (0.0%) |
| 15 to 17 Year Olds | 13 (100.0%) | 0 (0.0%) |
| 18 to 19 Year Olds | 0 (0.0%) | 0 (0.0%) |
| 20 to 24 Year Olds | 0 (0.0%) | 0 (0.0%) |
| 25 to 34 Year Olds | 0 (0.0%) | 0 (0.0%) |
| 35 Years and over | 0 (0.0%) | 0 (0.0%) |
| Total | 34 (100.0%) | 0 (0.0%) |
Educational Attainment by Field of Study in Borup
, and science & technology (5 | 100.0%) are the most common fields of study among 5 individuals in Borup who have obtained a bachelor's degree or higher.
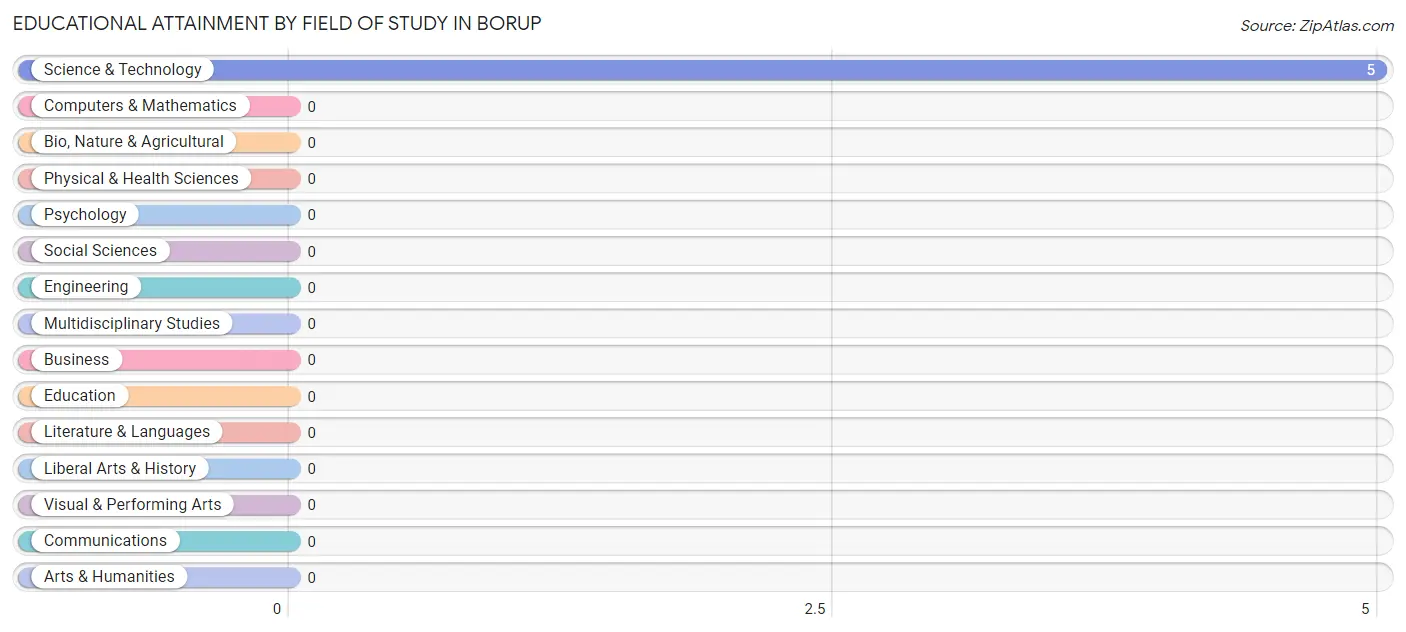
| Field of Study | # Graduates | % Graduates |
| Computers & Mathematics | 0 | 0.0% |
| Bio, Nature & Agricultural | 0 | 0.0% |
| Physical & Health Sciences | 0 | 0.0% |
| Psychology | 0 | 0.0% |
| Social Sciences | 0 | 0.0% |
| Engineering | 0 | 0.0% |
| Multidisciplinary Studies | 0 | 0.0% |
| Science & Technology | 5 | 100.0% |
| Business | 0 | 0.0% |
| Education | 0 | 0.0% |
| Literature & Languages | 0 | 0.0% |
| Liberal Arts & History | 0 | 0.0% |
| Visual & Performing Arts | 0 | 0.0% |
| Communications | 0 | 0.0% |
| Arts & Humanities | 0 | 0.0% |
| Total | 5 | 100.0% |
Transportation & Commute in Borup
Vehicle Availability by Sex in Borup
The most prevalent vehicle ownership categories in Borup are males with 3 vehicles (10, accounting for 47.6%) and females with 3 vehicles (12, making up 52.6%).
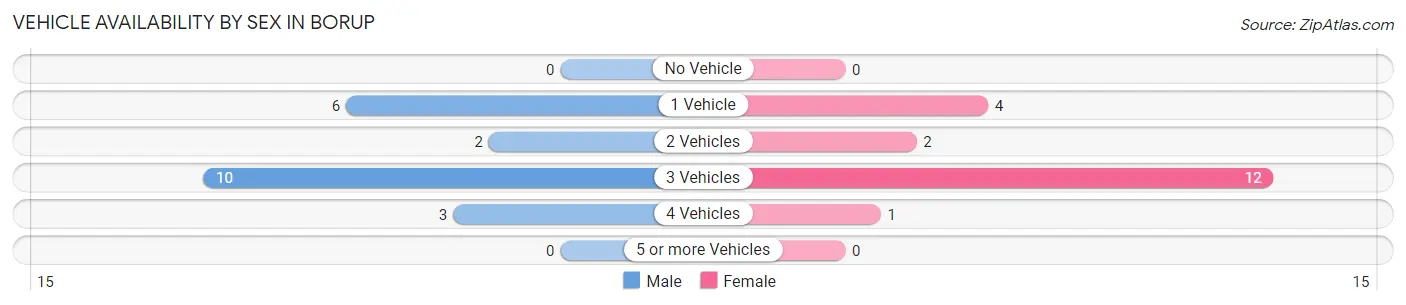
| Vehicles Available | Male | Female |
| No Vehicle | 0 (0.0%) | 0 (0.0%) |
| 1 Vehicle | 6 (28.6%) | 4 (21.0%) |
| 2 Vehicles | 2 (9.5%) | 2 (10.5%) |
| 3 Vehicles | 10 (47.6%) | 12 (63.2%) |
| 4 Vehicles | 3 (14.3%) | 1 (5.3%) |
| 5 or more Vehicles | 0 (0.0%) | 0 (0.0%) |
| Total | 21 (100.0%) | 19 (100.0%) |
Commute Time in Borup
The most frequently occuring commute durations in Borup are 15 to 19 minutes (21 commuters, 60.0%), 10 to 14 minutes (7 commuters, 20.0%), and less than 5 minutes (4 commuters, 11.4%).
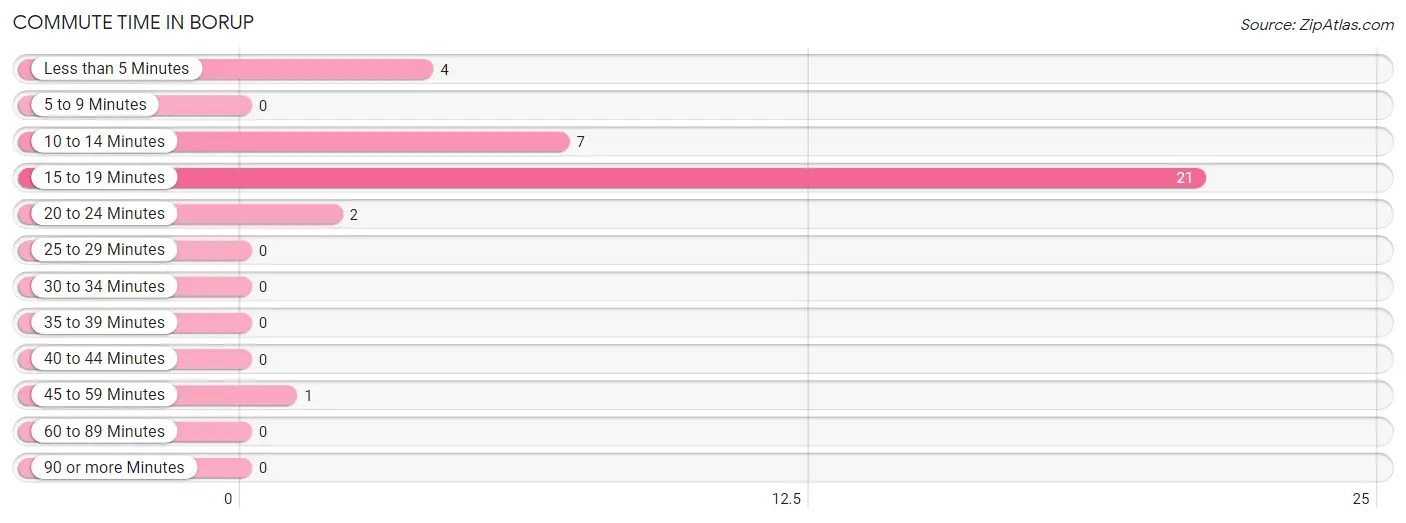
| Commute Time | # Commuters | % Commuters |
| Less than 5 Minutes | 4 | 11.4% |
| 5 to 9 Minutes | 0 | 0.0% |
| 10 to 14 Minutes | 7 | 20.0% |
| 15 to 19 Minutes | 21 | 60.0% |
| 20 to 24 Minutes | 2 | 5.7% |
| 25 to 29 Minutes | 0 | 0.0% |
| 30 to 34 Minutes | 0 | 0.0% |
| 35 to 39 Minutes | 0 | 0.0% |
| 40 to 44 Minutes | 0 | 0.0% |
| 45 to 59 Minutes | 1 | 2.9% |
| 60 to 89 Minutes | 0 | 0.0% |
| 90 or more Minutes | 0 | 0.0% |
Commute Time by Sex in Borup
The most common commute times in Borup are 15 to 19 minutes (10 commuters, 62.5%) for males and 15 to 19 minutes (11 commuters, 57.9%) for females.
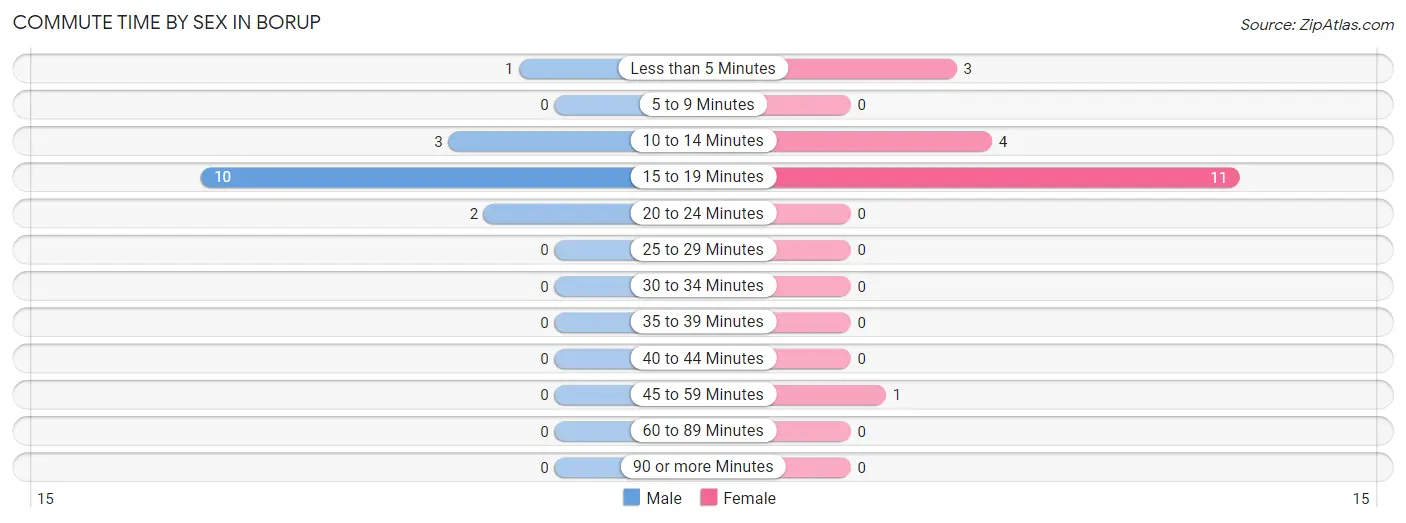
| Commute Time | Male | Female |
| Less than 5 Minutes | 1 (6.2%) | 3 (15.8%) |
| 5 to 9 Minutes | 0 (0.0%) | 0 (0.0%) |
| 10 to 14 Minutes | 3 (18.8%) | 4 (21.0%) |
| 15 to 19 Minutes | 10 (62.5%) | 11 (57.9%) |
| 20 to 24 Minutes | 2 (12.5%) | 0 (0.0%) |
| 25 to 29 Minutes | 0 (0.0%) | 0 (0.0%) |
| 30 to 34 Minutes | 0 (0.0%) | 0 (0.0%) |
| 35 to 39 Minutes | 0 (0.0%) | 0 (0.0%) |
| 40 to 44 Minutes | 0 (0.0%) | 0 (0.0%) |
| 45 to 59 Minutes | 0 (0.0%) | 1 (5.3%) |
| 60 to 89 Minutes | 0 (0.0%) | 0 (0.0%) |
| 90 or more Minutes | 0 (0.0%) | 0 (0.0%) |
Time of Departure to Work by Sex in Borup
The most frequent times of departure to work in Borup are 7:30 AM to 7:59 AM (9, 56.2%) for males and 7:00 AM to 7:29 AM (12, 63.2%) for females.
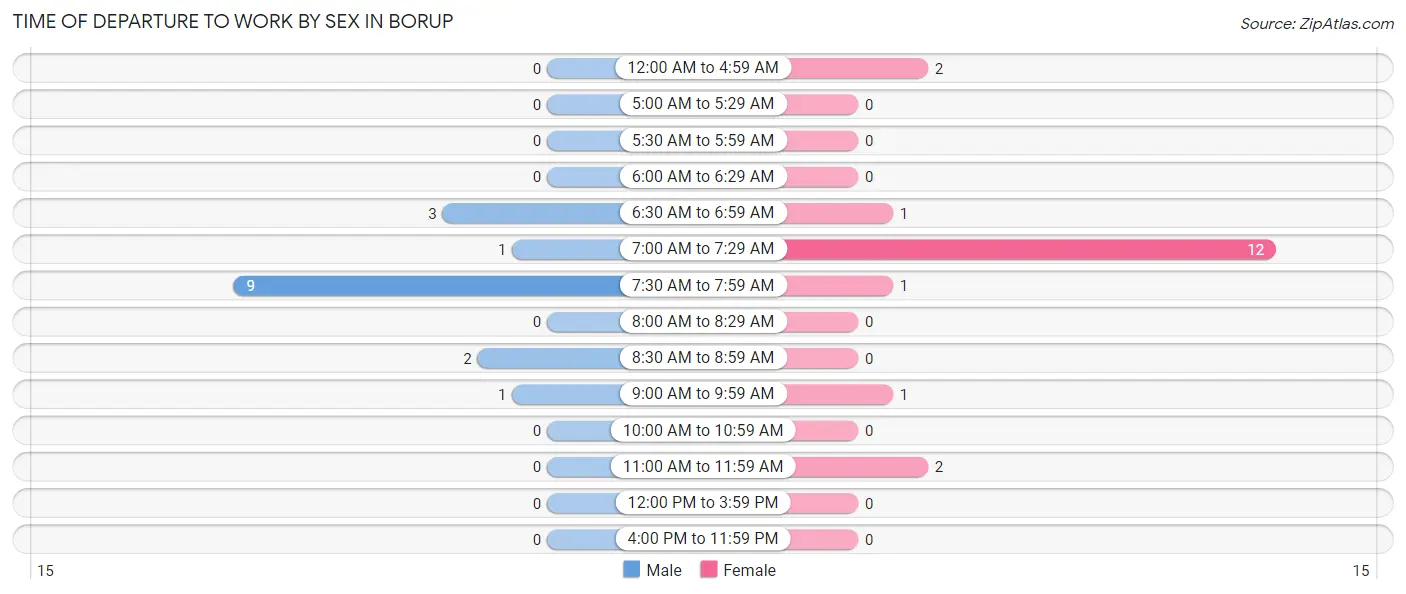
| Time of Departure | Male | Female |
| 12:00 AM to 4:59 AM | 0 (0.0%) | 2 (10.5%) |
| 5:00 AM to 5:29 AM | 0 (0.0%) | 0 (0.0%) |
| 5:30 AM to 5:59 AM | 0 (0.0%) | 0 (0.0%) |
| 6:00 AM to 6:29 AM | 0 (0.0%) | 0 (0.0%) |
| 6:30 AM to 6:59 AM | 3 (18.8%) | 1 (5.3%) |
| 7:00 AM to 7:29 AM | 1 (6.2%) | 12 (63.2%) |
| 7:30 AM to 7:59 AM | 9 (56.2%) | 1 (5.3%) |
| 8:00 AM to 8:29 AM | 0 (0.0%) | 0 (0.0%) |
| 8:30 AM to 8:59 AM | 2 (12.5%) | 0 (0.0%) |
| 9:00 AM to 9:59 AM | 1 (6.2%) | 1 (5.3%) |
| 10:00 AM to 10:59 AM | 0 (0.0%) | 0 (0.0%) |
| 11:00 AM to 11:59 AM | 0 (0.0%) | 2 (10.5%) |
| 12:00 PM to 3:59 PM | 0 (0.0%) | 0 (0.0%) |
| 4:00 PM to 11:59 PM | 0 (0.0%) | 0 (0.0%) |
| Total | 16 (100.0%) | 19 (100.0%) |
Housing Occupancy in Borup
Occupancy by Ownership in Borup
Of the total 54 dwellings in Borup, owner-occupied units account for 46 (85.2%), while renter-occupied units make up 8 (14.8%).
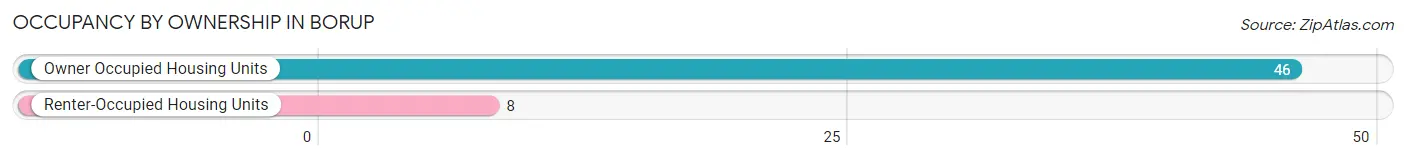
| Occupancy | # Housing Units | % Housing Units |
| Owner Occupied Housing Units | 46 | 85.2% |
| Renter-Occupied Housing Units | 8 | 14.8% |
| Total Occupied Housing Units | 54 | 100.0% |
Occupancy by Household Size in Borup
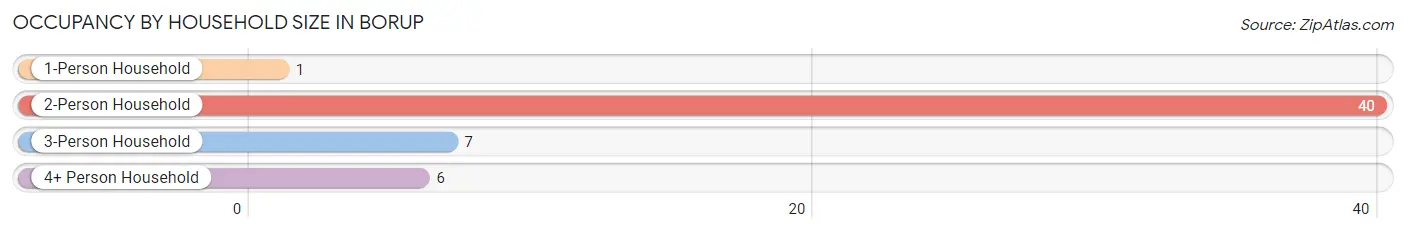
| Household Size | # Housing Units | % Housing Units |
| 1-Person Household | 1 | 1.8% |
| 2-Person Household | 40 | 74.1% |
| 3-Person Household | 7 | 13.0% |
| 4+ Person Household | 6 | 11.1% |
| Total Housing Units | 54 | 100.0% |
Occupancy by Ownership by Household Size in Borup
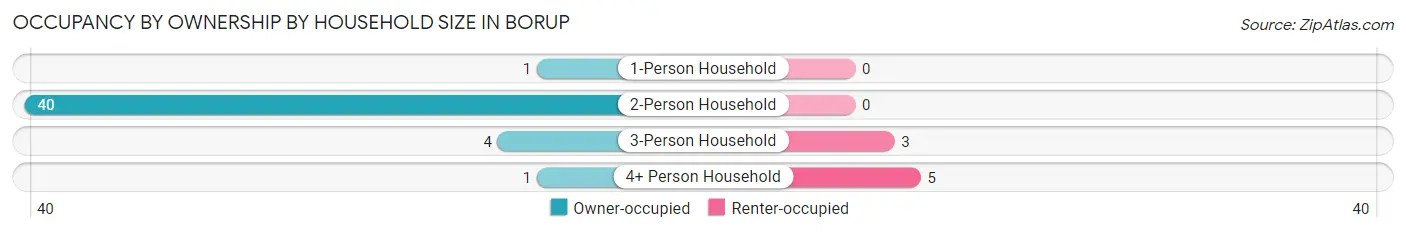
| Household Size | Owner-occupied | Renter-occupied |
| 1-Person Household | 1 (100.0%) | 0 (0.0%) |
| 2-Person Household | 40 (100.0%) | 0 (0.0%) |
| 3-Person Household | 4 (57.1%) | 3 (42.9%) |
| 4+ Person Household | 1 (16.7%) | 5 (83.3%) |
| Total Housing Units | 46 (85.2%) | 8 (14.8%) |
Occupancy by Educational Attainment in Borup
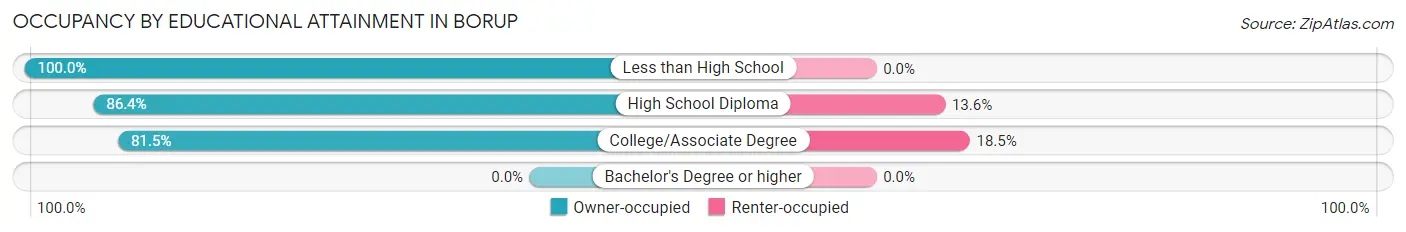
| Household Size | Owner-occupied | Renter-occupied |
| Less than High School | 5 (100.0%) | 0 (0.0%) |
| High School Diploma | 19 (86.4%) | 3 (13.6%) |
| College/Associate Degree | 22 (81.5%) | 5 (18.5%) |
| Bachelor's Degree or higher | 0 (0.0%) | 0 (0.0%) |
Occupancy by Age of Householder in Borup
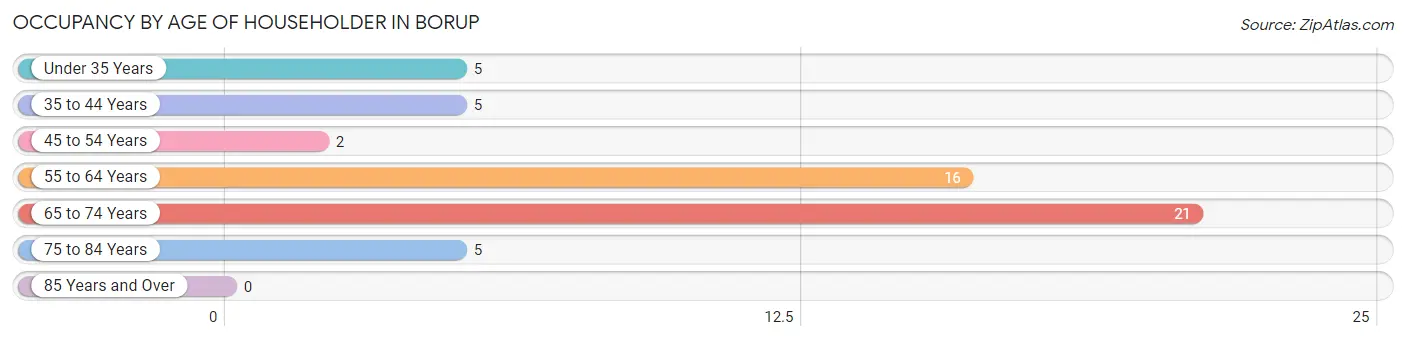
| Age Bracket | # Households | % Households |
| Under 35 Years | 5 | 9.3% |
| 35 to 44 Years | 5 | 9.3% |
| 45 to 54 Years | 2 | 3.7% |
| 55 to 64 Years | 16 | 29.6% |
| 65 to 74 Years | 21 | 38.9% |
| 75 to 84 Years | 5 | 9.3% |
| 85 Years and Over | 0 | 0.0% |
| Total | 54 | 100.0% |
Housing Finances in Borup
Median Income by Occupancy in Borup
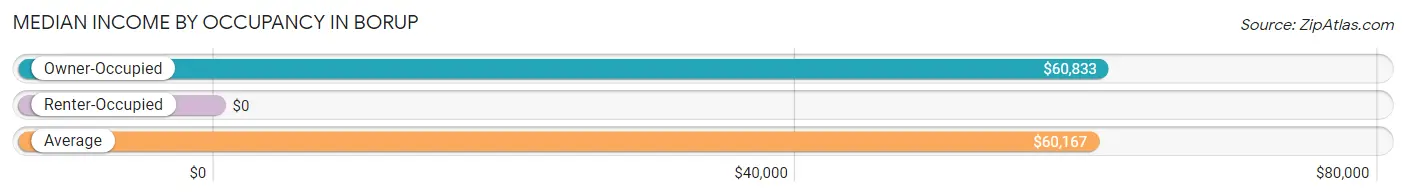
| Occupancy Type | # Households | Median Income |
| Owner-Occupied | 46 (85.2%) | $60,833 |
| Renter-Occupied | 8 (14.8%) | $0 |
| Average | 54 (100.0%) | $60,167 |
Occupancy by Householder Income Bracket in Borup
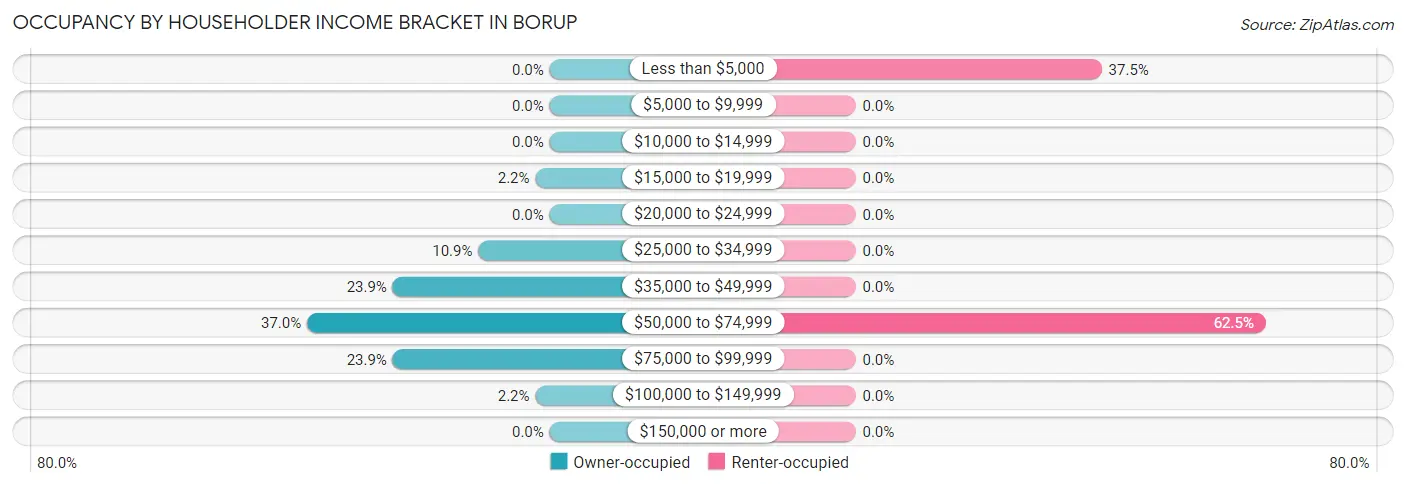
| Income Bracket | Owner-occupied | Renter-occupied |
| Less than $5,000 | 0 (0.0%) | 3 (37.5%) |
| $5,000 to $9,999 | 0 (0.0%) | 0 (0.0%) |
| $10,000 to $14,999 | 0 (0.0%) | 0 (0.0%) |
| $15,000 to $19,999 | 1 (2.2%) | 0 (0.0%) |
| $20,000 to $24,999 | 0 (0.0%) | 0 (0.0%) |
| $25,000 to $34,999 | 5 (10.9%) | 0 (0.0%) |
| $35,000 to $49,999 | 11 (23.9%) | 0 (0.0%) |
| $50,000 to $74,999 | 17 (37.0%) | 5 (62.5%) |
| $75,000 to $99,999 | 11 (23.9%) | 0 (0.0%) |
| $100,000 to $149,999 | 1 (2.2%) | 0 (0.0%) |
| $150,000 or more | 0 (0.0%) | 0 (0.0%) |
| Total | 46 (100.0%) | 8 (100.0%) |
Monthly Housing Cost Tiers in Borup
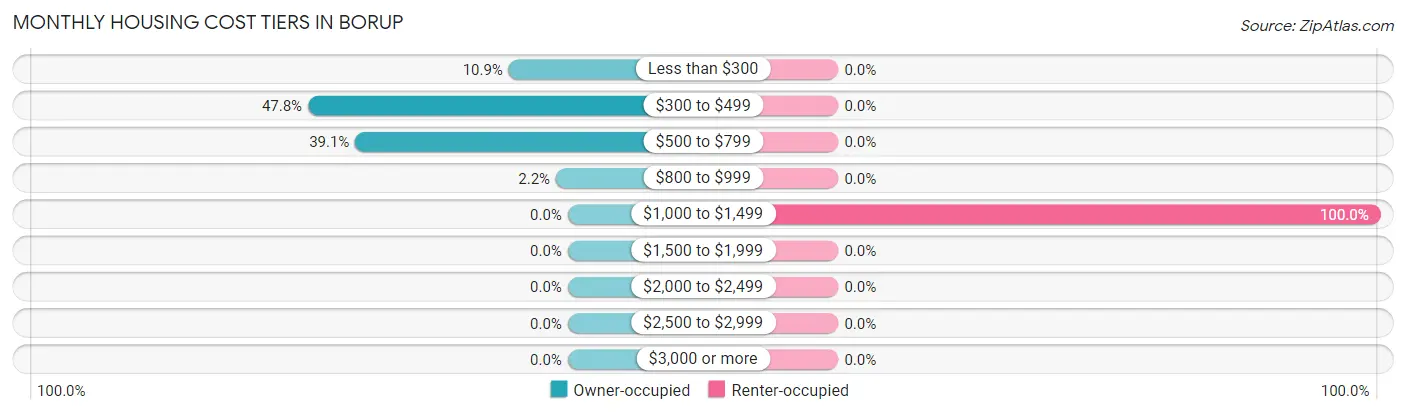
| Monthly Cost | Owner-occupied | Renter-occupied |
| Less than $300 | 5 (10.9%) | 0 (0.0%) |
| $300 to $499 | 22 (47.8%) | 0 (0.0%) |
| $500 to $799 | 18 (39.1%) | 0 (0.0%) |
| $800 to $999 | 1 (2.2%) | 0 (0.0%) |
| $1,000 to $1,499 | 0 (0.0%) | 8 (100.0%) |
| $1,500 to $1,999 | 0 (0.0%) | 0 (0.0%) |
| $2,000 to $2,499 | 0 (0.0%) | 0 (0.0%) |
| $2,500 to $2,999 | 0 (0.0%) | 0 (0.0%) |
| $3,000 or more | 0 (0.0%) | 0 (0.0%) |
| Total | 46 (100.0%) | 8 (100.0%) |
Physical Housing Characteristics in Borup
Housing Structures in Borup
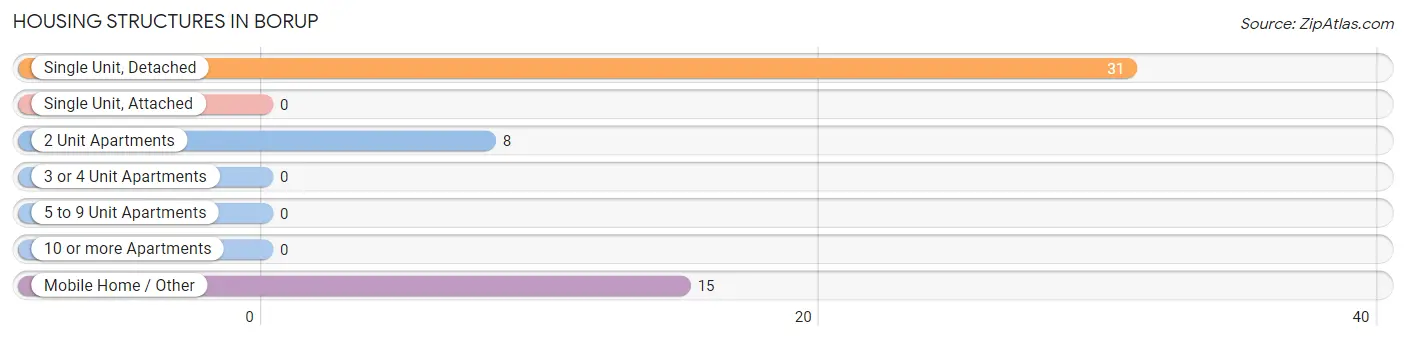
| Structure Type | # Housing Units | % Housing Units |
| Single Unit, Detached | 31 | 57.4% |
| Single Unit, Attached | 0 | 0.0% |
| 2 Unit Apartments | 8 | 14.8% |
| 3 or 4 Unit Apartments | 0 | 0.0% |
| 5 to 9 Unit Apartments | 0 | 0.0% |
| 10 or more Apartments | 0 | 0.0% |
| Mobile Home / Other | 15 | 27.8% |
| Total | 54 | 100.0% |
Housing Structures by Occupancy in Borup
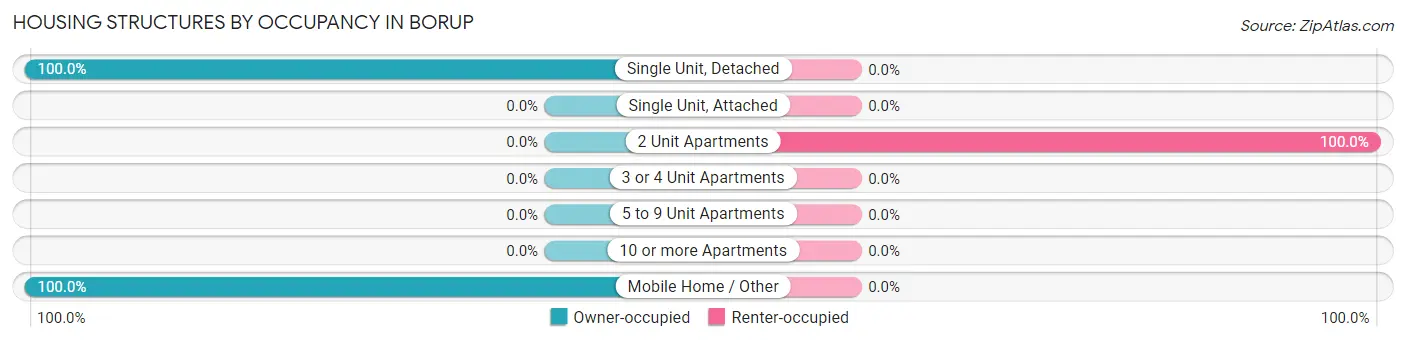
| Structure Type | Owner-occupied | Renter-occupied |
| Single Unit, Detached | 31 (100.0%) | 0 (0.0%) |
| Single Unit, Attached | 0 (0.0%) | 0 (0.0%) |
| 2 Unit Apartments | 0 (0.0%) | 8 (100.0%) |
| 3 or 4 Unit Apartments | 0 (0.0%) | 0 (0.0%) |
| 5 to 9 Unit Apartments | 0 (0.0%) | 0 (0.0%) |
| 10 or more Apartments | 0 (0.0%) | 0 (0.0%) |
| Mobile Home / Other | 15 (100.0%) | 0 (0.0%) |
| Total | 46 (85.2%) | 8 (14.8%) |
Housing Structures by Number of Rooms in Borup
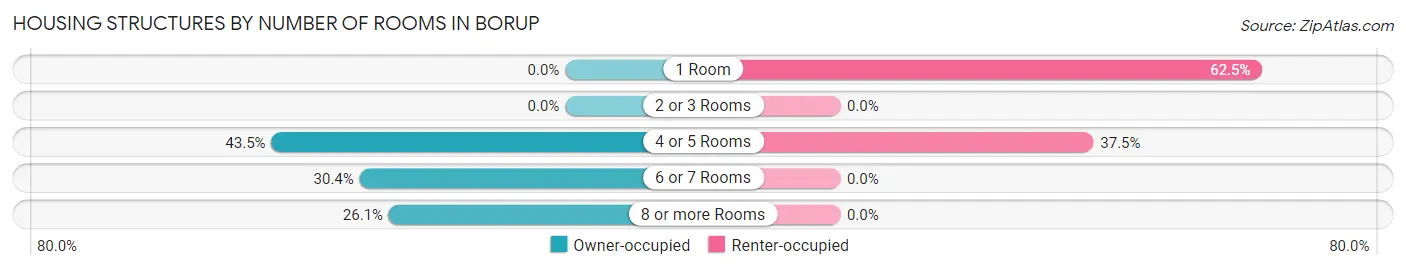
| Number of Rooms | Owner-occupied | Renter-occupied |
| 1 Room | 0 (0.0%) | 5 (62.5%) |
| 2 or 3 Rooms | 0 (0.0%) | 0 (0.0%) |
| 4 or 5 Rooms | 20 (43.5%) | 3 (37.5%) |
| 6 or 7 Rooms | 14 (30.4%) | 0 (0.0%) |
| 8 or more Rooms | 12 (26.1%) | 0 (0.0%) |
| Total | 46 (100.0%) | 8 (100.0%) |
Housing Structure by Heating Type in Borup
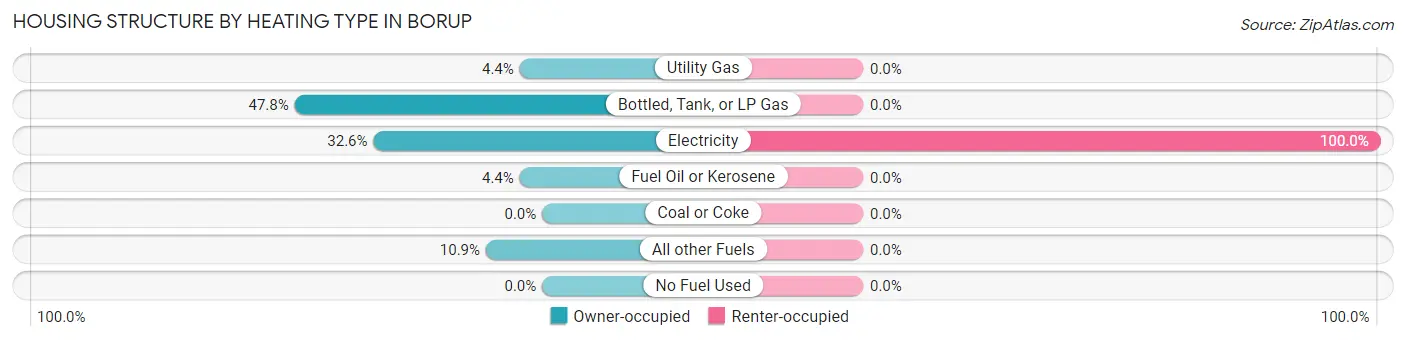
| Heating Type | Owner-occupied | Renter-occupied |
| Utility Gas | 2 (4.3%) | 0 (0.0%) |
| Bottled, Tank, or LP Gas | 22 (47.8%) | 0 (0.0%) |
| Electricity | 15 (32.6%) | 8 (100.0%) |
| Fuel Oil or Kerosene | 2 (4.3%) | 0 (0.0%) |
| Coal or Coke | 0 (0.0%) | 0 (0.0%) |
| All other Fuels | 5 (10.9%) | 0 (0.0%) |
| No Fuel Used | 0 (0.0%) | 0 (0.0%) |
| Total | 46 (100.0%) | 8 (100.0%) |
Household Vehicle Usage in Borup
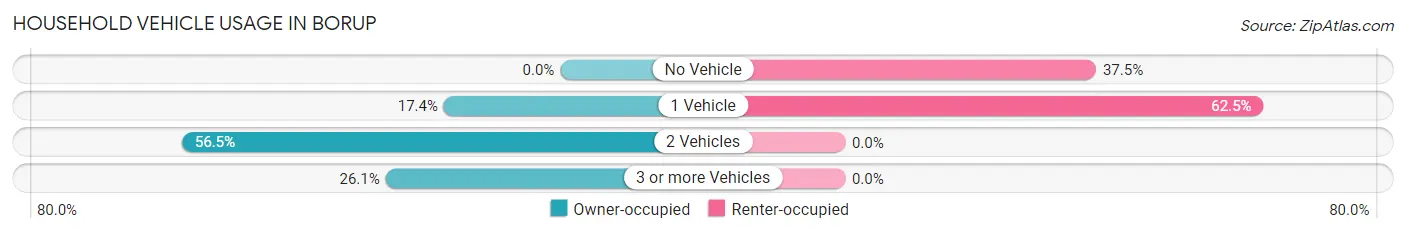
| Vehicles per Household | Owner-occupied | Renter-occupied |
| No Vehicle | 0 (0.0%) | 3 (37.5%) |
| 1 Vehicle | 8 (17.4%) | 5 (62.5%) |
| 2 Vehicles | 26 (56.5%) | 0 (0.0%) |
| 3 or more Vehicles | 12 (26.1%) | 0 (0.0%) |
| Total | 46 (100.0%) | 8 (100.0%) |
Real Estate & Mortgages in Borup
Real Estate and Mortgage Overview in Borup
| Characteristic | Without Mortgage | With Mortgage |
| Housing Units | 36 | 10 |
| Median Property Value | $65,600 | $0 |
| Median Household Income | $60,167 | $0 |
| Monthly Housing Costs | $457 | $0 |
| Real Estate Taxes | $684 | $0 |
Property Value by Mortgage Status in Borup
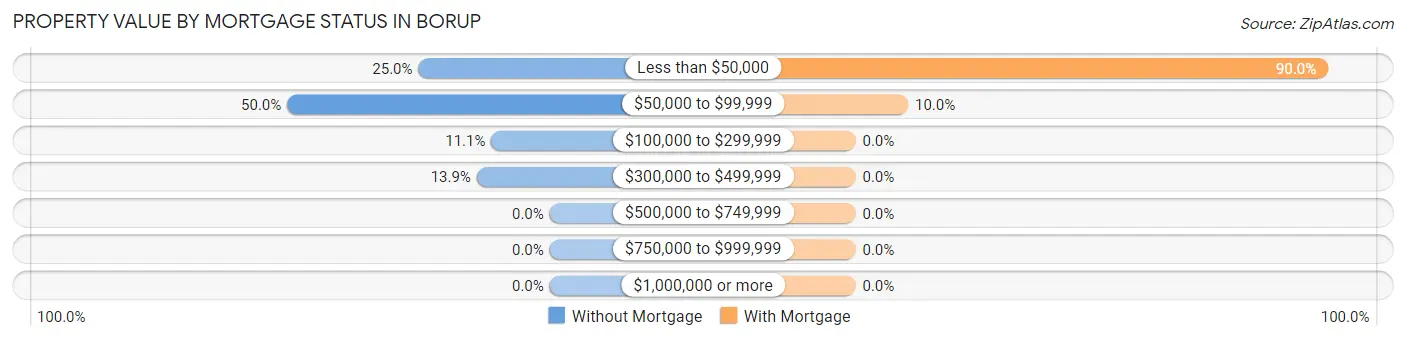
| Property Value | Without Mortgage | With Mortgage |
| Less than $50,000 | 9 (25.0%) | 9 (90.0%) |
| $50,000 to $99,999 | 18 (50.0%) | 1 (10.0%) |
| $100,000 to $299,999 | 4 (11.1%) | 0 (0.0%) |
| $300,000 to $499,999 | 5 (13.9%) | 0 (0.0%) |
| $500,000 to $749,999 | 0 (0.0%) | 0 (0.0%) |
| $750,000 to $999,999 | 0 (0.0%) | 0 (0.0%) |
| $1,000,000 or more | 0 (0.0%) | 0 (0.0%) |
| Total | 36 (100.0%) | 10 (100.0%) |
Household Income by Mortgage Status in Borup
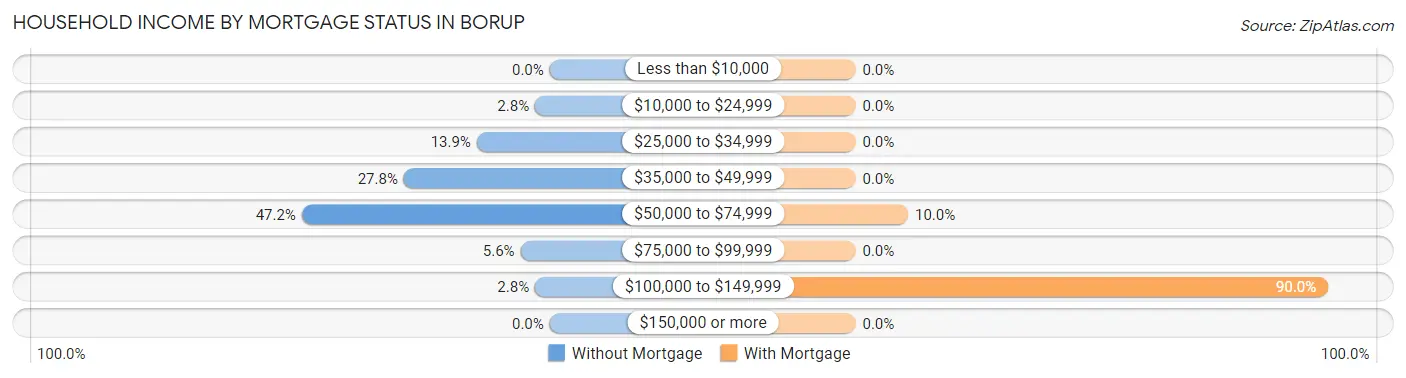
| Household Income | Without Mortgage | With Mortgage |
| Less than $10,000 | 0 (0.0%) | 0 (0.0%) |
| $10,000 to $24,999 | 1 (2.8%) | 0 (0.0%) |
| $25,000 to $34,999 | 5 (13.9%) | 0 (0.0%) |
| $35,000 to $49,999 | 10 (27.8%) | 0 (0.0%) |
| $50,000 to $74,999 | 17 (47.2%) | 1 (10.0%) |
| $75,000 to $99,999 | 2 (5.6%) | 0 (0.0%) |
| $100,000 to $149,999 | 1 (2.8%) | 9 (90.0%) |
| $150,000 or more | 0 (0.0%) | 0 (0.0%) |
| Total | 36 (100.0%) | 10 (100.0%) |
Property Value to Household Income Ratio in Borup
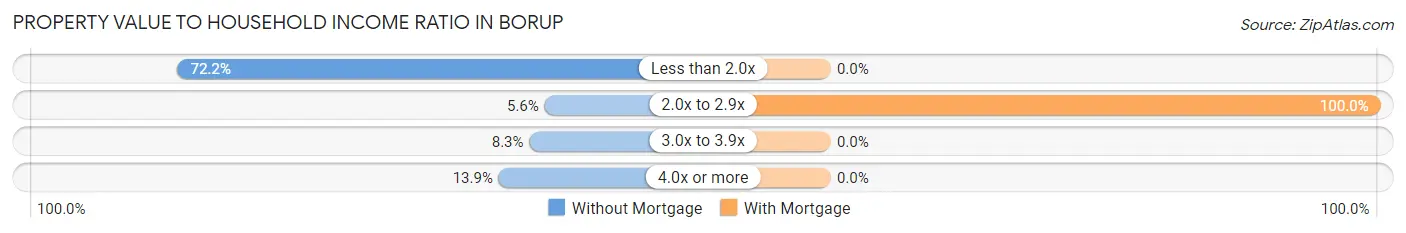
| Value-to-Income Ratio | Without Mortgage | With Mortgage |
| Less than 2.0x | 26 (72.2%) | 0 (0.0%) |
| 2.0x to 2.9x | 2 (5.6%) | 10 (100.0%) |
| 3.0x to 3.9x | 3 (8.3%) | 0 (0.0%) |
| 4.0x or more | 5 (13.9%) | 0 (0.0%) |
| Total | 36 (100.0%) | 10 (100.0%) |
Real Estate Taxes by Mortgage Status in Borup
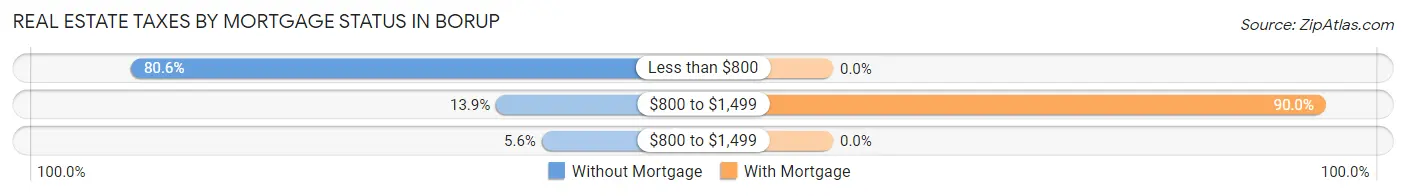
| Property Taxes | Without Mortgage | With Mortgage |
| Less than $800 | 29 (80.6%) | 0 (0.0%) |
| $800 to $1,499 | 5 (13.9%) | 9 (90.0%) |
| $800 to $1,499 | 2 (5.6%) | 0 (0.0%) |
| Total | 36 (100.0%) | 10 (100.0%) |
Health & Disability in Borup
Health Insurance Coverage by Age in Borup
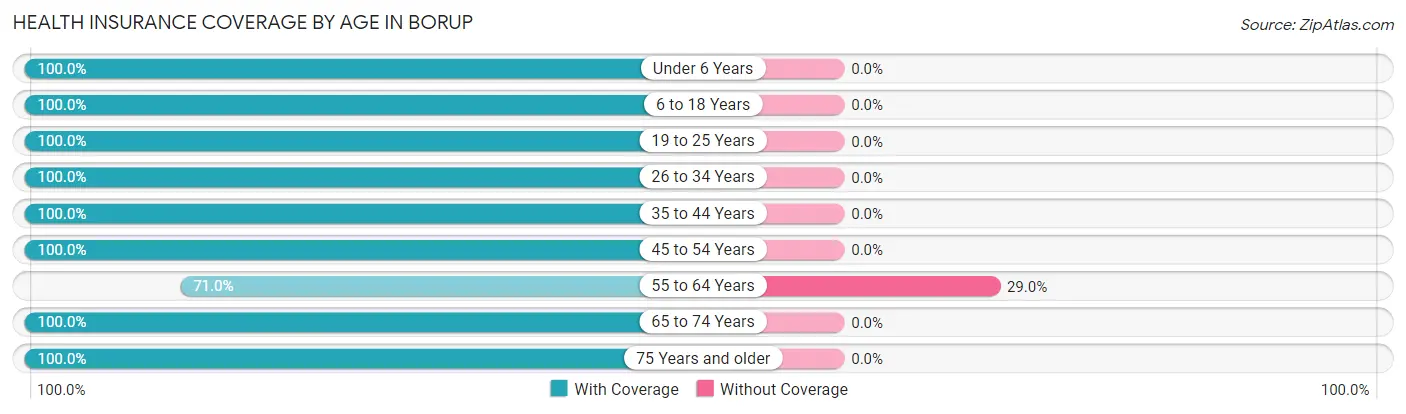
| Age Bracket | With Coverage | Without Coverage |
| Under 6 Years | 2 (100.0%) | 0 (0.0%) |
| 6 to 18 Years | 34 (100.0%) | 0 (0.0%) |
| 19 to 25 Years | 20 (100.0%) | 0 (0.0%) |
| 26 to 34 Years | 11 (100.0%) | 0 (0.0%) |
| 35 to 44 Years | 6 (100.0%) | 0 (0.0%) |
| 45 to 54 Years | 3 (100.0%) | 0 (0.0%) |
| 55 to 64 Years | 22 (71.0%) | 9 (29.0%) |
| 65 to 74 Years | 37 (100.0%) | 0 (0.0%) |
| 75 Years and older | 10 (100.0%) | 0 (0.0%) |
| Total | 145 (94.2%) | 9 (5.8%) |
Health Insurance Coverage by Citizenship Status in Borup
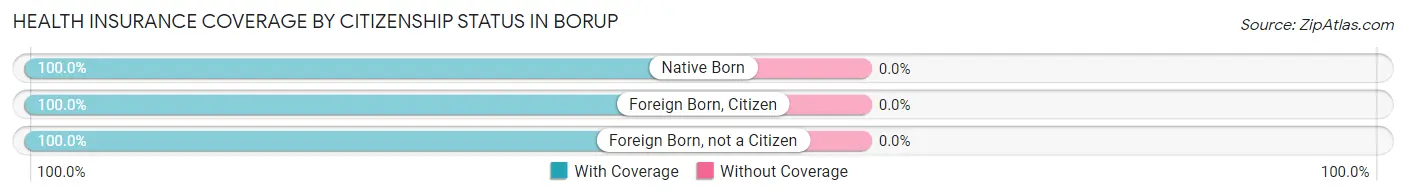
| Citizenship Status | With Coverage | Without Coverage |
| Native Born | 2 (100.0%) | 0 (0.0%) |
| Foreign Born, Citizen | 34 (100.0%) | 0 (0.0%) |
| Foreign Born, not a Citizen | 20 (100.0%) | 0 (0.0%) |
Health Insurance Coverage by Household Income in Borup
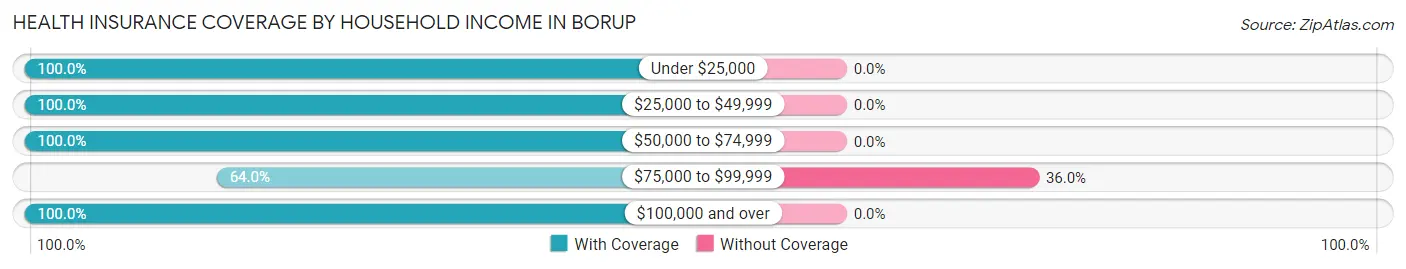
| Household Income | With Coverage | Without Coverage |
| Under $25,000 | 18 (100.0%) | 0 (0.0%) |
| $25,000 to $49,999 | 54 (100.0%) | 0 (0.0%) |
| $50,000 to $74,999 | 53 (100.0%) | 0 (0.0%) |
| $75,000 to $99,999 | 16 (64.0%) | 9 (36.0%) |
| $100,000 and over | 4 (100.0%) | 0 (0.0%) |
Public vs Private Health Insurance Coverage by Age in Borup
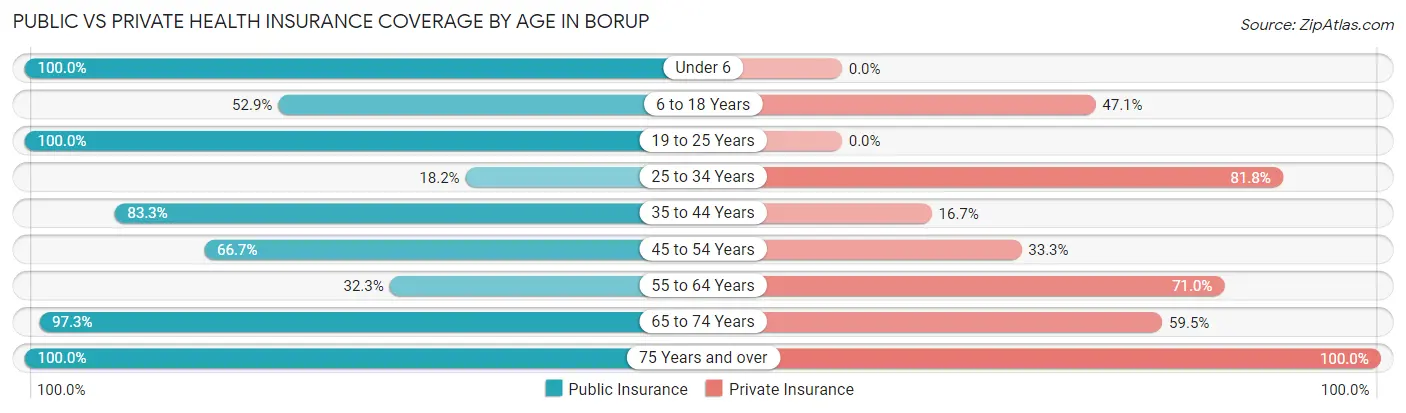
| Age Bracket | Public Insurance | Private Insurance |
| Under 6 | 2 (100.0%) | 0 (0.0%) |
| 6 to 18 Years | 18 (52.9%) | 16 (47.1%) |
| 19 to 25 Years | 20 (100.0%) | 0 (0.0%) |
| 25 to 34 Years | 2 (18.2%) | 9 (81.8%) |
| 35 to 44 Years | 5 (83.3%) | 1 (16.7%) |
| 45 to 54 Years | 2 (66.7%) | 1 (33.3%) |
| 55 to 64 Years | 10 (32.3%) | 22 (71.0%) |
| 65 to 74 Years | 36 (97.3%) | 22 (59.5%) |
| 75 Years and over | 10 (100.0%) | 10 (100.0%) |
| Total | 105 (68.2%) | 81 (52.6%) |
Disability Status by Sex by Age in Borup
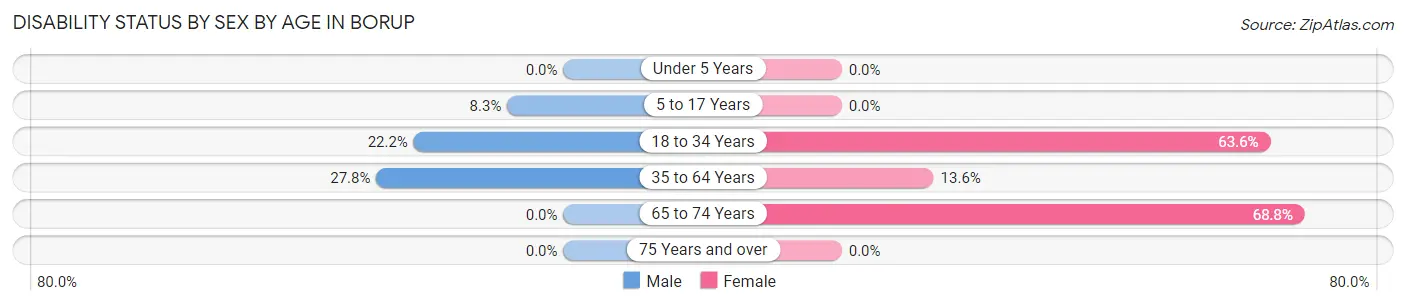
| Age Bracket | Male | Female |
| Under 5 Years | 0 (0.0%) | 0 (0.0%) |
| 5 to 17 Years | 1 (8.3%) | 0 (0.0%) |
| 18 to 34 Years | 2 (22.2%) | 14 (63.6%) |
| 35 to 64 Years | 5 (27.8%) | 3 (13.6%) |
| 65 to 74 Years | 0 (0.0%) | 11 (68.8%) |
| 75 Years and over | 0 (0.0%) | 0 (0.0%) |
Disability Class by Sex by Age in Borup
Disability Class: Hearing Difficulty
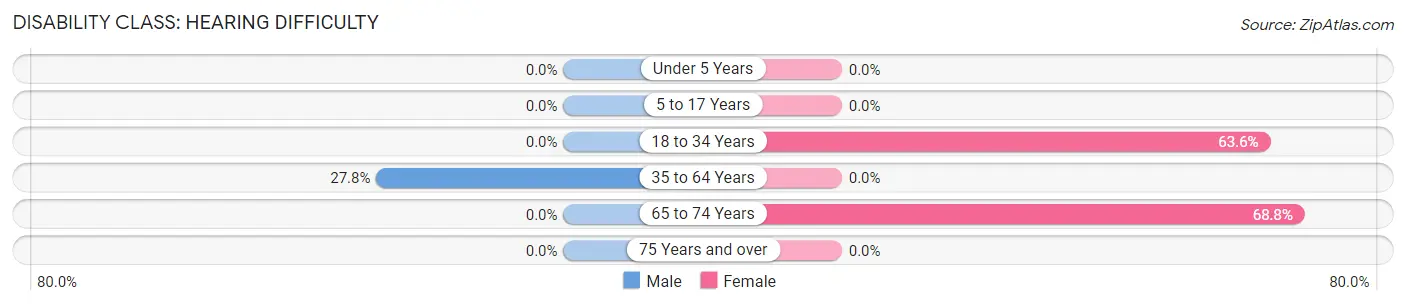
| Age Bracket | Male | Female |
| Under 5 Years | 0 (0.0%) | 0 (0.0%) |
| 5 to 17 Years | 0 (0.0%) | 0 (0.0%) |
| 18 to 34 Years | 0 (0.0%) | 14 (63.6%) |
| 35 to 64 Years | 5 (27.8%) | 0 (0.0%) |
| 65 to 74 Years | 0 (0.0%) | 11 (68.8%) |
| 75 Years and over | 0 (0.0%) | 0 (0.0%) |
Disability Class: Vision Difficulty
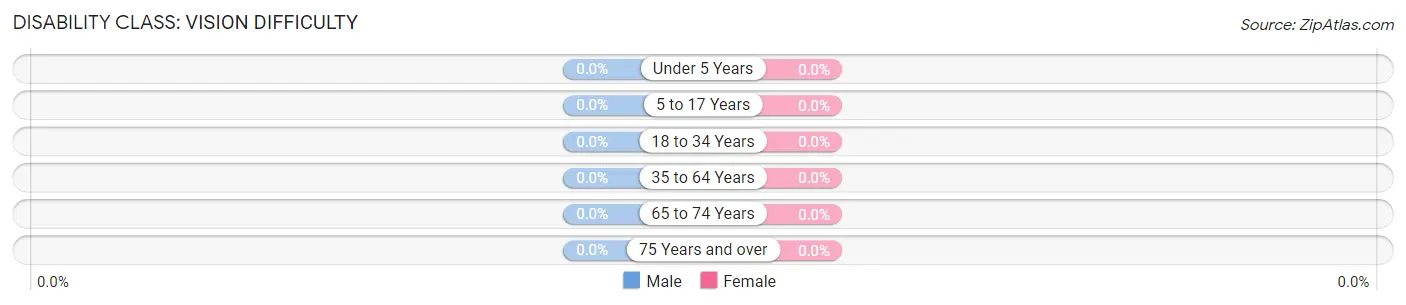
| Age Bracket | Male | Female |
| Under 5 Years | 0 (0.0%) | 0 (0.0%) |
| 5 to 17 Years | 0 (0.0%) | 0 (0.0%) |
| 18 to 34 Years | 0 (0.0%) | 0 (0.0%) |
| 35 to 64 Years | 0 (0.0%) | 0 (0.0%) |
| 65 to 74 Years | 0 (0.0%) | 0 (0.0%) |
| 75 Years and over | 0 (0.0%) | 0 (0.0%) |
Disability Class: Cognitive Difficulty
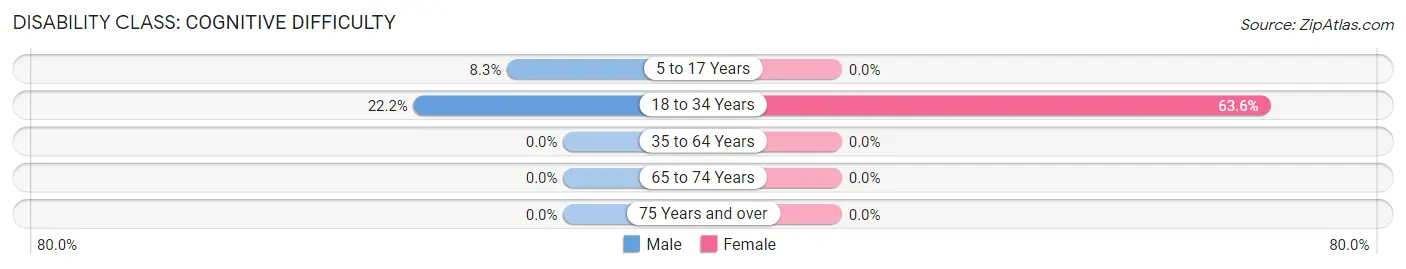
| Age Bracket | Male | Female |
| 5 to 17 Years | 1 (8.3%) | 0 (0.0%) |
| 18 to 34 Years | 2 (22.2%) | 14 (63.6%) |
| 35 to 64 Years | 0 (0.0%) | 0 (0.0%) |
| 65 to 74 Years | 0 (0.0%) | 0 (0.0%) |
| 75 Years and over | 0 (0.0%) | 0 (0.0%) |
Disability Class: Ambulatory Difficulty
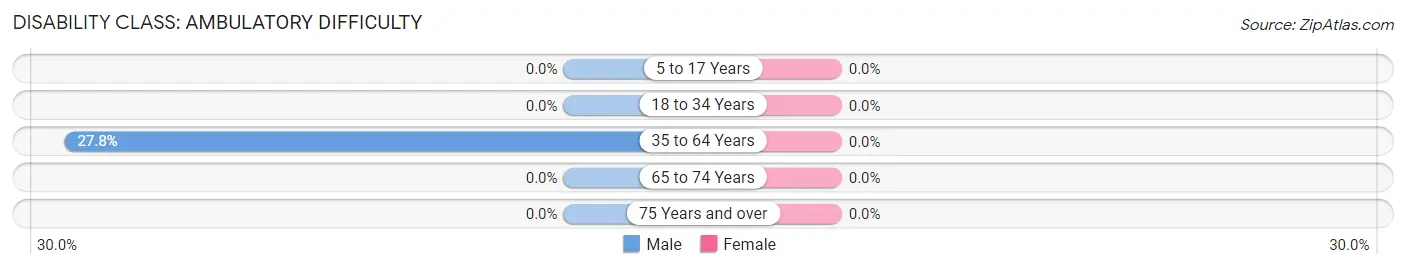
| Age Bracket | Male | Female |
| 5 to 17 Years | 0 (0.0%) | 0 (0.0%) |
| 18 to 34 Years | 0 (0.0%) | 0 (0.0%) |
| 35 to 64 Years | 5 (27.8%) | 0 (0.0%) |
| 65 to 74 Years | 0 (0.0%) | 0 (0.0%) |
| 75 Years and over | 0 (0.0%) | 0 (0.0%) |
Disability Class: Self-Care Difficulty
| Age Bracket | Male | Female |
| 5 to 17 Years | 0 (0.0%) | 0 (0.0%) |
| 18 to 34 Years | 0 (0.0%) | 0 (0.0%) |
| 35 to 64 Years | 0 (0.0%) | 0 (0.0%) |
| 65 to 74 Years | 0 (0.0%) | 0 (0.0%) |
| 75 Years and over | 0 (0.0%) | 0 (0.0%) |
Technology Access in Borup
Computing Device Access in Borup
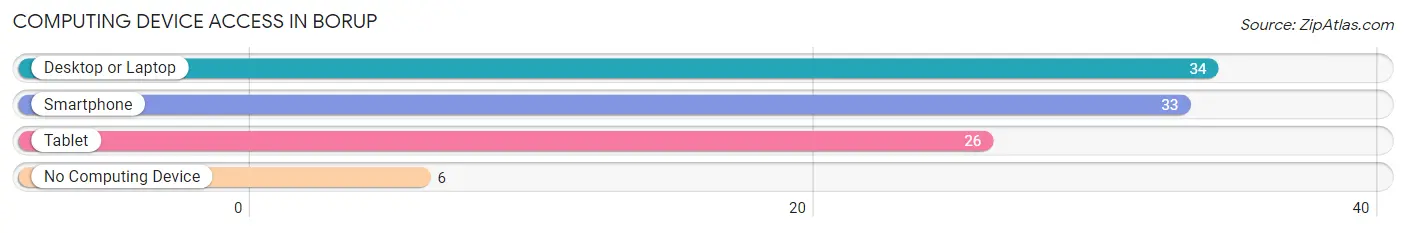
| Device Type | # Households | % Households |
| Desktop or Laptop | 34 | 63.0% |
| Smartphone | 33 | 61.1% |
| Tablet | 26 | 48.1% |
| No Computing Device | 6 | 11.1% |
| Total | 54 | 100.0% |
Internet Access in Borup
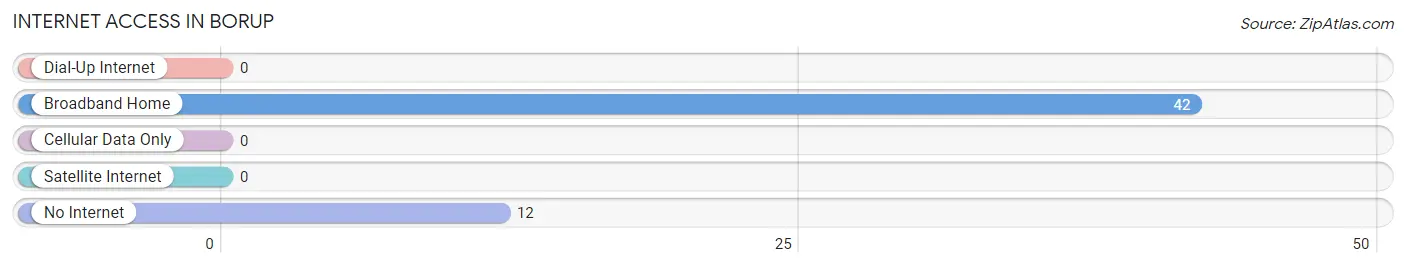
| Internet Type | # Households | % Households |
| Dial-Up Internet | 0 | 0.0% |
| Broadband Home | 42 | 77.8% |
| Cellular Data Only | 0 | 0.0% |
| Satellite Internet | 0 | 0.0% |
| No Internet | 12 | 22.2% |
| Total | 54 | 100.0% |
Borup Summary
Borup is a small city located in Norman County, Minnesota, United States. The city is situated on the western edge of the Red River Valley, approximately 20 miles south of Grand Forks, North Dakota. The population of Borup was estimated to be 545 in 2020.
History
Borup was founded in 1881 by Norwegian immigrants who had settled in the area. The city was named after the Norwegian town of Borup, which is located in the county of Vestfold. The first settlers in Borup were farmers who grew wheat, oats, and barley. The first post office was established in 1883.
In the early 1900s, the city began to grow and develop. The first school was built in 1906, and the first church was built in 1908. The city was incorporated in 1909.
In the 1920s, the city experienced a period of growth and development. The first bank was established in 1921, and the first newspaper was published in 1923. The city also had a movie theater, a hotel, and a variety of stores.
In the 1950s, the city experienced a period of decline. The population decreased from 1,000 in 1950 to 545 in 2020. The decline was due to the decline of the agricultural industry in the area.
Geography
Borup is located in the western part of Norman County, Minnesota. The city is situated on the western edge of the Red River Valley, approximately 20 miles south of Grand Forks, North Dakota. The city is surrounded by rolling hills and farmland. The city is located at an elevation of 1,072 feet above sea level.
The climate in Borup is classified as humid continental, with cold winters and warm summers. The average annual temperature is 41°F, and the average annual precipitation is 24 inches.
Economy
The economy of Borup is largely based on agriculture. The city is home to several farms that produce wheat, oats, barley, and other crops. The city also has a few small businesses, including a grocery store, a hardware store, and a restaurant.
Demographics
As of 2020, the population of Borup was estimated to be 545. The racial makeup of the city was 97.3% White, 0.7% Native American, 0.2% Asian, 0.2% from other races, and 1.6% from two or more races. The median household income was $45,000, and the median family income was $50,000. The per capita income was $20,000.
Common Questions
What is Per Capita Income in Borup?
Per Capita income in Borup is $20,321.
What is the Median Family Income in Borup?
Median Family Income in Borup is $60,250.
What is the Median Household income in Borup?
Median Household Income in Borup is $60,167.
What is Income or Wage Gap in Borup?
Income or Wage Gap in Borup is 51.3%.
Women in Borup earn 48.7 cents for every dollar earned by a man.
What is Inequality or Gini Index in Borup?
Inequality or Gini Index in Borup is 0.24.
What is the Total Population of Borup?
Total Population of Borup is 154.
What is the Total Male Population of Borup?
Total Male Population of Borup is 67.
What is the Total Female Population of Borup?
Total Female Population of Borup is 87.
What is the Ratio of Males per 100 Females in Borup?
There are 77.01 Males per 100 Females in Borup.
What is the Ratio of Females per 100 Males in Borup?
There are 129.85 Females per 100 Males in Borup.
What is the Median Population Age in Borup?
Median Population Age in Borup is 55.2 Years.
What is the Average Family Size in Borup
Average Family Size in Borup is 2.9 People.
What is the Average Household Size in Borup
Average Household Size in Borup is 2.9 People.
How Large is the Labor Force in Borup?
There are 40 People in the Labor Forcein in Borup.
What is the Percentage of People in the Labor Force in Borup?
33.9% of People are in the Labor Force in Borup.