Cambridge, MN Map & Demographics
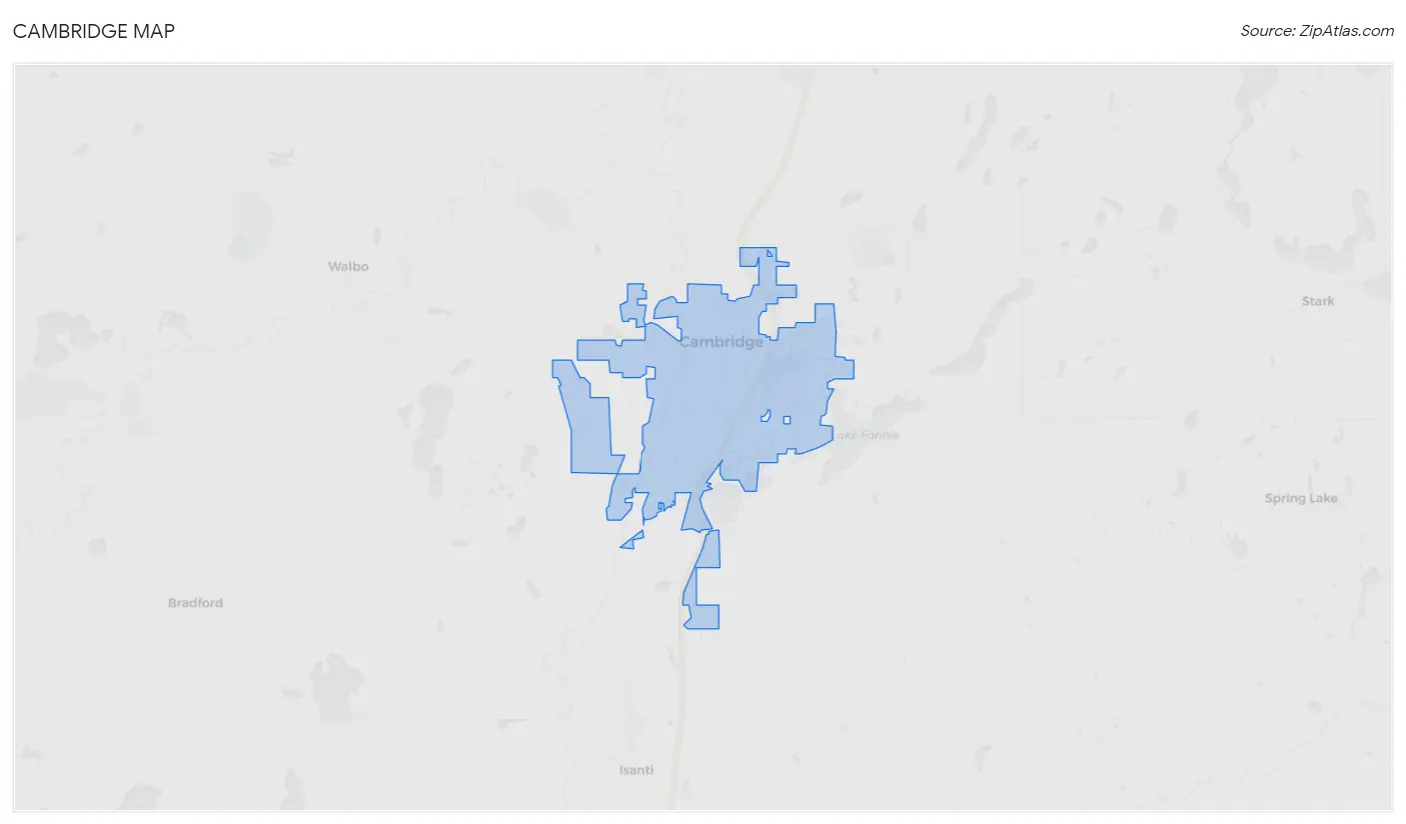
Cambridge Map
Cambridge Overview
$33,056
PER CAPITA INCOME
$81,708
AVG FAMILY INCOME
$64,286
AVG HOUSEHOLD INCOME
34.3%
WAGE / INCOME GAP [ % ]
65.7¢/ $1
WAGE / INCOME GAP [ $ ]
$7,235
FAMILY INCOME DEFICIT
0.39
INEQUALITY / GINI INDEX
9,726
TOTAL POPULATION
4,656
MALE POPULATION
5,070
FEMALE POPULATION
91.83
MALES / 100 FEMALES
108.89
FEMALES / 100 MALES
37.8
MEDIAN AGE
3.0
AVG FAMILY SIZE
2.4
AVG HOUSEHOLD SIZE
4,916
LABOR FORCE [ PEOPLE ]
62.7%
PERCENT IN LABOR FORCE
2.7%
UNEMPLOYMENT RATE
Cambridge Zip Codes
Income in Cambridge
Income Overview in Cambridge
Per Capita Income in Cambridge is $33,056, while median incomes of families and households are $81,708 and $64,286 respectively.
| Characteristic | Number | Measure |
| Per Capita Income | 9,726 | $33,056 |
| Median Family Income | 2,317 | $81,708 |
| Mean Family Income | 2,317 | $92,406 |
| Median Household Income | 4,028 | $64,286 |
| Mean Household Income | 4,028 | $76,531 |
| Income Deficit | 2,317 | $7,235 |
| Wage / Income Gap (%) | 9,726 | 34.34% |
| Wage / Income Gap ($) | 9,726 | 65.66¢ per $1 |
| Gini / Inequality Index | 9,726 | 0.39 |
Earnings by Sex in Cambridge
Average Earnings in Cambridge are $42,715, $52,593 for men and $34,531 for women, a difference of 34.3%.
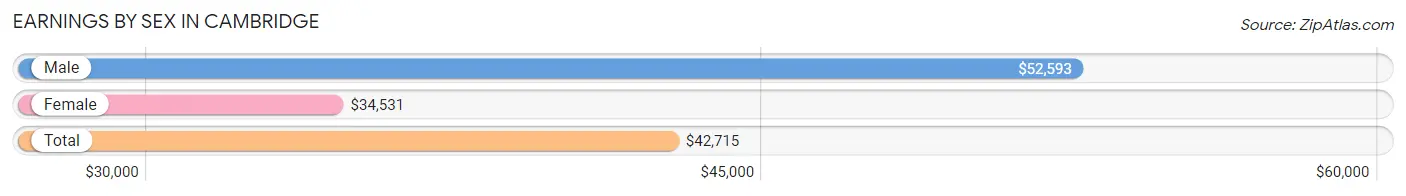
| Sex | Number | Average Earnings |
| Male | 2,686 (51.2%) | $52,593 |
| Female | 2,563 (48.8%) | $34,531 |
| Total | 5,249 (100.0%) | $42,715 |
Earnings by Sex by Income Bracket in Cambridge
The most common earnings brackets in Cambridge are $55,000 to $64,999 for men (419 | 15.6%) and $40,000 to $44,999 for women (267 | 10.4%).
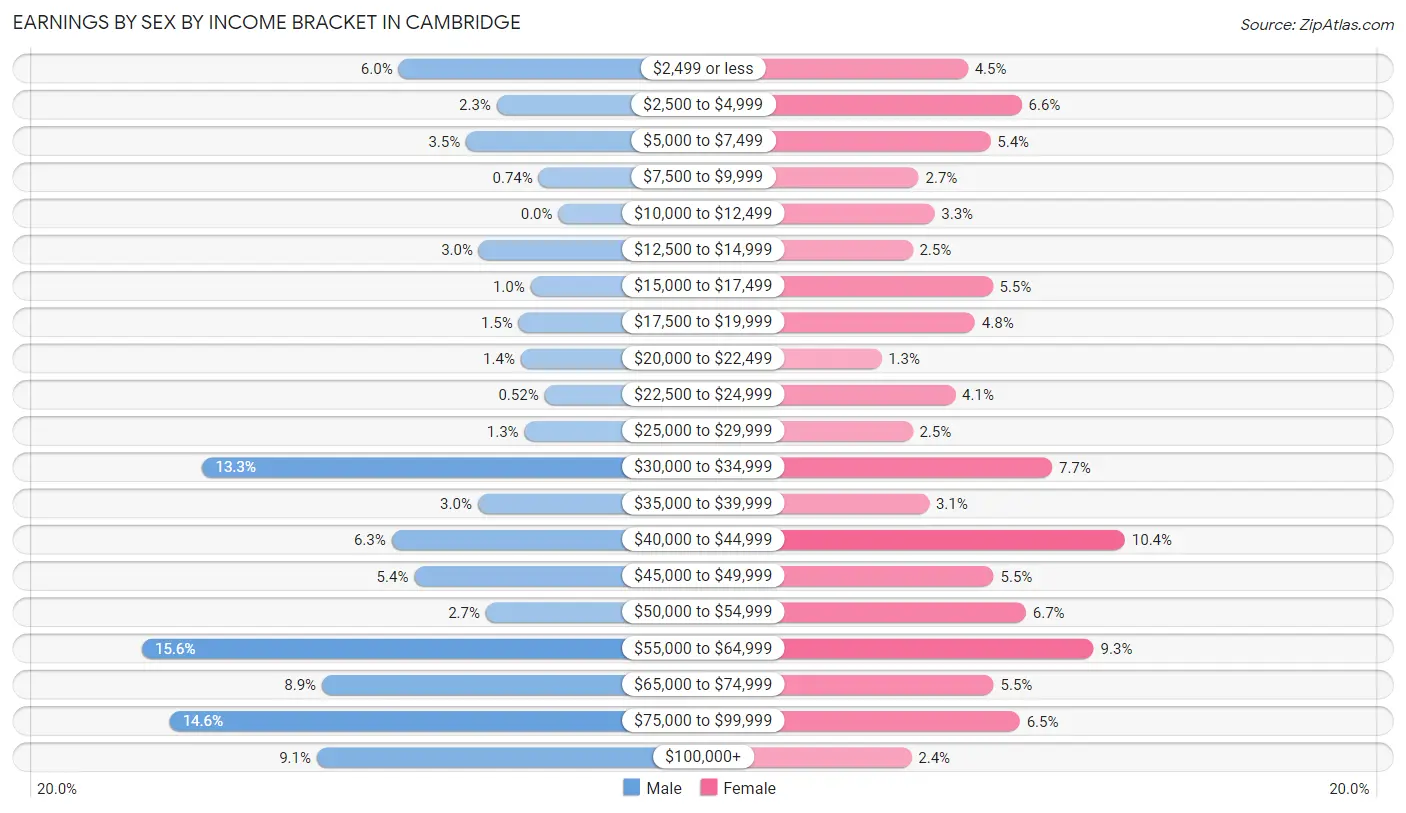
| Income | Male | Female |
| $2,499 or less | 161 (6.0%) | 116 (4.5%) |
| $2,500 to $4,999 | 62 (2.3%) | 168 (6.6%) |
| $5,000 to $7,499 | 93 (3.5%) | 138 (5.4%) |
| $7,500 to $9,999 | 20 (0.7%) | 69 (2.7%) |
| $10,000 to $12,499 | 0 (0.0%) | 84 (3.3%) |
| $12,500 to $14,999 | 80 (3.0%) | 63 (2.5%) |
| $15,000 to $17,499 | 28 (1.0%) | 140 (5.5%) |
| $17,500 to $19,999 | 40 (1.5%) | 123 (4.8%) |
| $20,000 to $22,499 | 38 (1.4%) | 33 (1.3%) |
| $22,500 to $24,999 | 14 (0.5%) | 104 (4.1%) |
| $25,000 to $29,999 | 34 (1.3%) | 63 (2.5%) |
| $30,000 to $34,999 | 358 (13.3%) | 197 (7.7%) |
| $35,000 to $39,999 | 81 (3.0%) | 79 (3.1%) |
| $40,000 to $44,999 | 168 (6.2%) | 267 (10.4%) |
| $45,000 to $49,999 | 145 (5.4%) | 141 (5.5%) |
| $50,000 to $54,999 | 73 (2.7%) | 172 (6.7%) |
| $55,000 to $64,999 | 419 (15.6%) | 237 (9.2%) |
| $65,000 to $74,999 | 238 (8.9%) | 141 (5.5%) |
| $75,000 to $99,999 | 391 (14.6%) | 166 (6.5%) |
| $100,000+ | 243 (9.0%) | 62 (2.4%) |
| Total | 2,686 (100.0%) | 2,563 (100.0%) |
Earnings by Sex by Educational Attainment in Cambridge
Average earnings in Cambridge are $61,201 for men and $42,972 for women, a difference of 29.8%. Men with an educational attainment of college or associate's degree enjoy the highest average annual earnings of $62,970, while those with less than high school education earn the least with $34,196. Women with an educational attainment of graduate degree earn the most with the average annual earnings of $81,458, while those with bachelor's degree education have the smallest earnings of $44,773.
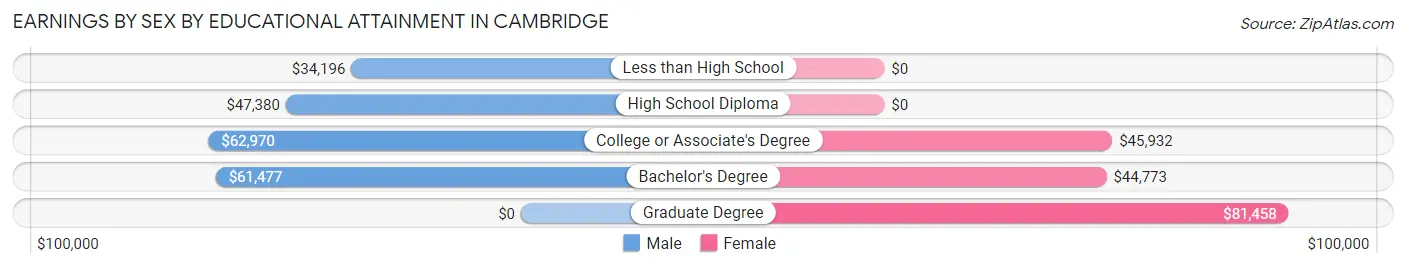
| Educational Attainment | Male Income | Female Income |
| Less than High School | $34,196 | $0 |
| High School Diploma | $47,380 | $0 |
| College or Associate's Degree | $62,970 | $45,932 |
| Bachelor's Degree | $61,477 | $44,773 |
| Graduate Degree | - | - |
| Total | $61,201 | $42,972 |
Family Income in Cambridge
Family Income Brackets in Cambridge
According to the Cambridge family income data, there are 521 families falling into the $75,000 to $99,999 income range, which is the most common income bracket and makes up 22.5% of all families. Conversely, the less than $10,000 income bracket is the least frequent group with only 32 families (1.4%) belonging to this category.
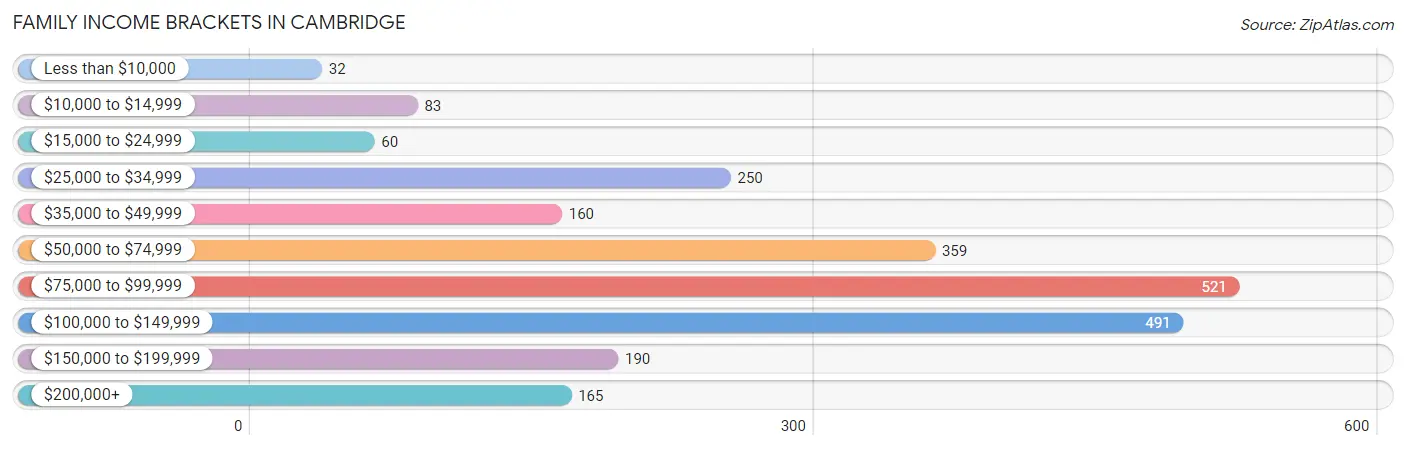
| Income Bracket | # Families | % Families |
| Less than $10,000 | 32 | 1.4% |
| $10,000 to $14,999 | 83 | 3.6% |
| $15,000 to $24,999 | 60 | 2.6% |
| $25,000 to $34,999 | 250 | 10.8% |
| $35,000 to $49,999 | 160 | 6.9% |
| $50,000 to $74,999 | 359 | 15.5% |
| $75,000 to $99,999 | 521 | 22.5% |
| $100,000 to $149,999 | 491 | 21.2% |
| $150,000 to $199,999 | 190 | 8.2% |
| $200,000+ | 165 | 7.1% |
Family Income by Famaliy Size in Cambridge
5-person families (263 | 11.4%) account for the highest median family income in Cambridge with $108,983 per family, while 2-person families (1,137 | 49.1%) have the highest median income of $29,980 per family member.
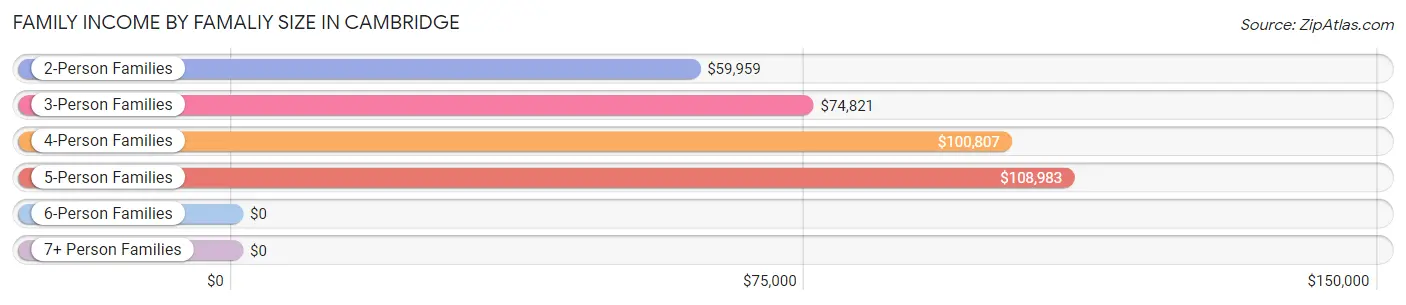
| Income Bracket | # Families | Median Income |
| 2-Person Families | 1,137 (49.1%) | $59,959 |
| 3-Person Families | 512 (22.1%) | $74,821 |
| 4-Person Families | 383 (16.5%) | $100,807 |
| 5-Person Families | 263 (11.4%) | $108,983 |
| 6-Person Families | 22 (0.9%) | $0 |
| 7+ Person Families | 0 (0.0%) | $0 |
| Total | 2,317 (100.0%) | $81,708 |
Family Income by Number of Earners in Cambridge
The median family income in Cambridge is $81,708, with families comprising 3+ earners (396) having the highest median family income of $109,593, while families with 1 earner (735) have the lowest median family income of $54,158, accounting for 17.1% and 31.7% of families, respectively.
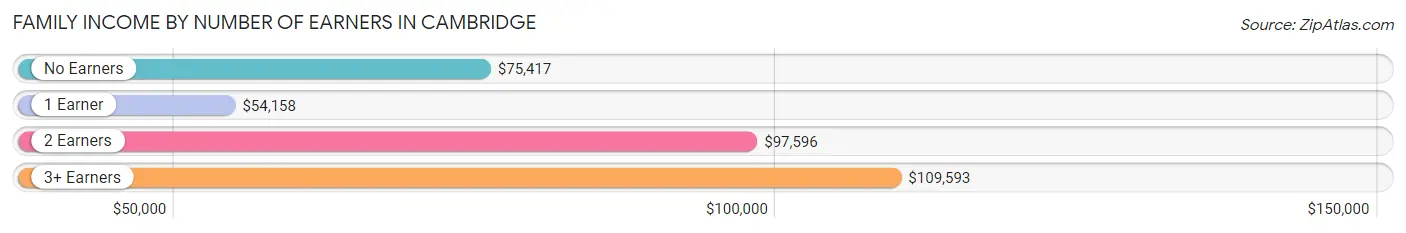
| Number of Earners | # Families | Median Income |
| No Earners | 383 (16.5%) | $75,417 |
| 1 Earner | 735 (31.7%) | $54,158 |
| 2 Earners | 803 (34.7%) | $97,596 |
| 3+ Earners | 396 (17.1%) | $109,593 |
| Total | 2,317 (100.0%) | $81,708 |
Household Income in Cambridge
Household Income Brackets in Cambridge
With 713 households falling in the category, the $75,000 to $99,999 income range is the most frequent in Cambridge, accounting for 17.7% of all households. In contrast, only 129 households (3.2%) fall into the less than $10,000 income bracket, making it the least populous group.
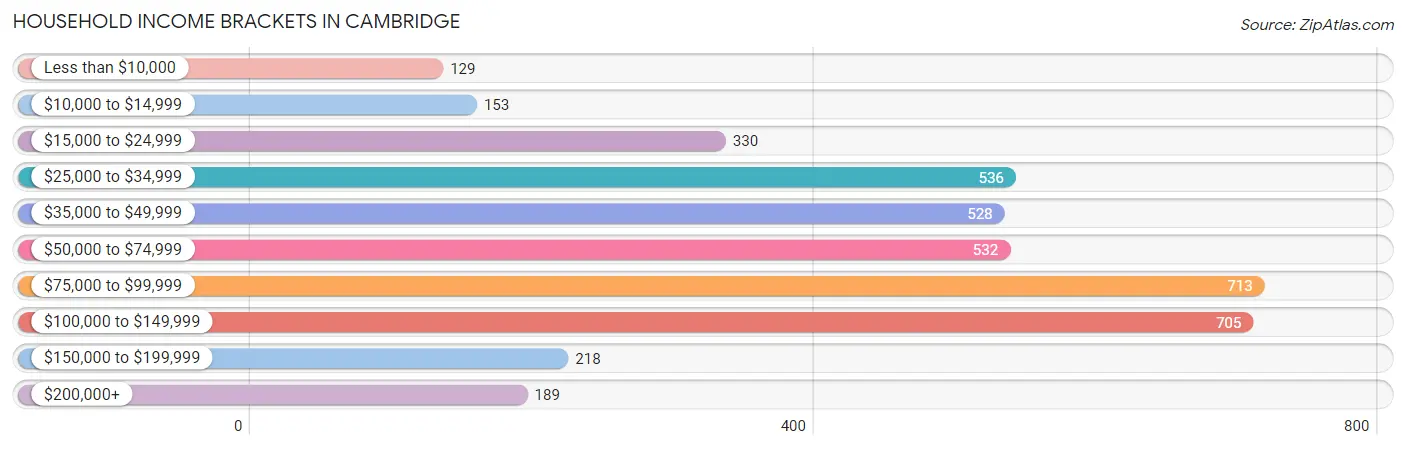
| Income Bracket | # Households | % Households |
| Less than $10,000 | 129 | 3.2% |
| $10,000 to $14,999 | 153 | 3.8% |
| $15,000 to $24,999 | 330 | 8.2% |
| $25,000 to $34,999 | 536 | 13.3% |
| $35,000 to $49,999 | 528 | 13.1% |
| $50,000 to $74,999 | 532 | 13.2% |
| $75,000 to $99,999 | 713 | 17.7% |
| $100,000 to $149,999 | 705 | 17.5% |
| $150,000 to $199,999 | 218 | 5.4% |
| $200,000+ | 189 | 4.7% |
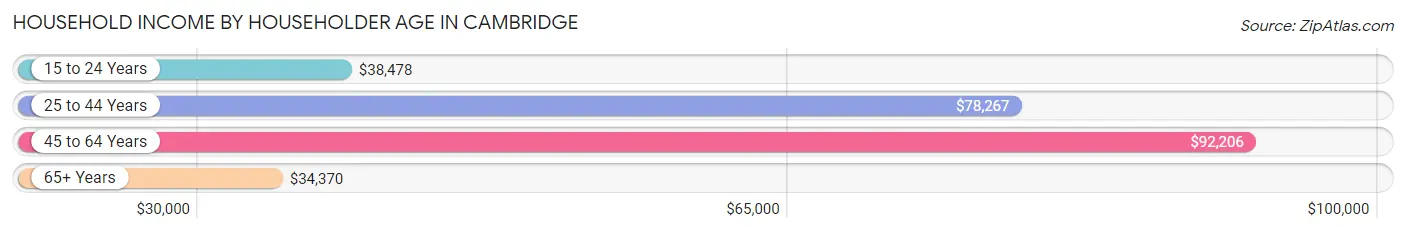
Household Income by Householder Age in Cambridge
The median household income in Cambridge is $64,286, with the highest median household income of $92,206 found in the 45 to 64 years age bracket for the primary householder. A total of 1,210 households (30.0%) fall into this category. Meanwhile, the 65+ years age bracket for the primary householder has the lowest median household income of $34,370, with 1,284 households (31.9%) in this group.
| Income Bracket | # Households | Median Income |
| 15 to 24 Years | 138 (3.4%) | $38,478 |
| 25 to 44 Years | 1,396 (34.7%) | $78,267 |
| 45 to 64 Years | 1,210 (30.0%) | $92,206 |
| 65+ Years | 1,284 (31.9%) | $34,370 |
| Total | 4,028 (100.0%) | $64,286 |
Poverty in Cambridge
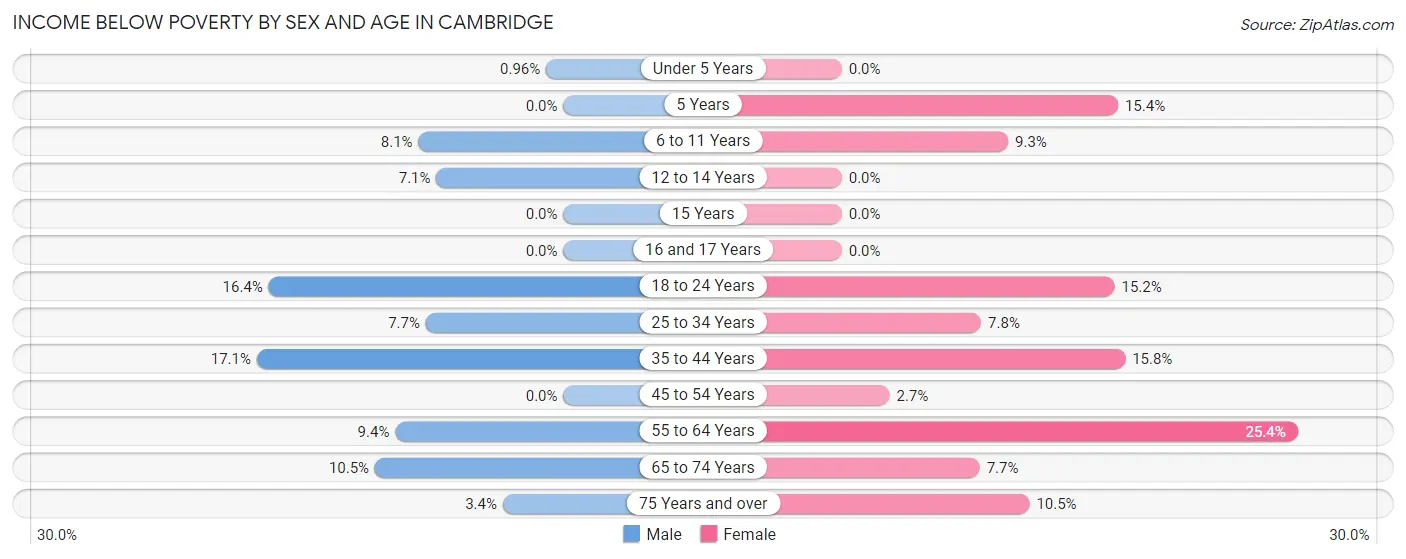
Income Below Poverty by Sex and Age in Cambridge
With 8.8% poverty level for males and 10.0% for females among the residents of Cambridge, 35 to 44 year old males and 55 to 64 year old females are the most vulnerable to poverty, with 127 males (17.1%) and 134 females (25.4%) in their respective age groups living below the poverty level.
| Age Bracket | Male | Female |
| Under 5 Years | 3 (1.0%) | 0 (0.0%) |
| 5 Years | 0 (0.0%) | 10 (15.4%) |
| 6 to 11 Years | 18 (8.1%) | 30 (9.3%) |
| 12 to 14 Years | 20 (7.1%) | 0 (0.0%) |
| 15 Years | 0 (0.0%) | 0 (0.0%) |
| 16 and 17 Years | 0 (0.0%) | 0 (0.0%) |
| 18 to 24 Years | 86 (16.4%) | 67 (15.2%) |
| 25 to 34 Years | 56 (7.7%) | 45 (7.8%) |
| 35 to 44 Years | 127 (17.1%) | 89 (15.8%) |
| 45 to 54 Years | 0 (0.0%) | 17 (2.7%) |
| 55 to 64 Years | 53 (9.4%) | 134 (25.4%) |
| 65 to 74 Years | 28 (10.5%) | 39 (7.7%) |
| 75 Years and over | 11 (3.4%) | 70 (10.4%) |
| Total | 402 (8.8%) | 501 (10.0%) |
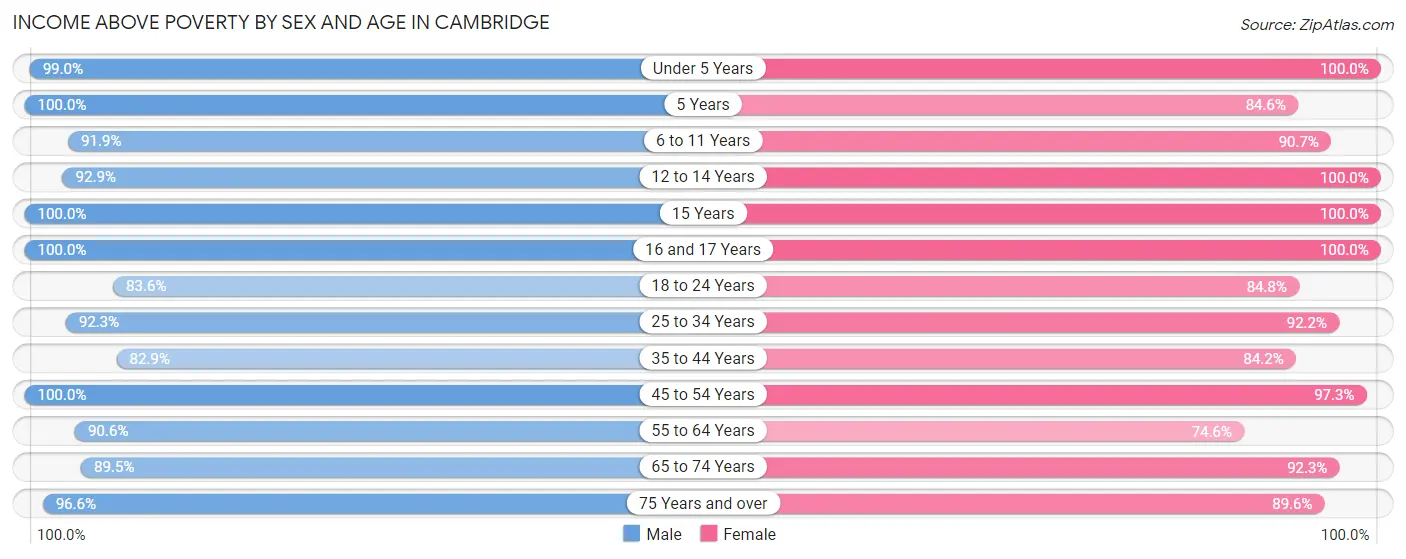
Income Above Poverty by Sex and Age in Cambridge
According to the poverty statistics in Cambridge, males aged 5 years and females aged under 5 years are the age groups that are most secure financially, with 100.0% of males and 100.0% of females in these age groups living above the poverty line.
| Age Bracket | Male | Female |
| Under 5 Years | 309 (99.0%) | 248 (100.0%) |
| 5 Years | 58 (100.0%) | 55 (84.6%) |
| 6 to 11 Years | 205 (91.9%) | 294 (90.7%) |
| 12 to 14 Years | 263 (92.9%) | 244 (100.0%) |
| 15 Years | 35 (100.0%) | 54 (100.0%) |
| 16 and 17 Years | 111 (100.0%) | 142 (100.0%) |
| 18 to 24 Years | 438 (83.6%) | 374 (84.8%) |
| 25 to 34 Years | 675 (92.3%) | 535 (92.2%) |
| 35 to 44 Years | 617 (82.9%) | 475 (84.2%) |
| 45 to 54 Years | 382 (100.0%) | 621 (97.3%) |
| 55 to 64 Years | 513 (90.6%) | 394 (74.6%) |
| 65 to 74 Years | 239 (89.5%) | 469 (92.3%) |
| 75 Years and over | 315 (96.6%) | 600 (89.5%) |
| Total | 4,160 (91.2%) | 4,505 (90.0%) |
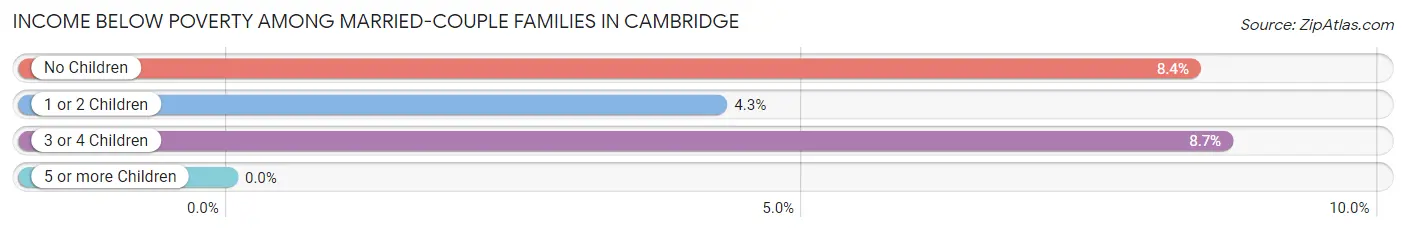
Income Below Poverty Among Married-Couple Families in Cambridge
The poverty statistics for married-couple families in Cambridge show that 7.0% or 111 of the total 1,574 families live below the poverty line. Families with 3 or 4 children have the highest poverty rate of 8.7%, comprising of 11 families. On the other hand, families with 1 or 2 children have the lowest poverty rate of 4.3%, which includes 22 families.
| Children | Above Poverty | Below Poverty |
| No Children | 853 (91.6%) | 78 (8.4%) |
| 1 or 2 Children | 494 (95.7%) | 22 (4.3%) |
| 3 or 4 Children | 116 (91.3%) | 11 (8.7%) |
| 5 or more Children | 0 (0.0%) | 0 (0.0%) |
| Total | 1,463 (92.9%) | 111 (7.0%) |
Income Below Poverty Among Single-Parent Households in Cambridge
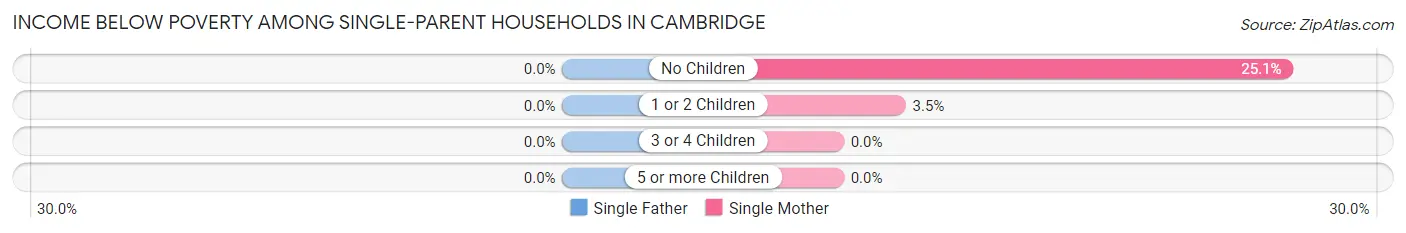
| Children | Single Father | Single Mother |
| No Children | 0 (0.0%) | 49 (25.1%) |
| 1 or 2 Children | 0 (0.0%) | 9 (3.5%) |
| 3 or 4 Children | 0 (0.0%) | 0 (0.0%) |
| 5 or more Children | 0 (0.0%) | 0 (0.0%) |
| Total | 0 (0.0%) | 58 (12.0%) |
Income Below Poverty Among Married-Couple vs Single-Parent Households in Cambridge
The poverty data for Cambridge shows that 111 of the married-couple family households (7.0%) and 58 of the single-parent households (7.8%) are living below the poverty level. Within the married-couple family households, those with 3 or 4 children have the highest poverty rate, with 11 households (8.7%) falling below the poverty line. Among the single-parent households, those with no children have the highest poverty rate, with 49 household (23.1%) living below poverty.
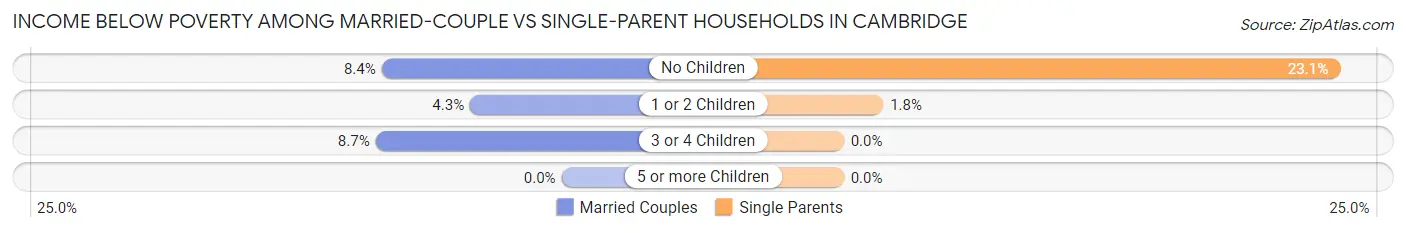
| Children | Married-Couple Families | Single-Parent Households |
| No Children | 78 (8.4%) | 49 (23.1%) |
| 1 or 2 Children | 22 (4.3%) | 9 (1.8%) |
| 3 or 4 Children | 11 (8.7%) | 0 (0.0%) |
| 5 or more Children | 0 (0.0%) | 0 (0.0%) |
| Total | 111 (7.0%) | 58 (7.8%) |
Race in Cambridge
The most populous races in Cambridge are White / Caucasian (8,908 | 91.6%), Asian (382 | 3.9%), and Two or more Races (183 | 1.9%).
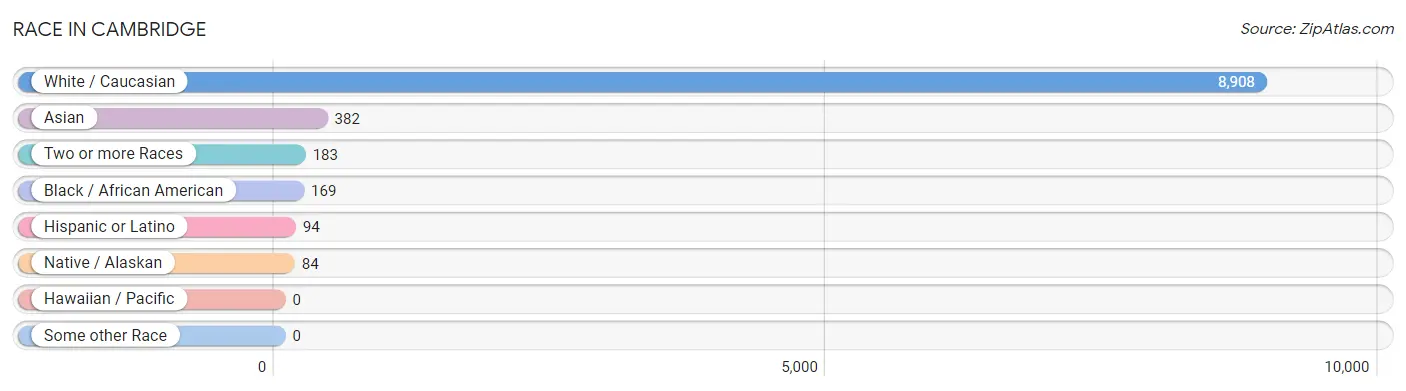
| Race | # Population | % Population |
| Asian | 382 | 3.9% |
| Black / African American | 169 | 1.7% |
| Hawaiian / Pacific | 0 | 0.0% |
| Hispanic or Latino | 94 | 1.0% |
| Native / Alaskan | 84 | 0.9% |
| White / Caucasian | 8,908 | 91.6% |
| Two or more Races | 183 | 1.9% |
| Some other Race | 0 | 0.0% |
| Total | 9,726 | 100.0% |
Ancestry in Cambridge
The most populous ancestries reported in Cambridge are German (2,260 | 23.2%), Swedish (1,484 | 15.3%), Norwegian (1,385 | 14.2%), Irish (932 | 9.6%), and English (465 | 4.8%), together accounting for 67.1% of all Cambridge residents.
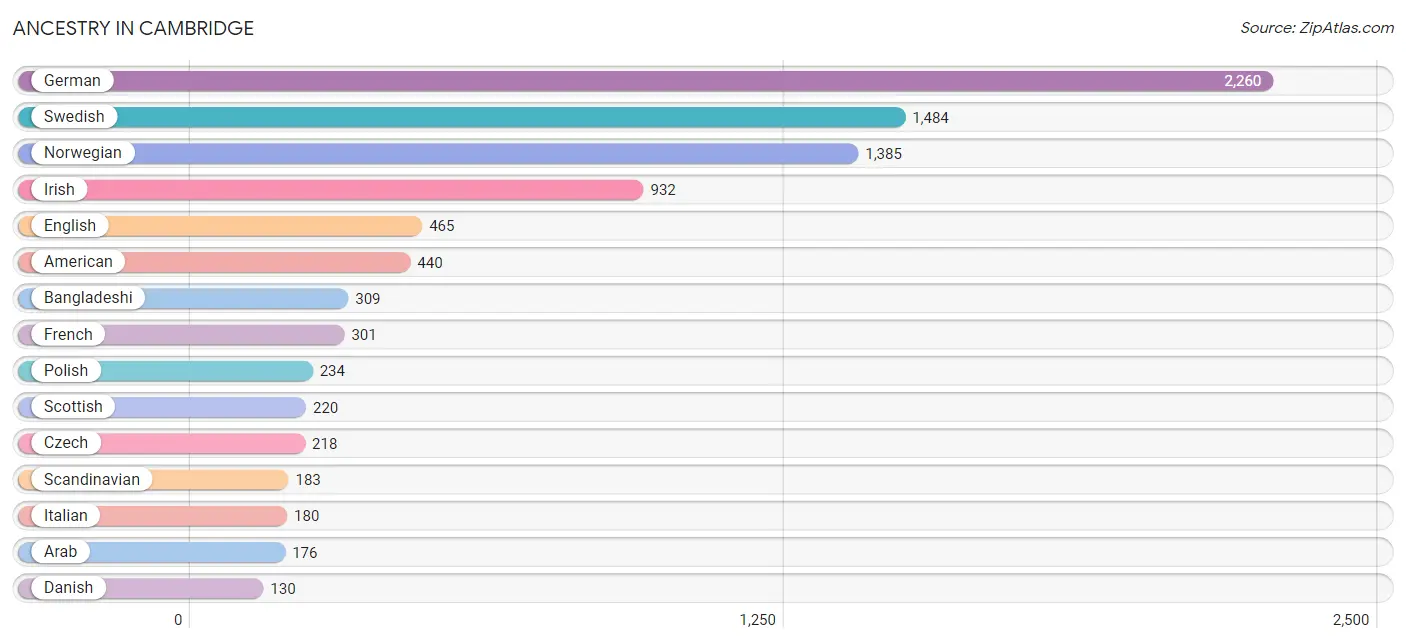
| Ancestry | # Population | % Population |
| African | 101 | 1.0% |
| American | 440 | 4.5% |
| Arab | 176 | 1.8% |
| Bangladeshi | 309 | 3.2% |
| British | 11 | 0.1% |
| Canadian | 47 | 0.5% |
| Chippewa | 62 | 0.6% |
| Cuban | 23 | 0.2% |
| Czech | 218 | 2.2% |
| Czechoslovakian | 16 | 0.2% |
| Danish | 130 | 1.3% |
| Dutch | 83 | 0.9% |
| English | 465 | 4.8% |
| European | 12 | 0.1% |
| Finnish | 108 | 1.1% |
| French | 301 | 3.1% |
| French American Indian | 9 | 0.1% |
| French Canadian | 17 | 0.2% |
| German | 2,260 | 23.2% |
| Hopi | 26 | 0.3% |
| Indian (Asian) | 54 | 0.6% |
| Irish | 932 | 9.6% |
| Italian | 180 | 1.8% |
| Korean | 19 | 0.2% |
| Lebanese | 44 | 0.4% |
| Luxembourger | 20 | 0.2% |
| Malaysian | 31 | 0.3% |
| Mexican | 28 | 0.3% |
| Navajo | 26 | 0.3% |
| Nigerian | 2 | 0.0% |
| Northern European | 12 | 0.1% |
| Norwegian | 1,385 | 14.2% |
| Polish | 234 | 2.4% |
| Scandinavian | 183 | 1.9% |
| Scotch-Irish | 20 | 0.2% |
| Scottish | 220 | 2.3% |
| Sioux | 29 | 0.3% |
| Slavic | 58 | 0.6% |
| Slovene | 14 | 0.1% |
| Subsaharan African | 103 | 1.1% |
| Swedish | 1,484 | 15.3% |
| Swiss | 89 | 0.9% |
| Syrian | 106 | 1.1% | View All 43 Rows |
Immigrants in Cambridge
The most numerous immigrant groups reported in Cambridge came from Asia (179 | 1.8%), Laos (125 | 1.3%), South Eastern Asia (125 | 1.3%), Central America (65 | 0.7%), and Latin America (65 | 0.7%), together accounting for 5.8% of all Cambridge residents.
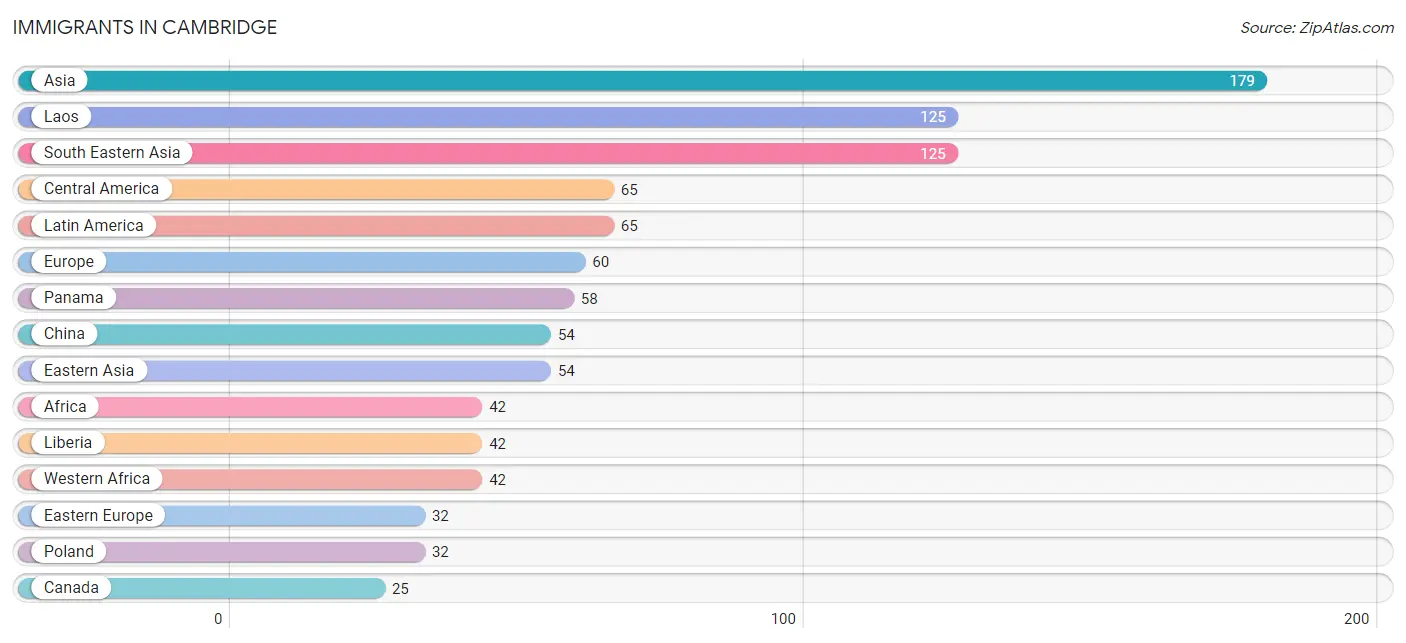
| Immigration Origin | # Population | % Population |
| Africa | 42 | 0.4% |
| Asia | 179 | 1.8% |
| Canada | 25 | 0.3% |
| Central America | 65 | 0.7% |
| China | 54 | 0.6% |
| Eastern Asia | 54 | 0.6% |
| Eastern Europe | 32 | 0.3% |
| Europe | 60 | 0.6% |
| Germany | 17 | 0.2% |
| Laos | 125 | 1.3% |
| Latin America | 65 | 0.7% |
| Liberia | 42 | 0.4% |
| Mexico | 7 | 0.1% |
| Northern Europe | 11 | 0.1% |
| Panama | 58 | 0.6% |
| Poland | 32 | 0.3% |
| South Eastern Asia | 125 | 1.3% |
| Western Africa | 42 | 0.4% |
| Western Europe | 17 | 0.2% | View All 19 Rows |
Sex and Age in Cambridge
Sex and Age in Cambridge
The most populous age groups in Cambridge are 30 to 34 Years (457 | 9.8%) for men and 30 to 34 Years (413 | 8.2%) for women.
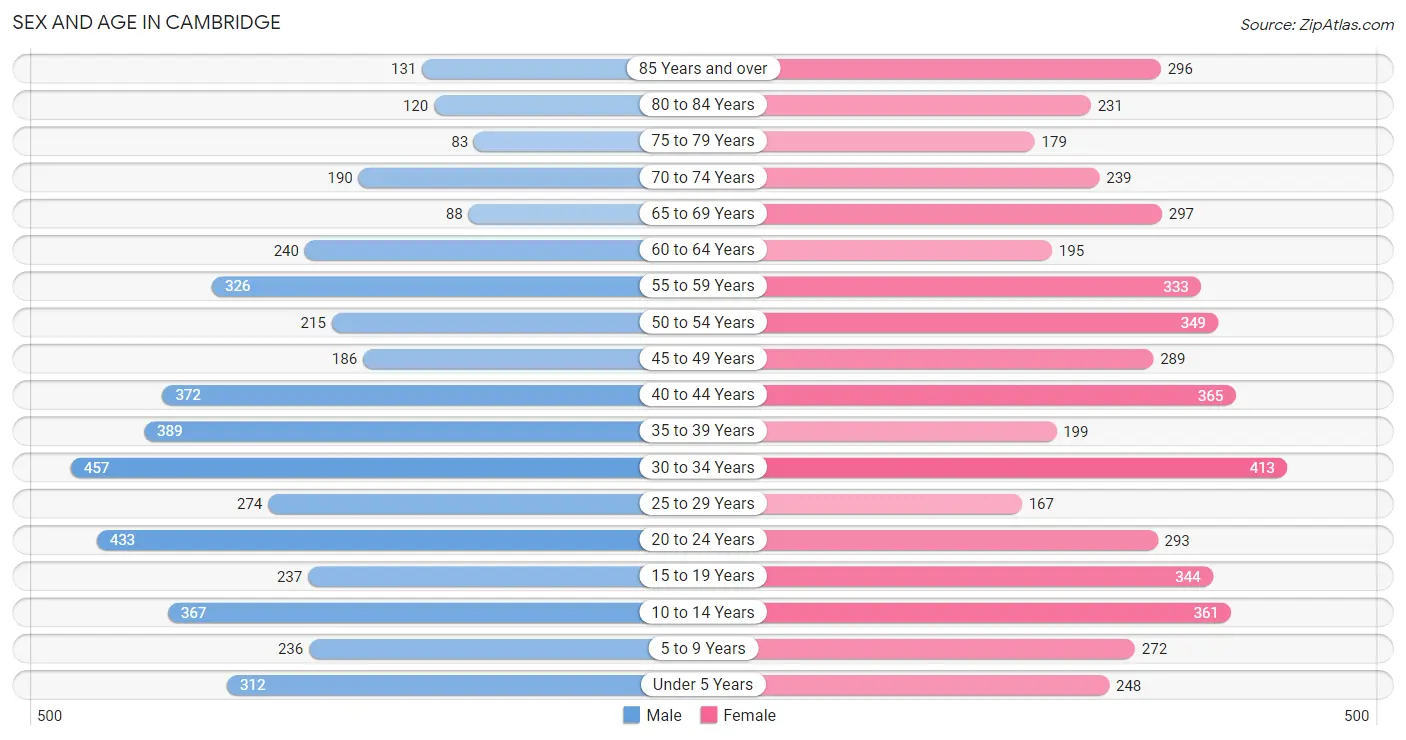
| Age Bracket | Male | Female |
| Under 5 Years | 312 (6.7%) | 248 (4.9%) |
| 5 to 9 Years | 236 (5.1%) | 272 (5.4%) |
| 10 to 14 Years | 367 (7.9%) | 361 (7.1%) |
| 15 to 19 Years | 237 (5.1%) | 344 (6.8%) |
| 20 to 24 Years | 433 (9.3%) | 293 (5.8%) |
| 25 to 29 Years | 274 (5.9%) | 167 (3.3%) |
| 30 to 34 Years | 457 (9.8%) | 413 (8.2%) |
| 35 to 39 Years | 389 (8.4%) | 199 (3.9%) |
| 40 to 44 Years | 372 (8.0%) | 365 (7.2%) |
| 45 to 49 Years | 186 (4.0%) | 289 (5.7%) |
| 50 to 54 Years | 215 (4.6%) | 349 (6.9%) |
| 55 to 59 Years | 326 (7.0%) | 333 (6.6%) |
| 60 to 64 Years | 240 (5.1%) | 195 (3.8%) |
| 65 to 69 Years | 88 (1.9%) | 297 (5.9%) |
| 70 to 74 Years | 190 (4.1%) | 239 (4.7%) |
| 75 to 79 Years | 83 (1.8%) | 179 (3.5%) |
| 80 to 84 Years | 120 (2.6%) | 231 (4.6%) |
| 85 Years and over | 131 (2.8%) | 296 (5.8%) |
| Total | 4,656 (100.0%) | 5,070 (100.0%) |
Families and Households in Cambridge
Median Family Size in Cambridge
The median family size in Cambridge is 3.03 persons per family, with married-couple families (1,574 | 67.9%) accounting for the largest median family size of 3.08 persons per family. On the other hand, single male/father families (260 | 11.2%) represent the smallest median family size with 2.87 persons per family.
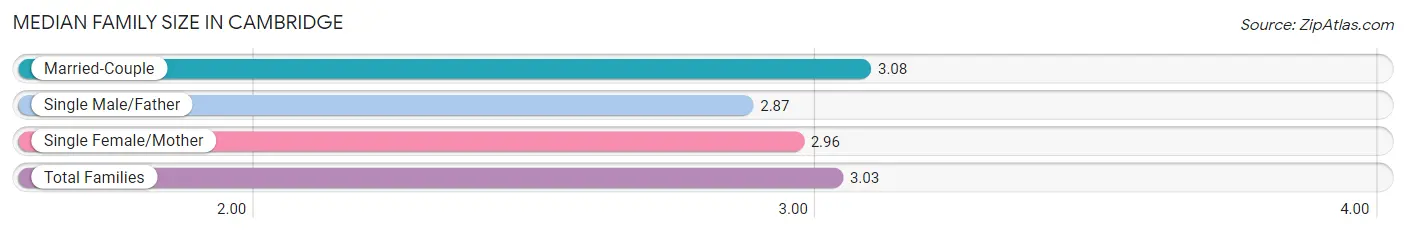
| Family Type | # Families | Family Size |
| Married-Couple | 1,574 (67.9%) | 3.08 |
| Single Male/Father | 260 (11.2%) | 2.87 |
| Single Female/Mother | 483 (20.8%) | 2.96 |
| Total Families | 2,317 (100.0%) | 3.03 |
Median Household Size in Cambridge
The median household size in Cambridge is 2.36 persons per household, with single male/father households (260 | 6.5%) accounting for the largest median household size of 3.65 persons per household. non-family households (1,711 | 42.5%) represent the smallest median household size with 1.23 persons per household.
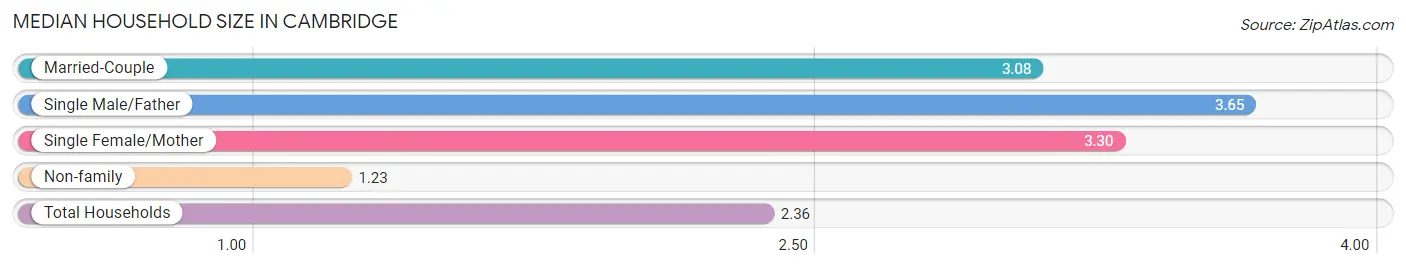
| Household Type | # Households | Household Size |
| Married-Couple | 1,574 (39.1%) | 3.08 |
| Single Male/Father | 260 (6.5%) | 3.65 |
| Single Female/Mother | 483 (12.0%) | 3.30 |
| Non-family | 1,711 (42.5%) | 1.23 |
| Total Households | 4,028 (100.0%) | 2.36 |
Household Size by Marriage Status in Cambridge
Out of a total of 4,028 households in Cambridge, 2,317 (57.5%) are family households, while 1,711 (42.5%) are nonfamily households. The most numerous type of family households are 2-person households, comprising 1,016, and the most common type of nonfamily households are 1-person households, comprising 1,444.
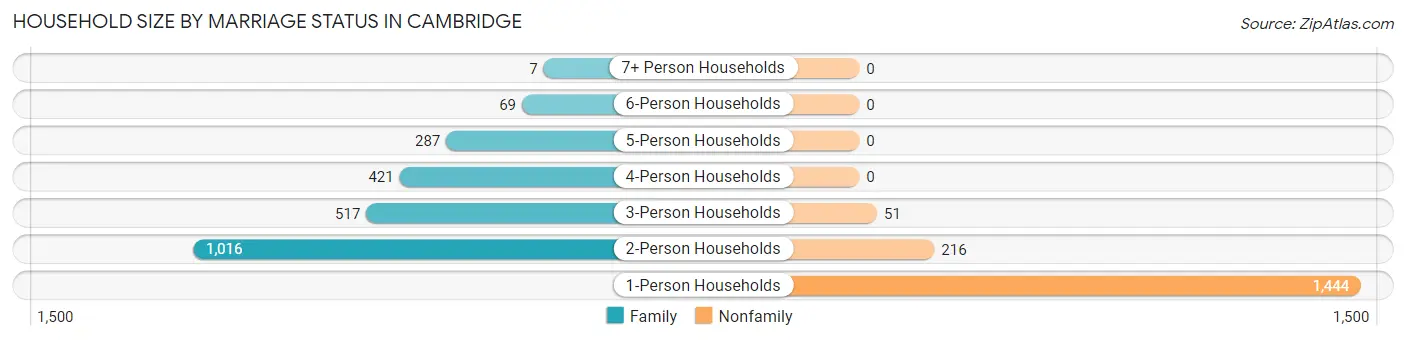
| Household Size | Family Households | Nonfamily Households |
| 1-Person Households | - | 1,444 (35.8%) |
| 2-Person Households | 1,016 (25.2%) | 216 (5.4%) |
| 3-Person Households | 517 (12.8%) | 51 (1.3%) |
| 4-Person Households | 421 (10.4%) | 0 (0.0%) |
| 5-Person Households | 287 (7.1%) | 0 (0.0%) |
| 6-Person Households | 69 (1.7%) | 0 (0.0%) |
| 7+ Person Households | 7 (0.2%) | 0 (0.0%) |
| Total | 2,317 (57.5%) | 1,711 (42.5%) |
Female Fertility in Cambridge
Fertility by Age in Cambridge
Average fertility rate in Cambridge is 38.0 births per 1,000 women. Women in the age bracket of 20 to 34 years have the highest fertility rate with 73.0 births per 1,000 women. Women in the age bracket of 20 to 34 years acount for 81.0% of all women with births.
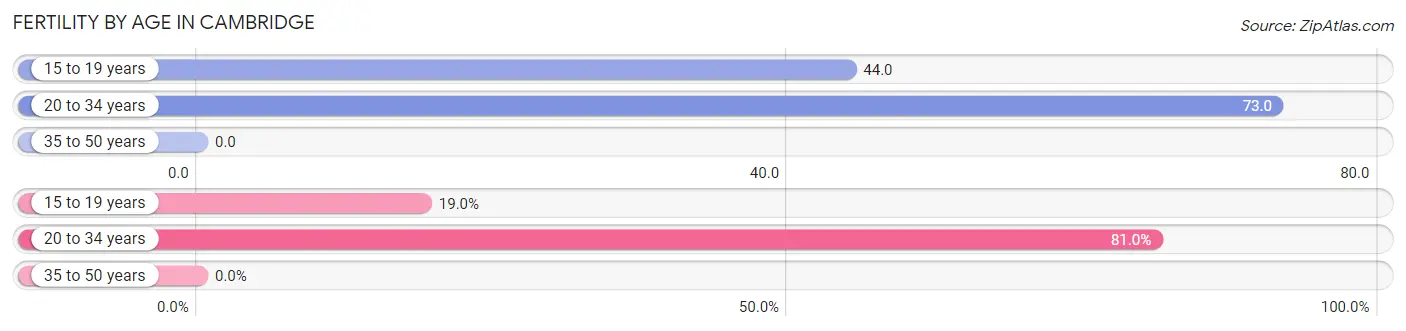
| Age Bracket | Women with Births | Births / 1,000 Women |
| 15 to 19 years | 15 (19.0%) | 44.0 |
| 20 to 34 years | 64 (81.0%) | 73.0 |
| 35 to 50 years | 0 (0.0%) | 0.0 |
| Total | 79 (100.0%) | 38.0 |
Fertility by Age by Marriage Status in Cambridge
40.5% of women with births (79) in Cambridge are married. The highest percentage of unmarried women with births falls into 15 to 19 years age bracket with 100.0% of them unmarried at the time of birth, while the lowest percentage of unmarried women with births belong to 20 to 34 years age bracket with 50.0% of them unmarried.
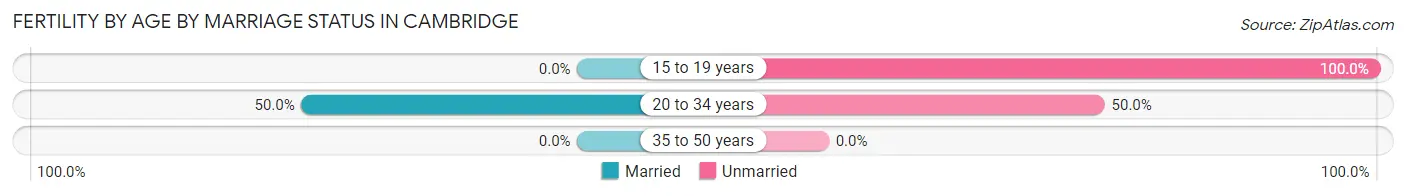
| Age Bracket | Married | Unmarried |
| 15 to 19 years | 0 (0.0%) | 15 (100.0%) |
| 20 to 34 years | 32 (50.0%) | 32 (50.0%) |
| 35 to 50 years | 0 (0.0%) | 0 (0.0%) |
| Total | 32 (40.5%) | 47 (59.5%) |
Fertility by Education in Cambridge
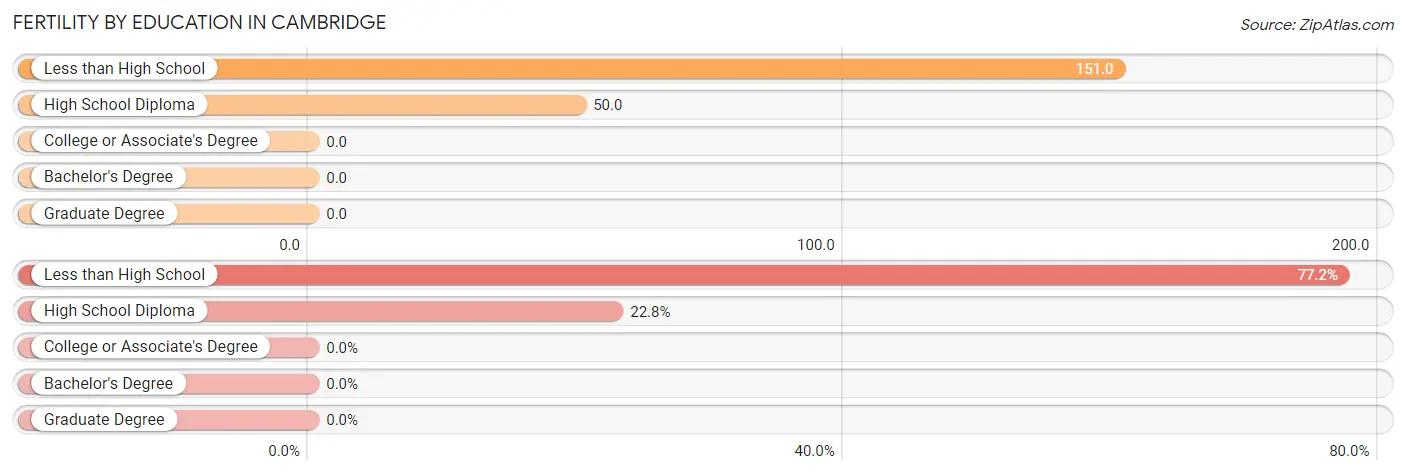
| Educational Attainment | Women with Births | Births / 1,000 Women |
| Less than High School | 61 (77.2%) | 151.0 |
| High School Diploma | 18 (22.8%) | 50.0 |
| College or Associate's Degree | 0 (0.0%) | 0.0 |
| Bachelor's Degree | 0 (0.0%) | 0.0 |
| Graduate Degree | 0 (0.0%) | 0.0 |
| Total | 79 (100.0%) | 38.0 |
Fertility by Education by Marriage Status in Cambridge
59.5% of women with births in Cambridge are unmarried. Women with the educational attainment of high school diploma are most likely to be married with 100.0% of them married at childbirth, while women with the educational attainment of less than high school are least likely to be married with 77.0% of them unmarried at childbirth.
| Educational Attainment | Married | Unmarried |
| Less than High School | 14 (23.0%) | 47 (77.0%) |
| High School Diploma | 18 (100.0%) | 0 (0.0%) |
| College or Associate's Degree | 0 (0.0%) | 0 (0.0%) |
| Bachelor's Degree | 0 (0.0%) | 0 (0.0%) |
| Graduate Degree | 0 (0.0%) | 0 (0.0%) |
| Total | 32 (40.5%) | 47 (59.5%) |
Employment Characteristics in Cambridge
Employment by Class of Employer in Cambridge
Among the 4,693 employed individuals in Cambridge, private company employees (3,074 | 65.5%), not-for-profit organizations (583 | 12.4%), and local government employees (419 | 8.9%) make up the most common classes of employment.
| Employer Class | # Employees | % Employees |
| Private Company Employees | 3,074 | 65.5% |
| Self-Employed (Incorporated) | 41 | 0.9% |
| Self-Employed (Not Incorporated) | 175 | 3.7% |
| Not-for-profit Organizations | 583 | 12.4% |
| Local Government Employees | 419 | 8.9% |
| State Government Employees | 277 | 5.9% |
| Federal Government Employees | 124 | 2.6% |
| Unpaid Family Workers | 0 | 0.0% |
| Total | 4,693 | 100.0% |
Employment Status by Age in Cambridge
According to the labor force statistics for Cambridge, out of the total population over 16 years of age (7,841), 62.7% or 4,916 individuals are in the labor force, with 2.7% or 133 of them unemployed. The age group with the highest labor force participation rate is 25 to 29 years, with 95.0% or 419 individuals in the labor force. Within the labor force, the 16 to 19 years age range has the highest percentage of unemployed individuals, with 15.8% or 37 of them being unemployed.
| Age Bracket | In Labor Force | Unemployed |
| 16 to 19 Years | 234 (47.6%) | 37 (15.8%) |
| 20 to 24 Years | 577 (79.5%) | 17 (2.9%) |
| 25 to 29 Years | 419 (95.0%) | 7 (1.7%) |
| 30 to 34 Years | 737 (84.7%) | 26 (3.5%) |
| 35 to 44 Years | 1,084 (81.8%) | 39 (3.6%) |
| 45 to 54 Years | 929 (89.4%) | 0 (0.0%) |
| 55 to 59 Years | 551 (83.6%) | 0 (0.0%) |
| 60 to 64 Years | 222 (51.0%) | 9 (4.1%) |
| 65 to 74 Years | 111 (13.6%) | 0 (0.0%) |
| 75 Years and over | 52 (5.0%) | 0 (0.0%) |
| Total | 4,916 (62.7%) | 133 (2.7%) |
Employment Status by Educational Attainment in Cambridge
According to labor force statistics for Cambridge, 82.7% of individuals (3,944) out of the total population between 25 and 64 years of age (4,769) are in the labor force, with 2.1% or 83 of them being unemployed. The group with the highest labor force participation rate are those with the educational attainment of bachelor's degree or higher, with 90.8% or 837 individuals in the labor force. Within the labor force, individuals with high school diploma education have the highest percentage of unemployment, with 2.8% or 34 of them being unemployed.
| Educational Attainment | In Labor Force | Unemployed |
| Less than High School | 84 (26.2%) | 0 (0.0%) |
| High School Diploma | 1,229 (81.9%) | 42 (2.8%) |
| College / Associate Degree | 1,793 (88.5%) | 32 (1.6%) |
| Bachelor's Degree or higher | 837 (90.8%) | 18 (2.0%) |
| Total | 3,944 (82.7%) | 100 (2.1%) |
Employment Occupations by Sex in Cambridge
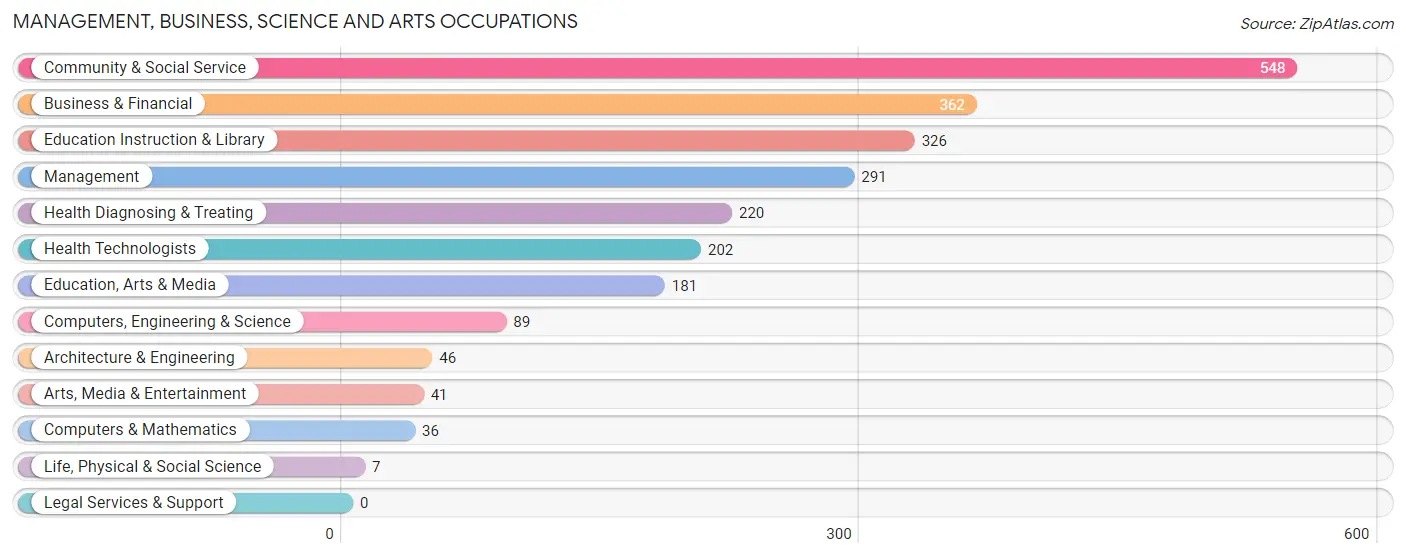
Management, Business, Science and Arts Occupations
The most common Management, Business, Science and Arts occupations in Cambridge are Community & Social Service (548 | 11.5%), Business & Financial (362 | 7.6%), Education Instruction & Library (326 | 6.8%), Management (291 | 6.1%), and Health Diagnosing & Treating (220 | 4.6%).
Management, Business, Science and Arts Occupations by Sex
Within the Management, Business, Science and Arts occupations in Cambridge, the most male-oriented occupations are Life, Physical & Social Science (100.0%), Architecture & Engineering (89.1%), and Computers, Engineering & Science (65.2%), while the most female-oriented occupations are Arts, Media & Entertainment (100.0%), Education, Arts & Media (81.2%), and Health Diagnosing & Treating (76.4%).
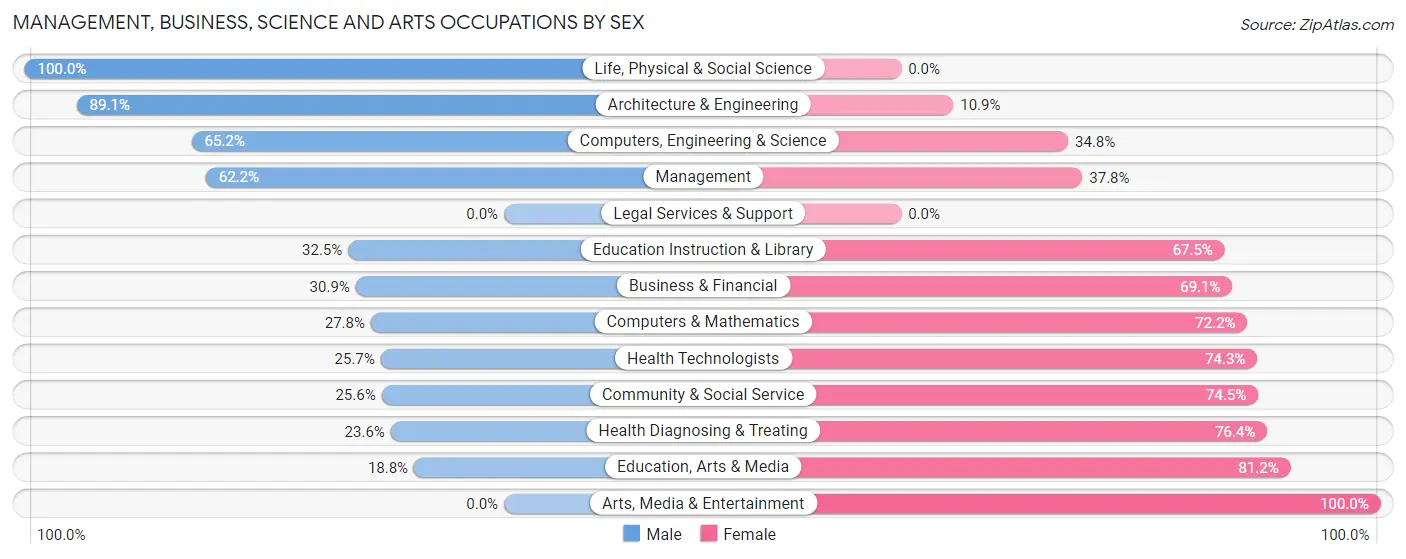
| Occupation | Male | Female |
| Management | 181 (62.2%) | 110 (37.8%) |
| Business & Financial | 112 (30.9%) | 250 (69.1%) |
| Computers, Engineering & Science | 58 (65.2%) | 31 (34.8%) |
| Computers & Mathematics | 10 (27.8%) | 26 (72.2%) |
| Architecture & Engineering | 41 (89.1%) | 5 (10.9%) |
| Life, Physical & Social Science | 7 (100.0%) | 0 (0.0%) |
| Community & Social Service | 140 (25.6%) | 408 (74.5%) |
| Education, Arts & Media | 34 (18.8%) | 147 (81.2%) |
| Legal Services & Support | 0 (0.0%) | 0 (0.0%) |
| Education Instruction & Library | 106 (32.5%) | 220 (67.5%) |
| Arts, Media & Entertainment | 0 (0.0%) | 41 (100.0%) |
| Health Diagnosing & Treating | 52 (23.6%) | 168 (76.4%) |
| Health Technologists | 52 (25.7%) | 150 (74.3%) |
| Total (Category) | 543 (36.0%) | 967 (64.0%) |
| Total (Overall) | 2,457 (51.4%) | 2,324 (48.6%) |
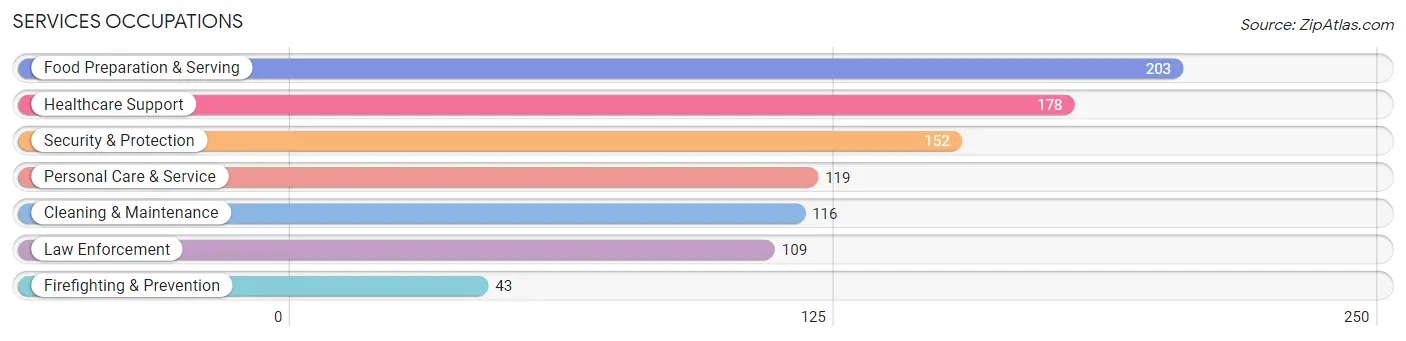
Services Occupations
The most common Services occupations in Cambridge are Food Preparation & Serving (203 | 4.3%), Healthcare Support (178 | 3.7%), Security & Protection (152 | 3.2%), Personal Care & Service (119 | 2.5%), and Cleaning & Maintenance (116 | 2.4%).
Services Occupations by Sex
Within the Services occupations in Cambridge, the most male-oriented occupations are Law Enforcement (100.0%), Security & Protection (84.2%), and Firefighting & Prevention (44.2%), while the most female-oriented occupations are Personal Care & Service (100.0%), Healthcare Support (93.8%), and Food Preparation & Serving (92.6%).
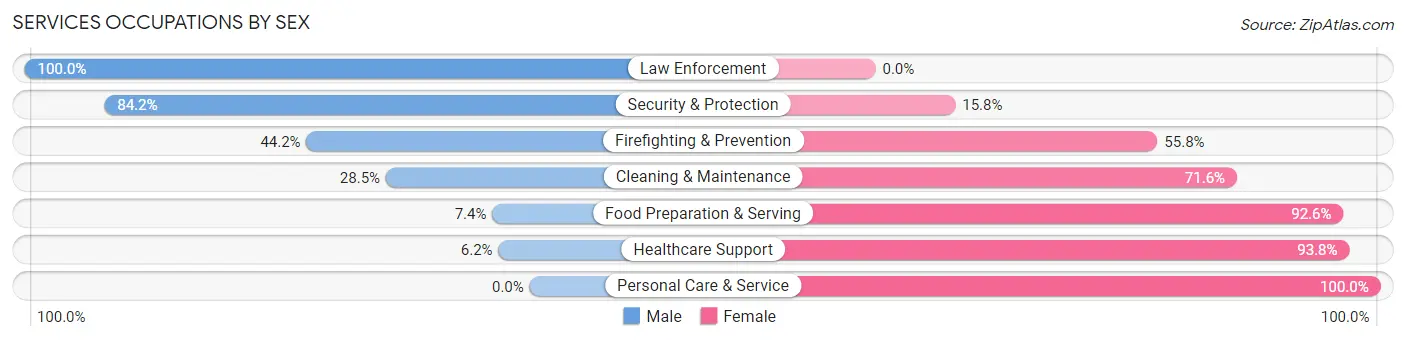
| Occupation | Male | Female |
| Healthcare Support | 11 (6.2%) | 167 (93.8%) |
| Security & Protection | 128 (84.2%) | 24 (15.8%) |
| Firefighting & Prevention | 19 (44.2%) | 24 (55.8%) |
| Law Enforcement | 109 (100.0%) | 0 (0.0%) |
| Food Preparation & Serving | 15 (7.4%) | 188 (92.6%) |
| Cleaning & Maintenance | 33 (28.4%) | 83 (71.6%) |
| Personal Care & Service | 0 (0.0%) | 119 (100.0%) |
| Total (Category) | 187 (24.3%) | 581 (75.6%) |
| Total (Overall) | 2,457 (51.4%) | 2,324 (48.6%) |
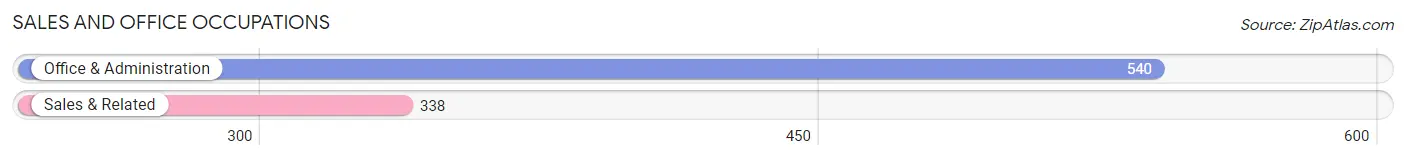
Sales and Office Occupations
The most common Sales and Office occupations in Cambridge are Office & Administration (540 | 11.3%), and Sales & Related (338 | 7.1%).
Sales and Office Occupations by Sex
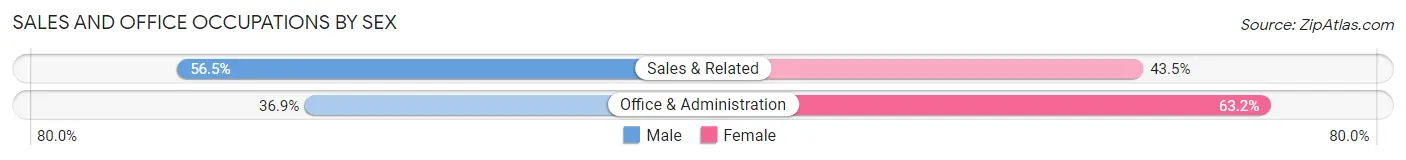
| Occupation | Male | Female |
| Sales & Related | 191 (56.5%) | 147 (43.5%) |
| Office & Administration | 199 (36.8%) | 341 (63.1%) |
| Total (Category) | 390 (44.4%) | 488 (55.6%) |
| Total (Overall) | 2,457 (51.4%) | 2,324 (48.6%) |
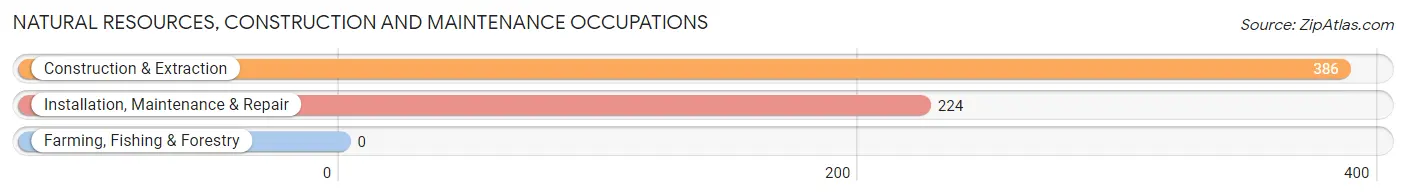
Natural Resources, Construction and Maintenance Occupations
The most common Natural Resources, Construction and Maintenance occupations in Cambridge are Construction & Extraction (386 | 8.1%), and Installation, Maintenance & Repair (224 | 4.7%).
Natural Resources, Construction and Maintenance Occupations by Sex
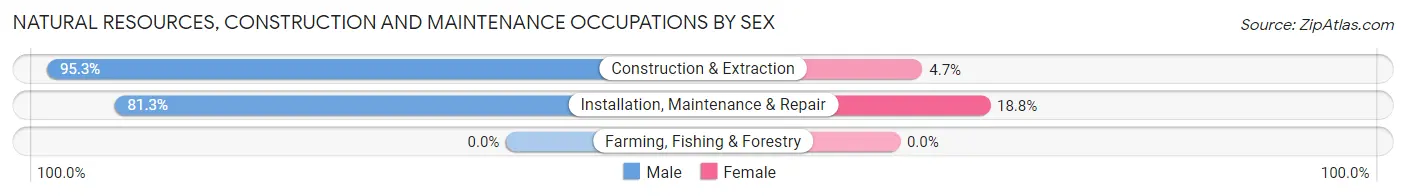
| Occupation | Male | Female |
| Farming, Fishing & Forestry | 0 (0.0%) | 0 (0.0%) |
| Construction & Extraction | 368 (95.3%) | 18 (4.7%) |
| Installation, Maintenance & Repair | 182 (81.2%) | 42 (18.8%) |
| Total (Category) | 550 (90.2%) | 60 (9.8%) |
| Total (Overall) | 2,457 (51.4%) | 2,324 (48.6%) |
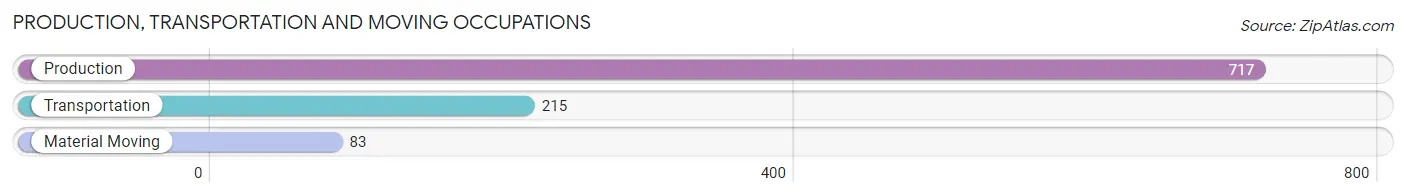
Production, Transportation and Moving Occupations
The most common Production, Transportation and Moving occupations in Cambridge are Production (717 | 15.0%), Transportation (215 | 4.5%), and Material Moving (83 | 1.7%).
Production, Transportation and Moving Occupations by Sex
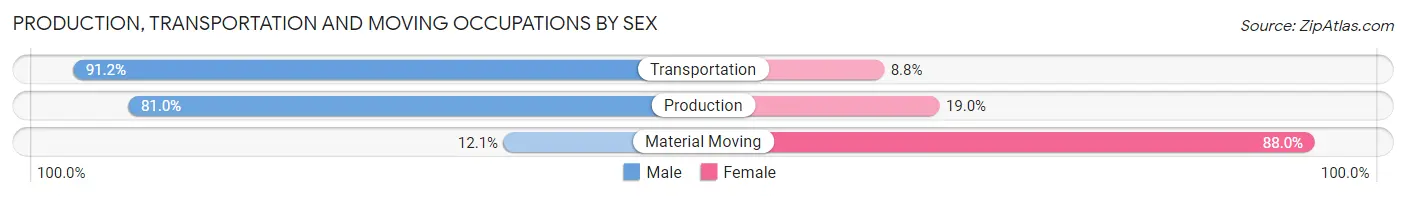
| Occupation | Male | Female |
| Production | 581 (81.0%) | 136 (19.0%) |
| Transportation | 196 (91.2%) | 19 (8.8%) |
| Material Moving | 10 (12.0%) | 73 (87.9%) |
| Total (Category) | 787 (77.5%) | 228 (22.5%) |
| Total (Overall) | 2,457 (51.4%) | 2,324 (48.6%) |
Employment Industries by Sex in Cambridge
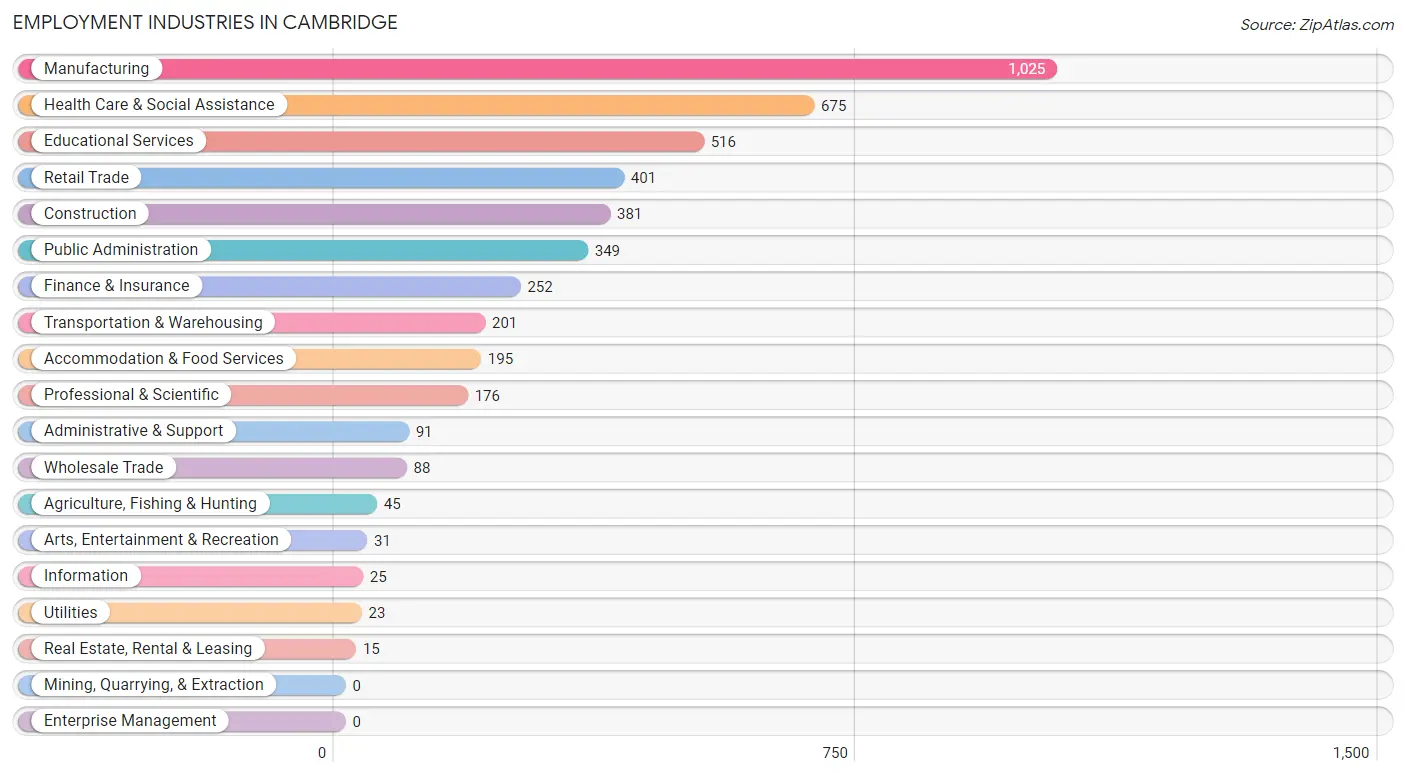
Employment Industries in Cambridge
The major employment industries in Cambridge include Manufacturing (1,025 | 21.4%), Health Care & Social Assistance (675 | 14.1%), Educational Services (516 | 10.8%), Retail Trade (401 | 8.4%), and Construction (381 | 8.0%).
Employment Industries by Sex in Cambridge
The Cambridge industries that see more men than women are Wholesale Trade (100.0%), Utilities (100.0%), and Real Estate, Rental & Leasing (100.0%), whereas the industries that tend to have a higher number of women are Administrative & Support (100.0%), Health Care & Social Assistance (87.7%), and Accommodation & Food Services (81.5%).
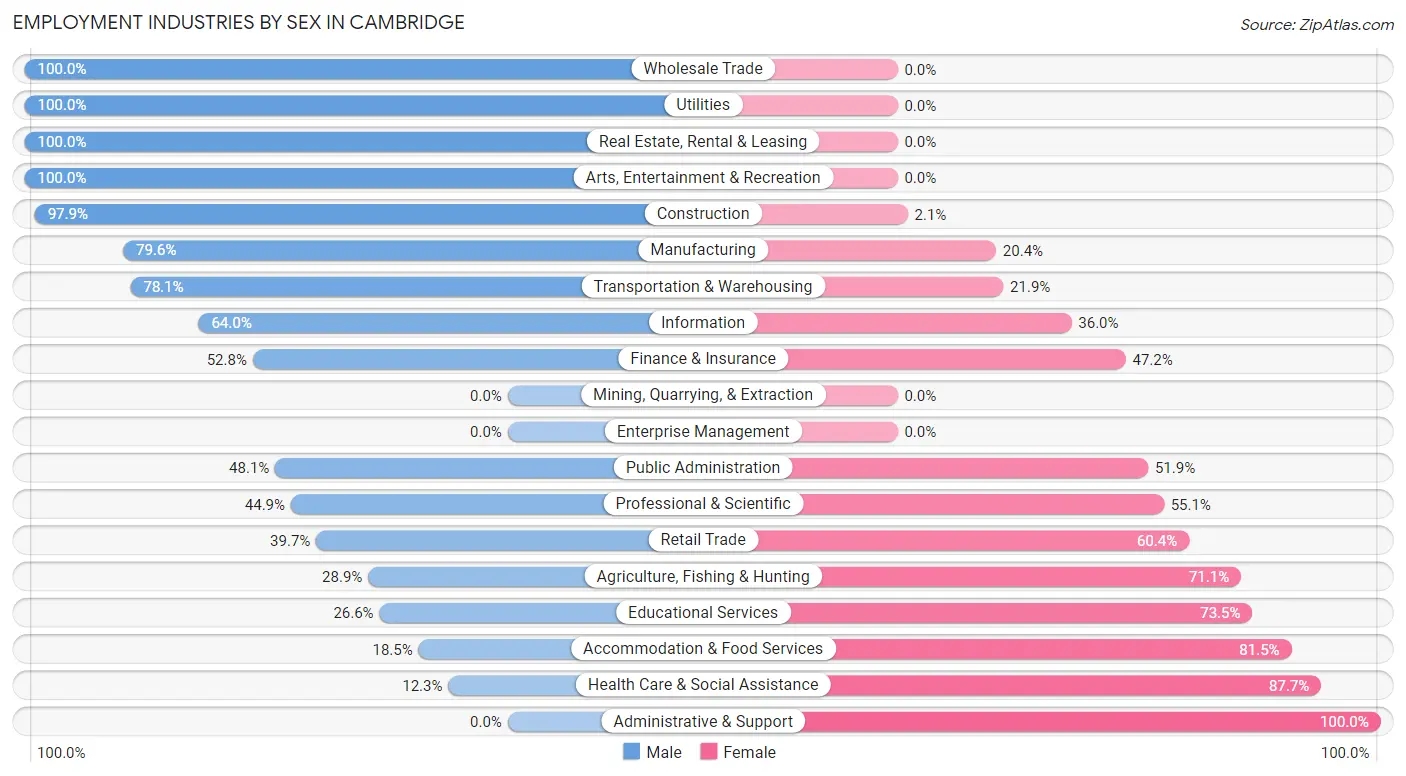
| Industry | Male | Female |
| Agriculture, Fishing & Hunting | 13 (28.9%) | 32 (71.1%) |
| Mining, Quarrying, & Extraction | 0 (0.0%) | 0 (0.0%) |
| Construction | 373 (97.9%) | 8 (2.1%) |
| Manufacturing | 816 (79.6%) | 209 (20.4%) |
| Wholesale Trade | 88 (100.0%) | 0 (0.0%) |
| Retail Trade | 159 (39.7%) | 242 (60.4%) |
| Transportation & Warehousing | 157 (78.1%) | 44 (21.9%) |
| Utilities | 23 (100.0%) | 0 (0.0%) |
| Information | 16 (64.0%) | 9 (36.0%) |
| Finance & Insurance | 133 (52.8%) | 119 (47.2%) |
| Real Estate, Rental & Leasing | 15 (100.0%) | 0 (0.0%) |
| Professional & Scientific | 79 (44.9%) | 97 (55.1%) |
| Enterprise Management | 0 (0.0%) | 0 (0.0%) |
| Administrative & Support | 0 (0.0%) | 91 (100.0%) |
| Educational Services | 137 (26.6%) | 379 (73.5%) |
| Health Care & Social Assistance | 83 (12.3%) | 592 (87.7%) |
| Arts, Entertainment & Recreation | 31 (100.0%) | 0 (0.0%) |
| Accommodation & Food Services | 36 (18.5%) | 159 (81.5%) |
| Public Administration | 168 (48.1%) | 181 (51.9%) |
| Total | 2,457 (51.4%) | 2,324 (48.6%) |
Education in Cambridge
School Enrollment in Cambridge
The most common levels of schooling among the 2,219 students in Cambridge are middle school (591 | 26.6%), high school (550 | 24.8%), and college / undergraduate (345 | 15.5%).
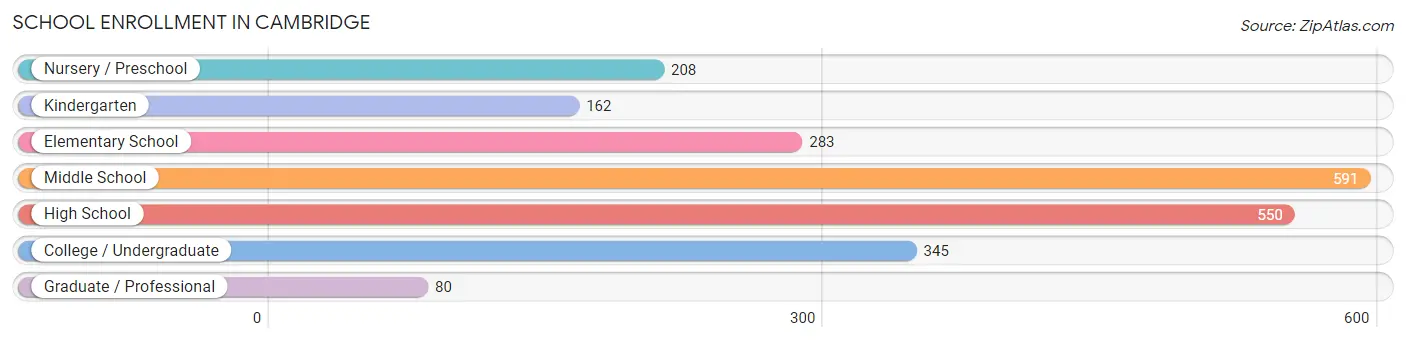
| School Level | # Students | % Students |
| Nursery / Preschool | 208 | 9.4% |
| Kindergarten | 162 | 7.3% |
| Elementary School | 283 | 12.8% |
| Middle School | 591 | 26.6% |
| High School | 550 | 24.8% |
| College / Undergraduate | 345 | 15.5% |
| Graduate / Professional | 80 | 3.6% |
| Total | 2,219 | 100.0% |
School Enrollment by Age by Funding Source in Cambridge
Out of a total of 2,219 students who are enrolled in schools in Cambridge, 249 (11.2%) attend a private institution, while the remaining 1,970 (88.8%) are enrolled in public schools. The age group of 5 to 9 year old has the highest likelihood of being enrolled in private schools, with 93 (20.7% in the age bracket) enrolled. Conversely, the age group of 20 to 24 year olds has the lowest likelihood of being enrolled in a private school, with 252 (100.0% in the age bracket) attending a public institution.
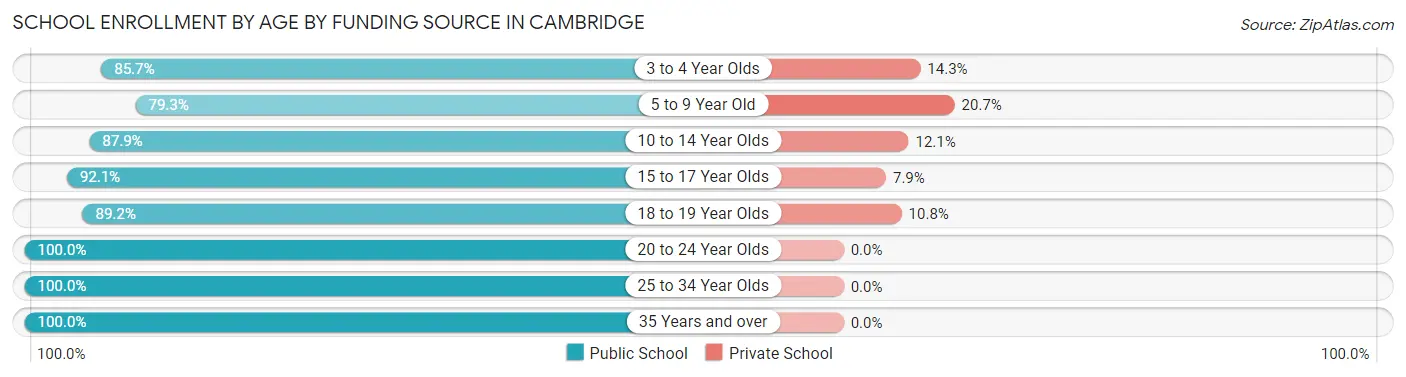
| Age Bracket | Public School | Private School |
| 3 to 4 Year Olds | 156 (85.7%) | 26 (14.3%) |
| 5 to 9 Year Old | 357 (79.3%) | 93 (20.7%) |
| 10 to 14 Year Olds | 582 (87.9%) | 80 (12.1%) |
| 15 to 17 Year Olds | 315 (92.1%) | 27 (7.9%) |
| 18 to 19 Year Olds | 190 (89.2%) | 23 (10.8%) |
| 20 to 24 Year Olds | 252 (100.0%) | 0 (0.0%) |
| 25 to 34 Year Olds | 70 (100.0%) | 0 (0.0%) |
| 35 Years and over | 48 (100.0%) | 0 (0.0%) |
| Total | 1,970 (88.8%) | 249 (11.2%) |
Educational Attainment by Field of Study in Cambridge
Education (369 | 26.8%), business (273 | 19.9%), science & technology (205 | 14.9%), arts & humanities (136 | 9.9%), and social sciences (87 | 6.3%) are the most common fields of study among 1,375 individuals in Cambridge who have obtained a bachelor's degree or higher.
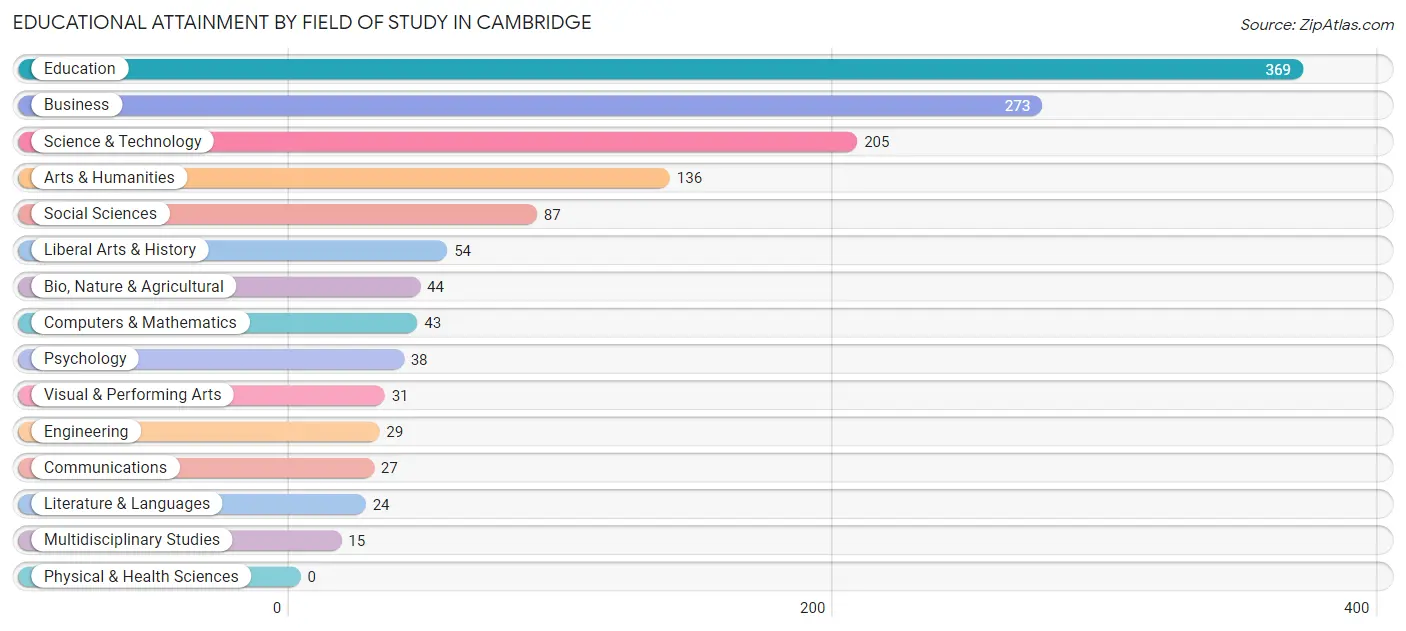
| Field of Study | # Graduates | % Graduates |
| Computers & Mathematics | 43 | 3.1% |
| Bio, Nature & Agricultural | 44 | 3.2% |
| Physical & Health Sciences | 0 | 0.0% |
| Psychology | 38 | 2.8% |
| Social Sciences | 87 | 6.3% |
| Engineering | 29 | 2.1% |
| Multidisciplinary Studies | 15 | 1.1% |
| Science & Technology | 205 | 14.9% |
| Business | 273 | 19.9% |
| Education | 369 | 26.8% |
| Literature & Languages | 24 | 1.8% |
| Liberal Arts & History | 54 | 3.9% |
| Visual & Performing Arts | 31 | 2.2% |
| Communications | 27 | 2.0% |
| Arts & Humanities | 136 | 9.9% |
| Total | 1,375 | 100.0% |
Transportation & Commute in Cambridge
Vehicle Availability by Sex in Cambridge
The most prevalent vehicle ownership categories in Cambridge are males with 2 vehicles (884, accounting for 36.6%) and females with 2 vehicles (755, making up 39.0%).
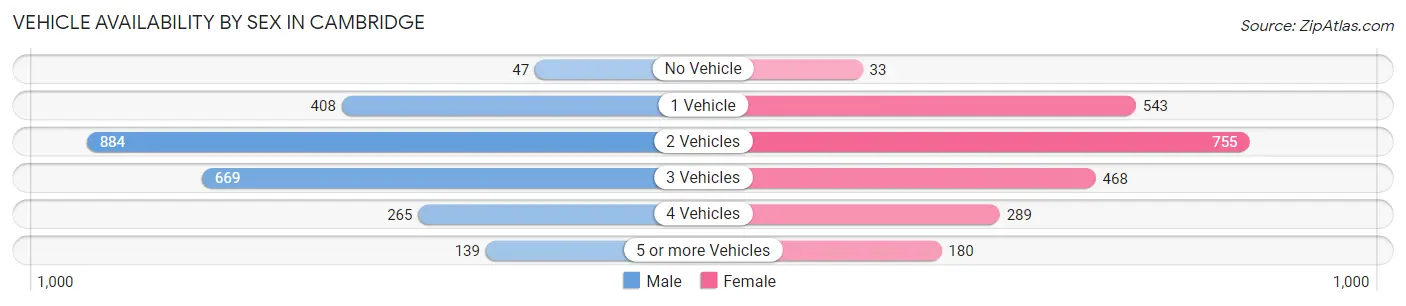
| Vehicles Available | Male | Female |
| No Vehicle | 47 (1.9%) | 33 (1.5%) |
| 1 Vehicle | 408 (16.9%) | 543 (23.9%) |
| 2 Vehicles | 884 (36.6%) | 755 (33.3%) |
| 3 Vehicles | 669 (27.7%) | 468 (20.6%) |
| 4 Vehicles | 265 (11.0%) | 289 (12.7%) |
| 5 or more Vehicles | 139 (5.8%) | 180 (7.9%) |
| Total | 2,412 (100.0%) | 2,268 (100.0%) |
Commute Time in Cambridge
The most frequently occuring commute durations in Cambridge are 5 to 9 minutes (927 commuters, 21.2%), 10 to 14 minutes (916 commuters, 20.9%), and 60 to 89 minutes (578 commuters, 13.2%).
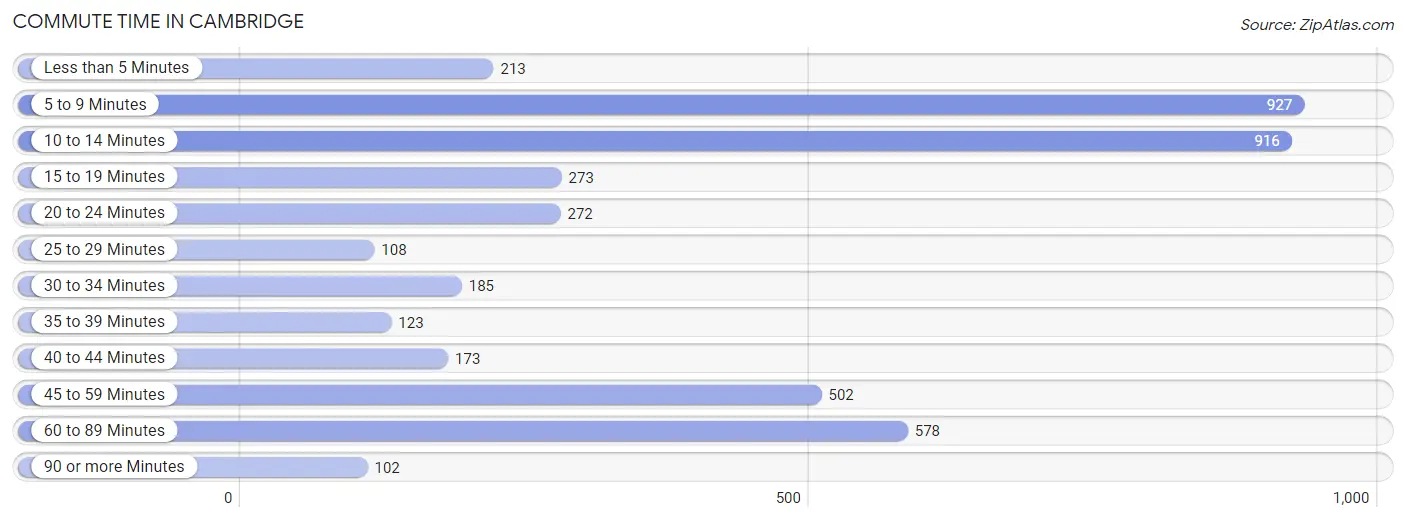
| Commute Time | # Commuters | % Commuters |
| Less than 5 Minutes | 213 | 4.9% |
| 5 to 9 Minutes | 927 | 21.2% |
| 10 to 14 Minutes | 916 | 20.9% |
| 15 to 19 Minutes | 273 | 6.2% |
| 20 to 24 Minutes | 272 | 6.2% |
| 25 to 29 Minutes | 108 | 2.5% |
| 30 to 34 Minutes | 185 | 4.2% |
| 35 to 39 Minutes | 123 | 2.8% |
| 40 to 44 Minutes | 173 | 4.0% |
| 45 to 59 Minutes | 502 | 11.5% |
| 60 to 89 Minutes | 578 | 13.2% |
| 90 or more Minutes | 102 | 2.3% |
Commute Time by Sex in Cambridge
The most common commute times in Cambridge are 10 to 14 minutes (502 commuters, 21.7%) for males and 5 to 9 minutes (545 commuters, 26.5%) for females.
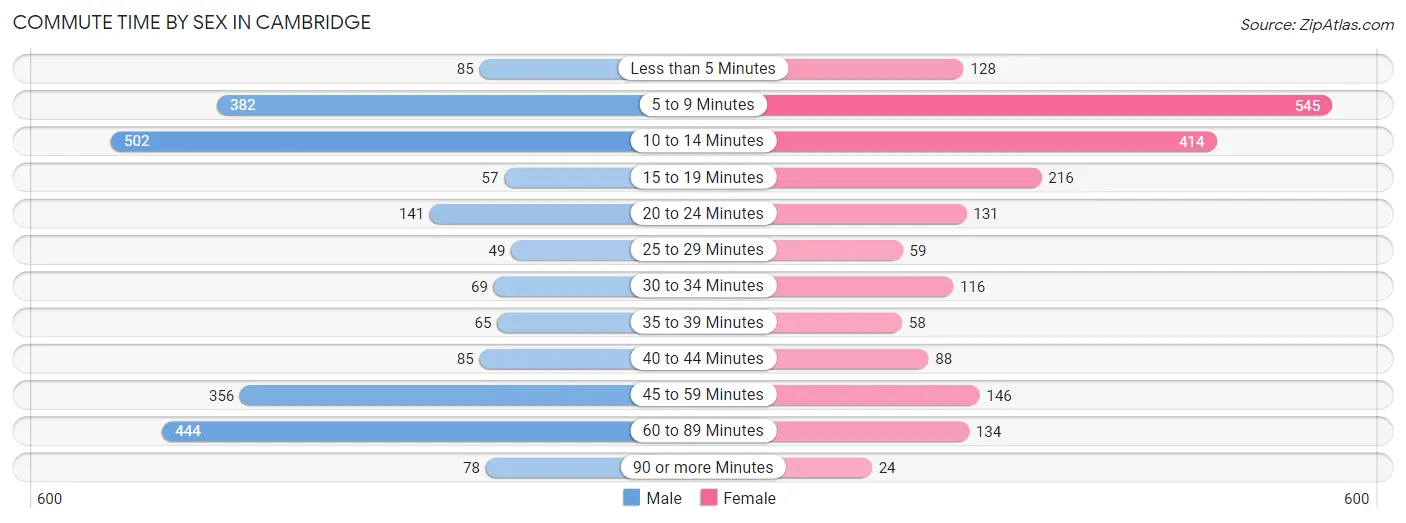
| Commute Time | Male | Female |
| Less than 5 Minutes | 85 (3.7%) | 128 (6.2%) |
| 5 to 9 Minutes | 382 (16.5%) | 545 (26.5%) |
| 10 to 14 Minutes | 502 (21.7%) | 414 (20.1%) |
| 15 to 19 Minutes | 57 (2.5%) | 216 (10.5%) |
| 20 to 24 Minutes | 141 (6.1%) | 131 (6.4%) |
| 25 to 29 Minutes | 49 (2.1%) | 59 (2.9%) |
| 30 to 34 Minutes | 69 (3.0%) | 116 (5.6%) |
| 35 to 39 Minutes | 65 (2.8%) | 58 (2.8%) |
| 40 to 44 Minutes | 85 (3.7%) | 88 (4.3%) |
| 45 to 59 Minutes | 356 (15.4%) | 146 (7.1%) |
| 60 to 89 Minutes | 444 (19.2%) | 134 (6.5%) |
| 90 or more Minutes | 78 (3.4%) | 24 (1.2%) |
Time of Departure to Work by Sex in Cambridge
The most frequent times of departure to work in Cambridge are 12:00 AM to 4:59 AM (443, 19.2%) for males and 7:00 AM to 7:29 AM (305, 14.8%) for females.
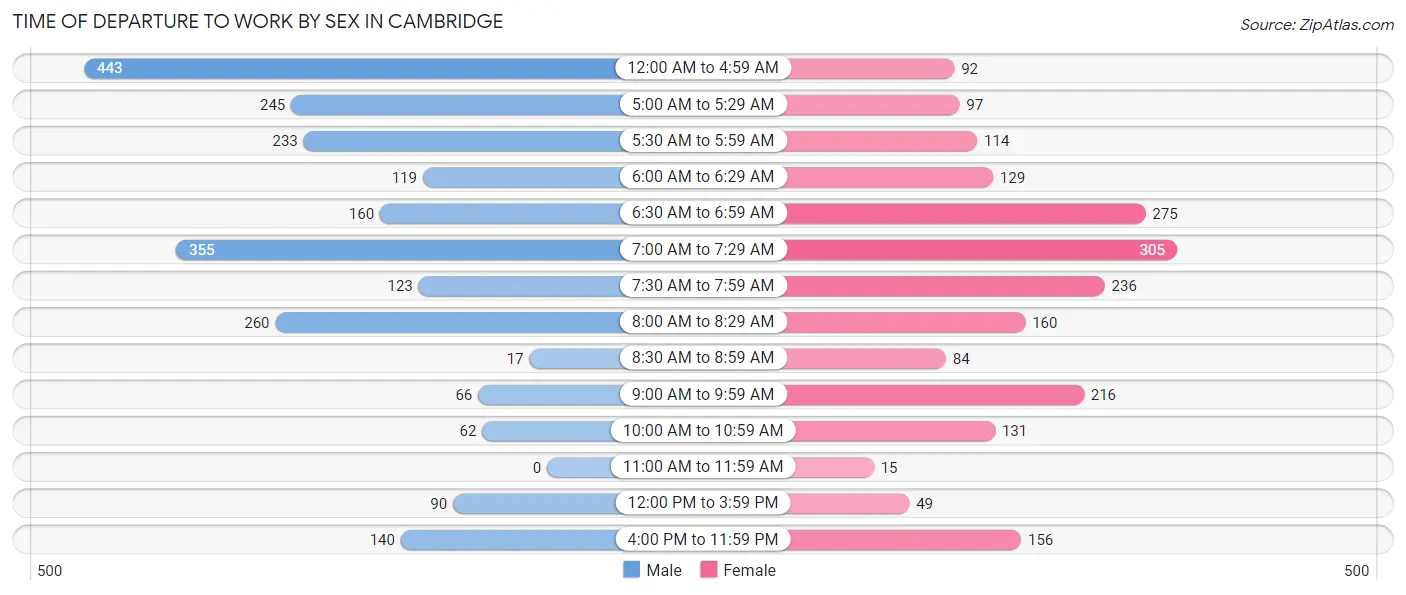
| Time of Departure | Male | Female |
| 12:00 AM to 4:59 AM | 443 (19.2%) | 92 (4.5%) |
| 5:00 AM to 5:29 AM | 245 (10.6%) | 97 (4.7%) |
| 5:30 AM to 5:59 AM | 233 (10.1%) | 114 (5.5%) |
| 6:00 AM to 6:29 AM | 119 (5.1%) | 129 (6.3%) |
| 6:30 AM to 6:59 AM | 160 (6.9%) | 275 (13.4%) |
| 7:00 AM to 7:29 AM | 355 (15.3%) | 305 (14.8%) |
| 7:30 AM to 7:59 AM | 123 (5.3%) | 236 (11.5%) |
| 8:00 AM to 8:29 AM | 260 (11.2%) | 160 (7.8%) |
| 8:30 AM to 8:59 AM | 17 (0.7%) | 84 (4.1%) |
| 9:00 AM to 9:59 AM | 66 (2.9%) | 216 (10.5%) |
| 10:00 AM to 10:59 AM | 62 (2.7%) | 131 (6.4%) |
| 11:00 AM to 11:59 AM | 0 (0.0%) | 15 (0.7%) |
| 12:00 PM to 3:59 PM | 90 (3.9%) | 49 (2.4%) |
| 4:00 PM to 11:59 PM | 140 (6.0%) | 156 (7.6%) |
| Total | 2,313 (100.0%) | 2,059 (100.0%) |
Housing Occupancy in Cambridge
Occupancy by Ownership in Cambridge
Of the total 4,028 dwellings in Cambridge, owner-occupied units account for 2,751 (68.3%), while renter-occupied units make up 1,277 (31.7%).
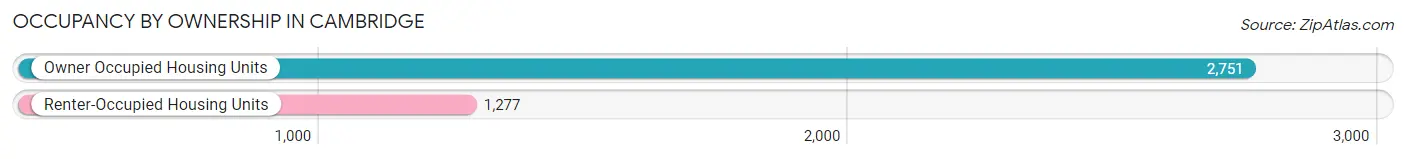
| Occupancy | # Housing Units | % Housing Units |
| Owner Occupied Housing Units | 2,751 | 68.3% |
| Renter-Occupied Housing Units | 1,277 | 31.7% |
| Total Occupied Housing Units | 4,028 | 100.0% |
Occupancy by Household Size in Cambridge
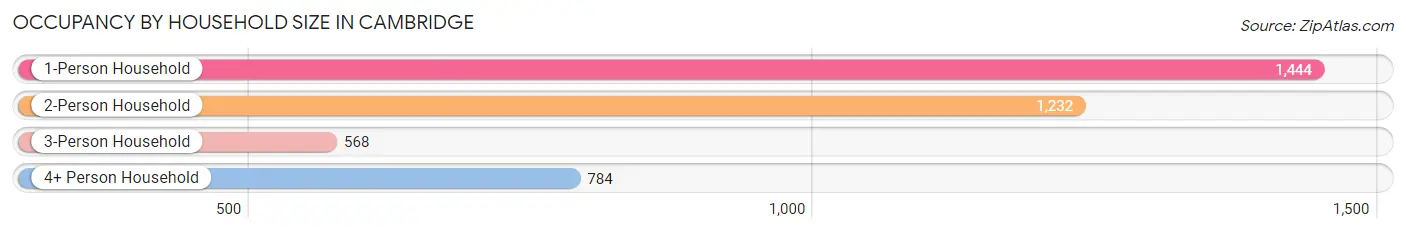
| Household Size | # Housing Units | % Housing Units |
| 1-Person Household | 1,444 | 35.8% |
| 2-Person Household | 1,232 | 30.6% |
| 3-Person Household | 568 | 14.1% |
| 4+ Person Household | 784 | 19.5% |
| Total Housing Units | 4,028 | 100.0% |
Occupancy by Ownership by Household Size in Cambridge
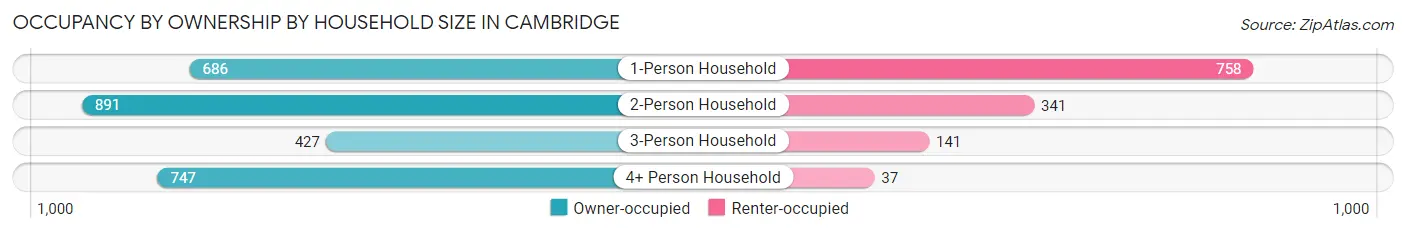
| Household Size | Owner-occupied | Renter-occupied |
| 1-Person Household | 686 (47.5%) | 758 (52.5%) |
| 2-Person Household | 891 (72.3%) | 341 (27.7%) |
| 3-Person Household | 427 (75.2%) | 141 (24.8%) |
| 4+ Person Household | 747 (95.3%) | 37 (4.7%) |
| Total Housing Units | 2,751 (68.3%) | 1,277 (31.7%) |
Occupancy by Educational Attainment in Cambridge
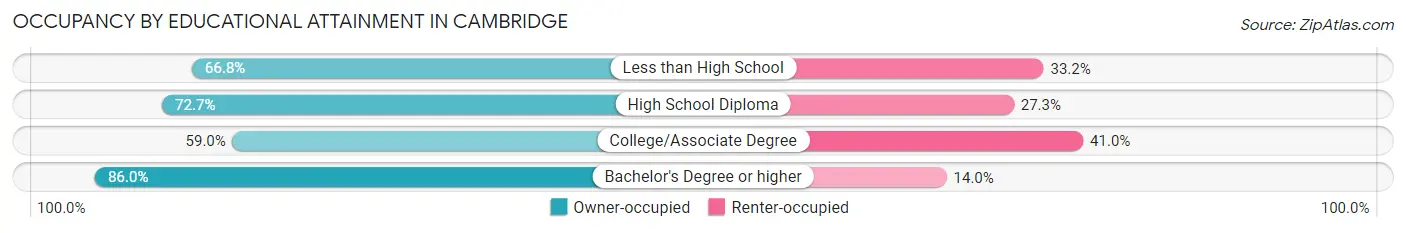
| Household Size | Owner-occupied | Renter-occupied |
| Less than High School | 141 (66.8%) | 70 (33.2%) |
| High School Diploma | 957 (72.7%) | 359 (27.3%) |
| College/Associate Degree | 1,086 (59.0%) | 756 (41.0%) |
| Bachelor's Degree or higher | 567 (86.0%) | 92 (14.0%) |
Occupancy by Age of Householder in Cambridge
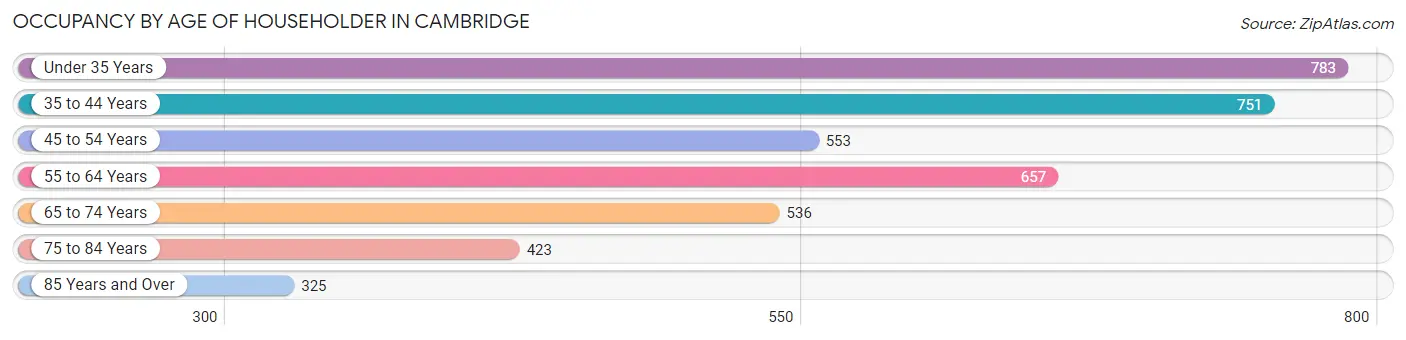
| Age Bracket | # Households | % Households |
| Under 35 Years | 783 | 19.4% |
| 35 to 44 Years | 751 | 18.6% |
| 45 to 54 Years | 553 | 13.7% |
| 55 to 64 Years | 657 | 16.3% |
| 65 to 74 Years | 536 | 13.3% |
| 75 to 84 Years | 423 | 10.5% |
| 85 Years and Over | 325 | 8.1% |
| Total | 4,028 | 100.0% |
Housing Finances in Cambridge
Median Income by Occupancy in Cambridge
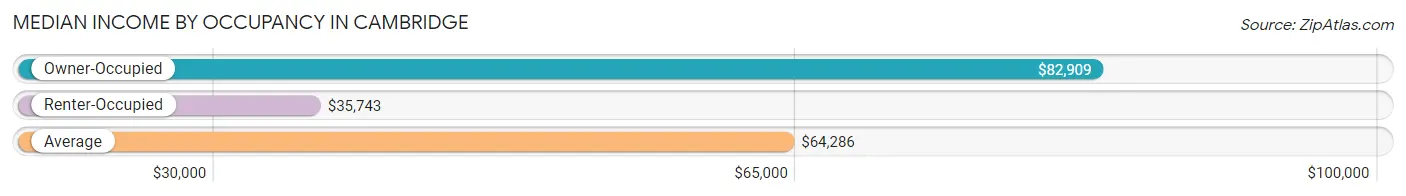
| Occupancy Type | # Households | Median Income |
| Owner-Occupied | 2,751 (68.3%) | $82,909 |
| Renter-Occupied | 1,277 (31.7%) | $35,743 |
| Average | 4,028 (100.0%) | $64,286 |
Occupancy by Householder Income Bracket in Cambridge
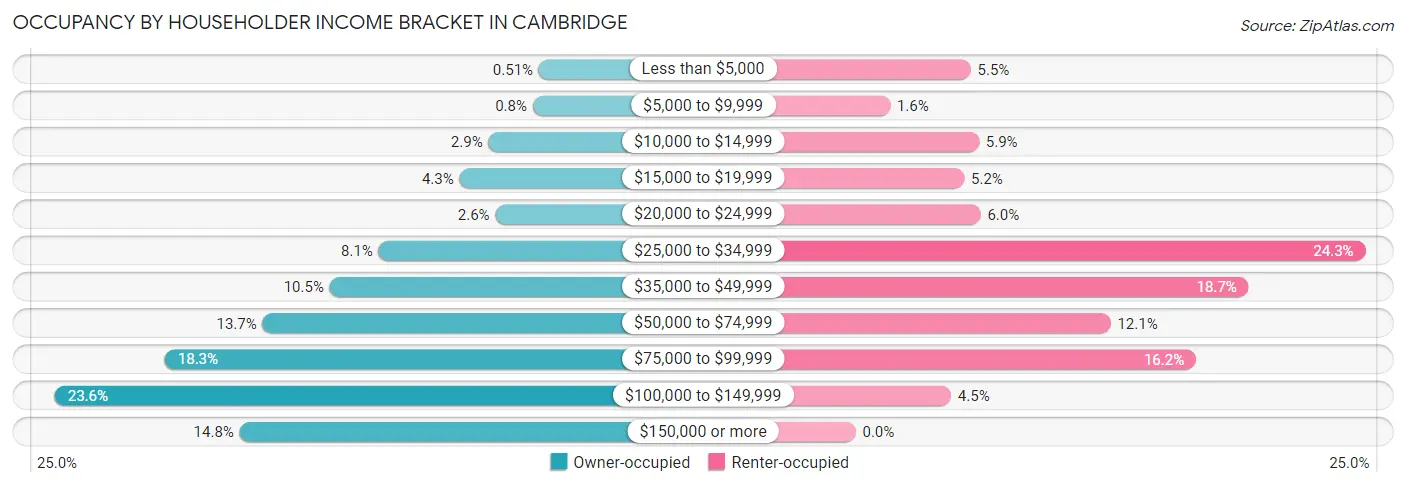
| Income Bracket | Owner-occupied | Renter-occupied |
| Less than $5,000 | 14 (0.5%) | 70 (5.5%) |
| $5,000 to $9,999 | 22 (0.8%) | 21 (1.6%) |
| $10,000 to $14,999 | 80 (2.9%) | 75 (5.9%) |
| $15,000 to $19,999 | 118 (4.3%) | 66 (5.2%) |
| $20,000 to $24,999 | 71 (2.6%) | 76 (5.9%) |
| $25,000 to $34,999 | 224 (8.1%) | 310 (24.3%) |
| $35,000 to $49,999 | 288 (10.5%) | 239 (18.7%) |
| $50,000 to $74,999 | 376 (13.7%) | 155 (12.1%) |
| $75,000 to $99,999 | 504 (18.3%) | 207 (16.2%) |
| $100,000 to $149,999 | 648 (23.6%) | 58 (4.5%) |
| $150,000 or more | 406 (14.8%) | 0 (0.0%) |
| Total | 2,751 (100.0%) | 1,277 (100.0%) |
Monthly Housing Cost Tiers in Cambridge
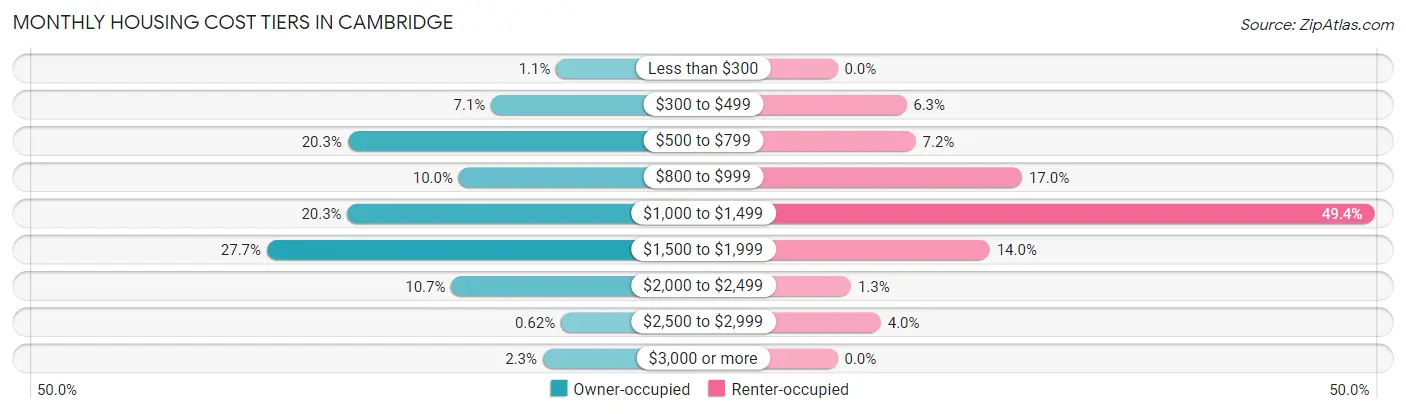
| Monthly Cost | Owner-occupied | Renter-occupied |
| Less than $300 | 29 (1.1%) | 0 (0.0%) |
| $300 to $499 | 194 (7.0%) | 81 (6.3%) |
| $500 to $799 | 557 (20.3%) | 92 (7.2%) |
| $800 to $999 | 276 (10.0%) | 217 (17.0%) |
| $1,000 to $1,499 | 558 (20.3%) | 631 (49.4%) |
| $1,500 to $1,999 | 762 (27.7%) | 179 (14.0%) |
| $2,000 to $2,499 | 295 (10.7%) | 16 (1.3%) |
| $2,500 to $2,999 | 17 (0.6%) | 51 (4.0%) |
| $3,000 or more | 63 (2.3%) | 0 (0.0%) |
| Total | 2,751 (100.0%) | 1,277 (100.0%) |
Physical Housing Characteristics in Cambridge
Housing Structures in Cambridge
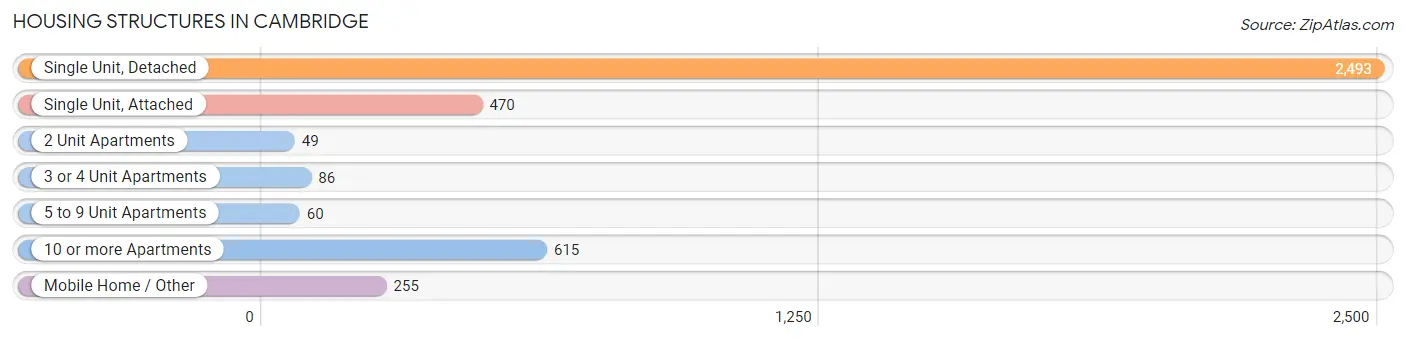
| Structure Type | # Housing Units | % Housing Units |
| Single Unit, Detached | 2,493 | 61.9% |
| Single Unit, Attached | 470 | 11.7% |
| 2 Unit Apartments | 49 | 1.2% |
| 3 or 4 Unit Apartments | 86 | 2.1% |
| 5 to 9 Unit Apartments | 60 | 1.5% |
| 10 or more Apartments | 615 | 15.3% |
| Mobile Home / Other | 255 | 6.3% |
| Total | 4,028 | 100.0% |
Housing Structures by Occupancy in Cambridge
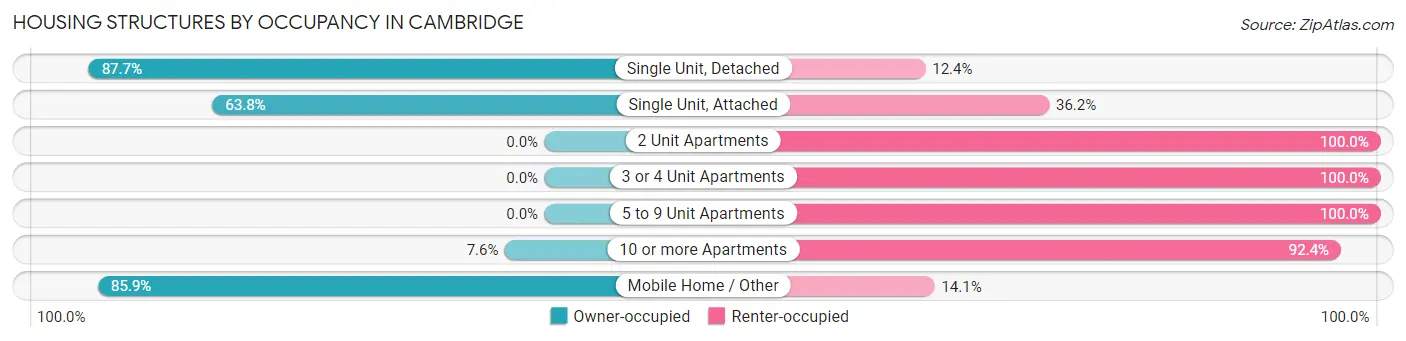
| Structure Type | Owner-occupied | Renter-occupied |
| Single Unit, Detached | 2,185 (87.6%) | 308 (12.3%) |
| Single Unit, Attached | 300 (63.8%) | 170 (36.2%) |
| 2 Unit Apartments | 0 (0.0%) | 49 (100.0%) |
| 3 or 4 Unit Apartments | 0 (0.0%) | 86 (100.0%) |
| 5 to 9 Unit Apartments | 0 (0.0%) | 60 (100.0%) |
| 10 or more Apartments | 47 (7.6%) | 568 (92.4%) |
| Mobile Home / Other | 219 (85.9%) | 36 (14.1%) |
| Total | 2,751 (68.3%) | 1,277 (31.7%) |
Housing Structures by Number of Rooms in Cambridge
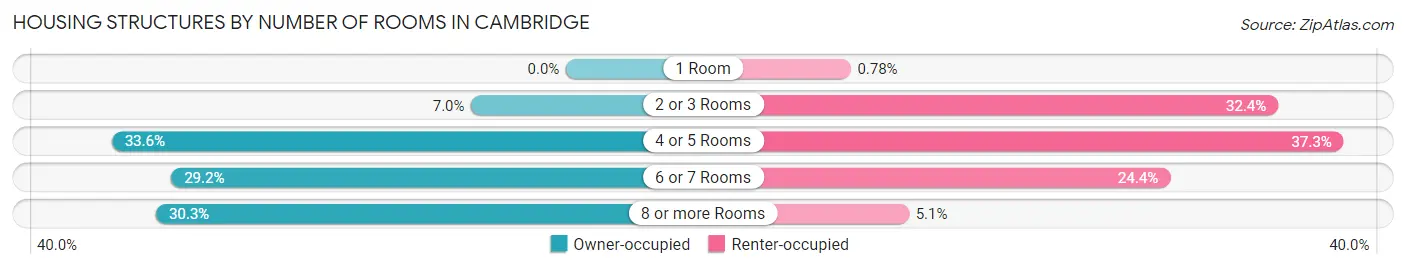
| Number of Rooms | Owner-occupied | Renter-occupied |
| 1 Room | 0 (0.0%) | 10 (0.8%) |
| 2 or 3 Rooms | 193 (7.0%) | 414 (32.4%) |
| 4 or 5 Rooms | 923 (33.6%) | 476 (37.3%) |
| 6 or 7 Rooms | 802 (29.1%) | 312 (24.4%) |
| 8 or more Rooms | 833 (30.3%) | 65 (5.1%) |
| Total | 2,751 (100.0%) | 1,277 (100.0%) |
Housing Structure by Heating Type in Cambridge
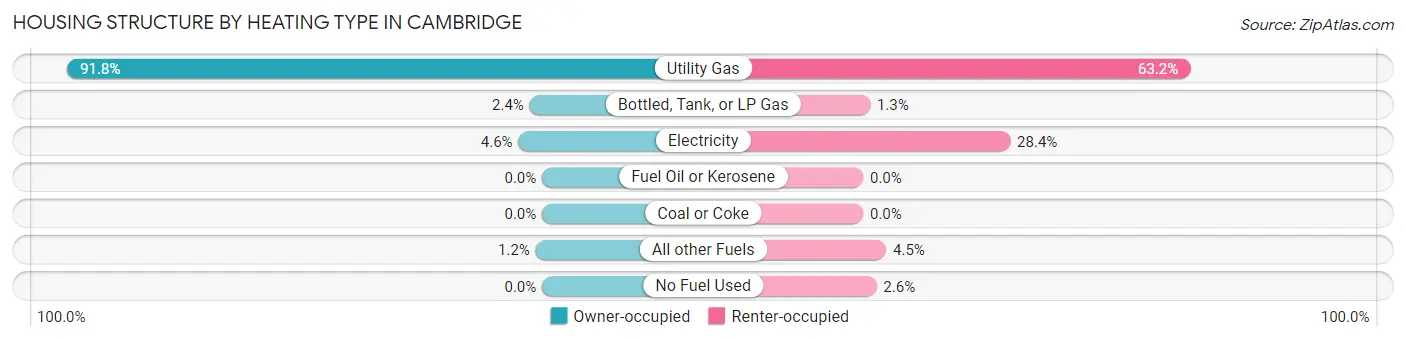
| Heating Type | Owner-occupied | Renter-occupied |
| Utility Gas | 2,525 (91.8%) | 807 (63.2%) |
| Bottled, Tank, or LP Gas | 66 (2.4%) | 17 (1.3%) |
| Electricity | 126 (4.6%) | 363 (28.4%) |
| Fuel Oil or Kerosene | 0 (0.0%) | 0 (0.0%) |
| Coal or Coke | 0 (0.0%) | 0 (0.0%) |
| All other Fuels | 34 (1.2%) | 57 (4.5%) |
| No Fuel Used | 0 (0.0%) | 33 (2.6%) |
| Total | 2,751 (100.0%) | 1,277 (100.0%) |
Household Vehicle Usage in Cambridge
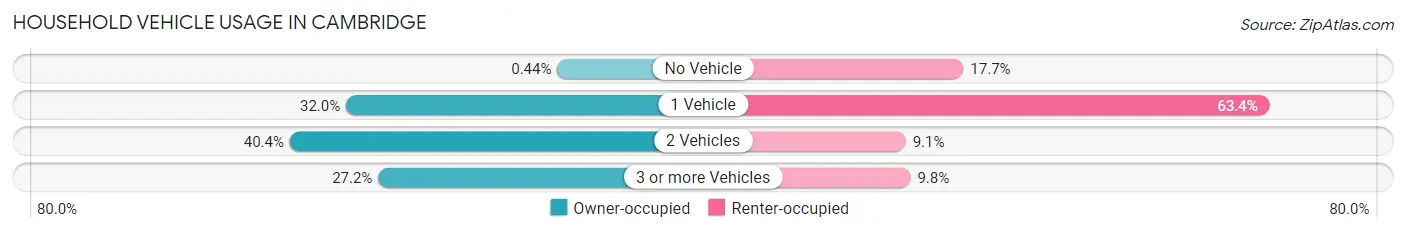
| Vehicles per Household | Owner-occupied | Renter-occupied |
| No Vehicle | 12 (0.4%) | 226 (17.7%) |
| 1 Vehicle | 880 (32.0%) | 810 (63.4%) |
| 2 Vehicles | 1,111 (40.4%) | 116 (9.1%) |
| 3 or more Vehicles | 748 (27.2%) | 125 (9.8%) |
| Total | 2,751 (100.0%) | 1,277 (100.0%) |
Real Estate & Mortgages in Cambridge
Real Estate and Mortgage Overview in Cambridge
| Characteristic | Without Mortgage | With Mortgage |
| Housing Units | 872 | 1,879 |
| Median Property Value | $194,000 | $235,700 |
| Median Household Income | $56,806 | $266 |
| Monthly Housing Costs | $598 | $63 |
| Real Estate Taxes | $2,628 | $38 |
Property Value by Mortgage Status in Cambridge
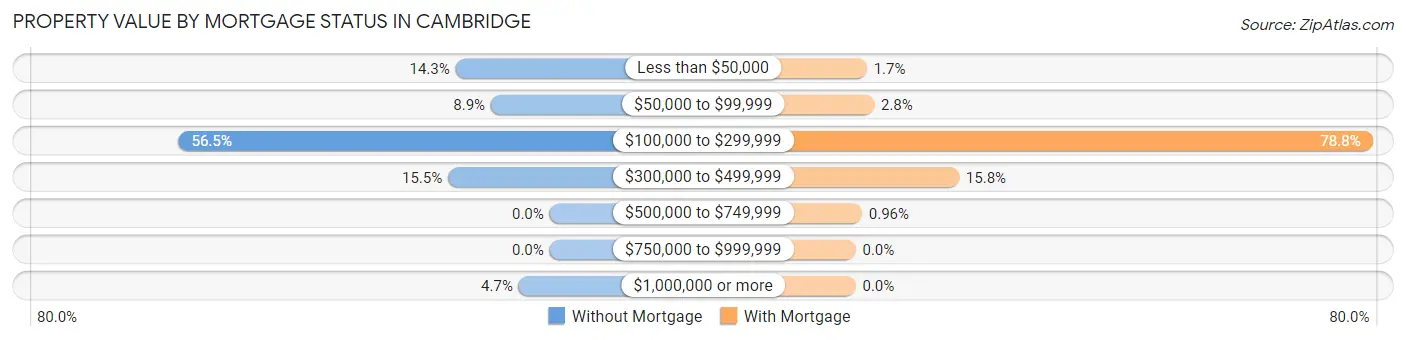
| Property Value | Without Mortgage | With Mortgage |
| Less than $50,000 | 125 (14.3%) | 32 (1.7%) |
| $50,000 to $99,999 | 78 (8.9%) | 53 (2.8%) |
| $100,000 to $299,999 | 493 (56.5%) | 1,480 (78.8%) |
| $300,000 to $499,999 | 135 (15.5%) | 296 (15.8%) |
| $500,000 to $749,999 | 0 (0.0%) | 18 (1.0%) |
| $750,000 to $999,999 | 0 (0.0%) | 0 (0.0%) |
| $1,000,000 or more | 41 (4.7%) | 0 (0.0%) |
| Total | 872 (100.0%) | 1,879 (100.0%) |
Household Income by Mortgage Status in Cambridge
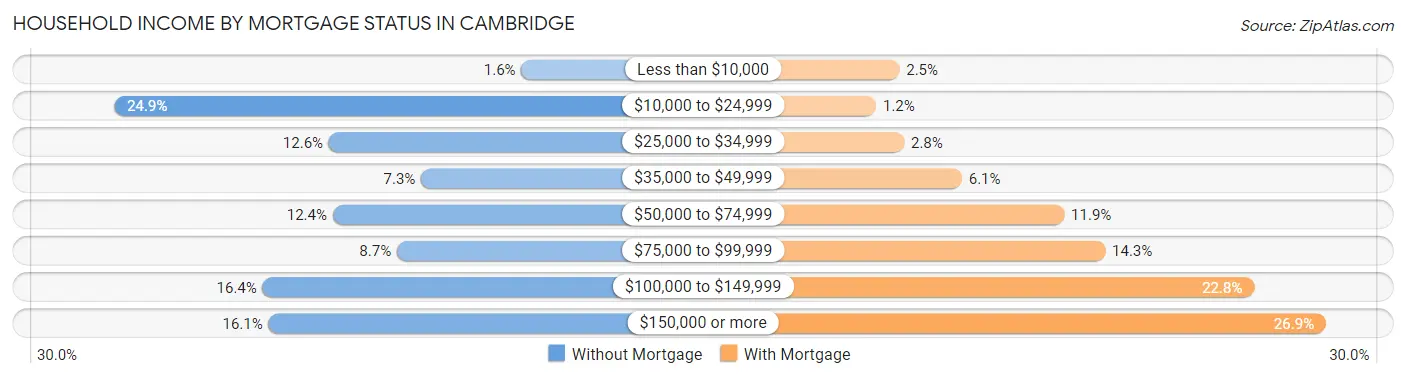
| Household Income | Without Mortgage | With Mortgage |
| Less than $10,000 | 14 (1.6%) | 47 (2.5%) |
| $10,000 to $24,999 | 217 (24.9%) | 22 (1.2%) |
| $25,000 to $34,999 | 110 (12.6%) | 52 (2.8%) |
| $35,000 to $49,999 | 64 (7.3%) | 114 (6.1%) |
| $50,000 to $74,999 | 108 (12.4%) | 224 (11.9%) |
| $75,000 to $99,999 | 76 (8.7%) | 268 (14.3%) |
| $100,000 to $149,999 | 143 (16.4%) | 428 (22.8%) |
| $150,000 or more | 140 (16.1%) | 505 (26.9%) |
| Total | 872 (100.0%) | 1,879 (100.0%) |
Property Value to Household Income Ratio in Cambridge
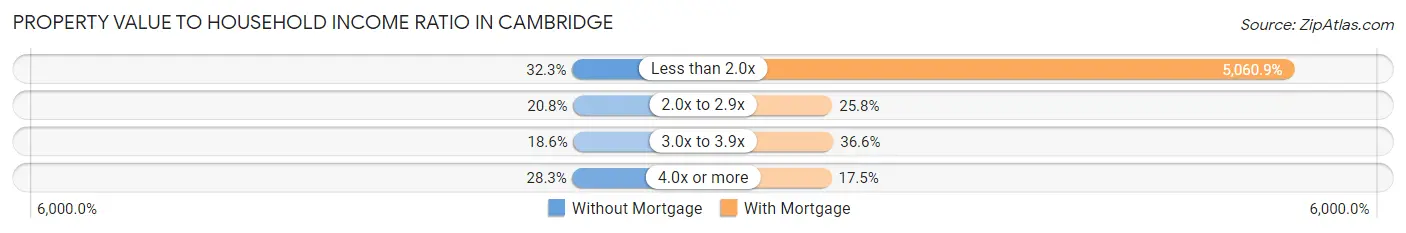
| Value-to-Income Ratio | Without Mortgage | With Mortgage |
| Less than 2.0x | 282 (32.3%) | 95,094 (5,060.9%) |
| 2.0x to 2.9x | 181 (20.8%) | 485 (25.8%) |
| 3.0x to 3.9x | 162 (18.6%) | 688 (36.6%) |
| 4.0x or more | 247 (28.3%) | 328 (17.5%) |
| Total | 872 (100.0%) | 1,879 (100.0%) |
Real Estate Taxes by Mortgage Status in Cambridge
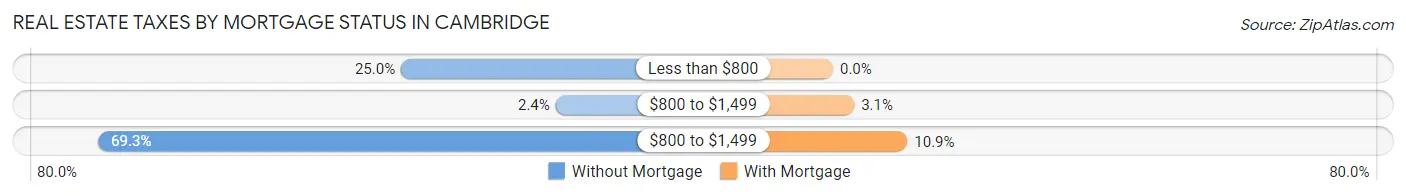
| Property Taxes | Without Mortgage | With Mortgage |
| Less than $800 | 218 (25.0%) | 0 (0.0%) |
| $800 to $1,499 | 21 (2.4%) | 58 (3.1%) |
| $800 to $1,499 | 604 (69.3%) | 204 (10.9%) |
| Total | 872 (100.0%) | 1,879 (100.0%) |
Health & Disability in Cambridge
Health Insurance Coverage by Age in Cambridge
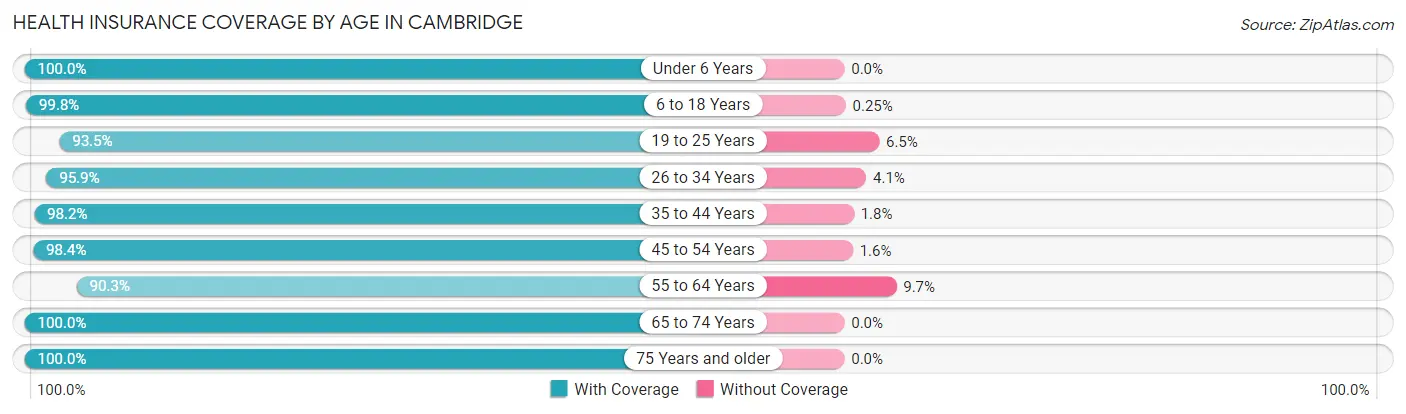
| Age Bracket | With Coverage | Without Coverage |
| Under 6 Years | 683 (100.0%) | 0 (0.0%) |
| 6 to 18 Years | 1,584 (99.8%) | 4 (0.3%) |
| 19 to 25 Years | 852 (93.5%) | 59 (6.5%) |
| 26 to 34 Years | 1,182 (95.9%) | 50 (4.1%) |
| 35 to 44 Years | 1,285 (98.2%) | 23 (1.8%) |
| 45 to 54 Years | 1,004 (98.4%) | 16 (1.6%) |
| 55 to 64 Years | 988 (90.3%) | 106 (9.7%) |
| 65 to 74 Years | 775 (100.0%) | 0 (0.0%) |
| 75 Years and older | 996 (100.0%) | 0 (0.0%) |
| Total | 9,349 (97.3%) | 258 (2.7%) |
Health Insurance Coverage by Citizenship Status in Cambridge
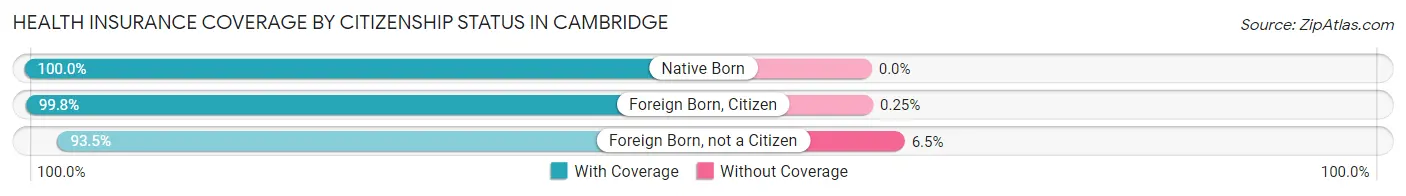
| Citizenship Status | With Coverage | Without Coverage |
| Native Born | 683 (100.0%) | 0 (0.0%) |
| Foreign Born, Citizen | 1,584 (99.8%) | 4 (0.3%) |
| Foreign Born, not a Citizen | 852 (93.5%) | 59 (6.5%) |
Health Insurance Coverage by Household Income in Cambridge
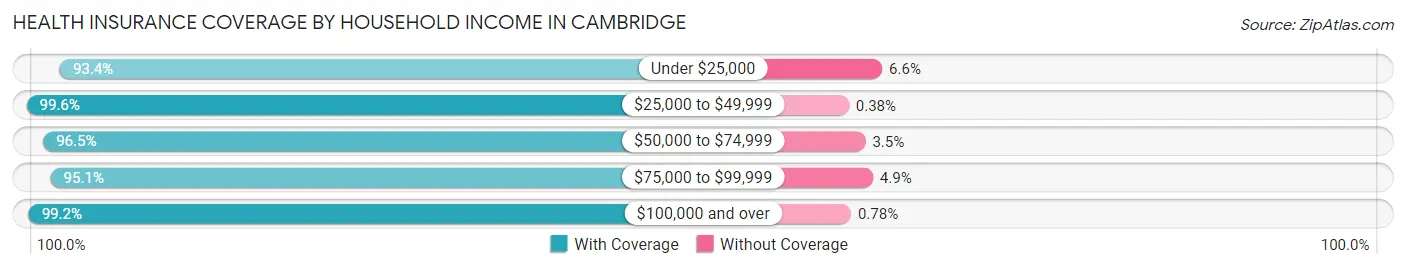
| Household Income | With Coverage | Without Coverage |
| Under $25,000 | 845 (93.4%) | 60 (6.6%) |
| $25,000 to $49,999 | 1,588 (99.6%) | 6 (0.4%) |
| $50,000 to $74,999 | 1,159 (96.5%) | 42 (3.5%) |
| $75,000 to $99,999 | 2,218 (95.1%) | 114 (4.9%) |
| $100,000 and over | 3,427 (99.2%) | 27 (0.8%) |
Public vs Private Health Insurance Coverage by Age in Cambridge
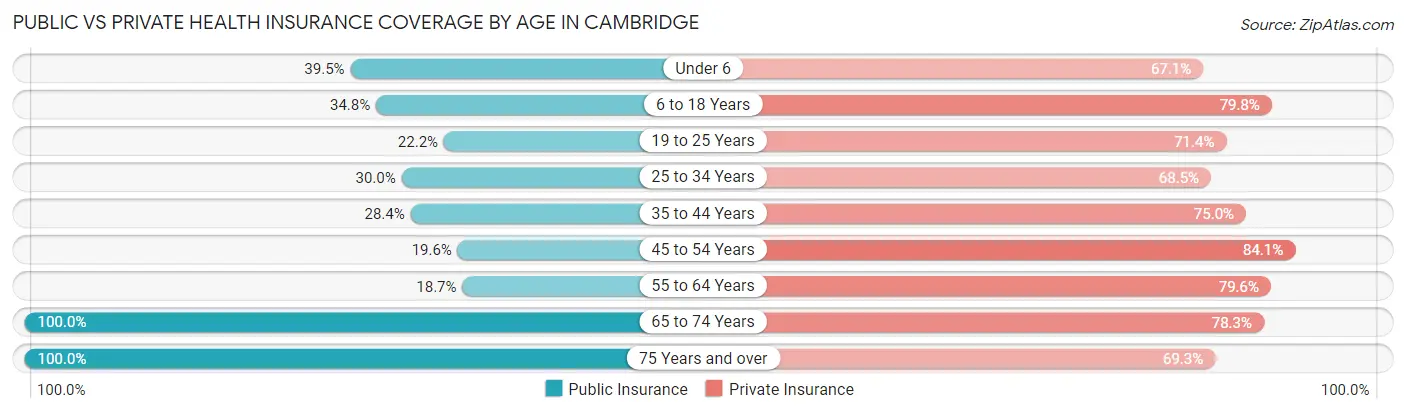
| Age Bracket | Public Insurance | Private Insurance |
| Under 6 | 270 (39.5%) | 458 (67.1%) |
| 6 to 18 Years | 552 (34.8%) | 1,267 (79.8%) |
| 19 to 25 Years | 202 (22.2%) | 650 (71.4%) |
| 25 to 34 Years | 370 (30.0%) | 844 (68.5%) |
| 35 to 44 Years | 371 (28.4%) | 981 (75.0%) |
| 45 to 54 Years | 200 (19.6%) | 858 (84.1%) |
| 55 to 64 Years | 205 (18.7%) | 871 (79.6%) |
| 65 to 74 Years | 775 (100.0%) | 607 (78.3%) |
| 75 Years and over | 996 (100.0%) | 690 (69.3%) |
| Total | 3,941 (41.0%) | 7,226 (75.2%) |
Disability Status by Sex by Age in Cambridge
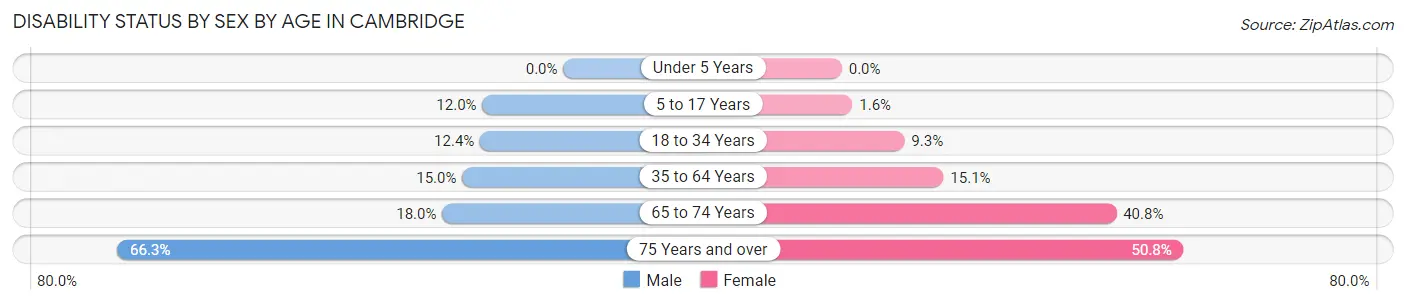
| Age Bracket | Male | Female |
| Under 5 Years | 0 (0.0%) | 0 (0.0%) |
| 5 to 17 Years | 90 (12.0%) | 13 (1.6%) |
| 18 to 34 Years | 155 (12.3%) | 95 (9.3%) |
| 35 to 64 Years | 254 (15.0%) | 261 (15.1%) |
| 65 to 74 Years | 48 (18.0%) | 207 (40.7%) |
| 75 Years and over | 216 (66.3%) | 340 (50.7%) |
Disability Class by Sex by Age in Cambridge
Disability Class: Hearing Difficulty
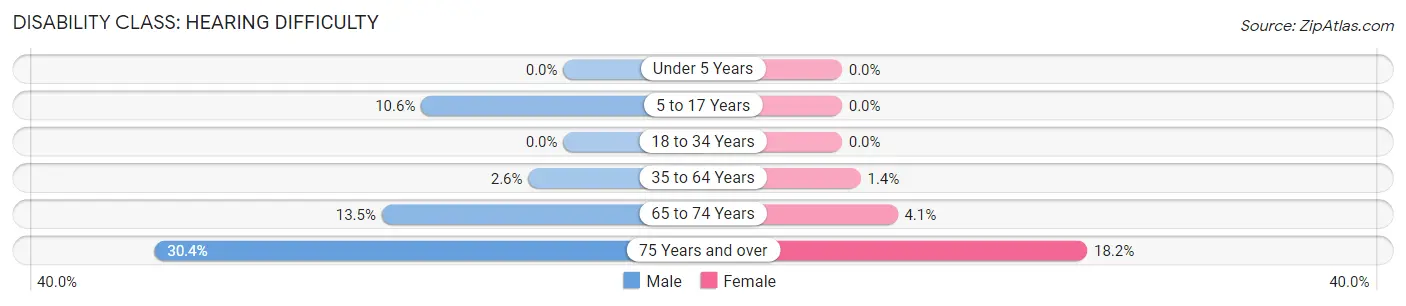
| Age Bracket | Male | Female |
| Under 5 Years | 0 (0.0%) | 0 (0.0%) |
| 5 to 17 Years | 79 (10.5%) | 0 (0.0%) |
| 18 to 34 Years | 0 (0.0%) | 0 (0.0%) |
| 35 to 64 Years | 44 (2.6%) | 24 (1.4%) |
| 65 to 74 Years | 36 (13.5%) | 21 (4.1%) |
| 75 Years and over | 99 (30.4%) | 122 (18.2%) |
Disability Class: Vision Difficulty
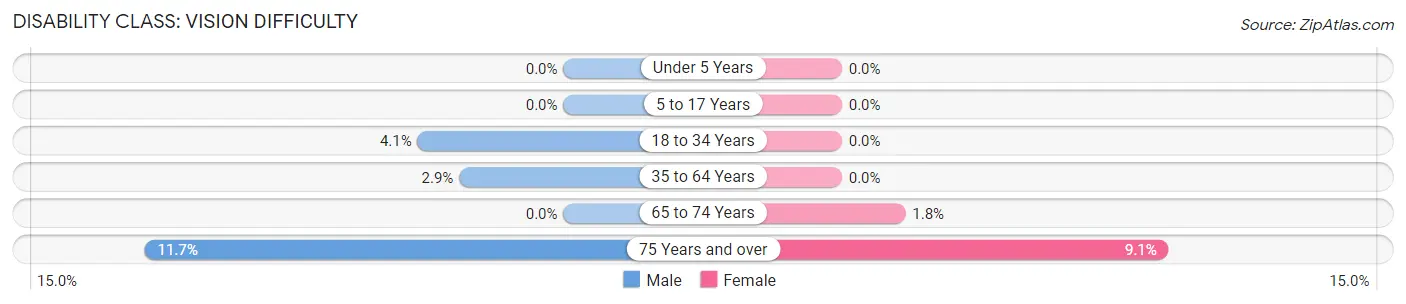
| Age Bracket | Male | Female |
| Under 5 Years | 0 (0.0%) | 0 (0.0%) |
| 5 to 17 Years | 0 (0.0%) | 0 (0.0%) |
| 18 to 34 Years | 51 (4.1%) | 0 (0.0%) |
| 35 to 64 Years | 49 (2.9%) | 0 (0.0%) |
| 65 to 74 Years | 0 (0.0%) | 9 (1.8%) |
| 75 Years and over | 38 (11.7%) | 61 (9.1%) |
Disability Class: Cognitive Difficulty
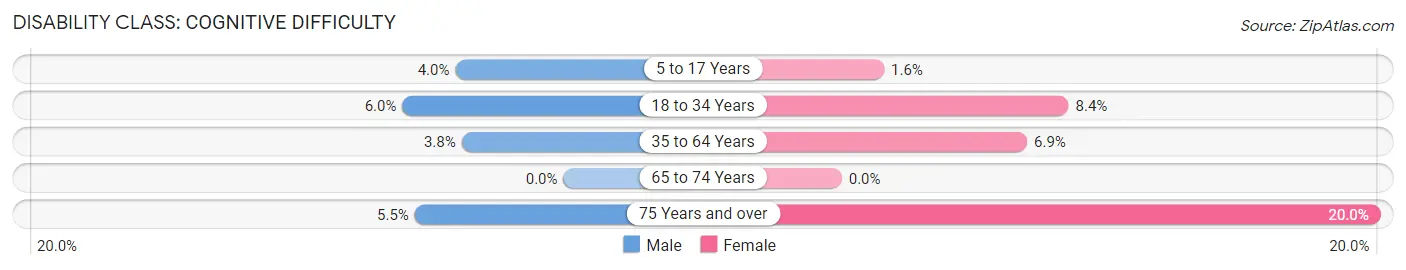
| Age Bracket | Male | Female |
| 5 to 17 Years | 30 (4.0%) | 13 (1.6%) |
| 18 to 34 Years | 75 (6.0%) | 86 (8.4%) |
| 35 to 64 Years | 64 (3.8%) | 119 (6.9%) |
| 65 to 74 Years | 0 (0.0%) | 0 (0.0%) |
| 75 Years and over | 18 (5.5%) | 134 (20.0%) |
Disability Class: Ambulatory Difficulty
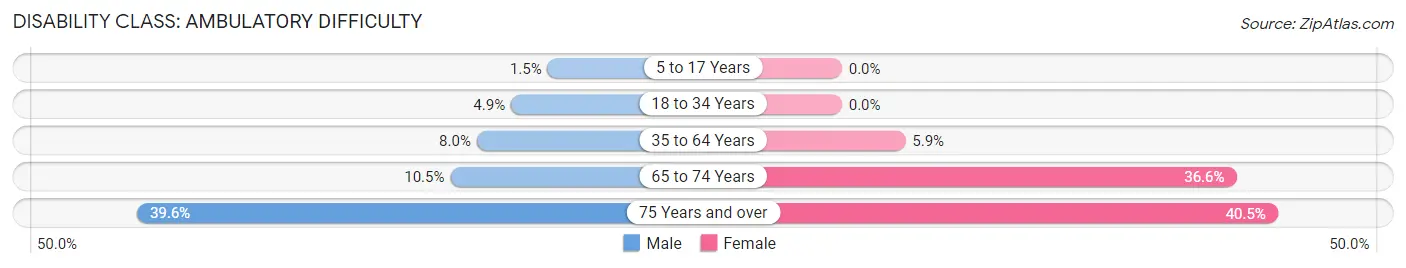
| Age Bracket | Male | Female |
| 5 to 17 Years | 11 (1.5%) | 0 (0.0%) |
| 18 to 34 Years | 61 (4.9%) | 0 (0.0%) |
| 35 to 64 Years | 136 (8.0%) | 102 (5.9%) |
| 65 to 74 Years | 28 (10.5%) | 186 (36.6%) |
| 75 Years and over | 129 (39.6%) | 271 (40.5%) |
Disability Class: Self-Care Difficulty
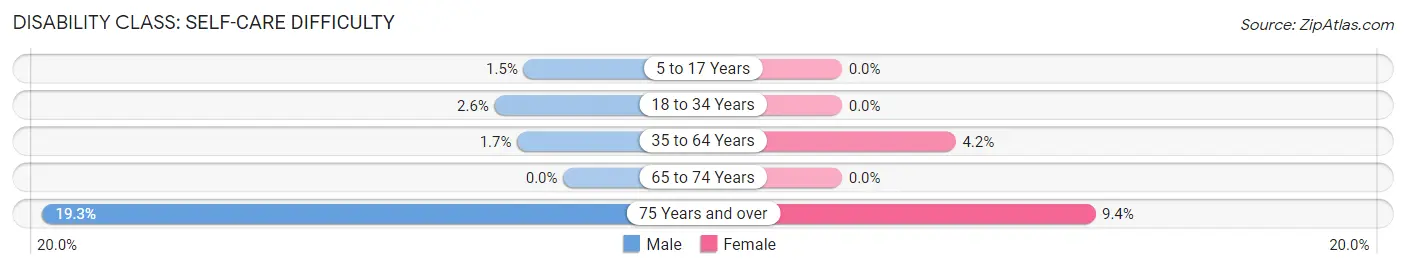
| Age Bracket | Male | Female |
| 5 to 17 Years | 11 (1.5%) | 0 (0.0%) |
| 18 to 34 Years | 32 (2.5%) | 0 (0.0%) |
| 35 to 64 Years | 29 (1.7%) | 73 (4.2%) |
| 65 to 74 Years | 0 (0.0%) | 0 (0.0%) |
| 75 Years and over | 63 (19.3%) | 63 (9.4%) |
Technology Access in Cambridge
Computing Device Access in Cambridge
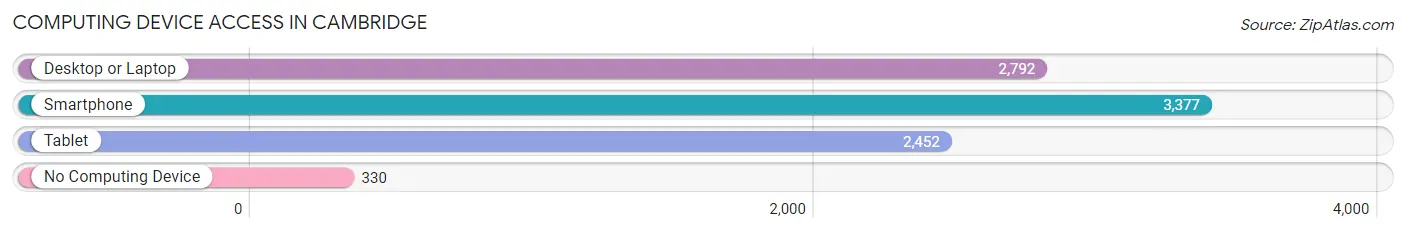
| Device Type | # Households | % Households |
| Desktop or Laptop | 2,792 | 69.3% |
| Smartphone | 3,377 | 83.8% |
| Tablet | 2,452 | 60.9% |
| No Computing Device | 330 | 8.2% |
| Total | 4,028 | 100.0% |
Internet Access in Cambridge
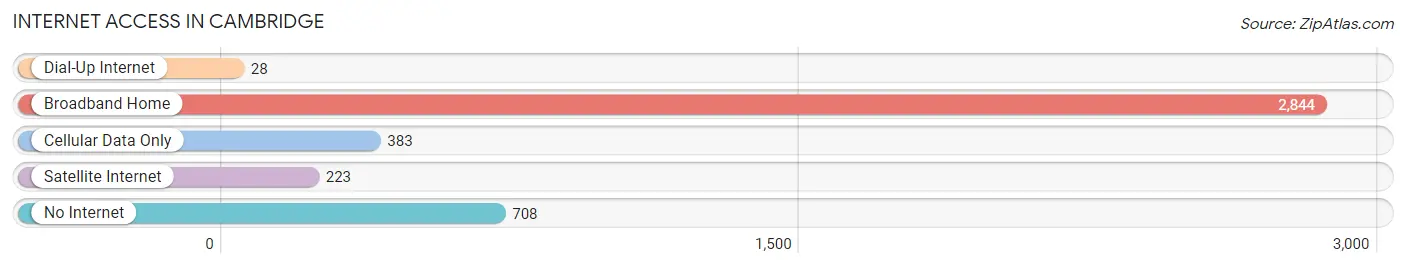
| Internet Type | # Households | % Households |
| Dial-Up Internet | 28 | 0.7% |
| Broadband Home | 2,844 | 70.6% |
| Cellular Data Only | 383 | 9.5% |
| Satellite Internet | 223 | 5.5% |
| No Internet | 708 | 17.6% |
| Total | 4,028 | 100.0% |
Cambridge Summary
Cambridge, Minnesota is a small city located in Isanti County, Minnesota, United States. The city is located on the Rum River, approximately 40 miles north of Minneapolis. As of the 2010 census, the population of Cambridge was 8,111.
History
The area that is now Cambridge was first settled in 1854 by a group of Swedish immigrants. The city was originally known as Isanti, after the Isanti Indians who lived in the area. The city was renamed Cambridge in 1872, after the city of Cambridge, Massachusetts.
In 1873, the first railroad line was built through Cambridge, connecting the city to Minneapolis. This allowed for the growth of the city, as it became a popular stop for travelers and freight.
In the late 19th century, Cambridge was a popular destination for wealthy Minneapolis residents, who built large summer homes in the area. The city was also home to several resorts, which attracted visitors from all over the Midwest.
Geography
Cambridge is located in Isanti County, Minnesota, approximately 40 miles north of Minneapolis. The city is situated on the Rum River, which flows through the city. The city is surrounded by several lakes, including Lake Francis, Lake Isanti, and Lake Elizabeth.
The city has a total area of 8.2 square miles, of which 8.1 square miles is land and 0.1 square miles is water.
Economy
The economy of Cambridge is largely based on agriculture and manufacturing. The city is home to several large agricultural companies, including Cargill, Land O’Lakes, and CHS. The city is also home to several manufacturing companies, including 3M, Andersen Windows, and Polaris Industries.
The city is also home to several retail stores restaurants and other businesses
Demographics
As of the 2010 census, the population of Cambridge was 8,111. The racial makeup of the city was 94.2% White, 0.7% African American, 0.4% Native American, 0.7% Asian, 0.1% Pacific Islander, 2.2% from other races, and 1.7% from two or more races. Hispanic or Latino of any race were 4.2% of the population.
The median income for a household in the city was $50,945, and the median income for a family was $60,945. The per capita income for the city was $24,945. About 5.2% of families and 7.2% of the population were below the poverty line, including 8.2% of those under age 18 and 6.2% of those age 65 or over.
Common Questions
What is Per Capita Income in Cambridge?
Per Capita income in Cambridge is $33,056.
What is the Median Family Income in Cambridge?
Median Family Income in Cambridge is $81,708.
What is the Median Household income in Cambridge?
Median Household Income in Cambridge is $64,286.
What is Income or Wage Gap in Cambridge?
Income or Wage Gap in Cambridge is 34.3%.
Women in Cambridge earn 65.7 cents for every dollar earned by a man.
What is Family Income Deficit in Cambridge?
Family Income Deficit in Cambridge is $7,235.
Families that are below poverty line in Cambridge earn $7,235 less on average than the poverty threshold level.
What is Inequality or Gini Index in Cambridge?
Inequality or Gini Index in Cambridge is 0.39.
What is the Total Population of Cambridge?
Total Population of Cambridge is 9,726.
What is the Total Male Population of Cambridge?
Total Male Population of Cambridge is 4,656.
What is the Total Female Population of Cambridge?
Total Female Population of Cambridge is 5,070.
What is the Ratio of Males per 100 Females in Cambridge?
There are 91.83 Males per 100 Females in Cambridge.
What is the Ratio of Females per 100 Males in Cambridge?
There are 108.89 Females per 100 Males in Cambridge.
What is the Median Population Age in Cambridge?
Median Population Age in Cambridge is 37.8 Years.
What is the Average Family Size in Cambridge
Average Family Size in Cambridge is 3.0 People.
What is the Average Household Size in Cambridge
Average Household Size in Cambridge is 2.4 People.
How Large is the Labor Force in Cambridge?
There are 4,916 People in the Labor Forcein in Cambridge.
What is the Percentage of People in the Labor Force in Cambridge?
62.7% of People are in the Labor Force in Cambridge.
What is the Unemployment Rate in Cambridge?
Unemployment Rate in Cambridge is 2.7%.