Wexford County, MI Map & Demographics
Wexford County Map
Wexford County Overview
$29,617
PER CAPITA INCOME
$70,704
AVG FAMILY INCOME
$58,652
AVG HOUSEHOLD INCOME
26.0%
WAGE / INCOME GAP [ % ]
74.0¢/ $1
WAGE / INCOME GAP [ $ ]
$11,452
FAMILY INCOME DEFICIT
0.44
INEQUALITY / GINI INDEX
33,766
TOTAL POPULATION
16,966
MALE POPULATION
16,800
FEMALE POPULATION
100.99
MALES / 100 FEMALES
99.02
FEMALES / 100 MALES
42.2
MEDIAN AGE
3.0
AVG FAMILY SIZE
2.5
AVG HOUSEHOLD SIZE
15,058
LABOR FORCE [ PEOPLE ]
56.1%
PERCENT IN LABOR FORCE
6.3%
UNEMPLOYMENT RATE
Wexford County Area Codes
Income in Wexford County
Income Overview in Wexford County
Per Capita Income in Wexford County is $29,617, while median incomes of families and households are $70,704 and $58,652 respectively.
| Characteristic | Number | Measure |
| Per Capita Income | 33,766 | $29,617 |
| Median Family Income | 8,934 | $70,704 |
| Mean Family Income | 8,934 | $88,396 |
| Median Household Income | 13,167 | $58,652 |
| Mean Household Income | 13,167 | $74,610 |
| Income Deficit | 8,934 | $11,452 |
| Wage / Income Gap (%) | 33,766 | 26.03% |
| Wage / Income Gap ($) | 33,766 | 73.97¢ per $1 |
| Gini / Inequality Index | 33,766 | 0.44 |
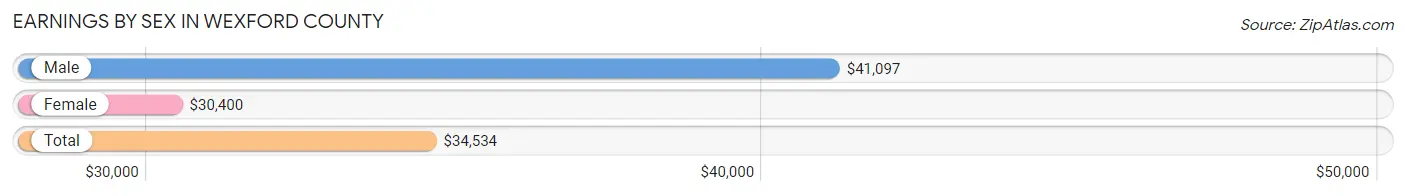
Earnings by Sex in Wexford County
Average Earnings in Wexford County are $34,534, $41,097 for men and $30,400 for women, a difference of 26.0%.
| Sex | Number | Average Earnings |
| Male | 8,583 (54.1%) | $41,097 |
| Female | 7,284 (45.9%) | $30,400 |
| Total | 15,867 (100.0%) | $34,534 |
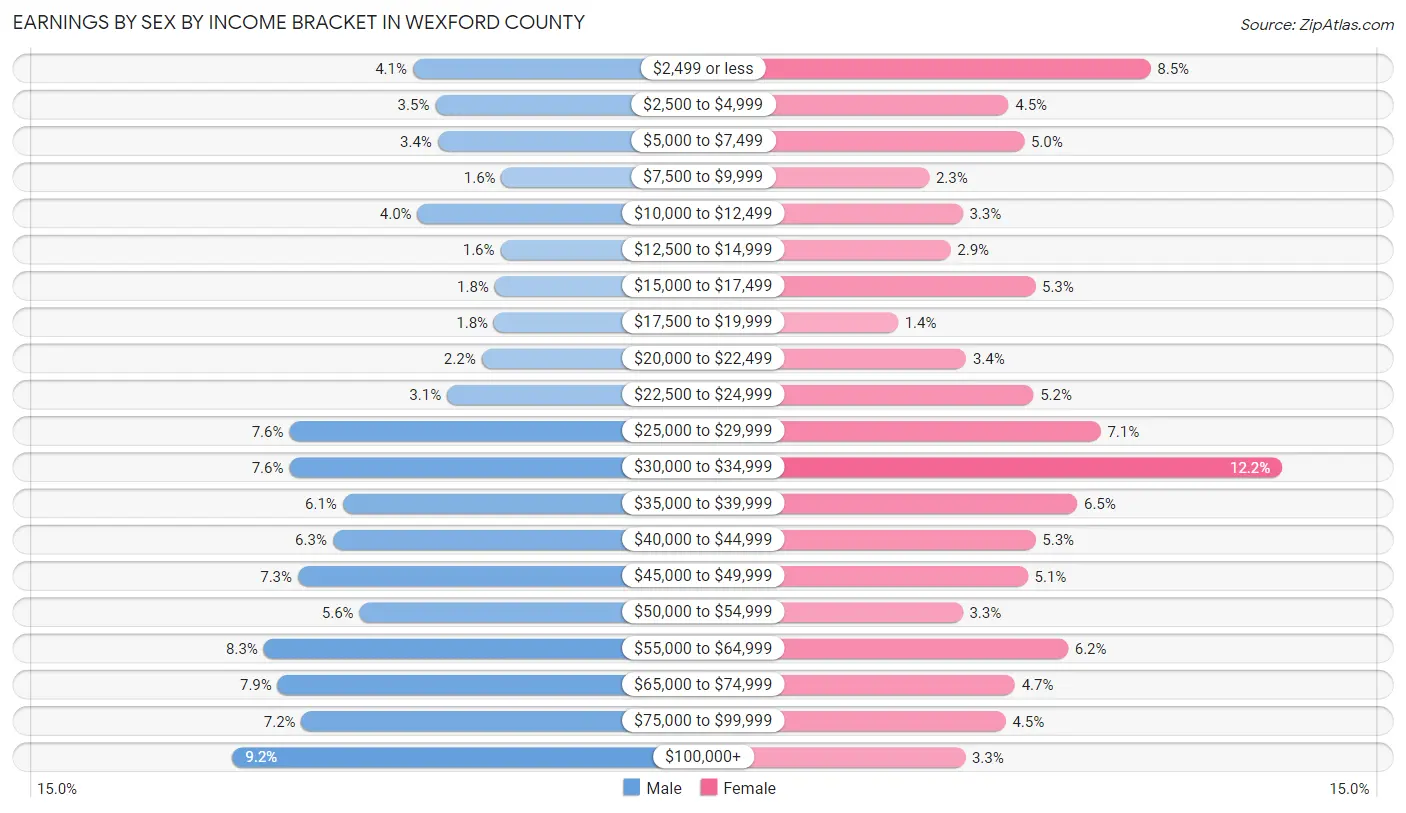
Earnings by Sex by Income Bracket in Wexford County
The most common earnings brackets in Wexford County are $100,000+ for men (786 | 9.2%) and $30,000 to $34,999 for women (891 | 12.2%).
| Income | Male | Female |
| $2,499 or less | 351 (4.1%) | 621 (8.5%) |
| $2,500 to $4,999 | 297 (3.5%) | 331 (4.5%) |
| $5,000 to $7,499 | 291 (3.4%) | 363 (5.0%) |
| $7,500 to $9,999 | 137 (1.6%) | 168 (2.3%) |
| $10,000 to $12,499 | 340 (4.0%) | 237 (3.3%) |
| $12,500 to $14,999 | 140 (1.6%) | 212 (2.9%) |
| $15,000 to $17,499 | 154 (1.8%) | 385 (5.3%) |
| $17,500 to $19,999 | 155 (1.8%) | 104 (1.4%) |
| $20,000 to $22,499 | 185 (2.2%) | 244 (3.4%) |
| $22,500 to $24,999 | 269 (3.1%) | 382 (5.2%) |
| $25,000 to $29,999 | 649 (7.6%) | 519 (7.1%) |
| $30,000 to $34,999 | 649 (7.6%) | 891 (12.2%) |
| $35,000 to $39,999 | 520 (6.1%) | 471 (6.5%) |
| $40,000 to $44,999 | 544 (6.3%) | 386 (5.3%) |
| $45,000 to $49,999 | 628 (7.3%) | 370 (5.1%) |
| $50,000 to $54,999 | 480 (5.6%) | 237 (3.3%) |
| $55,000 to $64,999 | 711 (8.3%) | 452 (6.2%) |
| $65,000 to $74,999 | 677 (7.9%) | 344 (4.7%) |
| $75,000 to $99,999 | 620 (7.2%) | 325 (4.5%) |
| $100,000+ | 786 (9.2%) | 242 (3.3%) |
| Total | 8,583 (100.0%) | 7,284 (100.0%) |
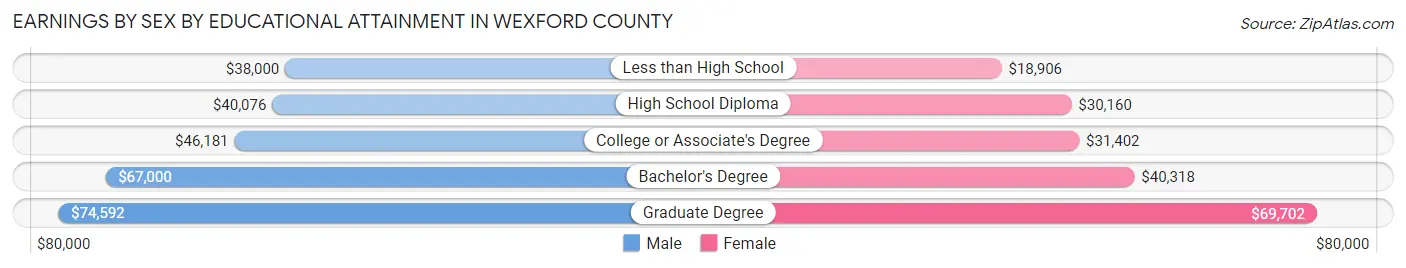
Earnings by Sex by Educational Attainment in Wexford County
Average earnings in Wexford County are $45,236 for men and $32,561 for women, a difference of 28.0%. Men with an educational attainment of graduate degree enjoy the highest average annual earnings of $74,592, while those with less than high school education earn the least with $38,000. Women with an educational attainment of graduate degree earn the most with the average annual earnings of $69,702, while those with less than high school education have the smallest earnings of $18,906.
| Educational Attainment | Male Income | Female Income |
| Less than High School | $38,000 | $18,906 |
| High School Diploma | $40,076 | $30,160 |
| College or Associate's Degree | $46,181 | $31,402 |
| Bachelor's Degree | $67,000 | $40,318 |
| Graduate Degree | $74,592 | $69,702 |
| Total | $45,236 | $32,561 |
Family Income in Wexford County
Family Income Brackets in Wexford County
According to the Wexford County family income data, there are 2,001 families falling into the $50,000 to $74,999 income range, which is the most common income bracket and makes up 22.4% of all families. Conversely, the $10,000 to $14,999 income bracket is the least frequent group with only 143 families (1.6%) belonging to this category.
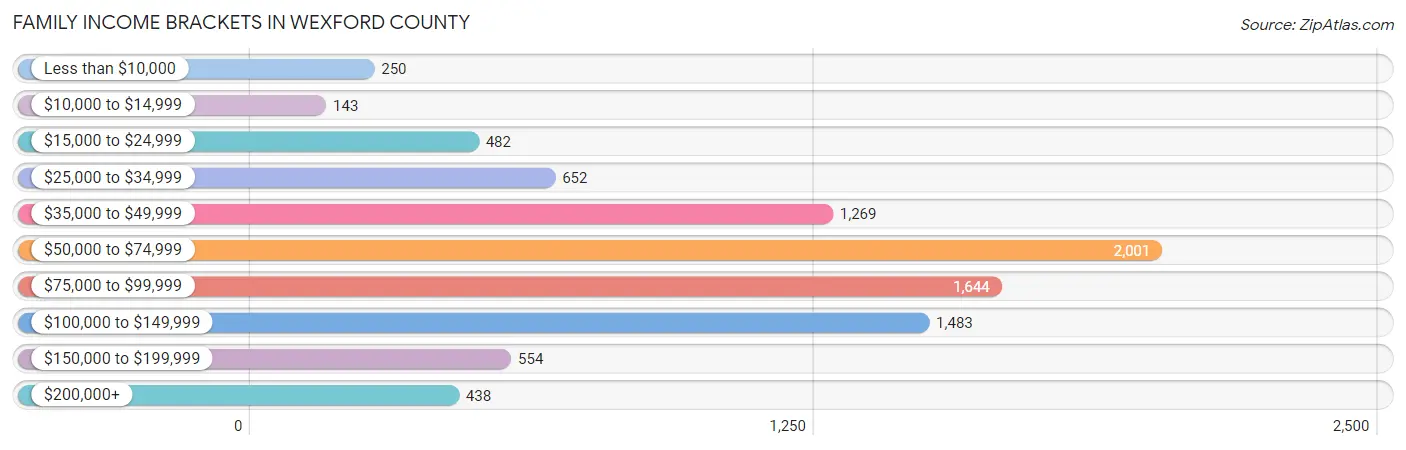
| Income Bracket | # Families | % Families |
| Less than $10,000 | 250 | 2.8% |
| $10,000 to $14,999 | 143 | 1.6% |
| $15,000 to $24,999 | 482 | 5.4% |
| $25,000 to $34,999 | 652 | 7.3% |
| $35,000 to $49,999 | 1,269 | 14.2% |
| $50,000 to $74,999 | 2,001 | 22.4% |
| $75,000 to $99,999 | 1,644 | 18.4% |
| $100,000 to $149,999 | 1,483 | 16.6% |
| $150,000 to $199,999 | 554 | 6.2% |
| $200,000+ | 438 | 4.9% |
Family Income by Famaliy Size in Wexford County
4-person families (1,337 | 15.0%) account for the highest median family income in Wexford County with $78,750 per family, while 2-person families (4,807 | 53.8%) have the highest median income of $32,951 per family member.
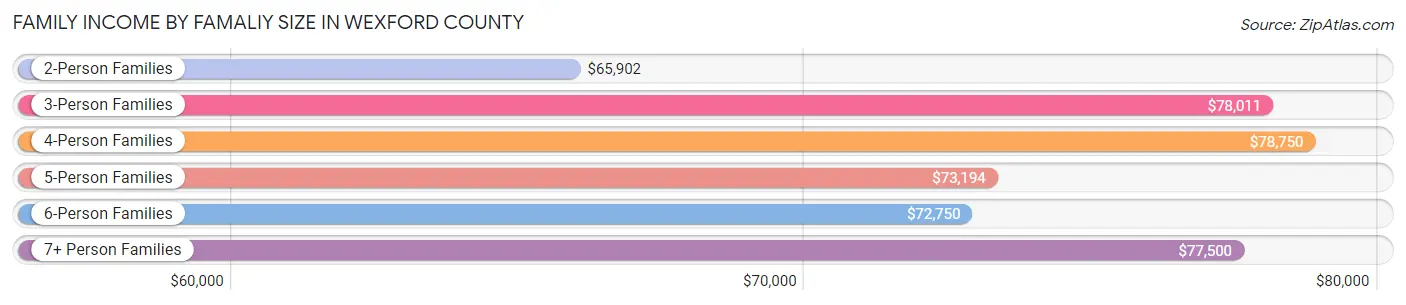
| Income Bracket | # Families | Median Income |
| 2-Person Families | 4,807 (53.8%) | $65,902 |
| 3-Person Families | 1,617 (18.1%) | $78,011 |
| 4-Person Families | 1,337 (15.0%) | $78,750 |
| 5-Person Families | 609 (6.8%) | $73,194 |
| 6-Person Families | 362 (4.1%) | $72,750 |
| 7+ Person Families | 202 (2.3%) | $77,500 |
| Total | 8,934 (100.0%) | $70,704 |
Family Income by Number of Earners in Wexford County
The median family income in Wexford County is $70,704, with families comprising 3+ earners (797) having the highest median family income of $118,689, while families with no earners (1,964) have the lowest median family income of $46,192, accounting for 8.9% and 22.0% of families, respectively.
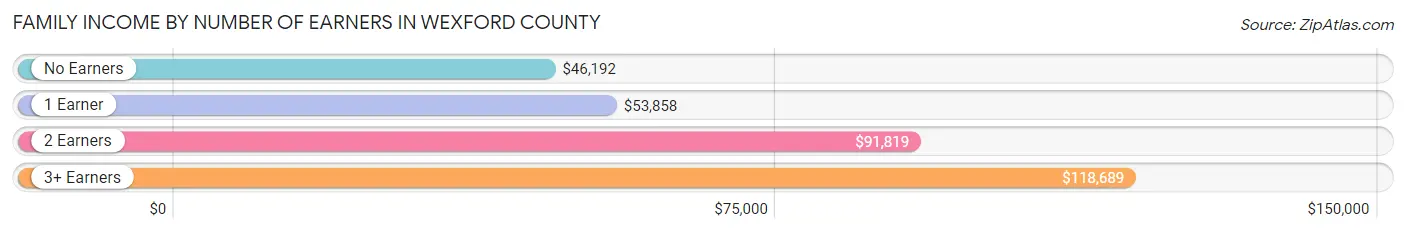
| Number of Earners | # Families | Median Income |
| No Earners | 1,964 (22.0%) | $46,192 |
| 1 Earner | 3,022 (33.8%) | $53,858 |
| 2 Earners | 3,151 (35.3%) | $91,819 |
| 3+ Earners | 797 (8.9%) | $118,689 |
| Total | 8,934 (100.0%) | $70,704 |
Household Income in Wexford County
Household Income Brackets in Wexford County
With 2,489 households falling in the category, the $50,000 to $74,999 income range is the most frequent in Wexford County, accounting for 18.9% of all households. In contrast, only 474 households (3.6%) fall into the $200,000+ income bracket, making it the least populous group.
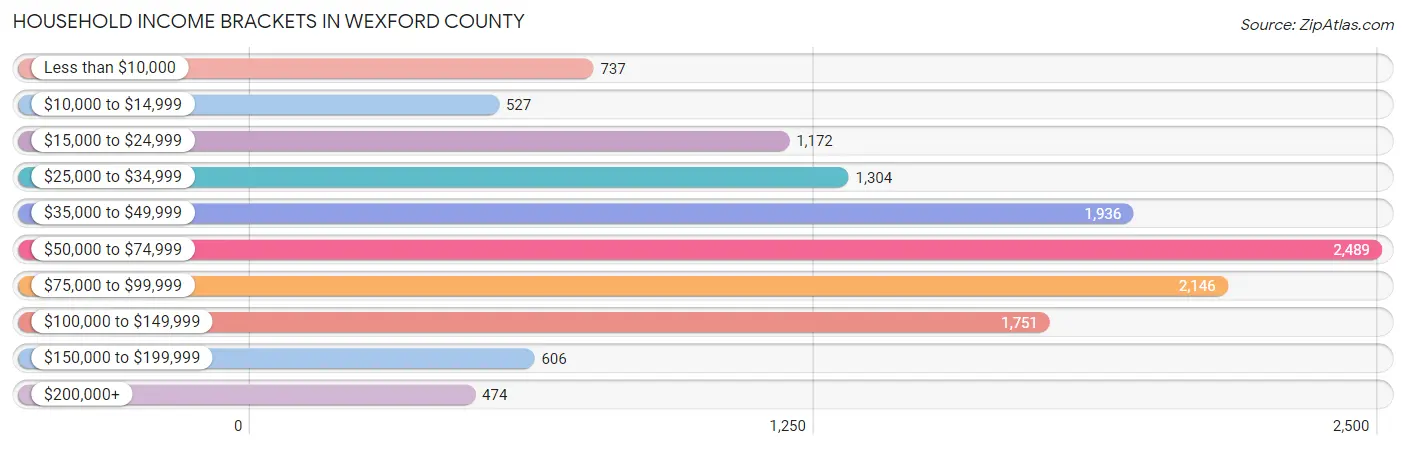
| Income Bracket | # Households | % Households |
| Less than $10,000 | 737 | 5.6% |
| $10,000 to $14,999 | 527 | 4.0% |
| $15,000 to $24,999 | 1,172 | 8.9% |
| $25,000 to $34,999 | 1,304 | 9.9% |
| $35,000 to $49,999 | 1,936 | 14.7% |
| $50,000 to $74,999 | 2,489 | 18.9% |
| $75,000 to $99,999 | 2,146 | 16.3% |
| $100,000 to $149,999 | 1,751 | 13.3% |
| $150,000 to $199,999 | 606 | 4.6% |
| $200,000+ | 474 | 3.6% |
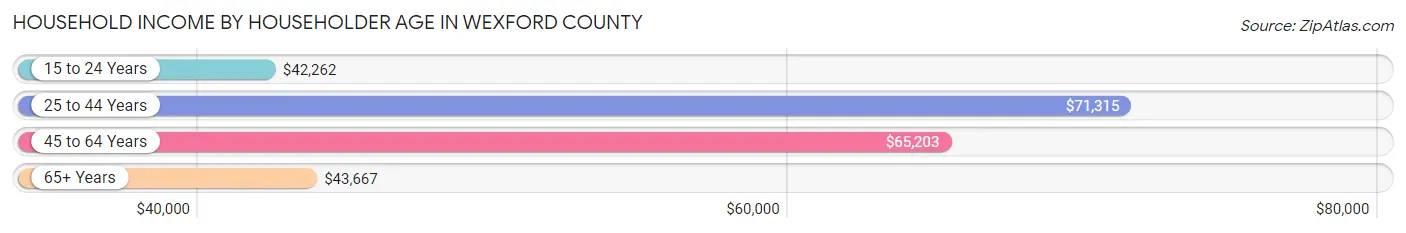
Household Income by Householder Age in Wexford County
The median household income in Wexford County is $58,652, with the highest median household income of $71,315 found in the 25 to 44 years age bracket for the primary householder. A total of 3,539 households (26.9%) fall into this category. Meanwhile, the 15 to 24 years age bracket for the primary householder has the lowest median household income of $42,262, with 482 households (3.7%) in this group.
| Income Bracket | # Households | Median Income |
| 15 to 24 Years | 482 (3.7%) | $42,262 |
| 25 to 44 Years | 3,539 (26.9%) | $71,315 |
| 45 to 64 Years | 4,828 (36.7%) | $65,203 |
| 65+ Years | 4,318 (32.8%) | $43,667 |
| Total | 13,167 (100.0%) | $58,652 |
Poverty in Wexford County
Income Below Poverty by Sex and Age in Wexford County
With 12.2% poverty level for males and 14.4% for females among the residents of Wexford County, under 5 year old males and 15 year old females are the most vulnerable to poverty, with 193 males (20.2%) and 146 females (46.5%) in their respective age groups living below the poverty level.
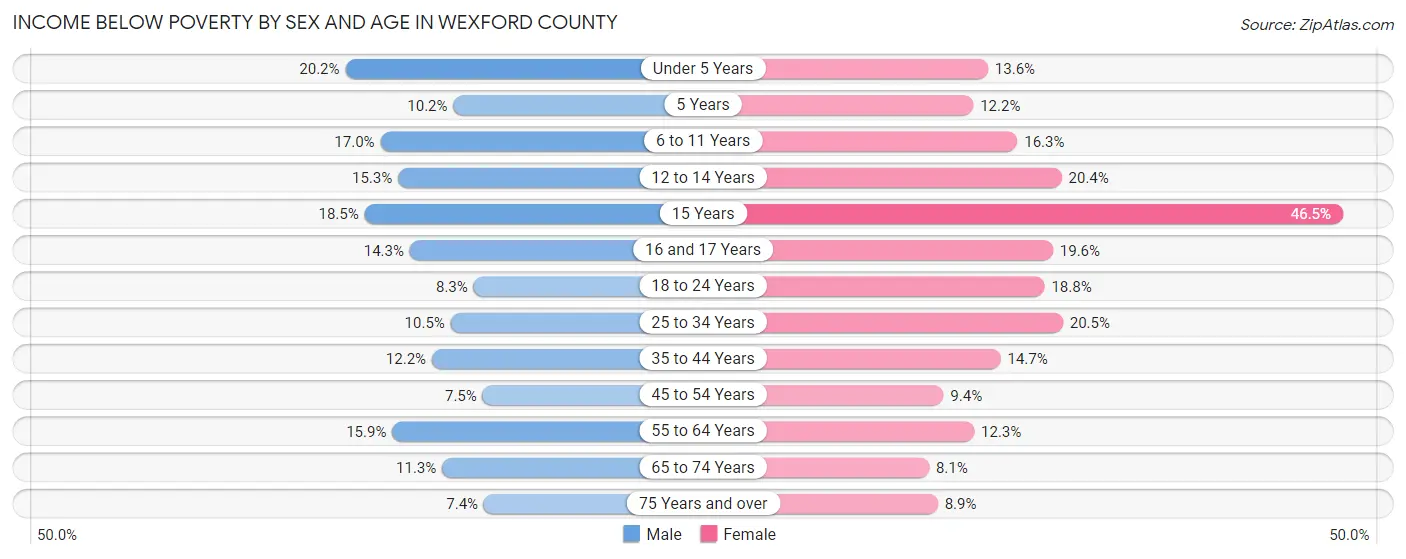
| Age Bracket | Male | Female |
| Under 5 Years | 193 (20.2%) | 123 (13.6%) |
| 5 Years | 29 (10.2%) | 30 (12.2%) |
| 6 to 11 Years | 223 (17.0%) | 216 (16.3%) |
| 12 to 14 Years | 87 (15.3%) | 112 (20.4%) |
| 15 Years | 43 (18.4%) | 146 (46.5%) |
| 16 and 17 Years | 59 (14.2%) | 77 (19.6%) |
| 18 to 24 Years | 107 (8.3%) | 222 (18.8%) |
| 25 to 34 Years | 199 (10.5%) | 403 (20.5%) |
| 35 to 44 Years | 244 (12.2%) | 282 (14.7%) |
| 45 to 54 Years | 156 (7.5%) | 182 (9.4%) |
| 55 to 64 Years | 389 (15.9%) | 304 (12.3%) |
| 65 to 74 Years | 227 (11.3%) | 159 (8.1%) |
| 75 Years and over | 88 (7.4%) | 125 (8.9%) |
| Total | 2,044 (12.2%) | 2,381 (14.4%) |
Income Above Poverty by Sex and Age in Wexford County
According to the poverty statistics in Wexford County, males aged 75 years and over and females aged 65 to 74 years are the age groups that are most secure financially, with 92.6% of males and 91.9% of females in these age groups living above the poverty line.
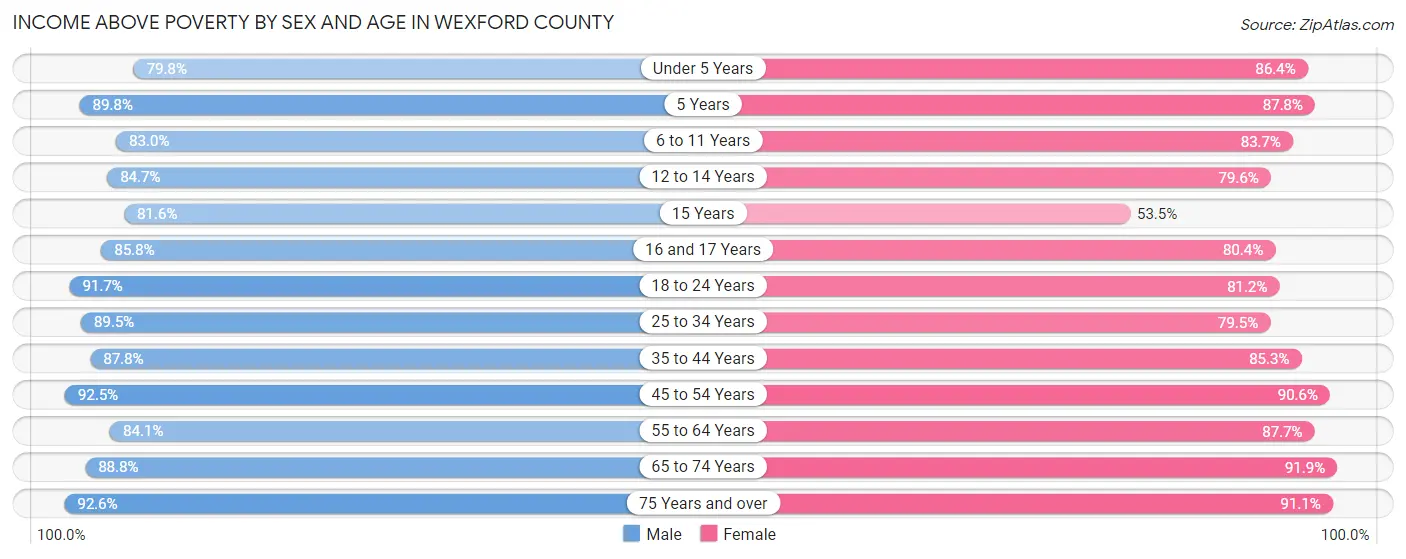
| Age Bracket | Male | Female |
| Under 5 Years | 761 (79.8%) | 784 (86.4%) |
| 5 Years | 255 (89.8%) | 216 (87.8%) |
| 6 to 11 Years | 1,090 (83.0%) | 1,110 (83.7%) |
| 12 to 14 Years | 480 (84.7%) | 437 (79.6%) |
| 15 Years | 190 (81.6%) | 168 (53.5%) |
| 16 and 17 Years | 355 (85.8%) | 316 (80.4%) |
| 18 to 24 Years | 1,177 (91.7%) | 958 (81.2%) |
| 25 to 34 Years | 1,704 (89.5%) | 1,562 (79.5%) |
| 35 to 44 Years | 1,756 (87.8%) | 1,632 (85.3%) |
| 45 to 54 Years | 1,928 (92.5%) | 1,748 (90.6%) |
| 55 to 64 Years | 2,061 (84.1%) | 2,171 (87.7%) |
| 65 to 74 Years | 1,791 (88.7%) | 1,807 (91.9%) |
| 75 Years and over | 1,106 (92.6%) | 1,280 (91.1%) |
| Total | 14,654 (87.8%) | 14,189 (85.6%) |
Income Below Poverty Among Married-Couple Families in Wexford County
The poverty statistics for married-couple families in Wexford County show that 3.9% or 259 of the total 6,683 families live below the poverty line. Families with 3 or 4 children have the highest poverty rate of 10.2%, comprising of 68 families. On the other hand, families with 5 or more children have the lowest poverty rate of 2.1%, which includes 2 families.
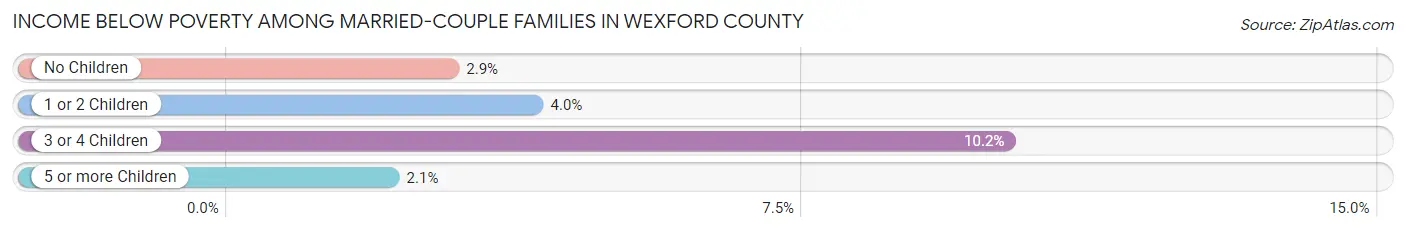
| Children | Above Poverty | Below Poverty |
| No Children | 4,165 (97.1%) | 124 (2.9%) |
| 1 or 2 Children | 1,565 (96.0%) | 65 (4.0%) |
| 3 or 4 Children | 601 (89.8%) | 68 (10.2%) |
| 5 or more Children | 93 (97.9%) | 2 (2.1%) |
| Total | 6,424 (96.1%) | 259 (3.9%) |
Income Below Poverty Among Single-Parent Households in Wexford County
According to the poverty data in Wexford County, 13.0% or 109 single-father households and 25.4% or 359 single-mother households are living below the poverty line. Among single-father households, those with 3 or 4 children have the highest poverty rate, with 27 households (27.3%) experiencing poverty. Likewise, among single-mother households, those with 3 or 4 children have the highest poverty rate, with 156 households (84.8%) falling below the poverty line.
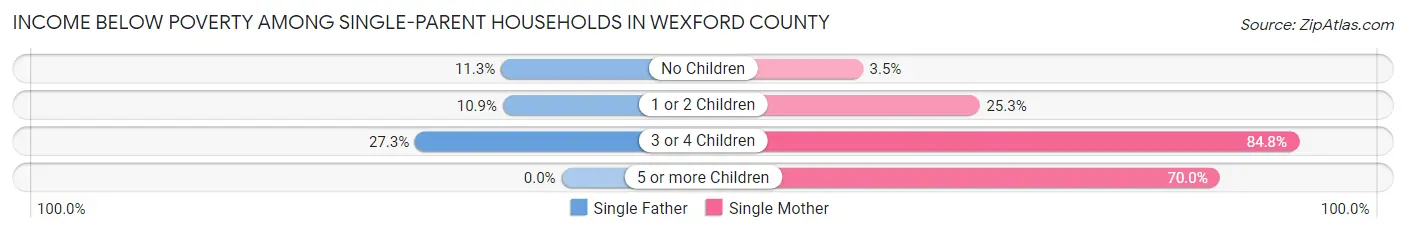
| Children | Single Father | Single Mother |
| No Children | 48 (11.3%) | 19 (3.5%) |
| 1 or 2 Children | 34 (10.9%) | 170 (25.3%) |
| 3 or 4 Children | 27 (27.3%) | 156 (84.8%) |
| 5 or more Children | 0 (0.0%) | 14 (70.0%) |
| Total | 109 (13.0%) | 359 (25.4%) |
Income Below Poverty Among Married-Couple vs Single-Parent Households in Wexford County
The poverty data for Wexford County shows that 259 of the married-couple family households (3.9%) and 468 of the single-parent households (20.8%) are living below the poverty level. Within the married-couple family households, those with 3 or 4 children have the highest poverty rate, with 68 households (10.2%) falling below the poverty line. Among the single-parent households, those with 5 or more children have the highest poverty rate, with 14 household (70.0%) living below poverty.
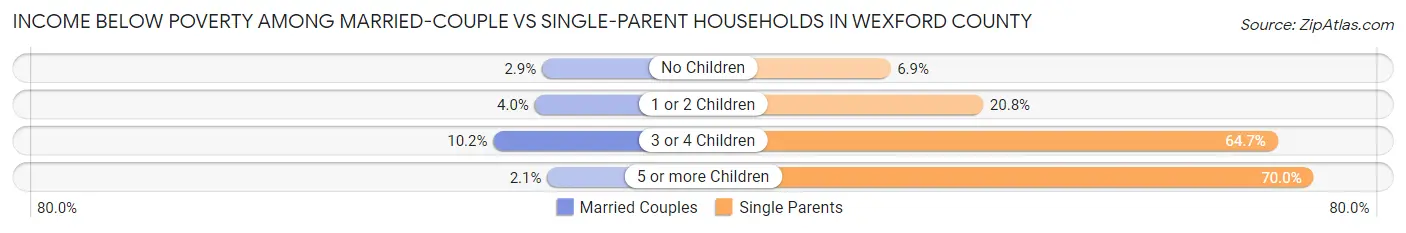
| Children | Married-Couple Families | Single-Parent Households |
| No Children | 124 (2.9%) | 67 (6.9%) |
| 1 or 2 Children | 65 (4.0%) | 204 (20.7%) |
| 3 or 4 Children | 68 (10.2%) | 183 (64.7%) |
| 5 or more Children | 2 (2.1%) | 14 (70.0%) |
| Total | 259 (3.9%) | 468 (20.8%) |
Race in Wexford County
The most populous races in Wexford County are White / Caucasian (31,383 | 92.9%), Two or more Races (1,560 | 4.6%), and Hispanic or Latino (778 | 2.3%).
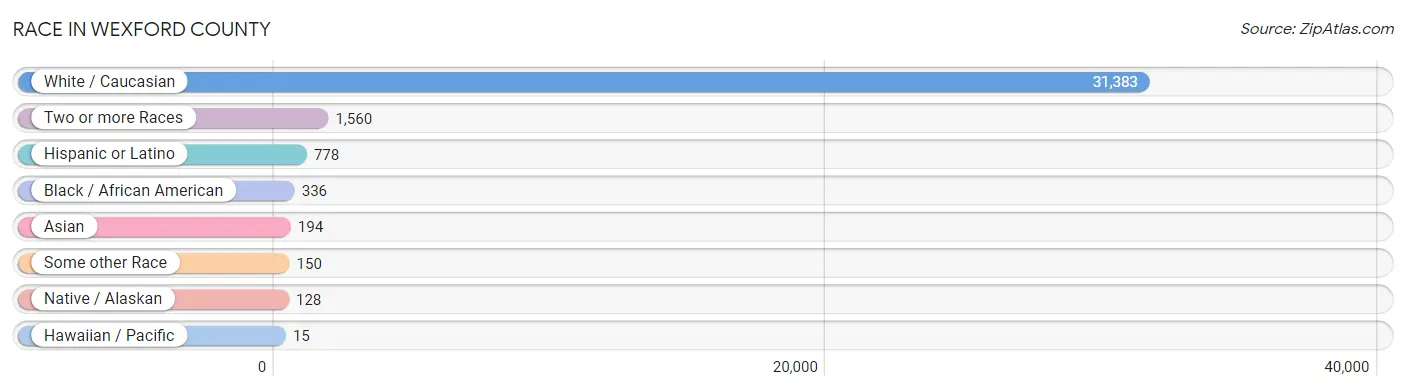
| Race | # Population | % Population |
| Asian | 194 | 0.6% |
| Black / African American | 336 | 1.0% |
| Hawaiian / Pacific | 15 | 0.0% |
| Hispanic or Latino | 778 | 2.3% |
| Native / Alaskan | 128 | 0.4% |
| White / Caucasian | 31,383 | 92.9% |
| Two or more Races | 1,560 | 4.6% |
| Some other Race | 150 | 0.4% |
| Total | 33,766 | 100.0% |
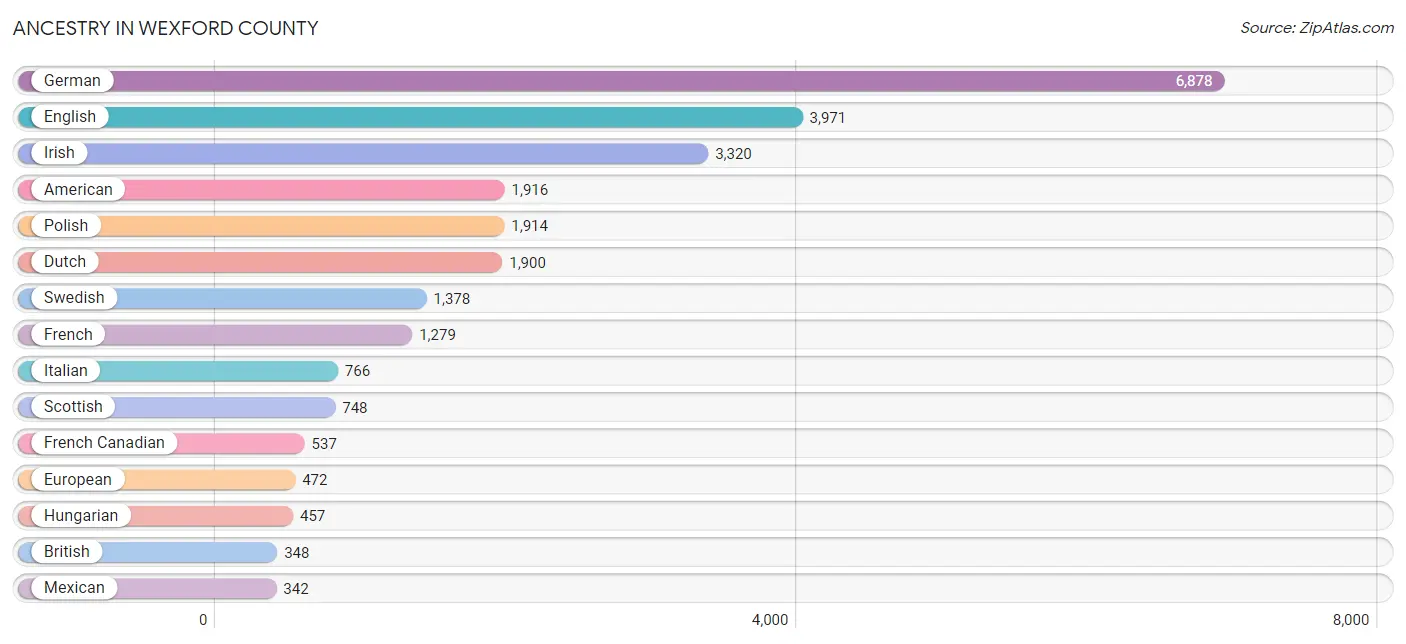
Ancestry in Wexford County
The most populous ancestries reported in Wexford County are German (6,878 | 20.4%), English (3,971 | 11.8%), Irish (3,320 | 9.8%), American (1,916 | 5.7%), and Polish (1,914 | 5.7%), together accounting for 53.3% of all Wexford County residents.
| Ancestry | # Population | % Population |
| African | 6 | 0.0% |
| Alaska Native | 28 | 0.1% |
| Albanian | 6 | 0.0% |
| Alsatian | 1 | 0.0% |
| American | 1,916 | 5.7% |
| Apache | 1 | 0.0% |
| Arab | 65 | 0.2% |
| Armenian | 5 | 0.0% |
| Austrian | 72 | 0.2% |
| Belgian | 86 | 0.3% |
| Bhutanese | 44 | 0.1% |
| Blackfeet | 14 | 0.0% |
| British | 348 | 1.0% |
| Burmese | 78 | 0.2% |
| Cajun | 10 | 0.0% |
| Canadian | 103 | 0.3% |
| Central American | 64 | 0.2% |
| Cherokee | 50 | 0.2% |
| Chippewa | 62 | 0.2% |
| Colombian | 13 | 0.0% |
| Comanche | 4 | 0.0% |
| Creek | 34 | 0.1% |
| Croatian | 26 | 0.1% |
| Cuban | 45 | 0.1% |
| Czech | 164 | 0.5% |
| Czechoslovakian | 10 | 0.0% |
| Danish | 103 | 0.3% |
| Dominican | 61 | 0.2% |
| Dutch | 1,900 | 5.6% |
| Eastern European | 16 | 0.1% |
| Ecuadorian | 32 | 0.1% |
| English | 3,971 | 11.8% |
| European | 472 | 1.4% |
| Finnish | 204 | 0.6% |
| French | 1,279 | 3.8% |
| French American Indian | 13 | 0.0% |
| French Canadian | 537 | 1.6% |
| German | 6,878 | 20.4% |
| Greek | 97 | 0.3% |
| Guamanian / Chamorro | 15 | 0.0% |
| Guatemalan | 11 | 0.0% |
| Haitian | 37 | 0.1% |
| Hungarian | 457 | 1.3% |
| Indian (Asian) | 19 | 0.1% |
| Irish | 3,320 | 9.8% |
| Iroquois | 2 | 0.0% |
| Italian | 766 | 2.3% |
| Korean | 81 | 0.2% |
| Lebanese | 26 | 0.1% |
| Lithuanian | 32 | 0.1% |
| Lumbee | 1 | 0.0% |
| Macedonian | 5 | 0.0% |
| Malaysian | 13 | 0.0% |
| Maltese | 5 | 0.0% |
| Mexican | 342 | 1.0% |
| Native Hawaiian | 6 | 0.0% |
| Northern European | 58 | 0.2% |
| Norwegian | 320 | 0.9% |
| Okinawan | 3 | 0.0% |
| Ottawa | 60 | 0.2% |
| Pakistani | 4 | 0.0% |
| Panamanian | 53 | 0.2% |
| Pennsylvania German | 71 | 0.2% |
| Polish | 1,914 | 5.7% |
| Portuguese | 3 | 0.0% |
| Potawatomi | 16 | 0.1% |
| Puerto Rican | 142 | 0.4% |
| Romanian | 45 | 0.1% |
| Russian | 124 | 0.4% |
| Samoan | 17 | 0.1% |
| Scandinavian | 98 | 0.3% |
| Scotch-Irish | 166 | 0.5% |
| Scottish | 748 | 2.2% |
| Sioux | 6 | 0.0% |
| Slavic | 10 | 0.0% |
| Slovak | 43 | 0.1% |
| Slovene | 42 | 0.1% |
| South American | 45 | 0.1% |
| Spaniard | 39 | 0.1% |
| Spanish | 4 | 0.0% |
| Sri Lankan | 29 | 0.1% |
| Subsaharan African | 6 | 0.0% |
| Swedish | 1,378 | 4.1% |
| Swiss | 99 | 0.3% |
| Syrian | 33 | 0.1% |
| Thai | 38 | 0.1% |
| Turkish | 3 | 0.0% |
| Ukrainian | 63 | 0.2% |
| Vietnamese | 46 | 0.1% |
| Welsh | 148 | 0.4% |
| Yaqui | 6 | 0.0% |
| Yugoslavian | 28 | 0.1% | View All 92 Rows |
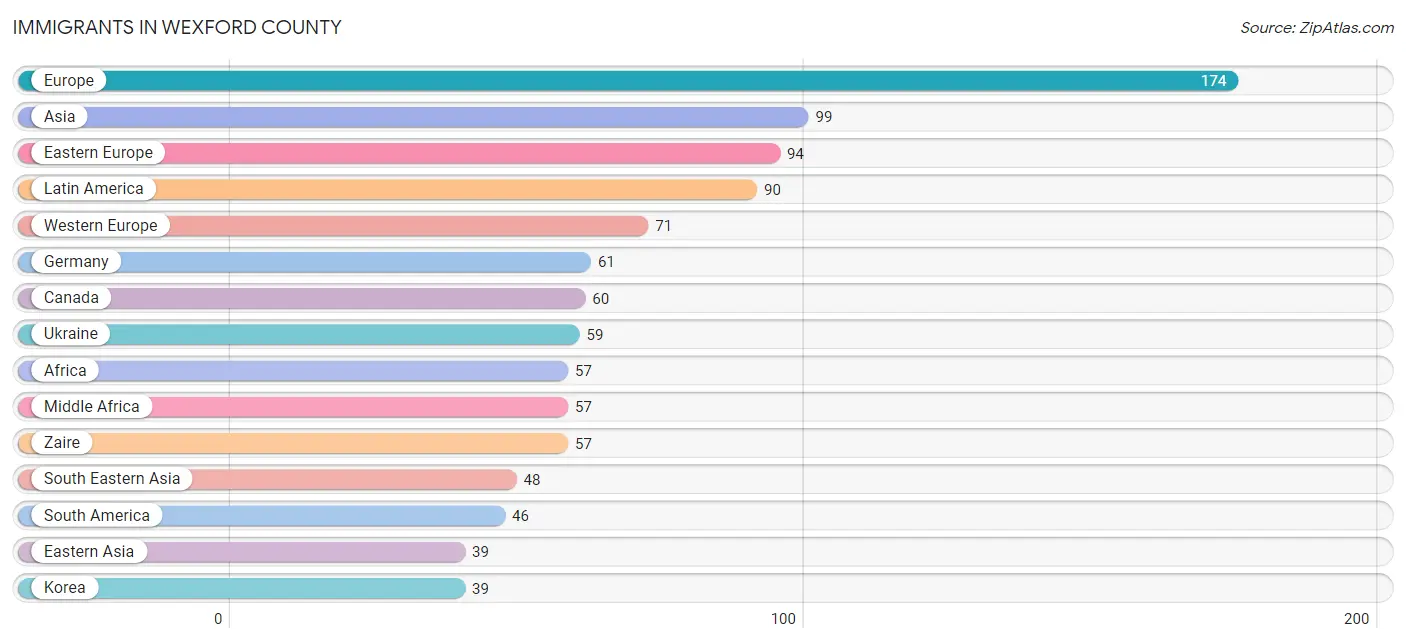
Immigrants in Wexford County
The most numerous immigrant groups reported in Wexford County came from Europe (174 | 0.5%), Asia (99 | 0.3%), Eastern Europe (94 | 0.3%), Latin America (90 | 0.3%), and Western Europe (71 | 0.2%), together accounting for 1.6% of all Wexford County residents.
| Immigration Origin | # Population | % Population |
| Africa | 57 | 0.2% |
| Albania | 11 | 0.0% |
| Argentina | 5 | 0.0% |
| Asia | 99 | 0.3% |
| Bangladesh | 9 | 0.0% |
| Belgium | 1 | 0.0% |
| Canada | 60 | 0.2% |
| Caribbean | 33 | 0.1% |
| Central America | 11 | 0.0% |
| Colombia | 9 | 0.0% |
| Cuba | 32 | 0.1% |
| Eastern Asia | 39 | 0.1% |
| Eastern Europe | 94 | 0.3% |
| Ecuador | 32 | 0.1% |
| England | 6 | 0.0% |
| Europe | 174 | 0.5% |
| France | 5 | 0.0% |
| Germany | 61 | 0.2% |
| Haiti | 1 | 0.0% |
| Korea | 39 | 0.1% |
| Laos | 4 | 0.0% |
| Latin America | 90 | 0.3% |
| Mexico | 11 | 0.0% |
| Middle Africa | 57 | 0.2% |
| Netherlands | 4 | 0.0% |
| Northern Europe | 9 | 0.0% |
| Philippines | 37 | 0.1% |
| Poland | 14 | 0.0% |
| Romania | 6 | 0.0% |
| Russia | 4 | 0.0% |
| Singapore | 3 | 0.0% |
| South America | 46 | 0.1% |
| South Central Asia | 9 | 0.0% |
| South Eastern Asia | 48 | 0.1% |
| Sweden | 3 | 0.0% |
| Turkey | 3 | 0.0% |
| Ukraine | 59 | 0.2% |
| Vietnam | 4 | 0.0% |
| Western Asia | 3 | 0.0% |
| Western Europe | 71 | 0.2% |
| Zaire | 57 | 0.2% | View All 41 Rows |
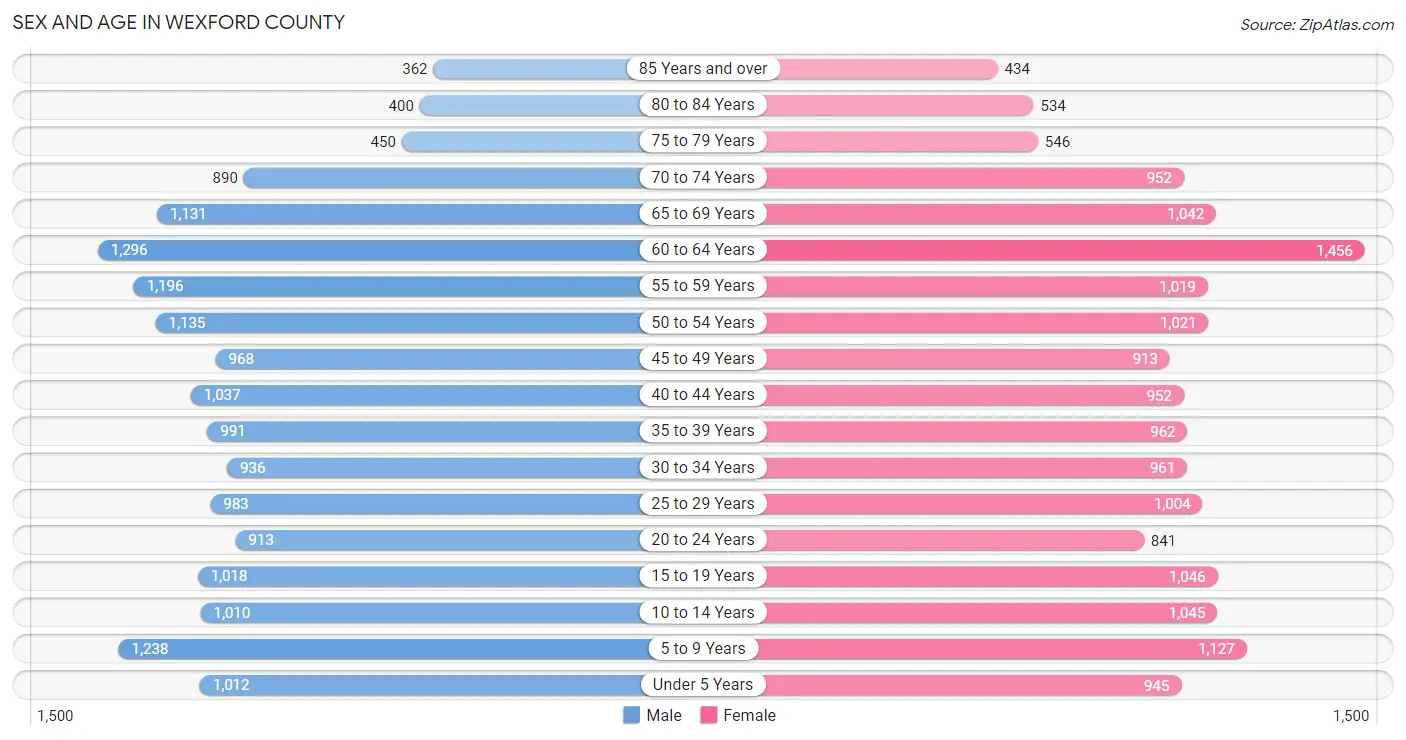
Sex and Age in Wexford County
Sex and Age in Wexford County
The most populous age groups in Wexford County are 60 to 64 Years (1,296 | 7.6%) for men and 60 to 64 Years (1,456 | 8.7%) for women.
| Age Bracket | Male | Female |
| Under 5 Years | 1,012 (6.0%) | 945 (5.6%) |
| 5 to 9 Years | 1,238 (7.3%) | 1,127 (6.7%) |
| 10 to 14 Years | 1,010 (5.9%) | 1,045 (6.2%) |
| 15 to 19 Years | 1,018 (6.0%) | 1,046 (6.2%) |
| 20 to 24 Years | 913 (5.4%) | 841 (5.0%) |
| 25 to 29 Years | 983 (5.8%) | 1,004 (6.0%) |
| 30 to 34 Years | 936 (5.5%) | 961 (5.7%) |
| 35 to 39 Years | 991 (5.8%) | 962 (5.7%) |
| 40 to 44 Years | 1,037 (6.1%) | 952 (5.7%) |
| 45 to 49 Years | 968 (5.7%) | 913 (5.4%) |
| 50 to 54 Years | 1,135 (6.7%) | 1,021 (6.1%) |
| 55 to 59 Years | 1,196 (7.0%) | 1,019 (6.1%) |
| 60 to 64 Years | 1,296 (7.6%) | 1,456 (8.7%) |
| 65 to 69 Years | 1,131 (6.7%) | 1,042 (6.2%) |
| 70 to 74 Years | 890 (5.2%) | 952 (5.7%) |
| 75 to 79 Years | 450 (2.6%) | 546 (3.3%) |
| 80 to 84 Years | 400 (2.4%) | 534 (3.2%) |
| 85 Years and over | 362 (2.1%) | 434 (2.6%) |
| Total | 16,966 (100.0%) | 16,800 (100.0%) |
Families and Households in Wexford County
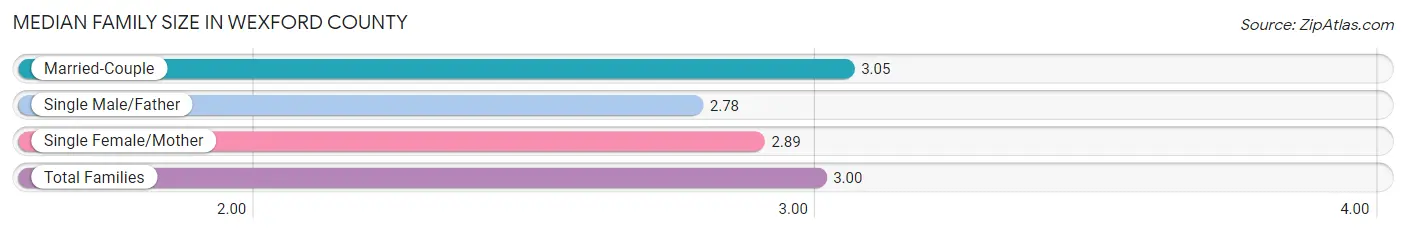
Median Family Size in Wexford County
The median family size in Wexford County is 3.00 persons per family, with married-couple families (6,683 | 74.8%) accounting for the largest median family size of 3.05 persons per family. On the other hand, single male/father families (836 | 9.4%) represent the smallest median family size with 2.78 persons per family.
| Family Type | # Families | Family Size |
| Married-Couple | 6,683 (74.8%) | 3.05 |
| Single Male/Father | 836 (9.4%) | 2.78 |
| Single Female/Mother | 1,415 (15.8%) | 2.89 |
| Total Families | 8,934 (100.0%) | 3.00 |
Median Household Size in Wexford County
The median household size in Wexford County is 2.54 persons per household, with single female/mother households (1,415 | 10.7%) accounting for the largest median household size of 3.28 persons per household. non-family households (4,233 | 32.2%) represent the smallest median household size with 1.32 persons per household.

| Household Type | # Households | Household Size |
| Married-Couple | 6,683 (50.8%) | 3.07 |
| Single Male/Father | 836 (6.4%) | 3.18 |
| Single Female/Mother | 1,415 (10.7%) | 3.28 |
| Non-family | 4,233 (32.2%) | 1.32 |
| Total Households | 13,167 (100.0%) | 2.54 |
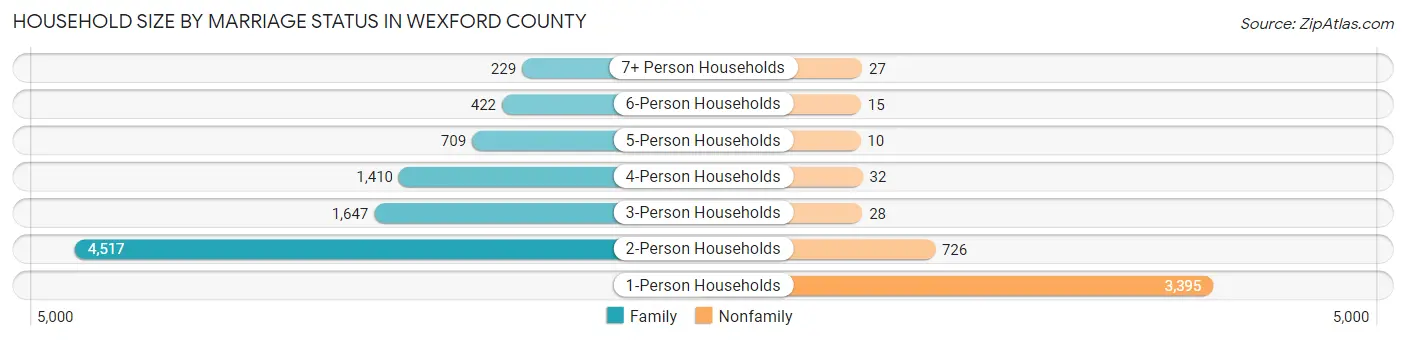
Household Size by Marriage Status in Wexford County
Out of a total of 13,167 households in Wexford County, 8,934 (67.8%) are family households, while 4,233 (32.2%) are nonfamily households. The most numerous type of family households are 2-person households, comprising 4,517, and the most common type of nonfamily households are 1-person households, comprising 3,395.
| Household Size | Family Households | Nonfamily Households |
| 1-Person Households | - | 3,395 (25.8%) |
| 2-Person Households | 4,517 (34.3%) | 726 (5.5%) |
| 3-Person Households | 1,647 (12.5%) | 28 (0.2%) |
| 4-Person Households | 1,410 (10.7%) | 32 (0.2%) |
| 5-Person Households | 709 (5.4%) | 10 (0.1%) |
| 6-Person Households | 422 (3.2%) | 15 (0.1%) |
| 7+ Person Households | 229 (1.7%) | 27 (0.2%) |
| Total | 8,934 (67.8%) | 4,233 (32.2%) |
Female Fertility in Wexford County
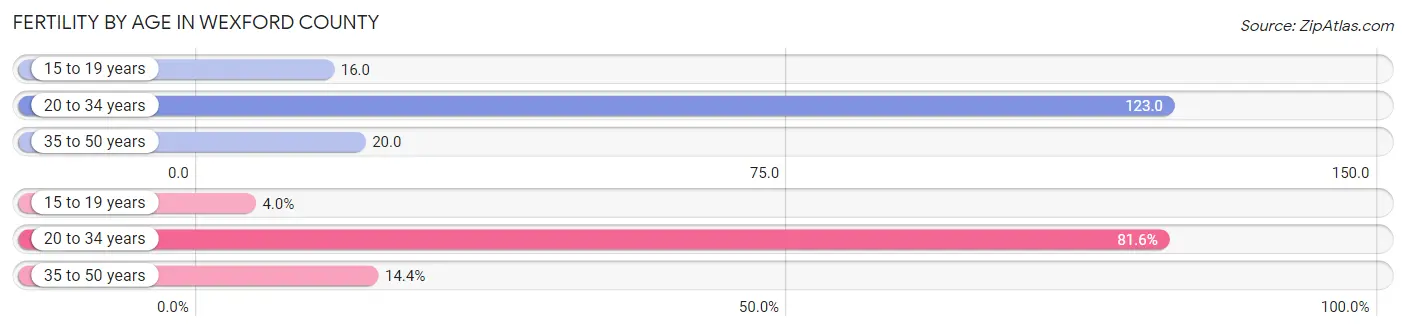
Fertility by Age in Wexford County
Average fertility rate in Wexford County is 62.0 births per 1,000 women. Women in the age bracket of 20 to 34 years have the highest fertility rate with 123.0 births per 1,000 women. Women in the age bracket of 20 to 34 years acount for 81.6% of all women with births.
| Age Bracket | Women with Births | Births / 1,000 Women |
| 15 to 19 years | 17 (4.0%) | 16.0 |
| 20 to 34 years | 345 (81.6%) | 123.0 |
| 35 to 50 years | 61 (14.4%) | 20.0 |
| Total | 423 (100.0%) | 62.0 |
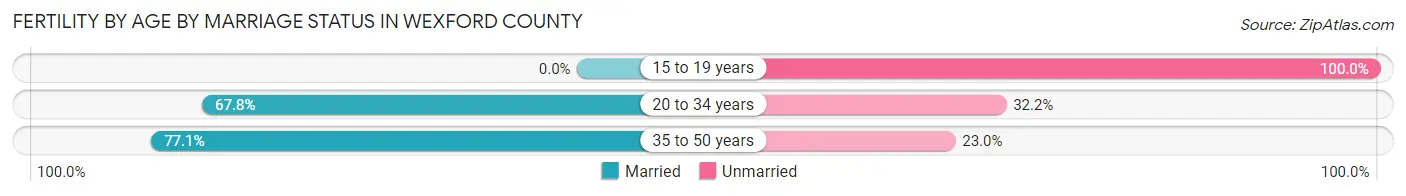
Fertility by Age by Marriage Status in Wexford County
66.4% of women with births (423) in Wexford County are married. The highest percentage of unmarried women with births falls into 15 to 19 years age bracket with 100.0% of them unmarried at the time of birth, while the lowest percentage of unmarried women with births belong to 35 to 50 years age bracket with 23.0% of them unmarried.
| Age Bracket | Married | Unmarried |
| 15 to 19 years | 0 (0.0%) | 17 (100.0%) |
| 20 to 34 years | 234 (67.8%) | 111 (32.2%) |
| 35 to 50 years | 47 (77.0%) | 14 (23.0%) |
| Total | 281 (66.4%) | 142 (33.6%) |
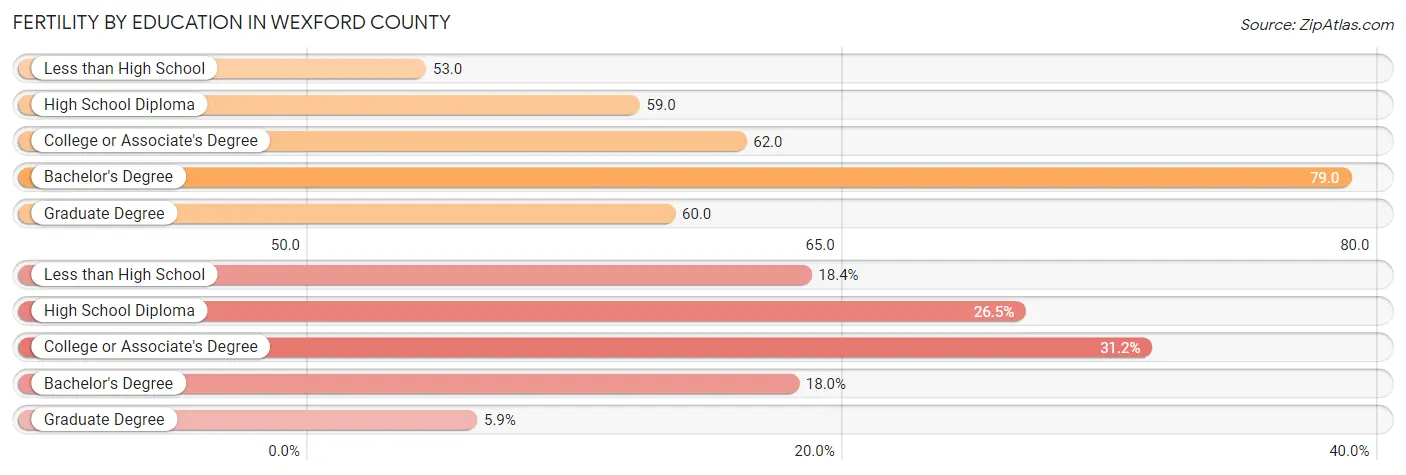
Fertility by Education in Wexford County
Average fertility rate in Wexford County is 62.0 births per 1,000 women. Women with the education attainment of bachelor's degree have the highest fertility rate of 79.0 births per 1,000 women, while women with the education attainment of less than high school have the lowest fertility at 53.0 births per 1,000 women. Women with the education attainment of college or associate's degree represent 31.2% of all women with births.
| Educational Attainment | Women with Births | Births / 1,000 Women |
| Less than High School | 78 (18.4%) | 53.0 |
| High School Diploma | 112 (26.5%) | 59.0 |
| College or Associate's Degree | 132 (31.2%) | 62.0 |
| Bachelor's Degree | 76 (18.0%) | 79.0 |
| Graduate Degree | 25 (5.9%) | 60.0 |
| Total | 423 (100.0%) | 62.0 |
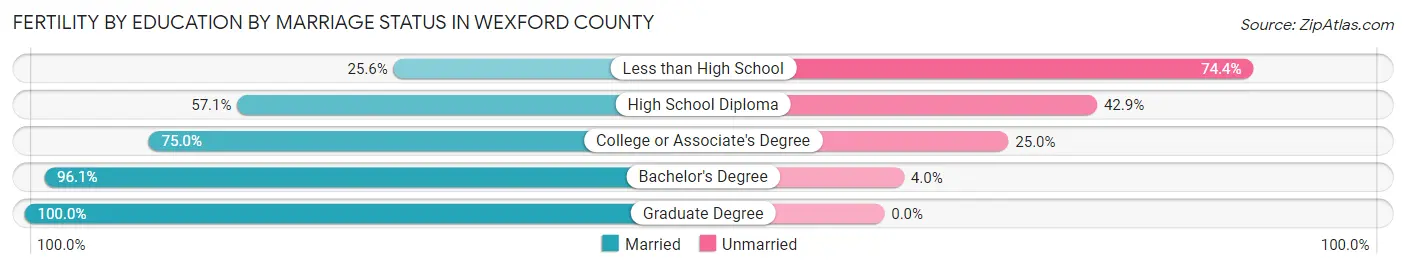
Fertility by Education by Marriage Status in Wexford County
33.6% of women with births in Wexford County are unmarried. Women with the educational attainment of graduate degree are most likely to be married with 100.0% of them married at childbirth, while women with the educational attainment of less than high school are least likely to be married with 74.4% of them unmarried at childbirth.
| Educational Attainment | Married | Unmarried |
| Less than High School | 20 (25.6%) | 58 (74.4%) |
| High School Diploma | 64 (57.1%) | 48 (42.9%) |
| College or Associate's Degree | 99 (75.0%) | 33 (25.0%) |
| Bachelor's Degree | 73 (96.1%) | 3 (4.0%) |
| Graduate Degree | 25 (100.0%) | 0 (0.0%) |
| Total | 281 (66.4%) | 142 (33.6%) |
Employment Characteristics in Wexford County
Employment by Class of Employer in Wexford County
Among the 13,849 employed individuals in Wexford County, private company employees (10,092 | 72.9%), not-for-profit organizations (1,081 | 7.8%), and self-employed (not incorporated) (767 | 5.5%) make up the most common classes of employment.
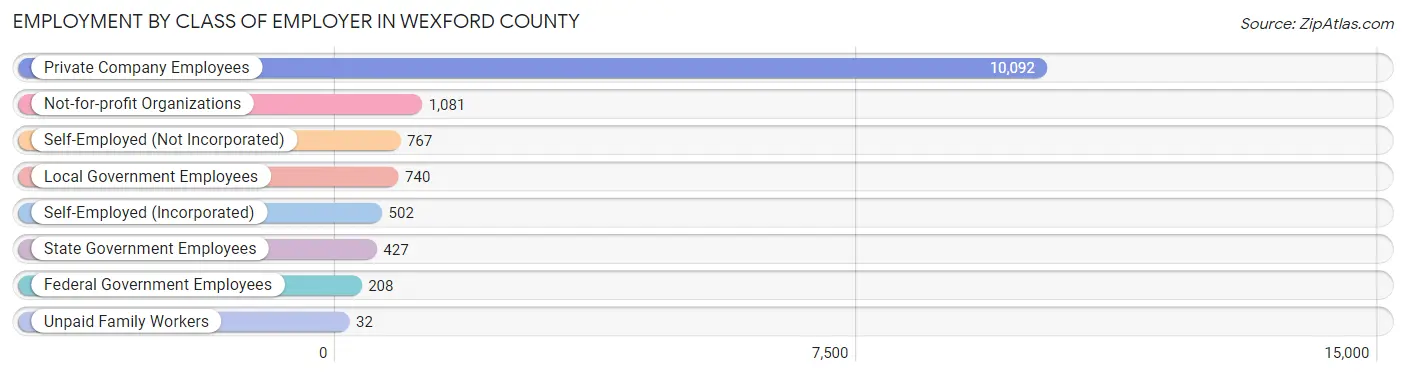
| Employer Class | # Employees | % Employees |
| Private Company Employees | 10,092 | 72.9% |
| Self-Employed (Incorporated) | 502 | 3.6% |
| Self-Employed (Not Incorporated) | 767 | 5.5% |
| Not-for-profit Organizations | 1,081 | 7.8% |
| Local Government Employees | 740 | 5.3% |
| State Government Employees | 427 | 3.1% |
| Federal Government Employees | 208 | 1.5% |
| Unpaid Family Workers | 32 | 0.2% |
| Total | 13,849 | 100.0% |
Employment Status by Age in Wexford County
According to the labor force statistics for Wexford County, out of the total population over 16 years of age (26,842), 56.1% or 15,058 individuals are in the labor force, with 6.3% or 949 of them unemployed. The age group with the highest labor force participation rate is 20 to 24 years, with 84.3% or 1,479 individuals in the labor force. Within the labor force, the 16 to 19 years age range has the highest percentage of unemployed individuals, with 19.3% or 123 of them being unemployed.
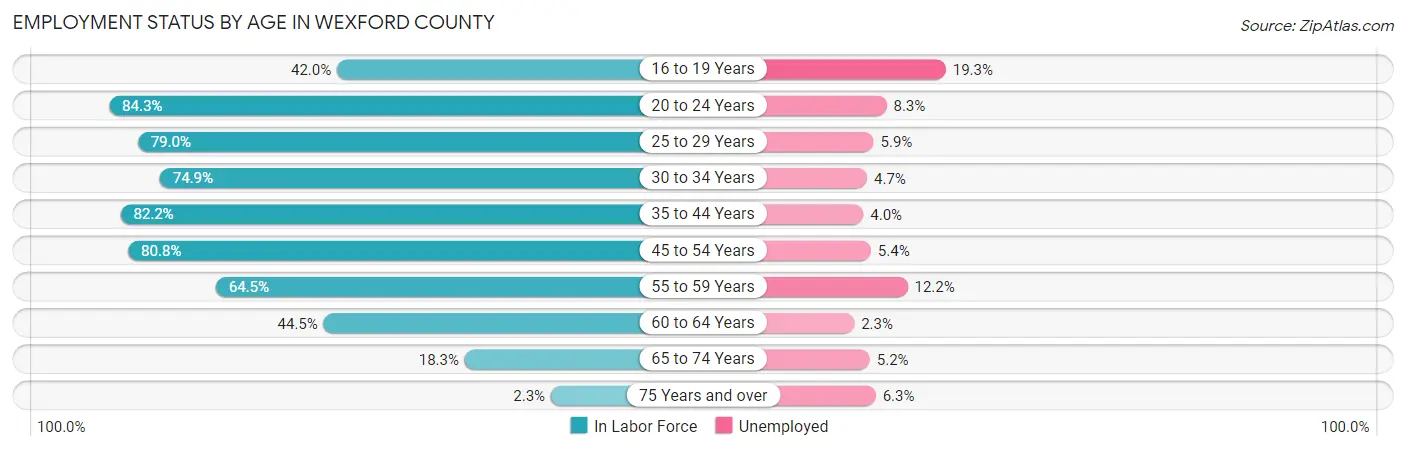
| Age Bracket | In Labor Force | Unemployed |
| 16 to 19 Years | 637 (42.0%) | 123 (19.3%) |
| 20 to 24 Years | 1,479 (84.3%) | 123 (8.3%) |
| 25 to 29 Years | 1,570 (79.0%) | 93 (5.9%) |
| 30 to 34 Years | 1,421 (74.9%) | 67 (4.7%) |
| 35 to 44 Years | 3,240 (82.2%) | 130 (4.0%) |
| 45 to 54 Years | 3,262 (80.8%) | 176 (5.4%) |
| 55 to 59 Years | 1,429 (64.5%) | 174 (12.2%) |
| 60 to 64 Years | 1,225 (44.5%) | 28 (2.3%) |
| 65 to 74 Years | 735 (18.3%) | 38 (5.2%) |
| 75 Years and over | 63 (2.3%) | 4 (6.3%) |
| Total | 15,058 (56.1%) | 949 (6.3%) |
Employment Status by Educational Attainment in Wexford County
According to labor force statistics for Wexford County, 72.2% of individuals (12,151) out of the total population between 25 and 64 years of age (16,830) are in the labor force, with 5.5% or 668 of them being unemployed. The group with the highest labor force participation rate are those with the educational attainment of bachelor's degree or higher, with 85.1% or 2,827 individuals in the labor force. Within the labor force, individuals with high school diploma education have the highest percentage of unemployment, with 7.9% or 316 of them being unemployed.
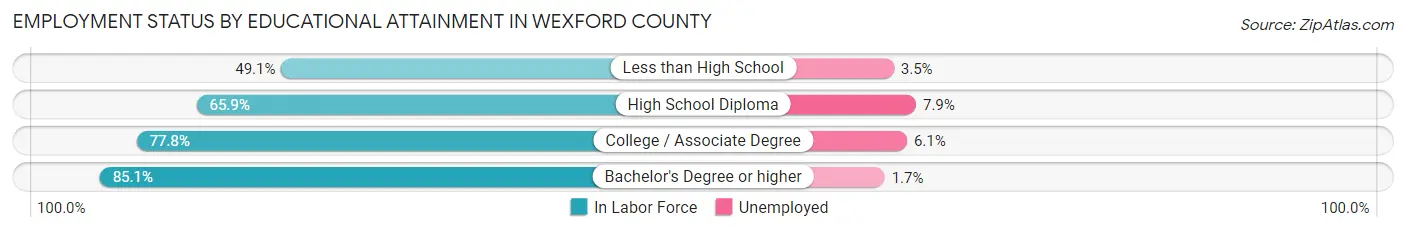
| Educational Attainment | In Labor Force | Unemployed |
| Less than High School | 807 (49.1%) | 58 (3.5%) |
| High School Diploma | 3,997 (65.9%) | 479 (7.9%) |
| College / Associate Degree | 4,512 (77.8%) | 354 (6.1%) |
| Bachelor's Degree or higher | 2,827 (85.1%) | 56 (1.7%) |
| Total | 12,151 (72.2%) | 926 (5.5%) |
Employment Occupations by Sex in Wexford County
Management, Business, Science and Arts Occupations
The most common Management, Business, Science and Arts occupations in Wexford County are Management (1,227 | 8.7%), Community & Social Service (1,026 | 7.3%), Health Diagnosing & Treating (924 | 6.6%), Computers, Engineering & Science (653 | 4.6%), and Education Instruction & Library (628 | 4.5%).
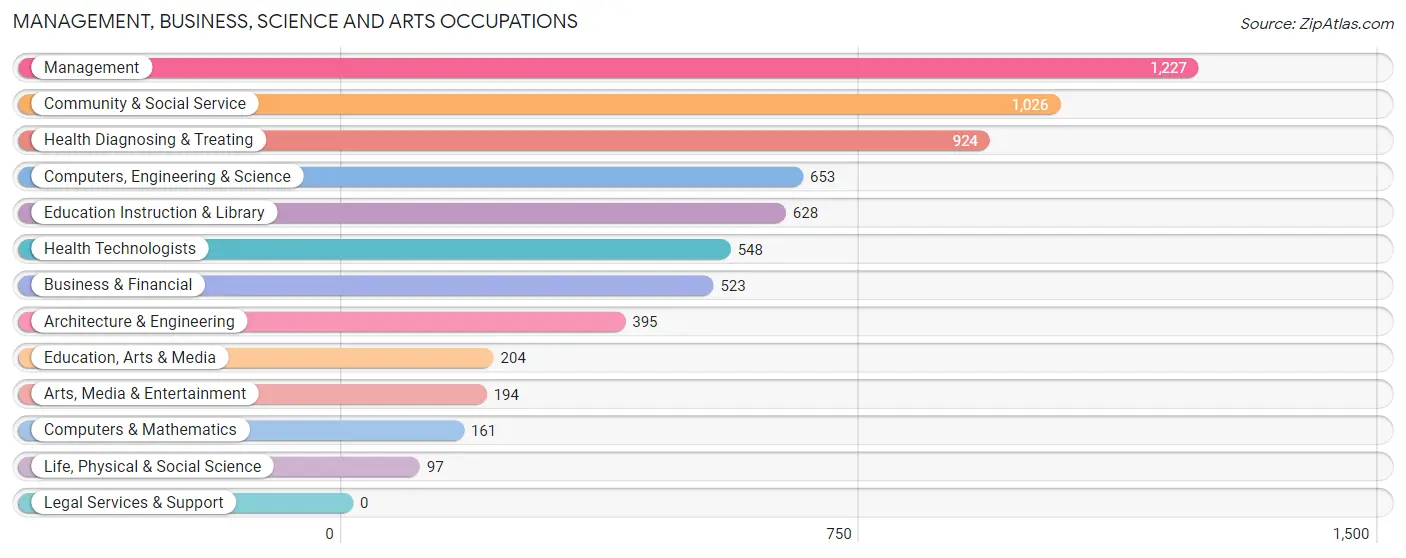
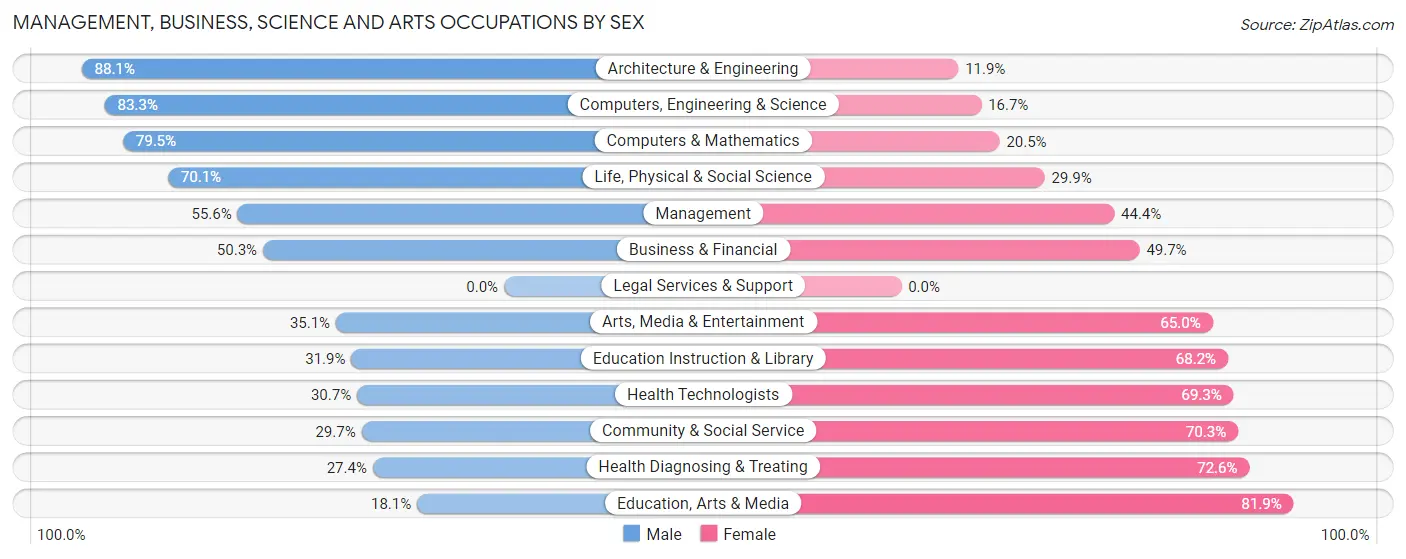
Management, Business, Science and Arts Occupations by Sex
Within the Management, Business, Science and Arts occupations in Wexford County, the most male-oriented occupations are Architecture & Engineering (88.1%), Computers, Engineering & Science (83.3%), and Computers & Mathematics (79.5%), while the most female-oriented occupations are Education, Arts & Media (81.9%), Health Diagnosing & Treating (72.6%), and Community & Social Service (70.3%).
| Occupation | Male | Female |
| Management | 682 (55.6%) | 545 (44.4%) |
| Business & Financial | 263 (50.3%) | 260 (49.7%) |
| Computers, Engineering & Science | 544 (83.3%) | 109 (16.7%) |
| Computers & Mathematics | 128 (79.5%) | 33 (20.5%) |
| Architecture & Engineering | 348 (88.1%) | 47 (11.9%) |
| Life, Physical & Social Science | 68 (70.1%) | 29 (29.9%) |
| Community & Social Service | 305 (29.7%) | 721 (70.3%) |
| Education, Arts & Media | 37 (18.1%) | 167 (81.9%) |
| Legal Services & Support | 0 (0.0%) | 0 (0.0%) |
| Education Instruction & Library | 200 (31.9%) | 428 (68.1%) |
| Arts, Media & Entertainment | 68 (35.0%) | 126 (64.9%) |
| Health Diagnosing & Treating | 253 (27.4%) | 671 (72.6%) |
| Health Technologists | 168 (30.7%) | 380 (69.3%) |
| Total (Category) | 2,047 (47.0%) | 2,306 (53.0%) |
| Total (Overall) | 7,662 (54.4%) | 6,413 (45.6%) |
Services Occupations
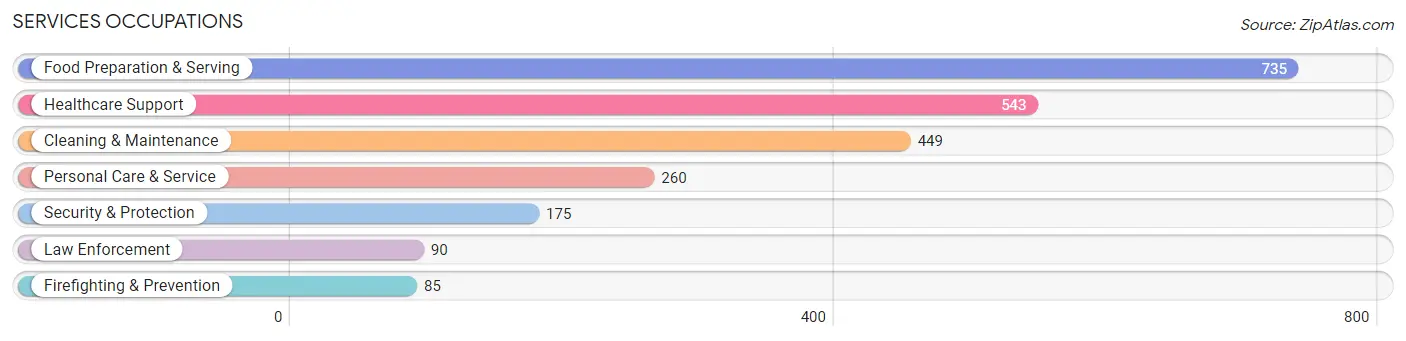
The most common Services occupations in Wexford County are Food Preparation & Serving (735 | 5.2%), Healthcare Support (543 | 3.9%), Cleaning & Maintenance (449 | 3.2%), Personal Care & Service (260 | 1.8%), and Security & Protection (175 | 1.2%).
Services Occupations by Sex
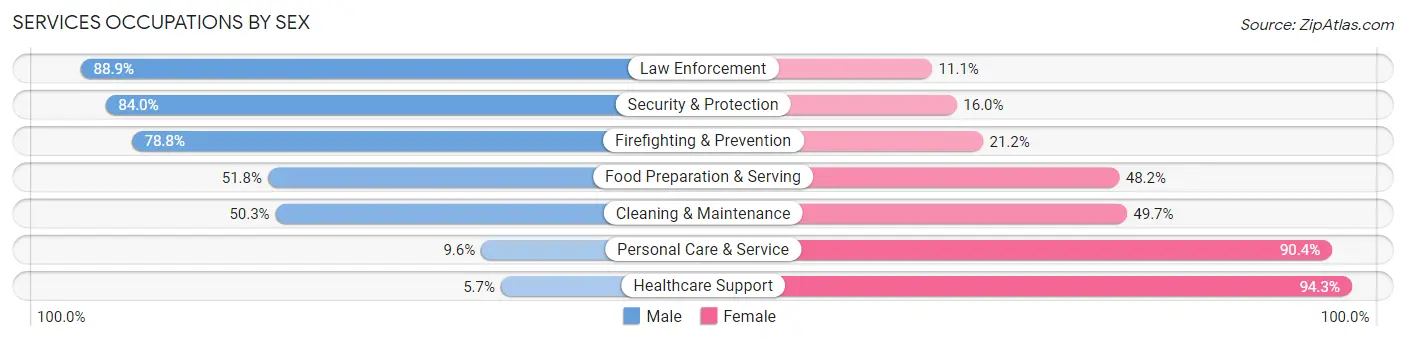
Within the Services occupations in Wexford County, the most male-oriented occupations are Law Enforcement (88.9%), Security & Protection (84.0%), and Firefighting & Prevention (78.8%), while the most female-oriented occupations are Healthcare Support (94.3%), Personal Care & Service (90.4%), and Cleaning & Maintenance (49.7%).
| Occupation | Male | Female |
| Healthcare Support | 31 (5.7%) | 512 (94.3%) |
| Security & Protection | 147 (84.0%) | 28 (16.0%) |
| Firefighting & Prevention | 67 (78.8%) | 18 (21.2%) |
| Law Enforcement | 80 (88.9%) | 10 (11.1%) |
| Food Preparation & Serving | 381 (51.8%) | 354 (48.2%) |
| Cleaning & Maintenance | 226 (50.3%) | 223 (49.7%) |
| Personal Care & Service | 25 (9.6%) | 235 (90.4%) |
| Total (Category) | 810 (37.5%) | 1,352 (62.5%) |
| Total (Overall) | 7,662 (54.4%) | 6,413 (45.6%) |
Sales and Office Occupations
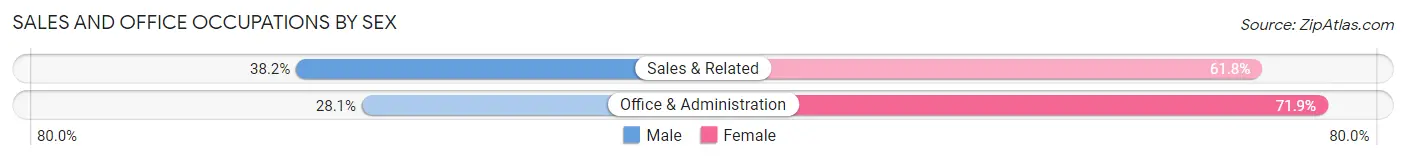
The most common Sales and Office occupations in Wexford County are Office & Administration (1,405 | 10.0%), and Sales & Related (1,266 | 9.0%).

Sales and Office Occupations by Sex
| Occupation | Male | Female |
| Sales & Related | 484 (38.2%) | 782 (61.8%) |
| Office & Administration | 395 (28.1%) | 1,010 (71.9%) |
| Total (Category) | 879 (32.9%) | 1,792 (67.1%) |
| Total (Overall) | 7,662 (54.4%) | 6,413 (45.6%) |
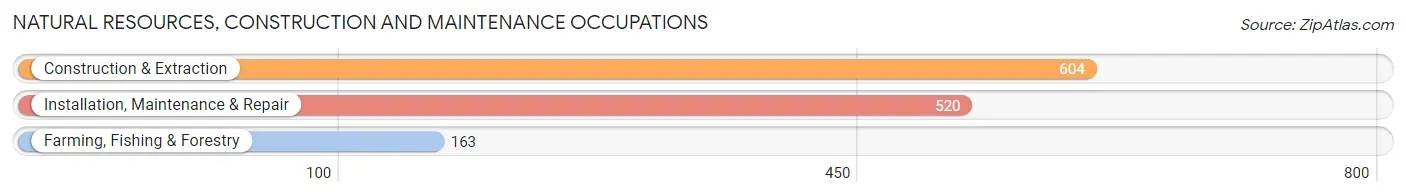
Natural Resources, Construction and Maintenance Occupations
The most common Natural Resources, Construction and Maintenance occupations in Wexford County are Construction & Extraction (604 | 4.3%), Installation, Maintenance & Repair (520 | 3.7%), and Farming, Fishing & Forestry (163 | 1.2%).
Natural Resources, Construction and Maintenance Occupations by Sex
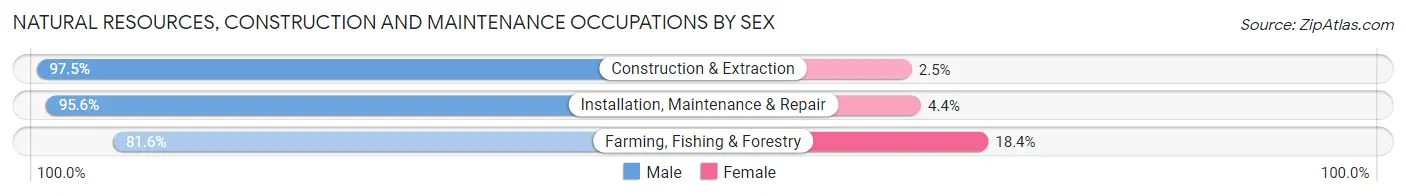
| Occupation | Male | Female |
| Farming, Fishing & Forestry | 133 (81.6%) | 30 (18.4%) |
| Construction & Extraction | 589 (97.5%) | 15 (2.5%) |
| Installation, Maintenance & Repair | 497 (95.6%) | 23 (4.4%) |
| Total (Category) | 1,219 (94.7%) | 68 (5.3%) |
| Total (Overall) | 7,662 (54.4%) | 6,413 (45.6%) |
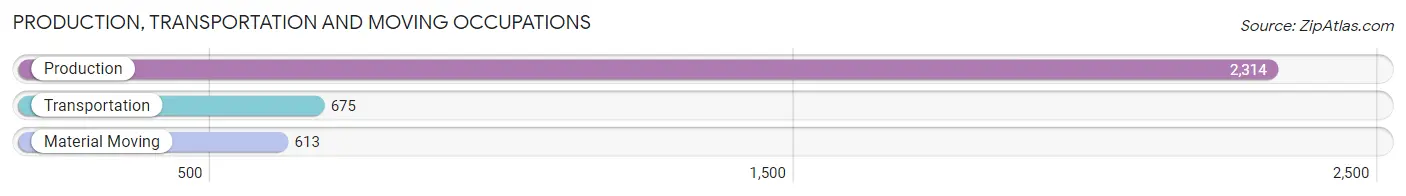
Production, Transportation and Moving Occupations
The most common Production, Transportation and Moving occupations in Wexford County are Production (2,314 | 16.4%), Transportation (675 | 4.8%), and Material Moving (613 | 4.4%).
Production, Transportation and Moving Occupations by Sex
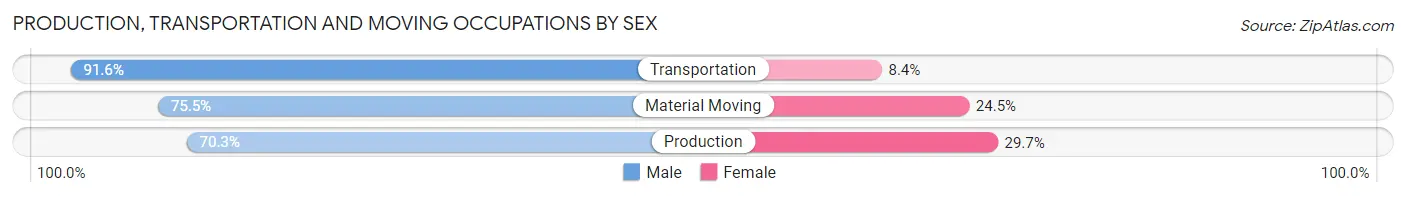
| Occupation | Male | Female |
| Production | 1,626 (70.3%) | 688 (29.7%) |
| Transportation | 618 (91.6%) | 57 (8.4%) |
| Material Moving | 463 (75.5%) | 150 (24.5%) |
| Total (Category) | 2,707 (75.1%) | 895 (24.8%) |
| Total (Overall) | 7,662 (54.4%) | 6,413 (45.6%) |
Employment Industries by Sex in Wexford County
Employment Industries in Wexford County
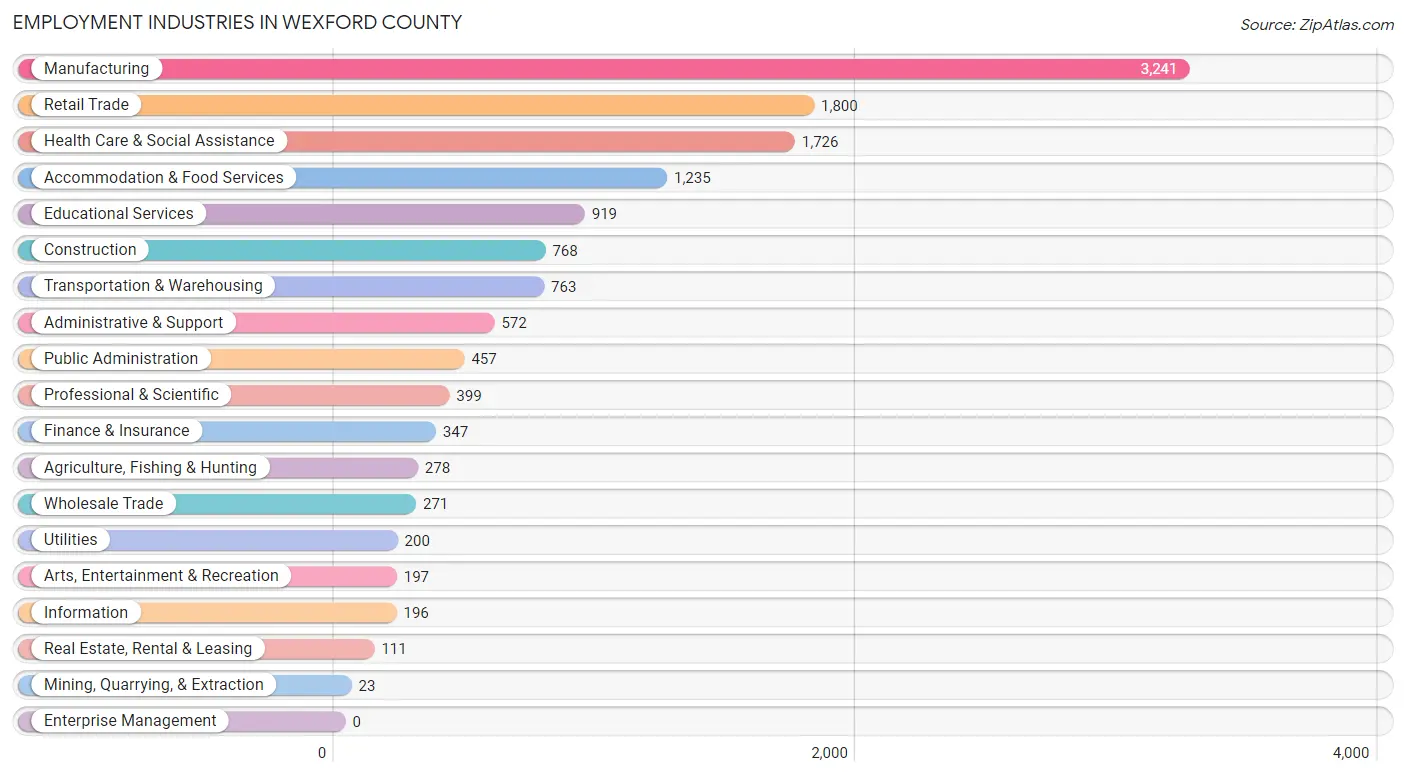
The major employment industries in Wexford County include Manufacturing (3,241 | 23.0%), Retail Trade (1,800 | 12.8%), Health Care & Social Assistance (1,726 | 12.3%), Accommodation & Food Services (1,235 | 8.8%), and Educational Services (919 | 6.5%).
Employment Industries by Sex in Wexford County
The Wexford County industries that see more men than women are Mining, Quarrying, & Extraction (100.0%), Construction (92.3%), and Utilities (83.5%), whereas the industries that tend to have a higher number of women are Health Care & Social Assistance (80.9%), Educational Services (73.5%), and Real Estate, Rental & Leasing (64.0%).
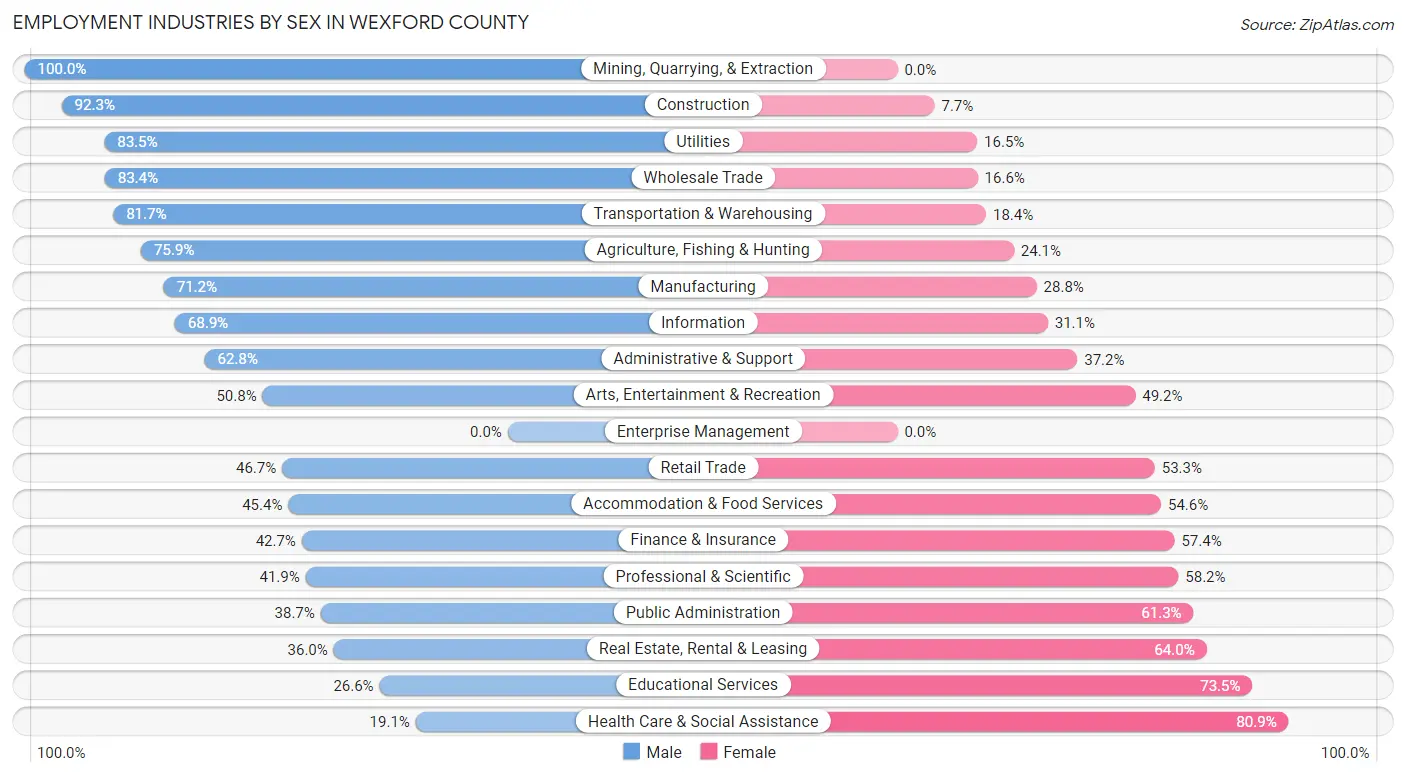
| Industry | Male | Female |
| Agriculture, Fishing & Hunting | 211 (75.9%) | 67 (24.1%) |
| Mining, Quarrying, & Extraction | 23 (100.0%) | 0 (0.0%) |
| Construction | 709 (92.3%) | 59 (7.7%) |
| Manufacturing | 2,307 (71.2%) | 934 (28.8%) |
| Wholesale Trade | 226 (83.4%) | 45 (16.6%) |
| Retail Trade | 841 (46.7%) | 959 (53.3%) |
| Transportation & Warehousing | 623 (81.7%) | 140 (18.3%) |
| Utilities | 167 (83.5%) | 33 (16.5%) |
| Information | 135 (68.9%) | 61 (31.1%) |
| Finance & Insurance | 148 (42.6%) | 199 (57.4%) |
| Real Estate, Rental & Leasing | 40 (36.0%) | 71 (64.0%) |
| Professional & Scientific | 167 (41.8%) | 232 (58.2%) |
| Enterprise Management | 0 (0.0%) | 0 (0.0%) |
| Administrative & Support | 359 (62.8%) | 213 (37.2%) |
| Educational Services | 244 (26.6%) | 675 (73.5%) |
| Health Care & Social Assistance | 329 (19.1%) | 1,397 (80.9%) |
| Arts, Entertainment & Recreation | 100 (50.8%) | 97 (49.2%) |
| Accommodation & Food Services | 561 (45.4%) | 674 (54.6%) |
| Public Administration | 177 (38.7%) | 280 (61.3%) |
| Total | 7,662 (54.4%) | 6,413 (45.6%) |
Education in Wexford County
School Enrollment in Wexford County
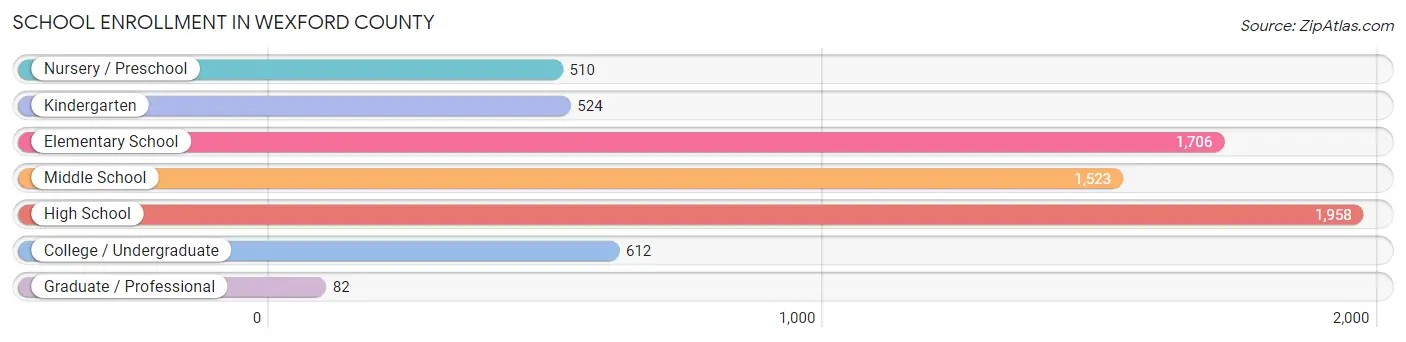
The most common levels of schooling among the 6,915 students in Wexford County are high school (1,958 | 28.3%), elementary school (1,706 | 24.7%), and middle school (1,523 | 22.0%).
| School Level | # Students | % Students |
| Nursery / Preschool | 510 | 7.4% |
| Kindergarten | 524 | 7.6% |
| Elementary School | 1,706 | 24.7% |
| Middle School | 1,523 | 22.0% |
| High School | 1,958 | 28.3% |
| College / Undergraduate | 612 | 8.8% |
| Graduate / Professional | 82 | 1.2% |
| Total | 6,915 | 100.0% |
School Enrollment by Age by Funding Source in Wexford County
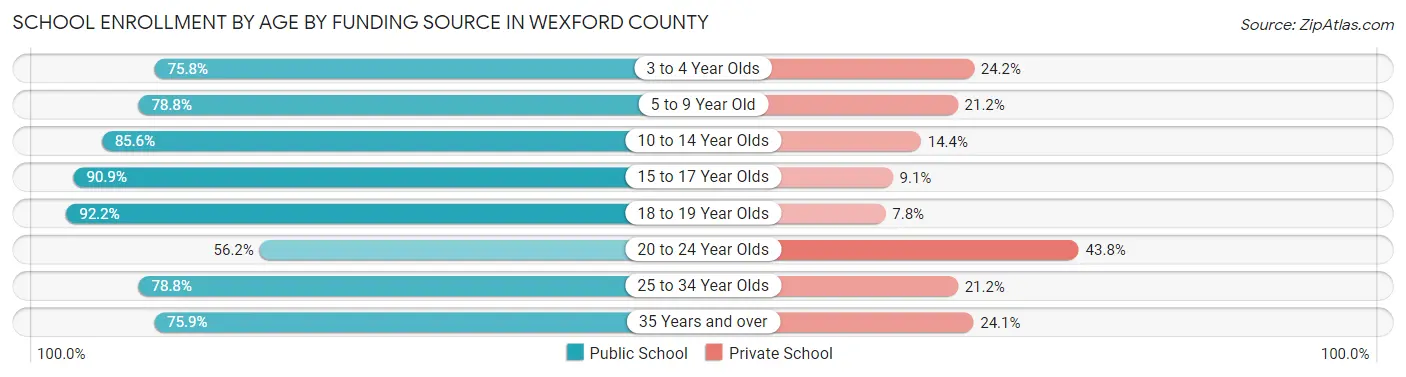
Out of a total of 6,915 students who are enrolled in schools in Wexford County, 1,210 (17.5%) attend a private institution, while the remaining 5,705 (82.5%) are enrolled in public schools. The age group of 20 to 24 year olds has the highest likelihood of being enrolled in private schools, with 144 (43.8% in the age bracket) enrolled. Conversely, the age group of 18 to 19 year olds has the lowest likelihood of being enrolled in a private school, with 368 (92.2% in the age bracket) attending a public institution.
| Age Bracket | Public School | Private School |
| 3 to 4 Year Olds | 272 (75.8%) | 87 (24.2%) |
| 5 to 9 Year Old | 1,700 (78.8%) | 458 (21.2%) |
| 10 to 14 Year Olds | 1,704 (85.6%) | 286 (14.4%) |
| 15 to 17 Year Olds | 1,187 (90.9%) | 119 (9.1%) |
| 18 to 19 Year Olds | 368 (92.2%) | 31 (7.8%) |
| 20 to 24 Year Olds | 185 (56.2%) | 144 (43.8%) |
| 25 to 34 Year Olds | 89 (78.8%) | 24 (21.2%) |
| 35 Years and over | 198 (75.9%) | 63 (24.1%) |
| Total | 5,705 (82.5%) | 1,210 (17.5%) |
Educational Attainment by Field of Study in Wexford County
Education (1,008 | 20.0%), business (992 | 19.7%), science & technology (768 | 15.2%), bio, nature & agricultural (394 | 7.8%), and arts & humanities (366 | 7.3%) are the most common fields of study among 5,041 individuals in Wexford County who have obtained a bachelor's degree or higher.
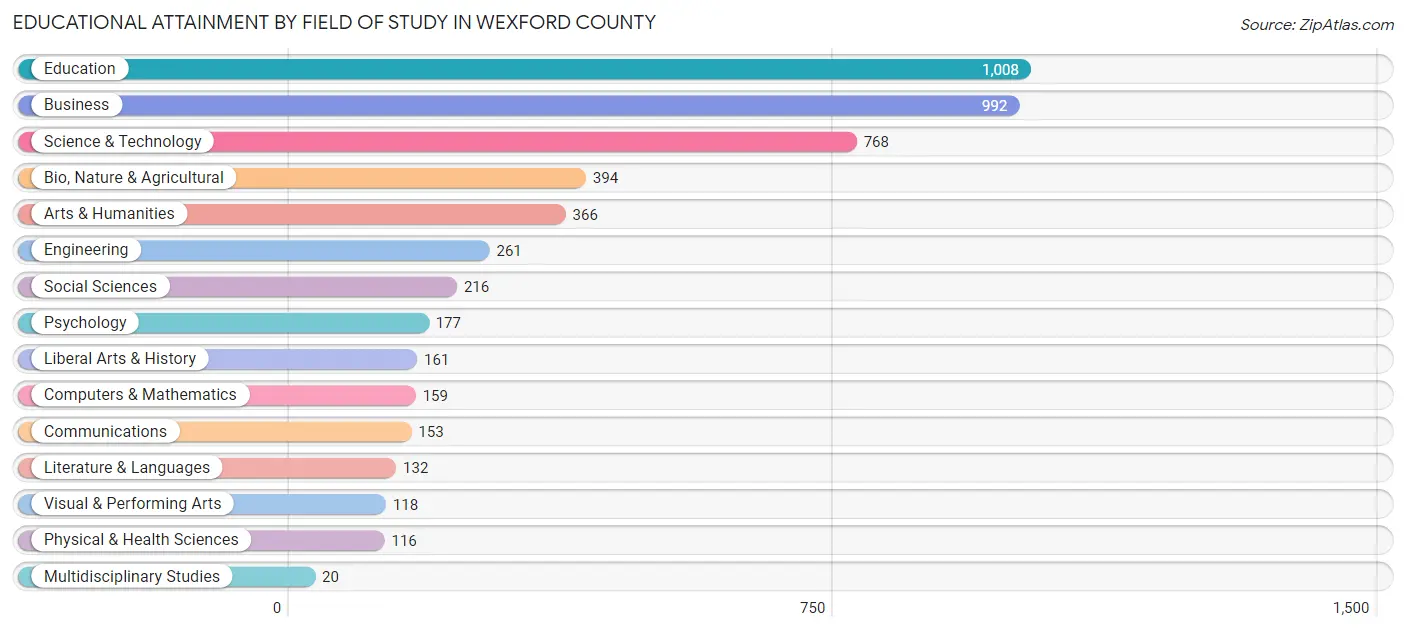
| Field of Study | # Graduates | % Graduates |
| Computers & Mathematics | 159 | 3.2% |
| Bio, Nature & Agricultural | 394 | 7.8% |
| Physical & Health Sciences | 116 | 2.3% |
| Psychology | 177 | 3.5% |
| Social Sciences | 216 | 4.3% |
| Engineering | 261 | 5.2% |
| Multidisciplinary Studies | 20 | 0.4% |
| Science & Technology | 768 | 15.2% |
| Business | 992 | 19.7% |
| Education | 1,008 | 20.0% |
| Literature & Languages | 132 | 2.6% |
| Liberal Arts & History | 161 | 3.2% |
| Visual & Performing Arts | 118 | 2.3% |
| Communications | 153 | 3.0% |
| Arts & Humanities | 366 | 7.3% |
| Total | 5,041 | 100.0% |
Transportation & Commute in Wexford County
Vehicle Availability by Sex in Wexford County
The most prevalent vehicle ownership categories in Wexford County are males with 2 vehicles (3,195, accounting for 42.3%) and females with 2 vehicles (2,683, making up 50.8%).
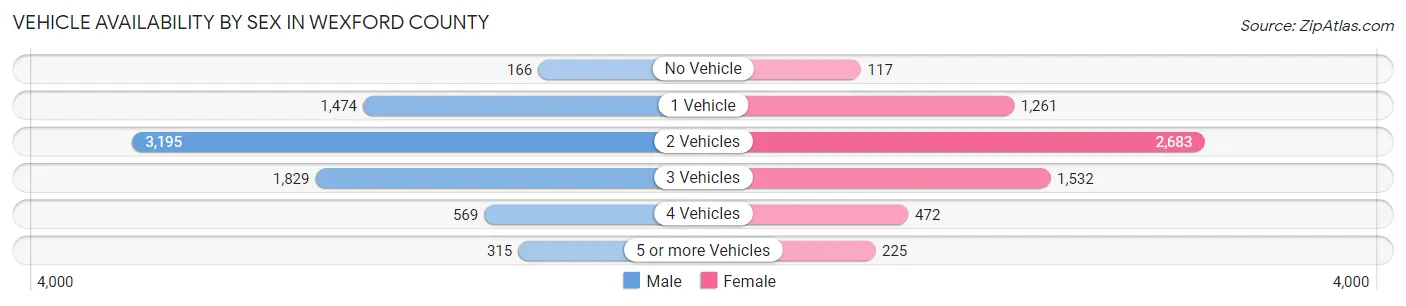
| Vehicles Available | Male | Female |
| No Vehicle | 166 (2.2%) | 117 (1.9%) |
| 1 Vehicle | 1,474 (19.5%) | 1,261 (20.1%) |
| 2 Vehicles | 3,195 (42.3%) | 2,683 (42.7%) |
| 3 Vehicles | 1,829 (24.2%) | 1,532 (24.4%) |
| 4 Vehicles | 569 (7.5%) | 472 (7.5%) |
| 5 or more Vehicles | 315 (4.2%) | 225 (3.6%) |
| Total | 7,548 (100.0%) | 6,290 (100.0%) |
Commute Time in Wexford County
The most frequently occuring commute durations in Wexford County are 5 to 9 minutes (2,560 commuters, 19.4%), 10 to 14 minutes (2,282 commuters, 17.3%), and 15 to 19 minutes (1,590 commuters, 12.1%).
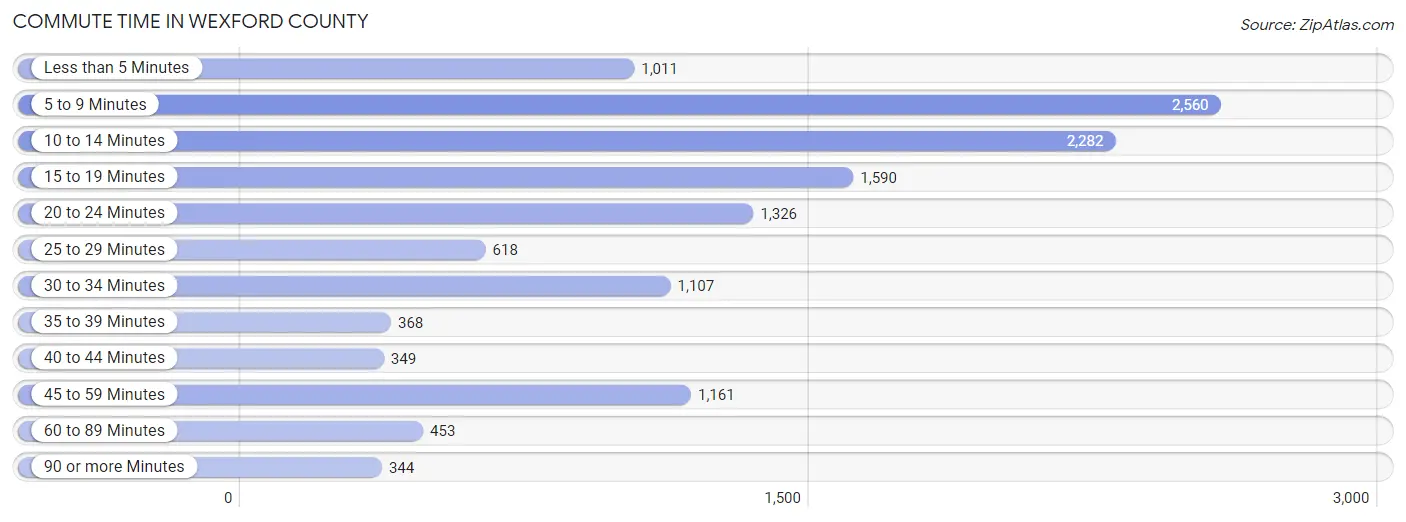
| Commute Time | # Commuters | % Commuters |
| Less than 5 Minutes | 1,011 | 7.7% |
| 5 to 9 Minutes | 2,560 | 19.4% |
| 10 to 14 Minutes | 2,282 | 17.3% |
| 15 to 19 Minutes | 1,590 | 12.1% |
| 20 to 24 Minutes | 1,326 | 10.1% |
| 25 to 29 Minutes | 618 | 4.7% |
| 30 to 34 Minutes | 1,107 | 8.4% |
| 35 to 39 Minutes | 368 | 2.8% |
| 40 to 44 Minutes | 349 | 2.6% |
| 45 to 59 Minutes | 1,161 | 8.8% |
| 60 to 89 Minutes | 453 | 3.4% |
| 90 or more Minutes | 344 | 2.6% |
Commute Time by Sex in Wexford County
The most common commute times in Wexford County are 10 to 14 minutes (1,399 commuters, 19.2%) for males and 5 to 9 minutes (1,249 commuters, 21.3%) for females.
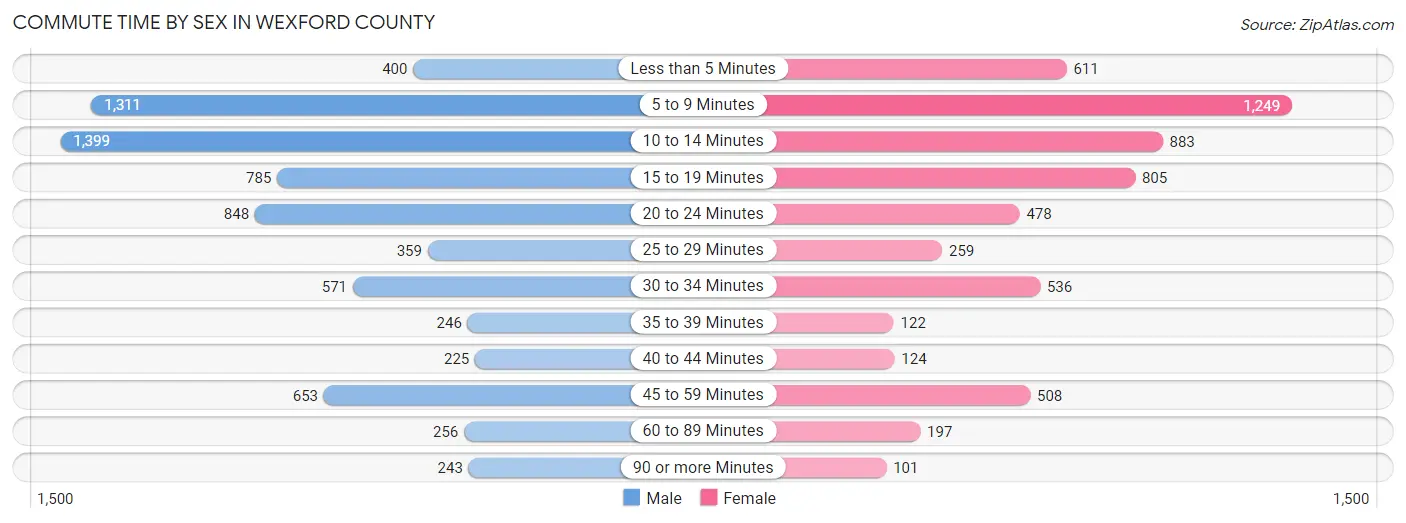
| Commute Time | Male | Female |
| Less than 5 Minutes | 400 (5.5%) | 611 (10.4%) |
| 5 to 9 Minutes | 1,311 (18.0%) | 1,249 (21.3%) |
| 10 to 14 Minutes | 1,399 (19.2%) | 883 (15.0%) |
| 15 to 19 Minutes | 785 (10.8%) | 805 (13.7%) |
| 20 to 24 Minutes | 848 (11.6%) | 478 (8.1%) |
| 25 to 29 Minutes | 359 (4.9%) | 259 (4.4%) |
| 30 to 34 Minutes | 571 (7.8%) | 536 (9.1%) |
| 35 to 39 Minutes | 246 (3.4%) | 122 (2.1%) |
| 40 to 44 Minutes | 225 (3.1%) | 124 (2.1%) |
| 45 to 59 Minutes | 653 (8.9%) | 508 (8.6%) |
| 60 to 89 Minutes | 256 (3.5%) | 197 (3.4%) |
| 90 or more Minutes | 243 (3.3%) | 101 (1.7%) |
Time of Departure to Work by Sex in Wexford County
The most frequent times of departure to work in Wexford County are 7:00 AM to 7:29 AM (858, 11.8%) for males and 7:30 AM to 7:59 AM (915, 15.6%) for females.
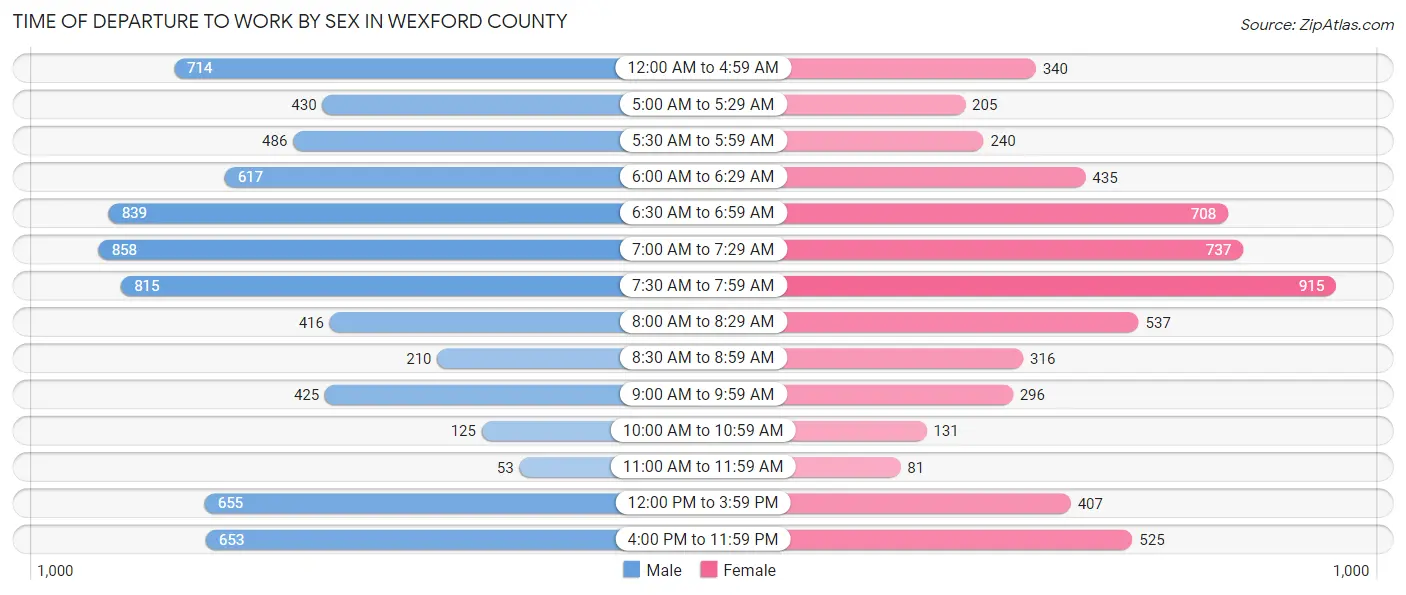
| Time of Departure | Male | Female |
| 12:00 AM to 4:59 AM | 714 (9.8%) | 340 (5.8%) |
| 5:00 AM to 5:29 AM | 430 (5.9%) | 205 (3.5%) |
| 5:30 AM to 5:59 AM | 486 (6.7%) | 240 (4.1%) |
| 6:00 AM to 6:29 AM | 617 (8.5%) | 435 (7.4%) |
| 6:30 AM to 6:59 AM | 839 (11.5%) | 708 (12.1%) |
| 7:00 AM to 7:29 AM | 858 (11.8%) | 737 (12.6%) |
| 7:30 AM to 7:59 AM | 815 (11.2%) | 915 (15.6%) |
| 8:00 AM to 8:29 AM | 416 (5.7%) | 537 (9.1%) |
| 8:30 AM to 8:59 AM | 210 (2.9%) | 316 (5.4%) |
| 9:00 AM to 9:59 AM | 425 (5.8%) | 296 (5.0%) |
| 10:00 AM to 10:59 AM | 125 (1.7%) | 131 (2.2%) |
| 11:00 AM to 11:59 AM | 53 (0.7%) | 81 (1.4%) |
| 12:00 PM to 3:59 PM | 655 (9.0%) | 407 (6.9%) |
| 4:00 PM to 11:59 PM | 653 (8.9%) | 525 (8.9%) |
| Total | 7,296 (100.0%) | 5,873 (100.0%) |
Housing Occupancy in Wexford County
Occupancy by Ownership in Wexford County
Of the total 13,167 dwellings in Wexford County, owner-occupied units account for 10,633 (80.7%), while renter-occupied units make up 2,534 (19.3%).
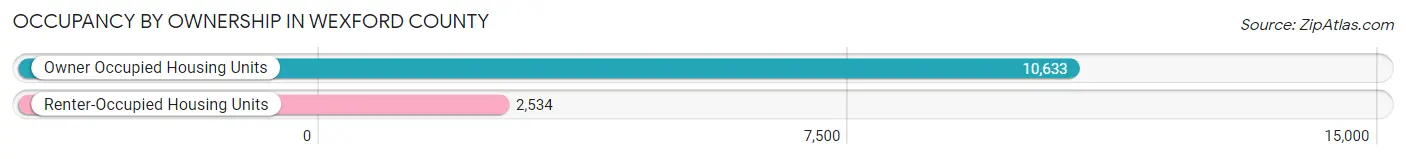
| Occupancy | # Housing Units | % Housing Units |
| Owner Occupied Housing Units | 10,633 | 80.7% |
| Renter-Occupied Housing Units | 2,534 | 19.3% |
| Total Occupied Housing Units | 13,167 | 100.0% |
Occupancy by Household Size in Wexford County
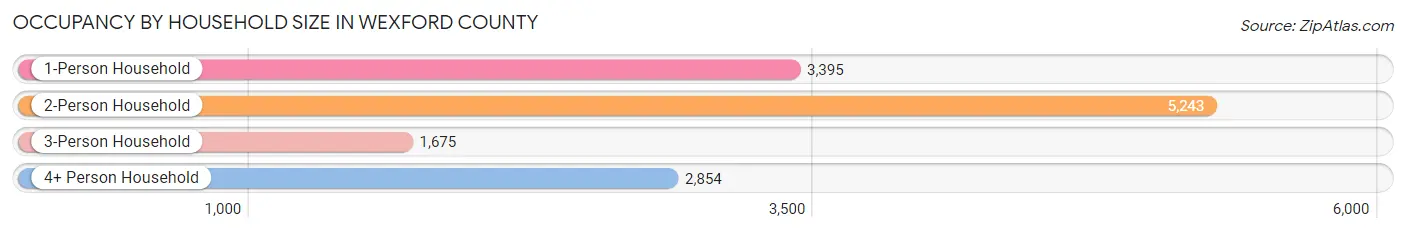
| Household Size | # Housing Units | % Housing Units |
| 1-Person Household | 3,395 | 25.8% |
| 2-Person Household | 5,243 | 39.8% |
| 3-Person Household | 1,675 | 12.7% |
| 4+ Person Household | 2,854 | 21.7% |
| Total Housing Units | 13,167 | 100.0% |
Occupancy by Ownership by Household Size in Wexford County
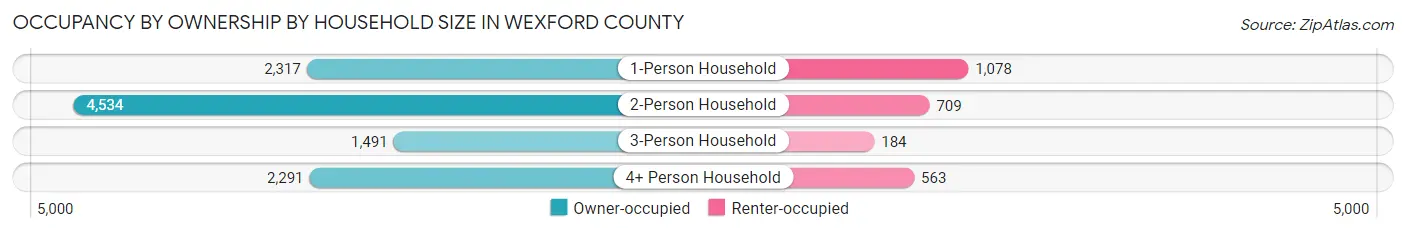
| Household Size | Owner-occupied | Renter-occupied |
| 1-Person Household | 2,317 (68.2%) | 1,078 (31.8%) |
| 2-Person Household | 4,534 (86.5%) | 709 (13.5%) |
| 3-Person Household | 1,491 (89.0%) | 184 (11.0%) |
| 4+ Person Household | 2,291 (80.3%) | 563 (19.7%) |
| Total Housing Units | 10,633 (80.7%) | 2,534 (19.3%) |
Occupancy by Educational Attainment in Wexford County
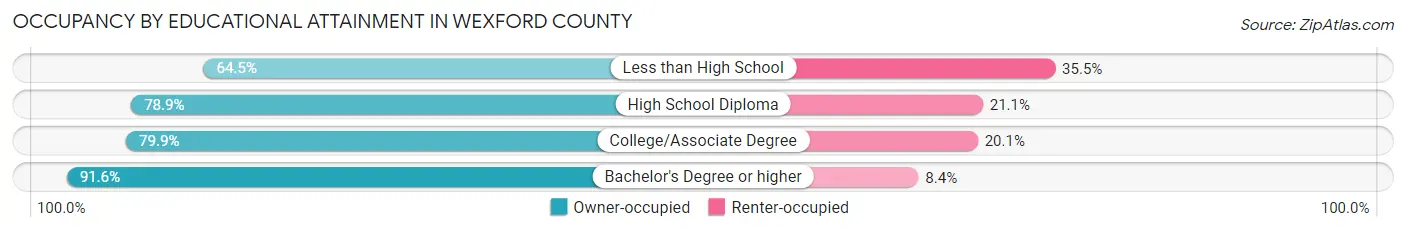
| Household Size | Owner-occupied | Renter-occupied |
| Less than High School | 756 (64.5%) | 416 (35.5%) |
| High School Diploma | 3,361 (78.9%) | 901 (21.1%) |
| College/Associate Degree | 3,866 (79.9%) | 975 (20.1%) |
| Bachelor's Degree or higher | 2,650 (91.6%) | 242 (8.4%) |
Occupancy by Age of Householder in Wexford County
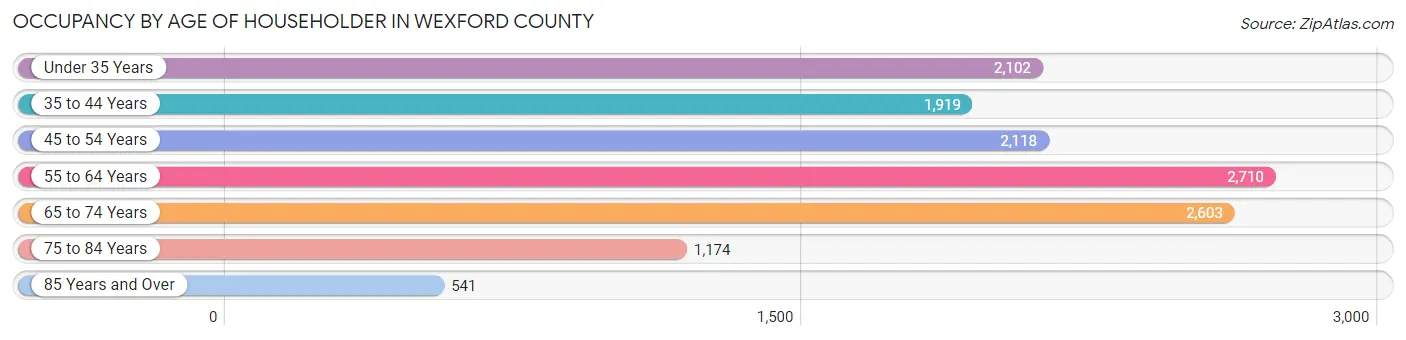
| Age Bracket | # Households | % Households |
| Under 35 Years | 2,102 | 16.0% |
| 35 to 44 Years | 1,919 | 14.6% |
| 45 to 54 Years | 2,118 | 16.1% |
| 55 to 64 Years | 2,710 | 20.6% |
| 65 to 74 Years | 2,603 | 19.8% |
| 75 to 84 Years | 1,174 | 8.9% |
| 85 Years and Over | 541 | 4.1% |
| Total | 13,167 | 100.0% |
Housing Finances in Wexford County
Median Income by Occupancy in Wexford County
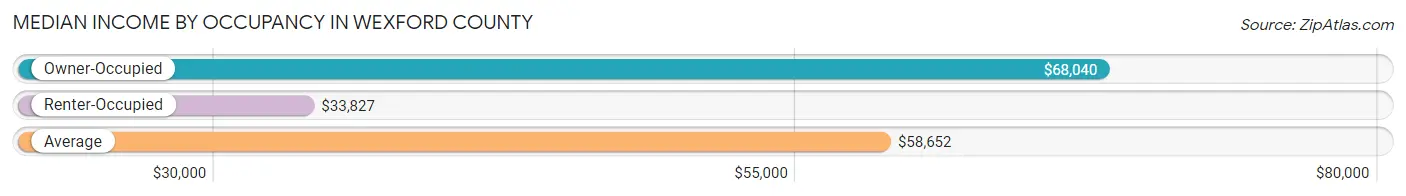
| Occupancy Type | # Households | Median Income |
| Owner-Occupied | 10,633 (80.7%) | $68,040 |
| Renter-Occupied | 2,534 (19.3%) | $33,827 |
| Average | 13,167 (100.0%) | $58,652 |
Occupancy by Householder Income Bracket in Wexford County
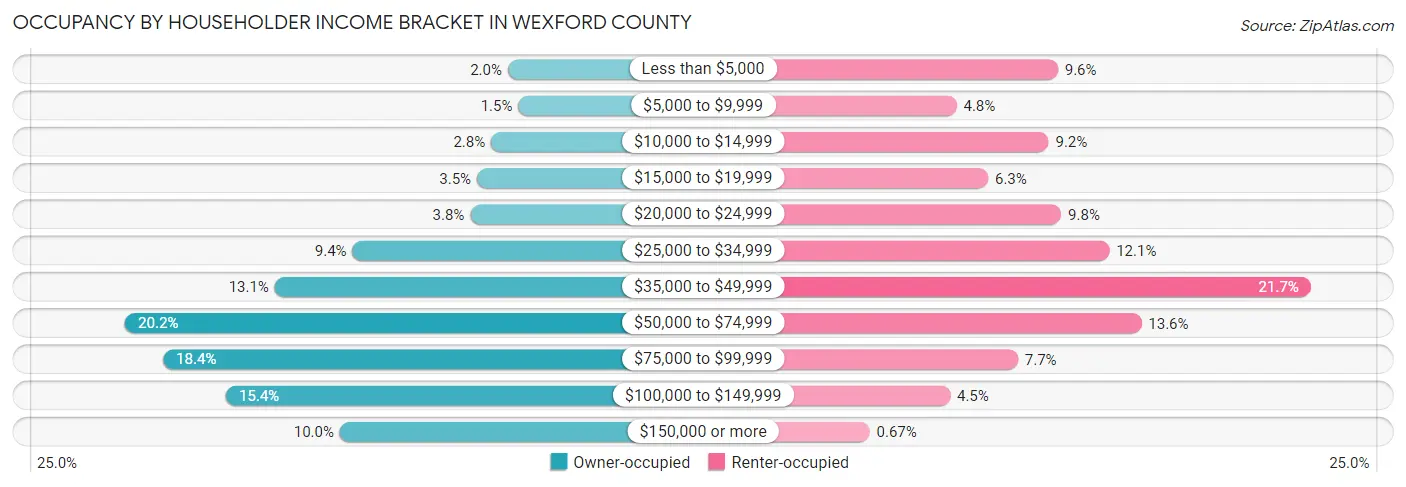
| Income Bracket | Owner-occupied | Renter-occupied |
| Less than $5,000 | 212 (2.0%) | 244 (9.6%) |
| $5,000 to $9,999 | 158 (1.5%) | 122 (4.8%) |
| $10,000 to $14,999 | 297 (2.8%) | 233 (9.2%) |
| $15,000 to $19,999 | 368 (3.5%) | 160 (6.3%) |
| $20,000 to $24,999 | 402 (3.8%) | 248 (9.8%) |
| $25,000 to $34,999 | 998 (9.4%) | 306 (12.1%) |
| $35,000 to $49,999 | 1,392 (13.1%) | 549 (21.7%) |
| $50,000 to $74,999 | 2,149 (20.2%) | 345 (13.6%) |
| $75,000 to $99,999 | 1,956 (18.4%) | 196 (7.7%) |
| $100,000 to $149,999 | 1,639 (15.4%) | 114 (4.5%) |
| $150,000 or more | 1,062 (10.0%) | 17 (0.7%) |
| Total | 10,633 (100.0%) | 2,534 (100.0%) |
Monthly Housing Cost Tiers in Wexford County
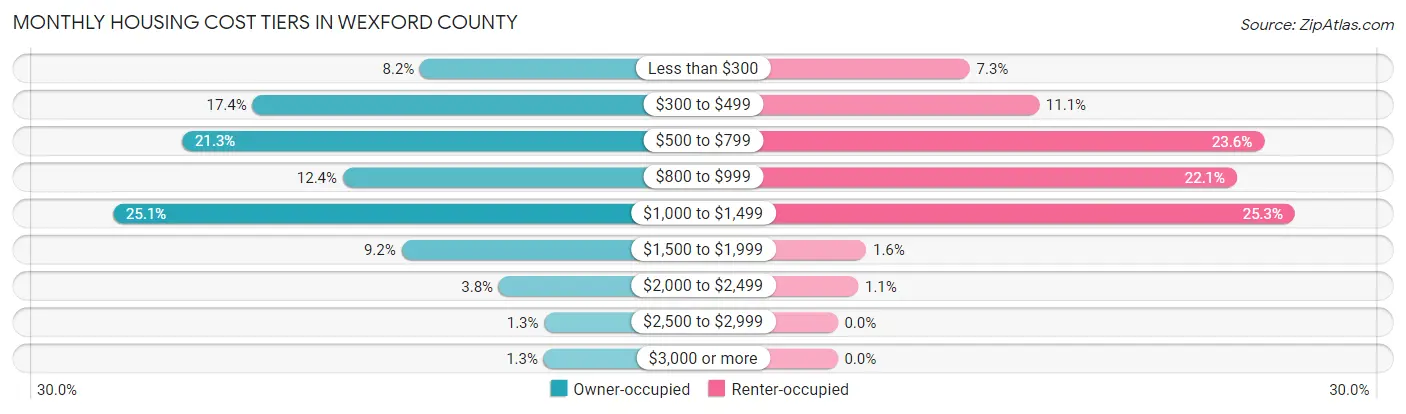
| Monthly Cost | Owner-occupied | Renter-occupied |
| Less than $300 | 867 (8.2%) | 185 (7.3%) |
| $300 to $499 | 1,851 (17.4%) | 282 (11.1%) |
| $500 to $799 | 2,266 (21.3%) | 597 (23.6%) |
| $800 to $999 | 1,321 (12.4%) | 559 (22.1%) |
| $1,000 to $1,499 | 2,671 (25.1%) | 640 (25.3%) |
| $1,500 to $1,999 | 976 (9.2%) | 40 (1.6%) |
| $2,000 to $2,499 | 404 (3.8%) | 29 (1.1%) |
| $2,500 to $2,999 | 137 (1.3%) | 0 (0.0%) |
| $3,000 or more | 140 (1.3%) | 0 (0.0%) |
| Total | 10,633 (100.0%) | 2,534 (100.0%) |
Physical Housing Characteristics in Wexford County
Housing Structures in Wexford County
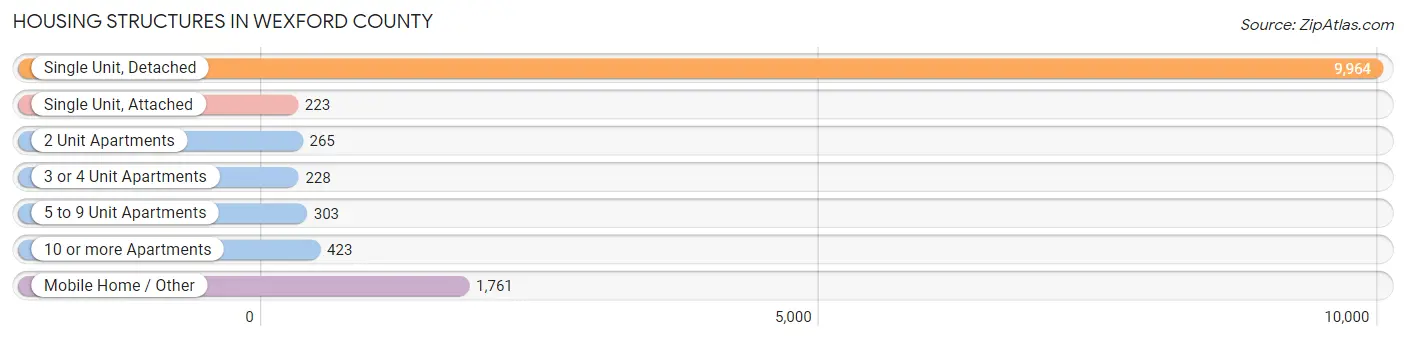
| Structure Type | # Housing Units | % Housing Units |
| Single Unit, Detached | 9,964 | 75.7% |
| Single Unit, Attached | 223 | 1.7% |
| 2 Unit Apartments | 265 | 2.0% |
| 3 or 4 Unit Apartments | 228 | 1.7% |
| 5 to 9 Unit Apartments | 303 | 2.3% |
| 10 or more Apartments | 423 | 3.2% |
| Mobile Home / Other | 1,761 | 13.4% |
| Total | 13,167 | 100.0% |
Housing Structures by Occupancy in Wexford County
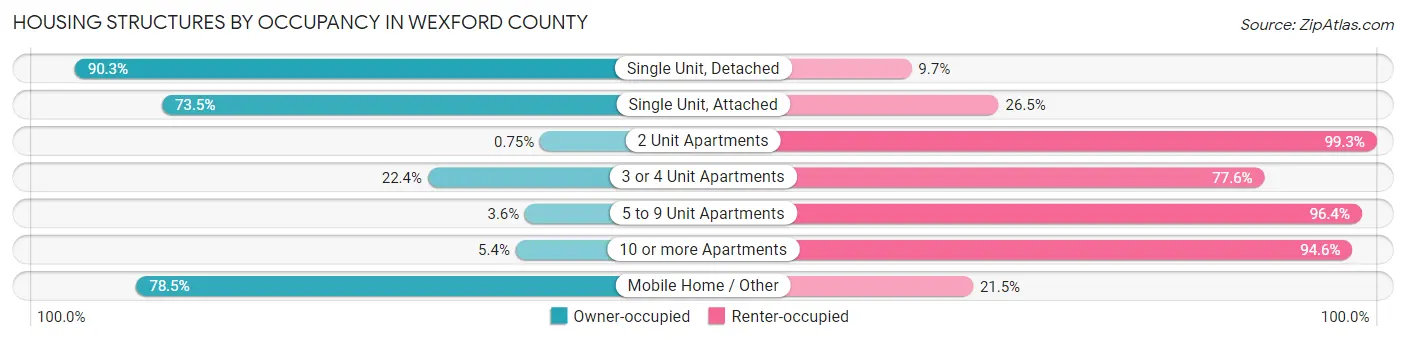
| Structure Type | Owner-occupied | Renter-occupied |
| Single Unit, Detached | 9,000 (90.3%) | 964 (9.7%) |
| Single Unit, Attached | 164 (73.5%) | 59 (26.5%) |
| 2 Unit Apartments | 2 (0.7%) | 263 (99.3%) |
| 3 or 4 Unit Apartments | 51 (22.4%) | 177 (77.6%) |
| 5 to 9 Unit Apartments | 11 (3.6%) | 292 (96.4%) |
| 10 or more Apartments | 23 (5.4%) | 400 (94.6%) |
| Mobile Home / Other | 1,382 (78.5%) | 379 (21.5%) |
| Total | 10,633 (80.7%) | 2,534 (19.3%) |
Housing Structures by Number of Rooms in Wexford County
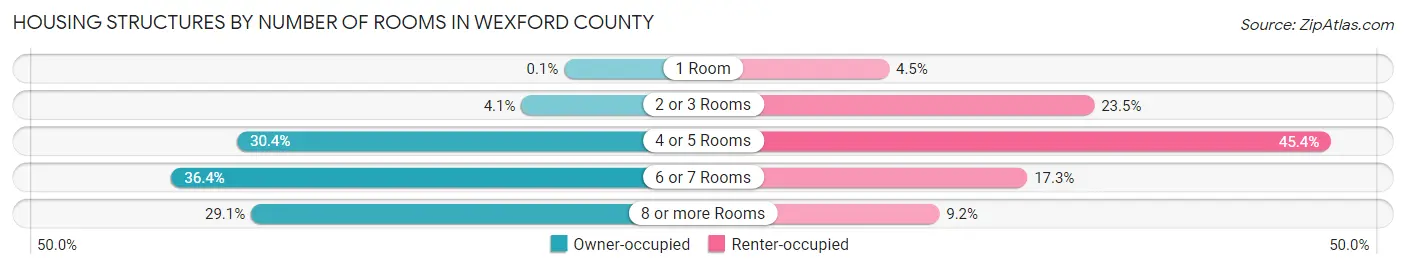
| Number of Rooms | Owner-occupied | Renter-occupied |
| 1 Room | 11 (0.1%) | 115 (4.5%) |
| 2 or 3 Rooms | 432 (4.1%) | 596 (23.5%) |
| 4 or 5 Rooms | 3,227 (30.3%) | 1,151 (45.4%) |
| 6 or 7 Rooms | 3,873 (36.4%) | 439 (17.3%) |
| 8 or more Rooms | 3,090 (29.1%) | 233 (9.2%) |
| Total | 10,633 (100.0%) | 2,534 (100.0%) |
Housing Structure by Heating Type in Wexford County
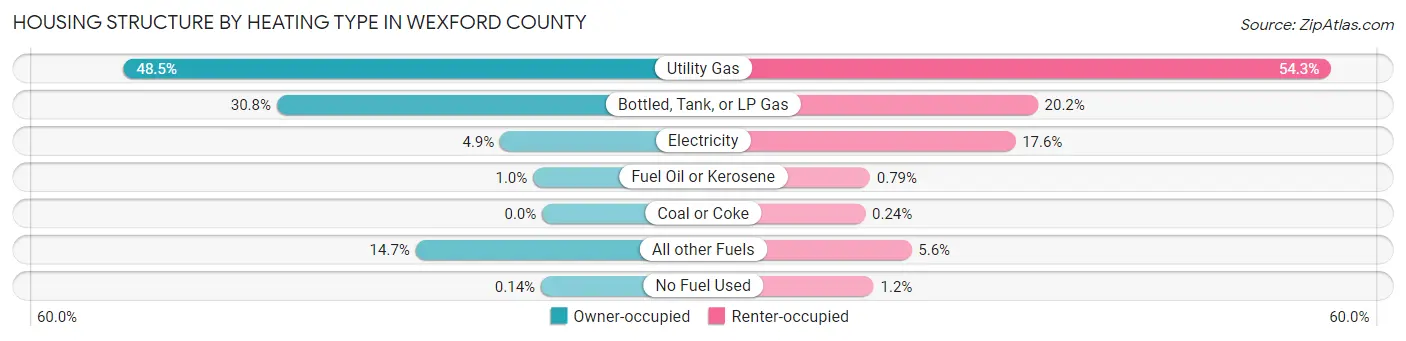
| Heating Type | Owner-occupied | Renter-occupied |
| Utility Gas | 5,159 (48.5%) | 1,375 (54.3%) |
| Bottled, Tank, or LP Gas | 3,271 (30.8%) | 513 (20.2%) |
| Electricity | 518 (4.9%) | 447 (17.6%) |
| Fuel Oil or Kerosene | 111 (1.0%) | 20 (0.8%) |
| Coal or Coke | 0 (0.0%) | 6 (0.2%) |
| All other Fuels | 1,559 (14.7%) | 142 (5.6%) |
| No Fuel Used | 15 (0.1%) | 31 (1.2%) |
| Total | 10,633 (100.0%) | 2,534 (100.0%) |
Household Vehicle Usage in Wexford County
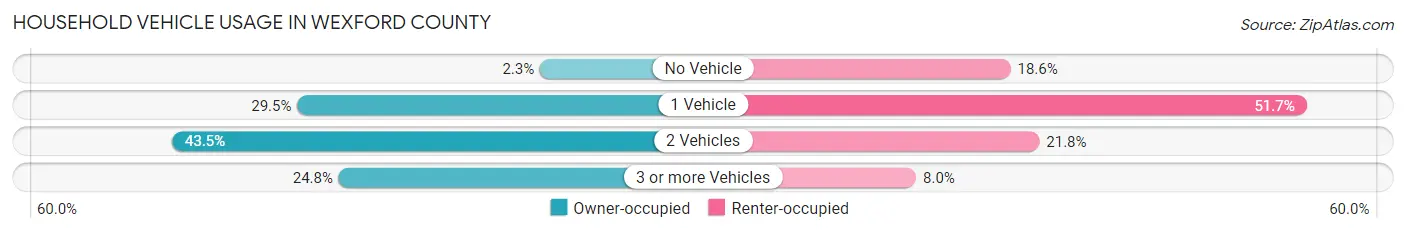
| Vehicles per Household | Owner-occupied | Renter-occupied |
| No Vehicle | 240 (2.3%) | 470 (18.5%) |
| 1 Vehicle | 3,131 (29.4%) | 1,310 (51.7%) |
| 2 Vehicles | 4,625 (43.5%) | 552 (21.8%) |
| 3 or more Vehicles | 2,637 (24.8%) | 202 (8.0%) |
| Total | 10,633 (100.0%) | 2,534 (100.0%) |
Real Estate & Mortgages in Wexford County
Real Estate and Mortgage Overview in Wexford County
| Characteristic | Without Mortgage | With Mortgage |
| Housing Units | 4,670 | 5,963 |
| Median Property Value | $126,400 | $156,700 |
| Median Household Income | $50,747 | $741 |
| Monthly Housing Costs | $472 | $128 |
| Real Estate Taxes | $1,702 | $245 |
Property Value by Mortgage Status in Wexford County
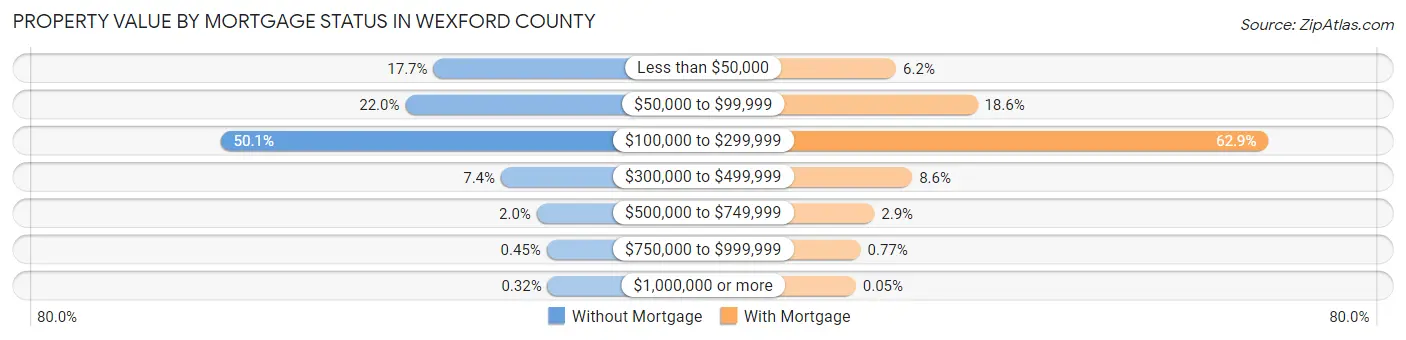
| Property Value | Without Mortgage | With Mortgage |
| Less than $50,000 | 827 (17.7%) | 369 (6.2%) |
| $50,000 to $99,999 | 1,027 (22.0%) | 1,108 (18.6%) |
| $100,000 to $299,999 | 2,341 (50.1%) | 3,751 (62.9%) |
| $300,000 to $499,999 | 347 (7.4%) | 515 (8.6%) |
| $500,000 to $749,999 | 92 (2.0%) | 171 (2.9%) |
| $750,000 to $999,999 | 21 (0.4%) | 46 (0.8%) |
| $1,000,000 or more | 15 (0.3%) | 3 (0.1%) |
| Total | 4,670 (100.0%) | 5,963 (100.0%) |
Household Income by Mortgage Status in Wexford County
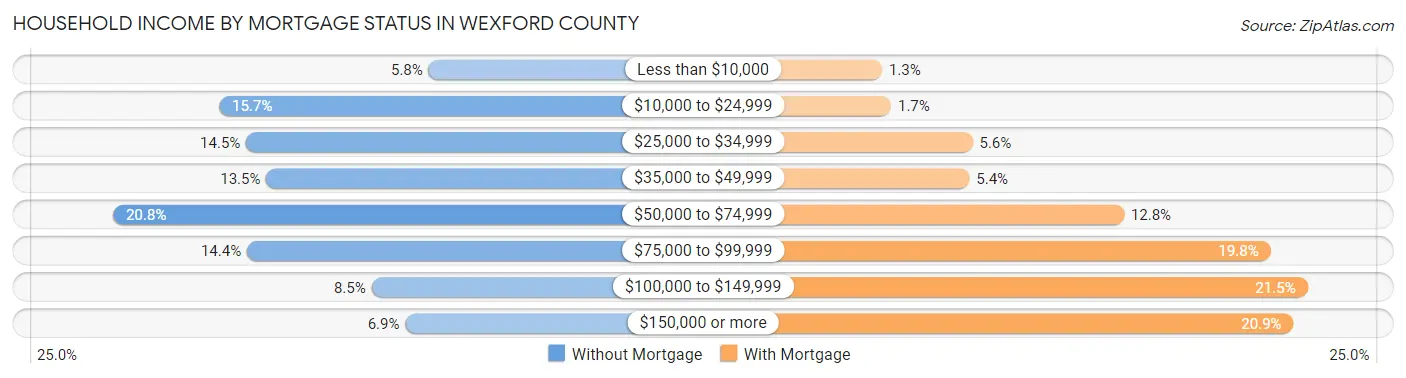
| Household Income | Without Mortgage | With Mortgage |
| Less than $10,000 | 269 (5.8%) | 75 (1.3%) |
| $10,000 to $24,999 | 735 (15.7%) | 101 (1.7%) |
| $25,000 to $34,999 | 675 (14.4%) | 332 (5.6%) |
| $35,000 to $49,999 | 630 (13.5%) | 323 (5.4%) |
| $50,000 to $74,999 | 971 (20.8%) | 762 (12.8%) |
| $75,000 to $99,999 | 673 (14.4%) | 1,178 (19.8%) |
| $100,000 to $149,999 | 396 (8.5%) | 1,283 (21.5%) |
| $150,000 or more | 321 (6.9%) | 1,243 (20.8%) |
| Total | 4,670 (100.0%) | 5,963 (100.0%) |
Property Value to Household Income Ratio in Wexford County
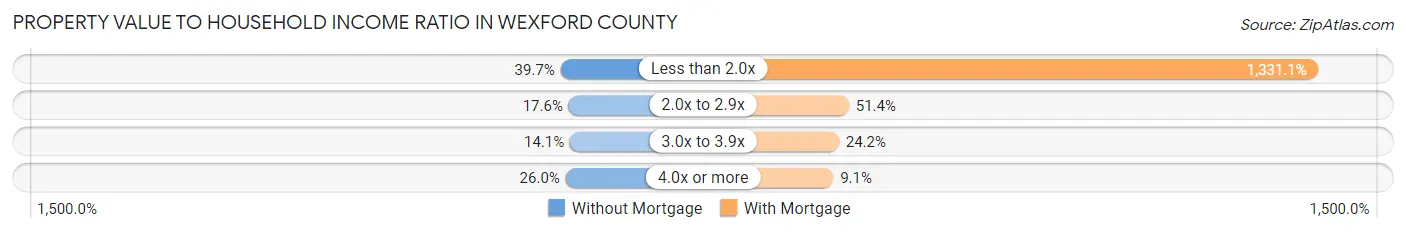
| Value-to-Income Ratio | Without Mortgage | With Mortgage |
| Less than 2.0x | 1,853 (39.7%) | 79,375 (1,331.1%) |
| 2.0x to 2.9x | 824 (17.6%) | 3,062 (51.3%) |
| 3.0x to 3.9x | 660 (14.1%) | 1,441 (24.2%) |
| 4.0x or more | 1,215 (26.0%) | 540 (9.1%) |
| Total | 4,670 (100.0%) | 5,963 (100.0%) |
Real Estate Taxes by Mortgage Status in Wexford County
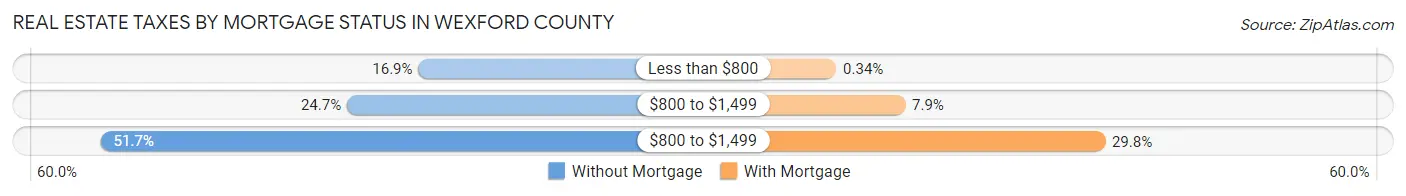
| Property Taxes | Without Mortgage | With Mortgage |
| Less than $800 | 787 (16.9%) | 20 (0.3%) |
| $800 to $1,499 | 1,152 (24.7%) | 471 (7.9%) |
| $800 to $1,499 | 2,413 (51.7%) | 1,777 (29.8%) |
| Total | 4,670 (100.0%) | 5,963 (100.0%) |
Health & Disability in Wexford County
Health Insurance Coverage by Age in Wexford County
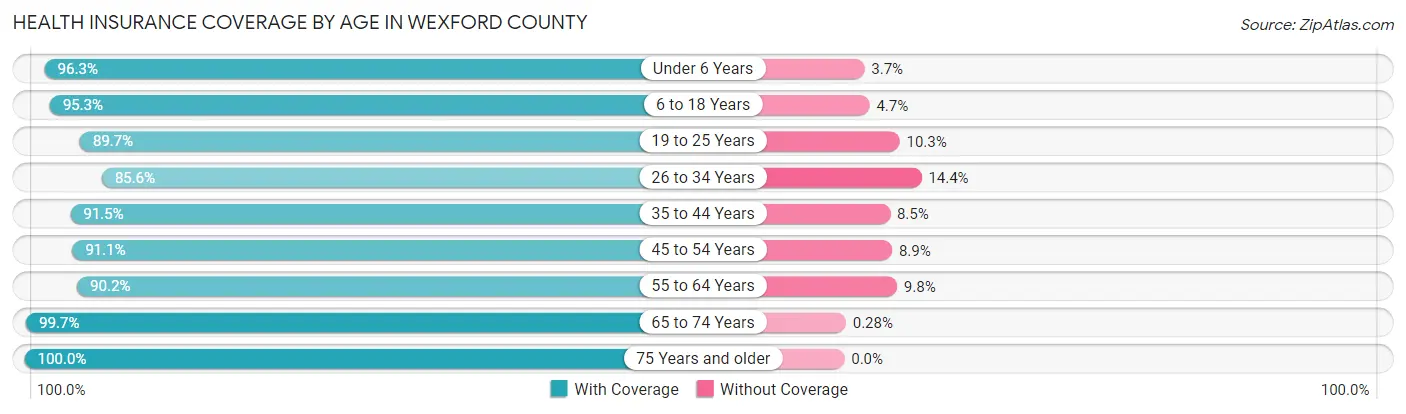
| Age Bracket | With Coverage | Without Coverage |
| Under 6 Years | 2,420 (96.3%) | 94 (3.7%) |
| 6 to 18 Years | 5,323 (95.3%) | 262 (4.7%) |
| 19 to 25 Years | 2,385 (89.7%) | 274 (10.3%) |
| 26 to 34 Years | 2,826 (85.6%) | 475 (14.4%) |
| 35 to 44 Years | 3,556 (91.5%) | 331 (8.5%) |
| 45 to 54 Years | 3,657 (91.1%) | 357 (8.9%) |
| 55 to 64 Years | 4,442 (90.2%) | 483 (9.8%) |
| 65 to 74 Years | 3,973 (99.7%) | 11 (0.3%) |
| 75 Years and older | 2,599 (100.0%) | 0 (0.0%) |
| Total | 31,181 (93.2%) | 2,287 (6.8%) |
Health Insurance Coverage by Citizenship Status in Wexford County
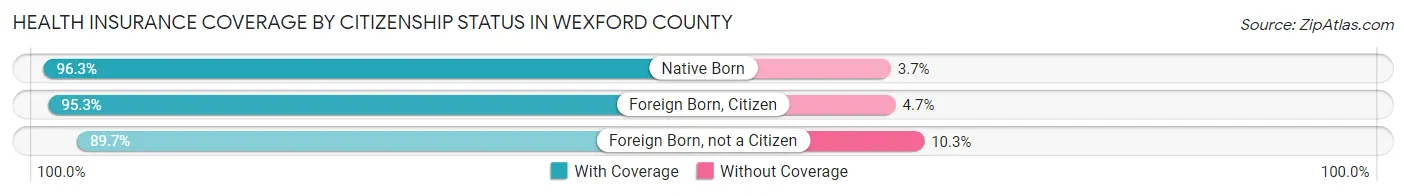
| Citizenship Status | With Coverage | Without Coverage |
| Native Born | 2,420 (96.3%) | 94 (3.7%) |
| Foreign Born, Citizen | 5,323 (95.3%) | 262 (4.7%) |
| Foreign Born, not a Citizen | 2,385 (89.7%) | 274 (10.3%) |
Health Insurance Coverage by Household Income in Wexford County
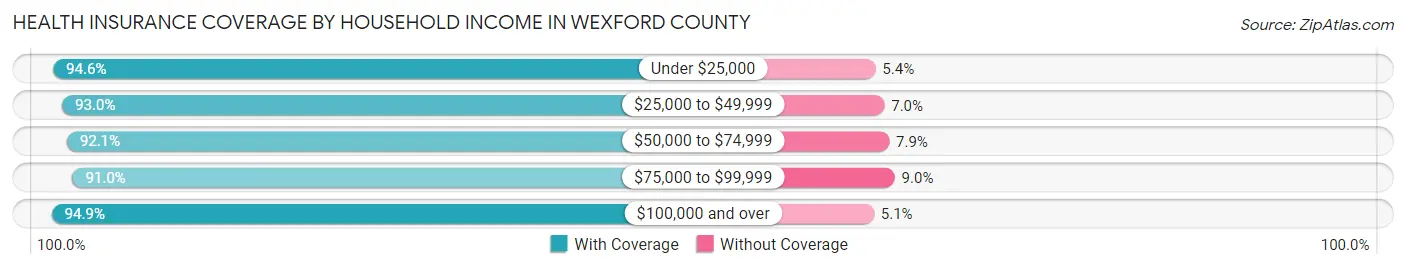
| Household Income | With Coverage | Without Coverage |
| Under $25,000 | 3,881 (94.6%) | 220 (5.4%) |
| $25,000 to $49,999 | 6,584 (93.0%) | 497 (7.0%) |
| $50,000 to $74,999 | 6,568 (92.1%) | 565 (7.9%) |
| $75,000 to $99,999 | 5,308 (91.0%) | 523 (9.0%) |
| $100,000 and over | 8,763 (94.9%) | 468 (5.1%) |
Public vs Private Health Insurance Coverage by Age in Wexford County
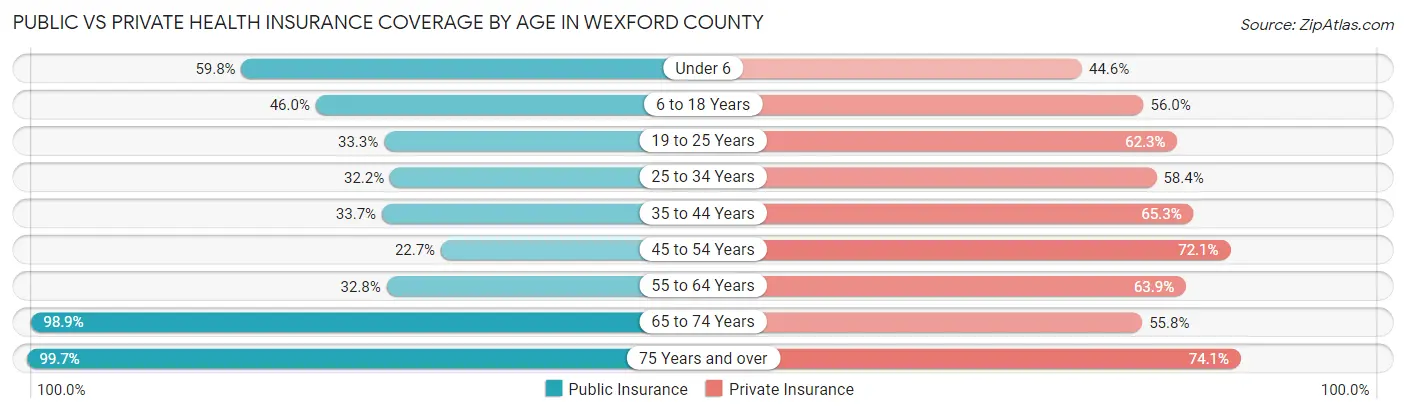
| Age Bracket | Public Insurance | Private Insurance |
| Under 6 | 1,502 (59.8%) | 1,121 (44.6%) |
| 6 to 18 Years | 2,567 (46.0%) | 3,128 (56.0%) |
| 19 to 25 Years | 885 (33.3%) | 1,656 (62.3%) |
| 25 to 34 Years | 1,062 (32.2%) | 1,928 (58.4%) |
| 35 to 44 Years | 1,309 (33.7%) | 2,537 (65.3%) |
| 45 to 54 Years | 912 (22.7%) | 2,895 (72.1%) |
| 55 to 64 Years | 1,616 (32.8%) | 3,146 (63.9%) |
| 65 to 74 Years | 3,941 (98.9%) | 2,222 (55.8%) |
| 75 Years and over | 2,590 (99.7%) | 1,925 (74.1%) |
| Total | 16,384 (48.9%) | 20,558 (61.4%) |
Disability Status by Sex by Age in Wexford County
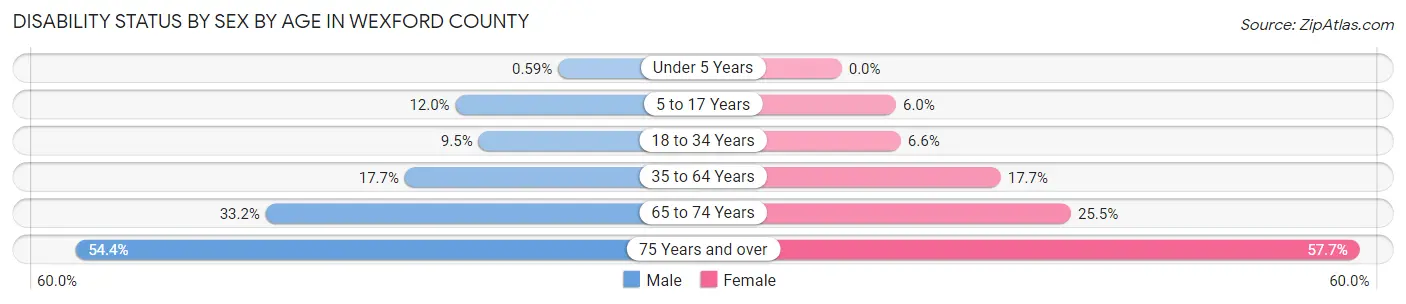
| Age Bracket | Male | Female |
| Under 5 Years | 6 (0.6%) | 0 (0.0%) |
| 5 to 17 Years | 348 (12.0%) | 174 (6.0%) |
| 18 to 34 Years | 301 (9.5%) | 207 (6.6%) |
| 35 to 64 Years | 1,149 (17.7%) | 1,119 (17.7%) |
| 65 to 74 Years | 669 (33.2%) | 502 (25.5%) |
| 75 Years and over | 649 (54.4%) | 810 (57.7%) |
Disability Class by Sex by Age in Wexford County
Disability Class: Hearing Difficulty
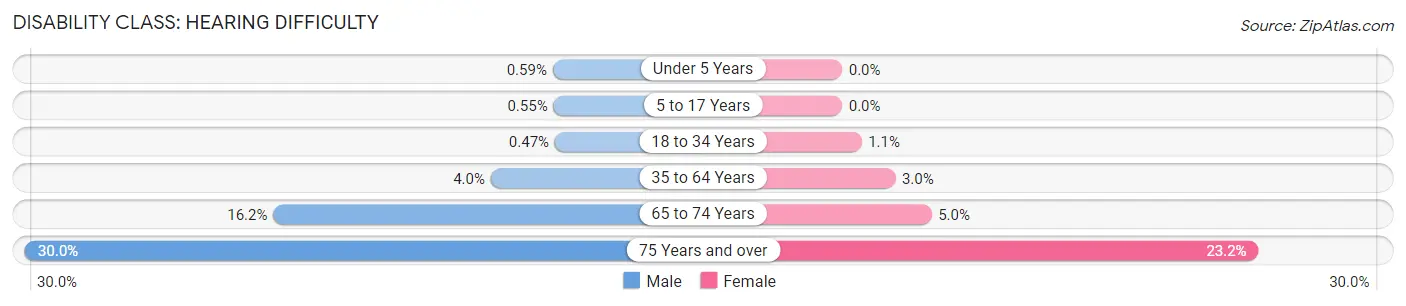
| Age Bracket | Male | Female |
| Under 5 Years | 6 (0.6%) | 0 (0.0%) |
| 5 to 17 Years | 16 (0.5%) | 0 (0.0%) |
| 18 to 34 Years | 15 (0.5%) | 34 (1.1%) |
| 35 to 64 Years | 263 (4.0%) | 187 (3.0%) |
| 65 to 74 Years | 326 (16.2%) | 98 (5.0%) |
| 75 Years and over | 358 (30.0%) | 326 (23.2%) |
Disability Class: Vision Difficulty
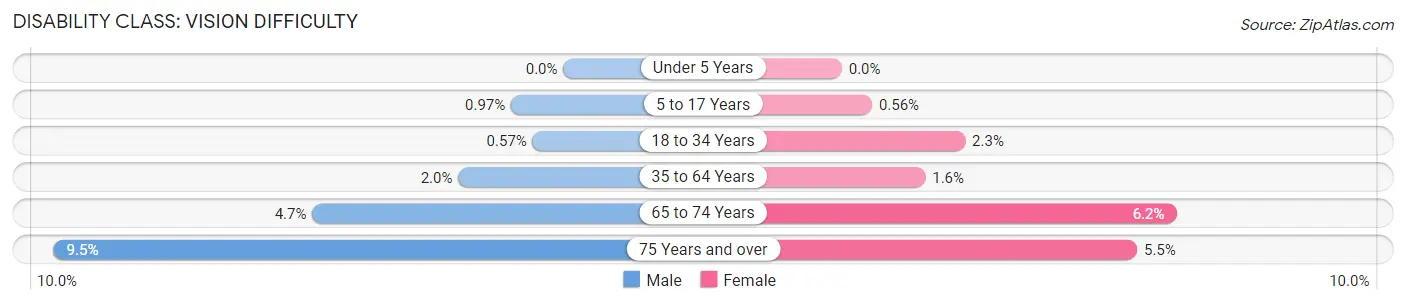
| Age Bracket | Male | Female |
| Under 5 Years | 0 (0.0%) | 0 (0.0%) |
| 5 to 17 Years | 28 (1.0%) | 16 (0.6%) |
| 18 to 34 Years | 18 (0.6%) | 72 (2.3%) |
| 35 to 64 Years | 127 (1.9%) | 98 (1.5%) |
| 65 to 74 Years | 94 (4.7%) | 122 (6.2%) |
| 75 Years and over | 113 (9.5%) | 77 (5.5%) |
Disability Class: Cognitive Difficulty
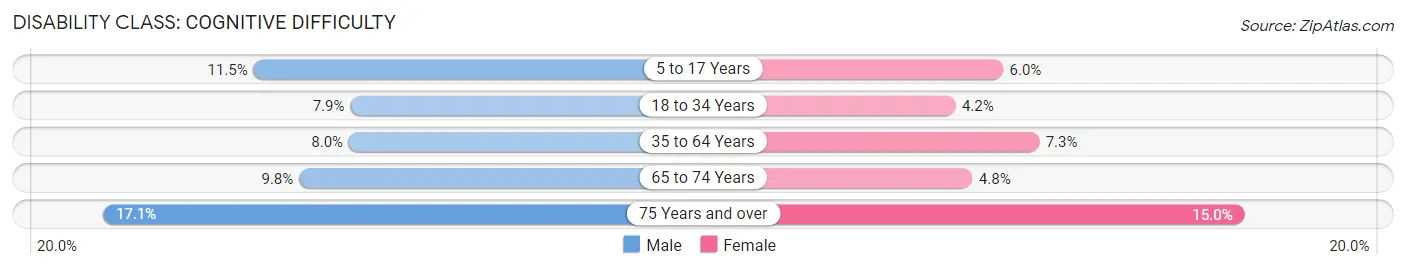
| Age Bracket | Male | Female |
| 5 to 17 Years | 333 (11.5%) | 172 (6.0%) |
| 18 to 34 Years | 252 (7.9%) | 132 (4.2%) |
| 35 to 64 Years | 518 (8.0%) | 462 (7.3%) |
| 65 to 74 Years | 198 (9.8%) | 95 (4.8%) |
| 75 Years and over | 204 (17.1%) | 210 (14.9%) |
Disability Class: Ambulatory Difficulty
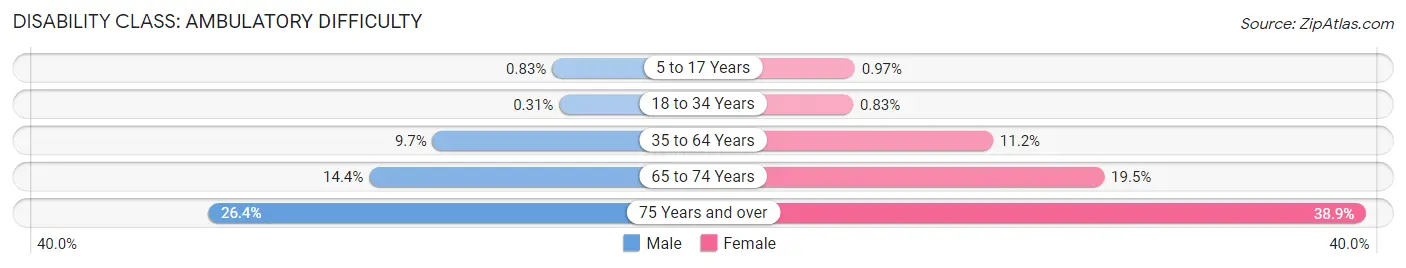
| Age Bracket | Male | Female |
| 5 to 17 Years | 24 (0.8%) | 28 (1.0%) |
| 18 to 34 Years | 10 (0.3%) | 26 (0.8%) |
| 35 to 64 Years | 632 (9.7%) | 709 (11.2%) |
| 65 to 74 Years | 291 (14.4%) | 383 (19.5%) |
| 75 Years and over | 315 (26.4%) | 547 (38.9%) |
Disability Class: Self-Care Difficulty
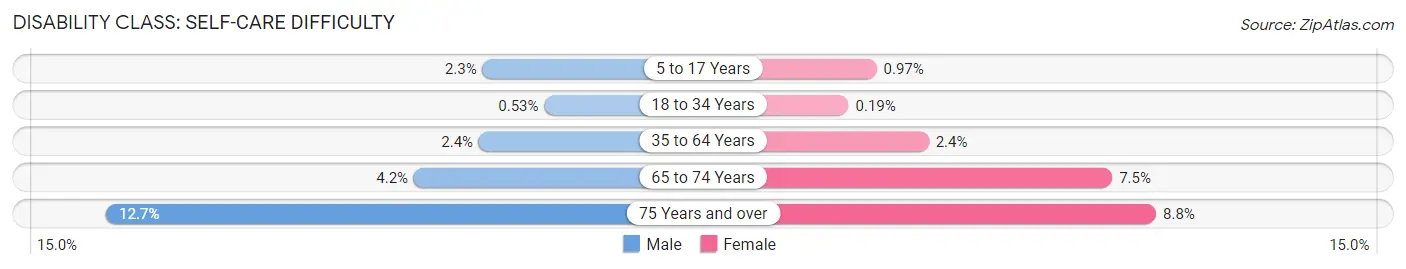
| Age Bracket | Male | Female |
| 5 to 17 Years | 65 (2.2%) | 28 (1.0%) |
| 18 to 34 Years | 17 (0.5%) | 6 (0.2%) |
| 35 to 64 Years | 153 (2.4%) | 153 (2.4%) |
| 65 to 74 Years | 84 (4.2%) | 148 (7.5%) |
| 75 Years and over | 152 (12.7%) | 123 (8.7%) |
Technology Access in Wexford County
Computing Device Access in Wexford County
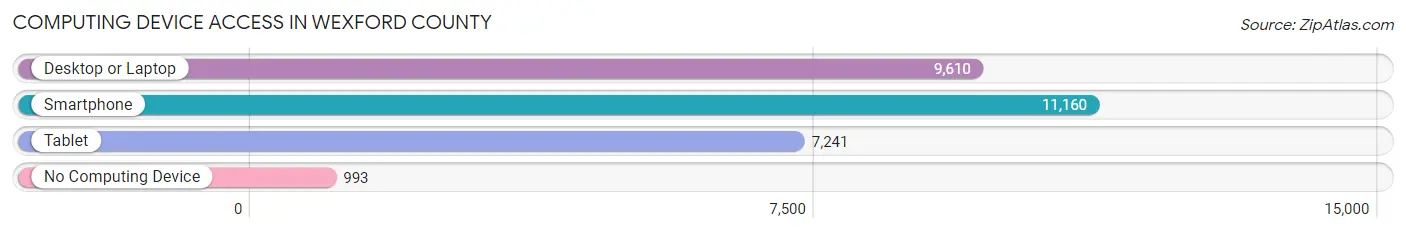
| Device Type | # Households | % Households |
| Desktop or Laptop | 9,610 | 73.0% |
| Smartphone | 11,160 | 84.8% |
| Tablet | 7,241 | 55.0% |
| No Computing Device | 993 | 7.5% |
| Total | 13,167 | 100.0% |
Internet Access in Wexford County
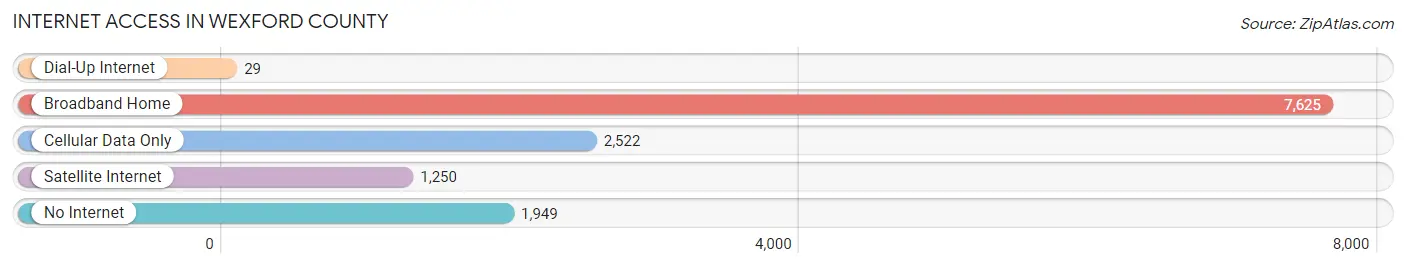
| Internet Type | # Households | % Households |
| Dial-Up Internet | 29 | 0.2% |
| Broadband Home | 7,625 | 57.9% |
| Cellular Data Only | 2,522 | 19.2% |
| Satellite Internet | 1,250 | 9.5% |
| No Internet | 1,949 | 14.8% |
| Total | 13,167 | 100.0% |
Wexford County Summary
Wexford County is located in the northwestern part of Michigan’s Lower Peninsula. It is bordered by Lake Michigan to the west, Manistee County to the north, Missaukee County to the east, and Osceola County to the south. The county seat is Cadillac, and the county has a total area of 576 square miles.
History
Wexford County was established in 1840 and was named after County Wexford in Ireland. The county was originally part of Mackinac County, and was later split off to form its own county. The first settlers in the area were mostly of Irish and Scottish descent, and the county was largely agricultural. The first county seat was located in Sherman, but it was moved to Cadillac in 1871.
Geography
Wexford County is located in the northwestern part of Michigan’s Lower Peninsula. It is bordered by Lake Michigan to the west, Manistee County to the north, Missaukee County to the east, and Osceola County to the south. The county has a total area of 576 square miles, and is mostly covered in forests and lakes. The Manistee National Forest is located in the northern part of the county, and the Pere Marquette State Forest is located in the southern part. The county is also home to several lakes, including Lake Cadillac, Lake Mitchell, and Lake Missaukee.
Economy
Wexford County’s economy is largely based on agriculture and tourism. The county is home to several farms, which produce a variety of crops, including corn, soybeans, wheat, and hay. The county is also home to several wineries, which produce a variety of wines. Tourism is also an important part of the county’s economy, as it is home to several popular attractions, including the Wexford County Historical Museum, the Wexford County Fairgrounds, and the Wexford County Speedway.
Demographics
As of the 2010 census, Wexford County had a population of 32,717. The population was spread out, with 24.3% under the age of 18, 8.2% from 18 to 24, 25.2% from 25 to 44, 28.2% from 45 to 64, and 14.1% who were 65 years of age or older. The median age was 39.3 years. The median income for a household in the county was $41,945, and the median income for a family was $50,945. The per capita income for the county was $21,845. The largest ethnic group in the county was White (93.2%), followed by Native American (2.2%), Hispanic (1.7%), and Asian (1.2%).
Common Questions
What is Per Capita Income in Wexford County?
Per Capita income in Wexford County is $29,617.
What is the Median Family Income in Wexford County?
Median Family Income in Wexford County is $70,704.
What is the Median Household income in Wexford County?
Median Household Income in Wexford County is $58,652.
What is Income or Wage Gap in Wexford County?
Income or Wage Gap in Wexford County is 26.0%.
Women in Wexford County earn 74.0 cents for every dollar earned by a man.
What is Family Income Deficit in Wexford County?
Family Income Deficit in Wexford County is $11,452.
Families that are below poverty line in Wexford County earn $11,452 less on average than the poverty threshold level.
What is Inequality or Gini Index in Wexford County?
Inequality or Gini Index in Wexford County is 0.44.
What is the Total Population of Wexford County?
Total Population of Wexford County is 33,766.
What is the Total Male Population of Wexford County?
Total Male Population of Wexford County is 16,966.
What is the Total Female Population of Wexford County?
Total Female Population of Wexford County is 16,800.
What is the Ratio of Males per 100 Females in Wexford County?
There are 100.99 Males per 100 Females in Wexford County.
What is the Ratio of Females per 100 Males in Wexford County?
There are 99.02 Females per 100 Males in Wexford County.
What is the Median Population Age in Wexford County?
Median Population Age in Wexford County is 42.2 Years.
What is the Average Family Size in Wexford County
Average Family Size in Wexford County is 3.0 People.
What is the Average Household Size in Wexford County
Average Household Size in Wexford County is 2.5 People.
How Large is the Labor Force in Wexford County?
There are 15,058 People in the Labor Forcein in Wexford County.
What is the Percentage of People in the Labor Force in Wexford County?
56.1% of People are in the Labor Force in Wexford County.
What is the Unemployment Rate in Wexford County?
Unemployment Rate in Wexford County is 6.3%.