St. Joseph County, MI Map & Demographics
St. Joseph County Map
St. Joseph County Overview
$30,171
PER CAPITA INCOME
$74,224
AVG FAMILY INCOME
$62,281
AVG HOUSEHOLD INCOME
35.6%
WAGE / INCOME GAP [ % ]
64.4¢/ $1
WAGE / INCOME GAP [ $ ]
$10,131
FAMILY INCOME DEFICIT
0.41
INEQUALITY / GINI INDEX
60,887
TOTAL POPULATION
30,671
MALE POPULATION
30,216
FEMALE POPULATION
101.51
MALES / 100 FEMALES
98.52
FEMALES / 100 MALES
39.8
MEDIAN AGE
3.1
AVG FAMILY SIZE
2.6
AVG HOUSEHOLD SIZE
29,483
LABOR FORCE [ PEOPLE ]
61.7%
PERCENT IN LABOR FORCE
5.3%
UNEMPLOYMENT RATE
St. Joseph County Area Codes
Income in St. Joseph County
Income Overview in St. Joseph County
Per Capita Income in St. Joseph County is $30,171, while median incomes of families and households are $74,224 and $62,281 respectively.
| Characteristic | Number | Measure |
| Per Capita Income | 60,887 | $30,171 |
| Median Family Income | 15,477 | $74,224 |
| Mean Family Income | 15,477 | $87,680 |
| Median Household Income | 23,478 | $62,281 |
| Mean Household Income | 23,478 | $76,121 |
| Income Deficit | 15,477 | $10,131 |
| Wage / Income Gap (%) | 60,887 | 35.58% |
| Wage / Income Gap ($) | 60,887 | 64.42¢ per $1 |
| Gini / Inequality Index | 60,887 | 0.41 |
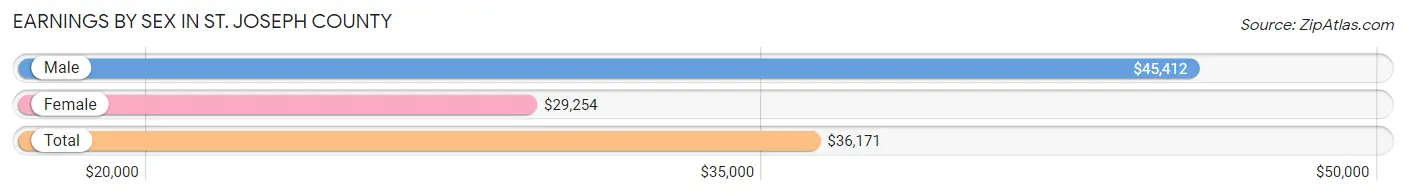
Earnings by Sex in St. Joseph County
Average Earnings in St. Joseph County are $36,171, $45,412 for men and $29,254 for women, a difference of 35.6%.
| Sex | Number | Average Earnings |
| Male | 16,760 (54.6%) | $45,412 |
| Female | 13,956 (45.4%) | $29,254 |
| Total | 30,716 (100.0%) | $36,171 |
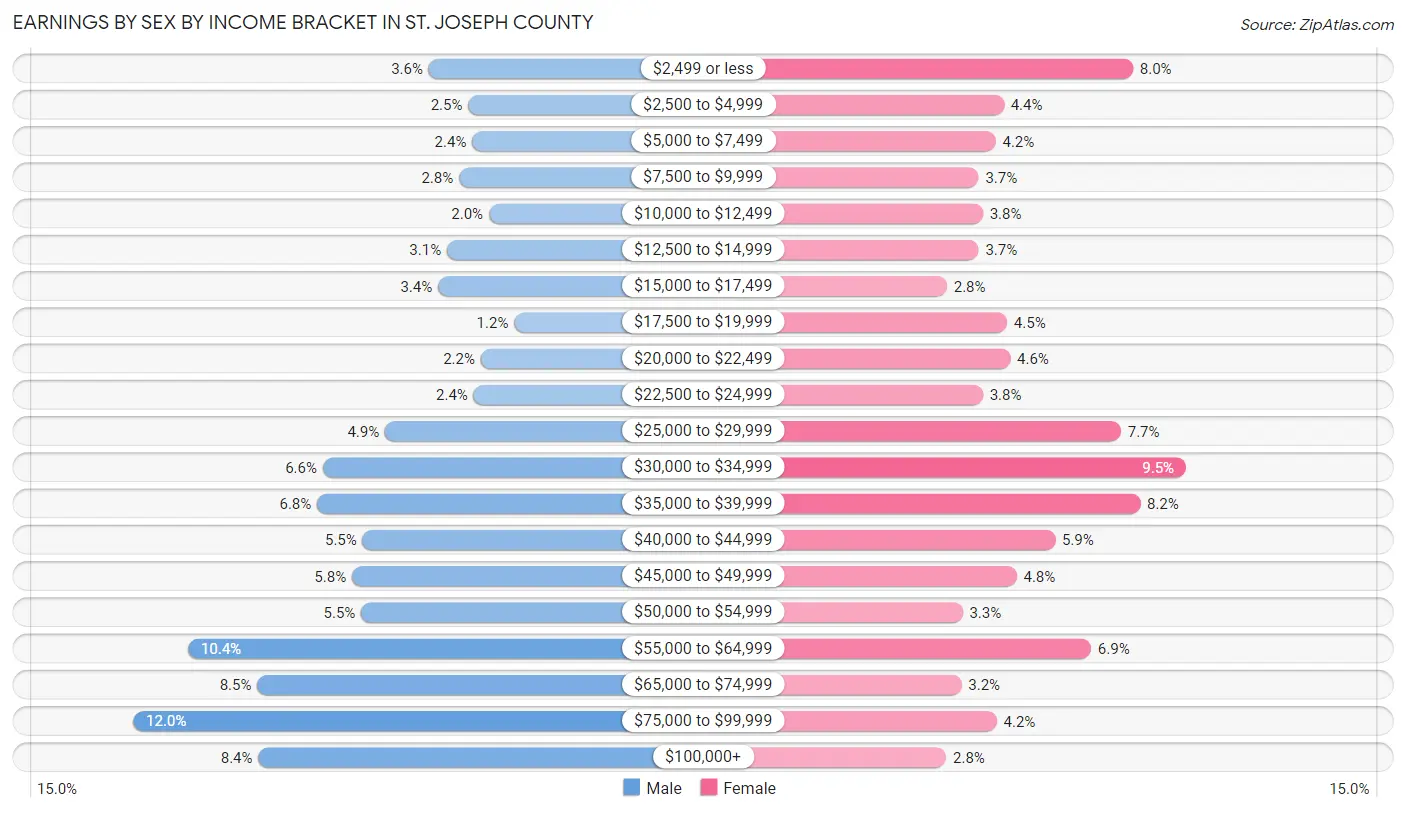
Earnings by Sex by Income Bracket in St. Joseph County
The most common earnings brackets in St. Joseph County are $75,000 to $99,999 for men (2,003 | 11.9%) and $30,000 to $34,999 for women (1,330 | 9.5%).
| Income | Male | Female |
| $2,499 or less | 610 (3.6%) | 1,122 (8.0%) |
| $2,500 to $4,999 | 424 (2.5%) | 616 (4.4%) |
| $5,000 to $7,499 | 406 (2.4%) | 583 (4.2%) |
| $7,500 to $9,999 | 468 (2.8%) | 517 (3.7%) |
| $10,000 to $12,499 | 326 (1.9%) | 533 (3.8%) |
| $12,500 to $14,999 | 525 (3.1%) | 517 (3.7%) |
| $15,000 to $17,499 | 566 (3.4%) | 392 (2.8%) |
| $17,500 to $19,999 | 207 (1.2%) | 628 (4.5%) |
| $20,000 to $22,499 | 365 (2.2%) | 641 (4.6%) |
| $22,500 to $24,999 | 399 (2.4%) | 533 (3.8%) |
| $25,000 to $29,999 | 817 (4.9%) | 1,075 (7.7%) |
| $30,000 to $34,999 | 1,110 (6.6%) | 1,330 (9.5%) |
| $35,000 to $39,999 | 1,137 (6.8%) | 1,150 (8.2%) |
| $40,000 to $44,999 | 922 (5.5%) | 816 (5.9%) |
| $45,000 to $49,999 | 972 (5.8%) | 666 (4.8%) |
| $50,000 to $54,999 | 928 (5.5%) | 453 (3.3%) |
| $55,000 to $64,999 | 1,744 (10.4%) | 958 (6.9%) |
| $65,000 to $74,999 | 1,418 (8.5%) | 450 (3.2%) |
| $75,000 to $99,999 | 2,003 (11.9%) | 587 (4.2%) |
| $100,000+ | 1,413 (8.4%) | 389 (2.8%) |
| Total | 16,760 (100.0%) | 13,956 (100.0%) |
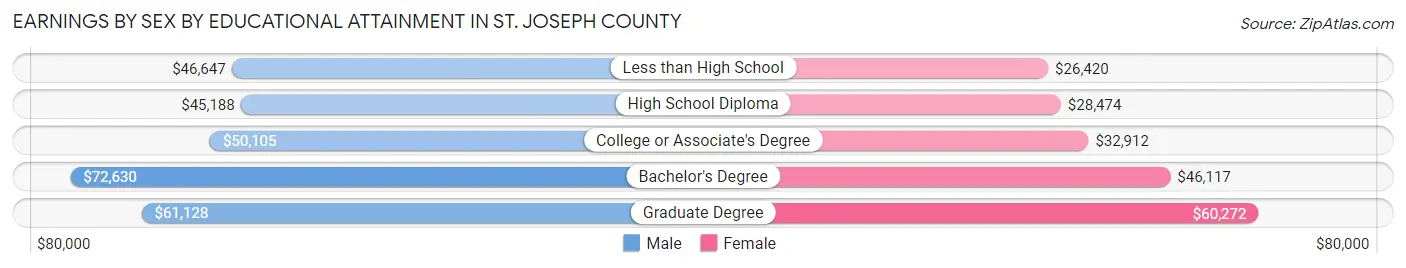
Earnings by Sex by Educational Attainment in St. Joseph County
Average earnings in St. Joseph County are $50,123 for men and $32,628 for women, a difference of 34.9%. Men with an educational attainment of bachelor's degree enjoy the highest average annual earnings of $72,630, while those with high school diploma education earn the least with $45,188. Women with an educational attainment of graduate degree earn the most with the average annual earnings of $60,272, while those with less than high school education have the smallest earnings of $26,420.
| Educational Attainment | Male Income | Female Income |
| Less than High School | $46,647 | $26,420 |
| High School Diploma | $45,188 | $28,474 |
| College or Associate's Degree | $50,105 | $32,912 |
| Bachelor's Degree | $72,630 | $46,117 |
| Graduate Degree | $61,128 | $60,272 |
| Total | $50,123 | $32,628 |
Family Income in St. Joseph County
Family Income Brackets in St. Joseph County
According to the St. Joseph County family income data, there are 3,637 families falling into the $50,000 to $74,999 income range, which is the most common income bracket and makes up 23.5% of all families. Conversely, the $10,000 to $14,999 income bracket is the least frequent group with only 325 families (2.1%) belonging to this category.
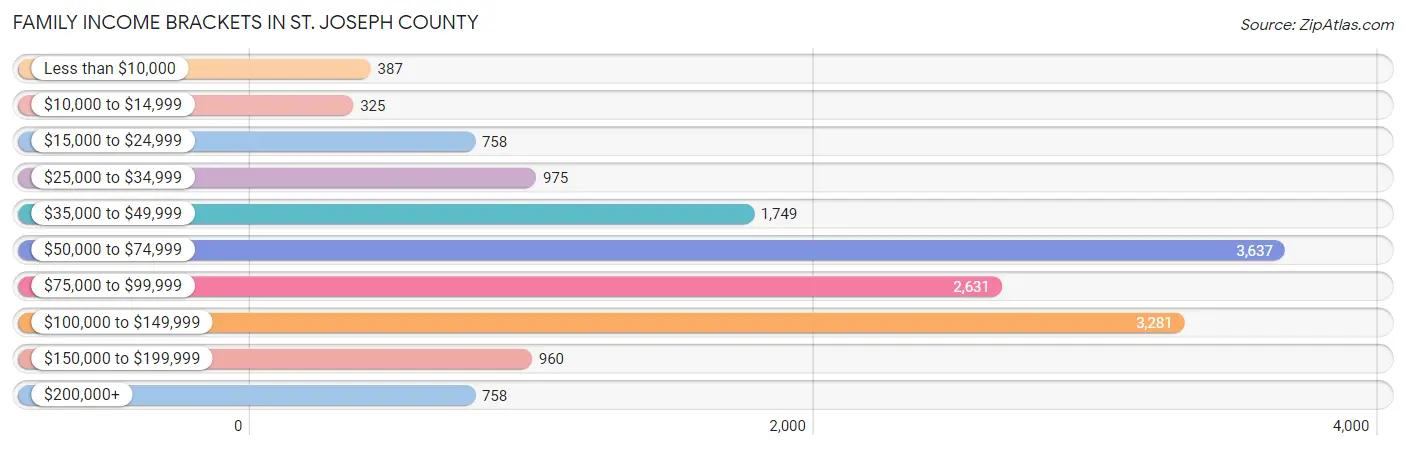
| Income Bracket | # Families | % Families |
| Less than $10,000 | 387 | 2.5% |
| $10,000 to $14,999 | 325 | 2.1% |
| $15,000 to $24,999 | 758 | 4.9% |
| $25,000 to $34,999 | 975 | 6.3% |
| $35,000 to $49,999 | 1,749 | 11.3% |
| $50,000 to $74,999 | 3,637 | 23.5% |
| $75,000 to $99,999 | 2,631 | 17.0% |
| $100,000 to $149,999 | 3,281 | 21.2% |
| $150,000 to $199,999 | 960 | 6.2% |
| $200,000+ | 758 | 4.9% |
Family Income by Famaliy Size in St. Joseph County
6-person families (614 | 4.0%) account for the highest median family income in St. Joseph County with $110,948 per family, while 2-person families (7,991 | 51.6%) have the highest median income of $31,704 per family member.
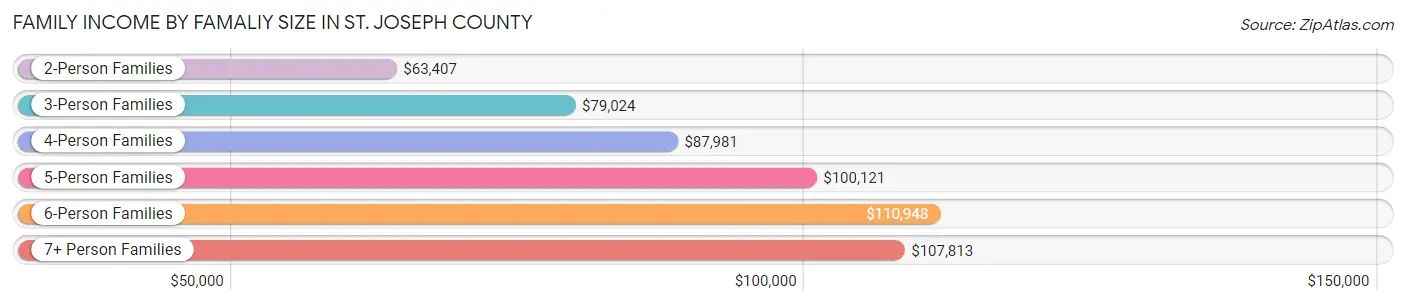
| Income Bracket | # Families | Median Income |
| 2-Person Families | 7,991 (51.6%) | $63,407 |
| 3-Person Families | 3,020 (19.5%) | $79,024 |
| 4-Person Families | 2,308 (14.9%) | $87,981 |
| 5-Person Families | 1,203 (7.8%) | $100,121 |
| 6-Person Families | 614 (4.0%) | $110,948 |
| 7+ Person Families | 341 (2.2%) | $107,813 |
| Total | 15,477 (100.0%) | $74,224 |
Family Income by Number of Earners in St. Joseph County
The median family income in St. Joseph County is $74,224, with families comprising 3+ earners (1,998) having the highest median family income of $119,954, while families with no earners (2,490) have the lowest median family income of $50,257, accounting for 12.9% and 16.1% of families, respectively.
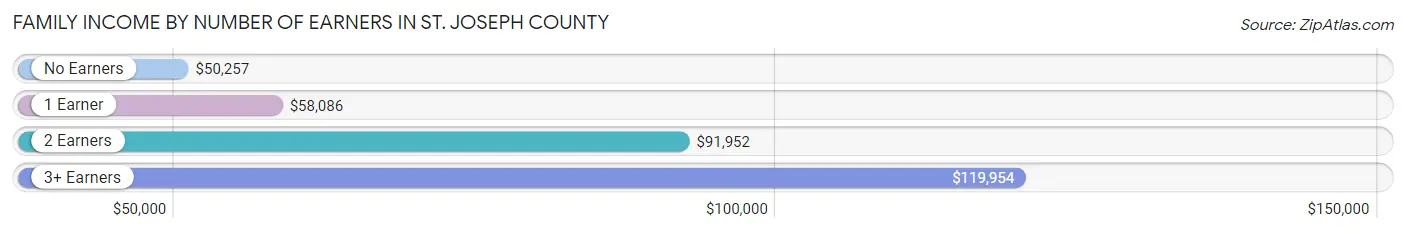
| Number of Earners | # Families | Median Income |
| No Earners | 2,490 (16.1%) | $50,257 |
| 1 Earner | 5,426 (35.1%) | $58,086 |
| 2 Earners | 5,563 (35.9%) | $91,952 |
| 3+ Earners | 1,998 (12.9%) | $119,954 |
| Total | 15,477 (100.0%) | $74,224 |
Household Income in St. Joseph County
Household Income Brackets in St. Joseph County
With 4,836 households falling in the category, the $50,000 to $74,999 income range is the most frequent in St. Joseph County, accounting for 20.6% of all households. In contrast, only 869 households (3.7%) fall into the $200,000+ income bracket, making it the least populous group.
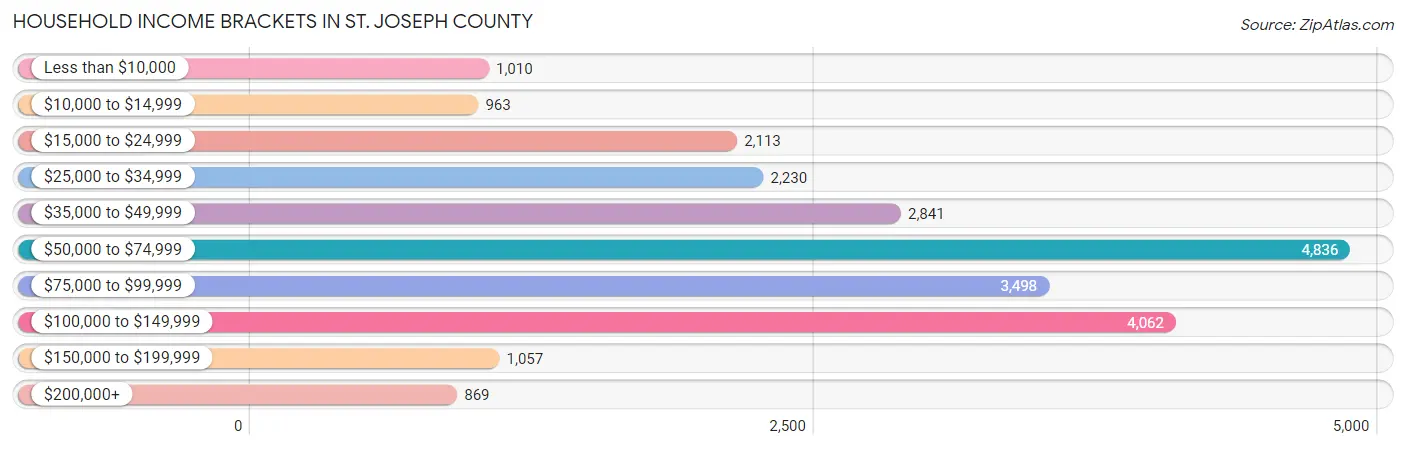
| Income Bracket | # Households | % Households |
| Less than $10,000 | 1,010 | 4.3% |
| $10,000 to $14,999 | 963 | 4.1% |
| $15,000 to $24,999 | 2,113 | 9.0% |
| $25,000 to $34,999 | 2,230 | 9.5% |
| $35,000 to $49,999 | 2,841 | 12.1% |
| $50,000 to $74,999 | 4,836 | 20.6% |
| $75,000 to $99,999 | 3,498 | 14.9% |
| $100,000 to $149,999 | 4,062 | 17.3% |
| $150,000 to $199,999 | 1,057 | 4.5% |
| $200,000+ | 869 | 3.7% |
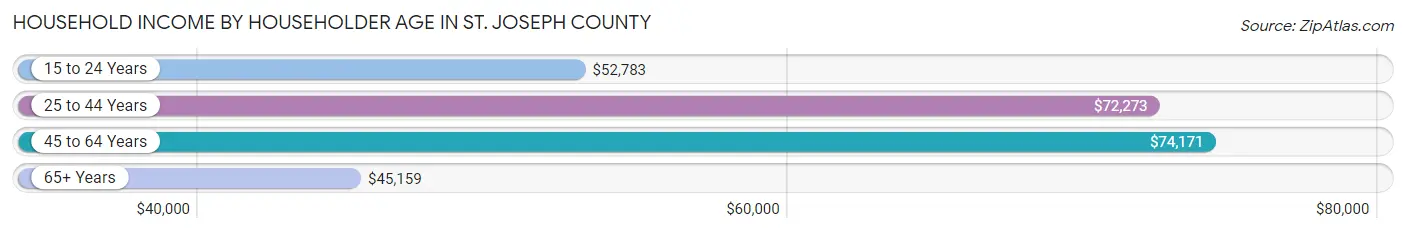
Household Income by Householder Age in St. Joseph County
The median household income in St. Joseph County is $62,281, with the highest median household income of $74,171 found in the 45 to 64 years age bracket for the primary householder. A total of 8,724 households (37.2%) fall into this category. Meanwhile, the 65+ years age bracket for the primary householder has the lowest median household income of $45,159, with 7,250 households (30.9%) in this group.
| Income Bracket | # Households | Median Income |
| 15 to 24 Years | 971 (4.1%) | $52,783 |
| 25 to 44 Years | 6,533 (27.8%) | $72,273 |
| 45 to 64 Years | 8,724 (37.2%) | $74,171 |
| 65+ Years | 7,250 (30.9%) | $45,159 |
| Total | 23,478 (100.0%) | $62,281 |
Poverty in St. Joseph County
Income Below Poverty by Sex and Age in St. Joseph County
With 11.7% poverty level for males and 14.1% for females among the residents of St. Joseph County, 5 year old males and 5 year old females are the most vulnerable to poverty, with 73 males (27.3%) and 158 females (35.4%) in their respective age groups living below the poverty level.
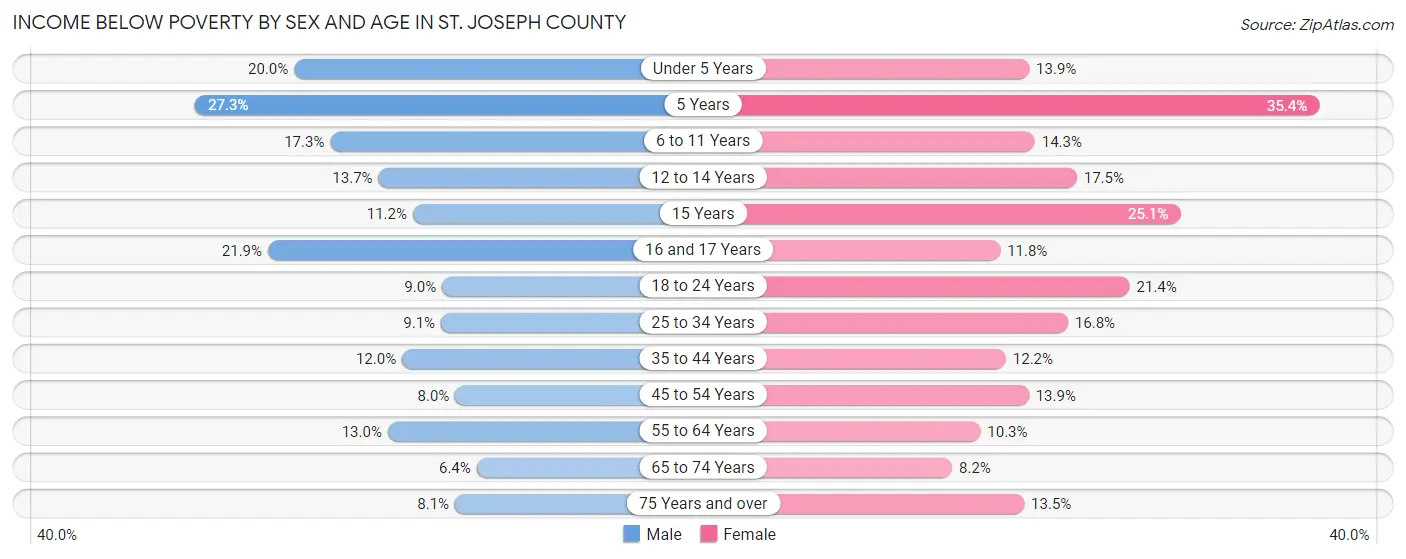
| Age Bracket | Male | Female |
| Under 5 Years | 387 (20.0%) | 246 (13.9%) |
| 5 Years | 73 (27.3%) | 158 (35.4%) |
| 6 to 11 Years | 473 (17.3%) | 291 (14.3%) |
| 12 to 14 Years | 152 (13.7%) | 251 (17.4%) |
| 15 Years | 54 (11.2%) | 111 (25.1%) |
| 16 and 17 Years | 181 (21.9%) | 102 (11.8%) |
| 18 to 24 Years | 229 (9.0%) | 506 (21.4%) |
| 25 to 34 Years | 335 (9.1%) | 585 (16.8%) |
| 35 to 44 Years | 443 (12.0%) | 420 (12.2%) |
| 45 to 54 Years | 285 (8.0%) | 478 (13.9%) |
| 55 to 64 Years | 561 (13.0%) | 439 (10.3%) |
| 65 to 74 Years | 207 (6.4%) | 283 (8.2%) |
| 75 Years and over | 142 (8.1%) | 322 (13.5%) |
| Total | 3,522 (11.7%) | 4,192 (14.1%) |
Income Above Poverty by Sex and Age in St. Joseph County
According to the poverty statistics in St. Joseph County, males aged 65 to 74 years and females aged 65 to 74 years are the age groups that are most secure financially, with 93.6% of males and 91.8% of females in these age groups living above the poverty line.
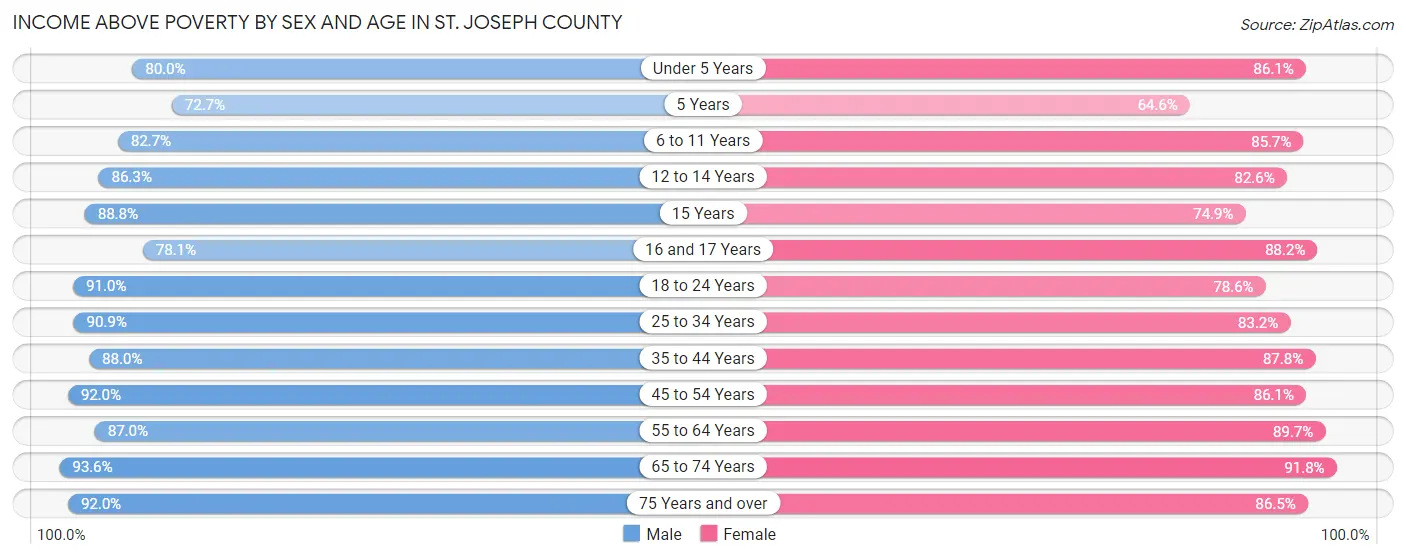
| Age Bracket | Male | Female |
| Under 5 Years | 1,549 (80.0%) | 1,523 (86.1%) |
| 5 Years | 194 (72.7%) | 288 (64.6%) |
| 6 to 11 Years | 2,259 (82.7%) | 1,740 (85.7%) |
| 12 to 14 Years | 955 (86.3%) | 1,187 (82.6%) |
| 15 Years | 429 (88.8%) | 331 (74.9%) |
| 16 and 17 Years | 644 (78.1%) | 765 (88.2%) |
| 18 to 24 Years | 2,313 (91.0%) | 1,862 (78.6%) |
| 25 to 34 Years | 3,350 (90.9%) | 2,899 (83.2%) |
| 35 to 44 Years | 3,254 (88.0%) | 3,028 (87.8%) |
| 45 to 54 Years | 3,263 (92.0%) | 2,965 (86.1%) |
| 55 to 64 Years | 3,741 (87.0%) | 3,827 (89.7%) |
| 65 to 74 Years | 3,008 (93.6%) | 3,173 (91.8%) |
| 75 Years and over | 1,622 (91.9%) | 2,056 (86.5%) |
| Total | 26,581 (88.3%) | 25,644 (86.0%) |
Income Below Poverty Among Married-Couple Families in St. Joseph County
The poverty statistics for married-couple families in St. Joseph County show that 4.9% or 559 of the total 11,369 families live below the poverty line. Families with 5 or more children have the highest poverty rate of 16.6%, comprising of 27 families. On the other hand, families with no children have the lowest poverty rate of 2.7%, which includes 186 families.
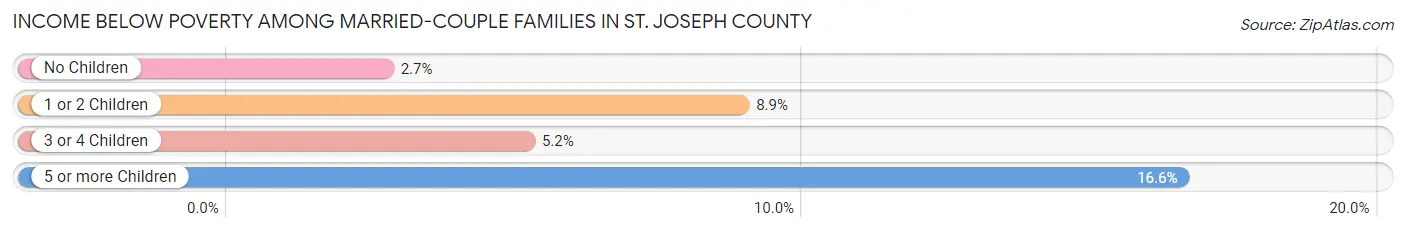
| Children | Above Poverty | Below Poverty |
| No Children | 6,687 (97.3%) | 186 (2.7%) |
| 1 or 2 Children | 2,978 (91.1%) | 291 (8.9%) |
| 3 or 4 Children | 1,009 (94.8%) | 55 (5.2%) |
| 5 or more Children | 136 (83.4%) | 27 (16.6%) |
| Total | 10,810 (95.1%) | 559 (4.9%) |
Income Below Poverty Among Single-Parent Households in St. Joseph County
According to the poverty data in St. Joseph County, 12.4% or 161 single-father households and 24.1% or 676 single-mother households are living below the poverty line. Among single-father households, those with 1 or 2 children have the highest poverty rate, with 110 households (19.5%) experiencing poverty. Likewise, among single-mother households, those with 5 or more children have the highest poverty rate, with 10 households (100.0%) falling below the poverty line.
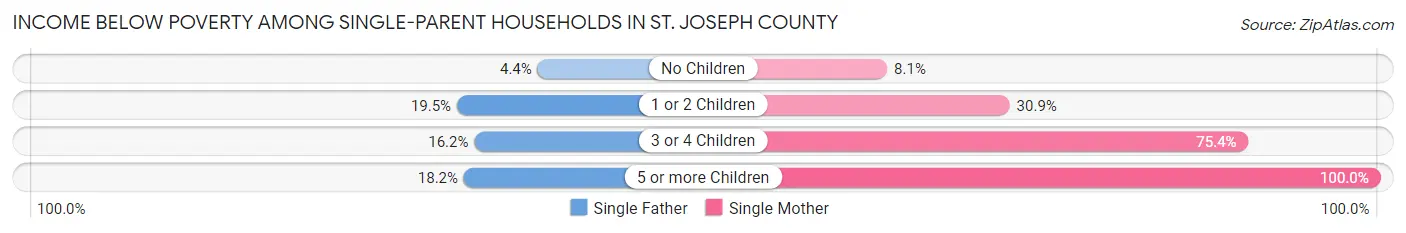
| Children | Single Father | Single Mother |
| No Children | 26 (4.4%) | 102 (8.1%) |
| 1 or 2 Children | 110 (19.5%) | 414 (30.9%) |
| 3 or 4 Children | 19 (16.2%) | 150 (75.4%) |
| 5 or more Children | 6 (18.2%) | 10 (100.0%) |
| Total | 161 (12.4%) | 676 (24.1%) |
Income Below Poverty Among Married-Couple vs Single-Parent Households in St. Joseph County
The poverty data for St. Joseph County shows that 559 of the married-couple family households (4.9%) and 837 of the single-parent households (20.4%) are living below the poverty level. Within the married-couple family households, those with 5 or more children have the highest poverty rate, with 27 households (16.6%) falling below the poverty line. Among the single-parent households, those with 3 or 4 children have the highest poverty rate, with 169 household (53.5%) living below poverty.
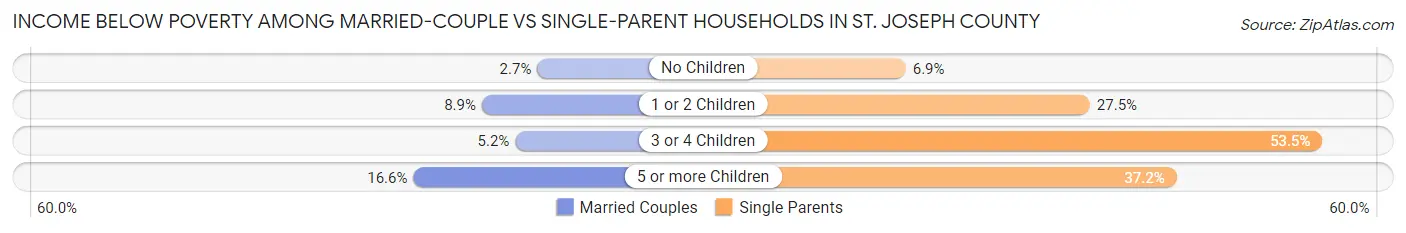
| Children | Married-Couple Families | Single-Parent Households |
| No Children | 186 (2.7%) | 128 (6.9%) |
| 1 or 2 Children | 291 (8.9%) | 524 (27.5%) |
| 3 or 4 Children | 55 (5.2%) | 169 (53.5%) |
| 5 or more Children | 27 (16.6%) | 16 (37.2%) |
| Total | 559 (4.9%) | 837 (20.4%) |
Race in St. Joseph County
The most populous races in St. Joseph County are White / Caucasian (54,037 | 88.7%), Hispanic or Latino (5,233 | 8.6%), and Two or more Races (4,430 | 7.3%).
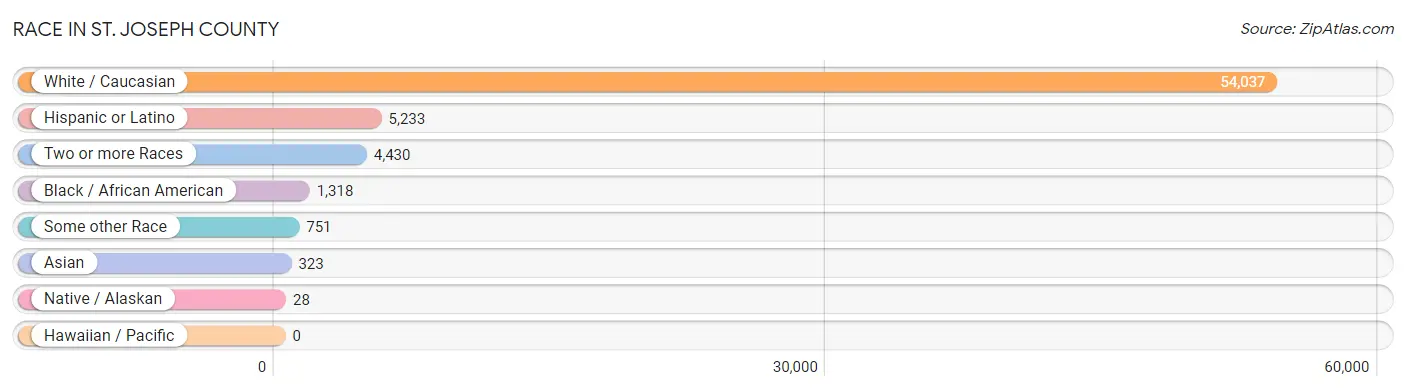
| Race | # Population | % Population |
| Asian | 323 | 0.5% |
| Black / African American | 1,318 | 2.2% |
| Hawaiian / Pacific | 0 | 0.0% |
| Hispanic or Latino | 5,233 | 8.6% |
| Native / Alaskan | 28 | 0.1% |
| White / Caucasian | 54,037 | 88.7% |
| Two or more Races | 4,430 | 7.3% |
| Some other Race | 751 | 1.2% |
| Total | 60,887 | 100.0% |
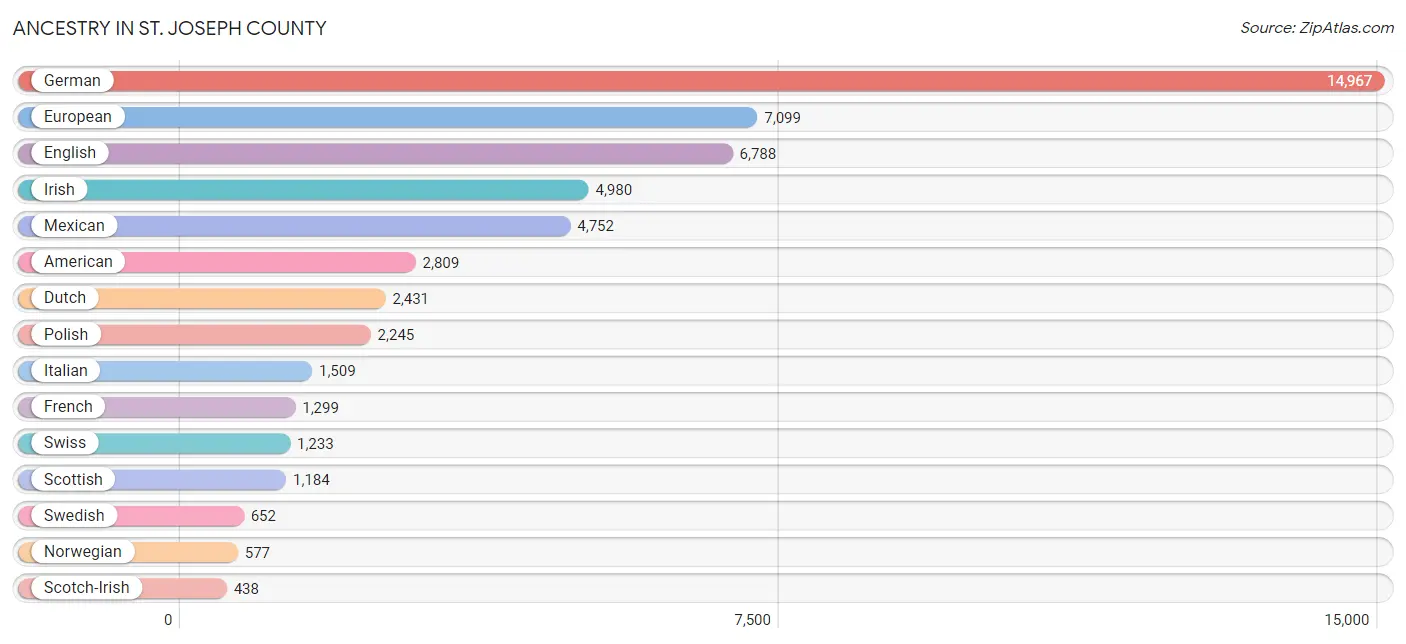
Ancestry in St. Joseph County
The most populous ancestries reported in St. Joseph County are German (14,967 | 24.6%), European (7,099 | 11.7%), English (6,788 | 11.2%), Irish (4,980 | 8.2%), and Mexican (4,752 | 7.8%), together accounting for 63.4% of all St. Joseph County residents.
| Ancestry | # Population | % Population |
| African | 57 | 0.1% |
| American | 2,809 | 4.6% |
| Apache | 17 | 0.0% |
| Arab | 153 | 0.3% |
| Assyrian / Chaldean / Syriac | 8 | 0.0% |
| Austrian | 89 | 0.2% |
| Belgian | 130 | 0.2% |
| Belizean | 48 | 0.1% |
| Bhutanese | 75 | 0.1% |
| Blackfeet | 215 | 0.4% |
| British | 171 | 0.3% |
| Bulgarian | 18 | 0.0% |
| Burmese | 95 | 0.2% |
| Cajun | 11 | 0.0% |
| Canadian | 104 | 0.2% |
| Central American | 69 | 0.1% |
| Cherokee | 269 | 0.4% |
| Cheyenne | 26 | 0.0% |
| Chickasaw | 3 | 0.0% |
| Chilean | 2 | 0.0% |
| Chippewa | 59 | 0.1% |
| Choctaw | 1 | 0.0% |
| Colombian | 30 | 0.1% |
| Croatian | 49 | 0.1% |
| Cuban | 5 | 0.0% |
| Czech | 189 | 0.3% |
| Czechoslovakian | 22 | 0.0% |
| Danish | 101 | 0.2% |
| Delaware | 6 | 0.0% |
| Dutch | 2,431 | 4.0% |
| Dutch West Indian | 8 | 0.0% |
| Eastern European | 131 | 0.2% |
| Egyptian | 35 | 0.1% |
| English | 6,788 | 11.2% |
| European | 7,099 | 11.7% |
| Finnish | 98 | 0.2% |
| French | 1,299 | 2.1% |
| French Canadian | 164 | 0.3% |
| German | 14,967 | 24.6% |
| Greek | 164 | 0.3% |
| Guatemalan | 16 | 0.0% |
| Hungarian | 223 | 0.4% |
| Indian (Asian) | 27 | 0.0% |
| Irish | 4,980 | 8.2% |
| Iroquois | 12 | 0.0% |
| Italian | 1,509 | 2.5% |
| Japanese | 7 | 0.0% |
| Kenyan | 6 | 0.0% |
| Korean | 145 | 0.2% |
| Latvian | 70 | 0.1% |
| Lebanese | 12 | 0.0% |
| Lithuanian | 89 | 0.2% |
| Lumbee | 2 | 0.0% |
| Luxembourger | 22 | 0.0% |
| Macedonian | 6 | 0.0% |
| Maltese | 17 | 0.0% |
| Mexican | 4,752 | 7.8% |
| Mongolian | 76 | 0.1% |
| Navajo | 21 | 0.0% |
| Northern European | 45 | 0.1% |
| Norwegian | 577 | 0.9% |
| Ottawa | 13 | 0.0% |
| Pakistani | 8 | 0.0% |
| Palestinian | 10 | 0.0% |
| Panamanian | 29 | 0.1% |
| Pennsylvania German | 359 | 0.6% |
| Polish | 2,245 | 3.7% |
| Portuguese | 38 | 0.1% |
| Potawatomi | 86 | 0.1% |
| Puerto Rican | 132 | 0.2% |
| Romanian | 24 | 0.0% |
| Russian | 82 | 0.1% |
| Salvadoran | 24 | 0.0% |
| Scandinavian | 86 | 0.1% |
| Scotch-Irish | 438 | 0.7% |
| Scottish | 1,184 | 1.9% |
| Serbian | 44 | 0.1% |
| Shoshone | 15 | 0.0% |
| Sioux | 17 | 0.0% |
| Slavic | 10 | 0.0% |
| Slovak | 43 | 0.1% |
| Slovene | 9 | 0.0% |
| South African | 1 | 0.0% |
| South American | 126 | 0.2% |
| Spaniard | 12 | 0.0% |
| Spanish | 26 | 0.0% |
| Sri Lankan | 13 | 0.0% |
| Subsaharan African | 75 | 0.1% |
| Swedish | 652 | 1.1% |
| Swiss | 1,233 | 2.0% |
| Thai | 178 | 0.3% |
| Ugandan | 11 | 0.0% |
| Ukrainian | 35 | 0.1% |
| Ute | 7 | 0.0% |
| Venezuelan | 94 | 0.2% |
| Welsh | 188 | 0.3% |
| West Indian | 10 | 0.0% |
| Yugoslavian | 14 | 0.0% | View All 98 Rows |
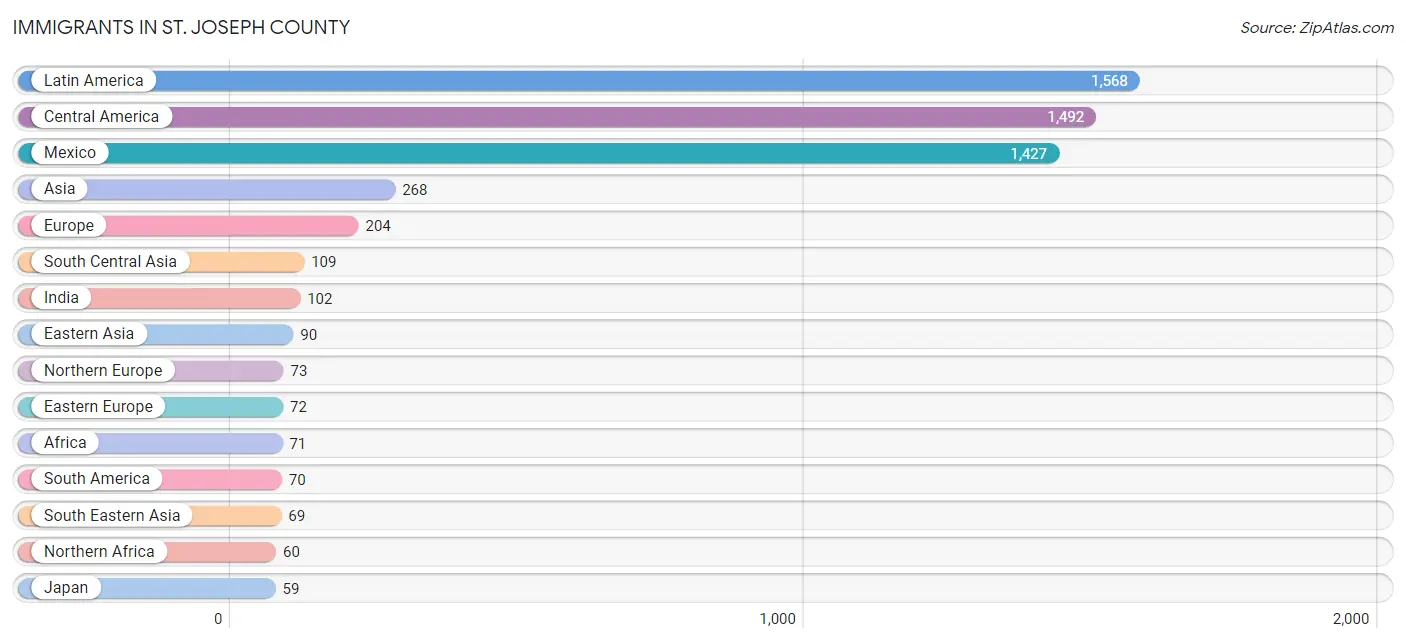
Immigrants in St. Joseph County
The most numerous immigrant groups reported in St. Joseph County came from Latin America (1,568 | 2.6%), Central America (1,492 | 2.5%), Mexico (1,427 | 2.3%), Asia (268 | 0.4%), and Europe (204 | 0.3%), together accounting for 8.2% of all St. Joseph County residents.
| Immigration Origin | # Population | % Population |
| Africa | 71 | 0.1% |
| Asia | 268 | 0.4% |
| Bangladesh | 7 | 0.0% |
| Belize | 22 | 0.0% |
| Cambodia | 6 | 0.0% |
| Canada | 26 | 0.0% |
| Caribbean | 6 | 0.0% |
| Central America | 1,492 | 2.5% |
| Chile | 2 | 0.0% |
| China | 16 | 0.0% |
| Colombia | 22 | 0.0% |
| Czechoslovakia | 8 | 0.0% |
| Eastern Africa | 6 | 0.0% |
| Eastern Asia | 90 | 0.2% |
| Eastern Europe | 72 | 0.1% |
| Egypt | 28 | 0.1% |
| El Salvador | 1 | 0.0% |
| England | 50 | 0.1% |
| Europe | 204 | 0.3% |
| Germany | 27 | 0.0% |
| Guatemala | 15 | 0.0% |
| India | 102 | 0.2% |
| Ireland | 12 | 0.0% |
| Japan | 59 | 0.1% |
| Kenya | 1 | 0.0% |
| Korea | 15 | 0.0% |
| Latin America | 1,568 | 2.6% |
| Latvia | 33 | 0.1% |
| Malaysia | 28 | 0.1% |
| Mexico | 1,427 | 2.3% |
| Netherlands | 10 | 0.0% |
| Northern Africa | 60 | 0.1% |
| Northern Europe | 73 | 0.1% |
| Panama | 27 | 0.0% |
| Philippines | 22 | 0.0% |
| Romania | 18 | 0.0% |
| Scotland | 6 | 0.0% |
| Serbia | 10 | 0.0% |
| South Africa | 1 | 0.0% |
| South America | 70 | 0.1% |
| South Central Asia | 109 | 0.2% |
| South Eastern Asia | 69 | 0.1% |
| Southern Europe | 22 | 0.0% |
| Spain | 5 | 0.0% |
| Thailand | 10 | 0.0% |
| Uganda | 5 | 0.0% |
| Venezuela | 46 | 0.1% |
| Vietnam | 3 | 0.0% |
| Western Europe | 37 | 0.1% | View All 49 Rows |
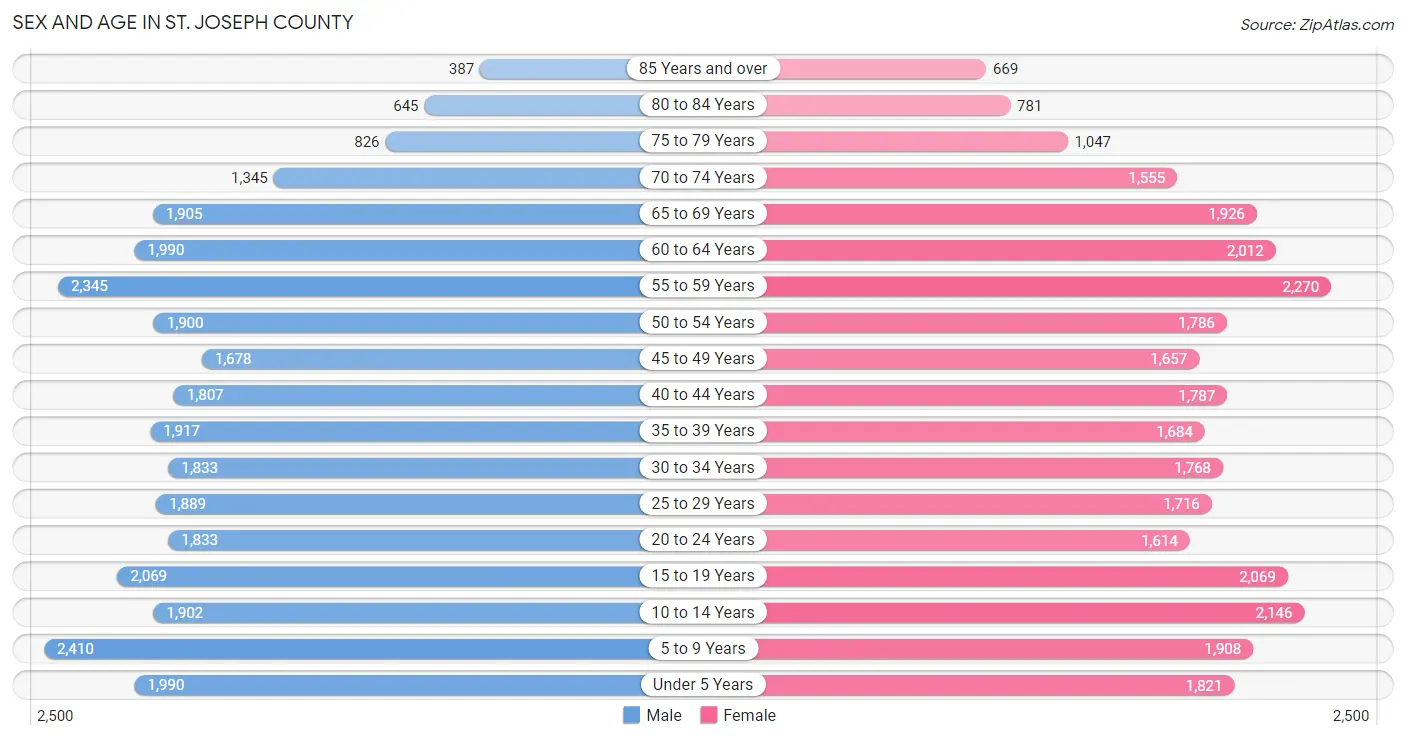
Sex and Age in St. Joseph County
Sex and Age in St. Joseph County
The most populous age groups in St. Joseph County are 5 to 9 Years (2,410 | 7.9%) for men and 55 to 59 Years (2,270 | 7.5%) for women.
| Age Bracket | Male | Female |
| Under 5 Years | 1,990 (6.5%) | 1,821 (6.0%) |
| 5 to 9 Years | 2,410 (7.9%) | 1,908 (6.3%) |
| 10 to 14 Years | 1,902 (6.2%) | 2,146 (7.1%) |
| 15 to 19 Years | 2,069 (6.8%) | 2,069 (6.9%) |
| 20 to 24 Years | 1,833 (6.0%) | 1,614 (5.3%) |
| 25 to 29 Years | 1,889 (6.2%) | 1,716 (5.7%) |
| 30 to 34 Years | 1,833 (6.0%) | 1,768 (5.9%) |
| 35 to 39 Years | 1,917 (6.2%) | 1,684 (5.6%) |
| 40 to 44 Years | 1,807 (5.9%) | 1,787 (5.9%) |
| 45 to 49 Years | 1,678 (5.5%) | 1,657 (5.5%) |
| 50 to 54 Years | 1,900 (6.2%) | 1,786 (5.9%) |
| 55 to 59 Years | 2,345 (7.6%) | 2,270 (7.5%) |
| 60 to 64 Years | 1,990 (6.5%) | 2,012 (6.7%) |
| 65 to 69 Years | 1,905 (6.2%) | 1,926 (6.4%) |
| 70 to 74 Years | 1,345 (4.4%) | 1,555 (5.1%) |
| 75 to 79 Years | 826 (2.7%) | 1,047 (3.5%) |
| 80 to 84 Years | 645 (2.1%) | 781 (2.6%) |
| 85 Years and over | 387 (1.3%) | 669 (2.2%) |
| Total | 30,671 (100.0%) | 30,216 (100.0%) |
Families and Households in St. Joseph County
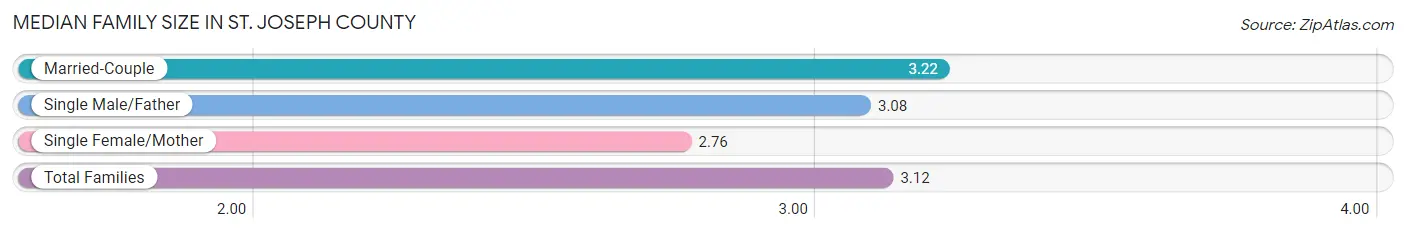
Median Family Size in St. Joseph County
The median family size in St. Joseph County is 3.12 persons per family, with married-couple families (11,369 | 73.5%) accounting for the largest median family size of 3.22 persons per family. On the other hand, single female/mother families (2,807 | 18.1%) represent the smallest median family size with 2.76 persons per family.
| Family Type | # Families | Family Size |
| Married-Couple | 11,369 (73.5%) | 3.22 |
| Single Male/Father | 1,301 (8.4%) | 3.08 |
| Single Female/Mother | 2,807 (18.1%) | 2.76 |
| Total Families | 15,477 (100.0%) | 3.12 |
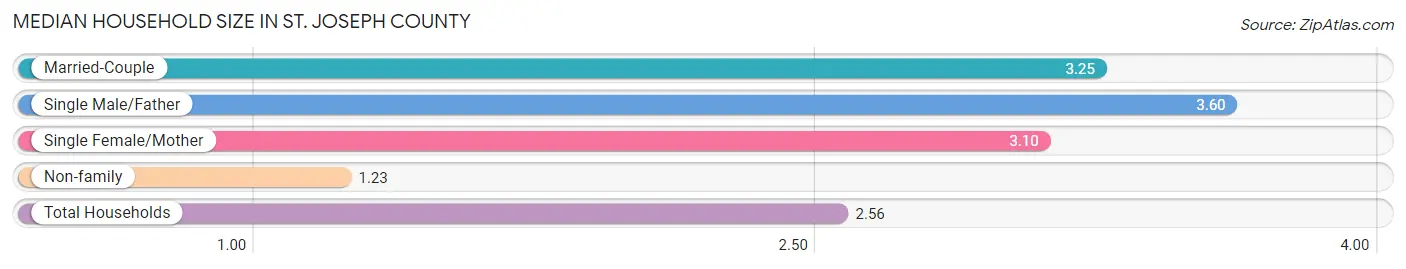
Median Household Size in St. Joseph County
The median household size in St. Joseph County is 2.56 persons per household, with single male/father households (1,301 | 5.5%) accounting for the largest median household size of 3.6 persons per household. non-family households (8,001 | 34.1%) represent the smallest median household size with 1.23 persons per household.
| Household Type | # Households | Household Size |
| Married-Couple | 11,369 (48.4%) | 3.25 |
| Single Male/Father | 1,301 (5.5%) | 3.60 |
| Single Female/Mother | 2,807 (12.0%) | 3.10 |
| Non-family | 8,001 (34.1%) | 1.23 |
| Total Households | 23,478 (100.0%) | 2.56 |
Household Size by Marriage Status in St. Joseph County
Out of a total of 23,478 households in St. Joseph County, 15,477 (65.9%) are family households, while 8,001 (34.1%) are nonfamily households. The most numerous type of family households are 2-person households, comprising 7,305, and the most common type of nonfamily households are 1-person households, comprising 6,530.
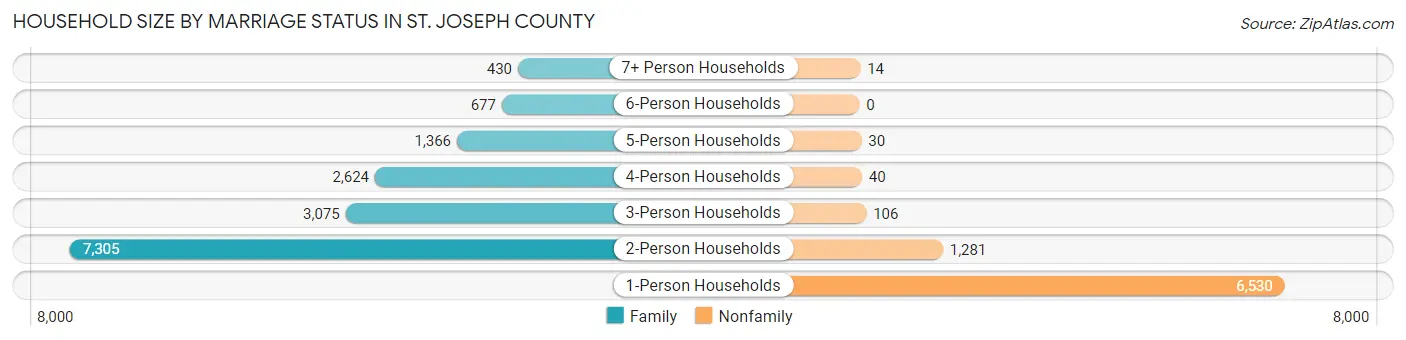
| Household Size | Family Households | Nonfamily Households |
| 1-Person Households | - | 6,530 (27.8%) |
| 2-Person Households | 7,305 (31.1%) | 1,281 (5.5%) |
| 3-Person Households | 3,075 (13.1%) | 106 (0.4%) |
| 4-Person Households | 2,624 (11.2%) | 40 (0.2%) |
| 5-Person Households | 1,366 (5.8%) | 30 (0.1%) |
| 6-Person Households | 677 (2.9%) | 0 (0.0%) |
| 7+ Person Households | 430 (1.8%) | 14 (0.1%) |
| Total | 15,477 (65.9%) | 8,001 (34.1%) |
Female Fertility in St. Joseph County
Fertility by Age in St. Joseph County
Average fertility rate in St. Joseph County is 50.0 births per 1,000 women. Women in the age bracket of 20 to 34 years have the highest fertility rate with 95.0 births per 1,000 women. Women in the age bracket of 20 to 34 years acount for 76.9% of all women with births.
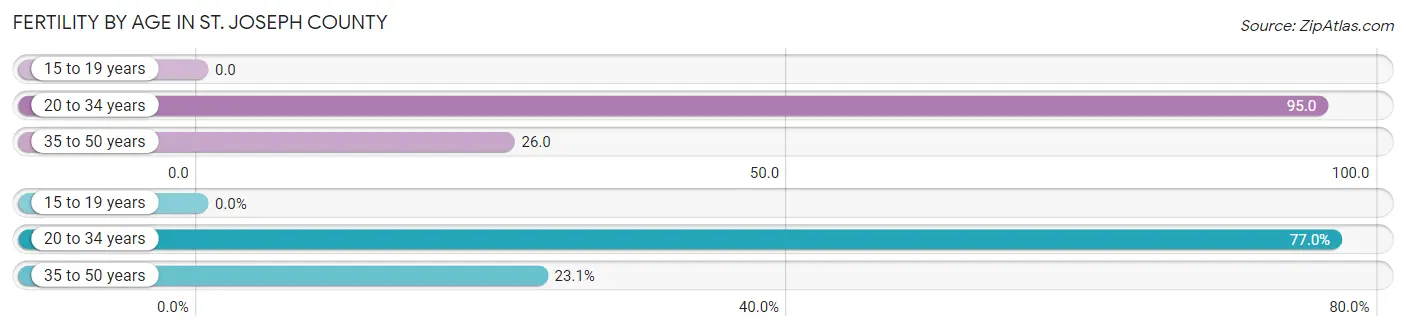
| Age Bracket | Women with Births | Births / 1,000 Women |
| 15 to 19 years | 0 (0.0%) | 0.0 |
| 20 to 34 years | 484 (76.9%) | 95.0 |
| 35 to 50 years | 145 (23.1%) | 26.0 |
| Total | 629 (100.0%) | 50.0 |
Fertility by Age by Marriage Status in St. Joseph County
63.1% of women with births (629) in St. Joseph County are married. The highest percentage of unmarried women with births falls into 20 to 34 years age bracket with 38.0% of them unmarried at the time of birth, while the lowest percentage of unmarried women with births belong to 35 to 50 years age bracket with 33.1% of them unmarried.
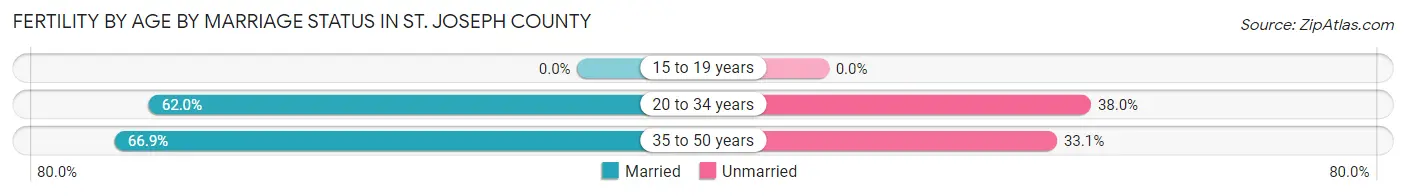
| Age Bracket | Married | Unmarried |
| 15 to 19 years | 0 (0.0%) | 0 (0.0%) |
| 20 to 34 years | 300 (62.0%) | 184 (38.0%) |
| 35 to 50 years | 97 (66.9%) | 48 (33.1%) |
| Total | 397 (63.1%) | 232 (36.9%) |
Fertility by Education in St. Joseph County
Average fertility rate in St. Joseph County is 50.0 births per 1,000 women. Women with the education attainment of graduate degree have the highest fertility rate of 73.0 births per 1,000 women, while women with the education attainment of less than high school have the lowest fertility at 38.0 births per 1,000 women. Women with the education attainment of college or associate's degree represent 36.7% of all women with births.
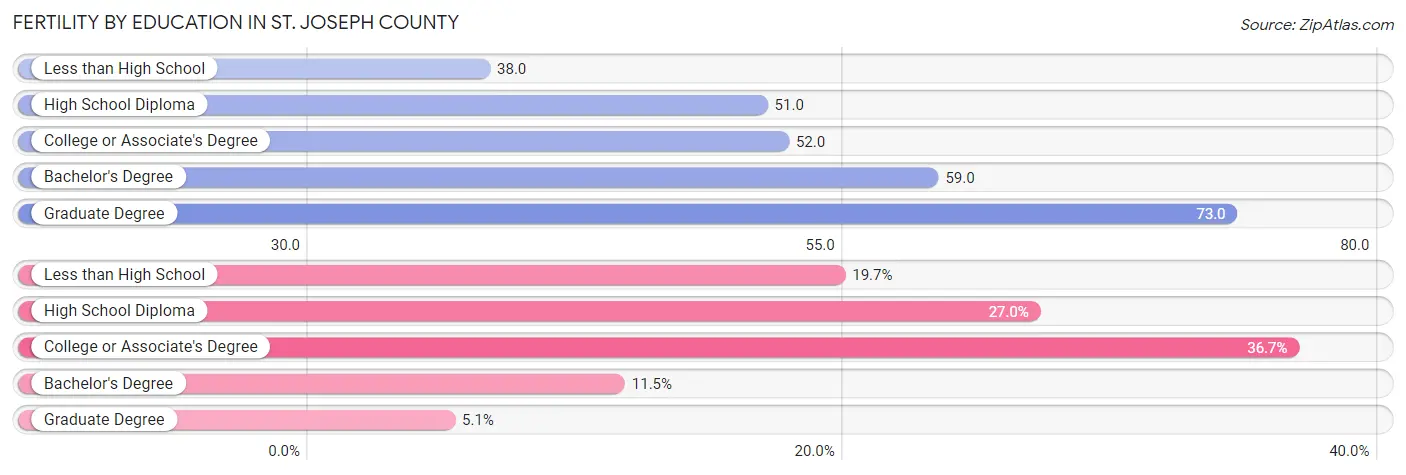
| Educational Attainment | Women with Births | Births / 1,000 Women |
| Less than High School | 124 (19.7%) | 38.0 |
| High School Diploma | 170 (27.0%) | 51.0 |
| College or Associate's Degree | 231 (36.7%) | 52.0 |
| Bachelor's Degree | 72 (11.5%) | 59.0 |
| Graduate Degree | 32 (5.1%) | 73.0 |
| Total | 629 (100.0%) | 50.0 |
Fertility by Education by Marriage Status in St. Joseph County
36.9% of women with births in St. Joseph County are unmarried. Women with the educational attainment of graduate degree are most likely to be married with 96.9% of them married at childbirth, while women with the educational attainment of high school diploma are least likely to be married with 67.1% of them unmarried at childbirth.
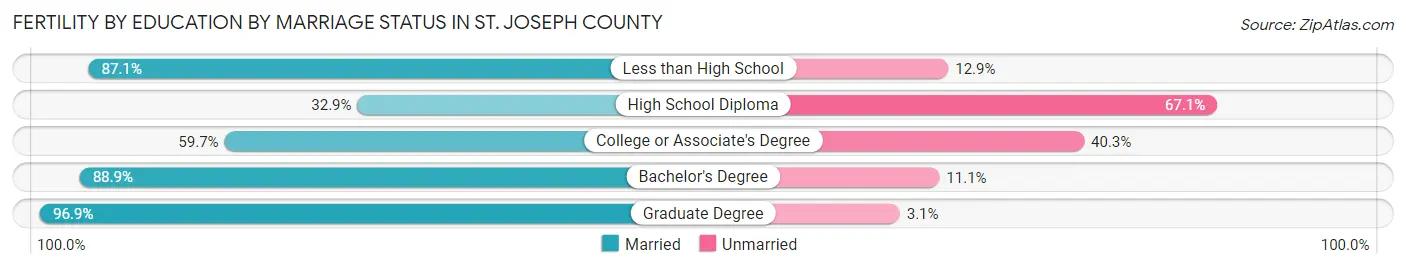
| Educational Attainment | Married | Unmarried |
| Less than High School | 108 (87.1%) | 16 (12.9%) |
| High School Diploma | 56 (32.9%) | 114 (67.1%) |
| College or Associate's Degree | 138 (59.7%) | 93 (40.3%) |
| Bachelor's Degree | 64 (88.9%) | 8 (11.1%) |
| Graduate Degree | 31 (96.9%) | 1 (3.1%) |
| Total | 397 (63.1%) | 232 (36.9%) |
Employment Characteristics in St. Joseph County
Employment by Class of Employer in St. Joseph County
Among the 27,239 employed individuals in St. Joseph County, private company employees (20,536 | 75.4%), not-for-profit organizations (2,130 | 7.8%), and local government employees (1,555 | 5.7%) make up the most common classes of employment.
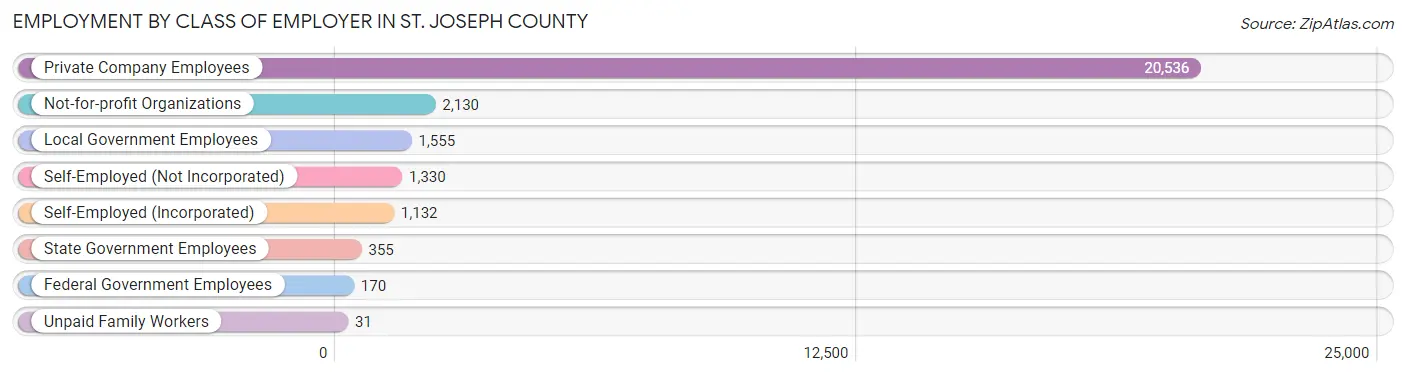
| Employer Class | # Employees | % Employees |
| Private Company Employees | 20,536 | 75.4% |
| Self-Employed (Incorporated) | 1,132 | 4.2% |
| Self-Employed (Not Incorporated) | 1,330 | 4.9% |
| Not-for-profit Organizations | 2,130 | 7.8% |
| Local Government Employees | 1,555 | 5.7% |
| State Government Employees | 355 | 1.3% |
| Federal Government Employees | 170 | 0.6% |
| Unpaid Family Workers | 31 | 0.1% |
| Total | 27,239 | 100.0% |
Employment Status by Age in St. Joseph County
According to the labor force statistics for St. Joseph County, out of the total population over 16 years of age (47,785), 61.7% or 29,483 individuals are in the labor force, with 5.3% or 1,563 of them unemployed. The age group with the highest labor force participation rate is 25 to 29 years, with 85.2% or 3,071 individuals in the labor force. Within the labor force, the 16 to 19 years age range has the highest percentage of unemployed individuals, with 10.4% or 185 of them being unemployed.
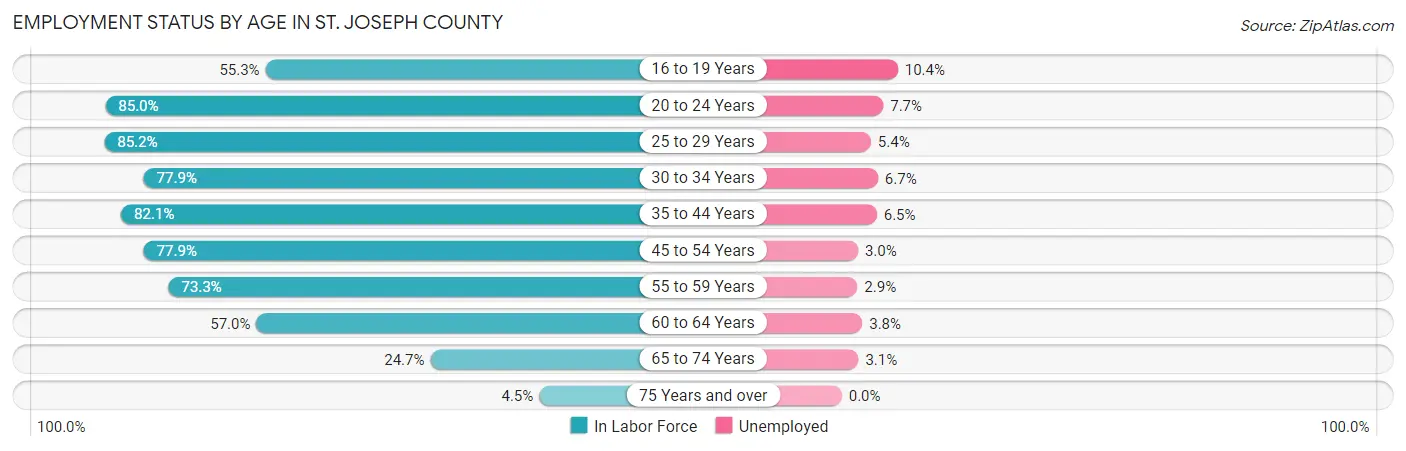
| Age Bracket | In Labor Force | Unemployed |
| 16 to 19 Years | 1,777 (55.3%) | 185 (10.4%) |
| 20 to 24 Years | 2,930 (85.0%) | 226 (7.7%) |
| 25 to 29 Years | 3,071 (85.2%) | 166 (5.4%) |
| 30 to 34 Years | 2,805 (77.9%) | 188 (6.7%) |
| 35 to 44 Years | 5,907 (82.1%) | 384 (6.5%) |
| 45 to 54 Years | 5,469 (77.9%) | 164 (3.0%) |
| 55 to 59 Years | 3,383 (73.3%) | 98 (2.9%) |
| 60 to 64 Years | 2,281 (57.0%) | 87 (3.8%) |
| 65 to 74 Years | 1,663 (24.7%) | 52 (3.1%) |
| 75 Years and over | 196 (4.5%) | 0 (0.0%) |
| Total | 29,483 (61.7%) | 1,563 (5.3%) |
Employment Status by Educational Attainment in St. Joseph County
According to labor force statistics for St. Joseph County, 76.3% of individuals (22,920) out of the total population between 25 and 64 years of age (30,039) are in the labor force, with 4.7% or 1,077 of them being unemployed. The group with the highest labor force participation rate are those with the educational attainment of bachelor's degree or higher, with 82.6% or 4,043 individuals in the labor force. Within the labor force, individuals with high school diploma education have the highest percentage of unemployment, with 6.1% or 485 of them being unemployed.
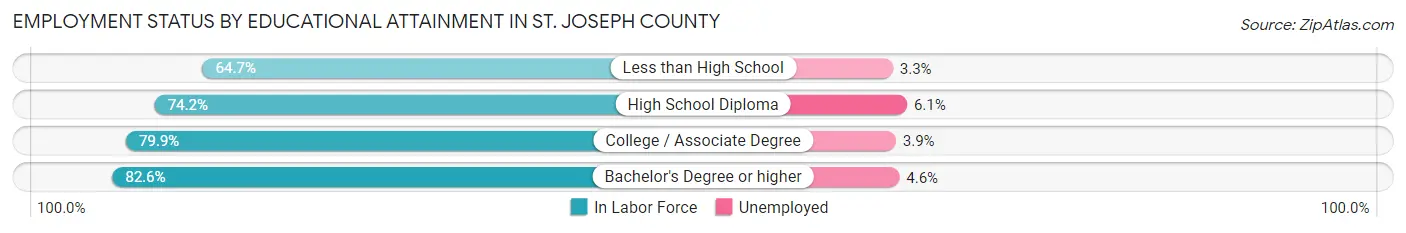
| Educational Attainment | In Labor Force | Unemployed |
| Less than High School | 2,624 (64.7%) | 134 (3.3%) |
| High School Diploma | 7,951 (74.2%) | 654 (6.1%) |
| College / Associate Degree | 8,287 (79.9%) | 405 (3.9%) |
| Bachelor's Degree or higher | 4,043 (82.6%) | 225 (4.6%) |
| Total | 22,920 (76.3%) | 1,412 (4.7%) |
Employment Occupations by Sex in St. Joseph County
Management, Business, Science and Arts Occupations
The most common Management, Business, Science and Arts occupations in St. Joseph County are Management (2,416 | 8.6%), Community & Social Service (1,750 | 6.3%), Health Diagnosing & Treating (1,277 | 4.6%), Computers, Engineering & Science (1,115 | 4.0%), and Education Instruction & Library (935 | 3.4%).
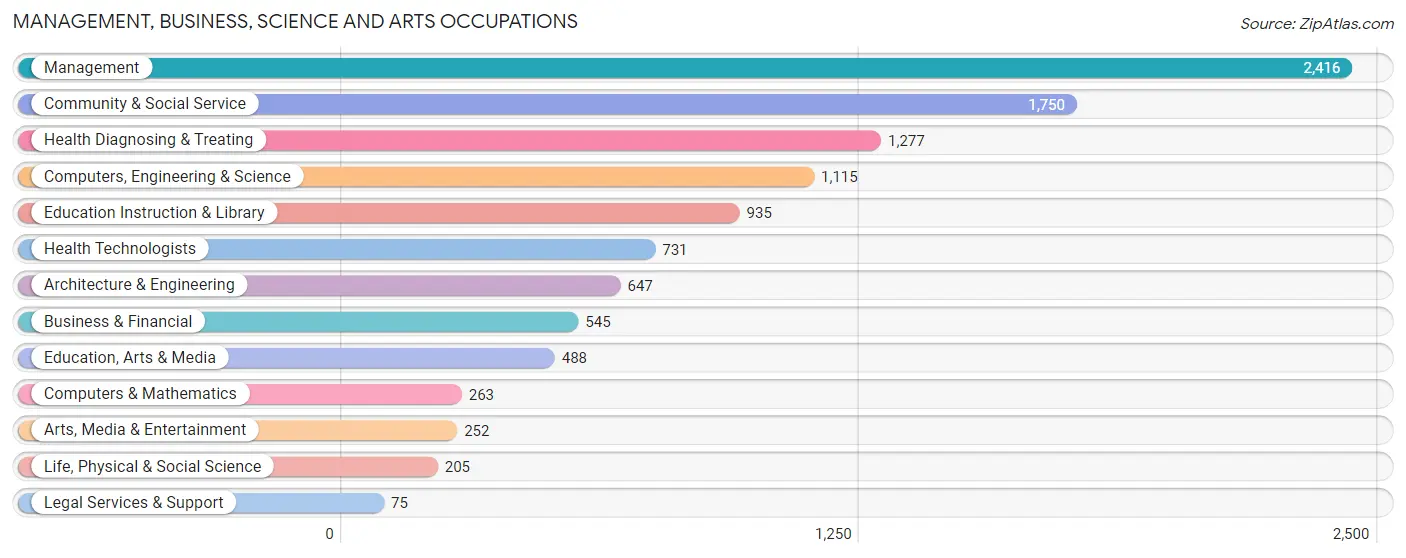
Management, Business, Science and Arts Occupations by Sex
Within the Management, Business, Science and Arts occupations in St. Joseph County, the most male-oriented occupations are Architecture & Engineering (92.0%), Computers, Engineering & Science (80.7%), and Computers & Mathematics (77.6%), while the most female-oriented occupations are Health Technologists (83.0%), Education Instruction & Library (81.9%), and Health Diagnosing & Treating (81.0%).
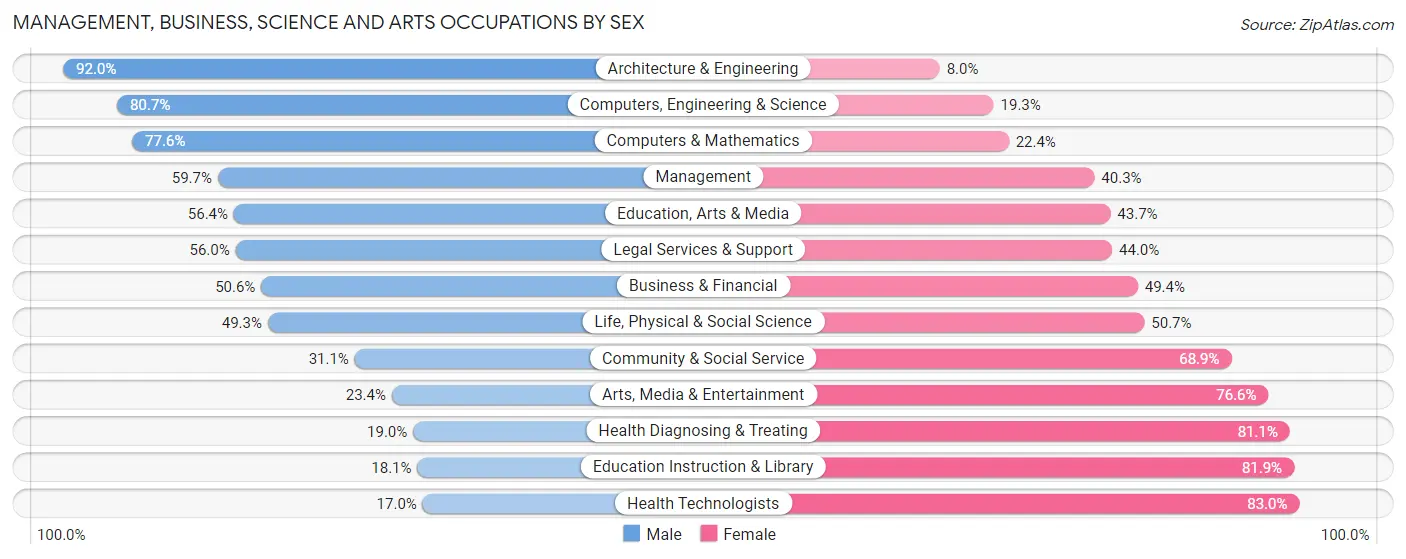
| Occupation | Male | Female |
| Management | 1,442 (59.7%) | 974 (40.3%) |
| Business & Financial | 276 (50.6%) | 269 (49.4%) |
| Computers, Engineering & Science | 900 (80.7%) | 215 (19.3%) |
| Computers & Mathematics | 204 (77.6%) | 59 (22.4%) |
| Architecture & Engineering | 595 (92.0%) | 52 (8.0%) |
| Life, Physical & Social Science | 101 (49.3%) | 104 (50.7%) |
| Community & Social Service | 545 (31.1%) | 1,205 (68.9%) |
| Education, Arts & Media | 275 (56.4%) | 213 (43.6%) |
| Legal Services & Support | 42 (56.0%) | 33 (44.0%) |
| Education Instruction & Library | 169 (18.1%) | 766 (81.9%) |
| Arts, Media & Entertainment | 59 (23.4%) | 193 (76.6%) |
| Health Diagnosing & Treating | 242 (19.0%) | 1,035 (81.0%) |
| Health Technologists | 124 (17.0%) | 607 (83.0%) |
| Total (Category) | 3,405 (47.9%) | 3,698 (52.1%) |
| Total (Overall) | 15,535 (55.6%) | 12,401 (44.4%) |
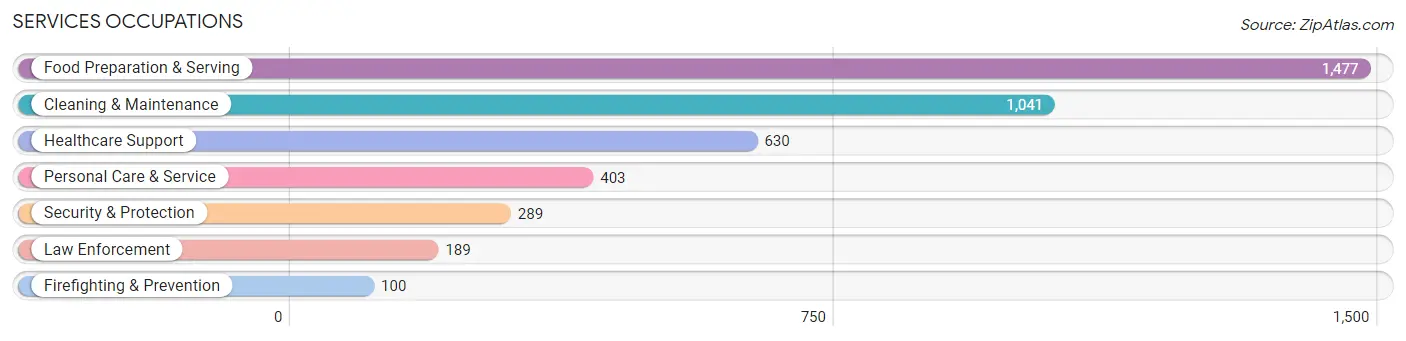
Services Occupations
The most common Services occupations in St. Joseph County are Food Preparation & Serving (1,477 | 5.3%), Cleaning & Maintenance (1,041 | 3.7%), Healthcare Support (630 | 2.3%), Personal Care & Service (403 | 1.4%), and Security & Protection (289 | 1.0%).
Services Occupations by Sex
Within the Services occupations in St. Joseph County, the most male-oriented occupations are Firefighting & Prevention (86.0%), Security & Protection (80.6%), and Law Enforcement (77.8%), while the most female-oriented occupations are Healthcare Support (92.1%), Personal Care & Service (87.1%), and Food Preparation & Serving (71.4%).
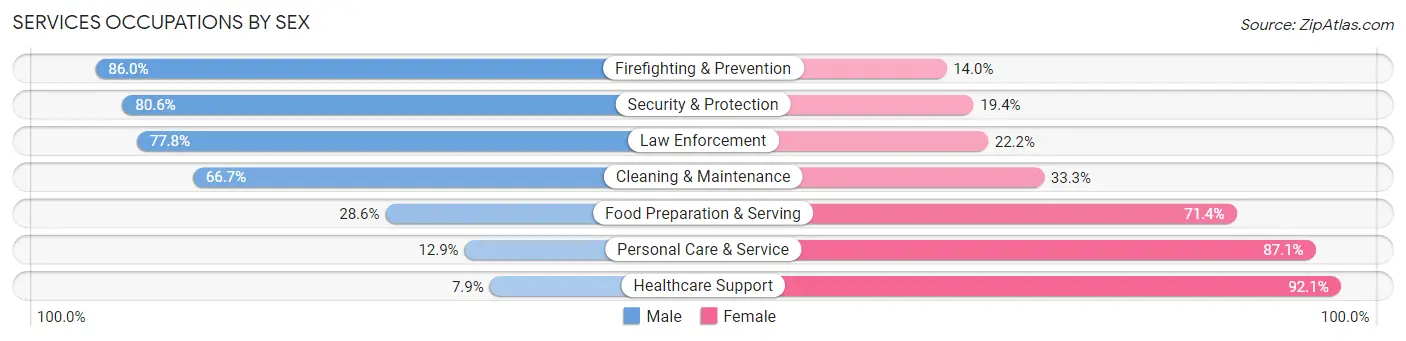
| Occupation | Male | Female |
| Healthcare Support | 50 (7.9%) | 580 (92.1%) |
| Security & Protection | 233 (80.6%) | 56 (19.4%) |
| Firefighting & Prevention | 86 (86.0%) | 14 (14.0%) |
| Law Enforcement | 147 (77.8%) | 42 (22.2%) |
| Food Preparation & Serving | 422 (28.6%) | 1,055 (71.4%) |
| Cleaning & Maintenance | 694 (66.7%) | 347 (33.3%) |
| Personal Care & Service | 52 (12.9%) | 351 (87.1%) |
| Total (Category) | 1,451 (37.8%) | 2,389 (62.2%) |
| Total (Overall) | 15,535 (55.6%) | 12,401 (44.4%) |
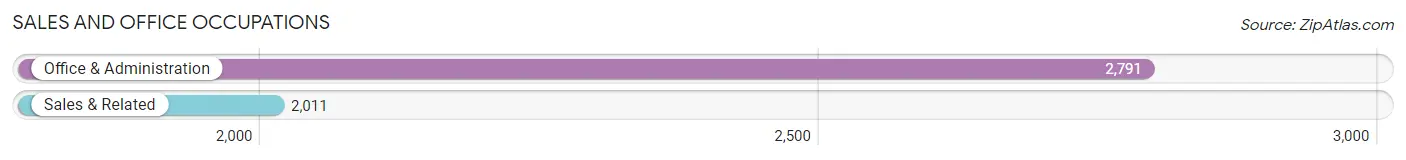
Sales and Office Occupations
The most common Sales and Office occupations in St. Joseph County are Office & Administration (2,791 | 10.0%), and Sales & Related (2,011 | 7.2%).
Sales and Office Occupations by Sex
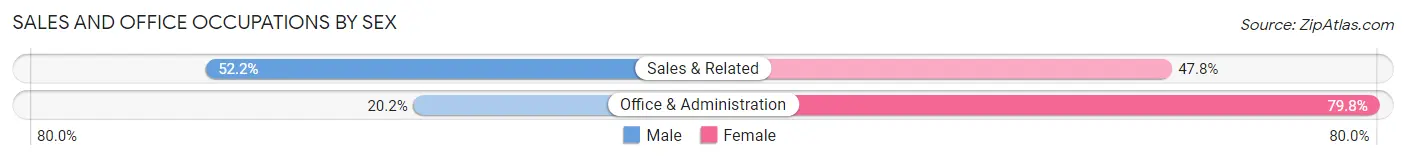
| Occupation | Male | Female |
| Sales & Related | 1,050 (52.2%) | 961 (47.8%) |
| Office & Administration | 563 (20.2%) | 2,228 (79.8%) |
| Total (Category) | 1,613 (33.6%) | 3,189 (66.4%) |
| Total (Overall) | 15,535 (55.6%) | 12,401 (44.4%) |
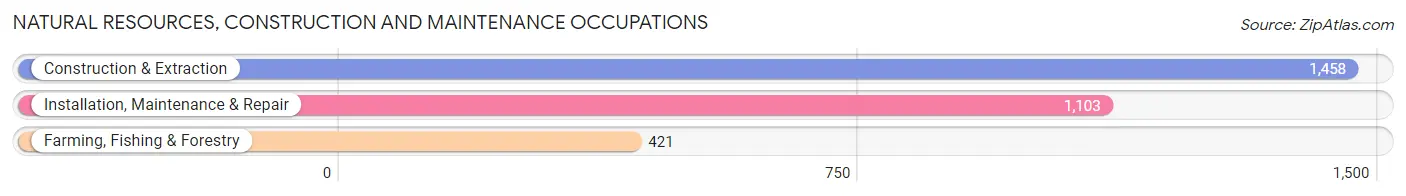
Natural Resources, Construction and Maintenance Occupations
The most common Natural Resources, Construction and Maintenance occupations in St. Joseph County are Construction & Extraction (1,458 | 5.2%), Installation, Maintenance & Repair (1,103 | 4.0%), and Farming, Fishing & Forestry (421 | 1.5%).
Natural Resources, Construction and Maintenance Occupations by Sex
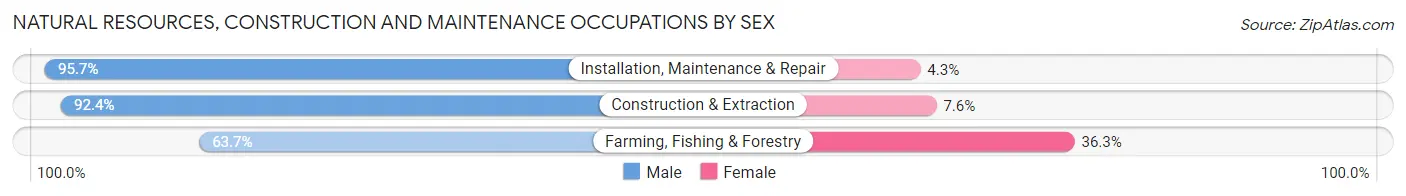
| Occupation | Male | Female |
| Farming, Fishing & Forestry | 268 (63.7%) | 153 (36.3%) |
| Construction & Extraction | 1,347 (92.4%) | 111 (7.6%) |
| Installation, Maintenance & Repair | 1,056 (95.7%) | 47 (4.3%) |
| Total (Category) | 2,671 (89.6%) | 311 (10.4%) |
| Total (Overall) | 15,535 (55.6%) | 12,401 (44.4%) |
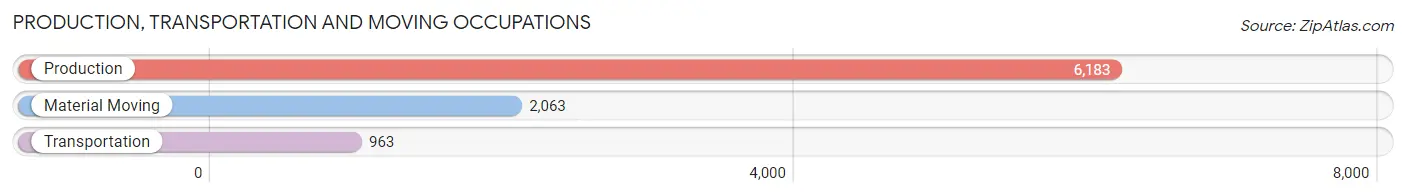
Production, Transportation and Moving Occupations
The most common Production, Transportation and Moving occupations in St. Joseph County are Production (6,183 | 22.1%), Material Moving (2,063 | 7.4%), and Transportation (963 | 3.5%).
Production, Transportation and Moving Occupations by Sex
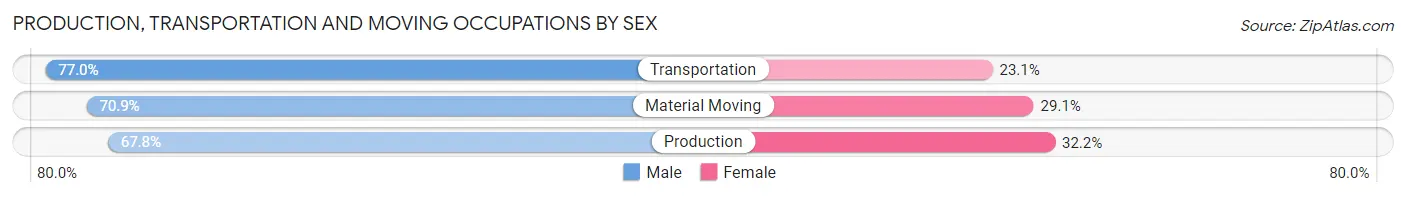
| Occupation | Male | Female |
| Production | 4,191 (67.8%) | 1,992 (32.2%) |
| Transportation | 741 (76.9%) | 222 (23.1%) |
| Material Moving | 1,463 (70.9%) | 600 (29.1%) |
| Total (Category) | 6,395 (69.4%) | 2,814 (30.6%) |
| Total (Overall) | 15,535 (55.6%) | 12,401 (44.4%) |
Employment Industries by Sex in St. Joseph County
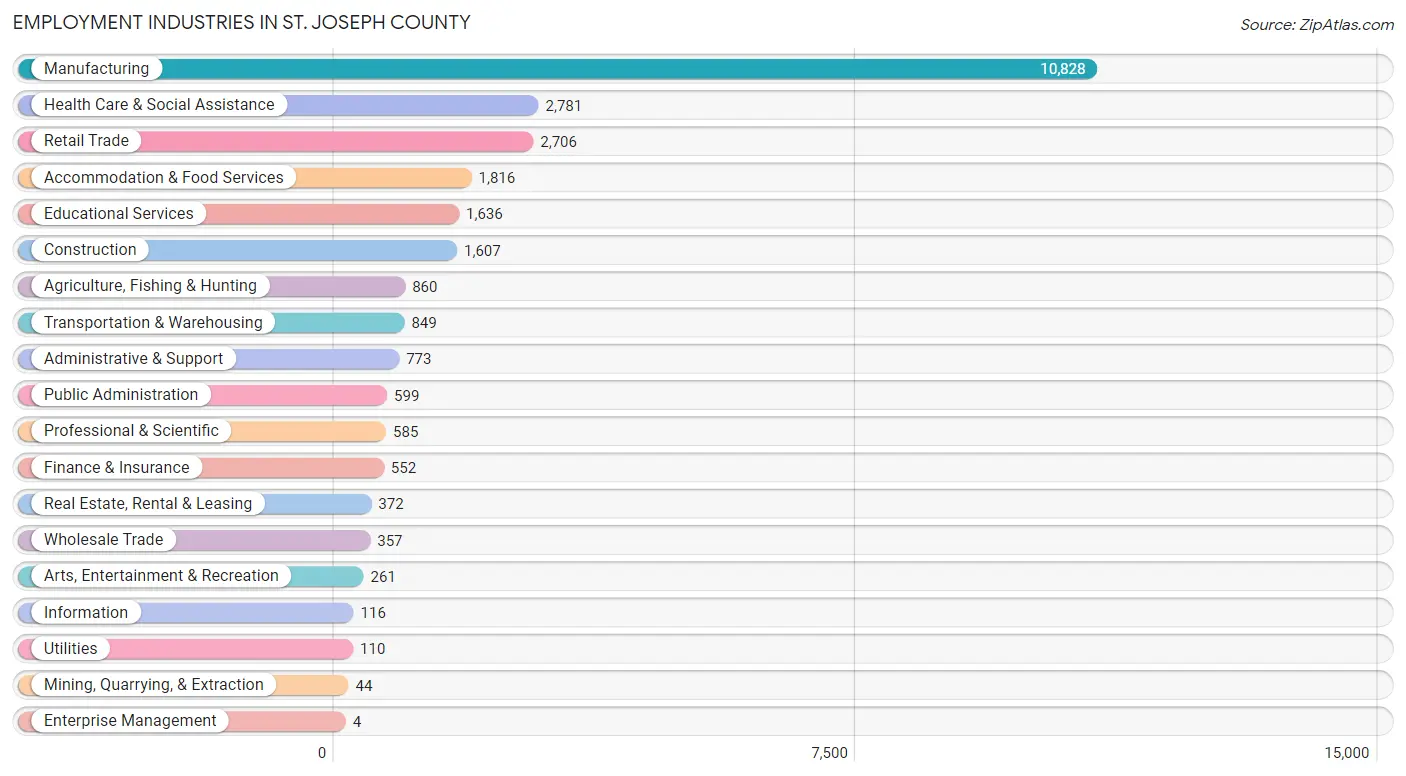
Employment Industries in St. Joseph County
The major employment industries in St. Joseph County include Manufacturing (10,828 | 38.8%), Health Care & Social Assistance (2,781 | 10.0%), Retail Trade (2,706 | 9.7%), Accommodation & Food Services (1,816 | 6.5%), and Educational Services (1,636 | 5.9%).
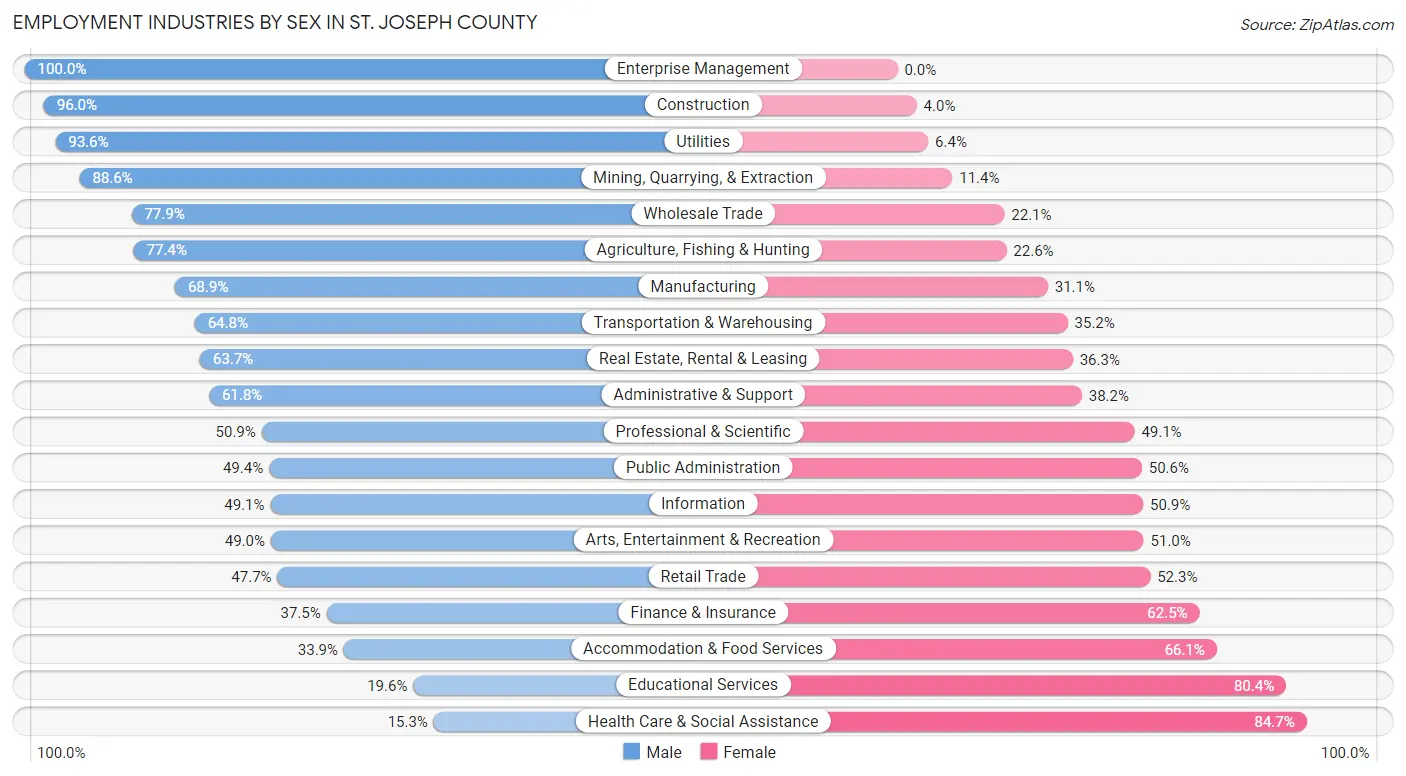
Employment Industries by Sex in St. Joseph County
The St. Joseph County industries that see more men than women are Enterprise Management (100.0%), Construction (96.0%), and Utilities (93.6%), whereas the industries that tend to have a higher number of women are Health Care & Social Assistance (84.7%), Educational Services (80.4%), and Accommodation & Food Services (66.1%).
| Industry | Male | Female |
| Agriculture, Fishing & Hunting | 666 (77.4%) | 194 (22.6%) |
| Mining, Quarrying, & Extraction | 39 (88.6%) | 5 (11.4%) |
| Construction | 1,543 (96.0%) | 64 (4.0%) |
| Manufacturing | 7,457 (68.9%) | 3,371 (31.1%) |
| Wholesale Trade | 278 (77.9%) | 79 (22.1%) |
| Retail Trade | 1,290 (47.7%) | 1,416 (52.3%) |
| Transportation & Warehousing | 550 (64.8%) | 299 (35.2%) |
| Utilities | 103 (93.6%) | 7 (6.4%) |
| Information | 57 (49.1%) | 59 (50.9%) |
| Finance & Insurance | 207 (37.5%) | 345 (62.5%) |
| Real Estate, Rental & Leasing | 237 (63.7%) | 135 (36.3%) |
| Professional & Scientific | 298 (50.9%) | 287 (49.1%) |
| Enterprise Management | 4 (100.0%) | 0 (0.0%) |
| Administrative & Support | 478 (61.8%) | 295 (38.2%) |
| Educational Services | 320 (19.6%) | 1,316 (80.4%) |
| Health Care & Social Assistance | 426 (15.3%) | 2,355 (84.7%) |
| Arts, Entertainment & Recreation | 128 (49.0%) | 133 (51.0%) |
| Accommodation & Food Services | 616 (33.9%) | 1,200 (66.1%) |
| Public Administration | 296 (49.4%) | 303 (50.6%) |
| Total | 15,535 (55.6%) | 12,401 (44.4%) |
Education in St. Joseph County
School Enrollment in St. Joseph County
The most common levels of schooling among the 13,250 students in St. Joseph County are elementary school (3,490 | 26.3%), high school (3,394 | 25.6%), and middle school (3,225 | 24.3%).
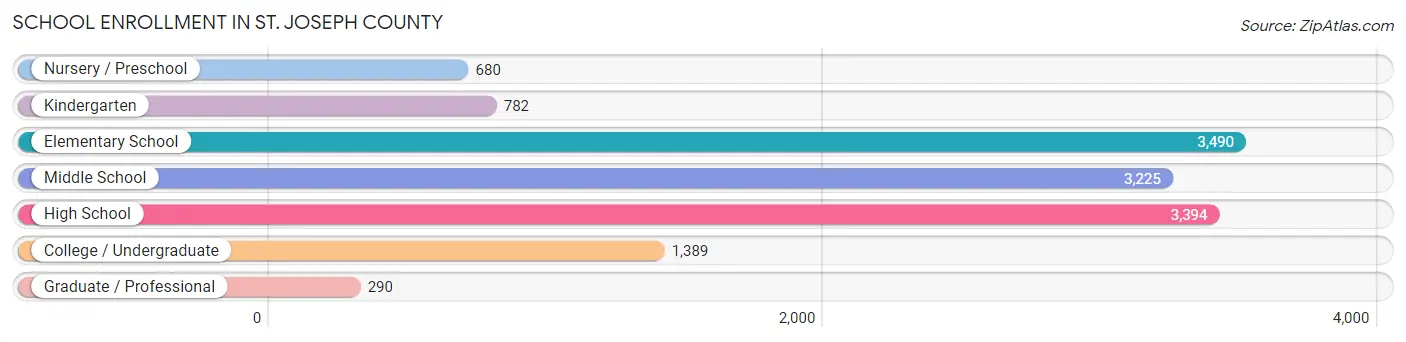
| School Level | # Students | % Students |
| Nursery / Preschool | 680 | 5.1% |
| Kindergarten | 782 | 5.9% |
| Elementary School | 3,490 | 26.3% |
| Middle School | 3,225 | 24.3% |
| High School | 3,394 | 25.6% |
| College / Undergraduate | 1,389 | 10.5% |
| Graduate / Professional | 290 | 2.2% |
| Total | 13,250 | 100.0% |
School Enrollment by Age by Funding Source in St. Joseph County
Out of a total of 13,250 students who are enrolled in schools in St. Joseph County, 1,776 (13.4%) attend a private institution, while the remaining 11,474 (86.6%) are enrolled in public schools. The age group of 3 to 4 year olds has the highest likelihood of being enrolled in private schools, with 270 (55.7% in the age bracket) enrolled. Conversely, the age group of 15 to 17 year olds has the lowest likelihood of being enrolled in a private school, with 2,254 (95.2% in the age bracket) attending a public institution.
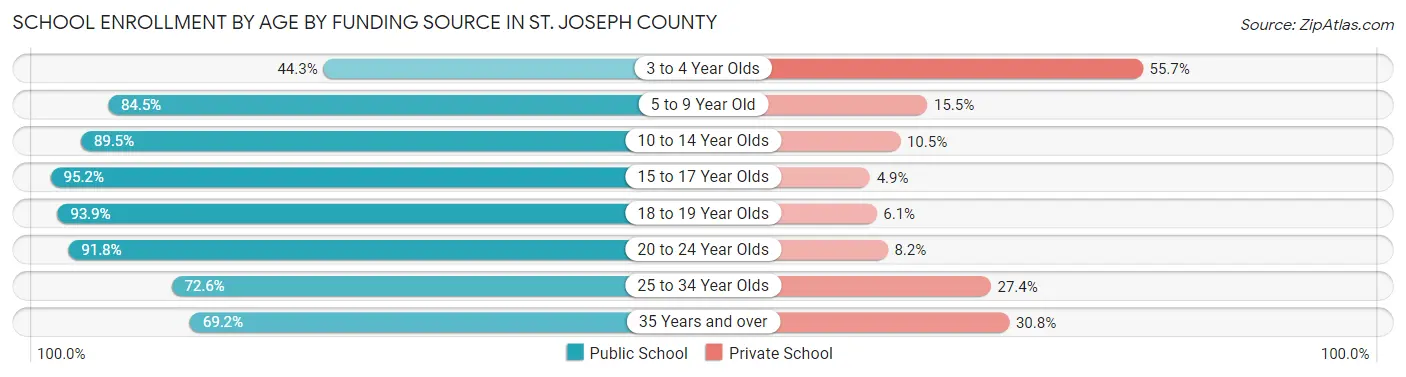
| Age Bracket | Public School | Private School |
| 3 to 4 Year Olds | 215 (44.3%) | 270 (55.7%) |
| 5 to 9 Year Old | 3,371 (84.5%) | 620 (15.5%) |
| 10 to 14 Year Olds | 3,558 (89.5%) | 417 (10.5%) |
| 15 to 17 Year Olds | 2,254 (95.2%) | 115 (4.9%) |
| 18 to 19 Year Olds | 833 (93.9%) | 54 (6.1%) |
| 20 to 24 Year Olds | 675 (91.8%) | 60 (8.2%) |
| 25 to 34 Year Olds | 292 (72.6%) | 110 (27.4%) |
| 35 Years and over | 281 (69.2%) | 125 (30.8%) |
| Total | 11,474 (86.6%) | 1,776 (13.4%) |
Educational Attainment by Field of Study in St. Joseph County
Education (1,658 | 21.3%), business (1,577 | 20.3%), science & technology (858 | 11.0%), social sciences (511 | 6.6%), and arts & humanities (483 | 6.2%) are the most common fields of study among 7,775 individuals in St. Joseph County who have obtained a bachelor's degree or higher.
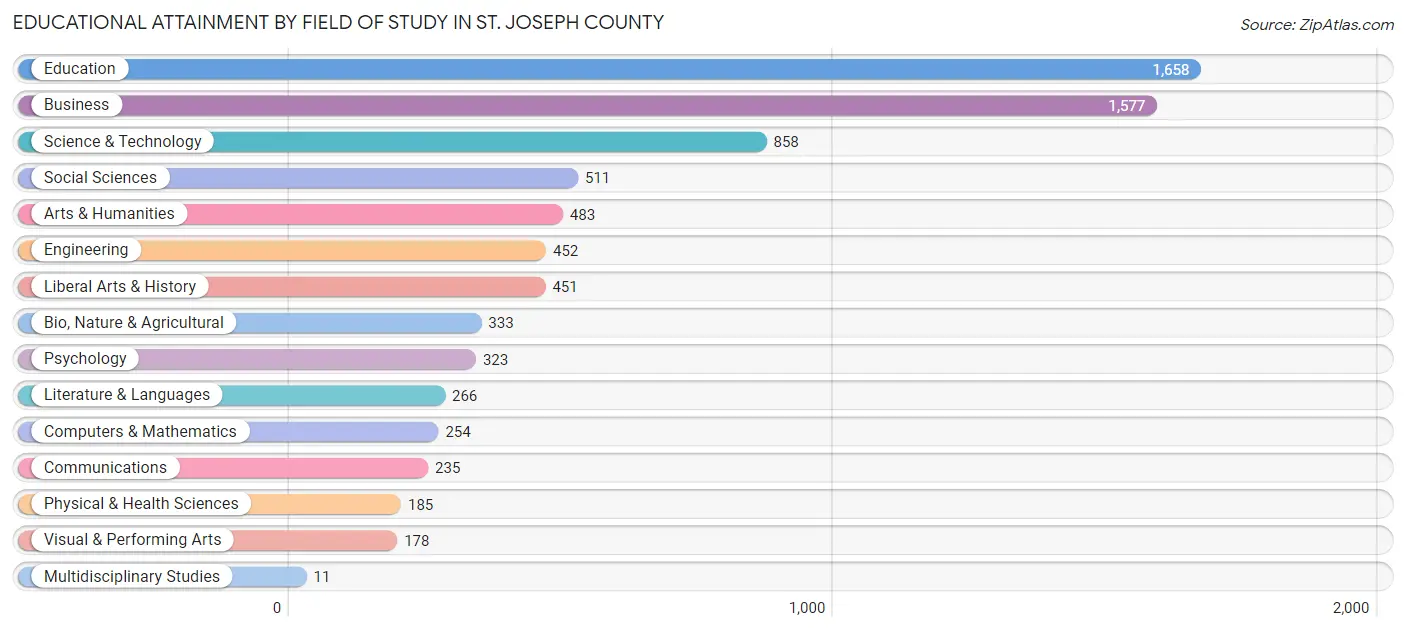
| Field of Study | # Graduates | % Graduates |
| Computers & Mathematics | 254 | 3.3% |
| Bio, Nature & Agricultural | 333 | 4.3% |
| Physical & Health Sciences | 185 | 2.4% |
| Psychology | 323 | 4.2% |
| Social Sciences | 511 | 6.6% |
| Engineering | 452 | 5.8% |
| Multidisciplinary Studies | 11 | 0.1% |
| Science & Technology | 858 | 11.0% |
| Business | 1,577 | 20.3% |
| Education | 1,658 | 21.3% |
| Literature & Languages | 266 | 3.4% |
| Liberal Arts & History | 451 | 5.8% |
| Visual & Performing Arts | 178 | 2.3% |
| Communications | 235 | 3.0% |
| Arts & Humanities | 483 | 6.2% |
| Total | 7,775 | 100.0% |
Transportation & Commute in St. Joseph County
Vehicle Availability by Sex in St. Joseph County
The most prevalent vehicle ownership categories in St. Joseph County are males with 2 vehicles (5,976, accounting for 39.5%) and females with 2 vehicles (4,615, making up 49.5%).
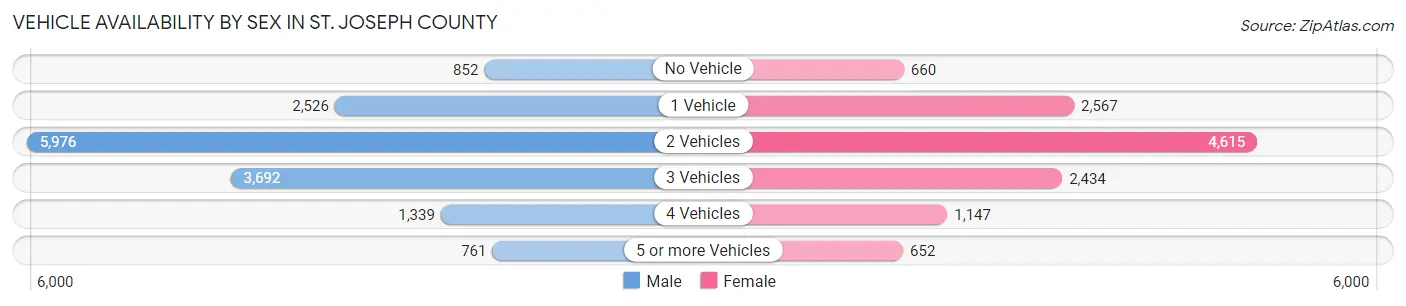
| Vehicles Available | Male | Female |
| No Vehicle | 852 (5.6%) | 660 (5.5%) |
| 1 Vehicle | 2,526 (16.7%) | 2,567 (21.3%) |
| 2 Vehicles | 5,976 (39.5%) | 4,615 (38.2%) |
| 3 Vehicles | 3,692 (24.4%) | 2,434 (20.2%) |
| 4 Vehicles | 1,339 (8.8%) | 1,147 (9.5%) |
| 5 or more Vehicles | 761 (5.0%) | 652 (5.4%) |
| Total | 15,146 (100.0%) | 12,075 (100.0%) |
Commute Time in St. Joseph County
The most frequently occuring commute durations in St. Joseph County are 5 to 9 minutes (4,908 commuters, 19.1%), 10 to 14 minutes (4,230 commuters, 16.5%), and 15 to 19 minutes (3,622 commuters, 14.1%).
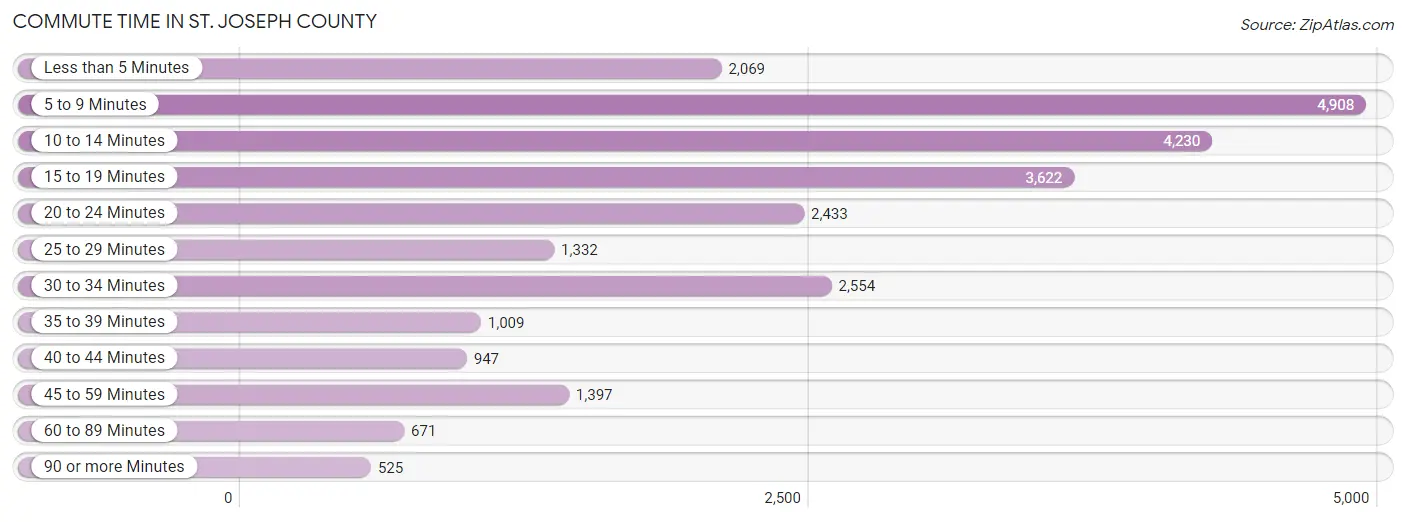
| Commute Time | # Commuters | % Commuters |
| Less than 5 Minutes | 2,069 | 8.1% |
| 5 to 9 Minutes | 4,908 | 19.1% |
| 10 to 14 Minutes | 4,230 | 16.5% |
| 15 to 19 Minutes | 3,622 | 14.1% |
| 20 to 24 Minutes | 2,433 | 9.5% |
| 25 to 29 Minutes | 1,332 | 5.2% |
| 30 to 34 Minutes | 2,554 | 9.9% |
| 35 to 39 Minutes | 1,009 | 3.9% |
| 40 to 44 Minutes | 947 | 3.7% |
| 45 to 59 Minutes | 1,397 | 5.4% |
| 60 to 89 Minutes | 671 | 2.6% |
| 90 or more Minutes | 525 | 2.0% |
Commute Time by Sex in St. Joseph County
The most common commute times in St. Joseph County are 5 to 9 minutes (2,442 commuters, 17.1%) for males and 5 to 9 minutes (2,466 commuters, 21.6%) for females.
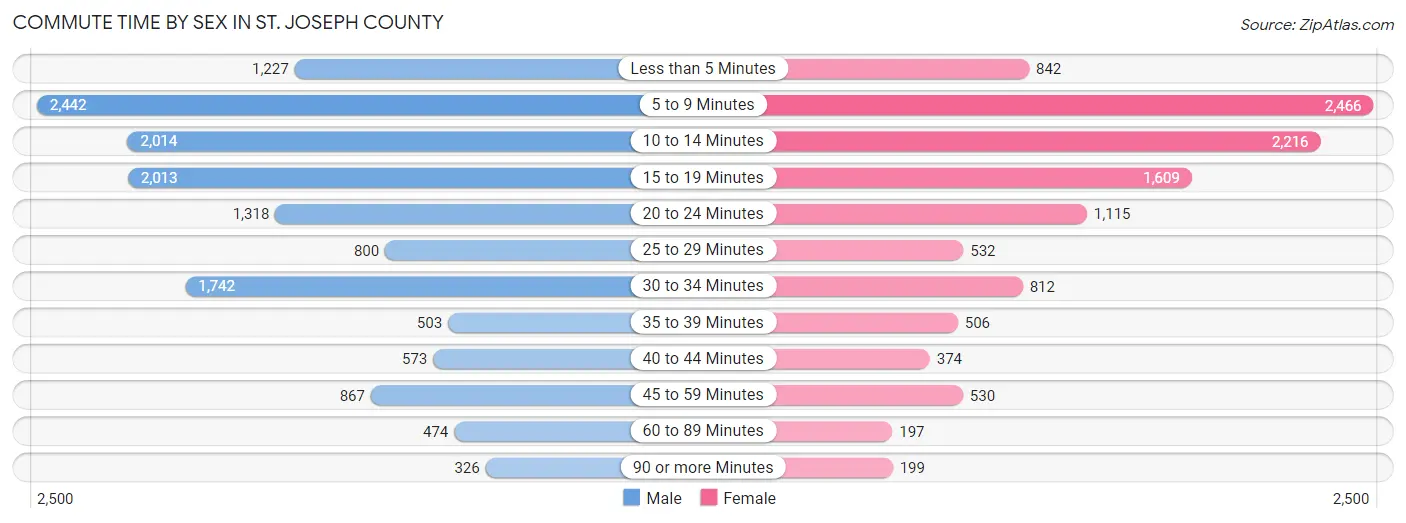
| Commute Time | Male | Female |
| Less than 5 Minutes | 1,227 (8.6%) | 842 (7.4%) |
| 5 to 9 Minutes | 2,442 (17.1%) | 2,466 (21.6%) |
| 10 to 14 Minutes | 2,014 (14.1%) | 2,216 (19.4%) |
| 15 to 19 Minutes | 2,013 (14.1%) | 1,609 (14.1%) |
| 20 to 24 Minutes | 1,318 (9.2%) | 1,115 (9.8%) |
| 25 to 29 Minutes | 800 (5.6%) | 532 (4.7%) |
| 30 to 34 Minutes | 1,742 (12.2%) | 812 (7.1%) |
| 35 to 39 Minutes | 503 (3.5%) | 506 (4.4%) |
| 40 to 44 Minutes | 573 (4.0%) | 374 (3.3%) |
| 45 to 59 Minutes | 867 (6.1%) | 530 (4.6%) |
| 60 to 89 Minutes | 474 (3.3%) | 197 (1.7%) |
| 90 or more Minutes | 326 (2.3%) | 199 (1.8%) |
Time of Departure to Work by Sex in St. Joseph County
The most frequent times of departure to work in St. Joseph County are 12:00 AM to 4:59 AM (2,564, 17.9%) for males and 7:30 AM to 7:59 AM (1,346, 11.8%) for females.
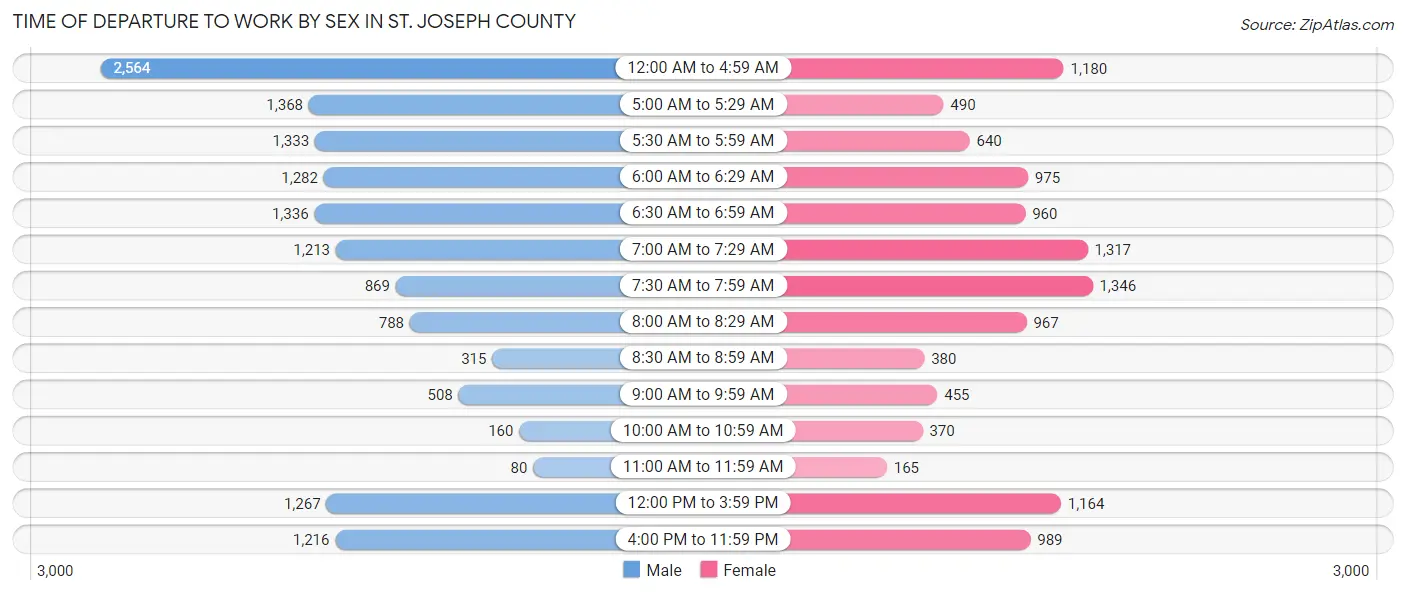
| Time of Departure | Male | Female |
| 12:00 AM to 4:59 AM | 2,564 (17.9%) | 1,180 (10.3%) |
| 5:00 AM to 5:29 AM | 1,368 (9.6%) | 490 (4.3%) |
| 5:30 AM to 5:59 AM | 1,333 (9.3%) | 640 (5.6%) |
| 6:00 AM to 6:29 AM | 1,282 (9.0%) | 975 (8.6%) |
| 6:30 AM to 6:59 AM | 1,336 (9.3%) | 960 (8.4%) |
| 7:00 AM to 7:29 AM | 1,213 (8.5%) | 1,317 (11.6%) |
| 7:30 AM to 7:59 AM | 869 (6.1%) | 1,346 (11.8%) |
| 8:00 AM to 8:29 AM | 788 (5.5%) | 967 (8.5%) |
| 8:30 AM to 8:59 AM | 315 (2.2%) | 380 (3.3%) |
| 9:00 AM to 9:59 AM | 508 (3.5%) | 455 (4.0%) |
| 10:00 AM to 10:59 AM | 160 (1.1%) | 370 (3.3%) |
| 11:00 AM to 11:59 AM | 80 (0.6%) | 165 (1.5%) |
| 12:00 PM to 3:59 PM | 1,267 (8.9%) | 1,164 (10.2%) |
| 4:00 PM to 11:59 PM | 1,216 (8.5%) | 989 (8.7%) |
| Total | 14,299 (100.0%) | 11,398 (100.0%) |
Housing Occupancy in St. Joseph County
Occupancy by Ownership in St. Joseph County
Of the total 23,478 dwellings in St. Joseph County, owner-occupied units account for 17,494 (74.5%), while renter-occupied units make up 5,984 (25.5%).
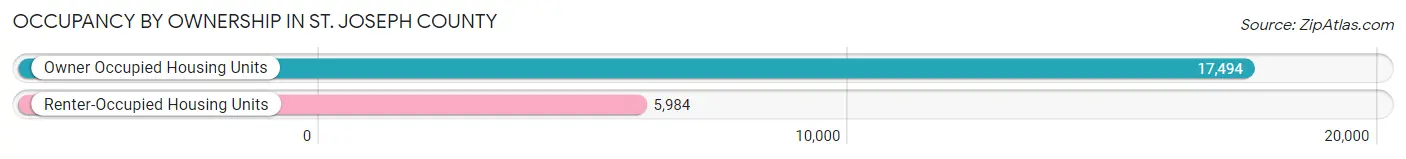
| Occupancy | # Housing Units | % Housing Units |
| Owner Occupied Housing Units | 17,494 | 74.5% |
| Renter-Occupied Housing Units | 5,984 | 25.5% |
| Total Occupied Housing Units | 23,478 | 100.0% |
Occupancy by Household Size in St. Joseph County
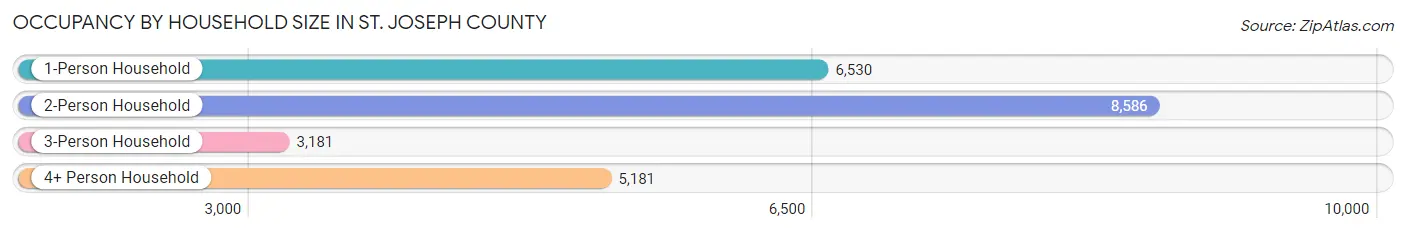
| Household Size | # Housing Units | % Housing Units |
| 1-Person Household | 6,530 | 27.8% |
| 2-Person Household | 8,586 | 36.6% |
| 3-Person Household | 3,181 | 13.6% |
| 4+ Person Household | 5,181 | 22.1% |
| Total Housing Units | 23,478 | 100.0% |
Occupancy by Ownership by Household Size in St. Joseph County
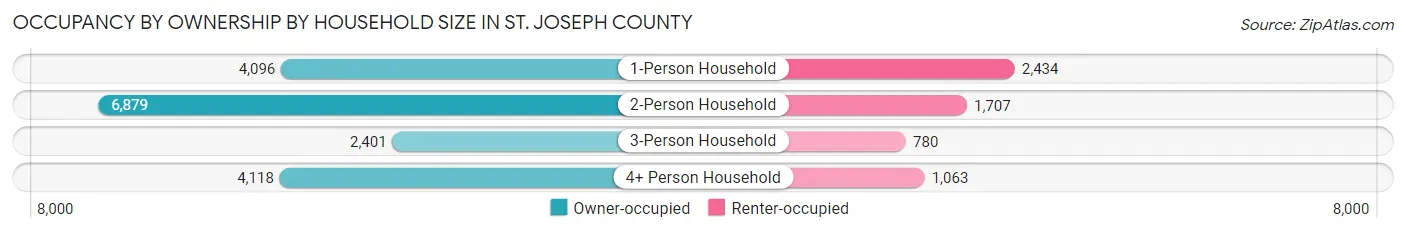
| Household Size | Owner-occupied | Renter-occupied |
| 1-Person Household | 4,096 (62.7%) | 2,434 (37.3%) |
| 2-Person Household | 6,879 (80.1%) | 1,707 (19.9%) |
| 3-Person Household | 2,401 (75.5%) | 780 (24.5%) |
| 4+ Person Household | 4,118 (79.5%) | 1,063 (20.5%) |
| Total Housing Units | 17,494 (74.5%) | 5,984 (25.5%) |
Occupancy by Educational Attainment in St. Joseph County
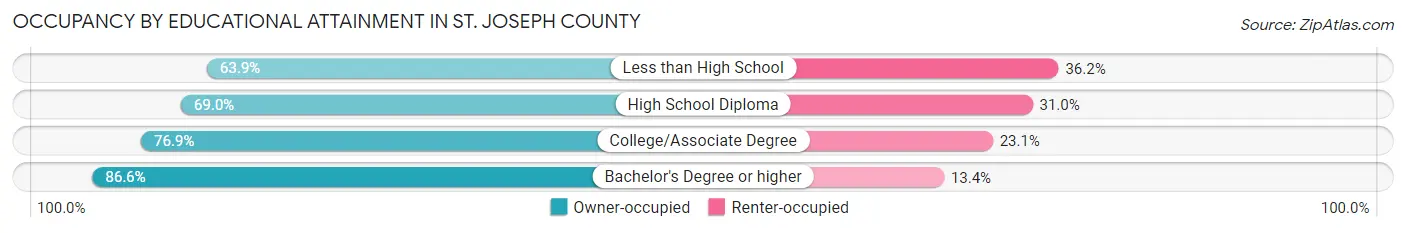
| Household Size | Owner-occupied | Renter-occupied |
| Less than High School | 1,657 (63.8%) | 938 (36.1%) |
| High School Diploma | 5,580 (69.0%) | 2,507 (31.0%) |
| College/Associate Degree | 6,522 (76.9%) | 1,959 (23.1%) |
| Bachelor's Degree or higher | 3,735 (86.6%) | 580 (13.4%) |
Occupancy by Age of Householder in St. Joseph County
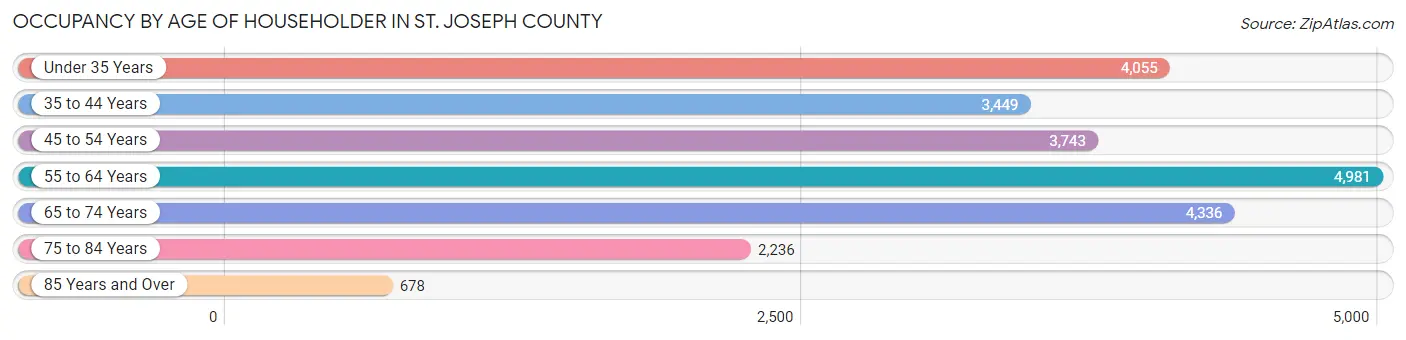
| Age Bracket | # Households | % Households |
| Under 35 Years | 4,055 | 17.3% |
| 35 to 44 Years | 3,449 | 14.7% |
| 45 to 54 Years | 3,743 | 15.9% |
| 55 to 64 Years | 4,981 | 21.2% |
| 65 to 74 Years | 4,336 | 18.5% |
| 75 to 84 Years | 2,236 | 9.5% |
| 85 Years and Over | 678 | 2.9% |
| Total | 23,478 | 100.0% |
Housing Finances in St. Joseph County
Median Income by Occupancy in St. Joseph County
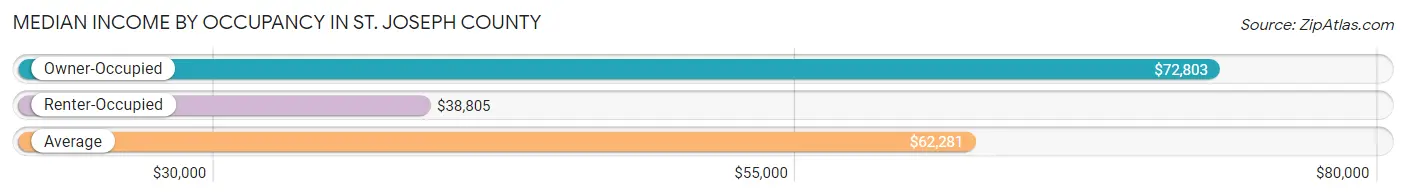
| Occupancy Type | # Households | Median Income |
| Owner-Occupied | 17,494 (74.5%) | $72,803 |
| Renter-Occupied | 5,984 (25.5%) | $38,805 |
| Average | 23,478 (100.0%) | $62,281 |
Occupancy by Householder Income Bracket in St. Joseph County
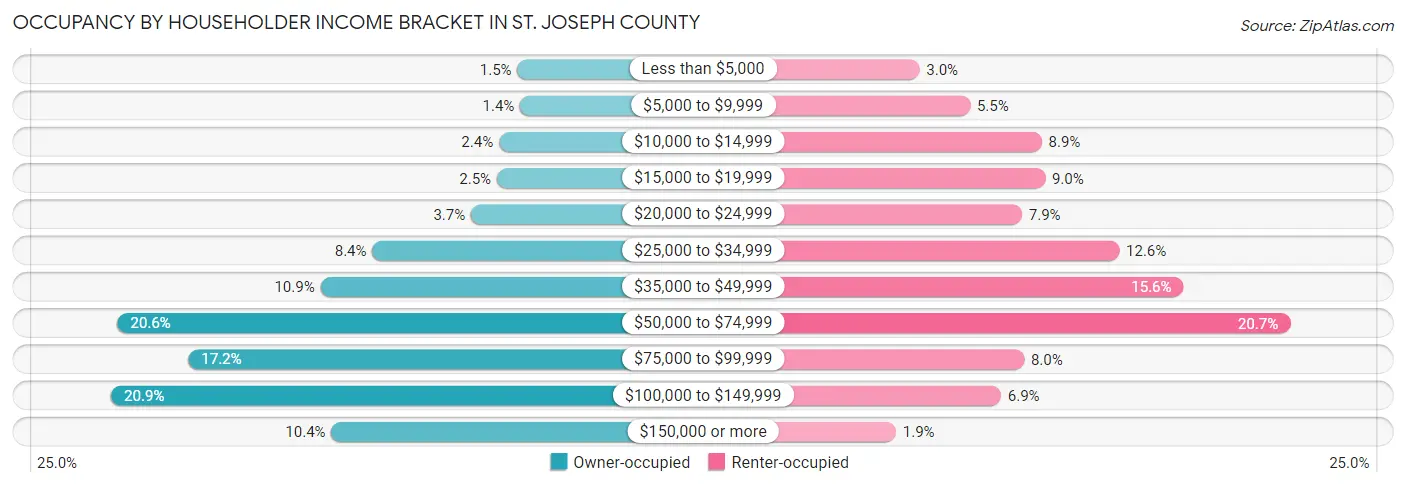
| Income Bracket | Owner-occupied | Renter-occupied |
| Less than $5,000 | 268 (1.5%) | 182 (3.0%) |
| $5,000 to $9,999 | 245 (1.4%) | 326 (5.4%) |
| $10,000 to $14,999 | 422 (2.4%) | 530 (8.9%) |
| $15,000 to $19,999 | 439 (2.5%) | 540 (9.0%) |
| $20,000 to $24,999 | 655 (3.7%) | 474 (7.9%) |
| $25,000 to $34,999 | 1,477 (8.4%) | 751 (12.6%) |
| $35,000 to $49,999 | 1,909 (10.9%) | 934 (15.6%) |
| $50,000 to $74,999 | 3,600 (20.6%) | 1,238 (20.7%) |
| $75,000 to $99,999 | 3,009 (17.2%) | 480 (8.0%) |
| $100,000 to $149,999 | 3,653 (20.9%) | 414 (6.9%) |
| $150,000 or more | 1,817 (10.4%) | 115 (1.9%) |
| Total | 17,494 (100.0%) | 5,984 (100.0%) |
Monthly Housing Cost Tiers in St. Joseph County
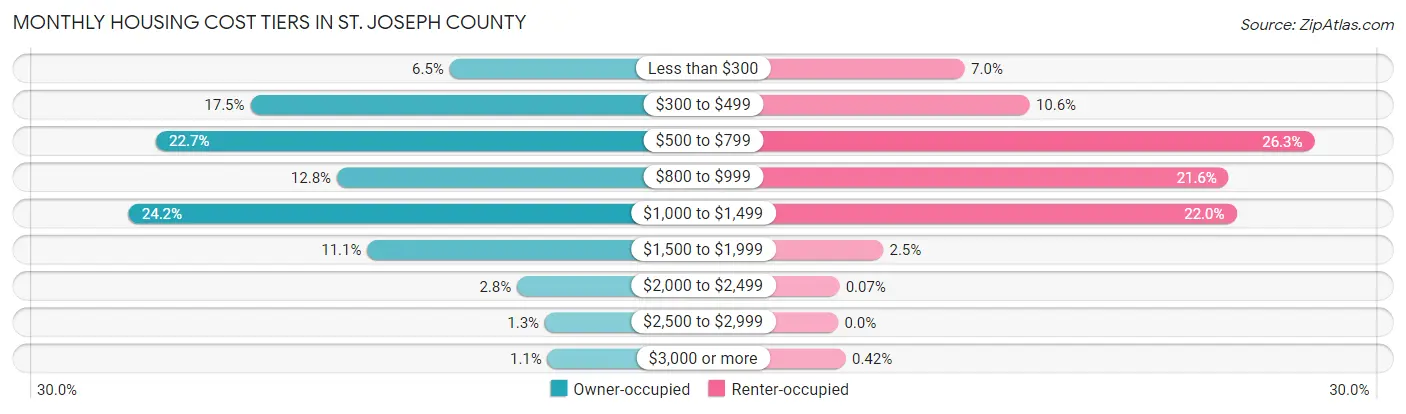
| Monthly Cost | Owner-occupied | Renter-occupied |
| Less than $300 | 1,141 (6.5%) | 419 (7.0%) |
| $300 to $499 | 3,066 (17.5%) | 633 (10.6%) |
| $500 to $799 | 3,976 (22.7%) | 1,576 (26.3%) |
| $800 to $999 | 2,230 (12.8%) | 1,293 (21.6%) |
| $1,000 to $1,499 | 4,240 (24.2%) | 1,318 (22.0%) |
| $1,500 to $1,999 | 1,937 (11.1%) | 149 (2.5%) |
| $2,000 to $2,499 | 490 (2.8%) | 4 (0.1%) |
| $2,500 to $2,999 | 220 (1.3%) | 0 (0.0%) |
| $3,000 or more | 194 (1.1%) | 25 (0.4%) |
| Total | 17,494 (100.0%) | 5,984 (100.0%) |
Physical Housing Characteristics in St. Joseph County
Housing Structures in St. Joseph County
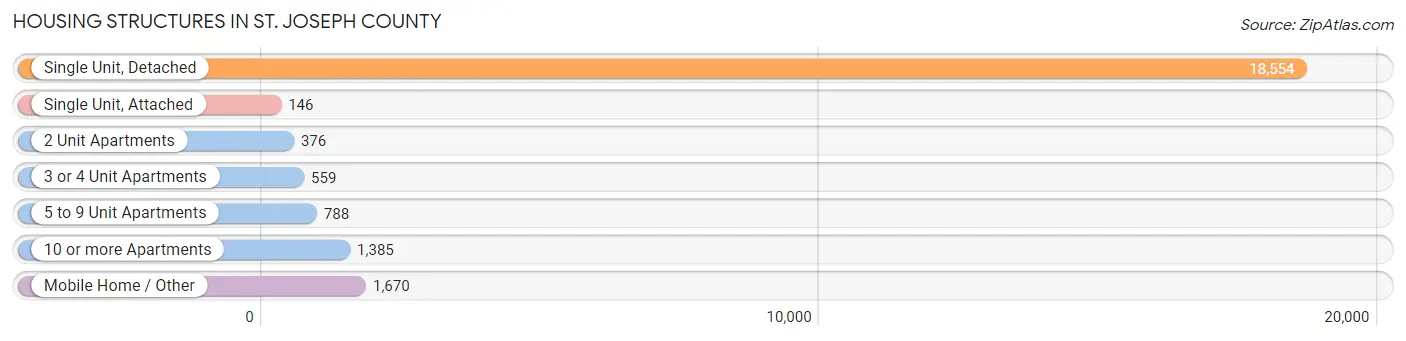
| Structure Type | # Housing Units | % Housing Units |
| Single Unit, Detached | 18,554 | 79.0% |
| Single Unit, Attached | 146 | 0.6% |
| 2 Unit Apartments | 376 | 1.6% |
| 3 or 4 Unit Apartments | 559 | 2.4% |
| 5 to 9 Unit Apartments | 788 | 3.4% |
| 10 or more Apartments | 1,385 | 5.9% |
| Mobile Home / Other | 1,670 | 7.1% |
| Total | 23,478 | 100.0% |
Housing Structures by Occupancy in St. Joseph County
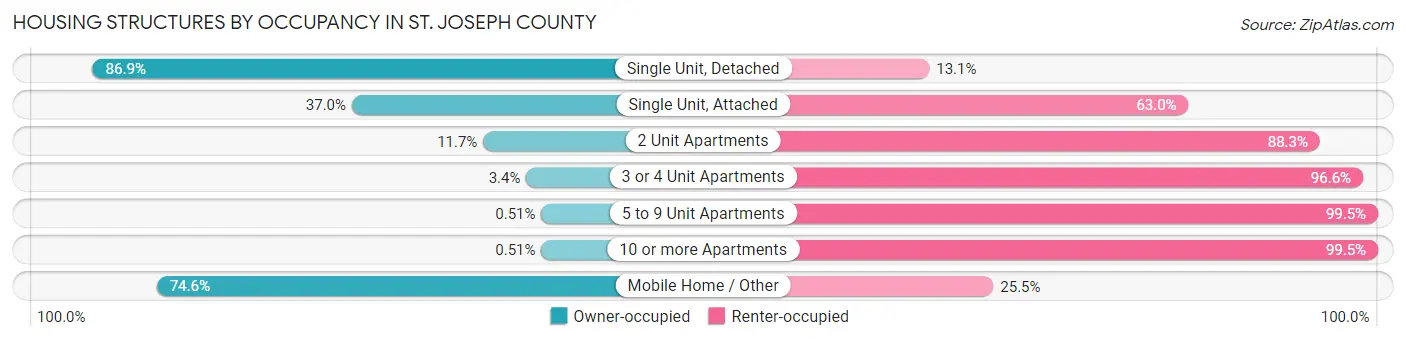
| Structure Type | Owner-occupied | Renter-occupied |
| Single Unit, Detached | 16,121 (86.9%) | 2,433 (13.1%) |
| Single Unit, Attached | 54 (37.0%) | 92 (63.0%) |
| 2 Unit Apartments | 44 (11.7%) | 332 (88.3%) |
| 3 or 4 Unit Apartments | 19 (3.4%) | 540 (96.6%) |
| 5 to 9 Unit Apartments | 4 (0.5%) | 784 (99.5%) |
| 10 or more Apartments | 7 (0.5%) | 1,378 (99.5%) |
| Mobile Home / Other | 1,245 (74.6%) | 425 (25.5%) |
| Total | 17,494 (74.5%) | 5,984 (25.5%) |
Housing Structures by Number of Rooms in St. Joseph County
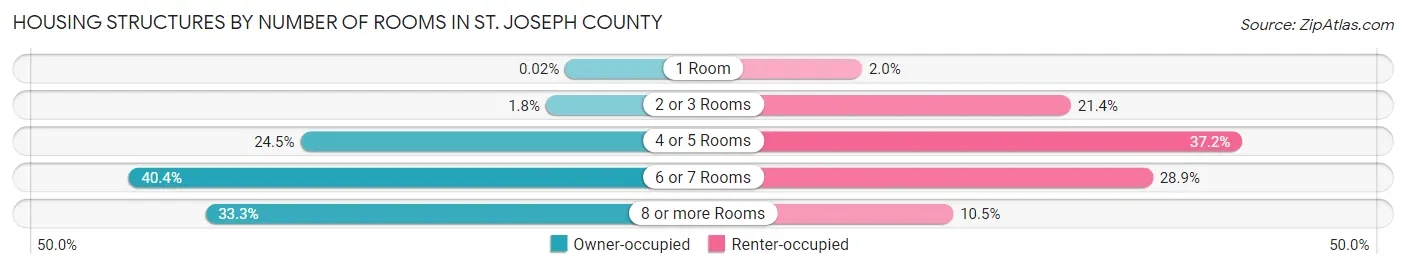
| Number of Rooms | Owner-occupied | Renter-occupied |
| 1 Room | 4 (0.0%) | 122 (2.0%) |
| 2 or 3 Rooms | 315 (1.8%) | 1,278 (21.4%) |
| 4 or 5 Rooms | 4,287 (24.5%) | 2,226 (37.2%) |
| 6 or 7 Rooms | 7,065 (40.4%) | 1,731 (28.9%) |
| 8 or more Rooms | 5,823 (33.3%) | 627 (10.5%) |
| Total | 17,494 (100.0%) | 5,984 (100.0%) |
Housing Structure by Heating Type in St. Joseph County
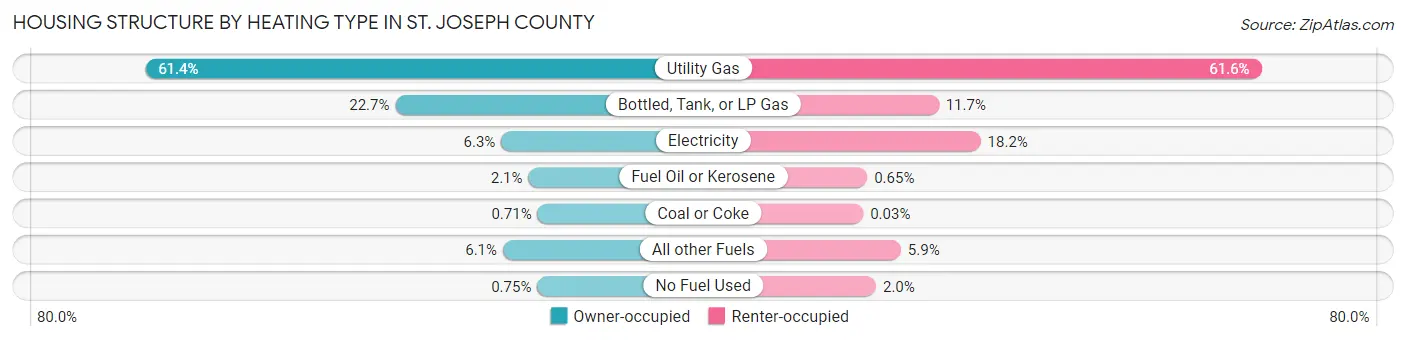
| Heating Type | Owner-occupied | Renter-occupied |
| Utility Gas | 10,732 (61.4%) | 3,685 (61.6%) |
| Bottled, Tank, or LP Gas | 3,970 (22.7%) | 700 (11.7%) |
| Electricity | 1,105 (6.3%) | 1,088 (18.2%) |
| Fuel Oil or Kerosene | 371 (2.1%) | 39 (0.6%) |
| Coal or Coke | 125 (0.7%) | 2 (0.0%) |
| All other Fuels | 1,060 (6.1%) | 350 (5.9%) |
| No Fuel Used | 131 (0.7%) | 120 (2.0%) |
| Total | 17,494 (100.0%) | 5,984 (100.0%) |
Household Vehicle Usage in St. Joseph County
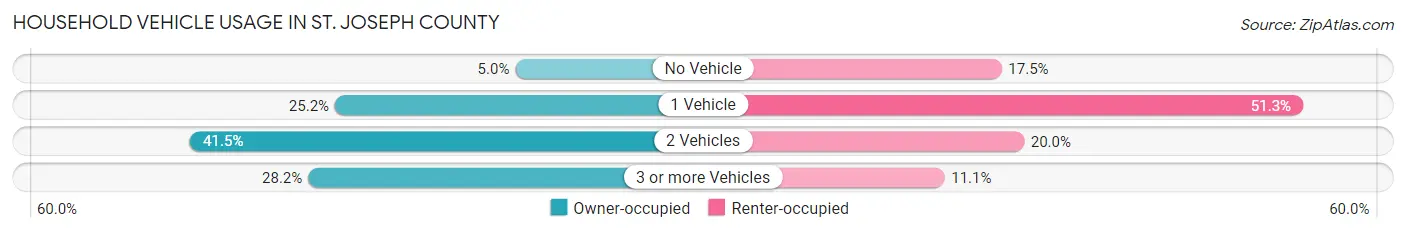
| Vehicles per Household | Owner-occupied | Renter-occupied |
| No Vehicle | 882 (5.0%) | 1,049 (17.5%) |
| 1 Vehicle | 4,416 (25.2%) | 3,070 (51.3%) |
| 2 Vehicles | 7,255 (41.5%) | 1,199 (20.0%) |
| 3 or more Vehicles | 4,941 (28.2%) | 666 (11.1%) |
| Total | 17,494 (100.0%) | 5,984 (100.0%) |
Real Estate & Mortgages in St. Joseph County
Real Estate and Mortgage Overview in St. Joseph County
| Characteristic | Without Mortgage | With Mortgage |
| Housing Units | 7,496 | 9,998 |
| Median Property Value | $143,000 | $158,800 |
| Median Household Income | $60,042 | $1,145 |
| Monthly Housing Costs | $479 | $175 |
| Real Estate Taxes | $1,722 | $383 |
Property Value by Mortgage Status in St. Joseph County
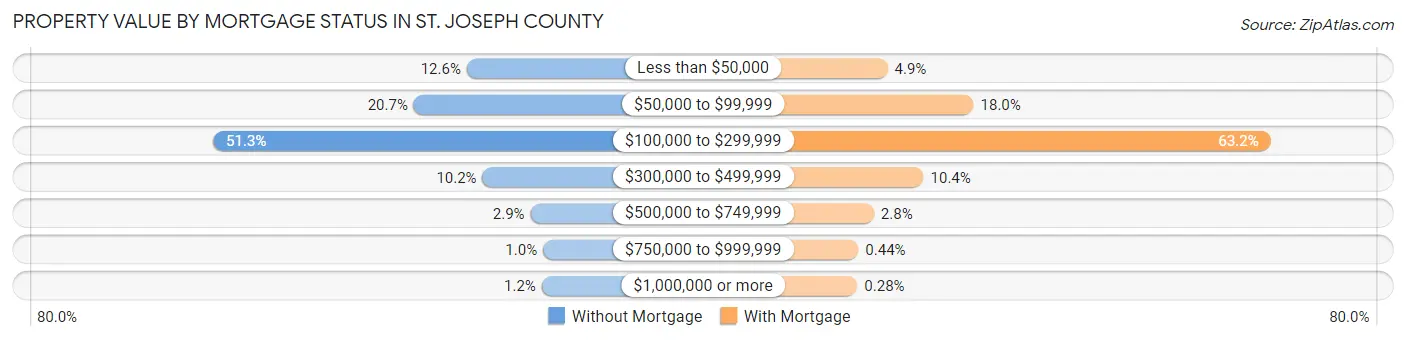
| Property Value | Without Mortgage | With Mortgage |
| Less than $50,000 | 947 (12.6%) | 488 (4.9%) |
| $50,000 to $99,999 | 1,552 (20.7%) | 1,799 (18.0%) |
| $100,000 to $299,999 | 3,844 (51.3%) | 6,322 (63.2%) |
| $300,000 to $499,999 | 767 (10.2%) | 1,037 (10.4%) |
| $500,000 to $749,999 | 219 (2.9%) | 280 (2.8%) |
| $750,000 to $999,999 | 76 (1.0%) | 44 (0.4%) |
| $1,000,000 or more | 91 (1.2%) | 28 (0.3%) |
| Total | 7,496 (100.0%) | 9,998 (100.0%) |
Household Income by Mortgage Status in St. Joseph County
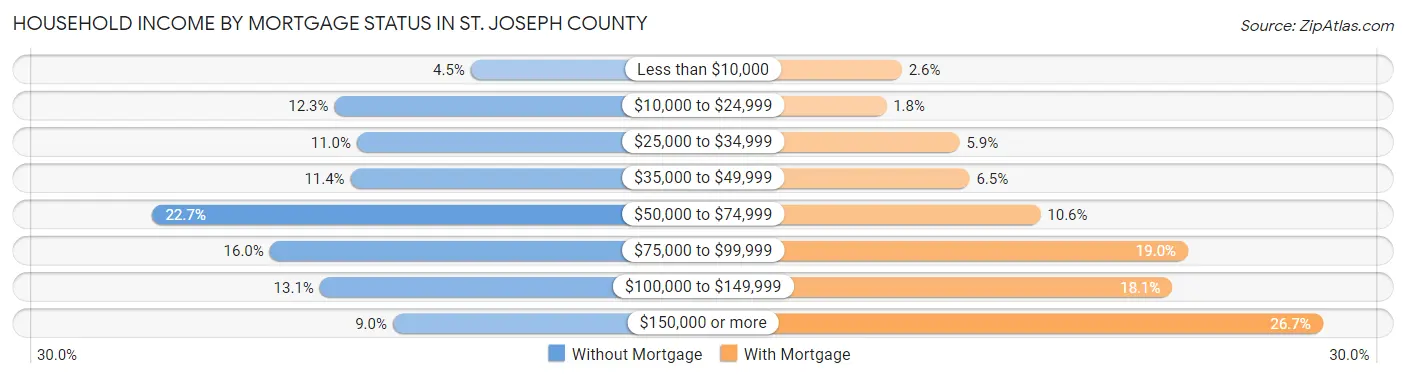
| Household Income | Without Mortgage | With Mortgage |
| Less than $10,000 | 338 (4.5%) | 264 (2.6%) |
| $10,000 to $24,999 | 922 (12.3%) | 175 (1.8%) |
| $25,000 to $34,999 | 826 (11.0%) | 594 (5.9%) |
| $35,000 to $49,999 | 853 (11.4%) | 651 (6.5%) |
| $50,000 to $74,999 | 1,701 (22.7%) | 1,056 (10.6%) |
| $75,000 to $99,999 | 1,199 (16.0%) | 1,899 (19.0%) |
| $100,000 to $149,999 | 985 (13.1%) | 1,810 (18.1%) |
| $150,000 or more | 672 (9.0%) | 2,668 (26.7%) |
| Total | 7,496 (100.0%) | 9,998 (100.0%) |
Property Value to Household Income Ratio in St. Joseph County
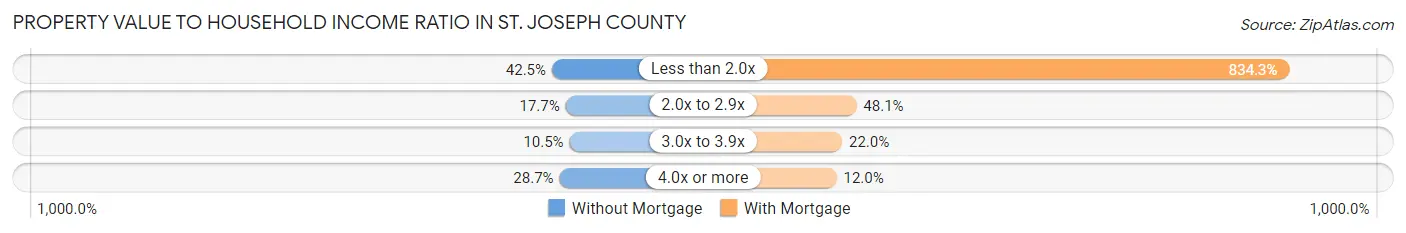
| Value-to-Income Ratio | Without Mortgage | With Mortgage |
| Less than 2.0x | 3,183 (42.5%) | 83,413 (834.3%) |
| 2.0x to 2.9x | 1,324 (17.7%) | 4,807 (48.1%) |
| 3.0x to 3.9x | 785 (10.5%) | 2,202 (22.0%) |
| 4.0x or more | 2,153 (28.7%) | 1,198 (12.0%) |
| Total | 7,496 (100.0%) | 9,998 (100.0%) |
Real Estate Taxes by Mortgage Status in St. Joseph County
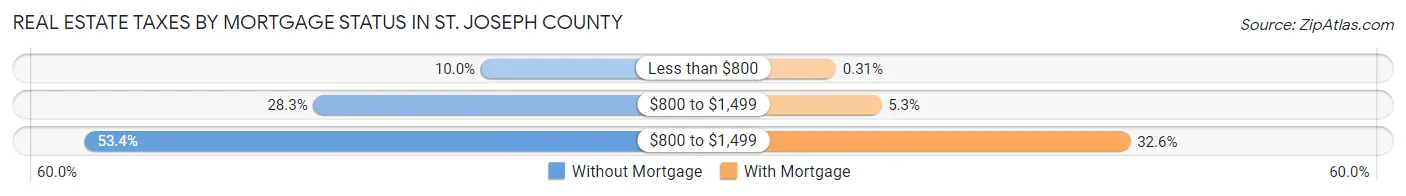
| Property Taxes | Without Mortgage | With Mortgage |
| Less than $800 | 749 (10.0%) | 31 (0.3%) |
| $800 to $1,499 | 2,124 (28.3%) | 528 (5.3%) |
| $800 to $1,499 | 4,005 (53.4%) | 3,256 (32.6%) |
| Total | 7,496 (100.0%) | 9,998 (100.0%) |
Health & Disability in St. Joseph County
Health Insurance Coverage by Age in St. Joseph County
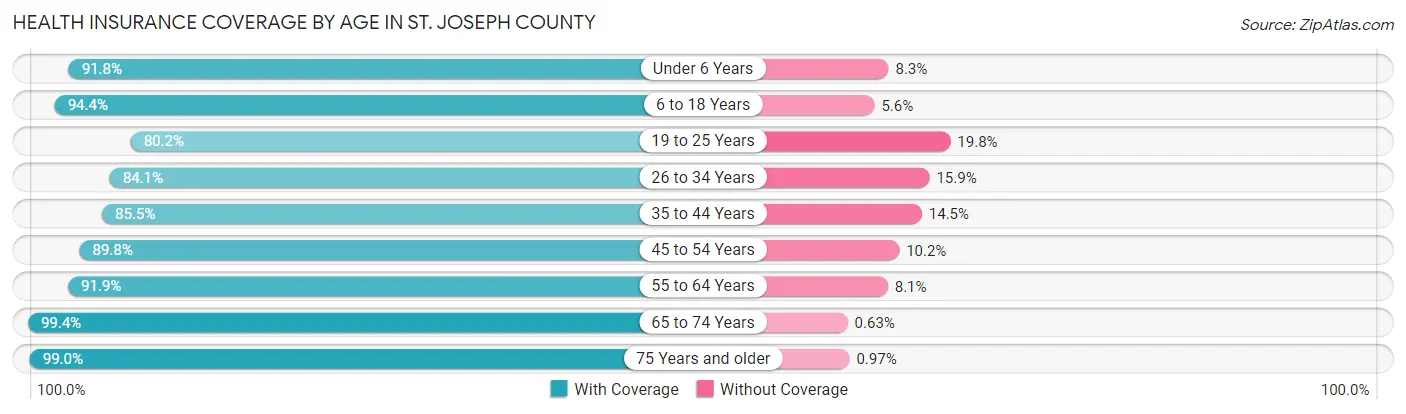
| Age Bracket | With Coverage | Without Coverage |
| Under 6 Years | 4,158 (91.7%) | 374 (8.3%) |
| 6 to 18 Years | 10,346 (94.4%) | 616 (5.6%) |
| 19 to 25 Years | 3,882 (80.2%) | 958 (19.8%) |
| 26 to 34 Years | 5,500 (84.1%) | 1,039 (15.9%) |
| 35 to 44 Years | 6,112 (85.5%) | 1,033 (14.5%) |
| 45 to 54 Years | 6,275 (89.8%) | 716 (10.2%) |
| 55 to 64 Years | 7,873 (91.9%) | 695 (8.1%) |
| 65 to 74 Years | 6,629 (99.4%) | 42 (0.6%) |
| 75 Years and older | 4,102 (99.0%) | 40 (1.0%) |
| Total | 54,877 (90.9%) | 5,513 (9.1%) |
Health Insurance Coverage by Citizenship Status in St. Joseph County
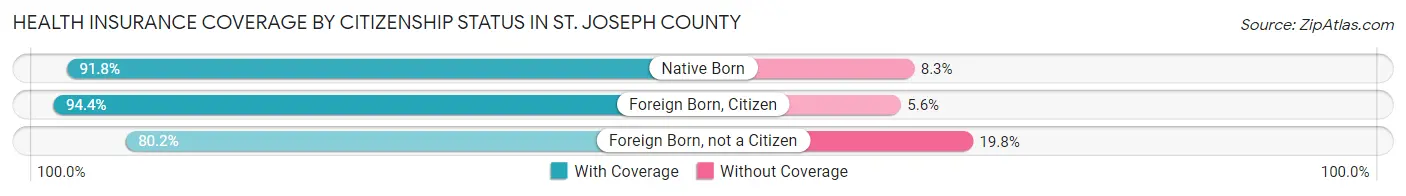
| Citizenship Status | With Coverage | Without Coverage |
| Native Born | 4,158 (91.7%) | 374 (8.3%) |
| Foreign Born, Citizen | 10,346 (94.4%) | 616 (5.6%) |
| Foreign Born, not a Citizen | 3,882 (80.2%) | 958 (19.8%) |
Health Insurance Coverage by Household Income in St. Joseph County
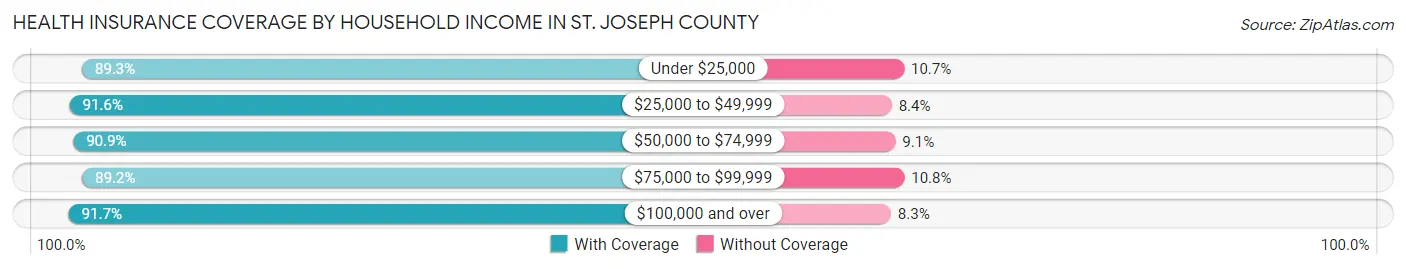
| Household Income | With Coverage | Without Coverage |
| Under $25,000 | 6,084 (89.3%) | 731 (10.7%) |
| $25,000 to $49,999 | 9,686 (91.6%) | 891 (8.4%) |
| $50,000 to $74,999 | 10,720 (90.9%) | 1,074 (9.1%) |
| $75,000 to $99,999 | 8,973 (89.2%) | 1,083 (10.8%) |
| $100,000 and over | 19,246 (91.7%) | 1,733 (8.3%) |
Public vs Private Health Insurance Coverage by Age in St. Joseph County
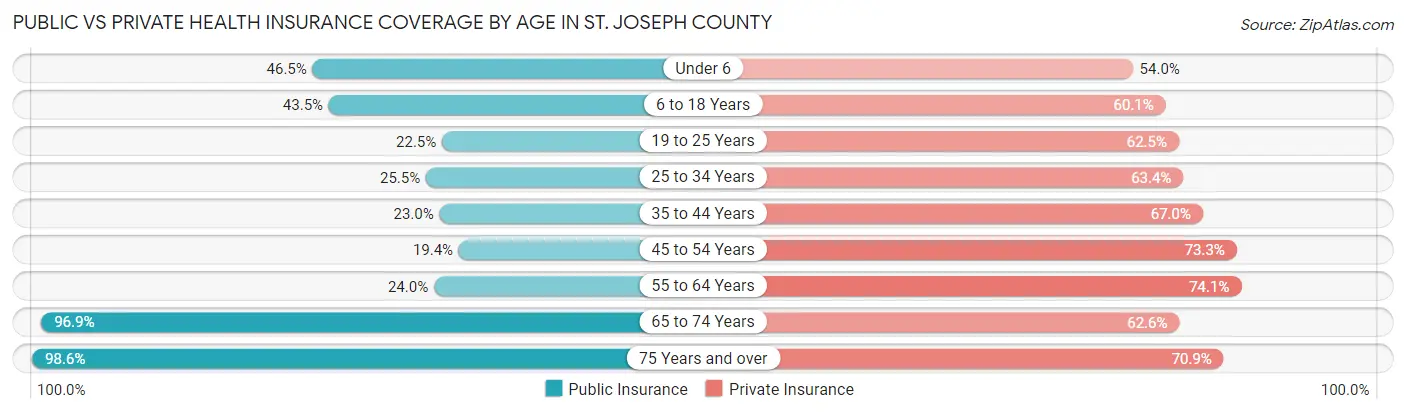
| Age Bracket | Public Insurance | Private Insurance |
| Under 6 | 2,109 (46.5%) | 2,447 (54.0%) |
| 6 to 18 Years | 4,771 (43.5%) | 6,588 (60.1%) |
| 19 to 25 Years | 1,089 (22.5%) | 3,027 (62.5%) |
| 25 to 34 Years | 1,667 (25.5%) | 4,143 (63.4%) |
| 35 to 44 Years | 1,642 (23.0%) | 4,787 (67.0%) |
| 45 to 54 Years | 1,355 (19.4%) | 5,124 (73.3%) |
| 55 to 64 Years | 2,057 (24.0%) | 6,352 (74.1%) |
| 65 to 74 Years | 6,465 (96.9%) | 4,179 (62.6%) |
| 75 Years and over | 4,085 (98.6%) | 2,936 (70.9%) |
| Total | 25,240 (41.8%) | 39,583 (65.5%) |
Disability Status by Sex by Age in St. Joseph County
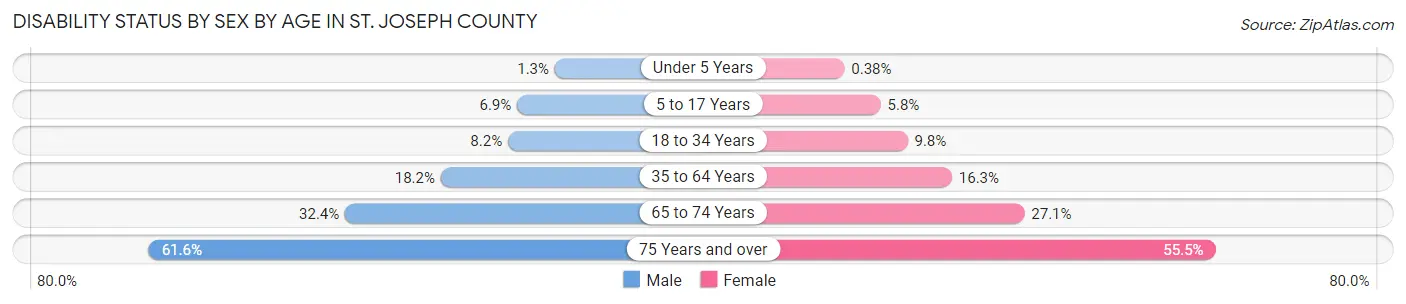
| Age Bracket | Male | Female |
| Under 5 Years | 25 (1.3%) | 7 (0.4%) |
| 5 to 17 Years | 386 (6.9%) | 309 (5.8%) |
| 18 to 34 Years | 512 (8.2%) | 571 (9.8%) |
| 35 to 64 Years | 2,101 (18.2%) | 1,823 (16.3%) |
| 65 to 74 Years | 1,042 (32.4%) | 937 (27.1%) |
| 75 Years and over | 1,086 (61.6%) | 1,319 (55.5%) |
Disability Class by Sex by Age in St. Joseph County
Disability Class: Hearing Difficulty
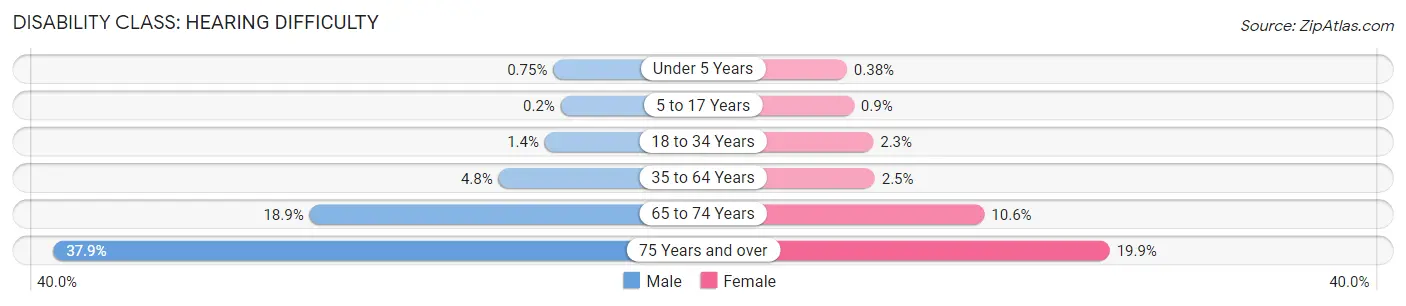
| Age Bracket | Male | Female |
| Under 5 Years | 15 (0.7%) | 7 (0.4%) |
| 5 to 17 Years | 11 (0.2%) | 48 (0.9%) |
| 18 to 34 Years | 86 (1.4%) | 137 (2.3%) |
| 35 to 64 Years | 555 (4.8%) | 273 (2.5%) |
| 65 to 74 Years | 606 (18.9%) | 366 (10.6%) |
| 75 Years and over | 668 (37.9%) | 473 (19.9%) |
Disability Class: Vision Difficulty
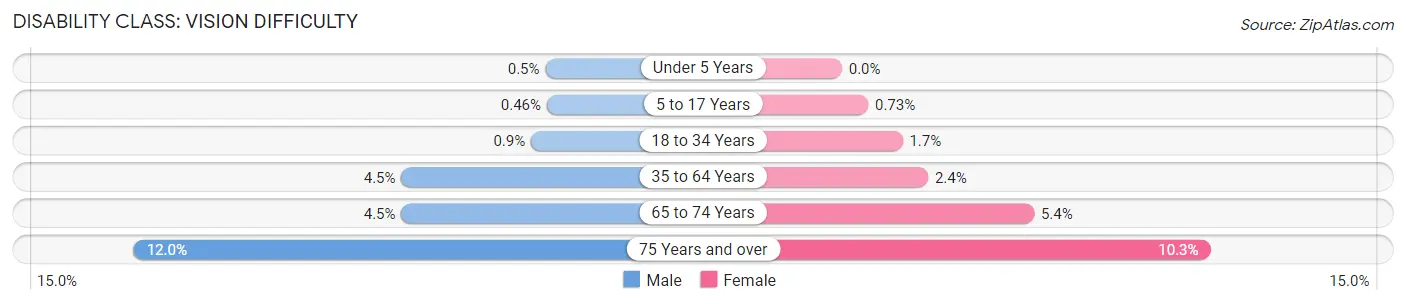
| Age Bracket | Male | Female |
| Under 5 Years | 10 (0.5%) | 0 (0.0%) |
| 5 to 17 Years | 26 (0.5%) | 39 (0.7%) |
| 18 to 34 Years | 56 (0.9%) | 99 (1.7%) |
| 35 to 64 Years | 521 (4.5%) | 268 (2.4%) |
| 65 to 74 Years | 145 (4.5%) | 185 (5.3%) |
| 75 Years and over | 211 (12.0%) | 244 (10.3%) |
Disability Class: Cognitive Difficulty
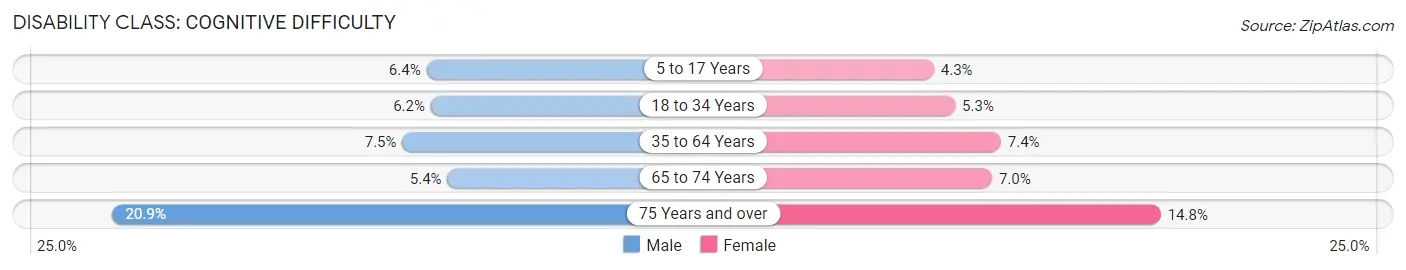
| Age Bracket | Male | Female |
| 5 to 17 Years | 357 (6.4%) | 229 (4.3%) |
| 18 to 34 Years | 383 (6.1%) | 308 (5.3%) |
| 35 to 64 Years | 863 (7.5%) | 823 (7.4%) |
| 65 to 74 Years | 173 (5.4%) | 241 (7.0%) |
| 75 Years and over | 369 (20.9%) | 352 (14.8%) |
Disability Class: Ambulatory Difficulty
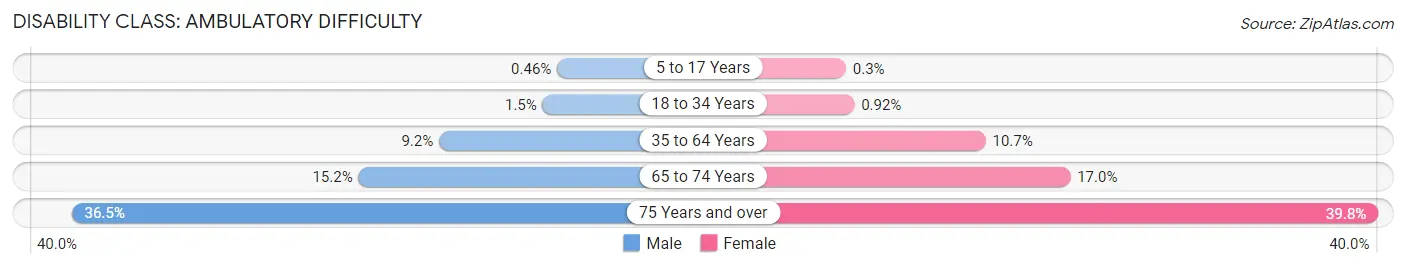
| Age Bracket | Male | Female |
| 5 to 17 Years | 26 (0.5%) | 16 (0.3%) |
| 18 to 34 Years | 96 (1.5%) | 54 (0.9%) |
| 35 to 64 Years | 1,066 (9.2%) | 1,191 (10.7%) |
| 65 to 74 Years | 489 (15.2%) | 586 (17.0%) |
| 75 Years and over | 644 (36.5%) | 947 (39.8%) |
Disability Class: Self-Care Difficulty
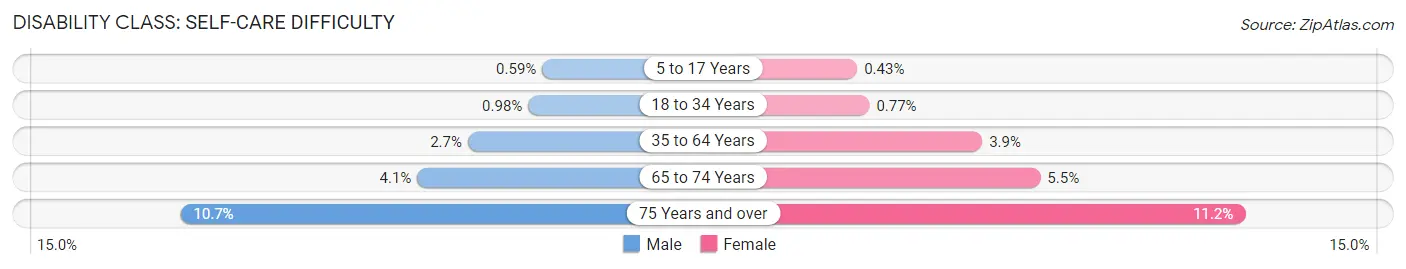
| Age Bracket | Male | Female |
| 5 to 17 Years | 33 (0.6%) | 23 (0.4%) |
| 18 to 34 Years | 61 (1.0%) | 45 (0.8%) |
| 35 to 64 Years | 307 (2.7%) | 436 (3.9%) |
| 65 to 74 Years | 131 (4.1%) | 191 (5.5%) |
| 75 Years and over | 188 (10.7%) | 267 (11.2%) |
Technology Access in St. Joseph County
Computing Device Access in St. Joseph County
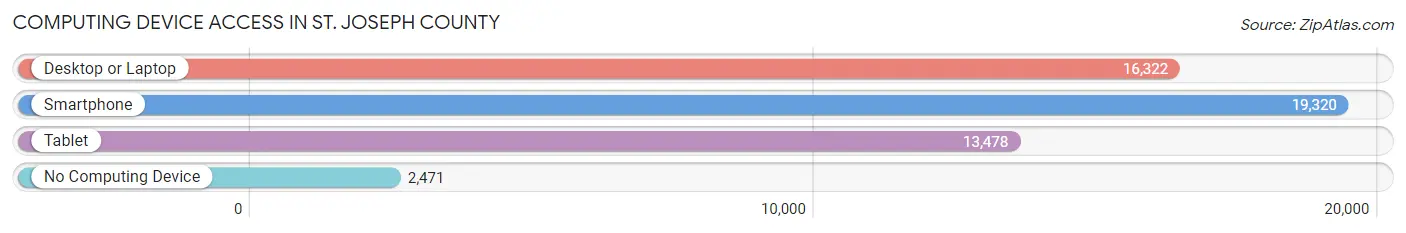
| Device Type | # Households | % Households |
| Desktop or Laptop | 16,322 | 69.5% |
| Smartphone | 19,320 | 82.3% |
| Tablet | 13,478 | 57.4% |
| No Computing Device | 2,471 | 10.5% |
| Total | 23,478 | 100.0% |
Internet Access in St. Joseph County
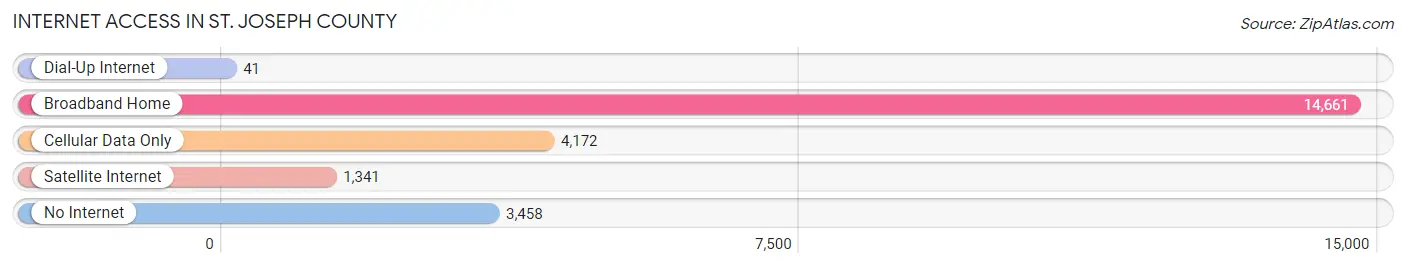
| Internet Type | # Households | % Households |
| Dial-Up Internet | 41 | 0.2% |
| Broadband Home | 14,661 | 62.5% |
| Cellular Data Only | 4,172 | 17.8% |
| Satellite Internet | 1,341 | 5.7% |
| No Internet | 3,458 | 14.7% |
| Total | 23,478 | 100.0% |
St. Joseph County Summary
St. Joseph County, Michigan is located in the southwestern corner of the state, bordered by Indiana to the south and Lake Michigan to the west. It is part of the larger Michiana region, which includes the counties of Berrien, Cass, and Van Buren. The county seat is Centreville, and the largest city is Three Rivers. The county was established in 1829 and named after St. Joseph, the patron saint of New France.
History
The area that is now St. Joseph County was originally inhabited by the Potawatomi people. The first European settlers arrived in the early 1800s, and the county was officially established in 1829. The county was named after St. Joseph, the patron saint of New France.
The county was largely agricultural in the 19th century, with the main crops being wheat, corn, and potatoes. The county also had a thriving lumber industry, with several sawmills located along the St. Joseph River.
In the late 19th century, the county began to industrialize, with the establishment of several factories in the cities of Three Rivers and Sturgis. The county also became a popular tourist destination, with several resorts located along the St. Joseph River.
Geography
St. Joseph County is located in the southwestern corner of Michigan, bordered by Indiana to the south and Lake Michigan to the west. The county covers an area of 545 square miles and is divided into 16 townships. The county is mostly flat, with the highest point being the St. Joseph River at 810 feet above sea level.
The county is home to several rivers, including the St. Joseph, Kalamazoo, and Portage. The St. Joseph River is the main river in the county, and it flows through the cities of Three Rivers and Sturgis. The county also has several lakes, including Lake Templene, Lake of the Woods, and Lake Goguac.
Economy
St. Joseph County has a diverse economy, with a mix of manufacturing, agriculture, and tourism. The county is home to several large manufacturing companies, including Whirlpool Corporation, Stryker Corporation, and Eaton Corporation. The county also has a thriving agricultural sector, with the main crops being corn, soybeans, and wheat.
The county is also a popular tourist destination, with several resorts located along the St. Joseph River. The county is home to several state parks, including St. Joseph State Park, Portage Lake State Park, and Lake Templene State Park.
Demographics
As of the 2010 census, St. Joseph County had a population of 61,295. The population is predominantly white (90.2%), with small percentages of African American (3.3%), Hispanic (2.7%), and Asian (1.7%) residents. The median household income is $48,945, and the median home value is $118,400.
The county is home to several colleges and universities, including Andrews University, Glen Oaks Community College, and Southwestern Michigan College. The county also has several public school districts, including Three Rivers Community Schools, Sturgis Public Schools, and Centreville Public Schools.
Conclusion
St. Joseph County is a diverse and vibrant county located in the southwestern corner of Michigan. The county has a mix of manufacturing, agriculture, and tourism, and is home to several colleges and universities. The county has a population of 61,295, with a median household income of $48,945 and a median home value of $118,400. St. Joseph County is a great place to live, work, and play.
Common Questions
What is Per Capita Income in St. Joseph County?
Per Capita income in St. Joseph County is $30,171.
What is the Median Family Income in St. Joseph County?
Median Family Income in St. Joseph County is $74,224.
What is the Median Household income in St. Joseph County?
Median Household Income in St. Joseph County is $62,281.
What is Income or Wage Gap in St. Joseph County?
Income or Wage Gap in St. Joseph County is 35.6%.
Women in St. Joseph County earn 64.4 cents for every dollar earned by a man.
What is Family Income Deficit in St. Joseph County?
Family Income Deficit in St. Joseph County is $10,131.
Families that are below poverty line in St. Joseph County earn $10,131 less on average than the poverty threshold level.
What is Inequality or Gini Index in St. Joseph County?
Inequality or Gini Index in St. Joseph County is 0.41.
What is the Total Population of St. Joseph County?
Total Population of St. Joseph County is 60,887.
What is the Total Male Population of St. Joseph County?
Total Male Population of St. Joseph County is 30,671.
What is the Total Female Population of St. Joseph County?
Total Female Population of St. Joseph County is 30,216.
What is the Ratio of Males per 100 Females in St. Joseph County?
There are 101.51 Males per 100 Females in St. Joseph County.
What is the Ratio of Females per 100 Males in St. Joseph County?
There are 98.52 Females per 100 Males in St. Joseph County.
What is the Median Population Age in St. Joseph County?
Median Population Age in St. Joseph County is 39.8 Years.
What is the Average Family Size in St. Joseph County
Average Family Size in St. Joseph County is 3.1 People.
What is the Average Household Size in St. Joseph County
Average Household Size in St. Joseph County is 2.6 People.
How Large is the Labor Force in St. Joseph County?
There are 29,483 People in the Labor Forcein in St. Joseph County.
What is the Percentage of People in the Labor Force in St. Joseph County?
61.7% of People are in the Labor Force in St. Joseph County.
What is the Unemployment Rate in St. Joseph County?
Unemployment Rate in St. Joseph County is 5.3%.