Sanilac County, MI Map & Demographics
Sanilac County Map
Sanilac County Overview
$30,904
PER CAPITA INCOME
$70,172
AVG FAMILY INCOME
$55,740
AVG HOUSEHOLD INCOME
33.5%
WAGE / INCOME GAP [ % ]
66.5¢/ $1
WAGE / INCOME GAP [ $ ]
$9,615
FAMILY INCOME DEFICIT
0.43
INEQUALITY / GINI INDEX
40,759
TOTAL POPULATION
20,605
MALE POPULATION
20,154
FEMALE POPULATION
102.24
MALES / 100 FEMALES
97.81
FEMALES / 100 MALES
45.2
MEDIAN AGE
2.8
AVG FAMILY SIZE
2.3
AVG HOUSEHOLD SIZE
18,570
LABOR FORCE [ PEOPLE ]
55.8%
PERCENT IN LABOR FORCE
6.5%
UNEMPLOYMENT RATE
Income in Sanilac County
Income Overview in Sanilac County
Per Capita Income in Sanilac County is $30,904, while median incomes of families and households are $70,172 and $55,740 respectively.
| Characteristic | Number | Measure |
| Per Capita Income | 40,759 | $30,904 |
| Median Family Income | 11,226 | $70,172 |
| Mean Family Income | 11,226 | $84,192 |
| Median Household Income | 17,296 | $55,740 |
| Mean Household Income | 17,296 | $72,456 |
| Income Deficit | 11,226 | $9,615 |
| Wage / Income Gap (%) | 40,759 | 33.54% |
| Wage / Income Gap ($) | 40,759 | 66.46¢ per $1 |
| Gini / Inequality Index | 40,759 | 0.43 |
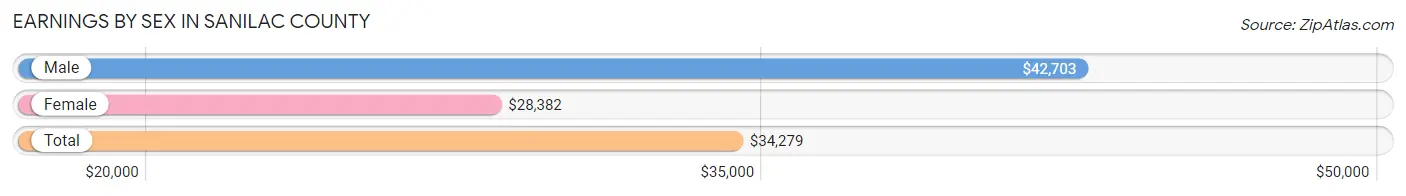
Earnings by Sex in Sanilac County
Average Earnings in Sanilac County are $34,279, $42,703 for men and $28,382 for women, a difference of 33.5%.
| Sex | Number | Average Earnings |
| Male | 10,700 (54.6%) | $42,703 |
| Female | 8,883 (45.4%) | $28,382 |
| Total | 19,583 (100.0%) | $34,279 |
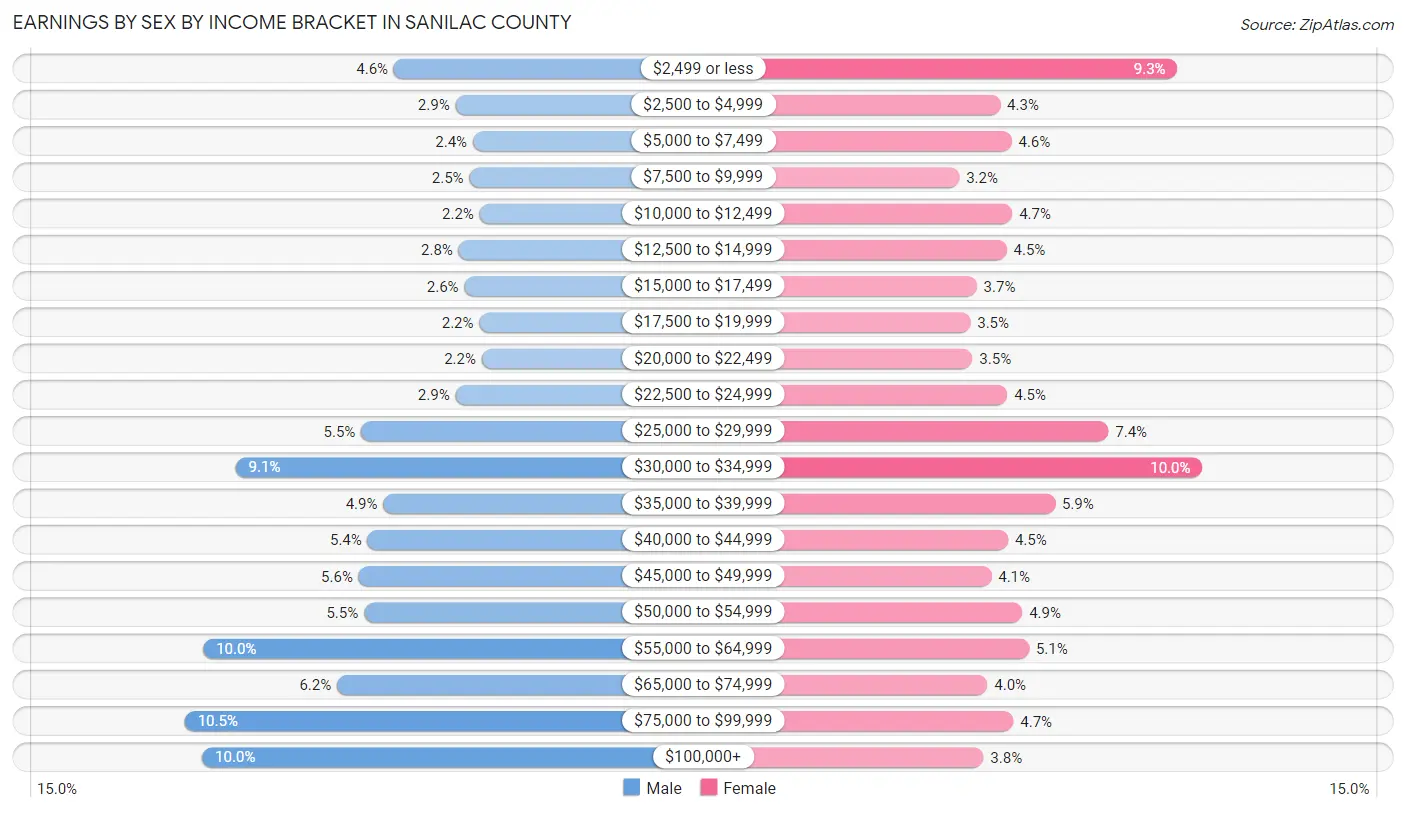
Earnings by Sex by Income Bracket in Sanilac County
The most common earnings brackets in Sanilac County are $75,000 to $99,999 for men (1,124 | 10.5%) and $30,000 to $34,999 for women (887 | 10.0%).
| Income | Male | Female |
| $2,499 or less | 494 (4.6%) | 825 (9.3%) |
| $2,500 to $4,999 | 309 (2.9%) | 383 (4.3%) |
| $5,000 to $7,499 | 257 (2.4%) | 411 (4.6%) |
| $7,500 to $9,999 | 268 (2.5%) | 281 (3.2%) |
| $10,000 to $12,499 | 236 (2.2%) | 413 (4.6%) |
| $12,500 to $14,999 | 300 (2.8%) | 399 (4.5%) |
| $15,000 to $17,499 | 283 (2.6%) | 324 (3.6%) |
| $17,500 to $19,999 | 238 (2.2%) | 308 (3.5%) |
| $20,000 to $22,499 | 230 (2.1%) | 314 (3.5%) |
| $22,500 to $24,999 | 309 (2.9%) | 401 (4.5%) |
| $25,000 to $29,999 | 593 (5.5%) | 653 (7.3%) |
| $30,000 to $34,999 | 970 (9.1%) | 887 (10.0%) |
| $35,000 to $39,999 | 526 (4.9%) | 520 (5.9%) |
| $40,000 to $44,999 | 574 (5.4%) | 402 (4.5%) |
| $45,000 to $49,999 | 600 (5.6%) | 361 (4.1%) |
| $50,000 to $54,999 | 584 (5.5%) | 438 (4.9%) |
| $55,000 to $64,999 | 1,068 (10.0%) | 455 (5.1%) |
| $65,000 to $74,999 | 666 (6.2%) | 351 (4.0%) |
| $75,000 to $99,999 | 1,124 (10.5%) | 416 (4.7%) |
| $100,000+ | 1,071 (10.0%) | 341 (3.8%) |
| Total | 10,700 (100.0%) | 8,883 (100.0%) |
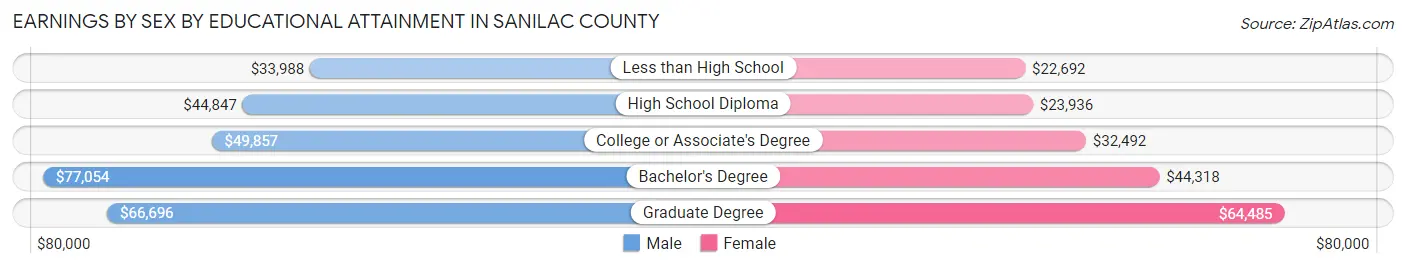
Earnings by Sex by Educational Attainment in Sanilac County
Average earnings in Sanilac County are $47,348 for men and $31,779 for women, a difference of 32.9%. Men with an educational attainment of bachelor's degree enjoy the highest average annual earnings of $77,054, while those with less than high school education earn the least with $33,988. Women with an educational attainment of graduate degree earn the most with the average annual earnings of $64,485, while those with less than high school education have the smallest earnings of $22,692.
| Educational Attainment | Male Income | Female Income |
| Less than High School | $33,988 | $22,692 |
| High School Diploma | $44,847 | $23,936 |
| College or Associate's Degree | $49,857 | $32,492 |
| Bachelor's Degree | $77,054 | $44,318 |
| Graduate Degree | $66,696 | $64,485 |
| Total | $47,348 | $31,779 |
Family Income in Sanilac County
Family Income Brackets in Sanilac County
According to the Sanilac County family income data, there are 2,256 families falling into the $50,000 to $74,999 income range, which is the most common income bracket and makes up 20.1% of all families. Conversely, the $10,000 to $14,999 income bracket is the least frequent group with only 281 families (2.5%) belonging to this category.
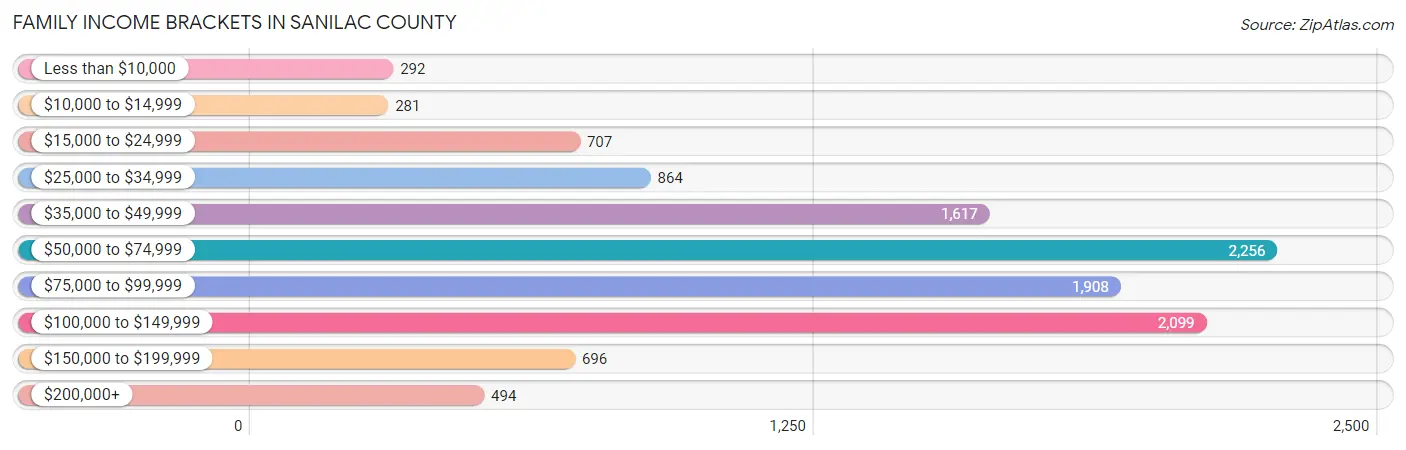
| Income Bracket | # Families | % Families |
| Less than $10,000 | 292 | 2.6% |
| $10,000 to $14,999 | 281 | 2.5% |
| $15,000 to $24,999 | 707 | 6.3% |
| $25,000 to $34,999 | 864 | 7.7% |
| $35,000 to $49,999 | 1,617 | 14.4% |
| $50,000 to $74,999 | 2,256 | 20.1% |
| $75,000 to $99,999 | 1,908 | 17.0% |
| $100,000 to $149,999 | 2,099 | 18.7% |
| $150,000 to $199,999 | 696 | 6.2% |
| $200,000+ | 494 | 4.4% |
Family Income by Famaliy Size in Sanilac County
4-person families (1,885 | 16.8%) account for the highest median family income in Sanilac County with $89,947 per family, while 2-person families (6,130 | 54.6%) have the highest median income of $31,105 per family member.
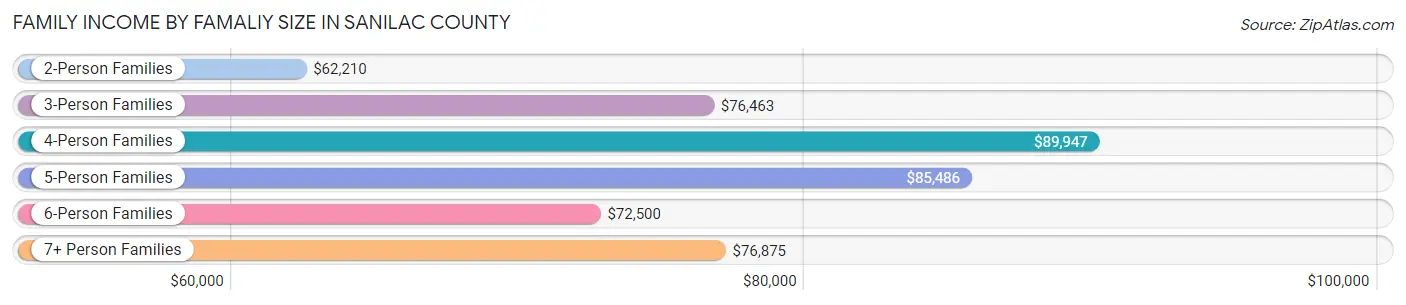
| Income Bracket | # Families | Median Income |
| 2-Person Families | 6,130 (54.6%) | $62,210 |
| 3-Person Families | 2,111 (18.8%) | $76,463 |
| 4-Person Families | 1,885 (16.8%) | $89,947 |
| 5-Person Families | 623 (5.6%) | $85,486 |
| 6-Person Families | 260 (2.3%) | $72,500 |
| 7+ Person Families | 217 (1.9%) | $76,875 |
| Total | 11,226 (100.0%) | $70,172 |
Family Income by Number of Earners in Sanilac County
The median family income in Sanilac County is $70,172, with families comprising 3+ earners (1,109) having the highest median family income of $120,179, while families with no earners (2,541) have the lowest median family income of $49,205, accounting for 9.9% and 22.6% of families, respectively.
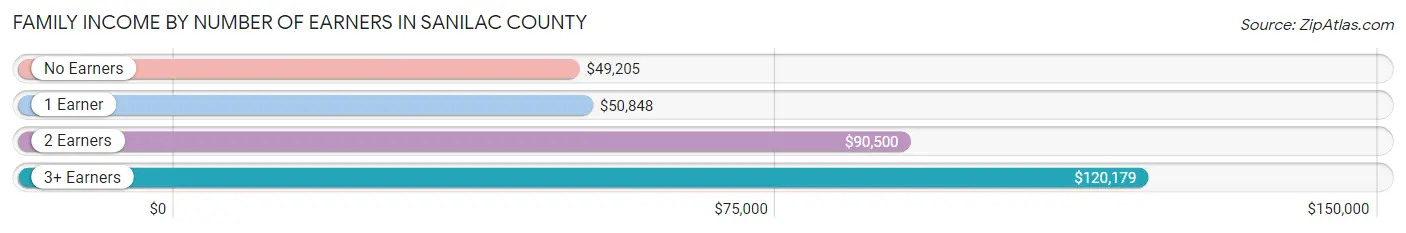
| Number of Earners | # Families | Median Income |
| No Earners | 2,541 (22.6%) | $49,205 |
| 1 Earner | 3,690 (32.9%) | $50,848 |
| 2 Earners | 3,886 (34.6%) | $90,500 |
| 3+ Earners | 1,109 (9.9%) | $120,179 |
| Total | 11,226 (100.0%) | $70,172 |
Household Income in Sanilac County
Household Income Brackets in Sanilac County
With 3,269 households falling in the category, the $50,000 to $74,999 income range is the most frequent in Sanilac County, accounting for 18.9% of all households. In contrast, only 588 households (3.4%) fall into the $200,000+ income bracket, making it the least populous group.
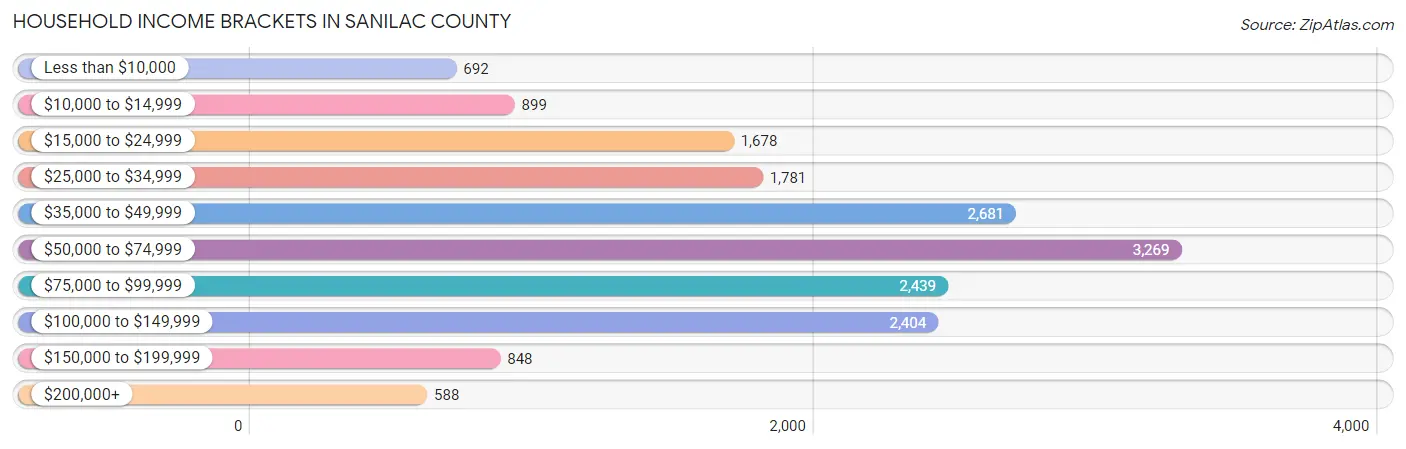
| Income Bracket | # Households | % Households |
| Less than $10,000 | 692 | 4.0% |
| $10,000 to $14,999 | 899 | 5.2% |
| $15,000 to $24,999 | 1,678 | 9.7% |
| $25,000 to $34,999 | 1,781 | 10.3% |
| $35,000 to $49,999 | 2,681 | 15.5% |
| $50,000 to $74,999 | 3,269 | 18.9% |
| $75,000 to $99,999 | 2,439 | 14.1% |
| $100,000 to $149,999 | 2,404 | 13.9% |
| $150,000 to $199,999 | 848 | 4.9% |
| $200,000+ | 588 | 3.4% |
Household Income by Householder Age in Sanilac County
The median household income in Sanilac County is $55,740, with the highest median household income of $67,967 found in the 45 to 64 years age bracket for the primary householder. A total of 6,599 households (38.2%) fall into this category. Meanwhile, the 65+ years age bracket for the primary householder has the lowest median household income of $41,633, with 5,844 households (33.8%) in this group.
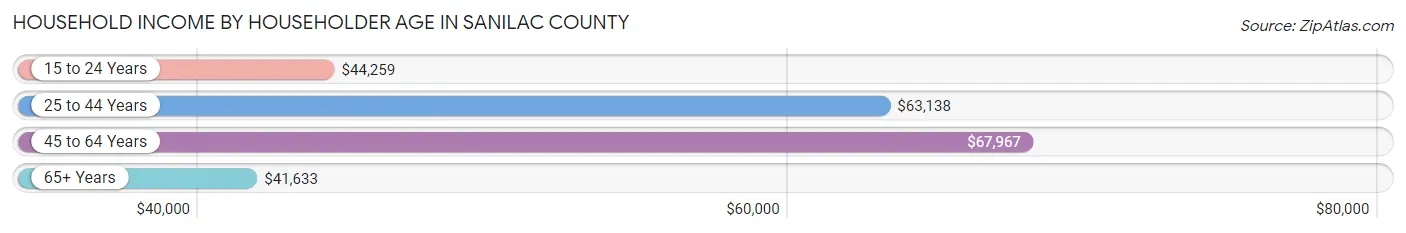
| Income Bracket | # Households | Median Income |
| 15 to 24 Years | 566 (3.3%) | $44,259 |
| 25 to 44 Years | 4,287 (24.8%) | $63,138 |
| 45 to 64 Years | 6,599 (38.2%) | $67,967 |
| 65+ Years | 5,844 (33.8%) | $41,633 |
| Total | 17,296 (100.0%) | $55,740 |
Poverty in Sanilac County
Income Below Poverty by Sex and Age in Sanilac County
With 12.6% poverty level for males and 17.4% for females among the residents of Sanilac County, under 5 year old males and under 5 year old females are the most vulnerable to poverty, with 258 males (25.1%) and 310 females (33.2%) in their respective age groups living below the poverty level.
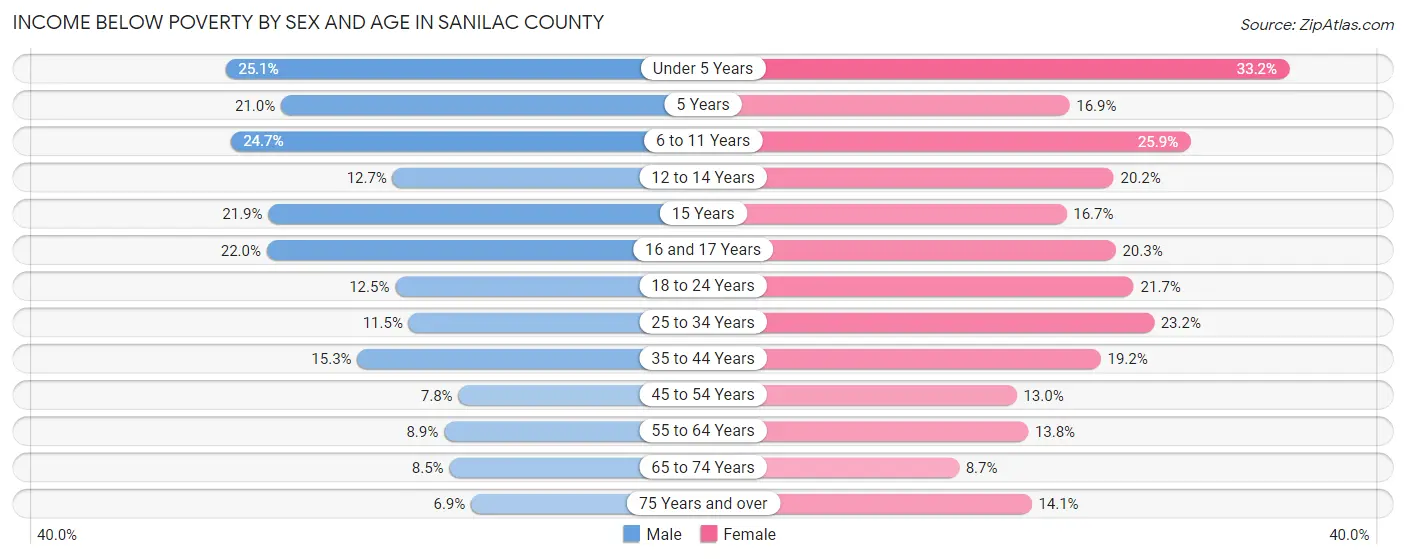
| Age Bracket | Male | Female |
| Under 5 Years | 258 (25.1%) | 310 (33.2%) |
| 5 Years | 48 (21.0%) | 37 (16.9%) |
| 6 to 11 Years | 368 (24.7%) | 367 (25.9%) |
| 12 to 14 Years | 91 (12.7%) | 134 (20.2%) |
| 15 Years | 60 (21.9%) | 41 (16.7%) |
| 16 and 17 Years | 122 (22.0%) | 116 (20.3%) |
| 18 to 24 Years | 200 (12.5%) | 314 (21.7%) |
| 25 to 34 Years | 244 (11.5%) | 466 (23.2%) |
| 35 to 44 Years | 334 (15.3%) | 412 (19.2%) |
| 45 to 54 Years | 195 (7.8%) | 312 (13.0%) |
| 55 to 64 Years | 296 (8.9%) | 432 (13.8%) |
| 65 to 74 Years | 220 (8.5%) | 233 (8.7%) |
| 75 Years and over | 111 (6.9%) | 283 (14.1%) |
| Total | 2,547 (12.6%) | 3,457 (17.4%) |
Income Above Poverty by Sex and Age in Sanilac County
According to the poverty statistics in Sanilac County, males aged 75 years and over and females aged 65 to 74 years are the age groups that are most secure financially, with 93.1% of males and 91.3% of females in these age groups living above the poverty line.
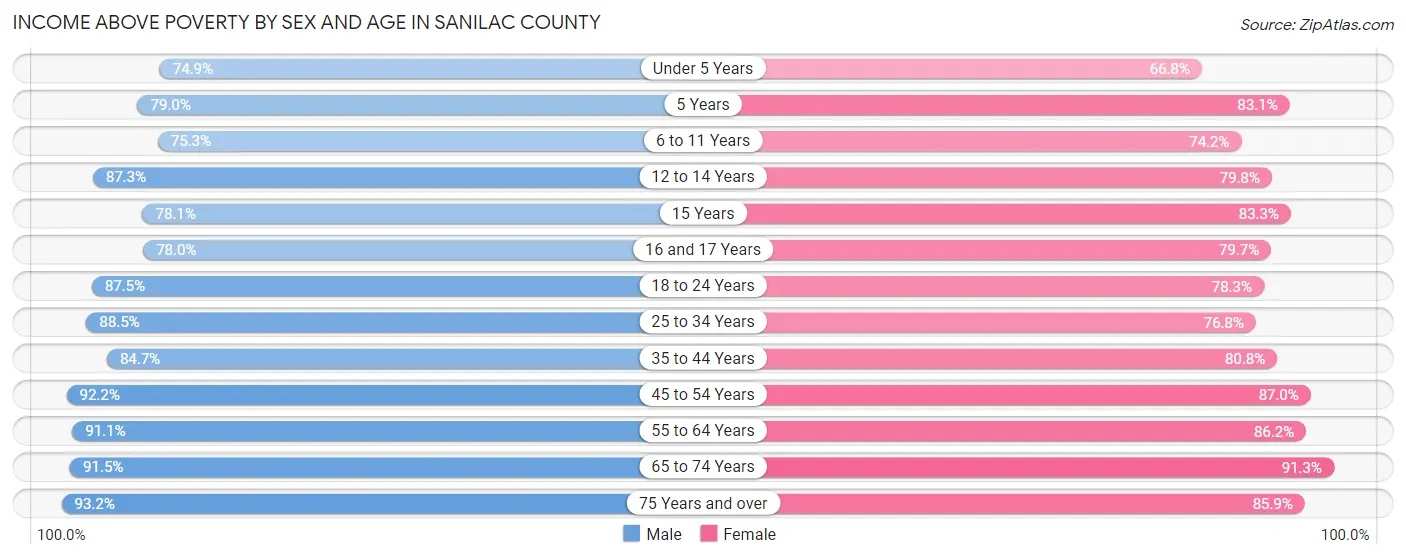
| Age Bracket | Male | Female |
| Under 5 Years | 770 (74.9%) | 624 (66.8%) |
| 5 Years | 181 (79.0%) | 182 (83.1%) |
| 6 to 11 Years | 1,120 (75.3%) | 1,053 (74.2%) |
| 12 to 14 Years | 627 (87.3%) | 530 (79.8%) |
| 15 Years | 214 (78.1%) | 205 (83.3%) |
| 16 and 17 Years | 432 (78.0%) | 455 (79.7%) |
| 18 to 24 Years | 1,403 (87.5%) | 1,135 (78.3%) |
| 25 to 34 Years | 1,881 (88.5%) | 1,546 (76.8%) |
| 35 to 44 Years | 1,851 (84.7%) | 1,733 (80.8%) |
| 45 to 54 Years | 2,307 (92.2%) | 2,093 (87.0%) |
| 55 to 64 Years | 3,045 (91.1%) | 2,695 (86.2%) |
| 65 to 74 Years | 2,380 (91.5%) | 2,452 (91.3%) |
| 75 Years and over | 1,510 (93.1%) | 1,727 (85.9%) |
| Total | 17,721 (87.4%) | 16,430 (82.6%) |
Income Below Poverty Among Married-Couple Families in Sanilac County
The poverty statistics for married-couple families in Sanilac County show that 5.7% or 500 of the total 8,792 families live below the poverty line. Families with 5 or more children have the highest poverty rate of 31.0%, comprising of 44 families. On the other hand, families with no children have the lowest poverty rate of 4.5%, which includes 263 families.
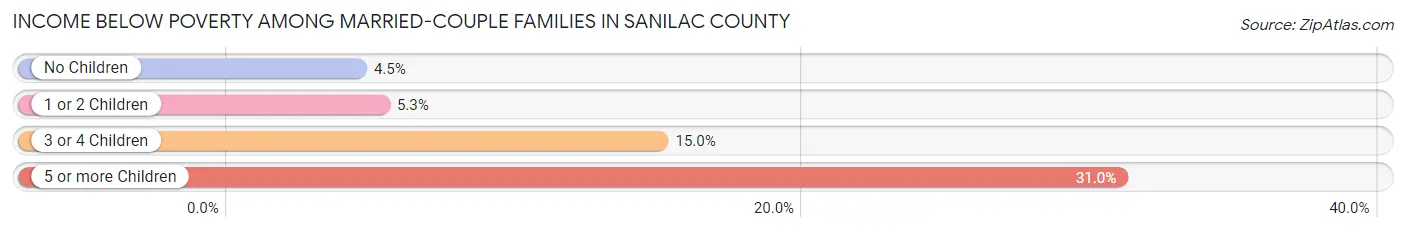
| Children | Above Poverty | Below Poverty |
| No Children | 5,593 (95.5%) | 263 (4.5%) |
| 1 or 2 Children | 2,204 (94.7%) | 123 (5.3%) |
| 3 or 4 Children | 397 (85.0%) | 70 (15.0%) |
| 5 or more Children | 98 (69.0%) | 44 (31.0%) |
| Total | 8,292 (94.3%) | 500 (5.7%) |
Income Below Poverty Among Single-Parent Households in Sanilac County
According to the poverty data in Sanilac County, 18.5% or 160 single-father households and 32.6% or 512 single-mother households are living below the poverty line. Among single-father households, those with 3 or 4 children have the highest poverty rate, with 59 households (66.3%) experiencing poverty. Likewise, among single-mother households, those with 5 or more children have the highest poverty rate, with 18 households (100.0%) falling below the poverty line.
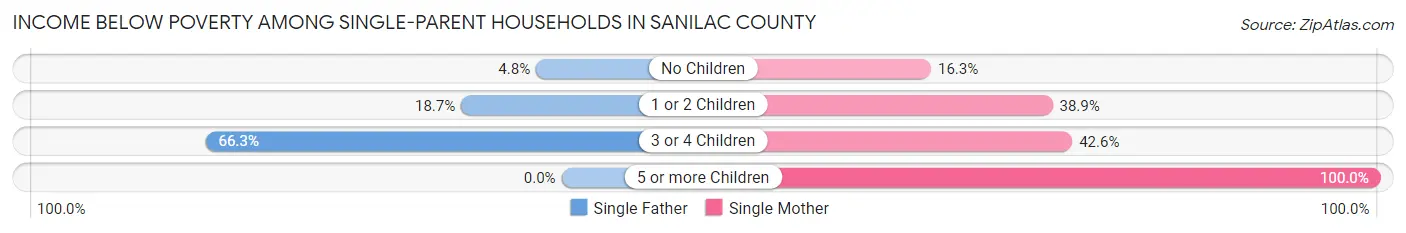
| Children | Single Father | Single Mother |
| No Children | 15 (4.8%) | 84 (16.3%) |
| 1 or 2 Children | 86 (18.7%) | 324 (38.9%) |
| 3 or 4 Children | 59 (66.3%) | 86 (42.6%) |
| 5 or more Children | 0 (0.0%) | 18 (100.0%) |
| Total | 160 (18.5%) | 512 (32.6%) |
Income Below Poverty Among Married-Couple vs Single-Parent Households in Sanilac County
The poverty data for Sanilac County shows that 500 of the married-couple family households (5.7%) and 672 of the single-parent households (27.6%) are living below the poverty level. Within the married-couple family households, those with 5 or more children have the highest poverty rate, with 44 households (31.0%) falling below the poverty line. Among the single-parent households, those with 5 or more children have the highest poverty rate, with 18 household (100.0%) living below poverty.
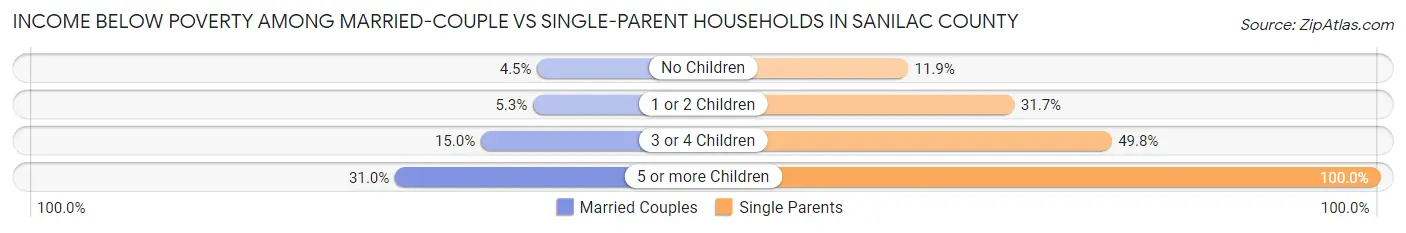
| Children | Married-Couple Families | Single-Parent Households |
| No Children | 263 (4.5%) | 99 (11.9%) |
| 1 or 2 Children | 123 (5.3%) | 410 (31.7%) |
| 3 or 4 Children | 70 (15.0%) | 145 (49.8%) |
| 5 or more Children | 44 (31.0%) | 18 (100.0%) |
| Total | 500 (5.7%) | 672 (27.6%) |
Race in Sanilac County
The most populous races in Sanilac County are White / Caucasian (38,527 | 94.5%), Hispanic or Latino (1,653 | 4.1%), and Two or more Races (1,368 | 3.4%).
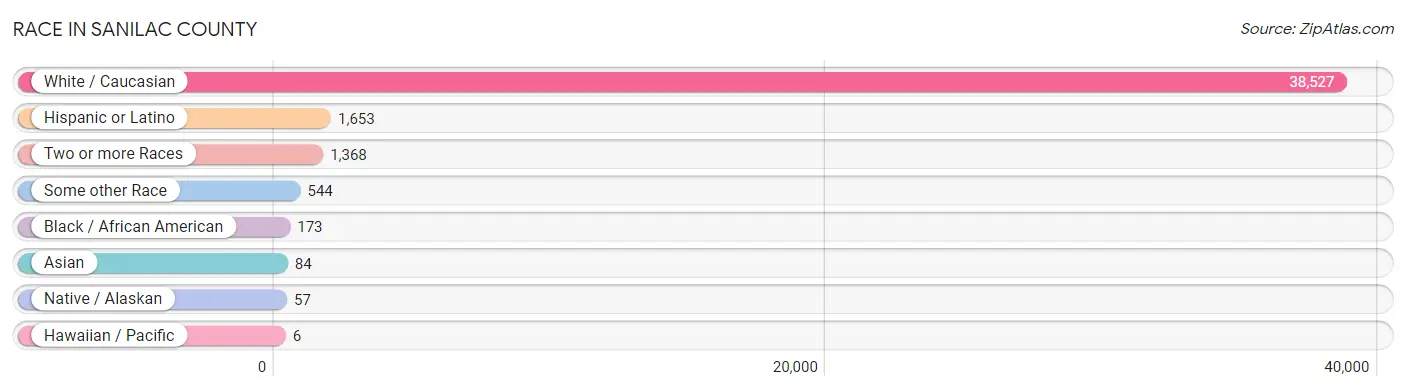
| Race | # Population | % Population |
| Asian | 84 | 0.2% |
| Black / African American | 173 | 0.4% |
| Hawaiian / Pacific | 6 | 0.0% |
| Hispanic or Latino | 1,653 | 4.1% |
| Native / Alaskan | 57 | 0.1% |
| White / Caucasian | 38,527 | 94.5% |
| Two or more Races | 1,368 | 3.4% |
| Some other Race | 544 | 1.3% |
| Total | 40,759 | 100.0% |
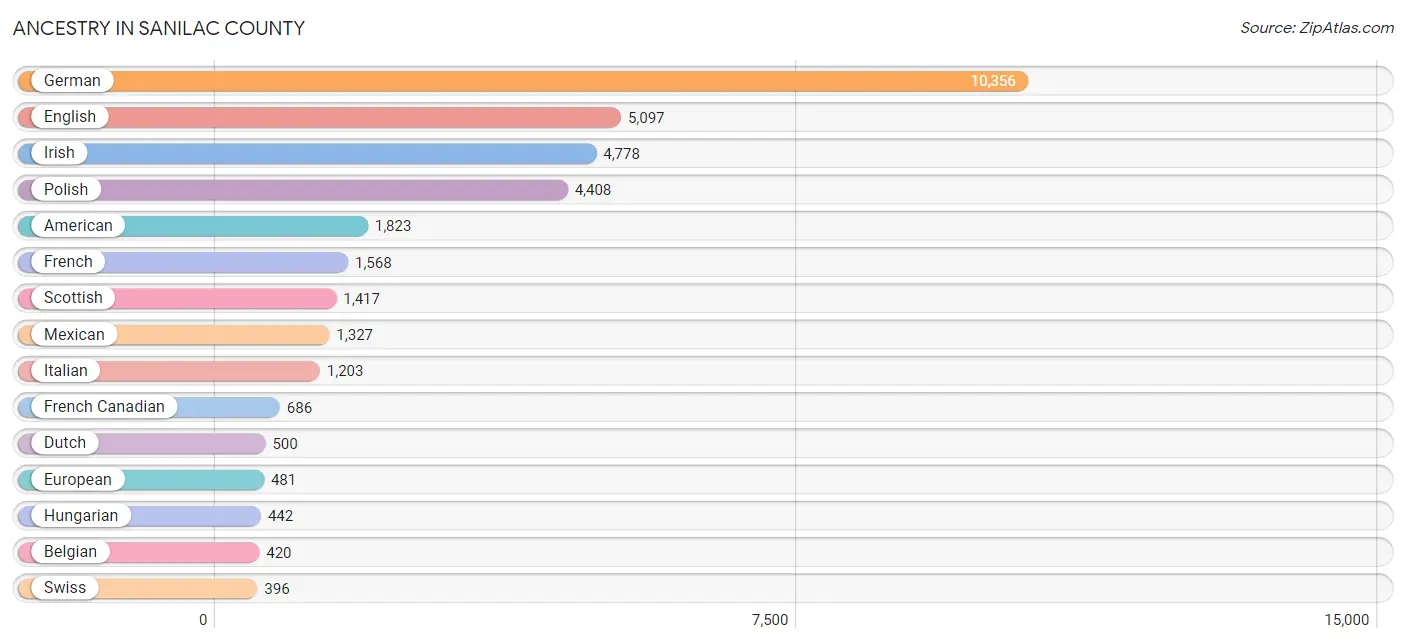
Ancestry in Sanilac County
The most populous ancestries reported in Sanilac County are German (10,356 | 25.4%), English (5,097 | 12.5%), Irish (4,778 | 11.7%), Polish (4,408 | 10.8%), and American (1,823 | 4.5%), together accounting for 64.9% of all Sanilac County residents.
| Ancestry | # Population | % Population |
| African | 6 | 0.0% |
| Albanian | 19 | 0.1% |
| American | 1,823 | 4.5% |
| Apache | 13 | 0.0% |
| Arab | 75 | 0.2% |
| Armenian | 40 | 0.1% |
| Assyrian / Chaldean / Syriac | 9 | 0.0% |
| Australian | 31 | 0.1% |
| Austrian | 110 | 0.3% |
| Belgian | 420 | 1.0% |
| Bhutanese | 24 | 0.1% |
| Blackfeet | 18 | 0.0% |
| Brazilian | 3 | 0.0% |
| British | 104 | 0.3% |
| Bulgarian | 4 | 0.0% |
| Burmese | 27 | 0.1% |
| Cambodian | 2 | 0.0% |
| Canadian | 264 | 0.6% |
| Celtic | 27 | 0.1% |
| Central American | 6 | 0.0% |
| Central American Indian | 7 | 0.0% |
| Cherokee | 122 | 0.3% |
| Chickasaw | 2 | 0.0% |
| Chippewa | 99 | 0.2% |
| Choctaw | 2 | 0.0% |
| Colombian | 21 | 0.1% |
| Cree | 2 | 0.0% |
| Croatian | 105 | 0.3% |
| Crow | 2 | 0.0% |
| Cuban | 35 | 0.1% |
| Czech | 124 | 0.3% |
| Czechoslovakian | 36 | 0.1% |
| Danish | 135 | 0.3% |
| Dutch | 500 | 1.2% |
| Dutch West Indian | 9 | 0.0% |
| Eastern European | 94 | 0.2% |
| Ecuadorian | 19 | 0.1% |
| Egyptian | 10 | 0.0% |
| English | 5,097 | 12.5% |
| Ethiopian | 2 | 0.0% |
| European | 481 | 1.2% |
| Finnish | 179 | 0.4% |
| French | 1,568 | 3.8% |
| French American Indian | 17 | 0.0% |
| French Canadian | 686 | 1.7% |
| German | 10,356 | 25.4% |
| German Russian | 4 | 0.0% |
| Greek | 124 | 0.3% |
| Guamanian / Chamorro | 12 | 0.0% |
| Guatemalan | 6 | 0.0% |
| Hopi | 2 | 0.0% |
| Hungarian | 442 | 1.1% |
| Indian (Asian) | 42 | 0.1% |
| Iranian | 11 | 0.0% |
| Iraqi | 11 | 0.0% |
| Irish | 4,778 | 11.7% |
| Iroquois | 11 | 0.0% |
| Italian | 1,203 | 2.9% |
| Jamaican | 8 | 0.0% |
| Jordanian | 5 | 0.0% |
| Korean | 61 | 0.2% |
| Lebanese | 15 | 0.0% |
| Lithuanian | 74 | 0.2% |
| Lumbee | 1 | 0.0% |
| Macedonian | 24 | 0.1% |
| Maltese | 98 | 0.2% |
| Mexican | 1,327 | 3.3% |
| Native Hawaiian | 6 | 0.0% |
| Nigerian | 2 | 0.0% |
| Northern European | 19 | 0.1% |
| Norwegian | 122 | 0.3% |
| Ottawa | 3 | 0.0% |
| Pakistani | 29 | 0.1% |
| Pennsylvania German | 116 | 0.3% |
| Peruvian | 6 | 0.0% |
| Polish | 4,408 | 10.8% |
| Portuguese | 3 | 0.0% |
| Potawatomi | 3 | 0.0% |
| Puerto Rican | 84 | 0.2% |
| Romanian | 74 | 0.2% |
| Russian | 180 | 0.4% |
| Scandinavian | 50 | 0.1% |
| Scotch-Irish | 266 | 0.6% |
| Scottish | 1,417 | 3.5% |
| Serbian | 16 | 0.0% |
| Slavic | 7 | 0.0% |
| Slovak | 56 | 0.1% |
| Slovene | 27 | 0.1% |
| South American | 55 | 0.1% |
| Spaniard | 15 | 0.0% |
| Spanish | 99 | 0.2% |
| Sri Lankan | 26 | 0.1% |
| Subsaharan African | 13 | 0.0% |
| Swedish | 278 | 0.7% |
| Swiss | 396 | 1.0% |
| Syrian | 6 | 0.0% |
| Thai | 11 | 0.0% |
| Trinidadian and Tobagonian | 9 | 0.0% |
| Turkish | 4 | 0.0% |
| Ukrainian | 136 | 0.3% |
| Welsh | 175 | 0.4% |
| Yugoslavian | 20 | 0.1% | View All 102 Rows |
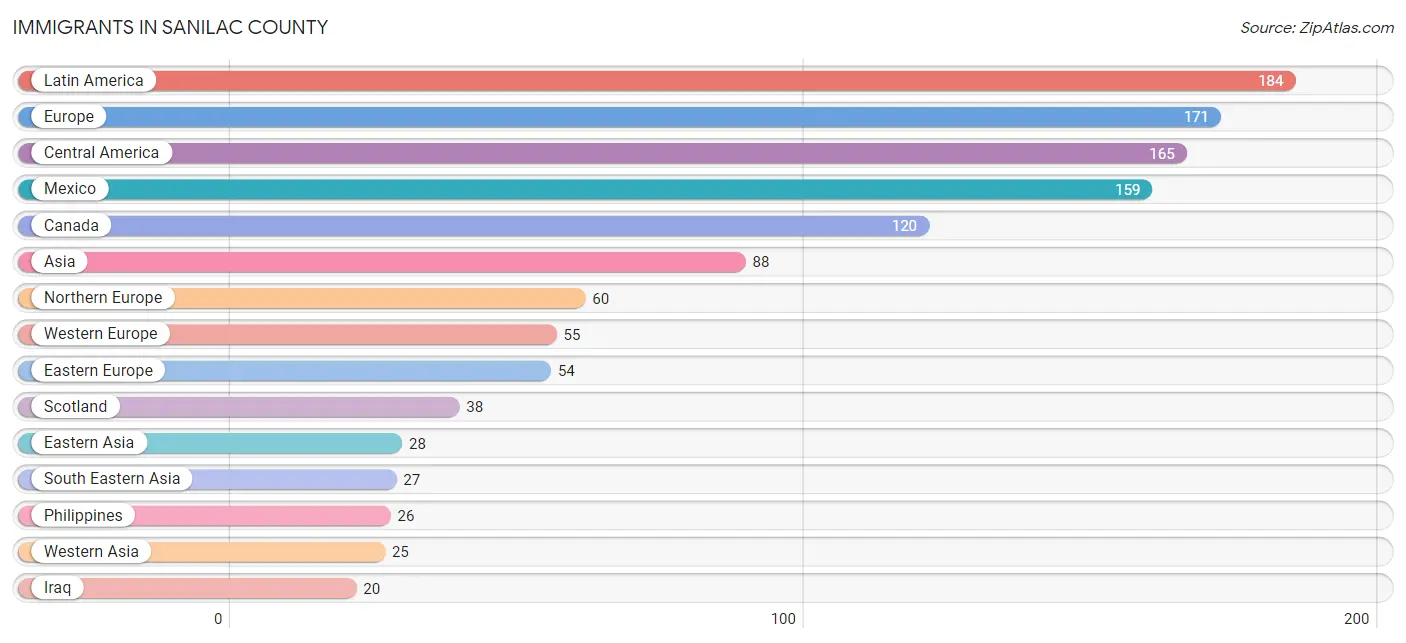
Immigrants in Sanilac County
The most numerous immigrant groups reported in Sanilac County came from Latin America (184 | 0.4%), Europe (171 | 0.4%), Central America (165 | 0.4%), Mexico (159 | 0.4%), and Canada (120 | 0.3%), together accounting for 1.9% of all Sanilac County residents.
| Immigration Origin | # Population | % Population |
| Africa | 2 | 0.0% |
| Asia | 88 | 0.2% |
| Australia | 12 | 0.0% |
| Austria | 9 | 0.0% |
| Belgium | 15 | 0.0% |
| Brazil | 3 | 0.0% |
| Canada | 120 | 0.3% |
| Caribbean | 7 | 0.0% |
| Central America | 165 | 0.4% |
| China | 10 | 0.0% |
| Colombia | 3 | 0.0% |
| Croatia | 3 | 0.0% |
| Cuba | 7 | 0.0% |
| Czechoslovakia | 4 | 0.0% |
| Eastern Africa | 2 | 0.0% |
| Eastern Asia | 28 | 0.1% |
| Eastern Europe | 54 | 0.1% |
| England | 6 | 0.0% |
| Ethiopia | 2 | 0.0% |
| Europe | 171 | 0.4% |
| France | 3 | 0.0% |
| Germany | 15 | 0.0% |
| Guatemala | 6 | 0.0% |
| Hungary | 7 | 0.0% |
| India | 2 | 0.0% |
| Iran | 6 | 0.0% |
| Iraq | 20 | 0.1% |
| Ireland | 12 | 0.0% |
| Italy | 1 | 0.0% |
| Jordan | 5 | 0.0% |
| Korea | 18 | 0.0% |
| Latin America | 184 | 0.4% |
| Mexico | 159 | 0.4% |
| Netherlands | 13 | 0.0% |
| North Macedonia | 13 | 0.0% |
| Northern Europe | 60 | 0.2% |
| Norway | 1 | 0.0% |
| Oceania | 12 | 0.0% |
| Peru | 6 | 0.0% |
| Philippines | 26 | 0.1% |
| Poland | 19 | 0.1% |
| Romania | 5 | 0.0% |
| Russia | 3 | 0.0% |
| Scotland | 38 | 0.1% |
| South America | 12 | 0.0% |
| South Central Asia | 8 | 0.0% |
| South Eastern Asia | 27 | 0.1% |
| Southern Europe | 2 | 0.0% |
| Western Asia | 25 | 0.1% |
| Western Europe | 55 | 0.1% | View All 50 Rows |
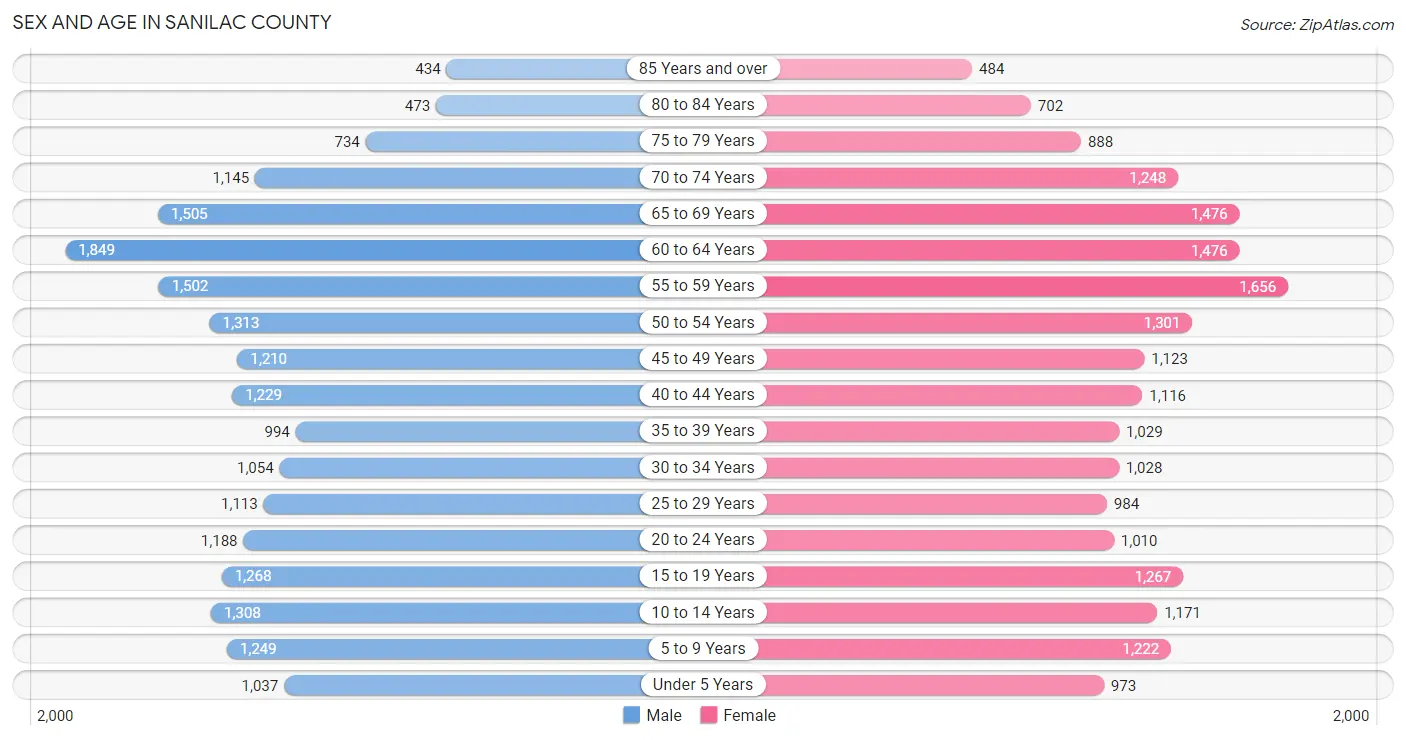
Sex and Age in Sanilac County
Sex and Age in Sanilac County
The most populous age groups in Sanilac County are 60 to 64 Years (1,849 | 9.0%) for men and 55 to 59 Years (1,656 | 8.2%) for women.
| Age Bracket | Male | Female |
| Under 5 Years | 1,037 (5.0%) | 973 (4.8%) |
| 5 to 9 Years | 1,249 (6.1%) | 1,222 (6.1%) |
| 10 to 14 Years | 1,308 (6.4%) | 1,171 (5.8%) |
| 15 to 19 Years | 1,268 (6.1%) | 1,267 (6.3%) |
| 20 to 24 Years | 1,188 (5.8%) | 1,010 (5.0%) |
| 25 to 29 Years | 1,113 (5.4%) | 984 (4.9%) |
| 30 to 34 Years | 1,054 (5.1%) | 1,028 (5.1%) |
| 35 to 39 Years | 994 (4.8%) | 1,029 (5.1%) |
| 40 to 44 Years | 1,229 (6.0%) | 1,116 (5.5%) |
| 45 to 49 Years | 1,210 (5.9%) | 1,123 (5.6%) |
| 50 to 54 Years | 1,313 (6.4%) | 1,301 (6.5%) |
| 55 to 59 Years | 1,502 (7.3%) | 1,656 (8.2%) |
| 60 to 64 Years | 1,849 (9.0%) | 1,476 (7.3%) |
| 65 to 69 Years | 1,505 (7.3%) | 1,476 (7.3%) |
| 70 to 74 Years | 1,145 (5.6%) | 1,248 (6.2%) |
| 75 to 79 Years | 734 (3.6%) | 888 (4.4%) |
| 80 to 84 Years | 473 (2.3%) | 702 (3.5%) |
| 85 Years and over | 434 (2.1%) | 484 (2.4%) |
| Total | 20,605 (100.0%) | 20,154 (100.0%) |
Families and Households in Sanilac County
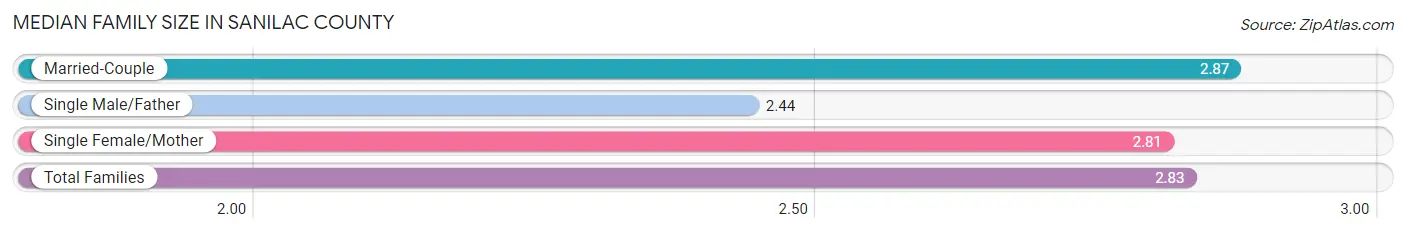
Median Family Size in Sanilac County
The median family size in Sanilac County is 2.83 persons per family, with married-couple families (8,792 | 78.3%) accounting for the largest median family size of 2.87 persons per family. On the other hand, single male/father families (865 | 7.7%) represent the smallest median family size with 2.44 persons per family.
| Family Type | # Families | Family Size |
| Married-Couple | 8,792 (78.3%) | 2.87 |
| Single Male/Father | 865 (7.7%) | 2.44 |
| Single Female/Mother | 1,569 (14.0%) | 2.81 |
| Total Families | 11,226 (100.0%) | 2.83 |
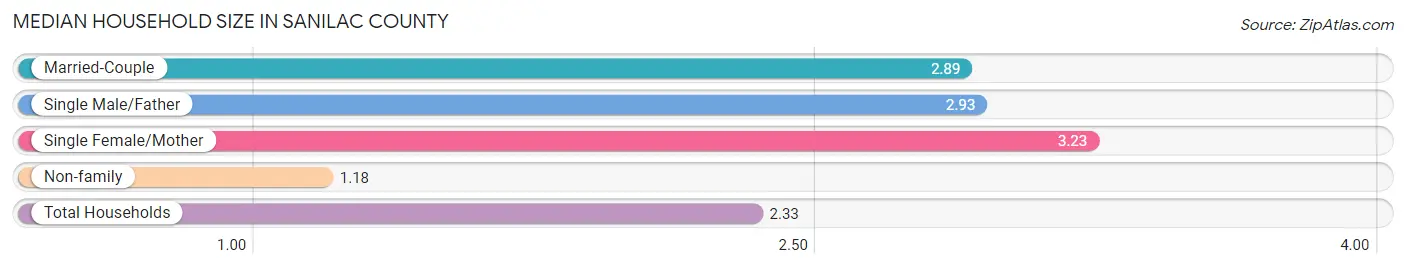
Median Household Size in Sanilac County
The median household size in Sanilac County is 2.33 persons per household, with single female/mother households (1,569 | 9.1%) accounting for the largest median household size of 3.23 persons per household. non-family households (6,070 | 35.1%) represent the smallest median household size with 1.18 persons per household.
| Household Type | # Households | Household Size |
| Married-Couple | 8,792 (50.8%) | 2.89 |
| Single Male/Father | 865 (5.0%) | 2.93 |
| Single Female/Mother | 1,569 (9.1%) | 3.23 |
| Non-family | 6,070 (35.1%) | 1.18 |
| Total Households | 17,296 (100.0%) | 2.33 |
Household Size by Marriage Status in Sanilac County
Out of a total of 17,296 households in Sanilac County, 11,226 (64.9%) are family households, while 6,070 (35.1%) are nonfamily households. The most numerous type of family households are 2-person households, comprising 5,738, and the most common type of nonfamily households are 1-person households, comprising 5,108.
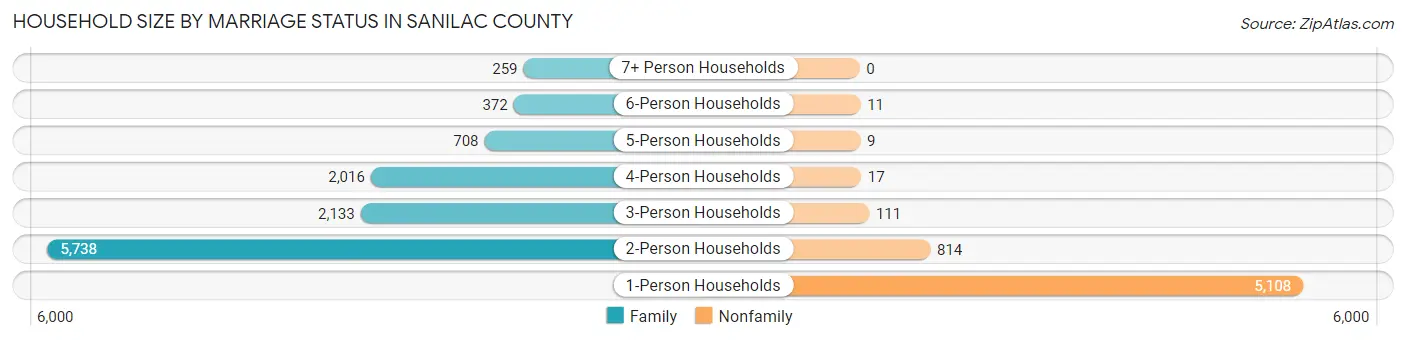
| Household Size | Family Households | Nonfamily Households |
| 1-Person Households | - | 5,108 (29.5%) |
| 2-Person Households | 5,738 (33.2%) | 814 (4.7%) |
| 3-Person Households | 2,133 (12.3%) | 111 (0.6%) |
| 4-Person Households | 2,016 (11.7%) | 17 (0.1%) |
| 5-Person Households | 708 (4.1%) | 9 (0.1%) |
| 6-Person Households | 372 (2.1%) | 11 (0.1%) |
| 7+ Person Households | 259 (1.5%) | 0 (0.0%) |
| Total | 11,226 (64.9%) | 6,070 (35.1%) |
Female Fertility in Sanilac County
Fertility by Age in Sanilac County
Average fertility rate in Sanilac County is 61.0 births per 1,000 women. Women in the age bracket of 20 to 34 years have the highest fertility rate with 129.0 births per 1,000 women. Women in the age bracket of 20 to 34 years acount for 82.3% of all women with births.
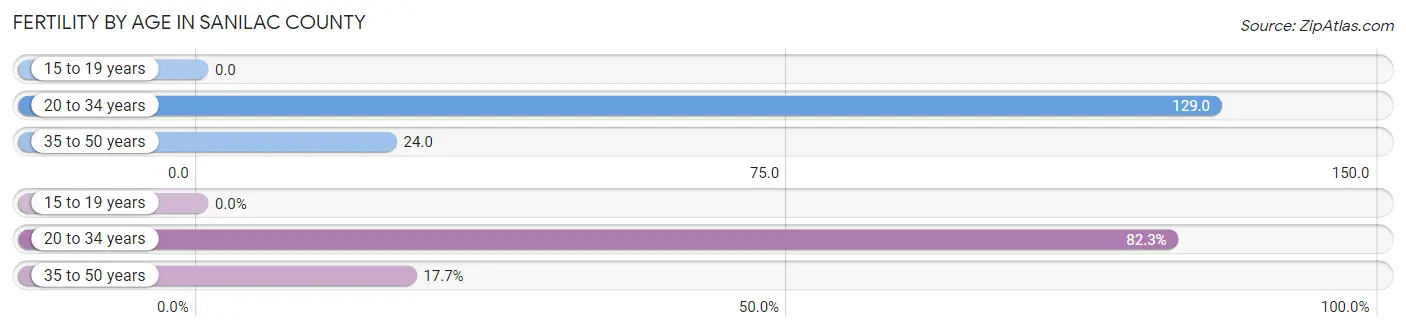
| Age Bracket | Women with Births | Births / 1,000 Women |
| 15 to 19 years | 0 (0.0%) | 0.0 |
| 20 to 34 years | 391 (82.3%) | 129.0 |
| 35 to 50 years | 84 (17.7%) | 24.0 |
| Total | 475 (100.0%) | 61.0 |
Fertility by Age by Marriage Status in Sanilac County
57.9% of women with births (475) in Sanilac County are married. The highest percentage of unmarried women with births falls into 20 to 34 years age bracket with 46.0% of them unmarried at the time of birth, while the lowest percentage of unmarried women with births belong to 35 to 50 years age bracket with 23.8% of them unmarried.
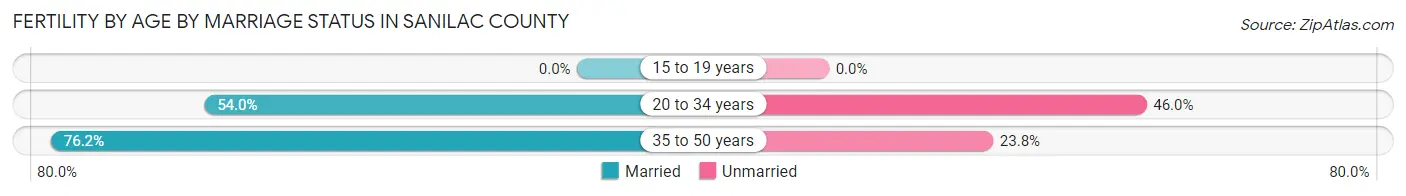
| Age Bracket | Married | Unmarried |
| 15 to 19 years | 0 (0.0%) | 0 (0.0%) |
| 20 to 34 years | 211 (54.0%) | 180 (46.0%) |
| 35 to 50 years | 64 (76.2%) | 20 (23.8%) |
| Total | 275 (57.9%) | 200 (42.1%) |
Fertility by Education in Sanilac County
Average fertility rate in Sanilac County is 61.0 births per 1,000 women. Women with the education attainment of bachelor's degree have the highest fertility rate of 95.0 births per 1,000 women, while women with the education attainment of graduate degree have the lowest fertility at 26.0 births per 1,000 women. Women with the education attainment of college or associate's degree represent 36.4% of all women with births.
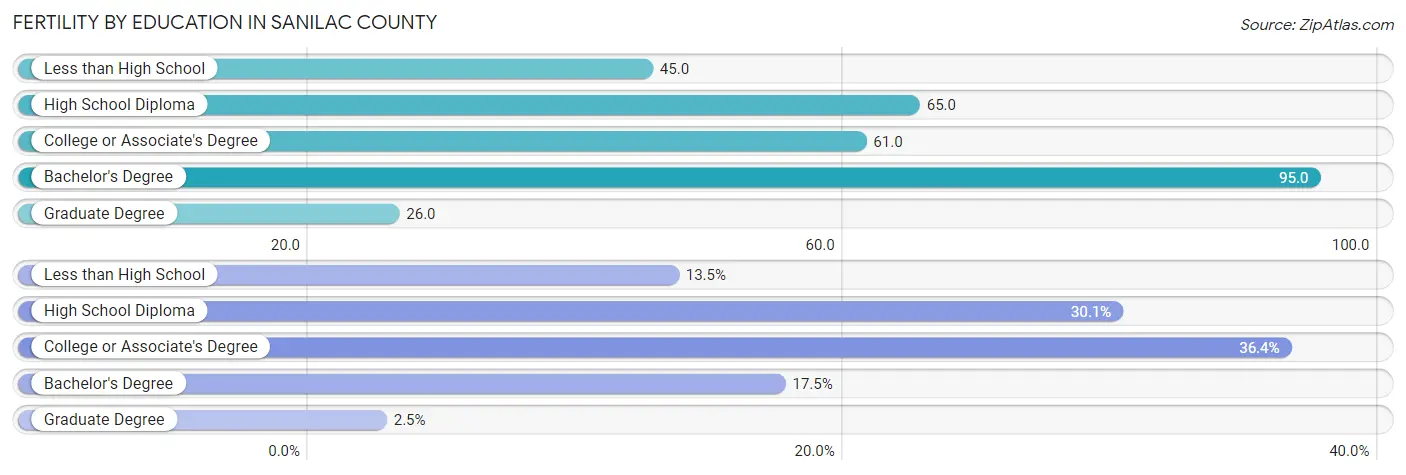
| Educational Attainment | Women with Births | Births / 1,000 Women |
| Less than High School | 64 (13.5%) | 45.0 |
| High School Diploma | 143 (30.1%) | 65.0 |
| College or Associate's Degree | 173 (36.4%) | 61.0 |
| Bachelor's Degree | 83 (17.5%) | 95.0 |
| Graduate Degree | 12 (2.5%) | 26.0 |
| Total | 475 (100.0%) | 61.0 |
Fertility by Education by Marriage Status in Sanilac County
42.1% of women with births in Sanilac County are unmarried. Women with the educational attainment of graduate degree are most likely to be married with 100.0% of them married at childbirth, while women with the educational attainment of less than high school are least likely to be married with 64.1% of them unmarried at childbirth.
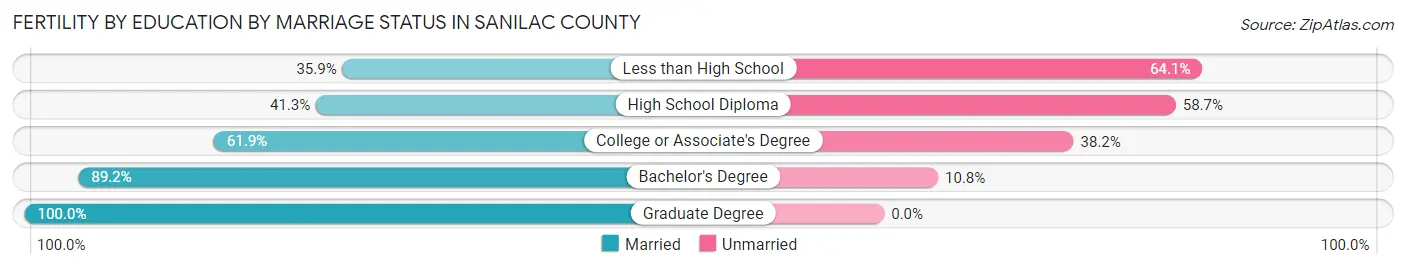
| Educational Attainment | Married | Unmarried |
| Less than High School | 23 (35.9%) | 41 (64.1%) |
| High School Diploma | 59 (41.3%) | 84 (58.7%) |
| College or Associate's Degree | 107 (61.9%) | 66 (38.2%) |
| Bachelor's Degree | 74 (89.2%) | 9 (10.8%) |
| Graduate Degree | 12 (100.0%) | 0 (0.0%) |
| Total | 275 (57.9%) | 200 (42.1%) |
Employment Characteristics in Sanilac County
Employment by Class of Employer in Sanilac County
Among the 17,035 employed individuals in Sanilac County, private company employees (11,647 | 68.4%), self-employed (not incorporated) (1,495 | 8.8%), and local government employees (1,243 | 7.3%) make up the most common classes of employment.
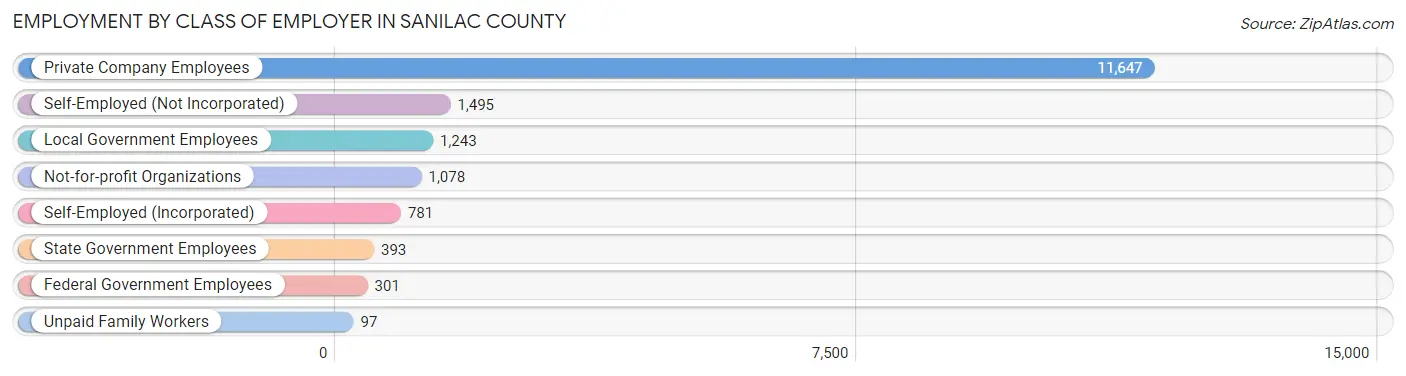
| Employer Class | # Employees | % Employees |
| Private Company Employees | 11,647 | 68.4% |
| Self-Employed (Incorporated) | 781 | 4.6% |
| Self-Employed (Not Incorporated) | 1,495 | 8.8% |
| Not-for-profit Organizations | 1,078 | 6.3% |
| Local Government Employees | 1,243 | 7.3% |
| State Government Employees | 393 | 2.3% |
| Federal Government Employees | 301 | 1.8% |
| Unpaid Family Workers | 97 | 0.6% |
| Total | 17,035 | 100.0% |
Employment Status by Age in Sanilac County
According to the labor force statistics for Sanilac County, out of the total population over 16 years of age (33,279), 55.8% or 18,570 individuals are in the labor force, with 6.5% or 1,207 of them unemployed. The age group with the highest labor force participation rate is 30 to 34 years, with 87.6% or 1,824 individuals in the labor force. Within the labor force, the 16 to 19 years age range has the highest percentage of unemployed individuals, with 18.5% or 137 of them being unemployed.
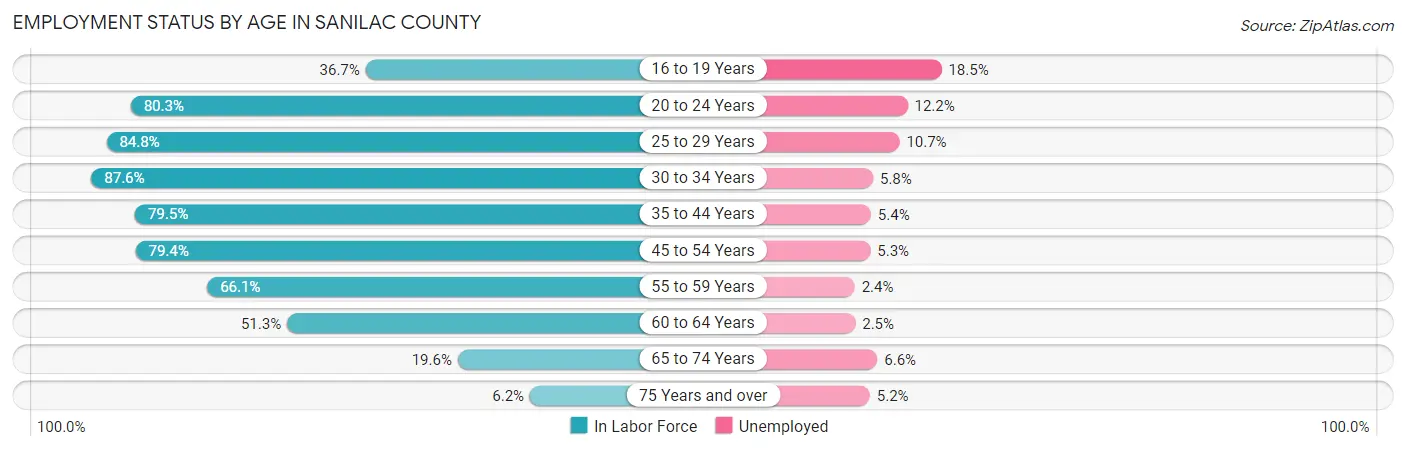
| Age Bracket | In Labor Force | Unemployed |
| 16 to 19 Years | 740 (36.7%) | 137 (18.5%) |
| 20 to 24 Years | 1,765 (80.3%) | 215 (12.2%) |
| 25 to 29 Years | 1,778 (84.8%) | 190 (10.7%) |
| 30 to 34 Years | 1,824 (87.6%) | 106 (5.8%) |
| 35 to 44 Years | 3,473 (79.5%) | 188 (5.4%) |
| 45 to 54 Years | 3,928 (79.4%) | 208 (5.3%) |
| 55 to 59 Years | 2,087 (66.1%) | 50 (2.4%) |
| 60 to 64 Years | 1,706 (51.3%) | 43 (2.5%) |
| 65 to 74 Years | 1,053 (19.6%) | 69 (6.6%) |
| 75 Years and over | 230 (6.2%) | 12 (5.2%) |
| Total | 18,570 (55.8%) | 1,207 (6.5%) |
Employment Status by Educational Attainment in Sanilac County
According to labor force statistics for Sanilac County, 74.1% of individuals (14,803) out of the total population between 25 and 64 years of age (19,977) are in the labor force, with 5.3% or 785 of them being unemployed. The group with the highest labor force participation rate are those with the educational attainment of bachelor's degree or higher, with 84.1% or 2,670 individuals in the labor force. Within the labor force, individuals with less than high school education have the highest percentage of unemployment, with 10.2% or 88 of them being unemployed.
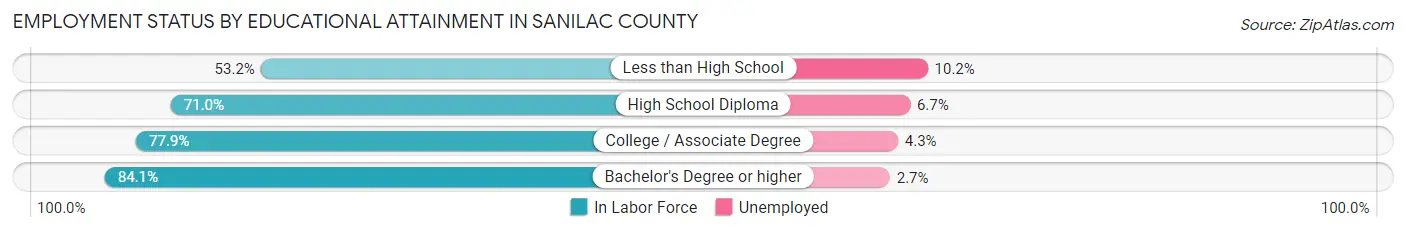
| Educational Attainment | In Labor Force | Unemployed |
| Less than High School | 865 (53.2%) | 166 (10.2%) |
| High School Diploma | 5,808 (71.0%) | 548 (6.7%) |
| College / Associate Degree | 5,450 (77.9%) | 301 (4.3%) |
| Bachelor's Degree or higher | 2,670 (84.1%) | 86 (2.7%) |
| Total | 14,803 (74.1%) | 1,059 (5.3%) |
Employment Occupations by Sex in Sanilac County
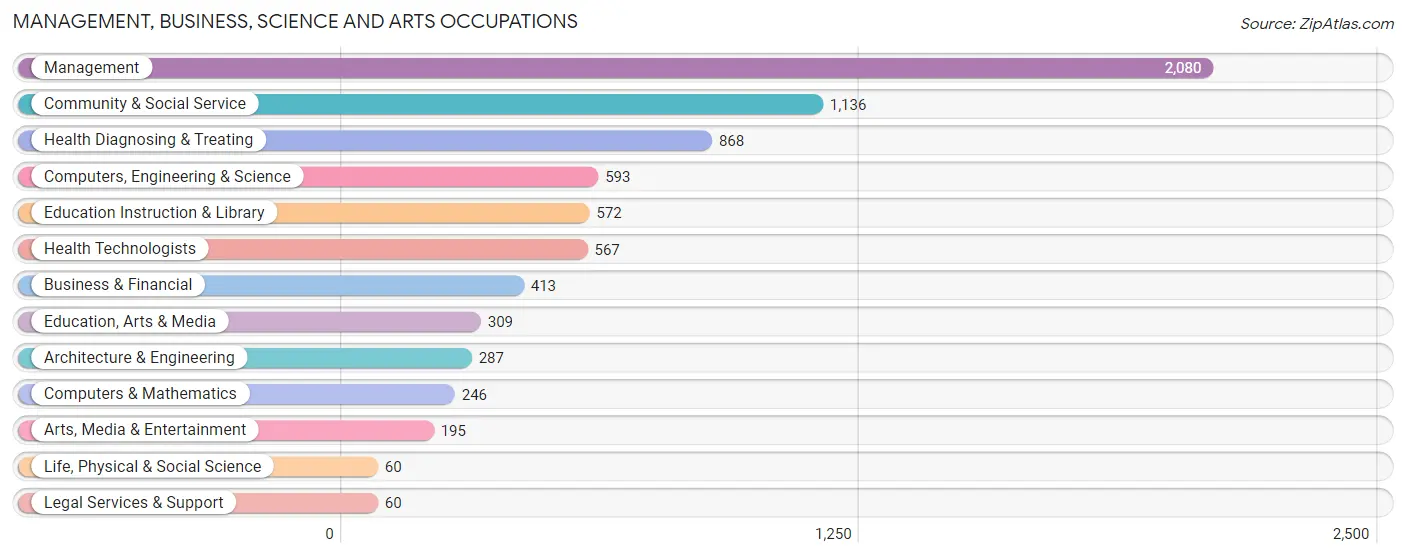
Management, Business, Science and Arts Occupations
The most common Management, Business, Science and Arts occupations in Sanilac County are Management (2,080 | 12.0%), Community & Social Service (1,136 | 6.6%), Health Diagnosing & Treating (868 | 5.0%), Computers, Engineering & Science (593 | 3.4%), and Education Instruction & Library (572 | 3.3%).
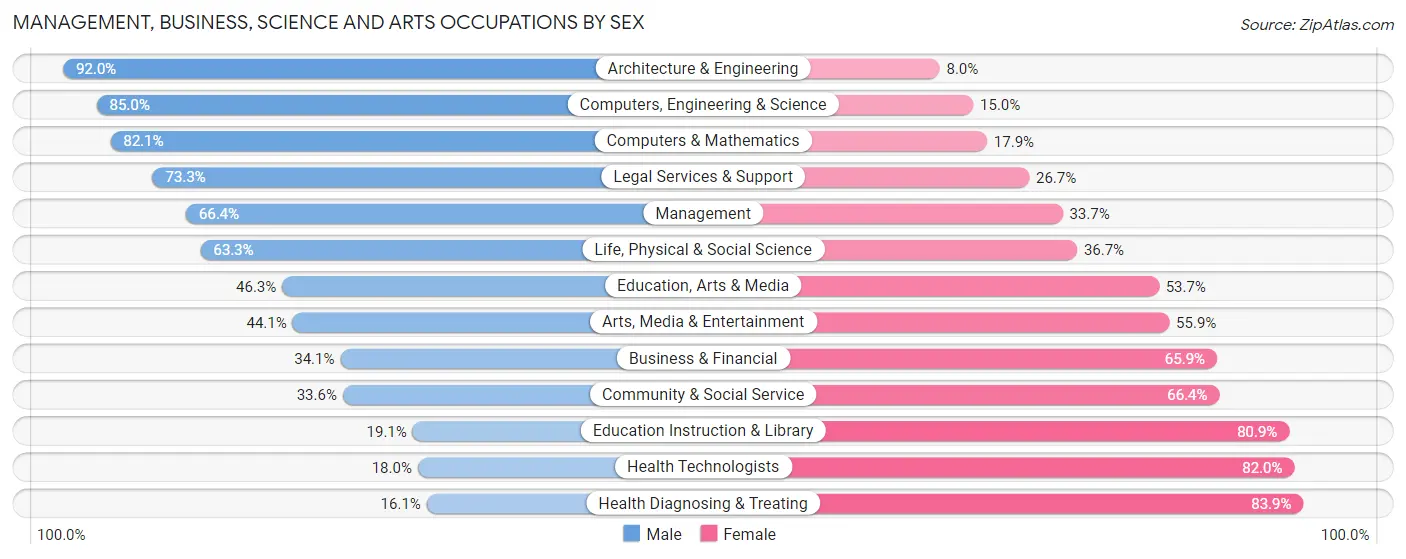
Management, Business, Science and Arts Occupations by Sex
Within the Management, Business, Science and Arts occupations in Sanilac County, the most male-oriented occupations are Architecture & Engineering (92.0%), Computers, Engineering & Science (85.0%), and Computers & Mathematics (82.1%), while the most female-oriented occupations are Health Diagnosing & Treating (83.9%), Health Technologists (82.0%), and Education Instruction & Library (80.9%).
| Occupation | Male | Female |
| Management | 1,380 (66.3%) | 700 (33.7%) |
| Business & Financial | 141 (34.1%) | 272 (65.9%) |
| Computers, Engineering & Science | 504 (85.0%) | 89 (15.0%) |
| Computers & Mathematics | 202 (82.1%) | 44 (17.9%) |
| Architecture & Engineering | 264 (92.0%) | 23 (8.0%) |
| Life, Physical & Social Science | 38 (63.3%) | 22 (36.7%) |
| Community & Social Service | 382 (33.6%) | 754 (66.4%) |
| Education, Arts & Media | 143 (46.3%) | 166 (53.7%) |
| Legal Services & Support | 44 (73.3%) | 16 (26.7%) |
| Education Instruction & Library | 109 (19.1%) | 463 (80.9%) |
| Arts, Media & Entertainment | 86 (44.1%) | 109 (55.9%) |
| Health Diagnosing & Treating | 140 (16.1%) | 728 (83.9%) |
| Health Technologists | 102 (18.0%) | 465 (82.0%) |
| Total (Category) | 2,547 (50.0%) | 2,543 (50.0%) |
| Total (Overall) | 9,533 (54.9%) | 7,816 (45.1%) |
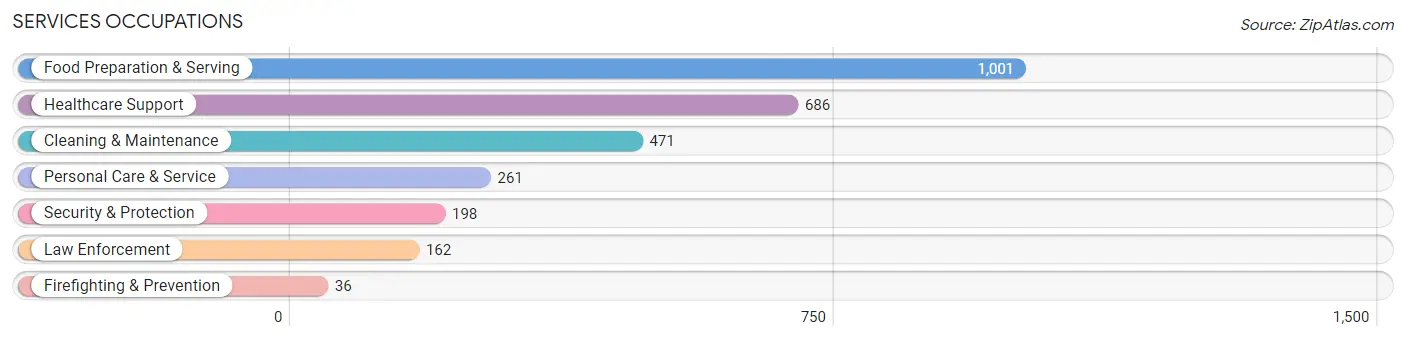
Services Occupations
The most common Services occupations in Sanilac County are Food Preparation & Serving (1,001 | 5.8%), Healthcare Support (686 | 4.0%), Cleaning & Maintenance (471 | 2.7%), Personal Care & Service (261 | 1.5%), and Security & Protection (198 | 1.1%).
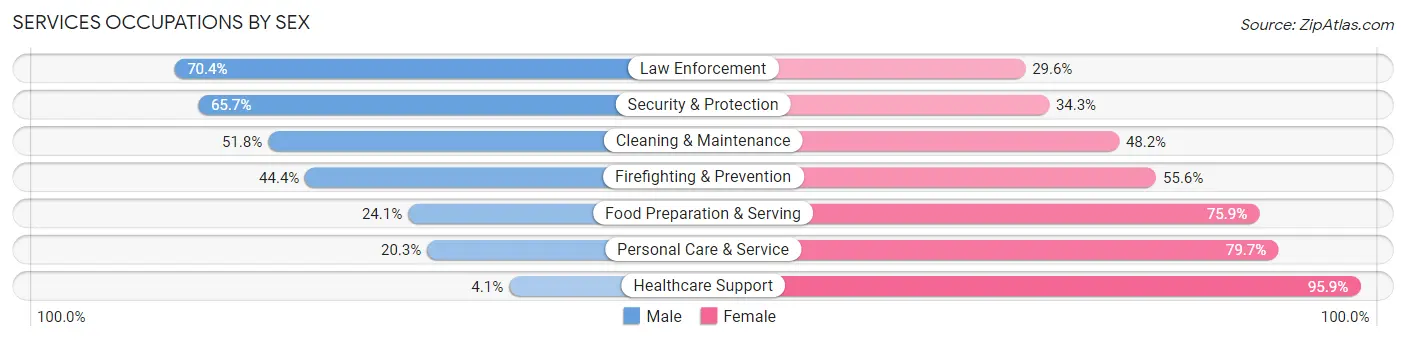
Services Occupations by Sex
Within the Services occupations in Sanilac County, the most male-oriented occupations are Law Enforcement (70.4%), Security & Protection (65.7%), and Cleaning & Maintenance (51.8%), while the most female-oriented occupations are Healthcare Support (95.9%), Personal Care & Service (79.7%), and Food Preparation & Serving (75.9%).
| Occupation | Male | Female |
| Healthcare Support | 28 (4.1%) | 658 (95.9%) |
| Security & Protection | 130 (65.7%) | 68 (34.3%) |
| Firefighting & Prevention | 16 (44.4%) | 20 (55.6%) |
| Law Enforcement | 114 (70.4%) | 48 (29.6%) |
| Food Preparation & Serving | 241 (24.1%) | 760 (75.9%) |
| Cleaning & Maintenance | 244 (51.8%) | 227 (48.2%) |
| Personal Care & Service | 53 (20.3%) | 208 (79.7%) |
| Total (Category) | 696 (26.6%) | 1,921 (73.4%) |
| Total (Overall) | 9,533 (54.9%) | 7,816 (45.1%) |
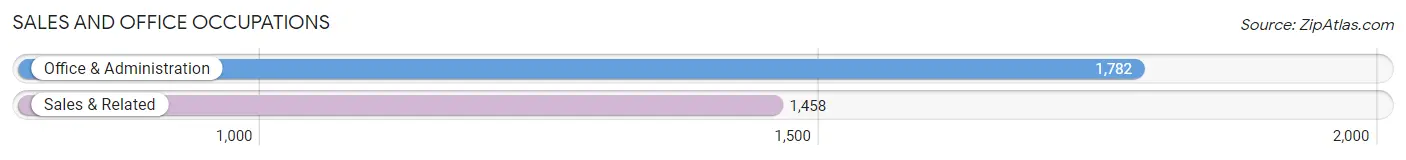
Sales and Office Occupations
The most common Sales and Office occupations in Sanilac County are Office & Administration (1,782 | 10.3%), and Sales & Related (1,458 | 8.4%).
Sales and Office Occupations by Sex
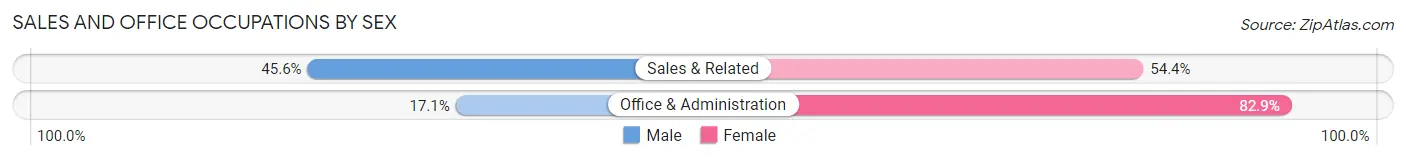
| Occupation | Male | Female |
| Sales & Related | 665 (45.6%) | 793 (54.4%) |
| Office & Administration | 305 (17.1%) | 1,477 (82.9%) |
| Total (Category) | 970 (29.9%) | 2,270 (70.1%) |
| Total (Overall) | 9,533 (54.9%) | 7,816 (45.1%) |
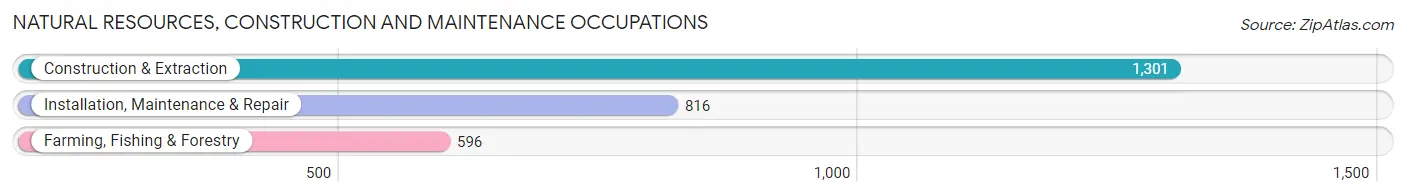
Natural Resources, Construction and Maintenance Occupations
The most common Natural Resources, Construction and Maintenance occupations in Sanilac County are Construction & Extraction (1,301 | 7.5%), Installation, Maintenance & Repair (816 | 4.7%), and Farming, Fishing & Forestry (596 | 3.4%).
Natural Resources, Construction and Maintenance Occupations by Sex
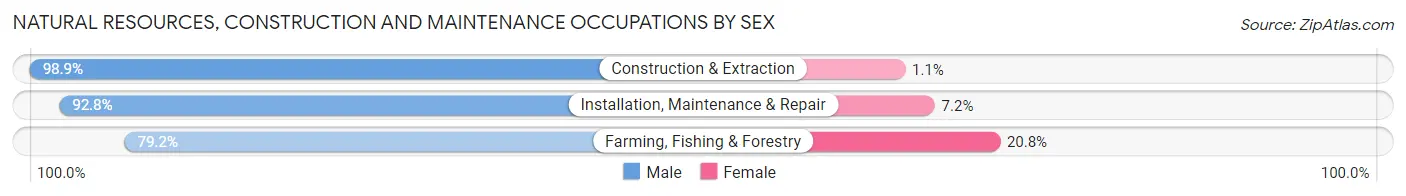
| Occupation | Male | Female |
| Farming, Fishing & Forestry | 472 (79.2%) | 124 (20.8%) |
| Construction & Extraction | 1,287 (98.9%) | 14 (1.1%) |
| Installation, Maintenance & Repair | 757 (92.8%) | 59 (7.2%) |
| Total (Category) | 2,516 (92.7%) | 197 (7.3%) |
| Total (Overall) | 9,533 (54.9%) | 7,816 (45.1%) |
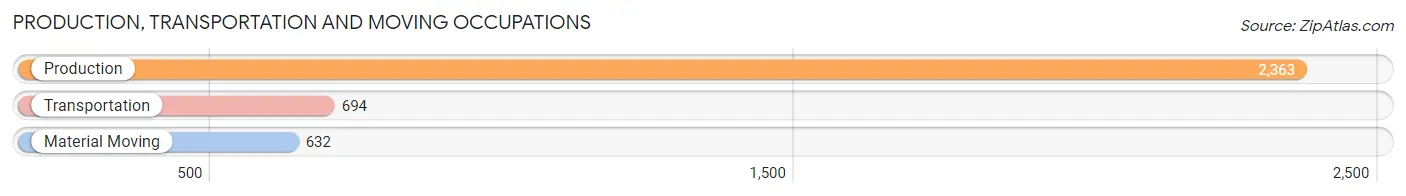
Production, Transportation and Moving Occupations
The most common Production, Transportation and Moving occupations in Sanilac County are Production (2,363 | 13.6%), Transportation (694 | 4.0%), and Material Moving (632 | 3.6%).
Production, Transportation and Moving Occupations by Sex
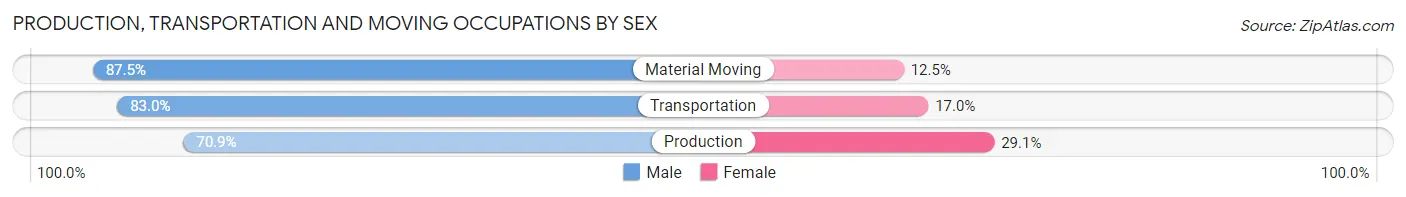
| Occupation | Male | Female |
| Production | 1,675 (70.9%) | 688 (29.1%) |
| Transportation | 576 (83.0%) | 118 (17.0%) |
| Material Moving | 553 (87.5%) | 79 (12.5%) |
| Total (Category) | 2,804 (76.0%) | 885 (24.0%) |
| Total (Overall) | 9,533 (54.9%) | 7,816 (45.1%) |
Employment Industries by Sex in Sanilac County
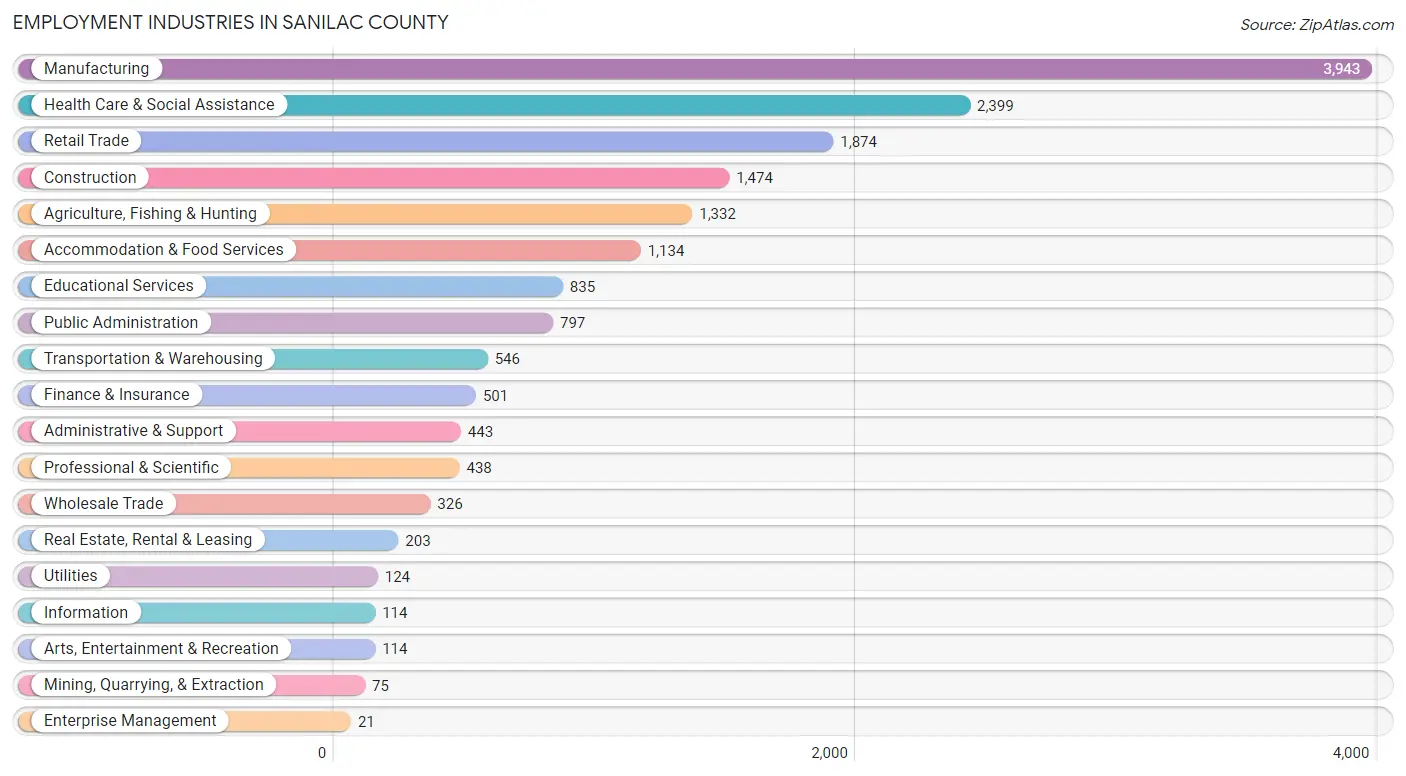
Employment Industries in Sanilac County
The major employment industries in Sanilac County include Manufacturing (3,943 | 22.7%), Health Care & Social Assistance (2,399 | 13.8%), Retail Trade (1,874 | 10.8%), Construction (1,474 | 8.5%), and Agriculture, Fishing & Hunting (1,332 | 7.7%).
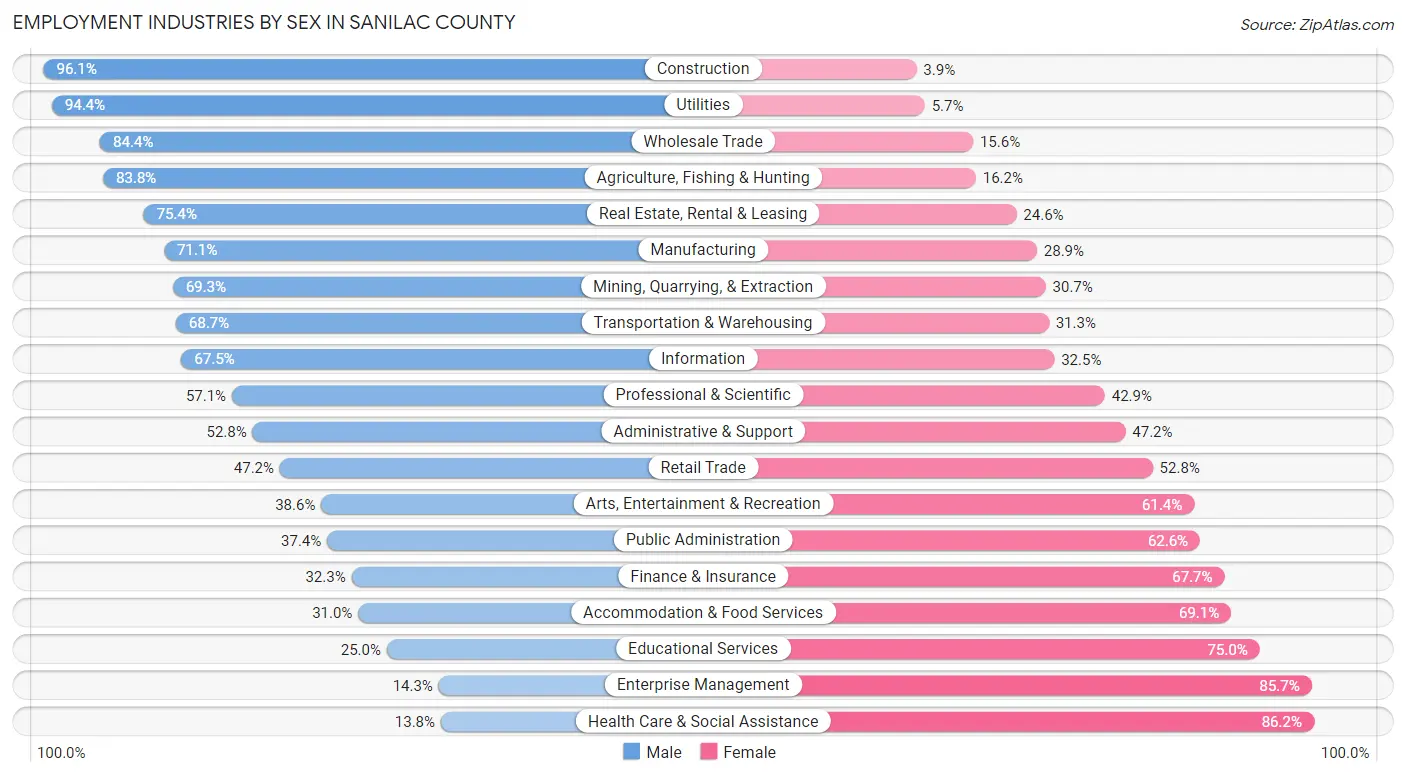
Employment Industries by Sex in Sanilac County
The Sanilac County industries that see more men than women are Construction (96.1%), Utilities (94.4%), and Wholesale Trade (84.4%), whereas the industries that tend to have a higher number of women are Health Care & Social Assistance (86.2%), Enterprise Management (85.7%), and Educational Services (75.0%).
| Industry | Male | Female |
| Agriculture, Fishing & Hunting | 1,116 (83.8%) | 216 (16.2%) |
| Mining, Quarrying, & Extraction | 52 (69.3%) | 23 (30.7%) |
| Construction | 1,416 (96.1%) | 58 (3.9%) |
| Manufacturing | 2,805 (71.1%) | 1,138 (28.9%) |
| Wholesale Trade | 275 (84.4%) | 51 (15.6%) |
| Retail Trade | 884 (47.2%) | 990 (52.8%) |
| Transportation & Warehousing | 375 (68.7%) | 171 (31.3%) |
| Utilities | 117 (94.4%) | 7 (5.7%) |
| Information | 77 (67.5%) | 37 (32.5%) |
| Finance & Insurance | 162 (32.3%) | 339 (67.7%) |
| Real Estate, Rental & Leasing | 153 (75.4%) | 50 (24.6%) |
| Professional & Scientific | 250 (57.1%) | 188 (42.9%) |
| Enterprise Management | 3 (14.3%) | 18 (85.7%) |
| Administrative & Support | 234 (52.8%) | 209 (47.2%) |
| Educational Services | 209 (25.0%) | 626 (75.0%) |
| Health Care & Social Assistance | 332 (13.8%) | 2,067 (86.2%) |
| Arts, Entertainment & Recreation | 44 (38.6%) | 70 (61.4%) |
| Accommodation & Food Services | 351 (30.9%) | 783 (69.1%) |
| Public Administration | 298 (37.4%) | 499 (62.6%) |
| Total | 9,533 (54.9%) | 7,816 (45.1%) |
Education in Sanilac County
School Enrollment in Sanilac County
The most common levels of schooling among the 7,844 students in Sanilac County are high school (1,993 | 25.4%), middle school (1,949 | 24.8%), and elementary school (1,903 | 24.3%).
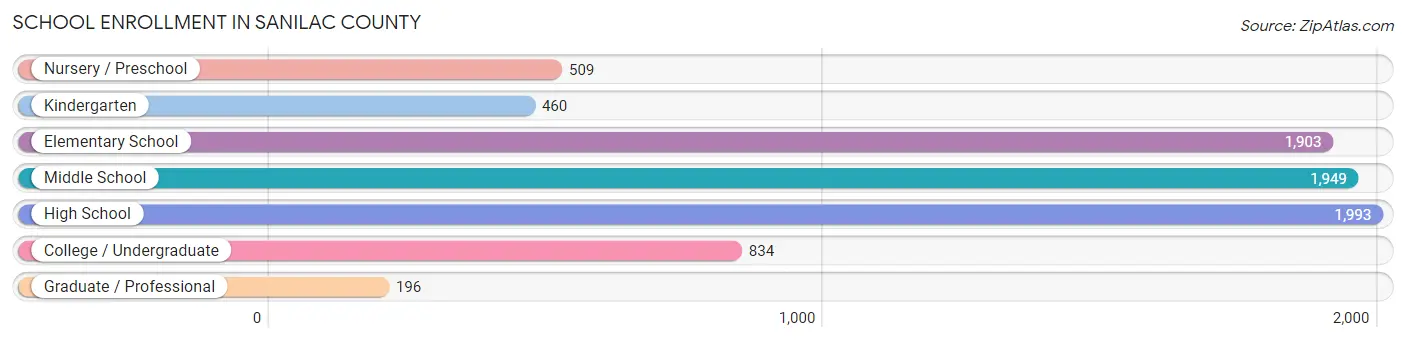
| School Level | # Students | % Students |
| Nursery / Preschool | 509 | 6.5% |
| Kindergarten | 460 | 5.9% |
| Elementary School | 1,903 | 24.3% |
| Middle School | 1,949 | 24.8% |
| High School | 1,993 | 25.4% |
| College / Undergraduate | 834 | 10.6% |
| Graduate / Professional | 196 | 2.5% |
| Total | 7,844 | 100.0% |
School Enrollment by Age by Funding Source in Sanilac County
Out of a total of 7,844 students who are enrolled in schools in Sanilac County, 1,020 (13.0%) attend a private institution, while the remaining 6,824 (87.0%) are enrolled in public schools. The age group of 35 years and over has the highest likelihood of being enrolled in private schools, with 90 (24.5% in the age bracket) enrolled. Conversely, the age group of 15 to 17 year olds has the lowest likelihood of being enrolled in a private school, with 1,347 (92.8% in the age bracket) attending a public institution.
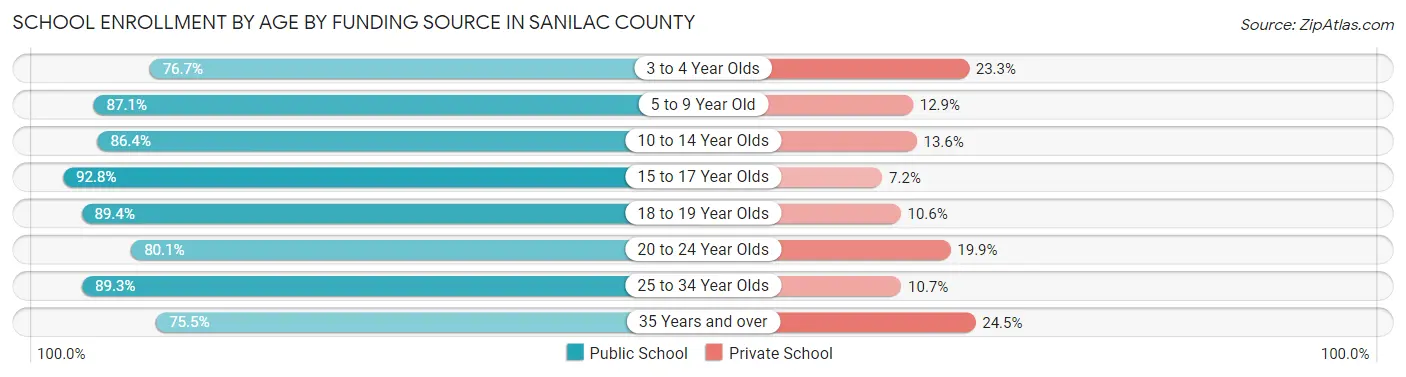
| Age Bracket | Public School | Private School |
| 3 to 4 Year Olds | 204 (76.7%) | 62 (23.3%) |
| 5 to 9 Year Old | 2,031 (87.1%) | 300 (12.9%) |
| 10 to 14 Year Olds | 2,088 (86.4%) | 328 (13.6%) |
| 15 to 17 Year Olds | 1,347 (92.8%) | 104 (7.2%) |
| 18 to 19 Year Olds | 430 (89.4%) | 51 (10.6%) |
| 20 to 24 Year Olds | 254 (80.1%) | 63 (19.9%) |
| 25 to 34 Year Olds | 192 (89.3%) | 23 (10.7%) |
| 35 Years and over | 277 (75.5%) | 90 (24.5%) |
| Total | 6,824 (87.0%) | 1,020 (13.0%) |
Educational Attainment by Field of Study in Sanilac County
Business (990 | 20.1%), education (885 | 18.0%), science & technology (543 | 11.0%), arts & humanities (380 | 7.7%), and bio, nature & agricultural (330 | 6.7%) are the most common fields of study among 4,918 individuals in Sanilac County who have obtained a bachelor's degree or higher.
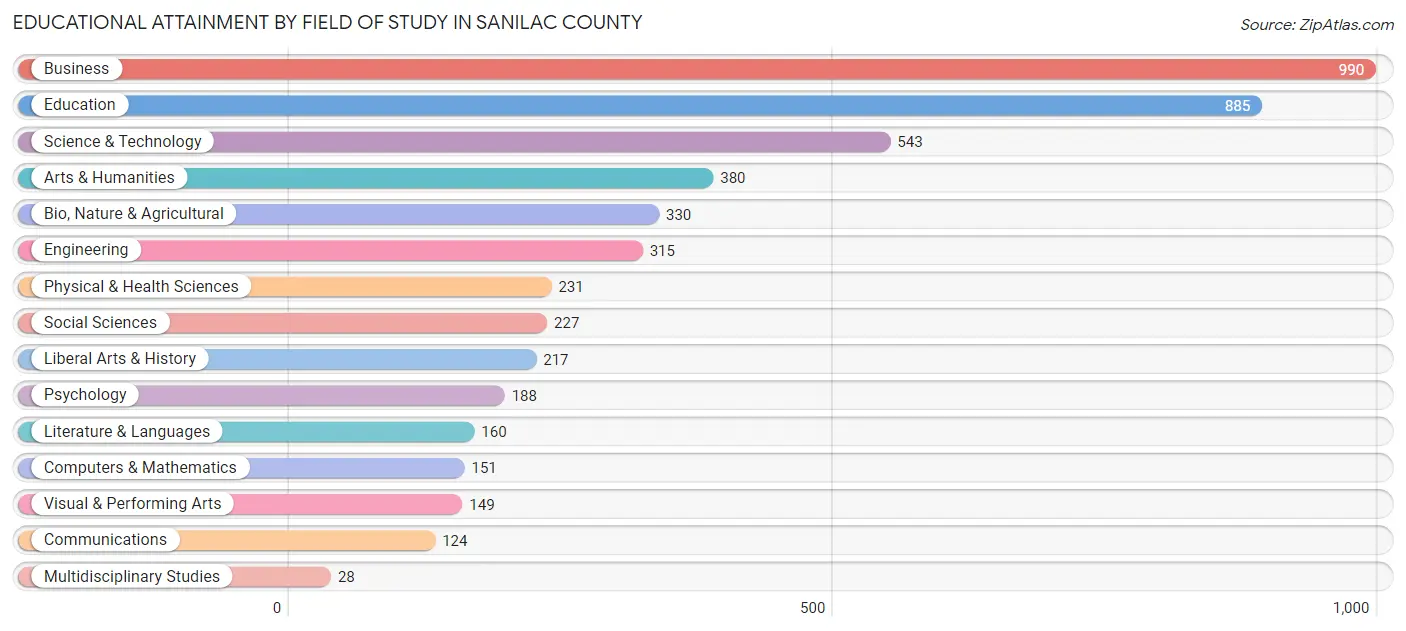
| Field of Study | # Graduates | % Graduates |
| Computers & Mathematics | 151 | 3.1% |
| Bio, Nature & Agricultural | 330 | 6.7% |
| Physical & Health Sciences | 231 | 4.7% |
| Psychology | 188 | 3.8% |
| Social Sciences | 227 | 4.6% |
| Engineering | 315 | 6.4% |
| Multidisciplinary Studies | 28 | 0.6% |
| Science & Technology | 543 | 11.0% |
| Business | 990 | 20.1% |
| Education | 885 | 18.0% |
| Literature & Languages | 160 | 3.3% |
| Liberal Arts & History | 217 | 4.4% |
| Visual & Performing Arts | 149 | 3.0% |
| Communications | 124 | 2.5% |
| Arts & Humanities | 380 | 7.7% |
| Total | 4,918 | 100.0% |
Transportation & Commute in Sanilac County
Vehicle Availability by Sex in Sanilac County
The most prevalent vehicle ownership categories in Sanilac County are males with 2 vehicles (3,782, accounting for 40.2%) and females with 2 vehicles (3,032, making up 50.1%).
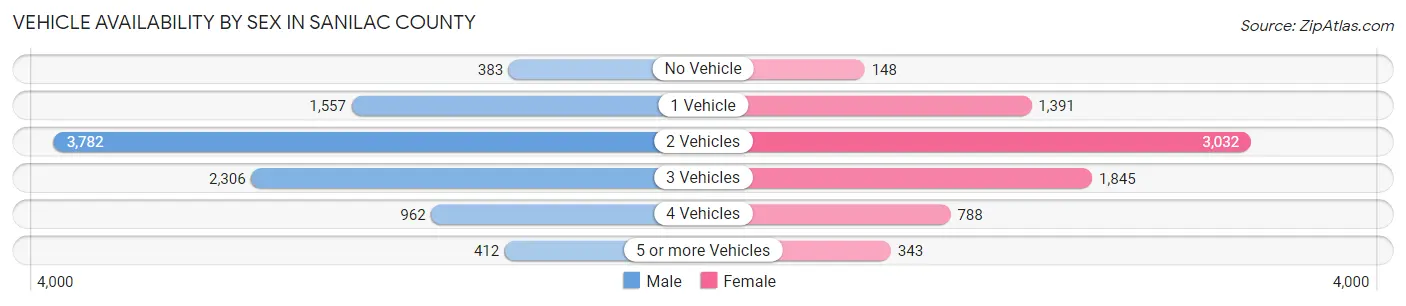
| Vehicles Available | Male | Female |
| No Vehicle | 383 (4.1%) | 148 (2.0%) |
| 1 Vehicle | 1,557 (16.6%) | 1,391 (18.4%) |
| 2 Vehicles | 3,782 (40.2%) | 3,032 (40.2%) |
| 3 Vehicles | 2,306 (24.5%) | 1,845 (24.4%) |
| 4 Vehicles | 962 (10.2%) | 788 (10.4%) |
| 5 or more Vehicles | 412 (4.4%) | 343 (4.5%) |
| Total | 9,402 (100.0%) | 7,547 (100.0%) |
Commute Time in Sanilac County
The most frequently occuring commute durations in Sanilac County are 5 to 9 minutes (2,115 commuters, 13.4%), 15 to 19 minutes (1,843 commuters, 11.7%), and 10 to 14 minutes (1,793 commuters, 11.4%).
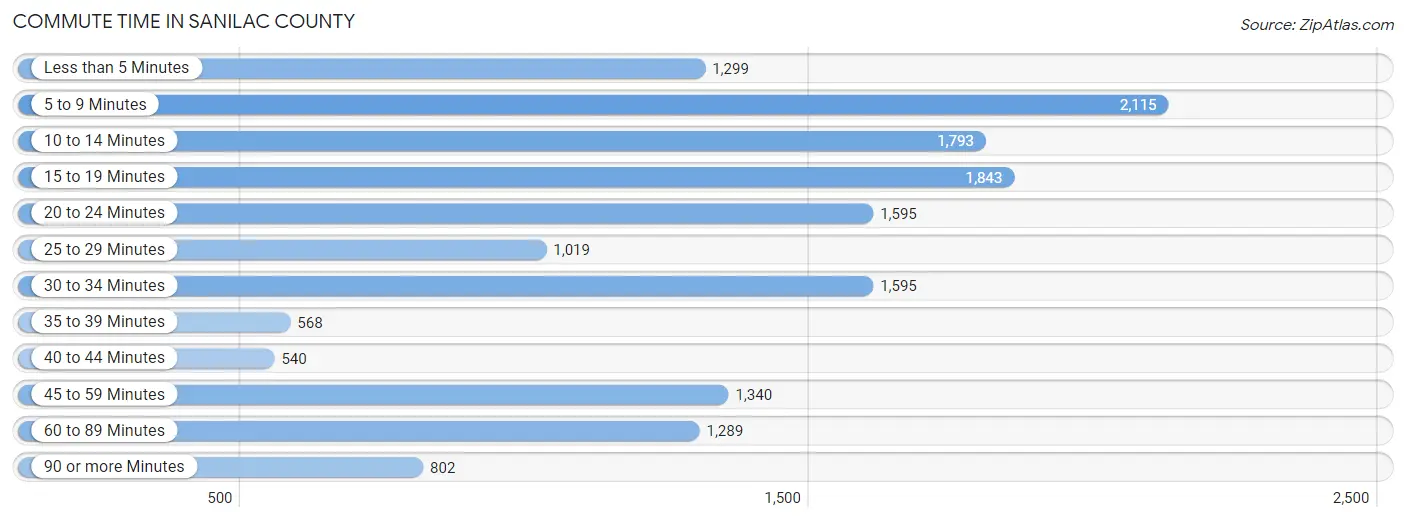
| Commute Time | # Commuters | % Commuters |
| Less than 5 Minutes | 1,299 | 8.2% |
| 5 to 9 Minutes | 2,115 | 13.4% |
| 10 to 14 Minutes | 1,793 | 11.4% |
| 15 to 19 Minutes | 1,843 | 11.7% |
| 20 to 24 Minutes | 1,595 | 10.1% |
| 25 to 29 Minutes | 1,019 | 6.5% |
| 30 to 34 Minutes | 1,595 | 10.1% |
| 35 to 39 Minutes | 568 | 3.6% |
| 40 to 44 Minutes | 540 | 3.4% |
| 45 to 59 Minutes | 1,340 | 8.5% |
| 60 to 89 Minutes | 1,289 | 8.2% |
| 90 or more Minutes | 802 | 5.1% |
Commute Time by Sex in Sanilac County
The most common commute times in Sanilac County are 5 to 9 minutes (1,128 commuters, 12.9%) for males and 10 to 14 minutes (989 commuters, 14.0%) for females.
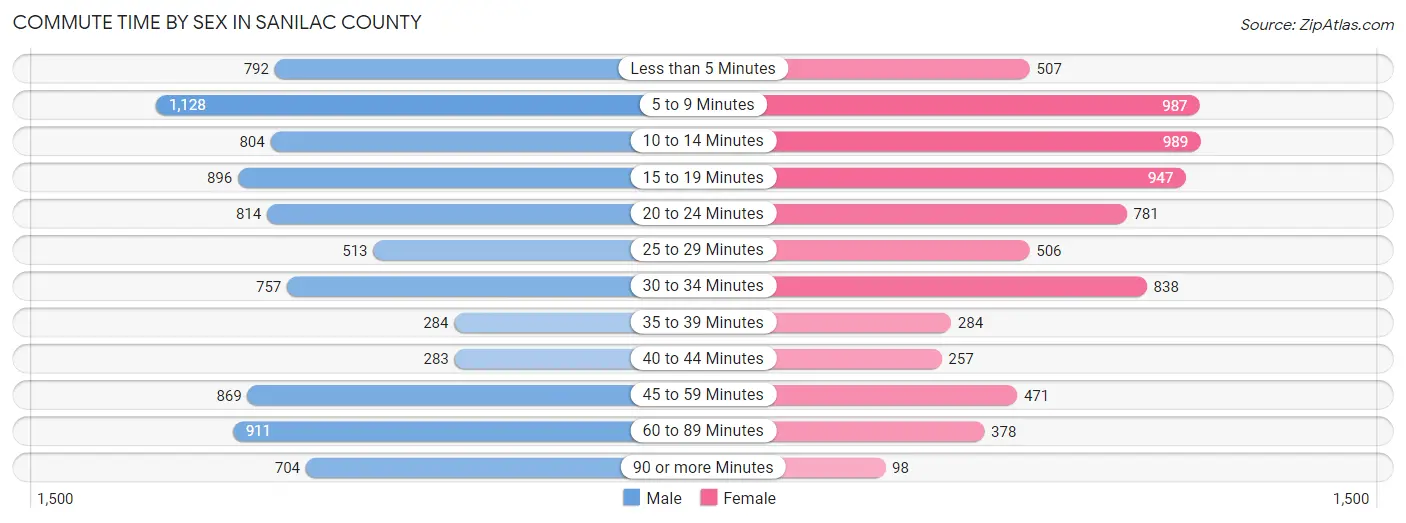
| Commute Time | Male | Female |
| Less than 5 Minutes | 792 (9.0%) | 507 (7.2%) |
| 5 to 9 Minutes | 1,128 (12.9%) | 987 (14.0%) |
| 10 to 14 Minutes | 804 (9.2%) | 989 (14.0%) |
| 15 to 19 Minutes | 896 (10.2%) | 947 (13.5%) |
| 20 to 24 Minutes | 814 (9.3%) | 781 (11.1%) |
| 25 to 29 Minutes | 513 (5.9%) | 506 (7.2%) |
| 30 to 34 Minutes | 757 (8.6%) | 838 (11.9%) |
| 35 to 39 Minutes | 284 (3.2%) | 284 (4.0%) |
| 40 to 44 Minutes | 283 (3.2%) | 257 (3.6%) |
| 45 to 59 Minutes | 869 (9.9%) | 471 (6.7%) |
| 60 to 89 Minutes | 911 (10.4%) | 378 (5.4%) |
| 90 or more Minutes | 704 (8.0%) | 98 (1.4%) |
Time of Departure to Work by Sex in Sanilac County
The most frequent times of departure to work in Sanilac County are 12:00 AM to 4:59 AM (1,188, 13.6%) for males and 7:30 AM to 7:59 AM (1,233, 17.5%) for females.
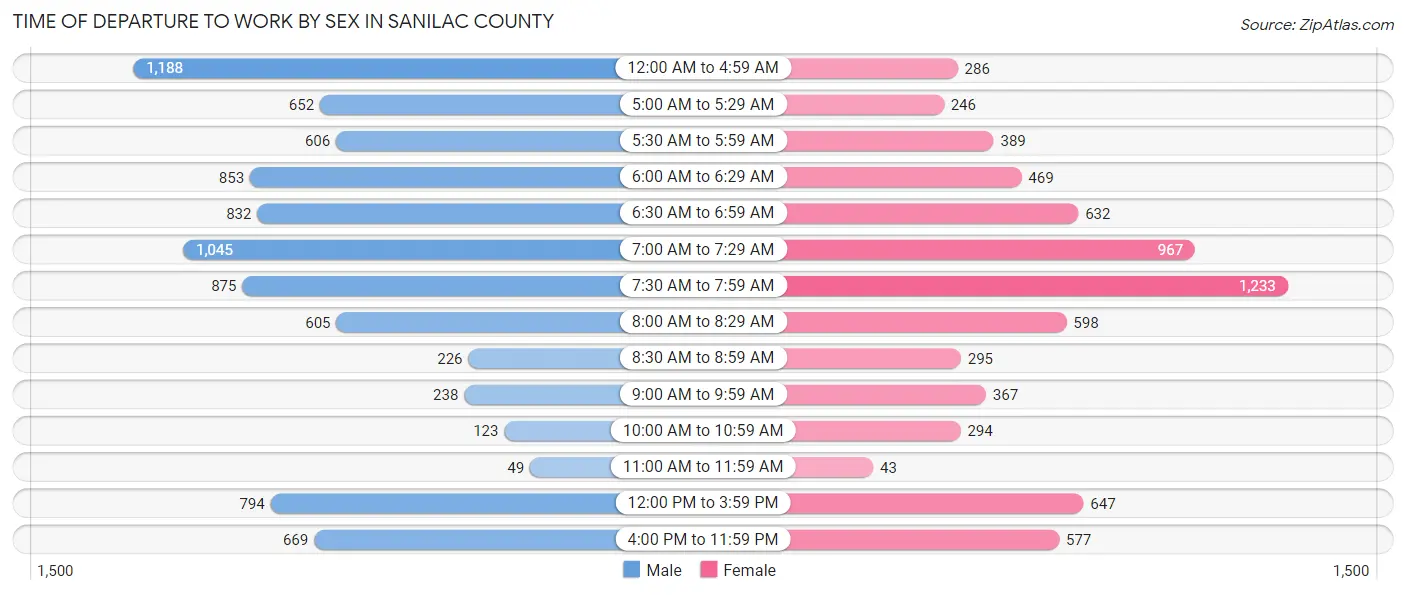
| Time of Departure | Male | Female |
| 12:00 AM to 4:59 AM | 1,188 (13.6%) | 286 (4.1%) |
| 5:00 AM to 5:29 AM | 652 (7.4%) | 246 (3.5%) |
| 5:30 AM to 5:59 AM | 606 (6.9%) | 389 (5.5%) |
| 6:00 AM to 6:29 AM | 853 (9.7%) | 469 (6.7%) |
| 6:30 AM to 6:59 AM | 832 (9.5%) | 632 (9.0%) |
| 7:00 AM to 7:29 AM | 1,045 (11.9%) | 967 (13.7%) |
| 7:30 AM to 7:59 AM | 875 (10.0%) | 1,233 (17.5%) |
| 8:00 AM to 8:29 AM | 605 (6.9%) | 598 (8.5%) |
| 8:30 AM to 8:59 AM | 226 (2.6%) | 295 (4.2%) |
| 9:00 AM to 9:59 AM | 238 (2.7%) | 367 (5.2%) |
| 10:00 AM to 10:59 AM | 123 (1.4%) | 294 (4.2%) |
| 11:00 AM to 11:59 AM | 49 (0.6%) | 43 (0.6%) |
| 12:00 PM to 3:59 PM | 794 (9.1%) | 647 (9.2%) |
| 4:00 PM to 11:59 PM | 669 (7.6%) | 577 (8.2%) |
| Total | 8,755 (100.0%) | 7,043 (100.0%) |
Housing Occupancy in Sanilac County
Occupancy by Ownership in Sanilac County
Of the total 17,296 dwellings in Sanilac County, owner-occupied units account for 13,787 (79.7%), while renter-occupied units make up 3,509 (20.3%).
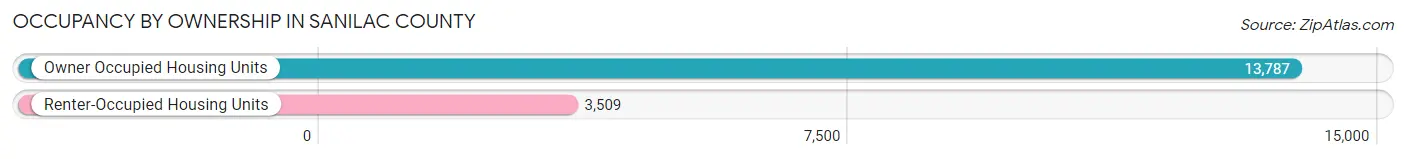
| Occupancy | # Housing Units | % Housing Units |
| Owner Occupied Housing Units | 13,787 | 79.7% |
| Renter-Occupied Housing Units | 3,509 | 20.3% |
| Total Occupied Housing Units | 17,296 | 100.0% |
Occupancy by Household Size in Sanilac County
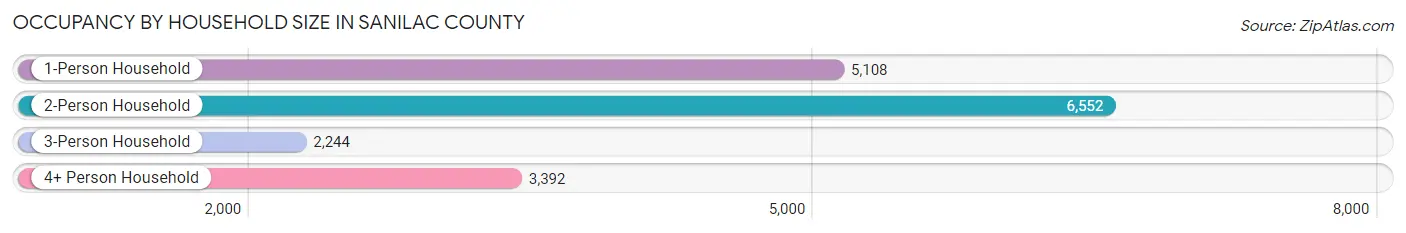
| Household Size | # Housing Units | % Housing Units |
| 1-Person Household | 5,108 | 29.5% |
| 2-Person Household | 6,552 | 37.9% |
| 3-Person Household | 2,244 | 13.0% |
| 4+ Person Household | 3,392 | 19.6% |
| Total Housing Units | 17,296 | 100.0% |
Occupancy by Ownership by Household Size in Sanilac County
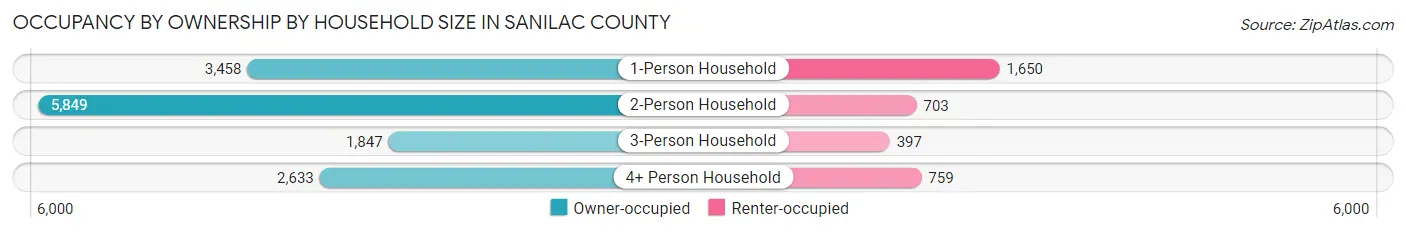
| Household Size | Owner-occupied | Renter-occupied |
| 1-Person Household | 3,458 (67.7%) | 1,650 (32.3%) |
| 2-Person Household | 5,849 (89.3%) | 703 (10.7%) |
| 3-Person Household | 1,847 (82.3%) | 397 (17.7%) |
| 4+ Person Household | 2,633 (77.6%) | 759 (22.4%) |
| Total Housing Units | 13,787 (79.7%) | 3,509 (20.3%) |
Occupancy by Educational Attainment in Sanilac County
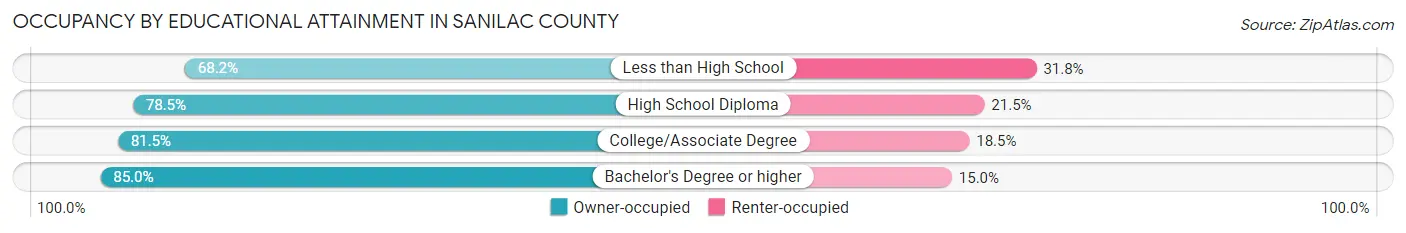
| Household Size | Owner-occupied | Renter-occupied |
| Less than High School | 1,022 (68.2%) | 476 (31.8%) |
| High School Diploma | 5,654 (78.5%) | 1,545 (21.5%) |
| College/Associate Degree | 4,665 (81.5%) | 1,056 (18.5%) |
| Bachelor's Degree or higher | 2,446 (85.0%) | 432 (15.0%) |
Occupancy by Age of Householder in Sanilac County
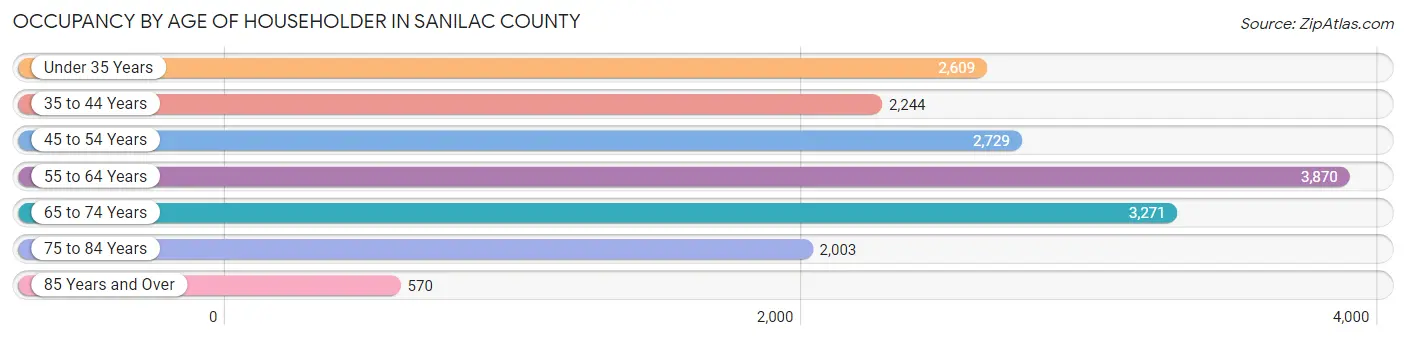
| Age Bracket | # Households | % Households |
| Under 35 Years | 2,609 | 15.1% |
| 35 to 44 Years | 2,244 | 13.0% |
| 45 to 54 Years | 2,729 | 15.8% |
| 55 to 64 Years | 3,870 | 22.4% |
| 65 to 74 Years | 3,271 | 18.9% |
| 75 to 84 Years | 2,003 | 11.6% |
| 85 Years and Over | 570 | 3.3% |
| Total | 17,296 | 100.0% |
Housing Finances in Sanilac County
Median Income by Occupancy in Sanilac County
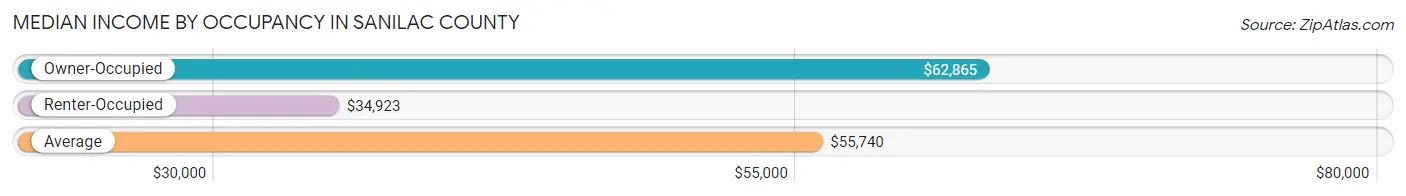
| Occupancy Type | # Households | Median Income |
| Owner-Occupied | 13,787 (79.7%) | $62,865 |
| Renter-Occupied | 3,509 (20.3%) | $34,923 |
| Average | 17,296 (100.0%) | $55,740 |
Occupancy by Householder Income Bracket in Sanilac County
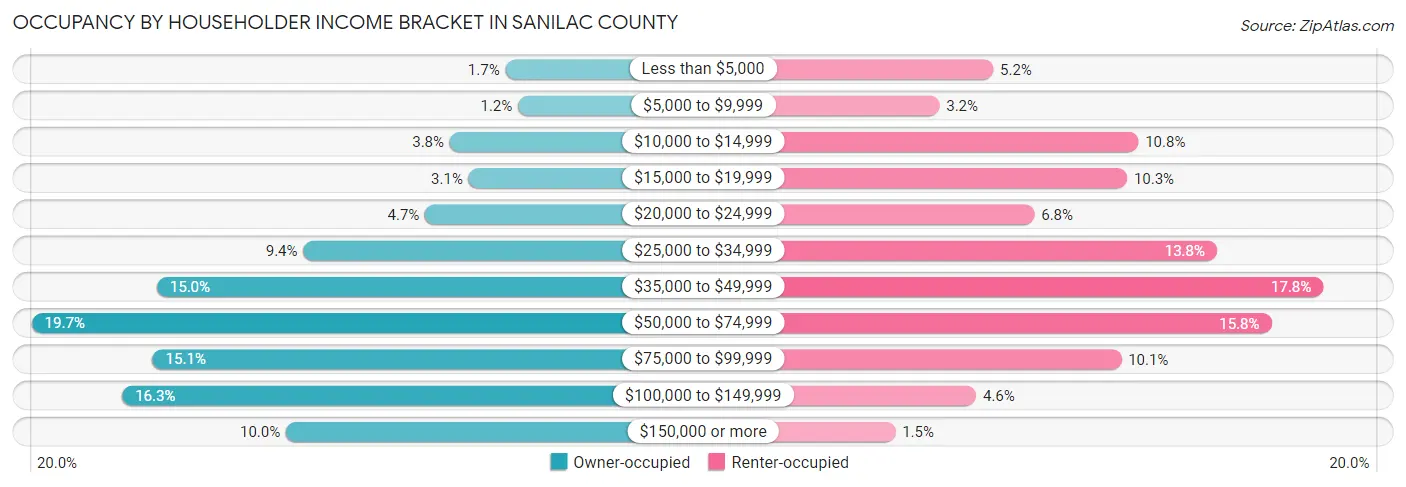
| Income Bracket | Owner-occupied | Renter-occupied |
| Less than $5,000 | 231 (1.7%) | 184 (5.2%) |
| $5,000 to $9,999 | 166 (1.2%) | 112 (3.2%) |
| $10,000 to $14,999 | 524 (3.8%) | 378 (10.8%) |
| $15,000 to $19,999 | 425 (3.1%) | 363 (10.3%) |
| $20,000 to $24,999 | 653 (4.7%) | 239 (6.8%) |
| $25,000 to $34,999 | 1,293 (9.4%) | 483 (13.8%) |
| $35,000 to $49,999 | 2,062 (15.0%) | 625 (17.8%) |
| $50,000 to $74,999 | 2,720 (19.7%) | 556 (15.8%) |
| $75,000 to $99,999 | 2,085 (15.1%) | 355 (10.1%) |
| $100,000 to $149,999 | 2,244 (16.3%) | 161 (4.6%) |
| $150,000 or more | 1,384 (10.0%) | 53 (1.5%) |
| Total | 13,787 (100.0%) | 3,509 (100.0%) |
Monthly Housing Cost Tiers in Sanilac County
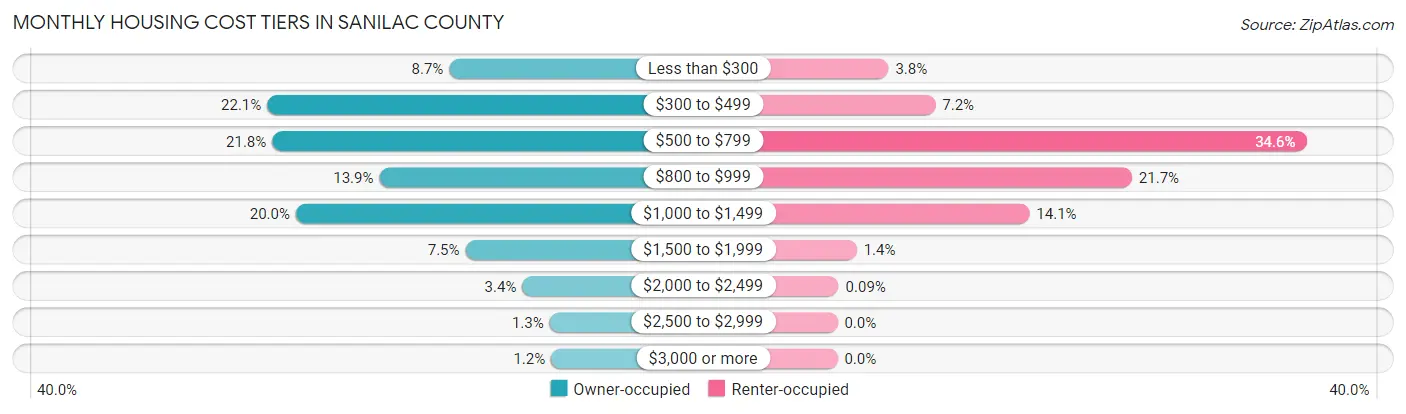
| Monthly Cost | Owner-occupied | Renter-occupied |
| Less than $300 | 1,204 (8.7%) | 132 (3.8%) |
| $300 to $499 | 3,052 (22.1%) | 253 (7.2%) |
| $500 to $799 | 3,002 (21.8%) | 1,214 (34.6%) |
| $800 to $999 | 1,913 (13.9%) | 761 (21.7%) |
| $1,000 to $1,499 | 2,761 (20.0%) | 496 (14.1%) |
| $1,500 to $1,999 | 1,039 (7.5%) | 50 (1.4%) |
| $2,000 to $2,499 | 462 (3.4%) | 3 (0.1%) |
| $2,500 to $2,999 | 185 (1.3%) | 0 (0.0%) |
| $3,000 or more | 169 (1.2%) | 0 (0.0%) |
| Total | 13,787 (100.0%) | 3,509 (100.0%) |
Physical Housing Characteristics in Sanilac County
Housing Structures in Sanilac County
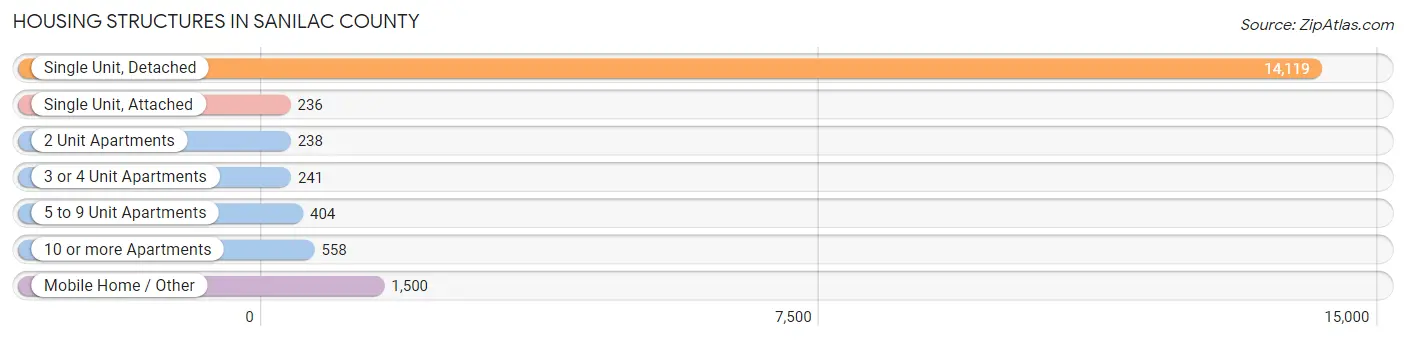
| Structure Type | # Housing Units | % Housing Units |
| Single Unit, Detached | 14,119 | 81.6% |
| Single Unit, Attached | 236 | 1.4% |
| 2 Unit Apartments | 238 | 1.4% |
| 3 or 4 Unit Apartments | 241 | 1.4% |
| 5 to 9 Unit Apartments | 404 | 2.3% |
| 10 or more Apartments | 558 | 3.2% |
| Mobile Home / Other | 1,500 | 8.7% |
| Total | 17,296 | 100.0% |
Housing Structures by Occupancy in Sanilac County
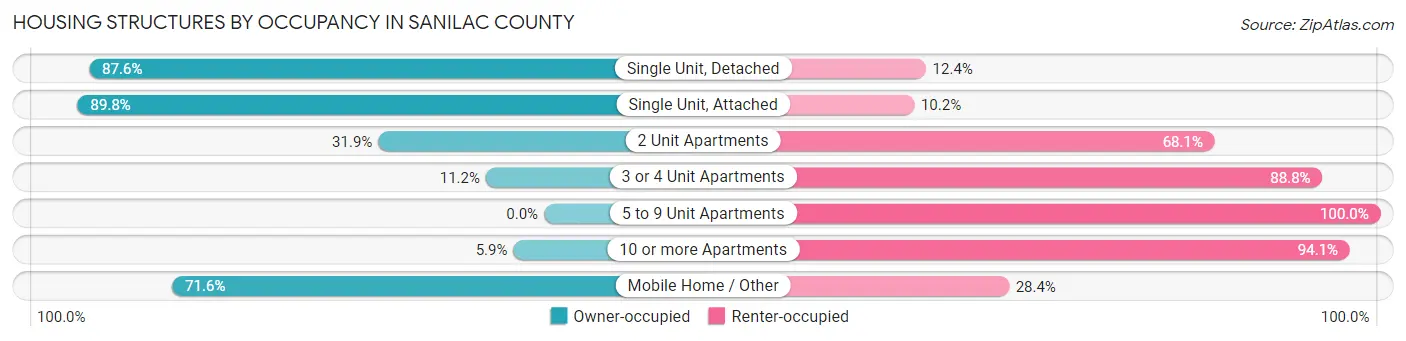
| Structure Type | Owner-occupied | Renter-occupied |
| Single Unit, Detached | 12,365 (87.6%) | 1,754 (12.4%) |
| Single Unit, Attached | 212 (89.8%) | 24 (10.2%) |
| 2 Unit Apartments | 76 (31.9%) | 162 (68.1%) |
| 3 or 4 Unit Apartments | 27 (11.2%) | 214 (88.8%) |
| 5 to 9 Unit Apartments | 0 (0.0%) | 404 (100.0%) |
| 10 or more Apartments | 33 (5.9%) | 525 (94.1%) |
| Mobile Home / Other | 1,074 (71.6%) | 426 (28.4%) |
| Total | 13,787 (79.7%) | 3,509 (20.3%) |
Housing Structures by Number of Rooms in Sanilac County
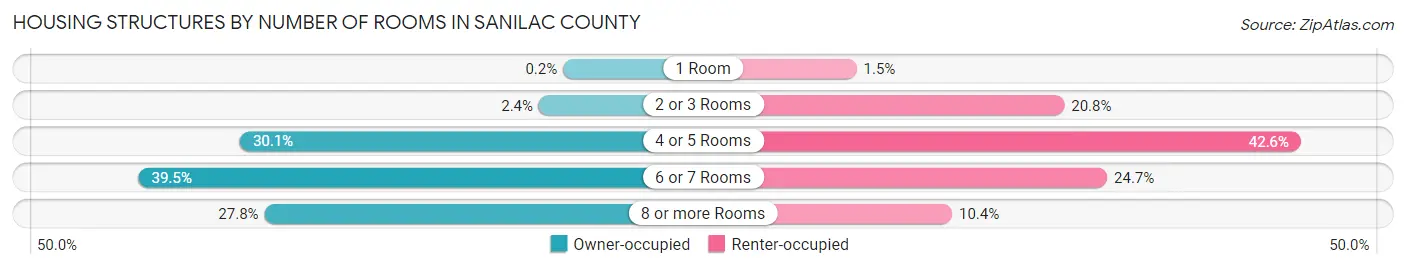
| Number of Rooms | Owner-occupied | Renter-occupied |
| 1 Room | 27 (0.2%) | 54 (1.5%) |
| 2 or 3 Rooms | 336 (2.4%) | 728 (20.7%) |
| 4 or 5 Rooms | 4,147 (30.1%) | 1,496 (42.6%) |
| 6 or 7 Rooms | 5,441 (39.5%) | 867 (24.7%) |
| 8 or more Rooms | 3,836 (27.8%) | 364 (10.4%) |
| Total | 13,787 (100.0%) | 3,509 (100.0%) |
Housing Structure by Heating Type in Sanilac County
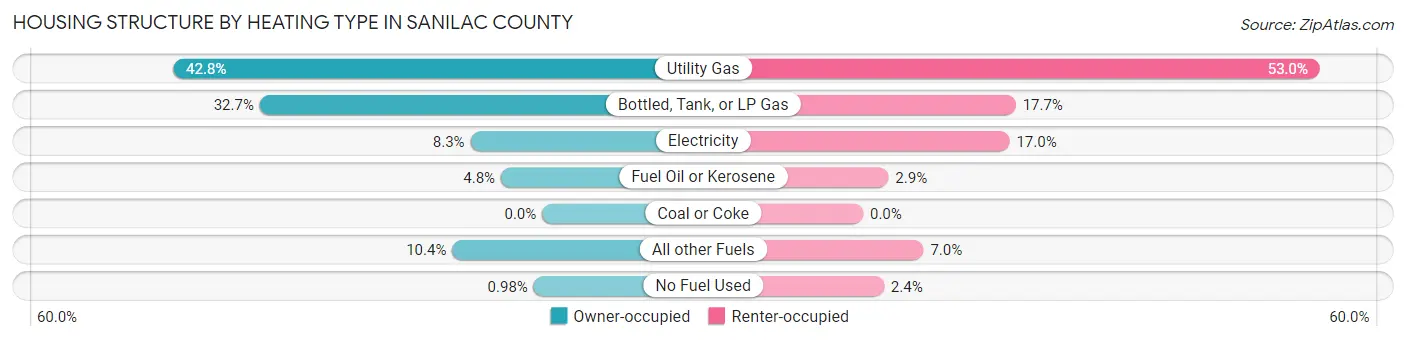
| Heating Type | Owner-occupied | Renter-occupied |
| Utility Gas | 5,898 (42.8%) | 1,858 (52.9%) |
| Bottled, Tank, or LP Gas | 4,514 (32.7%) | 621 (17.7%) |
| Electricity | 1,146 (8.3%) | 596 (17.0%) |
| Fuel Oil or Kerosene | 658 (4.8%) | 103 (2.9%) |
| Coal or Coke | 0 (0.0%) | 0 (0.0%) |
| All other Fuels | 1,436 (10.4%) | 246 (7.0%) |
| No Fuel Used | 135 (1.0%) | 85 (2.4%) |
| Total | 13,787 (100.0%) | 3,509 (100.0%) |
Household Vehicle Usage in Sanilac County
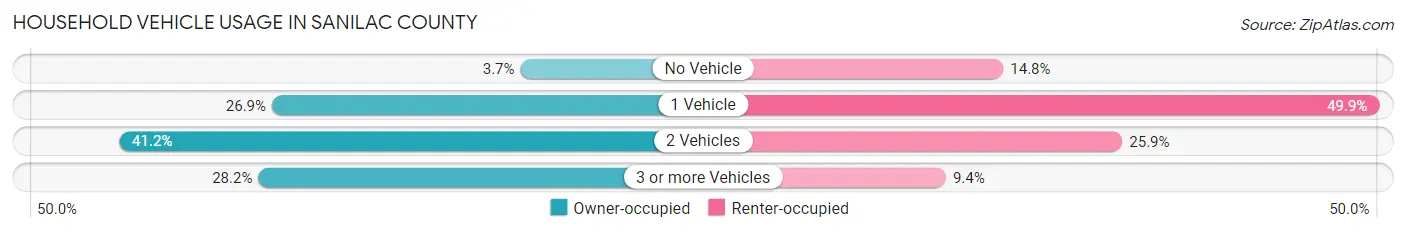
| Vehicles per Household | Owner-occupied | Renter-occupied |
| No Vehicle | 513 (3.7%) | 519 (14.8%) |
| 1 Vehicle | 3,712 (26.9%) | 1,750 (49.9%) |
| 2 Vehicles | 5,676 (41.2%) | 909 (25.9%) |
| 3 or more Vehicles | 3,886 (28.2%) | 331 (9.4%) |
| Total | 13,787 (100.0%) | 3,509 (100.0%) |
Real Estate & Mortgages in Sanilac County
Real Estate and Mortgage Overview in Sanilac County
| Characteristic | Without Mortgage | With Mortgage |
| Housing Units | 6,895 | 6,892 |
| Median Property Value | $135,300 | $158,100 |
| Median Household Income | $51,620 | $898 |
| Monthly Housing Costs | $453 | $160 |
| Real Estate Taxes | $1,394 | $361 |
Property Value by Mortgage Status in Sanilac County
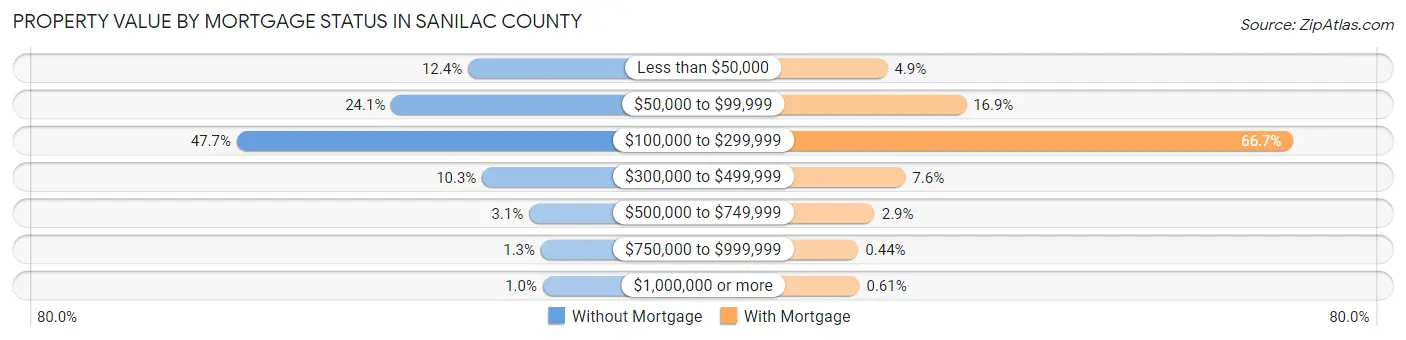
| Property Value | Without Mortgage | With Mortgage |
| Less than $50,000 | 858 (12.4%) | 335 (4.9%) |
| $50,000 to $99,999 | 1,664 (24.1%) | 1,162 (16.9%) |
| $100,000 to $299,999 | 3,287 (47.7%) | 4,597 (66.7%) |
| $300,000 to $499,999 | 708 (10.3%) | 524 (7.6%) |
| $500,000 to $749,999 | 215 (3.1%) | 202 (2.9%) |
| $750,000 to $999,999 | 92 (1.3%) | 30 (0.4%) |
| $1,000,000 or more | 71 (1.0%) | 42 (0.6%) |
| Total | 6,895 (100.0%) | 6,892 (100.0%) |
Household Income by Mortgage Status in Sanilac County
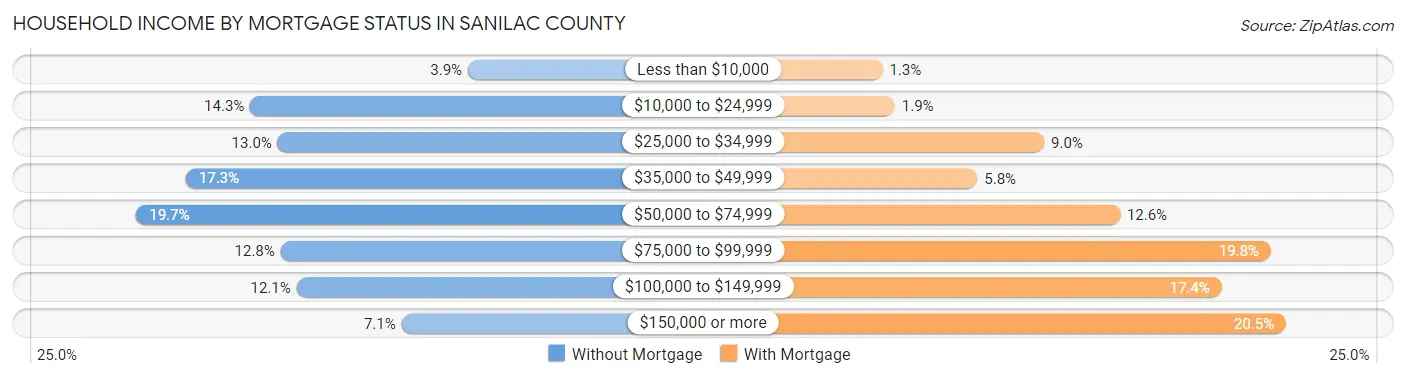
| Household Income | Without Mortgage | With Mortgage |
| Less than $10,000 | 268 (3.9%) | 88 (1.3%) |
| $10,000 to $24,999 | 983 (14.3%) | 129 (1.9%) |
| $25,000 to $34,999 | 893 (13.0%) | 619 (9.0%) |
| $35,000 to $49,999 | 1,194 (17.3%) | 400 (5.8%) |
| $50,000 to $74,999 | 1,357 (19.7%) | 868 (12.6%) |
| $75,000 to $99,999 | 883 (12.8%) | 1,363 (19.8%) |
| $100,000 to $149,999 | 831 (12.0%) | 1,202 (17.4%) |
| $150,000 or more | 486 (7.0%) | 1,413 (20.5%) |
| Total | 6,895 (100.0%) | 6,892 (100.0%) |
Property Value to Household Income Ratio in Sanilac County
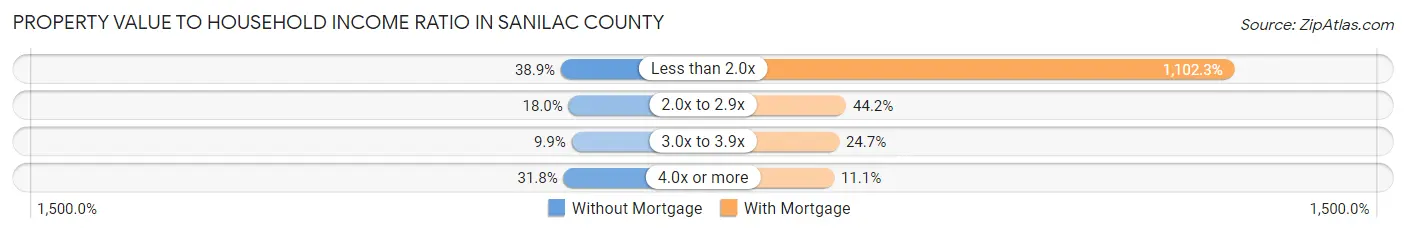
| Value-to-Income Ratio | Without Mortgage | With Mortgage |
| Less than 2.0x | 2,683 (38.9%) | 75,968 (1,102.3%) |
| 2.0x to 2.9x | 1,244 (18.0%) | 3,043 (44.2%) |
| 3.0x to 3.9x | 683 (9.9%) | 1,700 (24.7%) |
| 4.0x or more | 2,193 (31.8%) | 762 (11.1%) |
| Total | 6,895 (100.0%) | 6,892 (100.0%) |
Real Estate Taxes by Mortgage Status in Sanilac County
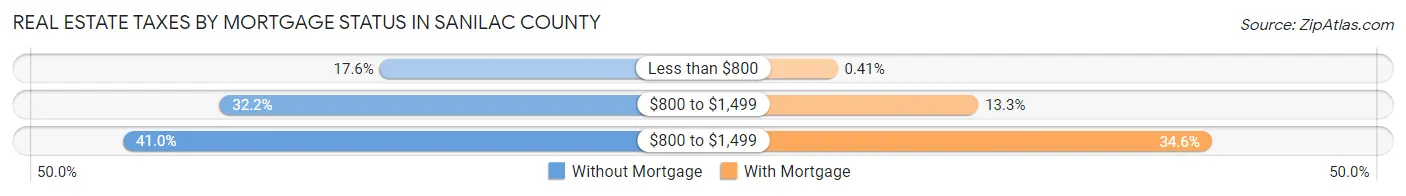
| Property Taxes | Without Mortgage | With Mortgage |
| Less than $800 | 1,212 (17.6%) | 28 (0.4%) |
| $800 to $1,499 | 2,221 (32.2%) | 914 (13.3%) |
| $800 to $1,499 | 2,827 (41.0%) | 2,383 (34.6%) |
| Total | 6,895 (100.0%) | 6,892 (100.0%) |
Health & Disability in Sanilac County
Health Insurance Coverage by Age in Sanilac County
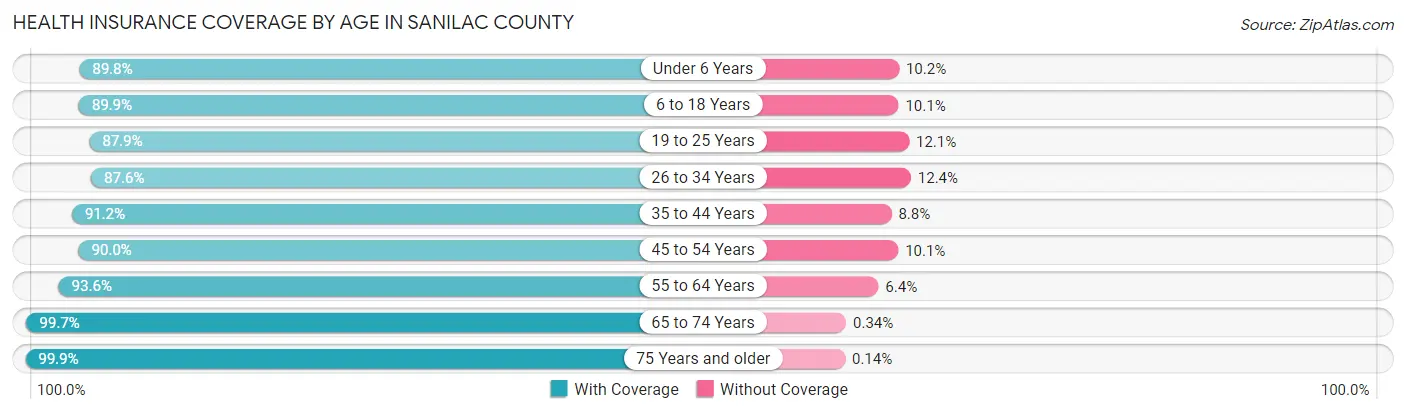
| Age Bracket | With Coverage | Without Coverage |
| Under 6 Years | 2,219 (89.8%) | 252 (10.2%) |
| 6 to 18 Years | 5,941 (89.9%) | 668 (10.1%) |
| 19 to 25 Years | 2,586 (87.9%) | 355 (12.1%) |
| 26 to 34 Years | 3,295 (87.6%) | 467 (12.4%) |
| 35 to 44 Years | 3,949 (91.2%) | 381 (8.8%) |
| 45 to 54 Years | 4,414 (89.9%) | 493 (10.1%) |
| 55 to 64 Years | 6,052 (93.6%) | 411 (6.4%) |
| 65 to 74 Years | 5,267 (99.7%) | 18 (0.3%) |
| 75 Years and older | 3,626 (99.9%) | 5 (0.1%) |
| Total | 37,349 (92.4%) | 3,050 (7.5%) |
Health Insurance Coverage by Citizenship Status in Sanilac County
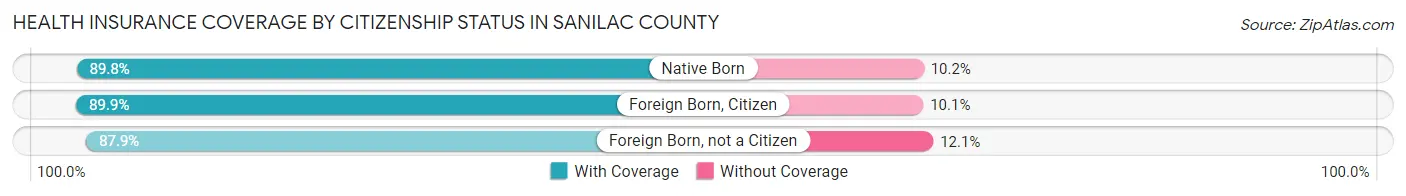
| Citizenship Status | With Coverage | Without Coverage |
| Native Born | 2,219 (89.8%) | 252 (10.2%) |
| Foreign Born, Citizen | 5,941 (89.9%) | 668 (10.1%) |
| Foreign Born, not a Citizen | 2,586 (87.9%) | 355 (12.1%) |
Health Insurance Coverage by Household Income in Sanilac County
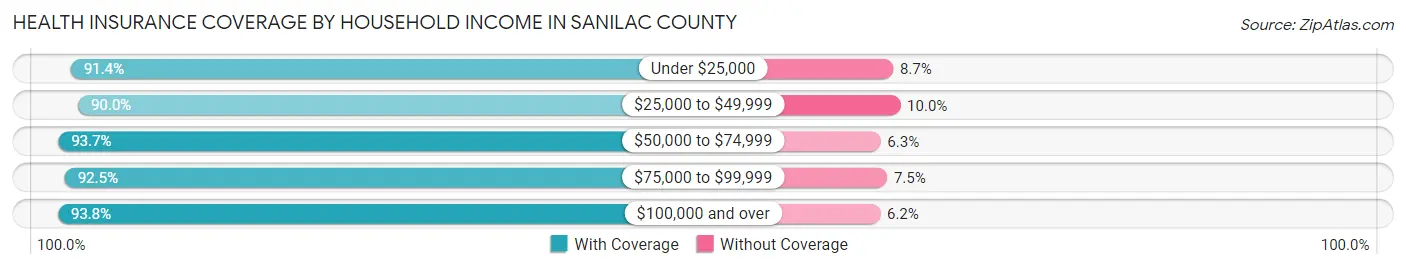
| Household Income | With Coverage | Without Coverage |
| Under $25,000 | 4,750 (91.3%) | 450 (8.6%) |
| $25,000 to $49,999 | 7,802 (90.0%) | 867 (10.0%) |
| $50,000 to $74,999 | 7,538 (93.7%) | 507 (6.3%) |
| $75,000 to $99,999 | 6,114 (92.5%) | 498 (7.5%) |
| $100,000 and over | 10,959 (93.8%) | 728 (6.2%) |
Public vs Private Health Insurance Coverage by Age in Sanilac County
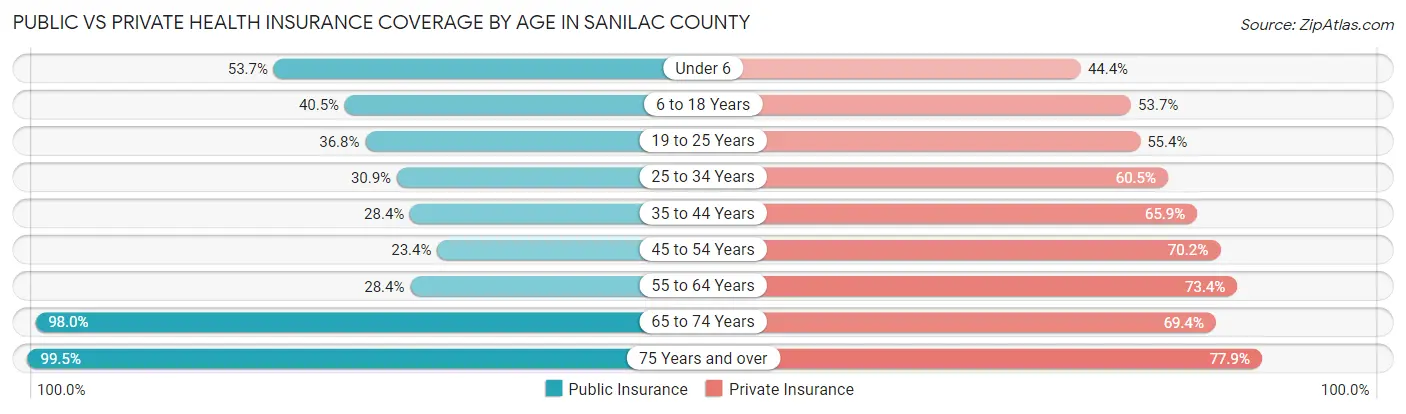
| Age Bracket | Public Insurance | Private Insurance |
| Under 6 | 1,328 (53.7%) | 1,097 (44.4%) |
| 6 to 18 Years | 2,679 (40.5%) | 3,550 (53.7%) |
| 19 to 25 Years | 1,081 (36.8%) | 1,629 (55.4%) |
| 25 to 34 Years | 1,162 (30.9%) | 2,276 (60.5%) |
| 35 to 44 Years | 1,231 (28.4%) | 2,855 (65.9%) |
| 45 to 54 Years | 1,148 (23.4%) | 3,444 (70.2%) |
| 55 to 64 Years | 1,836 (28.4%) | 4,743 (73.4%) |
| 65 to 74 Years | 5,181 (98.0%) | 3,668 (69.4%) |
| 75 Years and over | 3,611 (99.5%) | 2,830 (77.9%) |
| Total | 19,257 (47.7%) | 26,092 (64.6%) |
Disability Status by Sex by Age in Sanilac County
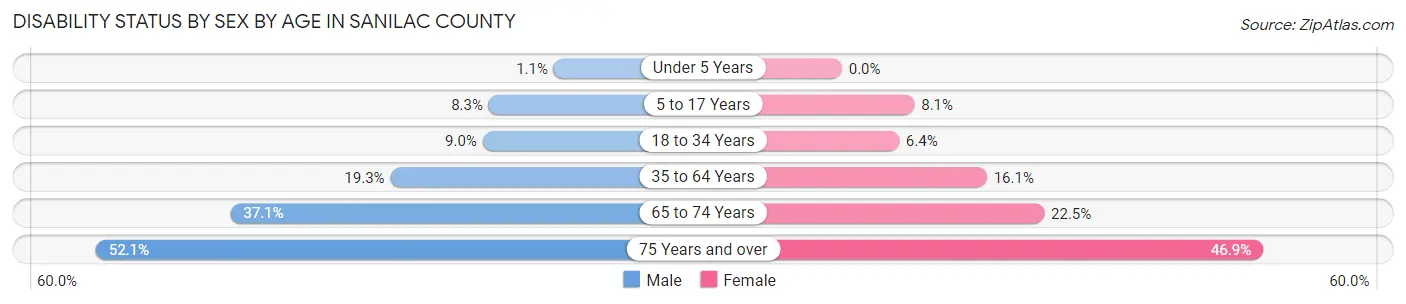
| Age Bracket | Male | Female |
| Under 5 Years | 11 (1.1%) | 0 (0.0%) |
| 5 to 17 Years | 281 (8.3%) | 259 (8.1%) |
| 18 to 34 Years | 334 (9.0%) | 220 (6.4%) |
| 35 to 64 Years | 1,545 (19.3%) | 1,239 (16.1%) |
| 65 to 74 Years | 964 (37.1%) | 605 (22.5%) |
| 75 Years and over | 844 (52.1%) | 943 (46.9%) |
Disability Class by Sex by Age in Sanilac County
Disability Class: Hearing Difficulty
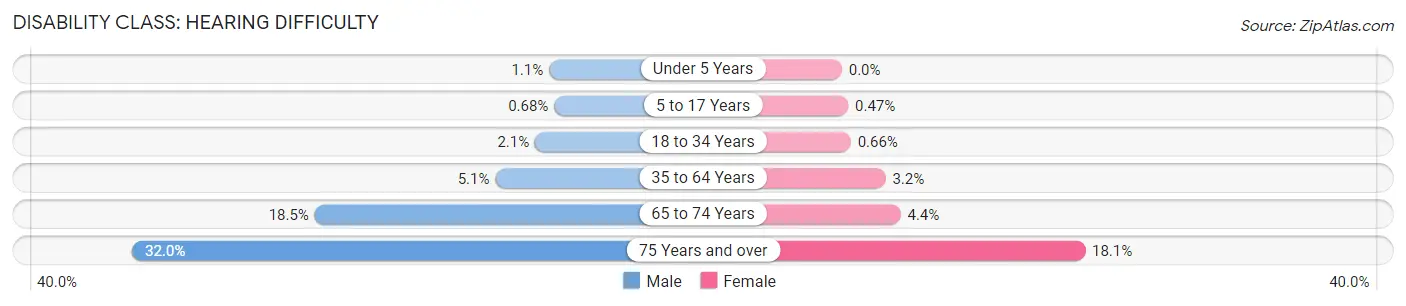
| Age Bracket | Male | Female |
| Under 5 Years | 11 (1.1%) | 0 (0.0%) |
| 5 to 17 Years | 23 (0.7%) | 15 (0.5%) |
| 18 to 34 Years | 78 (2.1%) | 23 (0.7%) |
| 35 to 64 Years | 405 (5.1%) | 249 (3.2%) |
| 65 to 74 Years | 480 (18.5%) | 117 (4.4%) |
| 75 Years and over | 519 (32.0%) | 363 (18.1%) |
Disability Class: Vision Difficulty
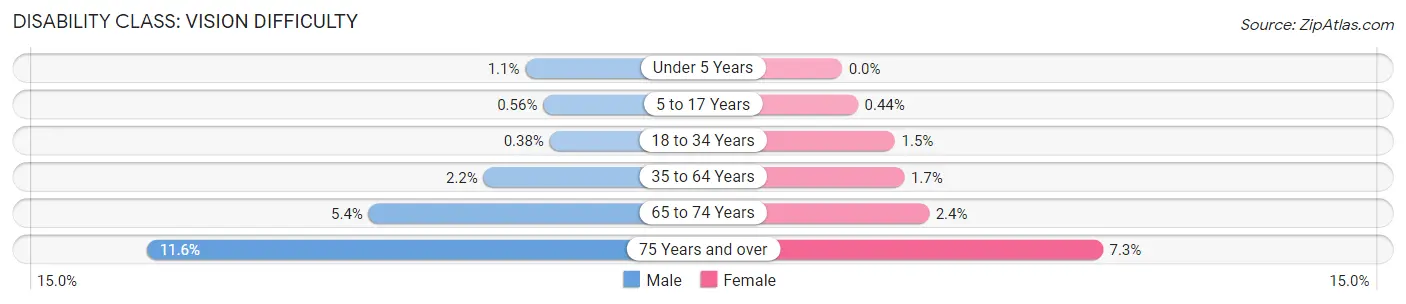
| Age Bracket | Male | Female |
| Under 5 Years | 11 (1.1%) | 0 (0.0%) |
| 5 to 17 Years | 19 (0.6%) | 14 (0.4%) |
| 18 to 34 Years | 14 (0.4%) | 51 (1.5%) |
| 35 to 64 Years | 178 (2.2%) | 133 (1.7%) |
| 65 to 74 Years | 141 (5.4%) | 65 (2.4%) |
| 75 Years and over | 188 (11.6%) | 146 (7.3%) |
Disability Class: Cognitive Difficulty
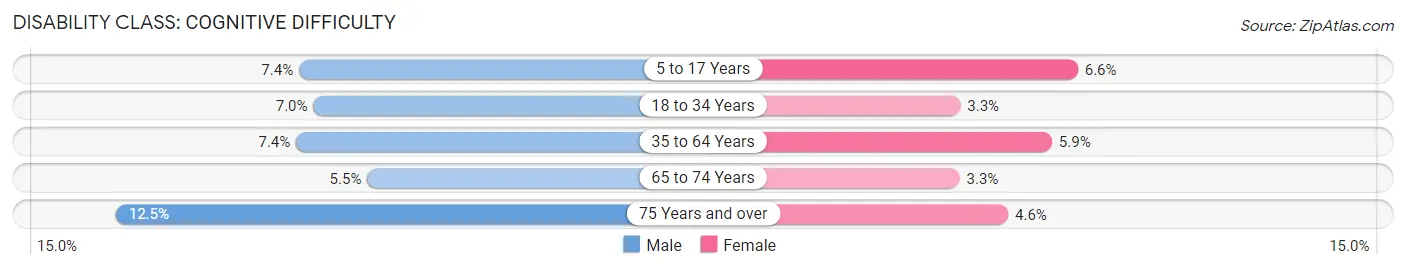
| Age Bracket | Male | Female |
| 5 to 17 Years | 249 (7.4%) | 211 (6.6%) |
| 18 to 34 Years | 259 (7.0%) | 114 (3.3%) |
| 35 to 64 Years | 597 (7.4%) | 449 (5.9%) |
| 65 to 74 Years | 142 (5.5%) | 88 (3.3%) |
| 75 Years and over | 202 (12.5%) | 93 (4.6%) |
Disability Class: Ambulatory Difficulty
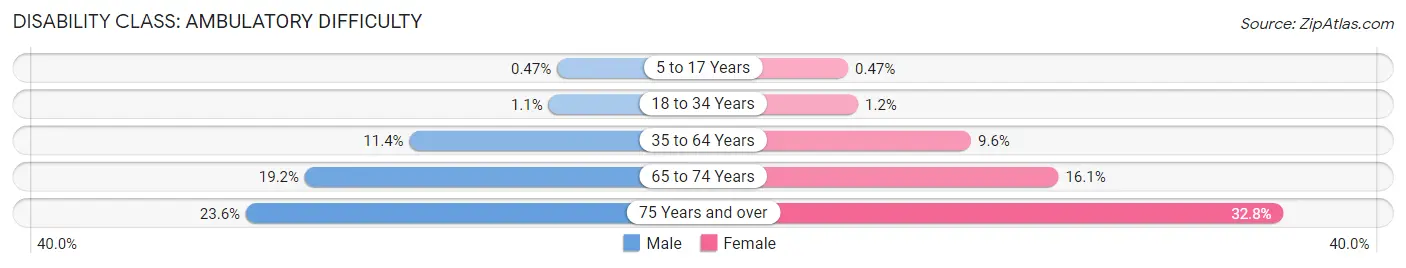
| Age Bracket | Male | Female |
| 5 to 17 Years | 16 (0.5%) | 15 (0.5%) |
| 18 to 34 Years | 41 (1.1%) | 42 (1.2%) |
| 35 to 64 Years | 917 (11.4%) | 737 (9.6%) |
| 65 to 74 Years | 499 (19.2%) | 432 (16.1%) |
| 75 Years and over | 382 (23.6%) | 659 (32.8%) |
Disability Class: Self-Care Difficulty
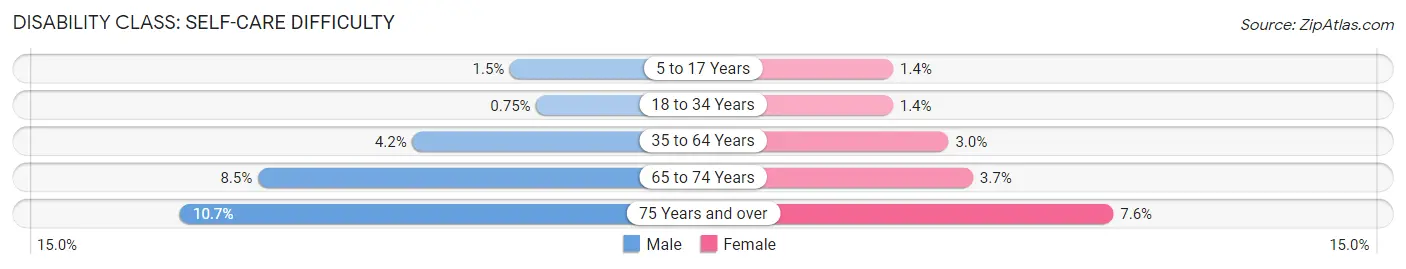
| Age Bracket | Male | Female |
| 5 to 17 Years | 50 (1.5%) | 46 (1.4%) |
| 18 to 34 Years | 28 (0.7%) | 49 (1.4%) |
| 35 to 64 Years | 337 (4.2%) | 228 (3.0%) |
| 65 to 74 Years | 221 (8.5%) | 98 (3.6%) |
| 75 Years and over | 173 (10.7%) | 152 (7.6%) |
Technology Access in Sanilac County
Computing Device Access in Sanilac County
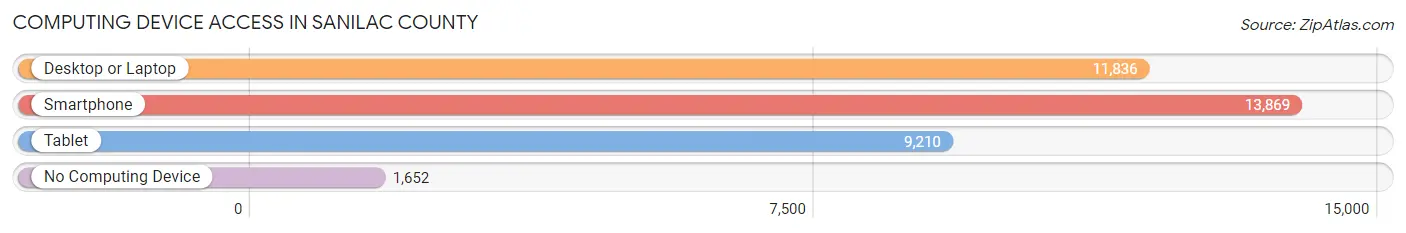
| Device Type | # Households | % Households |
| Desktop or Laptop | 11,836 | 68.4% |
| Smartphone | 13,869 | 80.2% |
| Tablet | 9,210 | 53.2% |
| No Computing Device | 1,652 | 9.6% |
| Total | 17,296 | 100.0% |
Internet Access in Sanilac County
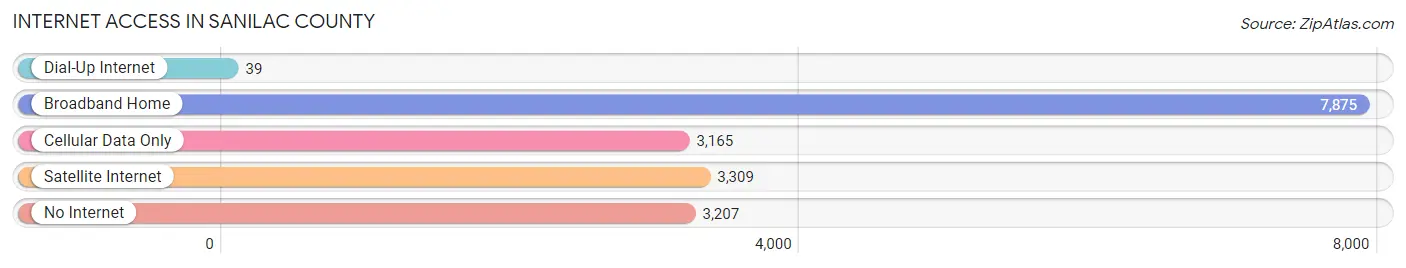
| Internet Type | # Households | % Households |
| Dial-Up Internet | 39 | 0.2% |
| Broadband Home | 7,875 | 45.5% |
| Cellular Data Only | 3,165 | 18.3% |
| Satellite Internet | 3,309 | 19.1% |
| No Internet | 3,207 | 18.5% |
| Total | 17,296 | 100.0% |
Sanilac County Summary
Sanilac County is located in the eastern portion of Michigan’s Lower Peninsula. It is bordered by Huron County to the north, Tuscola County to the west, St. Clair County to the south, and Lake Huron to the east. The county seat is Sandusky, and the largest city is Port Sanilac. The county has a total area of 845 square miles, of which 817 square miles is land and 28 square miles is water.
History
Sanilac County was first settled in 1822 by a group of French-Canadian fur traders. The county was officially organized in 1849 and named after the Sanilac River, which was named after a Native American chief. The county was originally part of Huron County, but was split off in 1849.
The county was largely agricultural in the 19th century, with the main crops being wheat, corn, and oats. The county also had a thriving lumber industry, with many sawmills located along the Sanilac River.
In the early 20th century, the county experienced a population boom due to the growth of the auto industry in Detroit. Many people moved to the county to work in the factories, and the population grew from 8,000 in 1900 to over 20,000 by 1930.
Geography
Sanilac County is located in the eastern portion of Michigan’s Lower Peninsula. It is bordered by Huron County to the north, Tuscola County to the west, St. Clair County to the south, and Lake Huron to the east. The county has a total area of 845 square miles, of which 817 square miles is land and 28 square miles is water.
The county is mostly flat, with some rolling hills in the northern and western parts. The Sanilac River runs through the county, and there are several small lakes and ponds scattered throughout. The county is mostly rural, with the majority of the population living in small towns and villages.
Economy
Sanilac County’s economy is largely based on agriculture and tourism. The county is home to several large farms, which produce a variety of crops including corn, wheat, soybeans, and hay. The county also has a thriving tourism industry, with many people visiting the area for its beaches, parks, and outdoor activities.
The county also has a growing manufacturing sector, with several companies located in the area. The largest employers in the county are the Sanilac County Medical Center, the Sanilac County Sheriff’s Office, and the Sanilac County Road Commission.
Demographics
As of the 2010 census, Sanilac County had a population of 43,114. The racial makeup of the county was 94.3% White, 0.7% African American, 0.5% Native American, 0.4% Asian, 0.1% Pacific Islander, 2.3% from other races, and 1.7% from two or more races. Hispanic or Latino of any race were 4.3% of the population.
The median income for a household in the county was $41,945, and the median income for a family was $50,945. The per capita income for the county was $20,945. About 11.3% of families and 14.7% of the population were below the poverty line, including 19.2% of those under age 18 and 8.2% of those age 65 or over.
Common Questions
What is Per Capita Income in Sanilac County?
Per Capita income in Sanilac County is $30,904.
What is the Median Family Income in Sanilac County?
Median Family Income in Sanilac County is $70,172.
What is the Median Household income in Sanilac County?
Median Household Income in Sanilac County is $55,740.
What is Income or Wage Gap in Sanilac County?
Income or Wage Gap in Sanilac County is 33.5%.
Women in Sanilac County earn 66.5 cents for every dollar earned by a man.
What is Family Income Deficit in Sanilac County?
Family Income Deficit in Sanilac County is $9,615.
Families that are below poverty line in Sanilac County earn $9,615 less on average than the poverty threshold level.
What is Inequality or Gini Index in Sanilac County?
Inequality or Gini Index in Sanilac County is 0.43.
What is the Total Population of Sanilac County?
Total Population of Sanilac County is 40,759.
What is the Total Male Population of Sanilac County?
Total Male Population of Sanilac County is 20,605.
What is the Total Female Population of Sanilac County?
Total Female Population of Sanilac County is 20,154.
What is the Ratio of Males per 100 Females in Sanilac County?
There are 102.24 Males per 100 Females in Sanilac County.
What is the Ratio of Females per 100 Males in Sanilac County?
There are 97.81 Females per 100 Males in Sanilac County.
What is the Median Population Age in Sanilac County?
Median Population Age in Sanilac County is 45.2 Years.
What is the Average Family Size in Sanilac County
Average Family Size in Sanilac County is 2.8 People.
What is the Average Household Size in Sanilac County
Average Household Size in Sanilac County is 2.3 People.
How Large is the Labor Force in Sanilac County?
There are 18,570 People in the Labor Forcein in Sanilac County.
What is the Percentage of People in the Labor Force in Sanilac County?
55.8% of People are in the Labor Force in Sanilac County.
What is the Unemployment Rate in Sanilac County?
Unemployment Rate in Sanilac County is 6.5%.