Ogemaw County, MI Map & Demographics
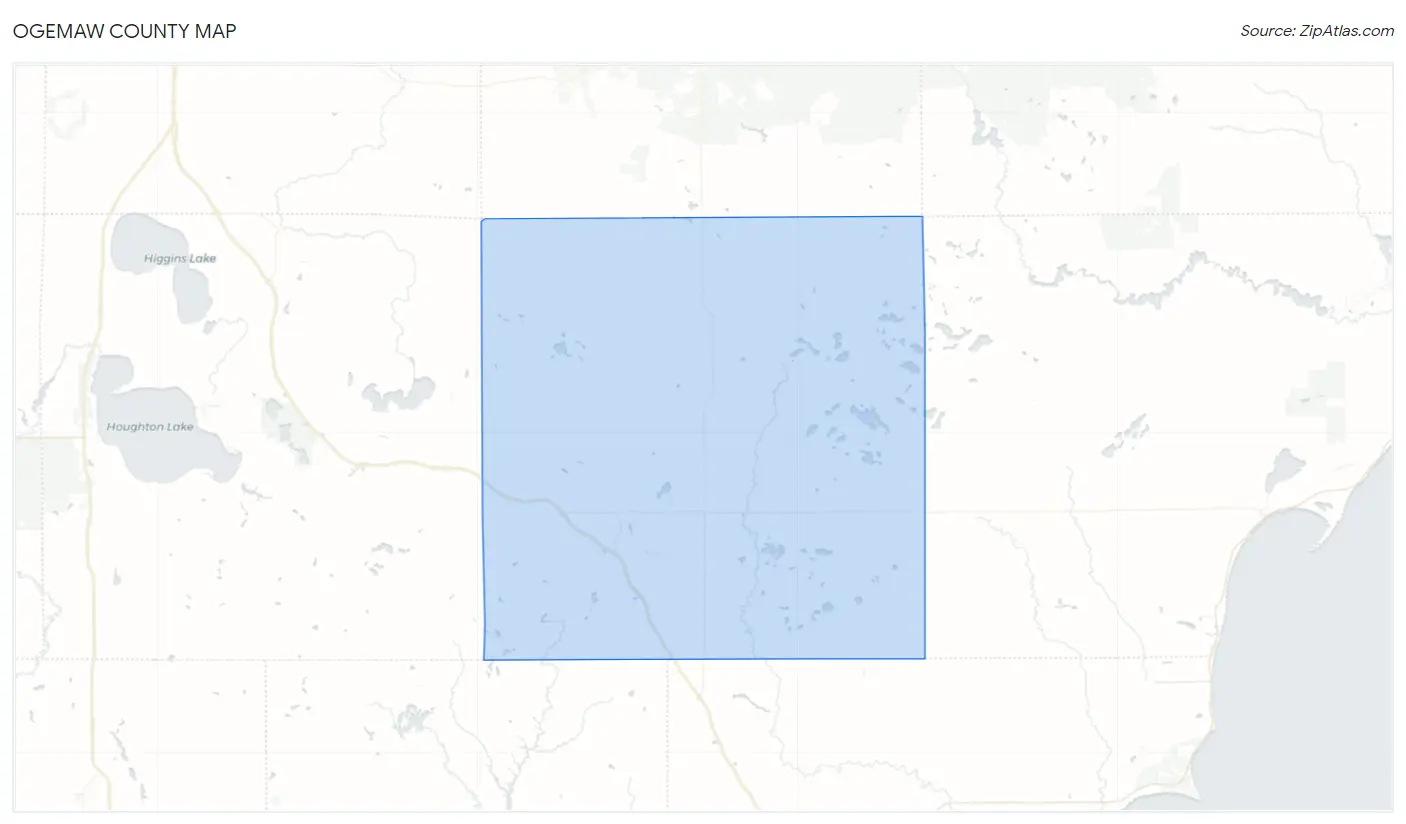
Ogemaw County Map
Ogemaw County Overview
$28,837
PER CAPITA INCOME
$61,625
AVG FAMILY INCOME
$50,377
AVG HOUSEHOLD INCOME
25.5%
WAGE / INCOME GAP [ % ]
74.5¢/ $1
WAGE / INCOME GAP [ $ ]
$10,791
FAMILY INCOME DEFICIT
0.44
INEQUALITY / GINI INDEX
20,820
TOTAL POPULATION
10,528
MALE POPULATION
10,292
FEMALE POPULATION
102.29
MALES / 100 FEMALES
97.76
FEMALES / 100 MALES
50.6
MEDIAN AGE
2.7
AVG FAMILY SIZE
2.3
AVG HOUSEHOLD SIZE
8,303
LABOR FORCE [ PEOPLE ]
47.1%
PERCENT IN LABOR FORCE
7.1%
UNEMPLOYMENT RATE
Ogemaw County Area Codes
Income in Ogemaw County
Income Overview in Ogemaw County
Per Capita Income in Ogemaw County is $28,837, while median incomes of families and households are $61,625 and $50,377 respectively.
| Characteristic | Number | Measure |
| Per Capita Income | 20,820 | $28,837 |
| Median Family Income | 5,929 | $61,625 |
| Mean Family Income | 5,929 | $77,547 |
| Median Household Income | 9,089 | $50,377 |
| Mean Household Income | 9,089 | $65,133 |
| Income Deficit | 5,929 | $10,791 |
| Wage / Income Gap (%) | 20,820 | 25.53% |
| Wage / Income Gap ($) | 20,820 | 74.47¢ per $1 |
| Gini / Inequality Index | 20,820 | 0.44 |
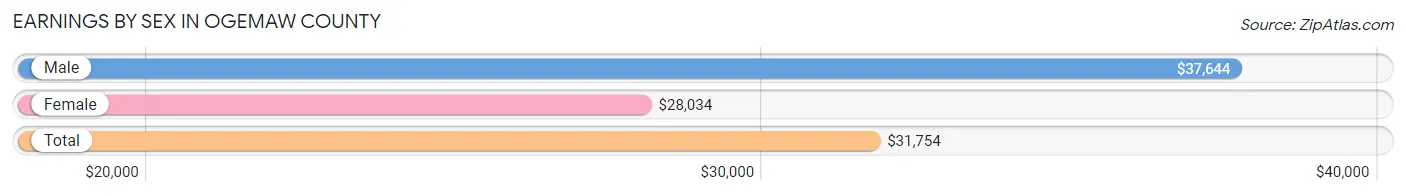
Earnings by Sex in Ogemaw County
Average Earnings in Ogemaw County are $31,754, $37,644 for men and $28,034 for women, a difference of 25.5%.
| Sex | Number | Average Earnings |
| Male | 4,710 (52.6%) | $37,644 |
| Female | 4,239 (47.4%) | $28,034 |
| Total | 8,949 (100.0%) | $31,754 |
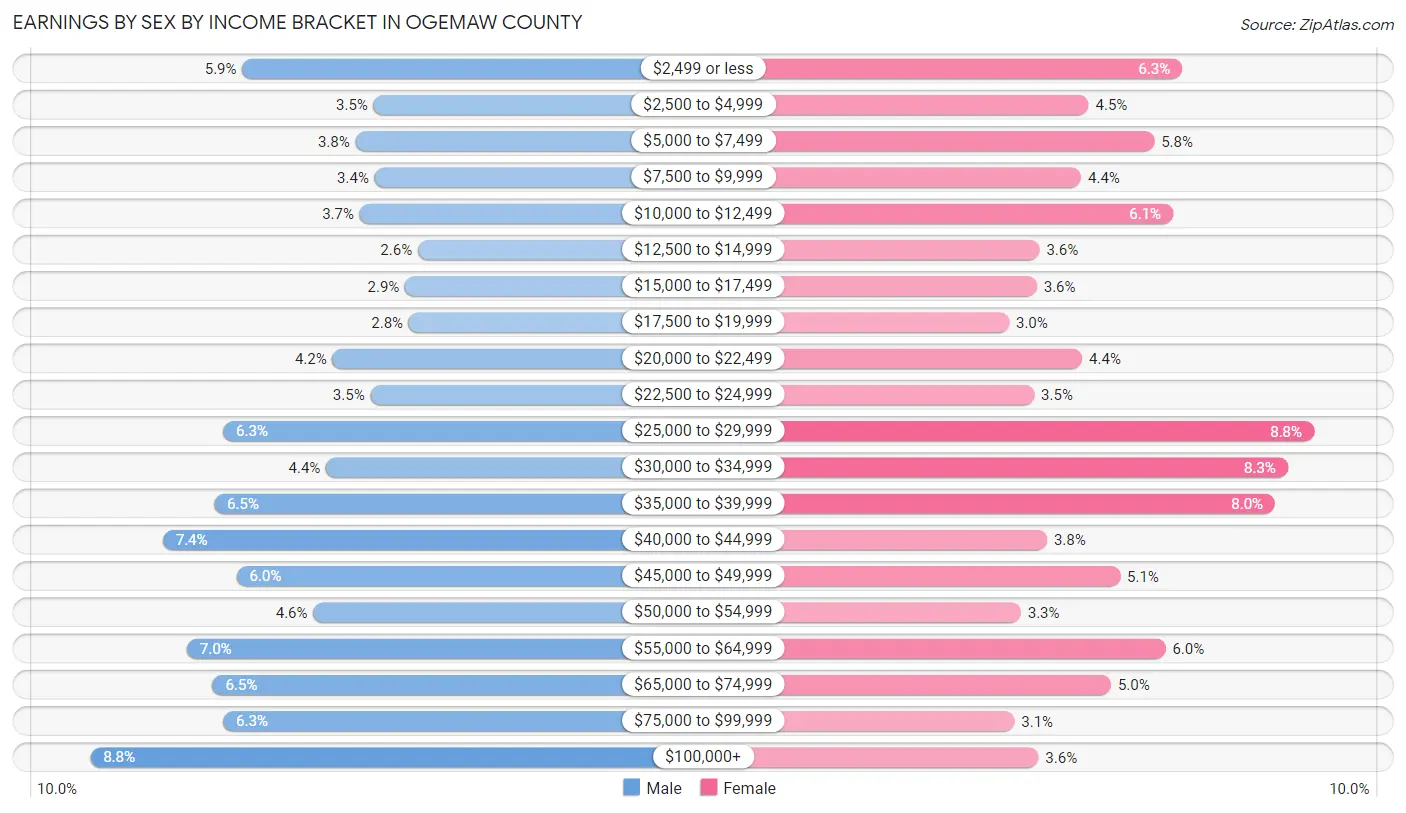
Earnings by Sex by Income Bracket in Ogemaw County
The most common earnings brackets in Ogemaw County are $100,000+ for men (413 | 8.8%) and $25,000 to $29,999 for women (371 | 8.7%).
| Income | Male | Female |
| $2,499 or less | 279 (5.9%) | 266 (6.3%) |
| $2,500 to $4,999 | 163 (3.5%) | 192 (4.5%) |
| $5,000 to $7,499 | 179 (3.8%) | 244 (5.8%) |
| $7,500 to $9,999 | 162 (3.4%) | 186 (4.4%) |
| $10,000 to $12,499 | 175 (3.7%) | 259 (6.1%) |
| $12,500 to $14,999 | 124 (2.6%) | 153 (3.6%) |
| $15,000 to $17,499 | 135 (2.9%) | 151 (3.6%) |
| $17,500 to $19,999 | 132 (2.8%) | 129 (3.0%) |
| $20,000 to $22,499 | 199 (4.2%) | 187 (4.4%) |
| $22,500 to $24,999 | 166 (3.5%) | 149 (3.5%) |
| $25,000 to $29,999 | 296 (6.3%) | 371 (8.7%) |
| $30,000 to $34,999 | 205 (4.3%) | 350 (8.3%) |
| $35,000 to $39,999 | 304 (6.5%) | 340 (8.0%) |
| $40,000 to $44,999 | 349 (7.4%) | 159 (3.7%) |
| $45,000 to $49,999 | 284 (6.0%) | 217 (5.1%) |
| $50,000 to $54,999 | 216 (4.6%) | 138 (3.3%) |
| $55,000 to $64,999 | 328 (7.0%) | 253 (6.0%) |
| $65,000 to $74,999 | 305 (6.5%) | 210 (5.0%) |
| $75,000 to $99,999 | 296 (6.3%) | 133 (3.1%) |
| $100,000+ | 413 (8.8%) | 152 (3.6%) |
| Total | 4,710 (100.0%) | 4,239 (100.0%) |
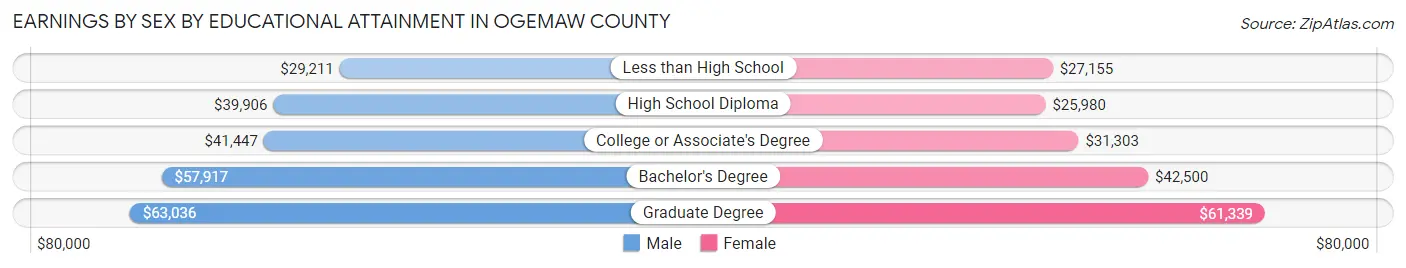
Earnings by Sex by Educational Attainment in Ogemaw County
Average earnings in Ogemaw County are $41,369 for men and $31,870 for women, a difference of 23.0%. Men with an educational attainment of graduate degree enjoy the highest average annual earnings of $63,036, while those with less than high school education earn the least with $29,211. Women with an educational attainment of graduate degree earn the most with the average annual earnings of $61,339, while those with high school diploma education have the smallest earnings of $25,980.
| Educational Attainment | Male Income | Female Income |
| Less than High School | $29,211 | $27,155 |
| High School Diploma | $39,906 | $25,980 |
| College or Associate's Degree | $41,447 | $31,303 |
| Bachelor's Degree | $57,917 | $42,500 |
| Graduate Degree | $63,036 | $61,339 |
| Total | $41,369 | $31,870 |
Family Income in Ogemaw County
Family Income Brackets in Ogemaw County
According to the Ogemaw County family income data, there are 1,429 families falling into the $50,000 to $74,999 income range, which is the most common income bracket and makes up 24.1% of all families. Conversely, the less than $10,000 income bracket is the least frequent group with only 213 families (3.6%) belonging to this category.
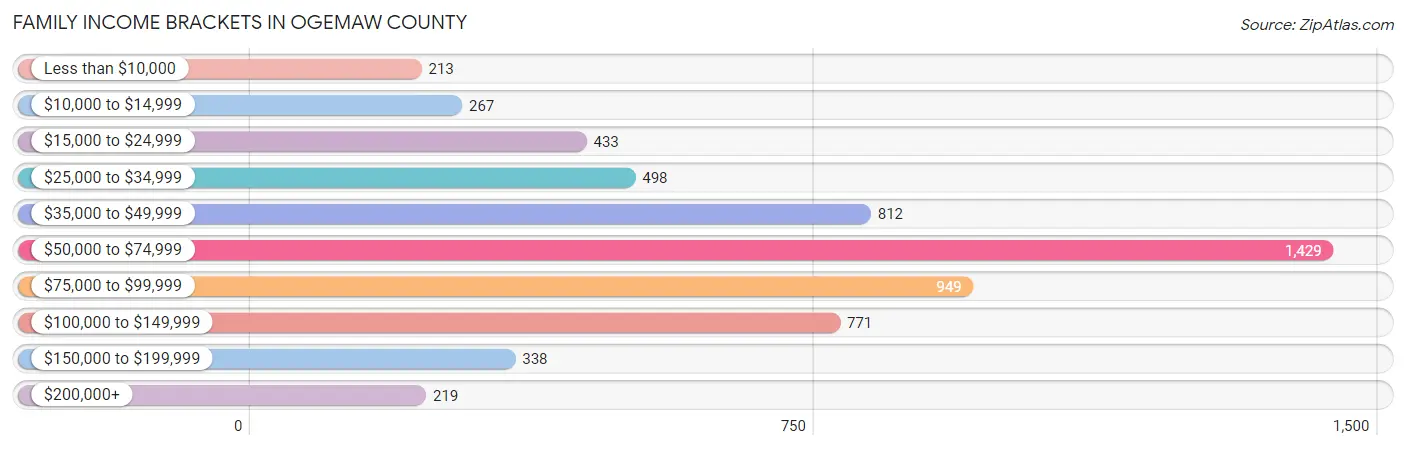
| Income Bracket | # Families | % Families |
| Less than $10,000 | 213 | 3.6% |
| $10,000 to $14,999 | 267 | 4.5% |
| $15,000 to $24,999 | 433 | 7.3% |
| $25,000 to $34,999 | 498 | 8.4% |
| $35,000 to $49,999 | 812 | 13.7% |
| $50,000 to $74,999 | 1,429 | 24.1% |
| $75,000 to $99,999 | 949 | 16.0% |
| $100,000 to $149,999 | 771 | 13.0% |
| $150,000 to $199,999 | 338 | 5.7% |
| $200,000+ | 219 | 3.7% |
Family Income by Famaliy Size in Ogemaw County
6-person families (143 | 2.4%) account for the highest median family income in Ogemaw County with $85,625 per family, while 2-person families (3,772 | 63.6%) have the highest median income of $27,916 per family member.
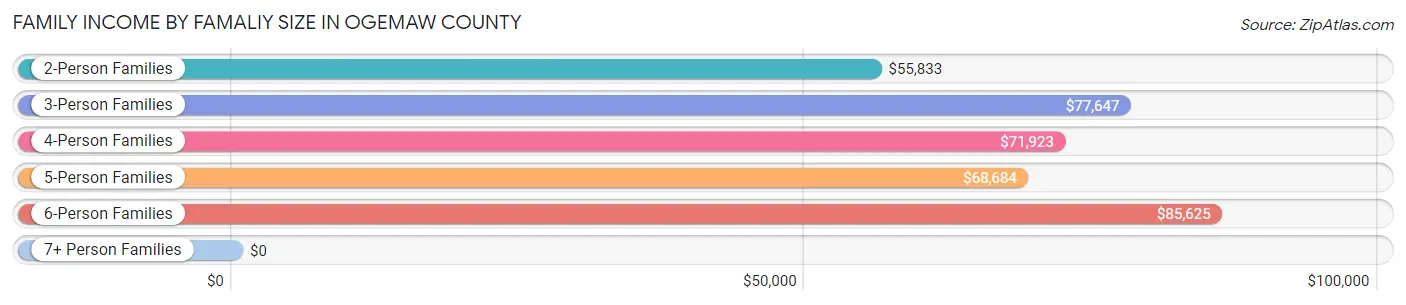
| Income Bracket | # Families | Median Income |
| 2-Person Families | 3,772 (63.6%) | $55,833 |
| 3-Person Families | 1,044 (17.6%) | $77,647 |
| 4-Person Families | 620 (10.5%) | $71,923 |
| 5-Person Families | 286 (4.8%) | $68,684 |
| 6-Person Families | 143 (2.4%) | $85,625 |
| 7+ Person Families | 64 (1.1%) | $0 |
| Total | 5,929 (100.0%) | $61,625 |
Family Income by Number of Earners in Ogemaw County
The median family income in Ogemaw County is $61,625, with families comprising 3+ earners (507) having the highest median family income of $110,417, while families with no earners (1,920) have the lowest median family income of $41,047, accounting for 8.6% and 32.4% of families, respectively.
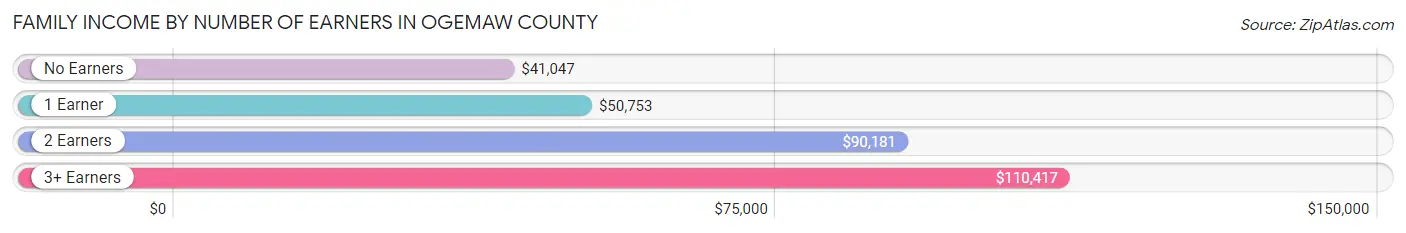
| Number of Earners | # Families | Median Income |
| No Earners | 1,920 (32.4%) | $41,047 |
| 1 Earner | 1,788 (30.2%) | $50,753 |
| 2 Earners | 1,714 (28.9%) | $90,181 |
| 3+ Earners | 507 (8.6%) | $110,417 |
| Total | 5,929 (100.0%) | $61,625 |
Household Income in Ogemaw County
Household Income Brackets in Ogemaw County
With 1,909 households falling in the category, the $50,000 to $74,999 income range is the most frequent in Ogemaw County, accounting for 21.0% of all households. In contrast, only 245 households (2.7%) fall into the $200,000+ income bracket, making it the least populous group.
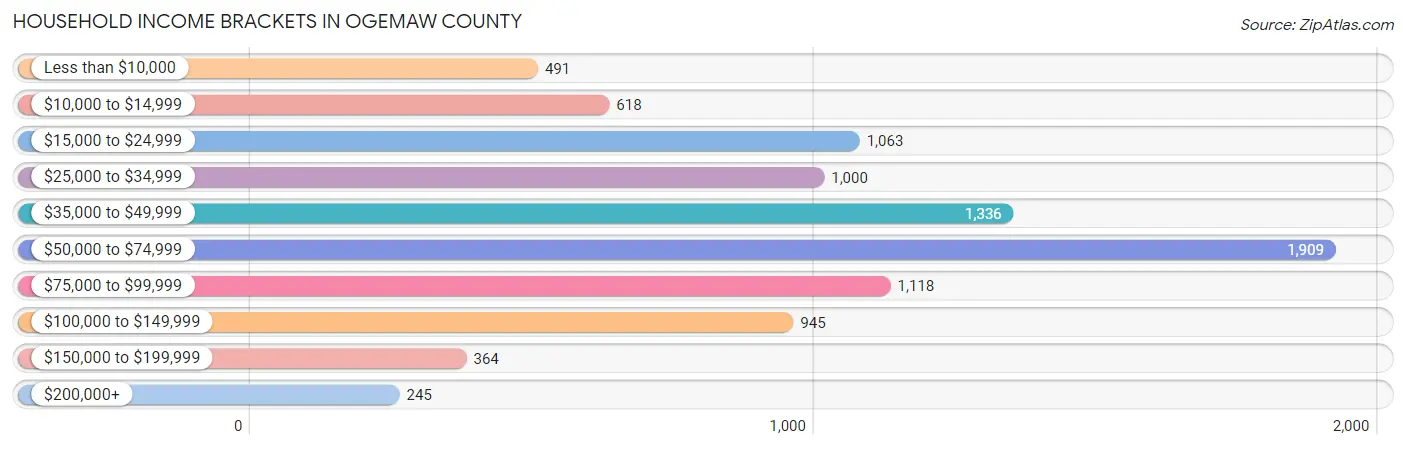
| Income Bracket | # Households | % Households |
| Less than $10,000 | 491 | 5.4% |
| $10,000 to $14,999 | 618 | 6.8% |
| $15,000 to $24,999 | 1,063 | 11.7% |
| $25,000 to $34,999 | 1,000 | 11.0% |
| $35,000 to $49,999 | 1,336 | 14.7% |
| $50,000 to $74,999 | 1,909 | 21.0% |
| $75,000 to $99,999 | 1,118 | 12.3% |
| $100,000 to $149,999 | 945 | 10.4% |
| $150,000 to $199,999 | 364 | 4.0% |
| $200,000+ | 245 | 2.7% |
Household Income by Householder Age in Ogemaw County
The median household income in Ogemaw County is $50,377, with the highest median household income of $55,476 found in the 45 to 64 years age bracket for the primary householder. A total of 3,514 households (38.7%) fall into this category. Meanwhile, the 65+ years age bracket for the primary householder has the lowest median household income of $43,293, with 3,379 households (37.2%) in this group.
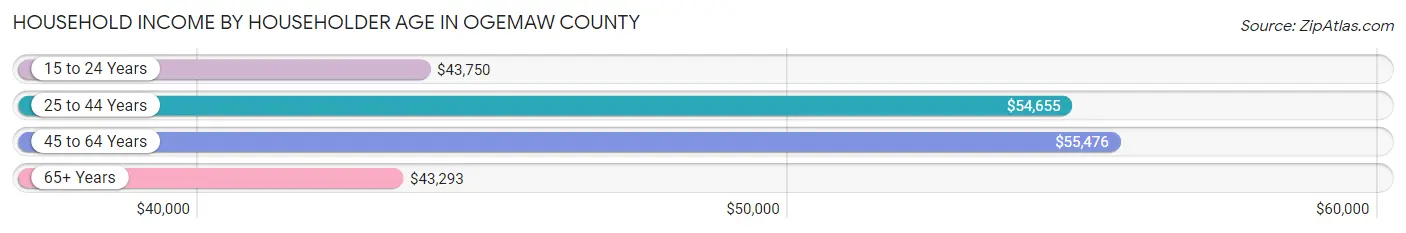
| Income Bracket | # Households | Median Income |
| 15 to 24 Years | 194 (2.1%) | $43,750 |
| 25 to 44 Years | 2,002 (22.0%) | $54,655 |
| 45 to 64 Years | 3,514 (38.7%) | $55,476 |
| 65+ Years | 3,379 (37.2%) | $43,293 |
| Total | 9,089 (100.0%) | $50,377 |
Poverty in Ogemaw County
Income Below Poverty by Sex and Age in Ogemaw County
With 16.6% poverty level for males and 17.6% for females among the residents of Ogemaw County, 12 to 14 year old males and under 5 year old females are the most vulnerable to poverty, with 124 males (41.2%) and 172 females (37.4%) in their respective age groups living below the poverty level.
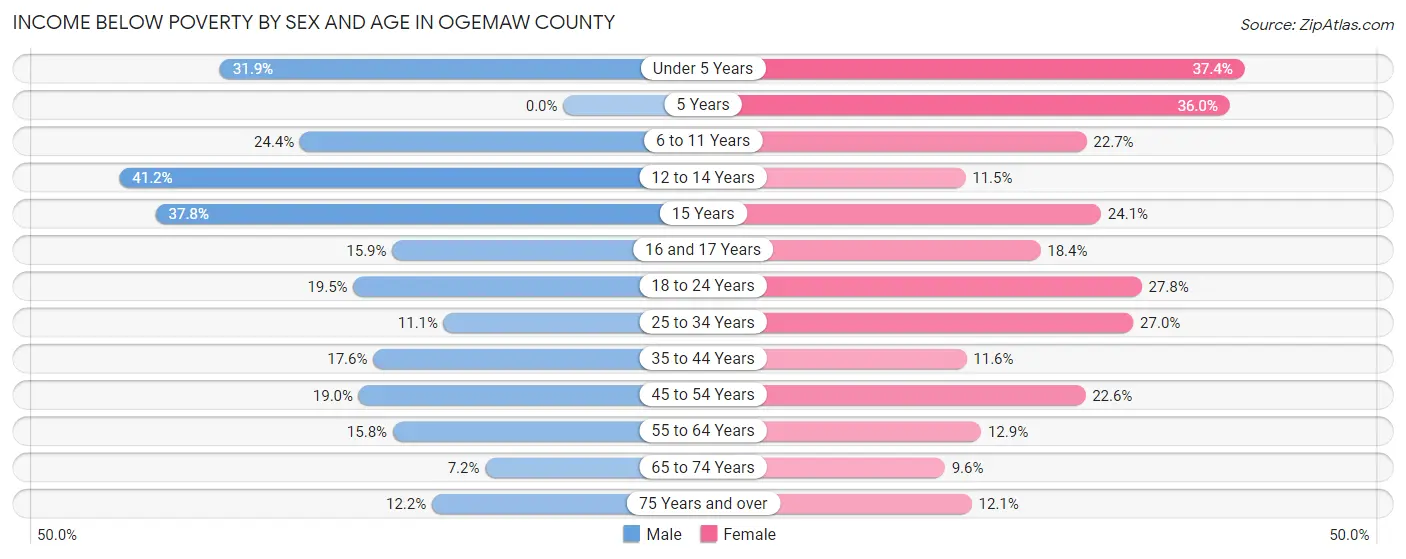
| Age Bracket | Male | Female |
| Under 5 Years | 138 (31.9%) | 172 (37.4%) |
| 5 Years | 0 (0.0%) | 36 (36.0%) |
| 6 to 11 Years | 162 (24.4%) | 126 (22.7%) |
| 12 to 14 Years | 124 (41.2%) | 40 (11.5%) |
| 15 Years | 28 (37.8%) | 19 (24.0%) |
| 16 and 17 Years | 50 (15.9%) | 49 (18.4%) |
| 18 to 24 Years | 136 (19.5%) | 175 (27.8%) |
| 25 to 34 Years | 105 (11.1%) | 272 (27.0%) |
| 35 to 44 Years | 190 (17.6%) | 115 (11.6%) |
| 45 to 54 Years | 230 (19.0%) | 253 (22.6%) |
| 55 to 64 Years | 293 (15.8%) | 243 (12.9%) |
| 65 to 74 Years | 117 (7.2%) | 155 (9.6%) |
| 75 Years and over | 127 (12.2%) | 130 (12.0%) |
| Total | 1,700 (16.6%) | 1,785 (17.6%) |
Income Above Poverty by Sex and Age in Ogemaw County
According to the poverty statistics in Ogemaw County, males aged 5 years and females aged 65 to 74 years are the age groups that are most secure financially, with 100.0% of males and 90.4% of females in these age groups living above the poverty line.
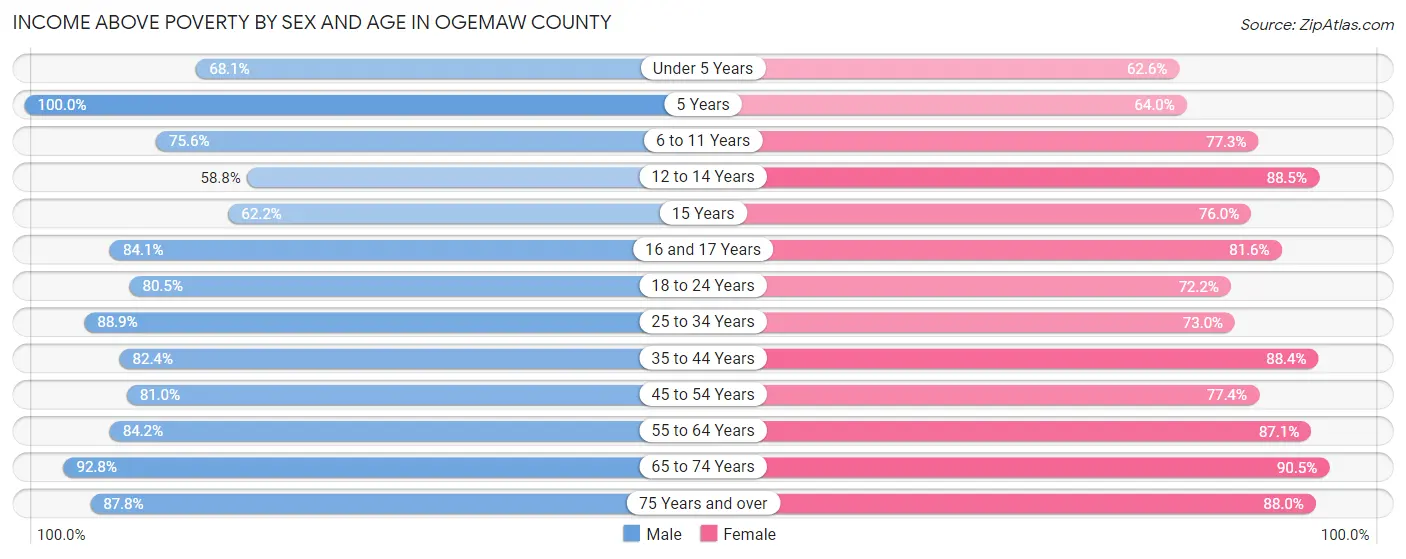
| Age Bracket | Male | Female |
| Under 5 Years | 295 (68.1%) | 288 (62.6%) |
| 5 Years | 45 (100.0%) | 64 (64.0%) |
| 6 to 11 Years | 501 (75.6%) | 429 (77.3%) |
| 12 to 14 Years | 177 (58.8%) | 309 (88.5%) |
| 15 Years | 46 (62.2%) | 60 (75.9%) |
| 16 and 17 Years | 265 (84.1%) | 217 (81.6%) |
| 18 to 24 Years | 562 (80.5%) | 454 (72.2%) |
| 25 to 34 Years | 842 (88.9%) | 734 (73.0%) |
| 35 to 44 Years | 887 (82.4%) | 880 (88.4%) |
| 45 to 54 Years | 982 (81.0%) | 867 (77.4%) |
| 55 to 64 Years | 1,559 (84.2%) | 1,638 (87.1%) |
| 65 to 74 Years | 1,499 (92.8%) | 1,468 (90.4%) |
| 75 Years and over | 915 (87.8%) | 949 (87.9%) |
| Total | 8,575 (83.5%) | 8,357 (82.4%) |
Income Below Poverty Among Married-Couple Families in Ogemaw County
The poverty statistics for married-couple families in Ogemaw County show that 7.2% or 321 of the total 4,463 families live below the poverty line. Families with 5 or more children have the highest poverty rate of 13.3%, comprising of 2 families. On the other hand, families with no children have the lowest poverty rate of 6.9%, which includes 235 families.
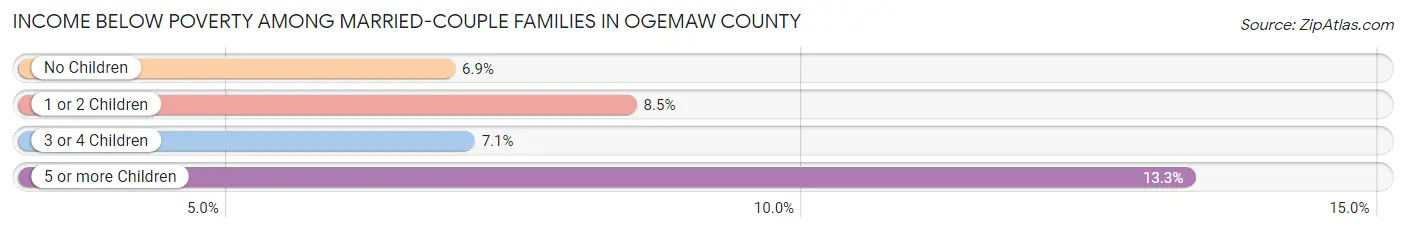
| Children | Above Poverty | Below Poverty |
| No Children | 3,177 (93.1%) | 235 (6.9%) |
| 1 or 2 Children | 702 (91.5%) | 65 (8.5%) |
| 3 or 4 Children | 250 (92.9%) | 19 (7.1%) |
| 5 or more Children | 13 (86.7%) | 2 (13.3%) |
| Total | 4,142 (92.8%) | 321 (7.2%) |
Income Below Poverty Among Single-Parent Households in Ogemaw County
According to the poverty data in Ogemaw County, 11.8% or 64 single-father households and 31.6% or 292 single-mother households are living below the poverty line. Among single-father households, those with 5 or more children have the highest poverty rate, with 32 households (88.9%) experiencing poverty. Likewise, among single-mother households, those with 5 or more children have the highest poverty rate, with 7 households (100.0%) falling below the poverty line.
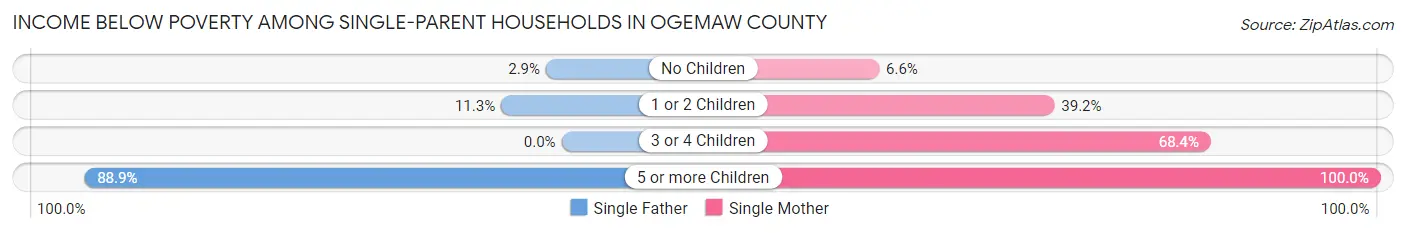
| Children | Single Father | Single Mother |
| No Children | 8 (2.9%) | 21 (6.6%) |
| 1 or 2 Children | 24 (11.3%) | 197 (39.2%) |
| 3 or 4 Children | 0 (0.0%) | 67 (68.4%) |
| 5 or more Children | 32 (88.9%) | 7 (100.0%) |
| Total | 64 (11.8%) | 292 (31.6%) |
Income Below Poverty Among Married-Couple vs Single-Parent Households in Ogemaw County
The poverty data for Ogemaw County shows that 321 of the married-couple family households (7.2%) and 356 of the single-parent households (24.3%) are living below the poverty level. Within the married-couple family households, those with 5 or more children have the highest poverty rate, with 2 households (13.3%) falling below the poverty line. Among the single-parent households, those with 5 or more children have the highest poverty rate, with 39 household (90.7%) living below poverty.
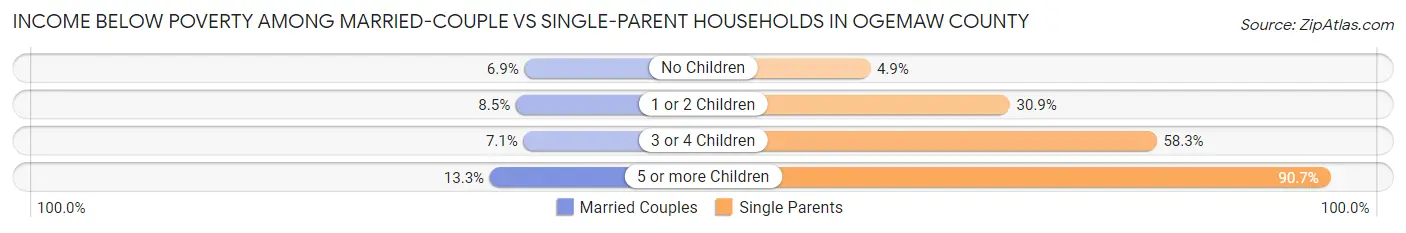
| Children | Married-Couple Families | Single-Parent Households |
| No Children | 235 (6.9%) | 29 (4.9%) |
| 1 or 2 Children | 65 (8.5%) | 221 (30.9%) |
| 3 or 4 Children | 19 (7.1%) | 67 (58.3%) |
| 5 or more Children | 2 (13.3%) | 39 (90.7%) |
| Total | 321 (7.2%) | 356 (24.3%) |
Race in Ogemaw County
The most populous races in Ogemaw County are White / Caucasian (19,762 | 94.9%), Two or more Races (647 | 3.1%), and Hispanic or Latino (469 | 2.2%).
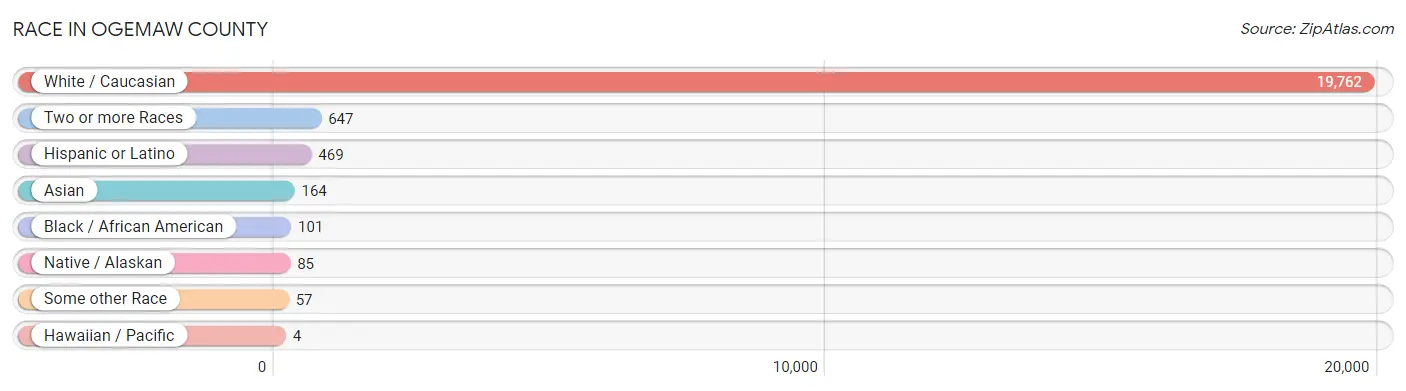
| Race | # Population | % Population |
| Asian | 164 | 0.8% |
| Black / African American | 101 | 0.5% |
| Hawaiian / Pacific | 4 | 0.0% |
| Hispanic or Latino | 469 | 2.2% |
| Native / Alaskan | 85 | 0.4% |
| White / Caucasian | 19,762 | 94.9% |
| Two or more Races | 647 | 3.1% |
| Some other Race | 57 | 0.3% |
| Total | 20,820 | 100.0% |
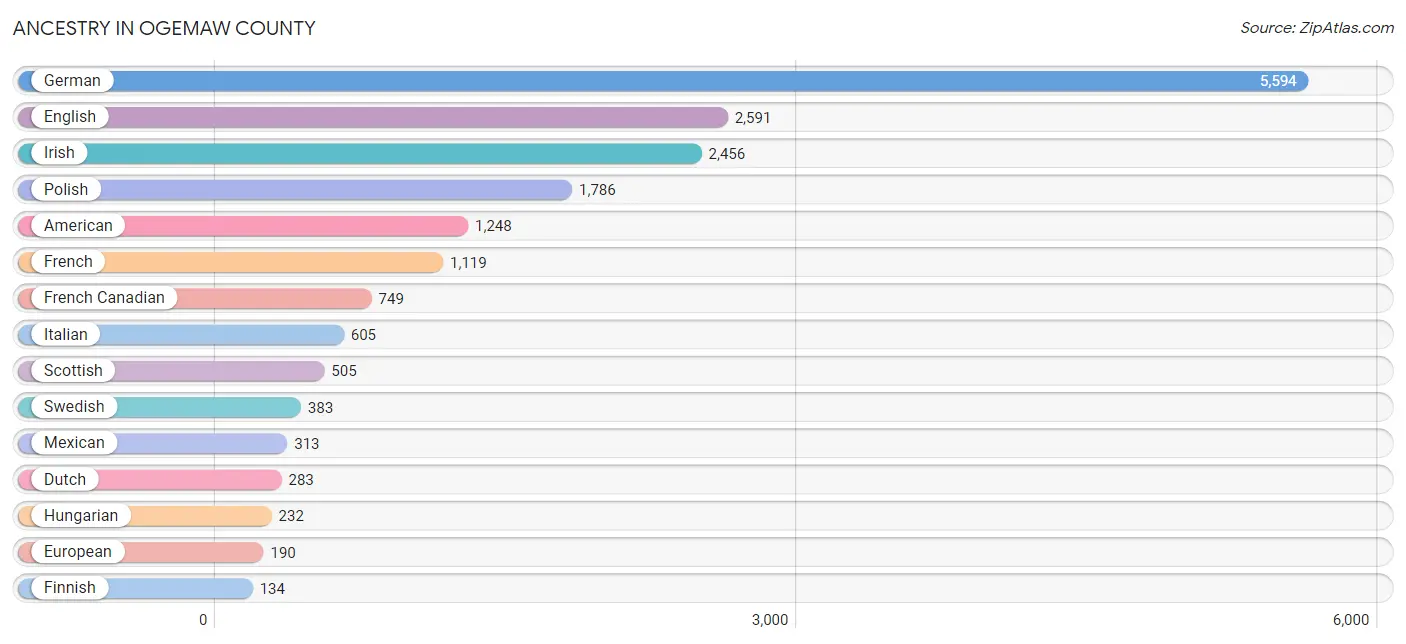
Ancestry in Ogemaw County
The most populous ancestries reported in Ogemaw County are German (5,594 | 26.9%), English (2,591 | 12.4%), Irish (2,456 | 11.8%), Polish (1,786 | 8.6%), and American (1,248 | 6.0%), together accounting for 65.7% of all Ogemaw County residents.
| Ancestry | # Population | % Population |
| African | 3 | 0.0% |
| American | 1,248 | 6.0% |
| Arab | 9 | 0.0% |
| Argentinean | 2 | 0.0% |
| Armenian | 1 | 0.0% |
| Assyrian / Chaldean / Syriac | 6 | 0.0% |
| Austrian | 47 | 0.2% |
| Belgian | 98 | 0.5% |
| Bhutanese | 4 | 0.0% |
| Blackfeet | 38 | 0.2% |
| British | 45 | 0.2% |
| Bulgarian | 2 | 0.0% |
| Burmese | 22 | 0.1% |
| Cajun | 1 | 0.0% |
| Canadian | 80 | 0.4% |
| Central American | 8 | 0.0% |
| Cherokee | 41 | 0.2% |
| Chippewa | 102 | 0.5% |
| Choctaw | 44 | 0.2% |
| Croatian | 9 | 0.0% |
| Cuban | 59 | 0.3% |
| Czech | 26 | 0.1% |
| Czechoslovakian | 16 | 0.1% |
| Danish | 45 | 0.2% |
| Dutch | 283 | 1.4% |
| Eastern European | 28 | 0.1% |
| English | 2,591 | 12.4% |
| European | 190 | 0.9% |
| Finnish | 134 | 0.6% |
| French | 1,119 | 5.4% |
| French American Indian | 25 | 0.1% |
| French Canadian | 749 | 3.6% |
| German | 5,594 | 26.9% |
| Greek | 57 | 0.3% |
| Guatemalan | 8 | 0.0% |
| Hungarian | 232 | 1.1% |
| Irish | 2,456 | 11.8% |
| Italian | 605 | 2.9% |
| Korean | 41 | 0.2% |
| Lebanese | 9 | 0.0% |
| Lithuanian | 19 | 0.1% |
| Maltese | 31 | 0.2% |
| Mexican | 313 | 1.5% |
| Mexican American Indian | 4 | 0.0% |
| Navajo | 4 | 0.0% |
| Northern European | 3 | 0.0% |
| Norwegian | 118 | 0.6% |
| Ottawa | 14 | 0.1% |
| Pennsylvania German | 19 | 0.1% |
| Peruvian | 7 | 0.0% |
| Polish | 1,786 | 8.6% |
| Portuguese | 10 | 0.1% |
| Puerto Rican | 56 | 0.3% |
| Romanian | 60 | 0.3% |
| Russian | 73 | 0.4% |
| Samoan | 4 | 0.0% |
| Scandinavian | 43 | 0.2% |
| Scotch-Irish | 125 | 0.6% |
| Scottish | 505 | 2.4% |
| Serbian | 3 | 0.0% |
| Shoshone | 17 | 0.1% |
| Slavic | 22 | 0.1% |
| Slovak | 21 | 0.1% |
| South American | 9 | 0.0% |
| Spaniard | 2 | 0.0% |
| Spanish | 6 | 0.0% |
| Sri Lankan | 6 | 0.0% |
| Subsaharan African | 12 | 0.1% |
| Swedish | 383 | 1.8% |
| Swiss | 29 | 0.1% |
| Thai | 21 | 0.1% |
| Ukrainian | 26 | 0.1% |
| Welsh | 100 | 0.5% |
| Yugoslavian | 18 | 0.1% | View All 74 Rows |
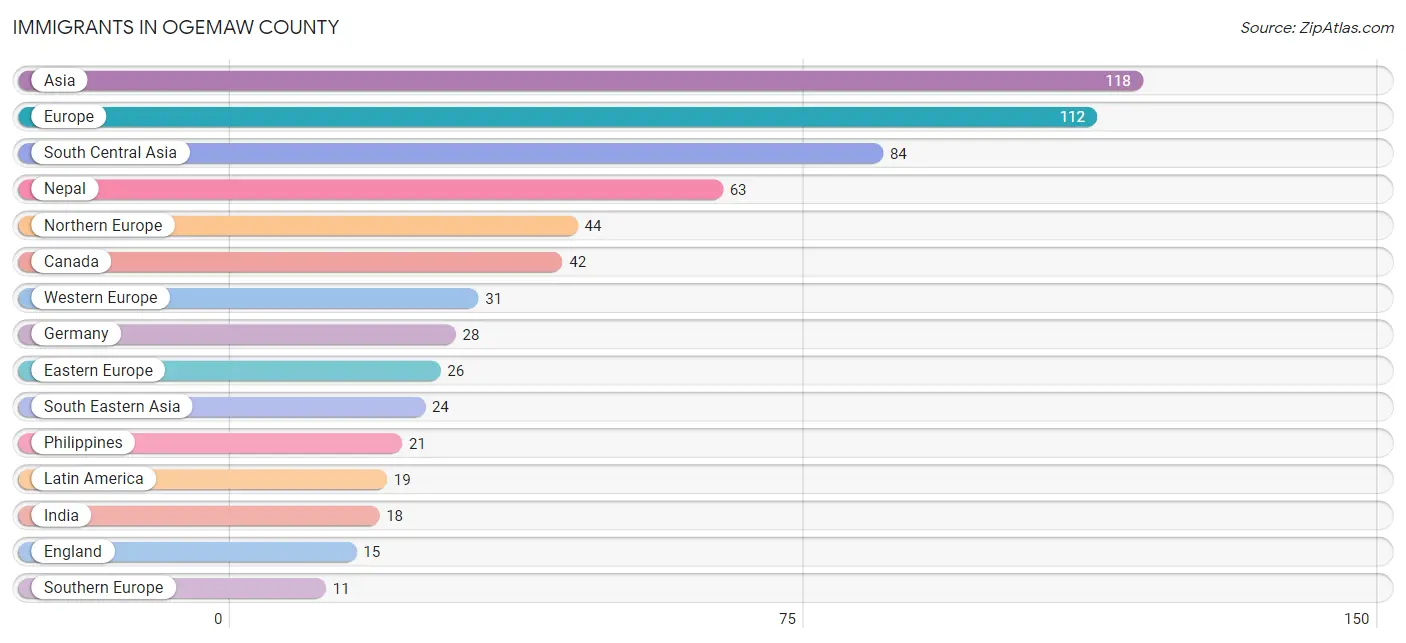
Immigrants in Ogemaw County
The most numerous immigrant groups reported in Ogemaw County came from Asia (118 | 0.6%), Europe (112 | 0.5%), South Central Asia (84 | 0.4%), Nepal (63 | 0.3%), and Northern Europe (44 | 0.2%), together accounting for 2.0% of all Ogemaw County residents.
| Immigration Origin | # Population | % Population |
| Africa | 9 | 0.0% |
| Asia | 118 | 0.6% |
| Austria | 1 | 0.0% |
| Canada | 42 | 0.2% |
| Caribbean | 4 | 0.0% |
| Central America | 8 | 0.0% |
| Cuba | 4 | 0.0% |
| Czechoslovakia | 5 | 0.0% |
| Eastern Africa | 9 | 0.0% |
| Eastern Asia | 8 | 0.0% |
| Eastern Europe | 26 | 0.1% |
| England | 15 | 0.1% |
| Europe | 112 | 0.5% |
| France | 2 | 0.0% |
| Germany | 28 | 0.1% |
| Guatemala | 8 | 0.0% |
| Hungary | 7 | 0.0% |
| India | 18 | 0.1% |
| Iran | 3 | 0.0% |
| Ireland | 4 | 0.0% |
| Italy | 6 | 0.0% |
| Korea | 8 | 0.0% |
| Latin America | 19 | 0.1% |
| Lebanon | 2 | 0.0% |
| Nepal | 63 | 0.3% |
| Northern Europe | 44 | 0.2% |
| Peru | 7 | 0.0% |
| Philippines | 21 | 0.1% |
| Portugal | 5 | 0.0% |
| Russia | 9 | 0.0% |
| South America | 7 | 0.0% |
| South Central Asia | 84 | 0.4% |
| South Eastern Asia | 24 | 0.1% |
| Southern Europe | 11 | 0.1% |
| Thailand | 3 | 0.0% |
| Western Asia | 2 | 0.0% |
| Western Europe | 31 | 0.2% | View All 37 Rows |
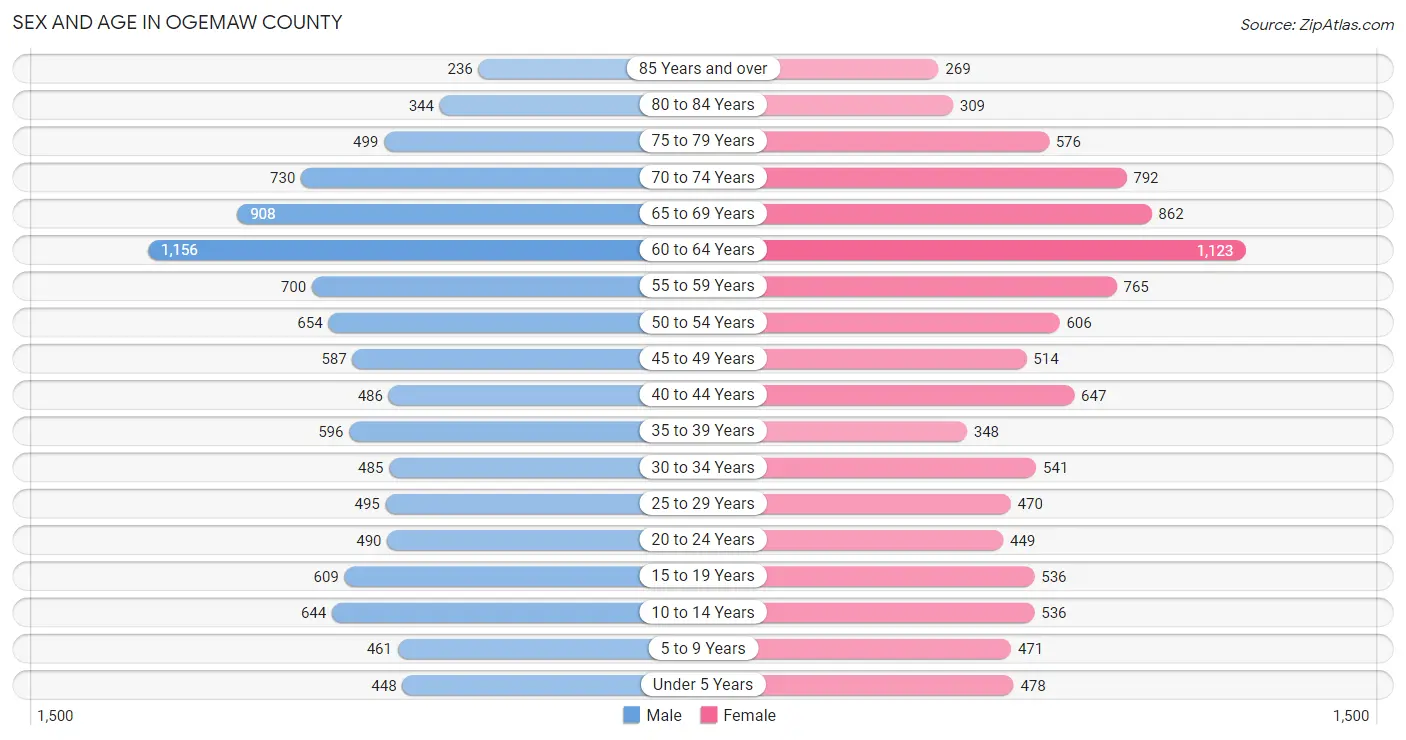
Sex and Age in Ogemaw County
Sex and Age in Ogemaw County
The most populous age groups in Ogemaw County are 60 to 64 Years (1,156 | 11.0%) for men and 60 to 64 Years (1,123 | 10.9%) for women.
| Age Bracket | Male | Female |
| Under 5 Years | 448 (4.3%) | 478 (4.6%) |
| 5 to 9 Years | 461 (4.4%) | 471 (4.6%) |
| 10 to 14 Years | 644 (6.1%) | 536 (5.2%) |
| 15 to 19 Years | 609 (5.8%) | 536 (5.2%) |
| 20 to 24 Years | 490 (4.6%) | 449 (4.4%) |
| 25 to 29 Years | 495 (4.7%) | 470 (4.6%) |
| 30 to 34 Years | 485 (4.6%) | 541 (5.3%) |
| 35 to 39 Years | 596 (5.7%) | 348 (3.4%) |
| 40 to 44 Years | 486 (4.6%) | 647 (6.3%) |
| 45 to 49 Years | 587 (5.6%) | 514 (5.0%) |
| 50 to 54 Years | 654 (6.2%) | 606 (5.9%) |
| 55 to 59 Years | 700 (6.7%) | 765 (7.4%) |
| 60 to 64 Years | 1,156 (11.0%) | 1,123 (10.9%) |
| 65 to 69 Years | 908 (8.6%) | 862 (8.4%) |
| 70 to 74 Years | 730 (6.9%) | 792 (7.7%) |
| 75 to 79 Years | 499 (4.7%) | 576 (5.6%) |
| 80 to 84 Years | 344 (3.3%) | 309 (3.0%) |
| 85 Years and over | 236 (2.2%) | 269 (2.6%) |
| Total | 10,528 (100.0%) | 10,292 (100.0%) |
Families and Households in Ogemaw County
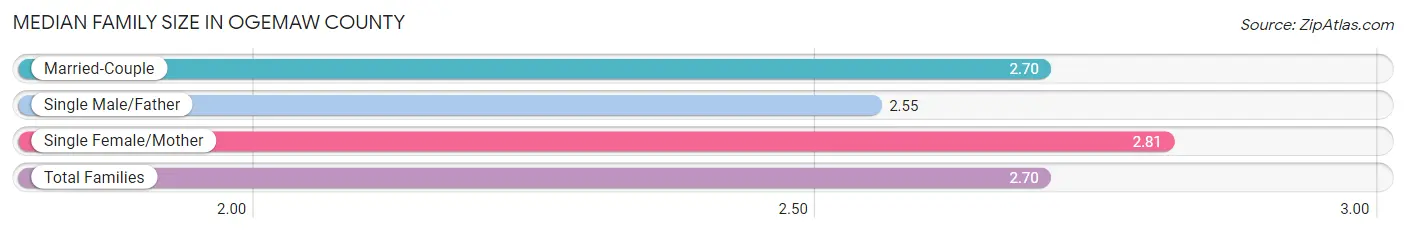
Median Family Size in Ogemaw County
The median family size in Ogemaw County is 2.70 persons per family, with single female/mother families (925 | 15.6%) accounting for the largest median family size of 2.81 persons per family. On the other hand, single male/father families (541 | 9.1%) represent the smallest median family size with 2.55 persons per family.
| Family Type | # Families | Family Size |
| Married-Couple | 4,463 (75.3%) | 2.70 |
| Single Male/Father | 541 (9.1%) | 2.55 |
| Single Female/Mother | 925 (15.6%) | 2.81 |
| Total Families | 5,929 (100.0%) | 2.70 |
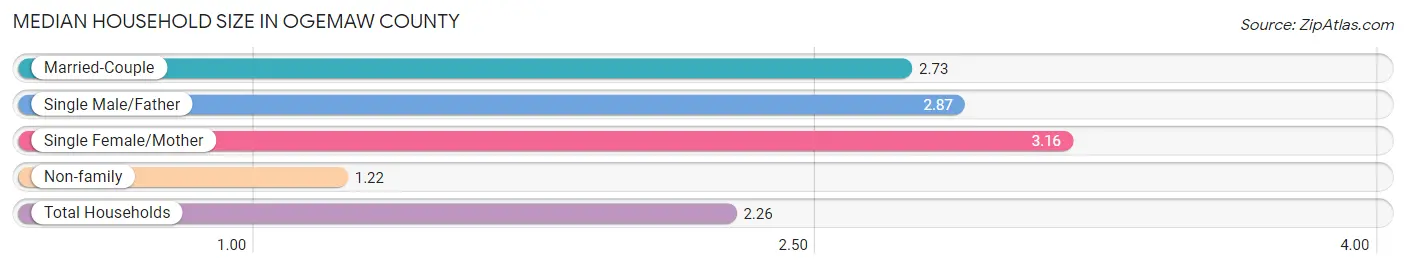
Median Household Size in Ogemaw County
The median household size in Ogemaw County is 2.26 persons per household, with single female/mother households (925 | 10.2%) accounting for the largest median household size of 3.16 persons per household. non-family households (3,160 | 34.8%) represent the smallest median household size with 1.22 persons per household.
| Household Type | # Households | Household Size |
| Married-Couple | 4,463 (49.1%) | 2.73 |
| Single Male/Father | 541 (5.9%) | 2.87 |
| Single Female/Mother | 925 (10.2%) | 3.16 |
| Non-family | 3,160 (34.8%) | 1.22 |
| Total Households | 9,089 (100.0%) | 2.26 |
Household Size by Marriage Status in Ogemaw County
Out of a total of 9,089 households in Ogemaw County, 5,929 (65.2%) are family households, while 3,160 (34.8%) are nonfamily households. The most numerous type of family households are 2-person households, comprising 3,528, and the most common type of nonfamily households are 1-person households, comprising 2,573.
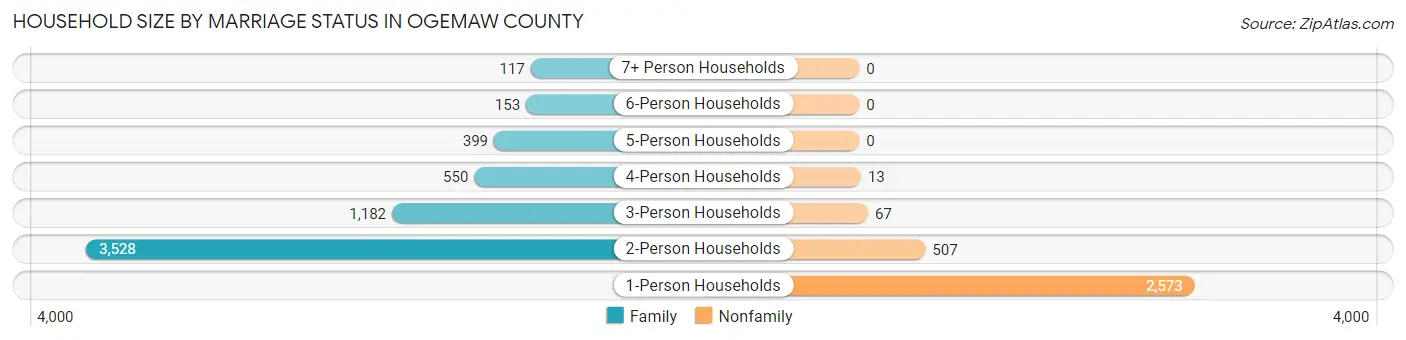
| Household Size | Family Households | Nonfamily Households |
| 1-Person Households | - | 2,573 (28.3%) |
| 2-Person Households | 3,528 (38.8%) | 507 (5.6%) |
| 3-Person Households | 1,182 (13.0%) | 67 (0.7%) |
| 4-Person Households | 550 (6.0%) | 13 (0.1%) |
| 5-Person Households | 399 (4.4%) | 0 (0.0%) |
| 6-Person Households | 153 (1.7%) | 0 (0.0%) |
| 7+ Person Households | 117 (1.3%) | 0 (0.0%) |
| Total | 5,929 (65.2%) | 3,160 (34.8%) |
Female Fertility in Ogemaw County
Fertility by Age in Ogemaw County
Average fertility rate in Ogemaw County is 70.0 births per 1,000 women. Women in the age bracket of 20 to 34 years have the highest fertility rate with 169.0 births per 1,000 women. Women in the age bracket of 20 to 34 years acount for 98.4% of all women with births.
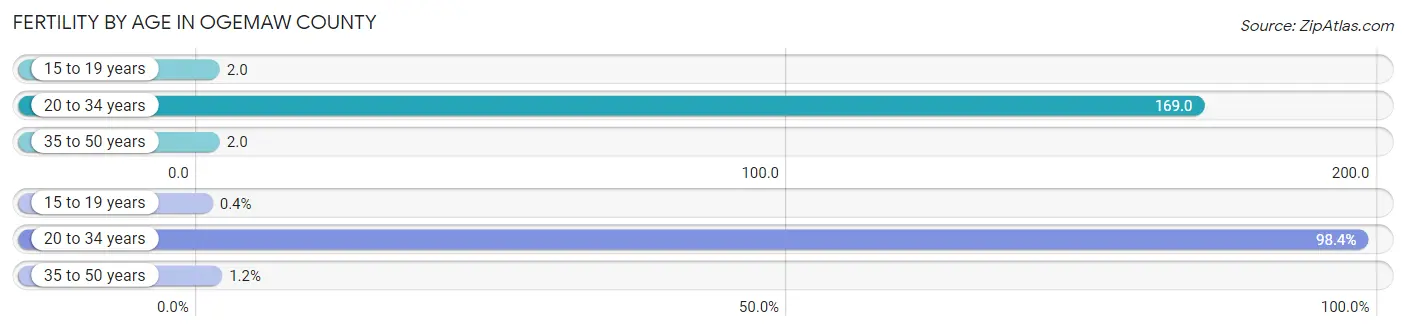
| Age Bracket | Women with Births | Births / 1,000 Women |
| 15 to 19 years | 1 (0.4%) | 2.0 |
| 20 to 34 years | 247 (98.4%) | 169.0 |
| 35 to 50 years | 3 (1.2%) | 2.0 |
| Total | 251 (100.0%) | 70.0 |
Fertility by Age by Marriage Status in Ogemaw County
42.6% of women with births (251) in Ogemaw County are married. The highest percentage of unmarried women with births falls into 15 to 19 years age bracket with 100.0% of them unmarried at the time of birth, while the lowest percentage of unmarried women with births belong to 35 to 50 years age bracket with 0.0% of them unmarried.
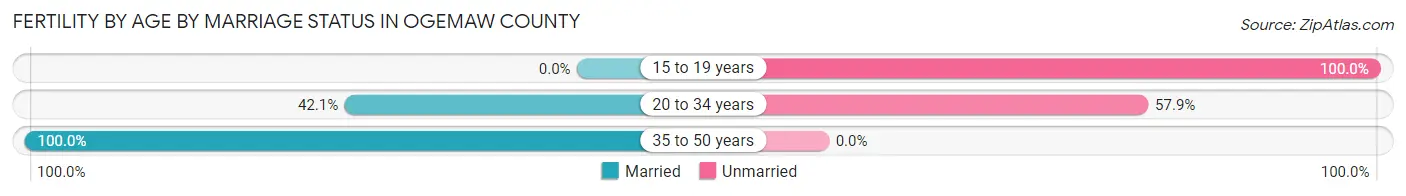
| Age Bracket | Married | Unmarried |
| 15 to 19 years | 0 (0.0%) | 1 (100.0%) |
| 20 to 34 years | 104 (42.1%) | 143 (57.9%) |
| 35 to 50 years | 3 (100.0%) | 0 (0.0%) |
| Total | 107 (42.6%) | 144 (57.4%) |
Fertility by Education in Ogemaw County
Average fertility rate in Ogemaw County is 70.0 births per 1,000 women. Women with the education attainment of college or associate's degree have the highest fertility rate of 95.0 births per 1,000 women, while women with the education attainment of graduate degree have the lowest fertility at 38.0 births per 1,000 women. Women with the education attainment of college or associate's degree represent 57.4% of all women with births.
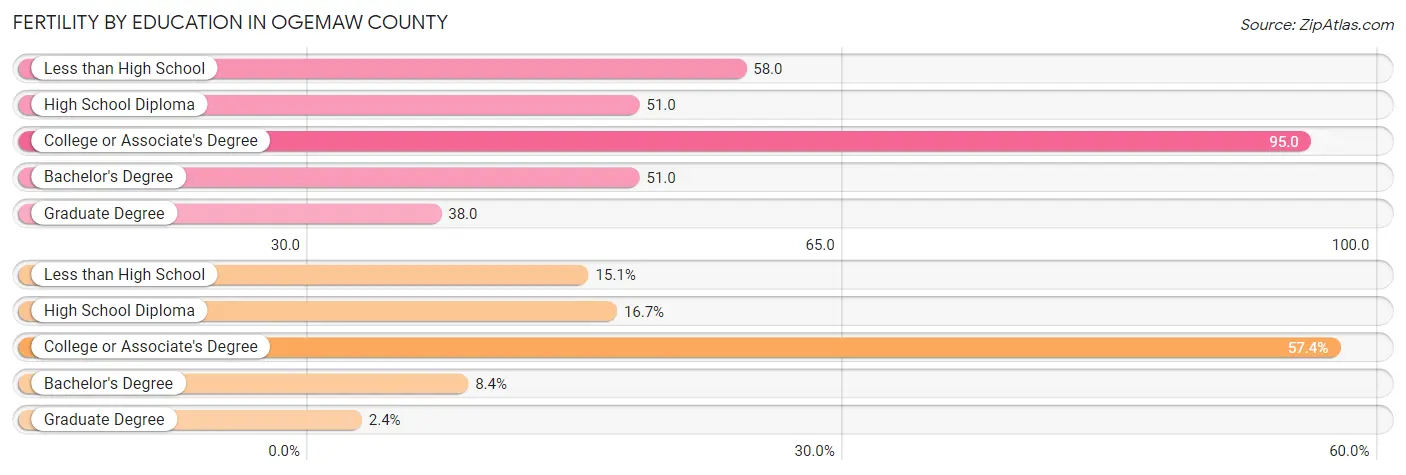
| Educational Attainment | Women with Births | Births / 1,000 Women |
| Less than High School | 38 (15.1%) | 58.0 |
| High School Diploma | 42 (16.7%) | 51.0 |
| College or Associate's Degree | 144 (57.4%) | 95.0 |
| Bachelor's Degree | 21 (8.4%) | 51.0 |
| Graduate Degree | 6 (2.4%) | 38.0 |
| Total | 251 (100.0%) | 70.0 |
Fertility by Education by Marriage Status in Ogemaw County
57.4% of women with births in Ogemaw County are unmarried. Women with the educational attainment of graduate degree are most likely to be married with 100.0% of them married at childbirth, while women with the educational attainment of less than high school are least likely to be married with 100.0% of them unmarried at childbirth.
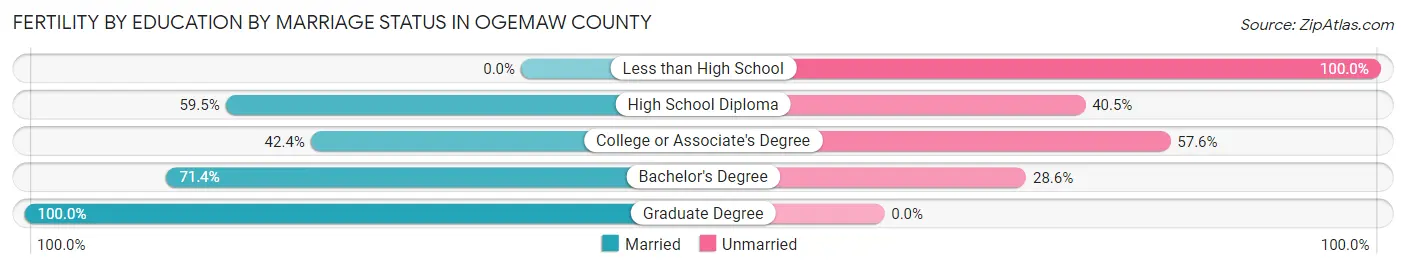
| Educational Attainment | Married | Unmarried |
| Less than High School | 0 (0.0%) | 38 (100.0%) |
| High School Diploma | 25 (59.5%) | 17 (40.5%) |
| College or Associate's Degree | 61 (42.4%) | 83 (57.6%) |
| Bachelor's Degree | 15 (71.4%) | 6 (28.6%) |
| Graduate Degree | 6 (100.0%) | 0 (0.0%) |
| Total | 107 (42.6%) | 144 (57.4%) |
Employment Characteristics in Ogemaw County
Employment by Class of Employer in Ogemaw County
Among the 7,482 employed individuals in Ogemaw County, private company employees (5,074 | 67.8%), not-for-profit organizations (684 | 9.1%), and local government employees (510 | 6.8%) make up the most common classes of employment.
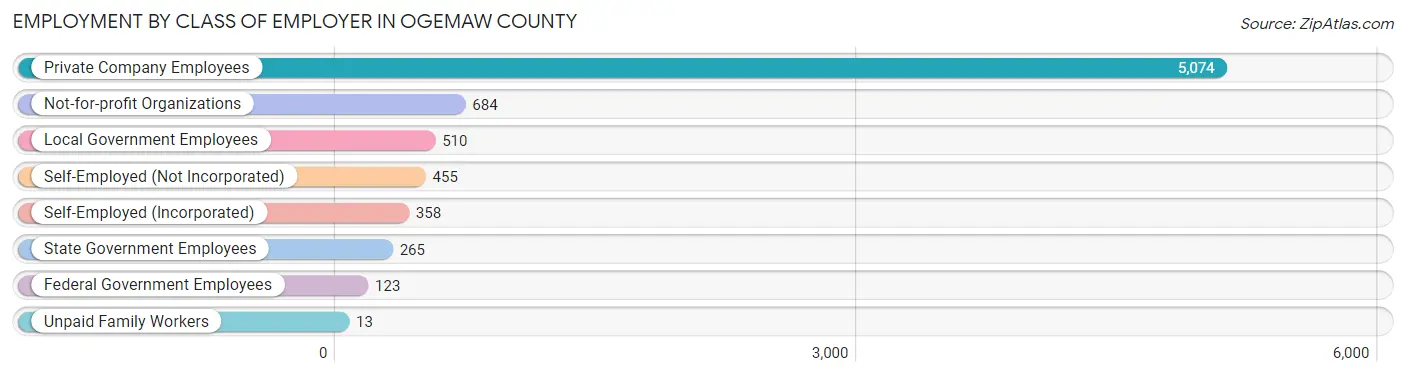
| Employer Class | # Employees | % Employees |
| Private Company Employees | 5,074 | 67.8% |
| Self-Employed (Incorporated) | 358 | 4.8% |
| Self-Employed (Not Incorporated) | 455 | 6.1% |
| Not-for-profit Organizations | 684 | 9.1% |
| Local Government Employees | 510 | 6.8% |
| State Government Employees | 265 | 3.5% |
| Federal Government Employees | 123 | 1.6% |
| Unpaid Family Workers | 13 | 0.2% |
| Total | 7,482 | 100.0% |
Employment Status by Age in Ogemaw County
According to the labor force statistics for Ogemaw County, out of the total population over 16 years of age (17,629), 47.1% or 8,303 individuals are in the labor force, with 7.1% or 590 of them unemployed. The age group with the highest labor force participation rate is 25 to 29 years, with 87.6% or 845 individuals in the labor force. Within the labor force, the 16 to 19 years age range has the highest percentage of unemployed individuals, with 14.3% or 59 of them being unemployed.
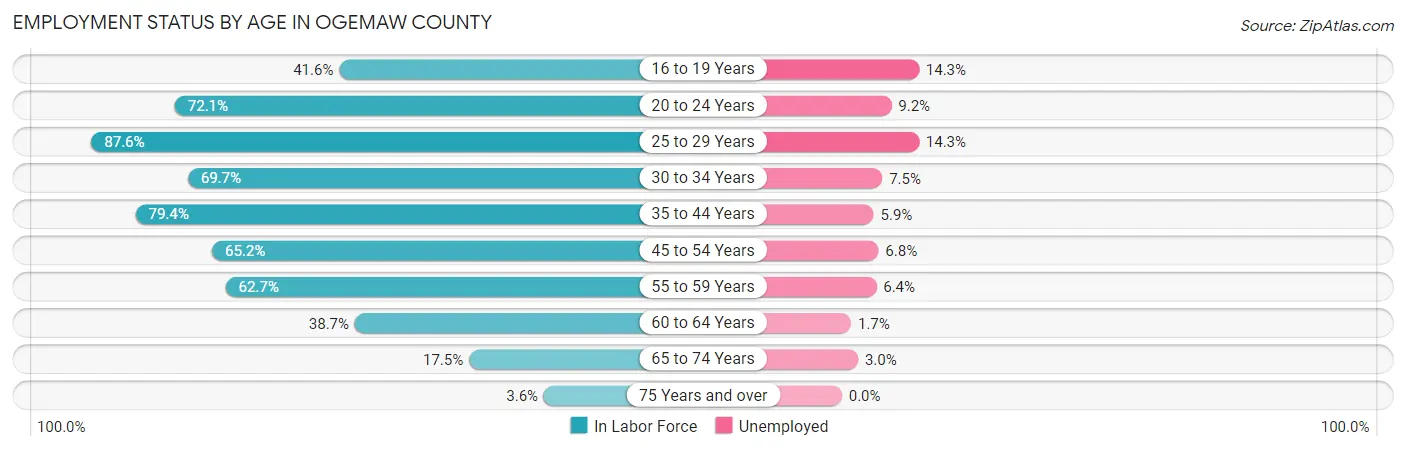
| Age Bracket | In Labor Force | Unemployed |
| 16 to 19 Years | 413 (41.6%) | 59 (14.3%) |
| 20 to 24 Years | 677 (72.1%) | 62 (9.2%) |
| 25 to 29 Years | 845 (87.6%) | 121 (14.3%) |
| 30 to 34 Years | 715 (69.7%) | 54 (7.5%) |
| 35 to 44 Years | 1,649 (79.4%) | 97 (5.9%) |
| 45 to 54 Years | 1,539 (65.2%) | 105 (6.8%) |
| 55 to 59 Years | 919 (62.7%) | 59 (6.4%) |
| 60 to 64 Years | 882 (38.7%) | 15 (1.7%) |
| 65 to 74 Years | 576 (17.5%) | 17 (3.0%) |
| 75 Years and over | 80 (3.6%) | 0 (0.0%) |
| Total | 8,303 (47.1%) | 590 (7.1%) |
Employment Status by Educational Attainment in Ogemaw County
According to labor force statistics for Ogemaw County, 64.4% of individuals (6,551) out of the total population between 25 and 64 years of age (10,173) are in the labor force, with 6.9% or 452 of them being unemployed. The group with the highest labor force participation rate are those with the educational attainment of bachelor's degree or higher, with 83.3% or 1,294 individuals in the labor force. Within the labor force, individuals with high school diploma education have the highest percentage of unemployment, with 11.4% or 255 of them being unemployed.
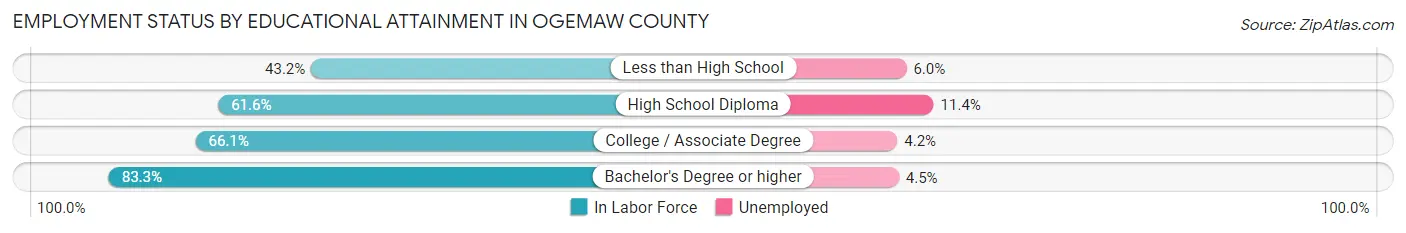
| Educational Attainment | In Labor Force | Unemployed |
| Less than High School | 521 (43.2%) | 72 (6.0%) |
| High School Diploma | 2,234 (61.6%) | 413 (11.4%) |
| College / Associate Degree | 2,504 (66.1%) | 159 (4.2%) |
| Bachelor's Degree or higher | 1,294 (83.3%) | 70 (4.5%) |
| Total | 6,551 (64.4%) | 702 (6.9%) |
Employment Occupations by Sex in Ogemaw County
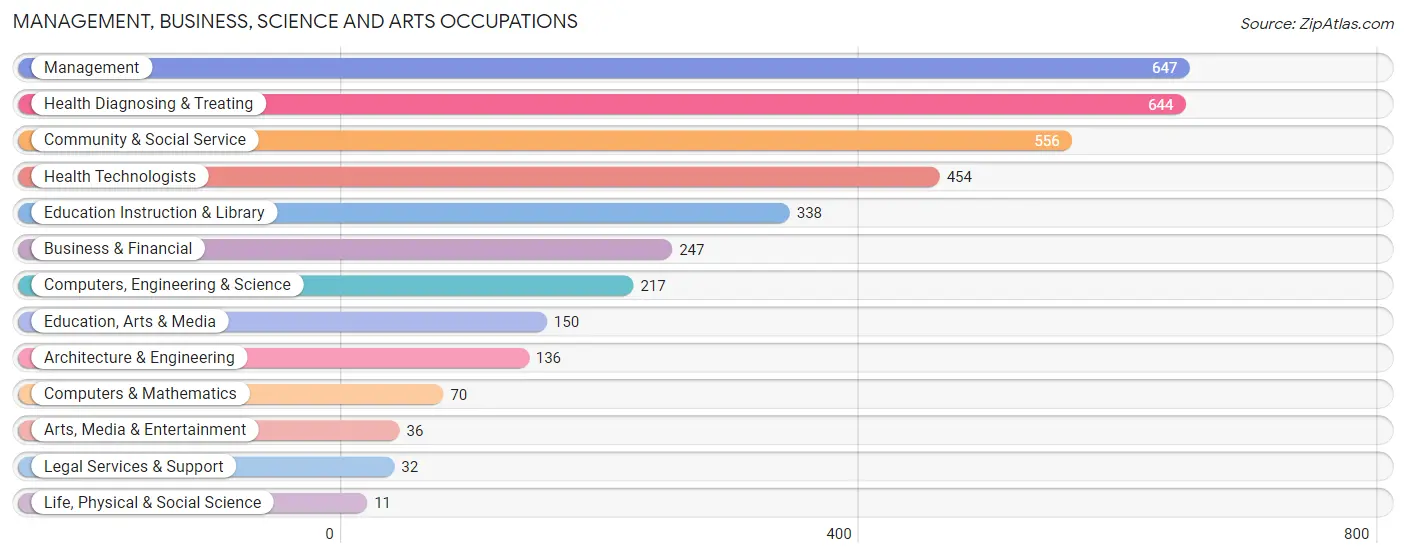
Management, Business, Science and Arts Occupations
The most common Management, Business, Science and Arts occupations in Ogemaw County are Management (647 | 8.4%), Health Diagnosing & Treating (644 | 8.4%), Community & Social Service (556 | 7.2%), Health Technologists (454 | 5.9%), and Education Instruction & Library (338 | 4.4%).
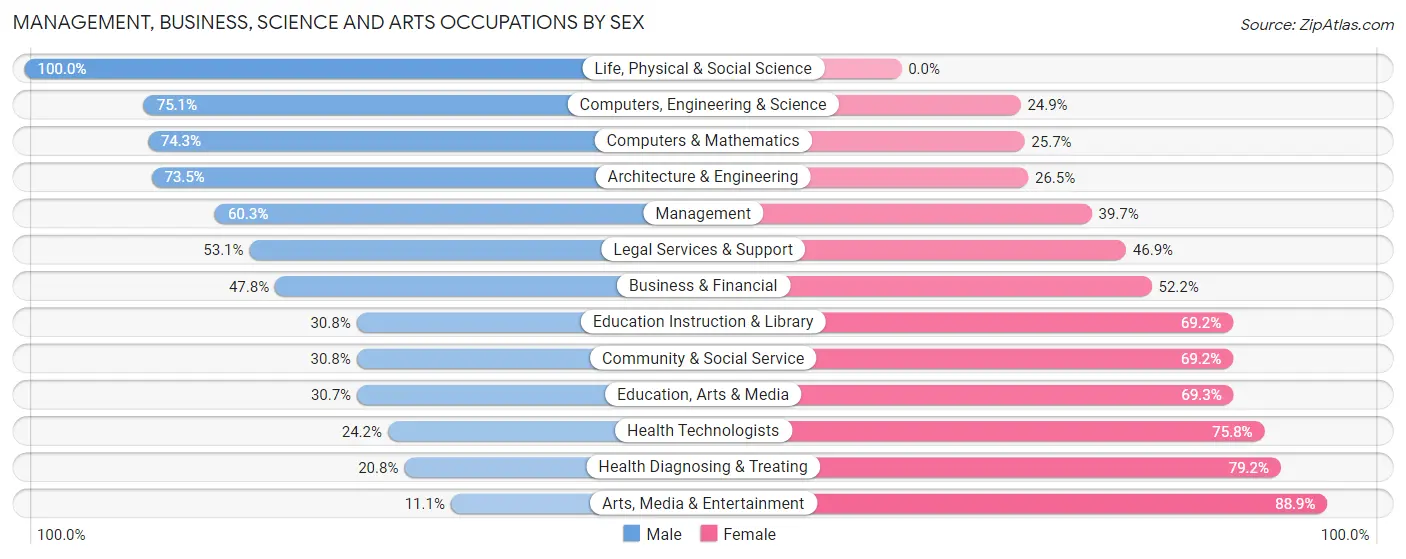
Management, Business, Science and Arts Occupations by Sex
Within the Management, Business, Science and Arts occupations in Ogemaw County, the most male-oriented occupations are Life, Physical & Social Science (100.0%), Computers, Engineering & Science (75.1%), and Computers & Mathematics (74.3%), while the most female-oriented occupations are Arts, Media & Entertainment (88.9%), Health Diagnosing & Treating (79.2%), and Health Technologists (75.8%).
| Occupation | Male | Female |
| Management | 390 (60.3%) | 257 (39.7%) |
| Business & Financial | 118 (47.8%) | 129 (52.2%) |
| Computers, Engineering & Science | 163 (75.1%) | 54 (24.9%) |
| Computers & Mathematics | 52 (74.3%) | 18 (25.7%) |
| Architecture & Engineering | 100 (73.5%) | 36 (26.5%) |
| Life, Physical & Social Science | 11 (100.0%) | 0 (0.0%) |
| Community & Social Service | 171 (30.8%) | 385 (69.2%) |
| Education, Arts & Media | 46 (30.7%) | 104 (69.3%) |
| Legal Services & Support | 17 (53.1%) | 15 (46.9%) |
| Education Instruction & Library | 104 (30.8%) | 234 (69.2%) |
| Arts, Media & Entertainment | 4 (11.1%) | 32 (88.9%) |
| Health Diagnosing & Treating | 134 (20.8%) | 510 (79.2%) |
| Health Technologists | 110 (24.2%) | 344 (75.8%) |
| Total (Category) | 976 (42.2%) | 1,335 (57.8%) |
| Total (Overall) | 3,935 (51.1%) | 3,762 (48.9%) |
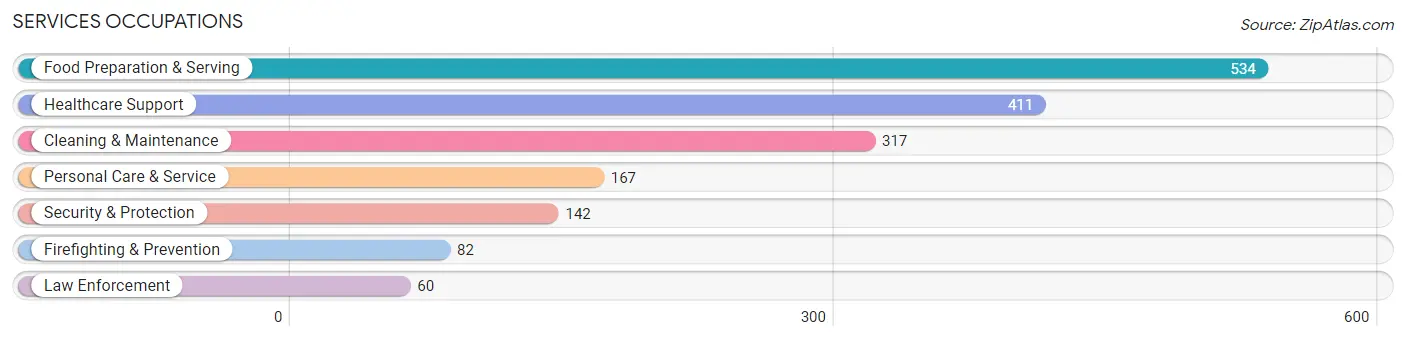
Services Occupations
The most common Services occupations in Ogemaw County are Food Preparation & Serving (534 | 6.9%), Healthcare Support (411 | 5.3%), Cleaning & Maintenance (317 | 4.1%), Personal Care & Service (167 | 2.2%), and Security & Protection (142 | 1.8%).
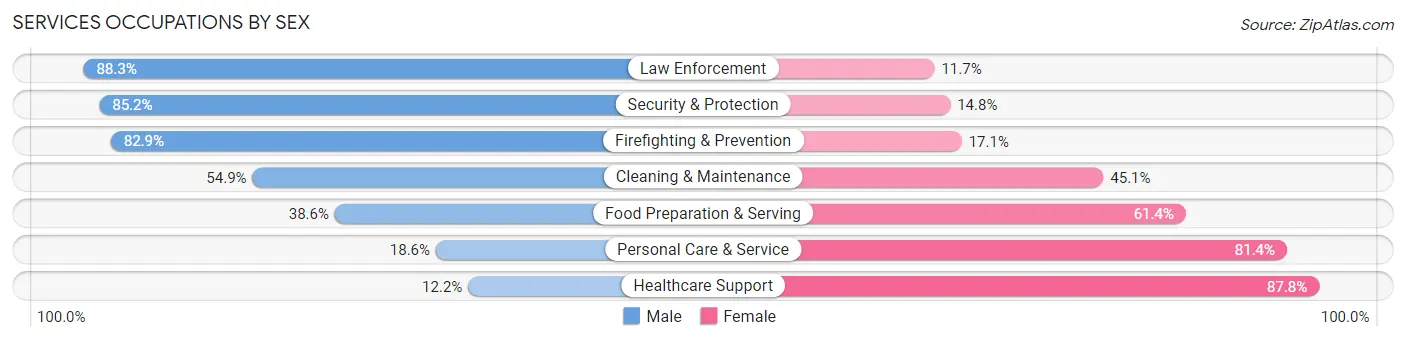
Services Occupations by Sex
Within the Services occupations in Ogemaw County, the most male-oriented occupations are Law Enforcement (88.3%), Security & Protection (85.2%), and Firefighting & Prevention (82.9%), while the most female-oriented occupations are Healthcare Support (87.8%), Personal Care & Service (81.4%), and Food Preparation & Serving (61.4%).
| Occupation | Male | Female |
| Healthcare Support | 50 (12.2%) | 361 (87.8%) |
| Security & Protection | 121 (85.2%) | 21 (14.8%) |
| Firefighting & Prevention | 68 (82.9%) | 14 (17.1%) |
| Law Enforcement | 53 (88.3%) | 7 (11.7%) |
| Food Preparation & Serving | 206 (38.6%) | 328 (61.4%) |
| Cleaning & Maintenance | 174 (54.9%) | 143 (45.1%) |
| Personal Care & Service | 31 (18.6%) | 136 (81.4%) |
| Total (Category) | 582 (37.0%) | 989 (62.9%) |
| Total (Overall) | 3,935 (51.1%) | 3,762 (48.9%) |
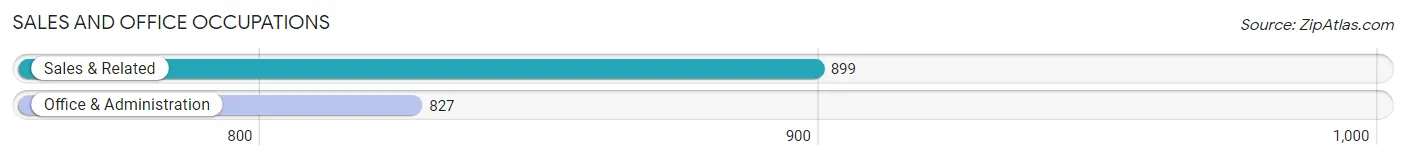
Sales and Office Occupations
The most common Sales and Office occupations in Ogemaw County are Sales & Related (899 | 11.7%), and Office & Administration (827 | 10.7%).
Sales and Office Occupations by Sex
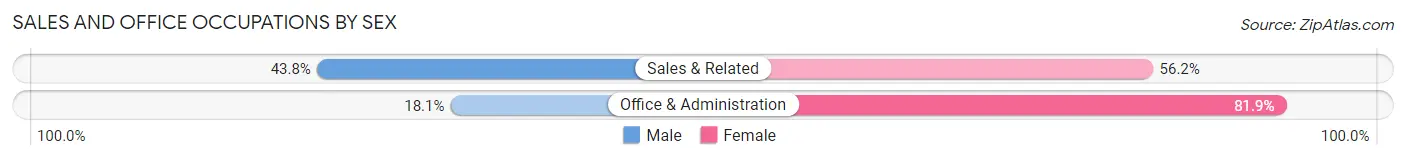
| Occupation | Male | Female |
| Sales & Related | 394 (43.8%) | 505 (56.2%) |
| Office & Administration | 150 (18.1%) | 677 (81.9%) |
| Total (Category) | 544 (31.5%) | 1,182 (68.5%) |
| Total (Overall) | 3,935 (51.1%) | 3,762 (48.9%) |
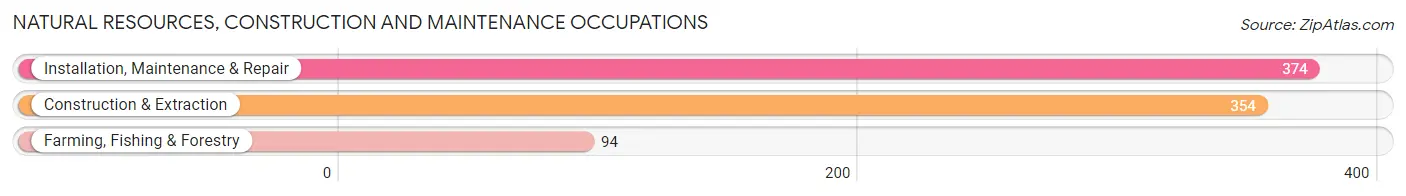
Natural Resources, Construction and Maintenance Occupations
The most common Natural Resources, Construction and Maintenance occupations in Ogemaw County are Installation, Maintenance & Repair (374 | 4.9%), Construction & Extraction (354 | 4.6%), and Farming, Fishing & Forestry (94 | 1.2%).
Natural Resources, Construction and Maintenance Occupations by Sex
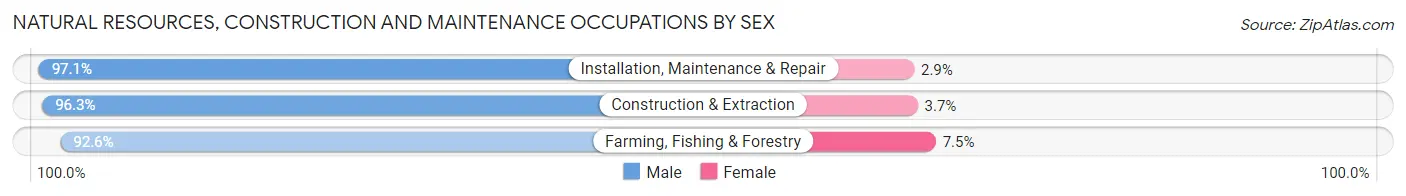
| Occupation | Male | Female |
| Farming, Fishing & Forestry | 87 (92.5%) | 7 (7.4%) |
| Construction & Extraction | 341 (96.3%) | 13 (3.7%) |
| Installation, Maintenance & Repair | 363 (97.1%) | 11 (2.9%) |
| Total (Category) | 791 (96.2%) | 31 (3.8%) |
| Total (Overall) | 3,935 (51.1%) | 3,762 (48.9%) |
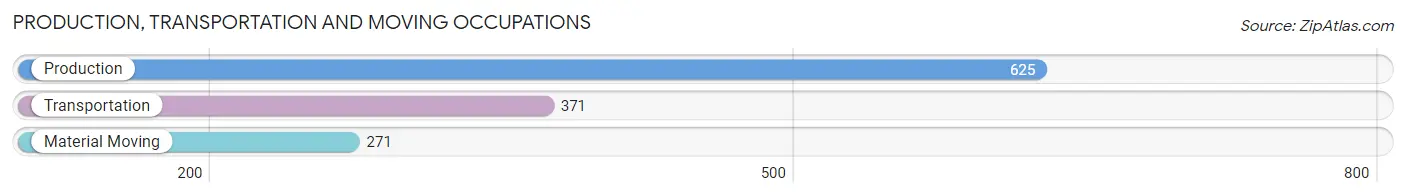
Production, Transportation and Moving Occupations
The most common Production, Transportation and Moving occupations in Ogemaw County are Production (625 | 8.1%), Transportation (371 | 4.8%), and Material Moving (271 | 3.5%).
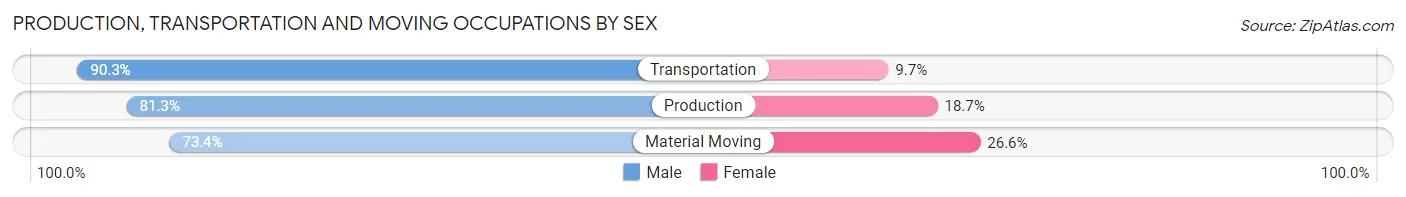
Production, Transportation and Moving Occupations by Sex
| Occupation | Male | Female |
| Production | 508 (81.3%) | 117 (18.7%) |
| Transportation | 335 (90.3%) | 36 (9.7%) |
| Material Moving | 199 (73.4%) | 72 (26.6%) |
| Total (Category) | 1,042 (82.2%) | 225 (17.8%) |
| Total (Overall) | 3,935 (51.1%) | 3,762 (48.9%) |
Employment Industries by Sex in Ogemaw County
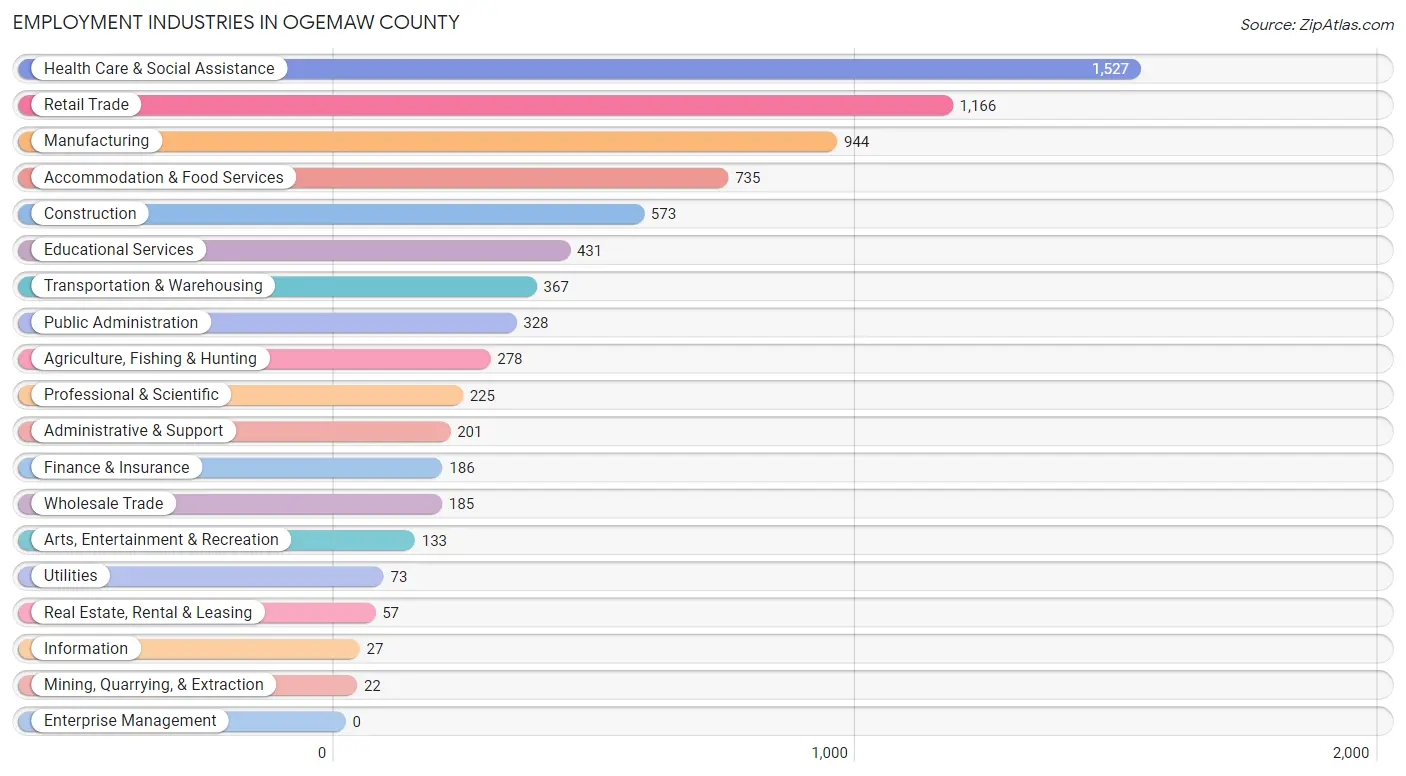
Employment Industries in Ogemaw County
The major employment industries in Ogemaw County include Health Care & Social Assistance (1,527 | 19.8%), Retail Trade (1,166 | 15.1%), Manufacturing (944 | 12.3%), Accommodation & Food Services (735 | 9.6%), and Construction (573 | 7.4%).
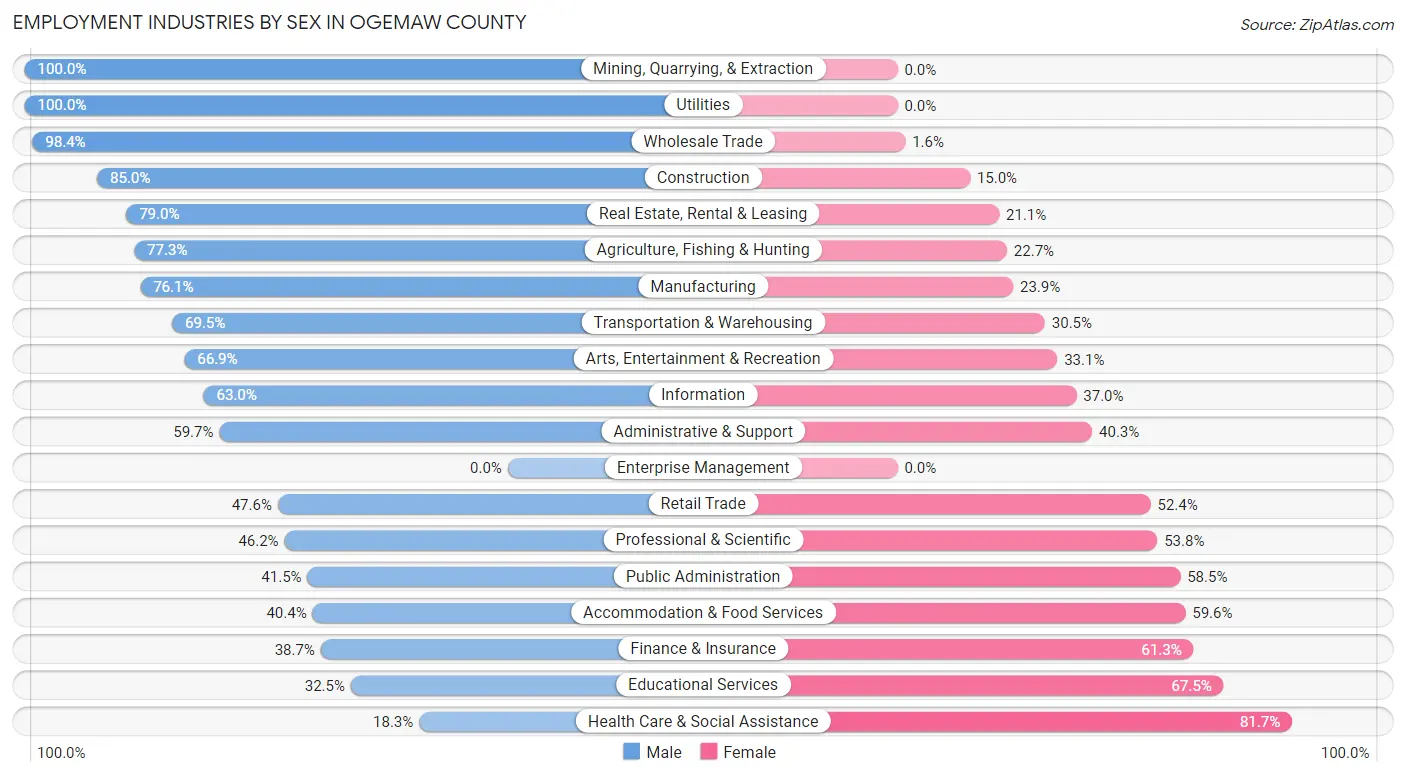
Employment Industries by Sex in Ogemaw County
The Ogemaw County industries that see more men than women are Mining, Quarrying, & Extraction (100.0%), Utilities (100.0%), and Wholesale Trade (98.4%), whereas the industries that tend to have a higher number of women are Health Care & Social Assistance (81.7%), Educational Services (67.5%), and Finance & Insurance (61.3%).
| Industry | Male | Female |
| Agriculture, Fishing & Hunting | 215 (77.3%) | 63 (22.7%) |
| Mining, Quarrying, & Extraction | 22 (100.0%) | 0 (0.0%) |
| Construction | 487 (85.0%) | 86 (15.0%) |
| Manufacturing | 718 (76.1%) | 226 (23.9%) |
| Wholesale Trade | 182 (98.4%) | 3 (1.6%) |
| Retail Trade | 555 (47.6%) | 611 (52.4%) |
| Transportation & Warehousing | 255 (69.5%) | 112 (30.5%) |
| Utilities | 73 (100.0%) | 0 (0.0%) |
| Information | 17 (63.0%) | 10 (37.0%) |
| Finance & Insurance | 72 (38.7%) | 114 (61.3%) |
| Real Estate, Rental & Leasing | 45 (78.9%) | 12 (21.0%) |
| Professional & Scientific | 104 (46.2%) | 121 (53.8%) |
| Enterprise Management | 0 (0.0%) | 0 (0.0%) |
| Administrative & Support | 120 (59.7%) | 81 (40.3%) |
| Educational Services | 140 (32.5%) | 291 (67.5%) |
| Health Care & Social Assistance | 280 (18.3%) | 1,247 (81.7%) |
| Arts, Entertainment & Recreation | 89 (66.9%) | 44 (33.1%) |
| Accommodation & Food Services | 297 (40.4%) | 438 (59.6%) |
| Public Administration | 136 (41.5%) | 192 (58.5%) |
| Total | 3,935 (51.1%) | 3,762 (48.9%) |
Education in Ogemaw County
School Enrollment in Ogemaw County
The most common levels of schooling among the 3,657 students in Ogemaw County are high school (957 | 26.2%), middle school (895 | 24.5%), and elementary school (701 | 19.2%).
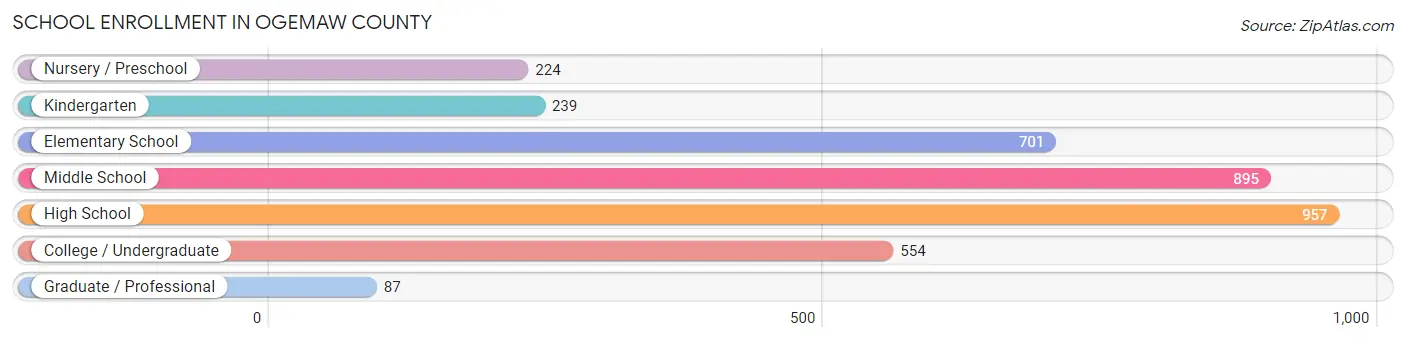
| School Level | # Students | % Students |
| Nursery / Preschool | 224 | 6.1% |
| Kindergarten | 239 | 6.5% |
| Elementary School | 701 | 19.2% |
| Middle School | 895 | 24.5% |
| High School | 957 | 26.2% |
| College / Undergraduate | 554 | 15.1% |
| Graduate / Professional | 87 | 2.4% |
| Total | 3,657 | 100.0% |
School Enrollment by Age by Funding Source in Ogemaw County
Out of a total of 3,657 students who are enrolled in schools in Ogemaw County, 380 (10.4%) attend a private institution, while the remaining 3,277 (89.6%) are enrolled in public schools. The age group of 3 to 4 year olds has the highest likelihood of being enrolled in private schools, with 46 (30.3% in the age bracket) enrolled. Conversely, the age group of 20 to 24 year olds has the lowest likelihood of being enrolled in a private school, with 293 (98.3% in the age bracket) attending a public institution.
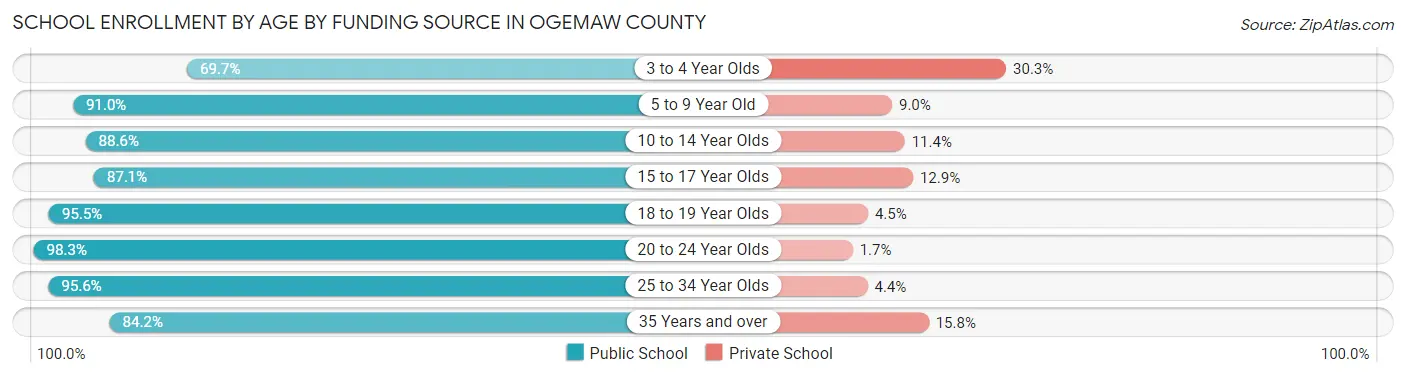
| Age Bracket | Public School | Private School |
| 3 to 4 Year Olds | 106 (69.7%) | 46 (30.3%) |
| 5 to 9 Year Old | 808 (91.0%) | 80 (9.0%) |
| 10 to 14 Year Olds | 1,021 (88.6%) | 131 (11.4%) |
| 15 to 17 Year Olds | 580 (87.1%) | 86 (12.9%) |
| 18 to 19 Year Olds | 253 (95.5%) | 12 (4.5%) |
| 20 to 24 Year Olds | 293 (98.3%) | 5 (1.7%) |
| 25 to 34 Year Olds | 129 (95.6%) | 6 (4.4%) |
| 35 Years and over | 85 (84.2%) | 16 (15.8%) |
| Total | 3,277 (89.6%) | 380 (10.4%) |
Educational Attainment by Field of Study in Ogemaw County
Education (608 | 24.0%), business (417 | 16.5%), science & technology (318 | 12.6%), liberal arts & history (167 | 6.6%), and arts & humanities (164 | 6.5%) are the most common fields of study among 2,533 individuals in Ogemaw County who have obtained a bachelor's degree or higher.
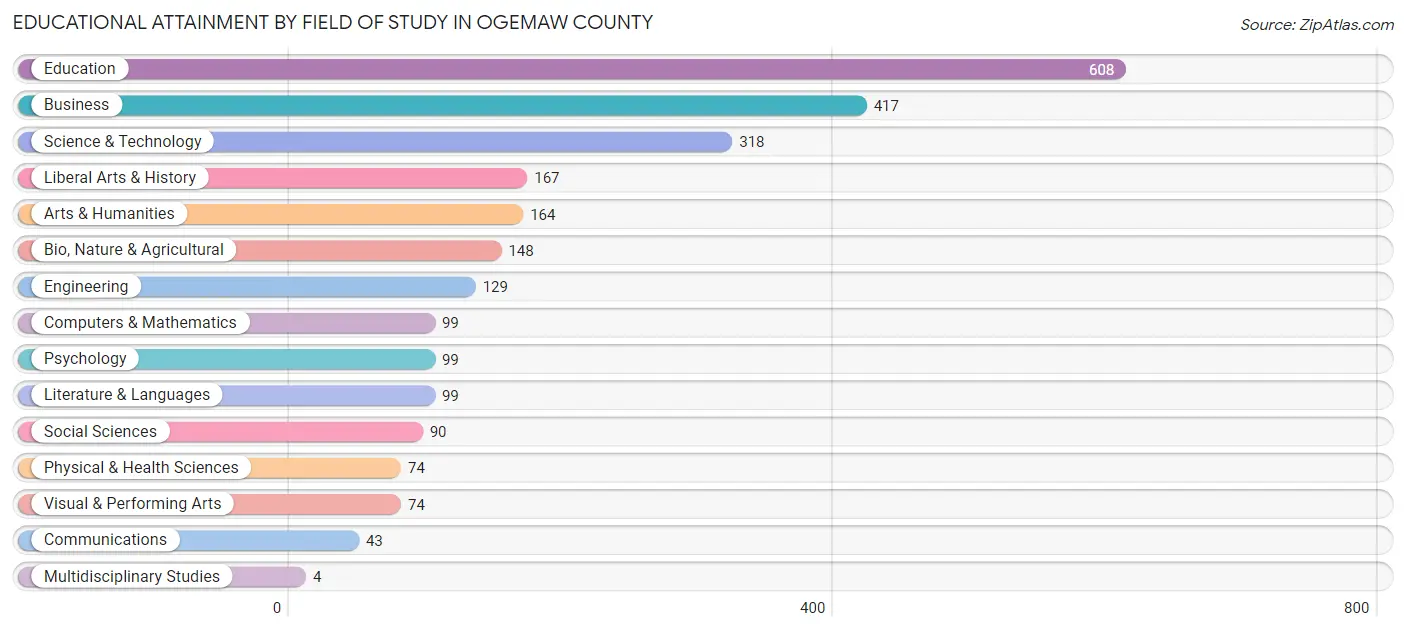
| Field of Study | # Graduates | % Graduates |
| Computers & Mathematics | 99 | 3.9% |
| Bio, Nature & Agricultural | 148 | 5.8% |
| Physical & Health Sciences | 74 | 2.9% |
| Psychology | 99 | 3.9% |
| Social Sciences | 90 | 3.5% |
| Engineering | 129 | 5.1% |
| Multidisciplinary Studies | 4 | 0.2% |
| Science & Technology | 318 | 12.6% |
| Business | 417 | 16.5% |
| Education | 608 | 24.0% |
| Literature & Languages | 99 | 3.9% |
| Liberal Arts & History | 167 | 6.6% |
| Visual & Performing Arts | 74 | 2.9% |
| Communications | 43 | 1.7% |
| Arts & Humanities | 164 | 6.5% |
| Total | 2,533 | 100.0% |
Transportation & Commute in Ogemaw County
Vehicle Availability by Sex in Ogemaw County
The most prevalent vehicle ownership categories in Ogemaw County are males with 2 vehicles (1,556, accounting for 40.9%) and females with 2 vehicles (1,367, making up 42.3%).
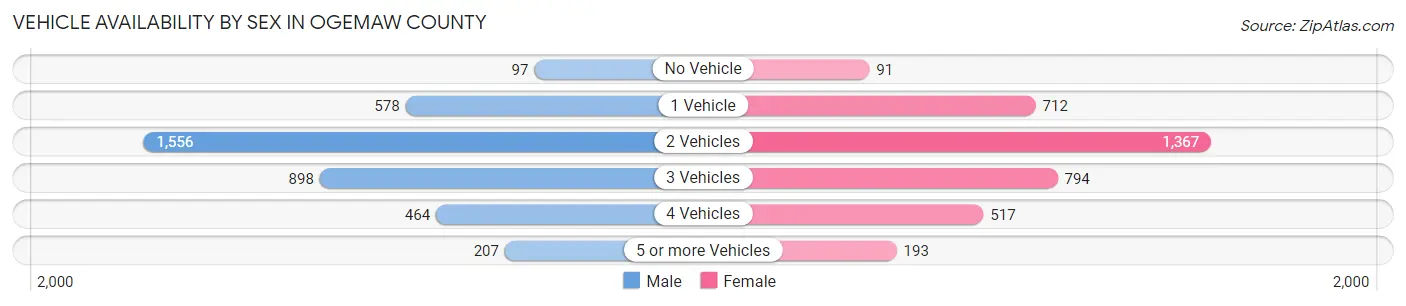
| Vehicles Available | Male | Female |
| No Vehicle | 97 (2.5%) | 91 (2.5%) |
| 1 Vehicle | 578 (15.2%) | 712 (19.4%) |
| 2 Vehicles | 1,556 (40.9%) | 1,367 (37.2%) |
| 3 Vehicles | 898 (23.6%) | 794 (21.6%) |
| 4 Vehicles | 464 (12.2%) | 517 (14.1%) |
| 5 or more Vehicles | 207 (5.4%) | 193 (5.2%) |
| Total | 3,800 (100.0%) | 3,674 (100.0%) |
Commute Time in Ogemaw County
The most frequently occuring commute durations in Ogemaw County are 10 to 14 minutes (1,221 commuters, 17.5%), 5 to 9 minutes (1,001 commuters, 14.3%), and 15 to 19 minutes (872 commuters, 12.5%).
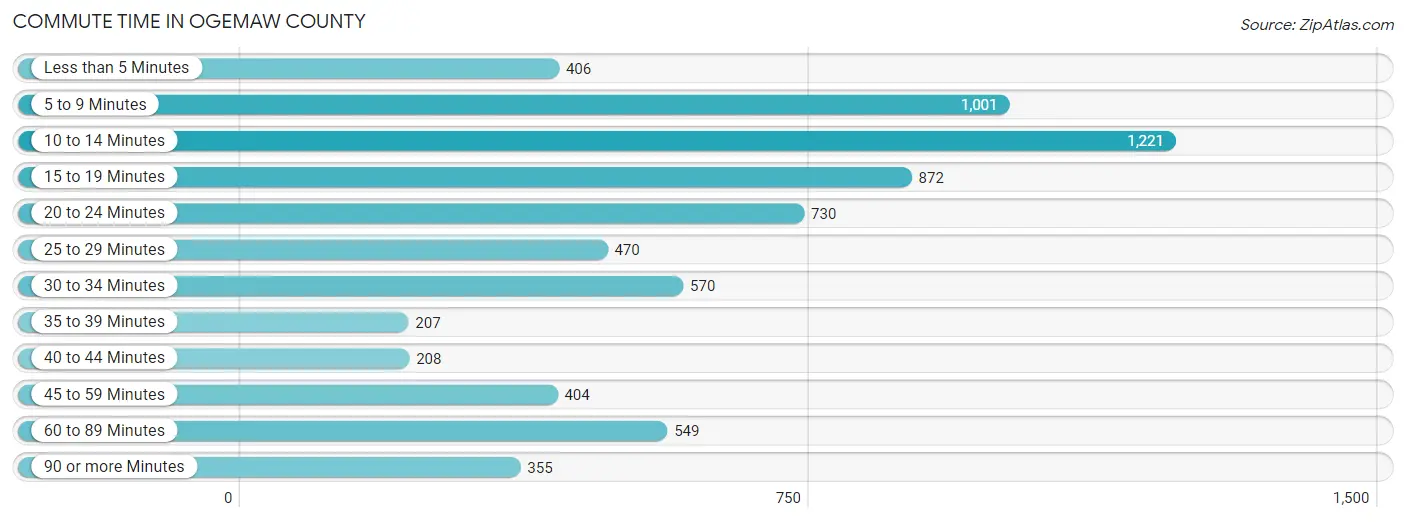
| Commute Time | # Commuters | % Commuters |
| Less than 5 Minutes | 406 | 5.8% |
| 5 to 9 Minutes | 1,001 | 14.3% |
| 10 to 14 Minutes | 1,221 | 17.5% |
| 15 to 19 Minutes | 872 | 12.5% |
| 20 to 24 Minutes | 730 | 10.4% |
| 25 to 29 Minutes | 470 | 6.7% |
| 30 to 34 Minutes | 570 | 8.2% |
| 35 to 39 Minutes | 207 | 3.0% |
| 40 to 44 Minutes | 208 | 3.0% |
| 45 to 59 Minutes | 404 | 5.8% |
| 60 to 89 Minutes | 549 | 7.9% |
| 90 or more Minutes | 355 | 5.1% |
Commute Time by Sex in Ogemaw County
The most common commute times in Ogemaw County are 10 to 14 minutes (634 commuters, 17.9%) for males and 10 to 14 minutes (587 commuters, 17.0%) for females.
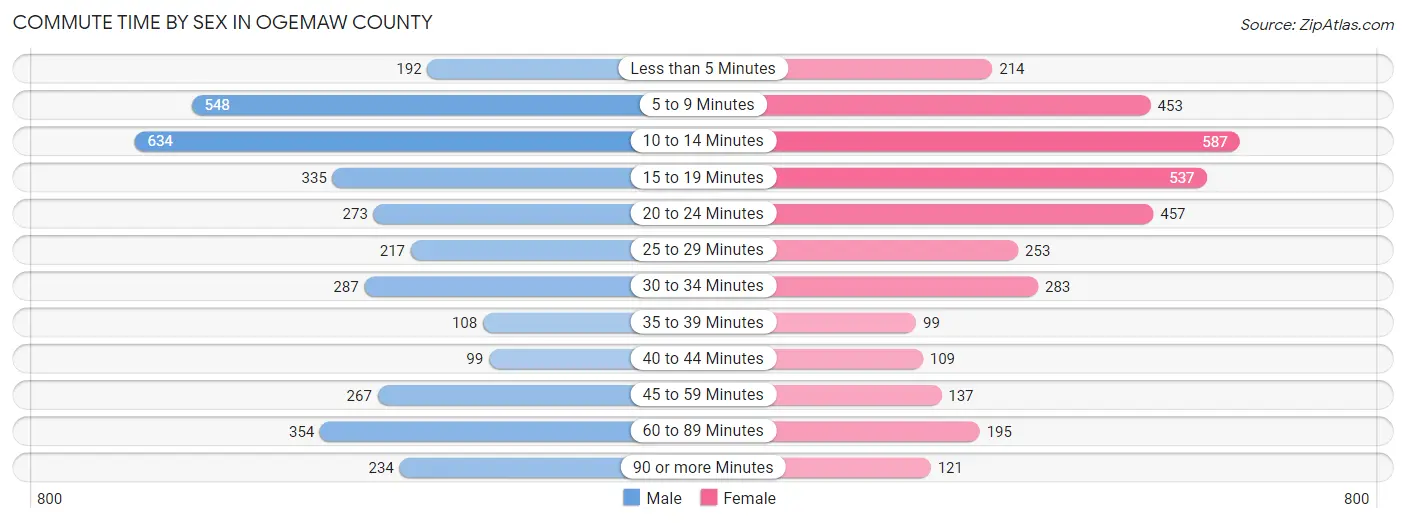
| Commute Time | Male | Female |
| Less than 5 Minutes | 192 (5.4%) | 214 (6.2%) |
| 5 to 9 Minutes | 548 (15.4%) | 453 (13.2%) |
| 10 to 14 Minutes | 634 (17.9%) | 587 (17.0%) |
| 15 to 19 Minutes | 335 (9.4%) | 537 (15.6%) |
| 20 to 24 Minutes | 273 (7.7%) | 457 (13.3%) |
| 25 to 29 Minutes | 217 (6.1%) | 253 (7.3%) |
| 30 to 34 Minutes | 287 (8.1%) | 283 (8.2%) |
| 35 to 39 Minutes | 108 (3.0%) | 99 (2.9%) |
| 40 to 44 Minutes | 99 (2.8%) | 109 (3.2%) |
| 45 to 59 Minutes | 267 (7.5%) | 137 (4.0%) |
| 60 to 89 Minutes | 354 (10.0%) | 195 (5.7%) |
| 90 or more Minutes | 234 (6.6%) | 121 (3.5%) |
Time of Departure to Work by Sex in Ogemaw County
The most frequent times of departure to work in Ogemaw County are 7:00 AM to 7:29 AM (447, 12.6%) for males and 7:30 AM to 7:59 AM (481, 14.0%) for females.
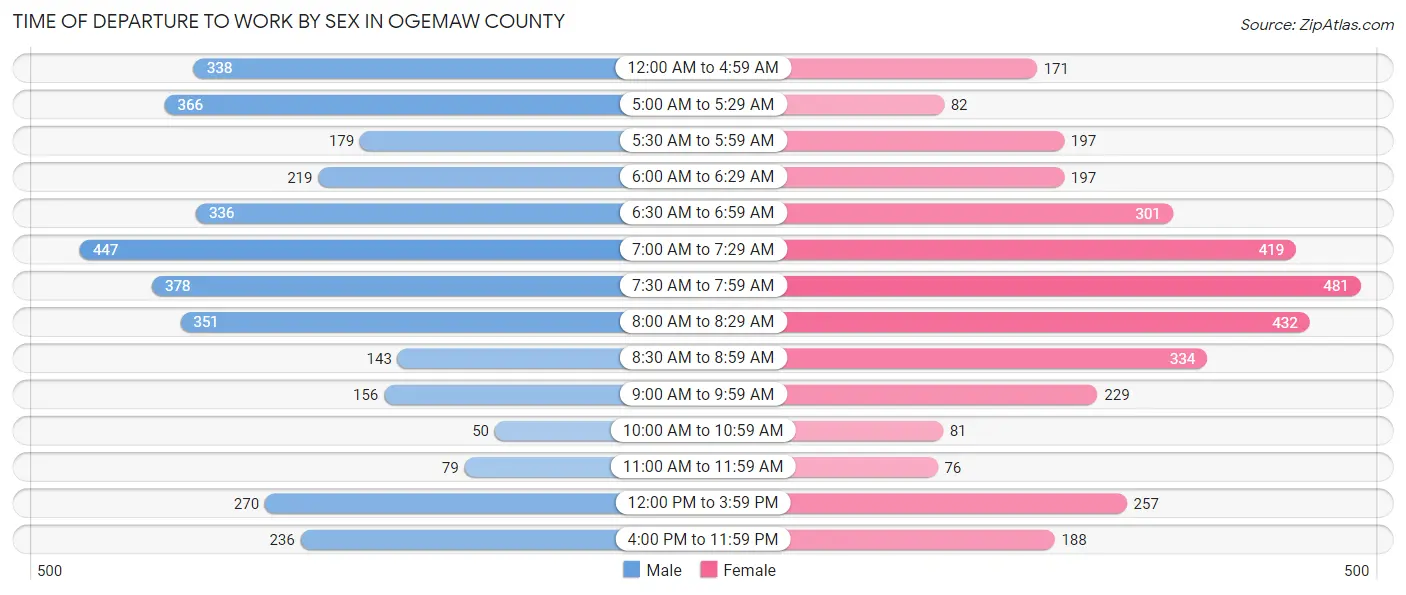
| Time of Departure | Male | Female |
| 12:00 AM to 4:59 AM | 338 (9.5%) | 171 (5.0%) |
| 5:00 AM to 5:29 AM | 366 (10.3%) | 82 (2.4%) |
| 5:30 AM to 5:59 AM | 179 (5.1%) | 197 (5.7%) |
| 6:00 AM to 6:29 AM | 219 (6.2%) | 197 (5.7%) |
| 6:30 AM to 6:59 AM | 336 (9.5%) | 301 (8.7%) |
| 7:00 AM to 7:29 AM | 447 (12.6%) | 419 (12.2%) |
| 7:30 AM to 7:59 AM | 378 (10.6%) | 481 (14.0%) |
| 8:00 AM to 8:29 AM | 351 (9.9%) | 432 (12.5%) |
| 8:30 AM to 8:59 AM | 143 (4.0%) | 334 (9.7%) |
| 9:00 AM to 9:59 AM | 156 (4.4%) | 229 (6.7%) |
| 10:00 AM to 10:59 AM | 50 (1.4%) | 81 (2.4%) |
| 11:00 AM to 11:59 AM | 79 (2.2%) | 76 (2.2%) |
| 12:00 PM to 3:59 PM | 270 (7.6%) | 257 (7.5%) |
| 4:00 PM to 11:59 PM | 236 (6.7%) | 188 (5.5%) |
| Total | 3,548 (100.0%) | 3,445 (100.0%) |
Housing Occupancy in Ogemaw County
Occupancy by Ownership in Ogemaw County
Of the total 9,089 dwellings in Ogemaw County, owner-occupied units account for 7,476 (82.3%), while renter-occupied units make up 1,613 (17.7%).
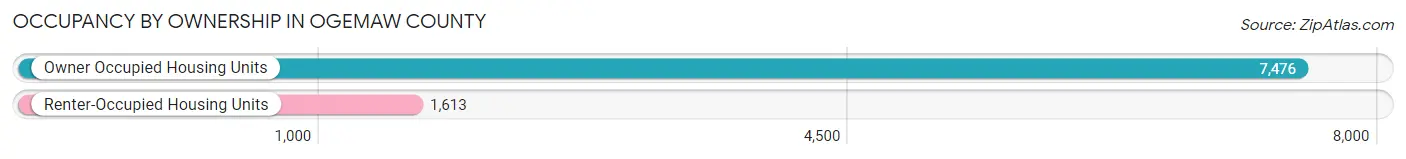
| Occupancy | # Housing Units | % Housing Units |
| Owner Occupied Housing Units | 7,476 | 82.3% |
| Renter-Occupied Housing Units | 1,613 | 17.7% |
| Total Occupied Housing Units | 9,089 | 100.0% |
Occupancy by Household Size in Ogemaw County
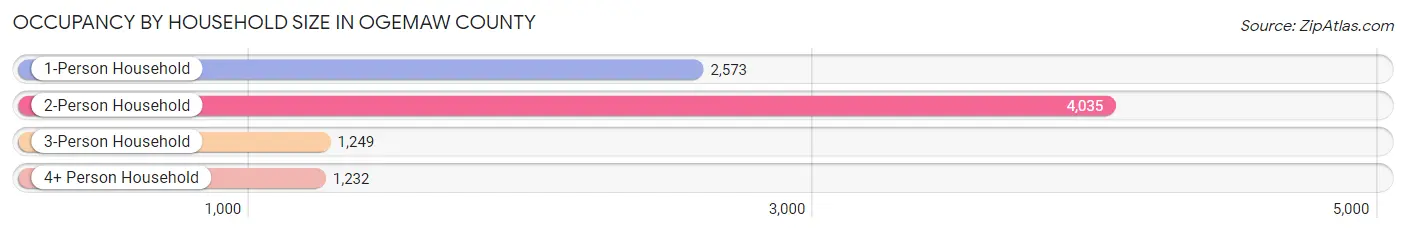
| Household Size | # Housing Units | % Housing Units |
| 1-Person Household | 2,573 | 28.3% |
| 2-Person Household | 4,035 | 44.4% |
| 3-Person Household | 1,249 | 13.7% |
| 4+ Person Household | 1,232 | 13.6% |
| Total Housing Units | 9,089 | 100.0% |
Occupancy by Ownership by Household Size in Ogemaw County
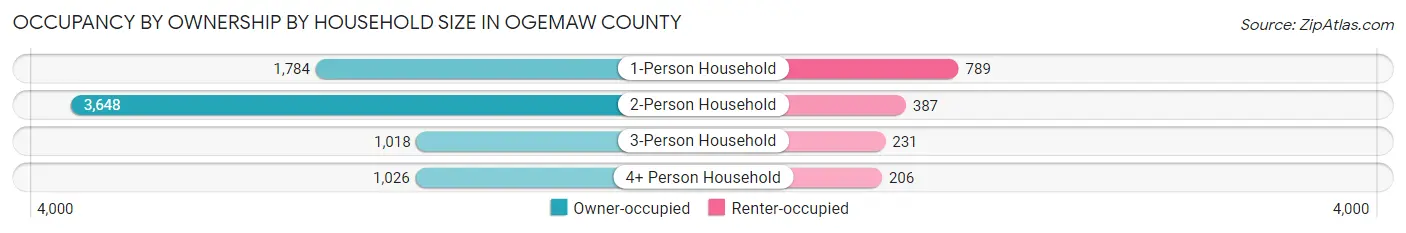
| Household Size | Owner-occupied | Renter-occupied |
| 1-Person Household | 1,784 (69.3%) | 789 (30.7%) |
| 2-Person Household | 3,648 (90.4%) | 387 (9.6%) |
| 3-Person Household | 1,018 (81.5%) | 231 (18.5%) |
| 4+ Person Household | 1,026 (83.3%) | 206 (16.7%) |
| Total Housing Units | 7,476 (82.3%) | 1,613 (17.7%) |
Occupancy by Educational Attainment in Ogemaw County
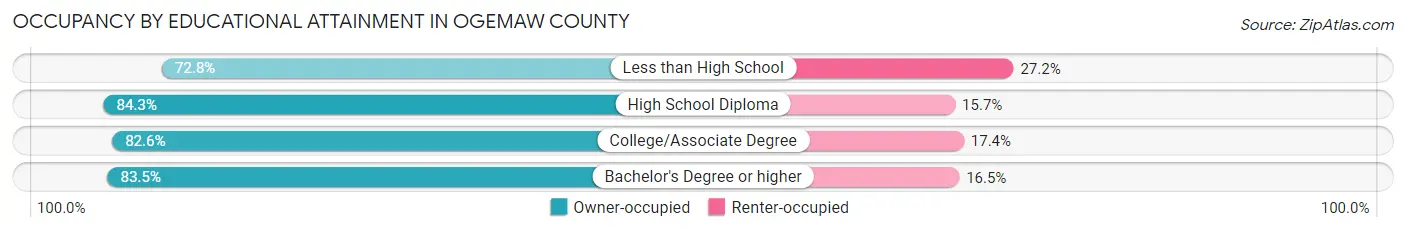
| Household Size | Owner-occupied | Renter-occupied |
| Less than High School | 751 (72.8%) | 281 (27.2%) |
| High School Diploma | 2,693 (84.3%) | 500 (15.7%) |
| College/Associate Degree | 2,824 (82.6%) | 594 (17.4%) |
| Bachelor's Degree or higher | 1,208 (83.5%) | 238 (16.5%) |
Occupancy by Age of Householder in Ogemaw County
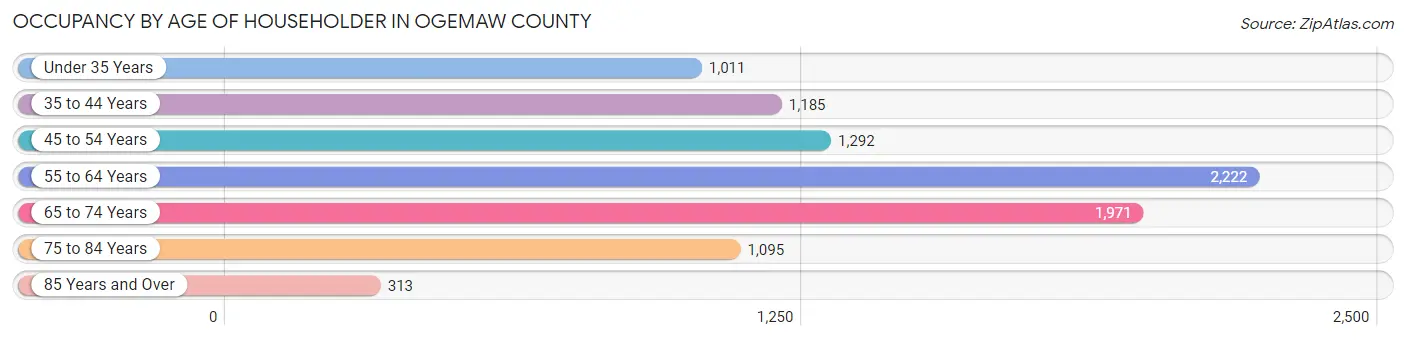
| Age Bracket | # Households | % Households |
| Under 35 Years | 1,011 | 11.1% |
| 35 to 44 Years | 1,185 | 13.0% |
| 45 to 54 Years | 1,292 | 14.2% |
| 55 to 64 Years | 2,222 | 24.4% |
| 65 to 74 Years | 1,971 | 21.7% |
| 75 to 84 Years | 1,095 | 12.0% |
| 85 Years and Over | 313 | 3.4% |
| Total | 9,089 | 100.0% |
Housing Finances in Ogemaw County
Median Income by Occupancy in Ogemaw County
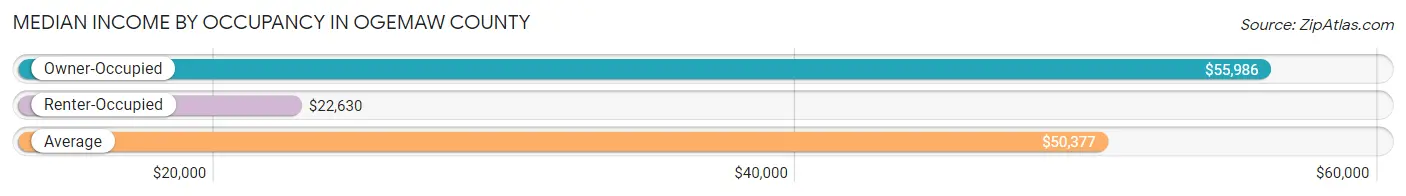
| Occupancy Type | # Households | Median Income |
| Owner-Occupied | 7,476 (82.3%) | $55,986 |
| Renter-Occupied | 1,613 (17.7%) | $22,630 |
| Average | 9,089 (100.0%) | $50,377 |
Occupancy by Householder Income Bracket in Ogemaw County
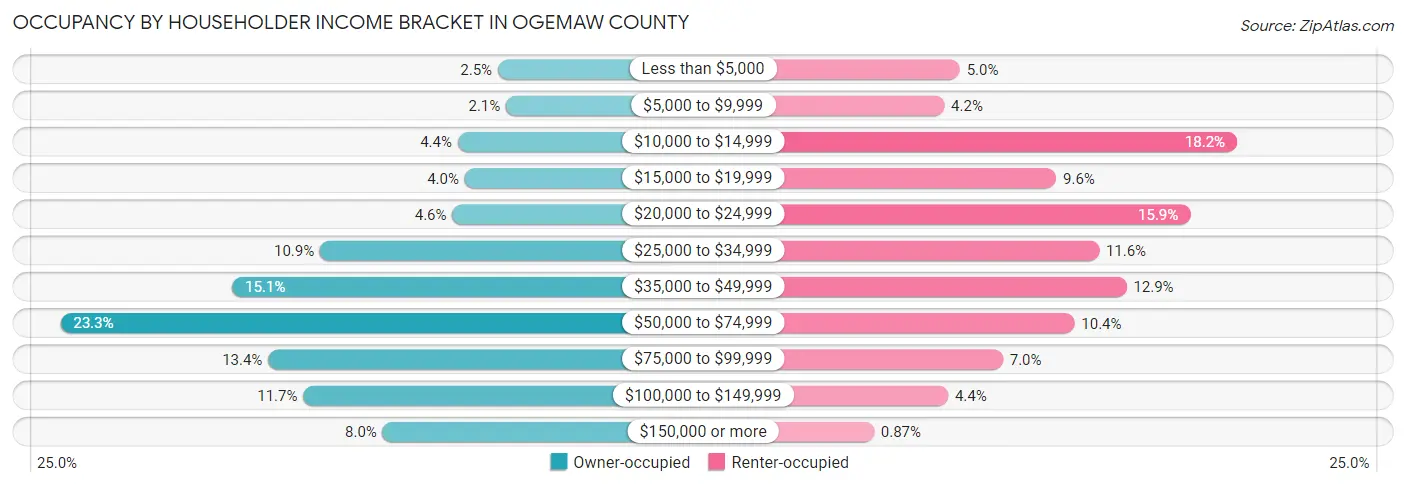
| Income Bracket | Owner-occupied | Renter-occupied |
| Less than $5,000 | 184 (2.5%) | 80 (5.0%) |
| $5,000 to $9,999 | 155 (2.1%) | 68 (4.2%) |
| $10,000 to $14,999 | 327 (4.4%) | 293 (18.2%) |
| $15,000 to $19,999 | 302 (4.0%) | 154 (9.6%) |
| $20,000 to $24,999 | 346 (4.6%) | 257 (15.9%) |
| $25,000 to $34,999 | 817 (10.9%) | 187 (11.6%) |
| $35,000 to $49,999 | 1,130 (15.1%) | 208 (12.9%) |
| $50,000 to $74,999 | 1,742 (23.3%) | 168 (10.4%) |
| $75,000 to $99,999 | 1,002 (13.4%) | 113 (7.0%) |
| $100,000 to $149,999 | 877 (11.7%) | 71 (4.4%) |
| $150,000 or more | 594 (8.0%) | 14 (0.9%) |
| Total | 7,476 (100.0%) | 1,613 (100.0%) |
Monthly Housing Cost Tiers in Ogemaw County
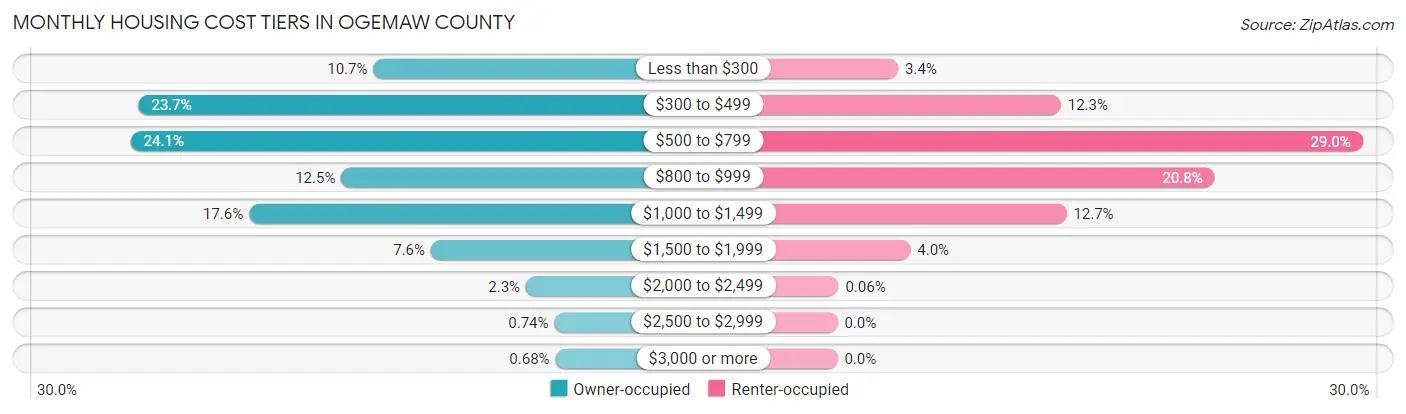
| Monthly Cost | Owner-occupied | Renter-occupied |
| Less than $300 | 803 (10.7%) | 54 (3.4%) |
| $300 to $499 | 1,773 (23.7%) | 199 (12.3%) |
| $500 to $799 | 1,805 (24.1%) | 468 (29.0%) |
| $800 to $999 | 935 (12.5%) | 336 (20.8%) |
| $1,000 to $1,499 | 1,316 (17.6%) | 204 (12.7%) |
| $1,500 to $1,999 | 565 (7.6%) | 65 (4.0%) |
| $2,000 to $2,499 | 173 (2.3%) | 1 (0.1%) |
| $2,500 to $2,999 | 55 (0.7%) | 0 (0.0%) |
| $3,000 or more | 51 (0.7%) | 0 (0.0%) |
| Total | 7,476 (100.0%) | 1,613 (100.0%) |
Physical Housing Characteristics in Ogemaw County
Housing Structures in Ogemaw County
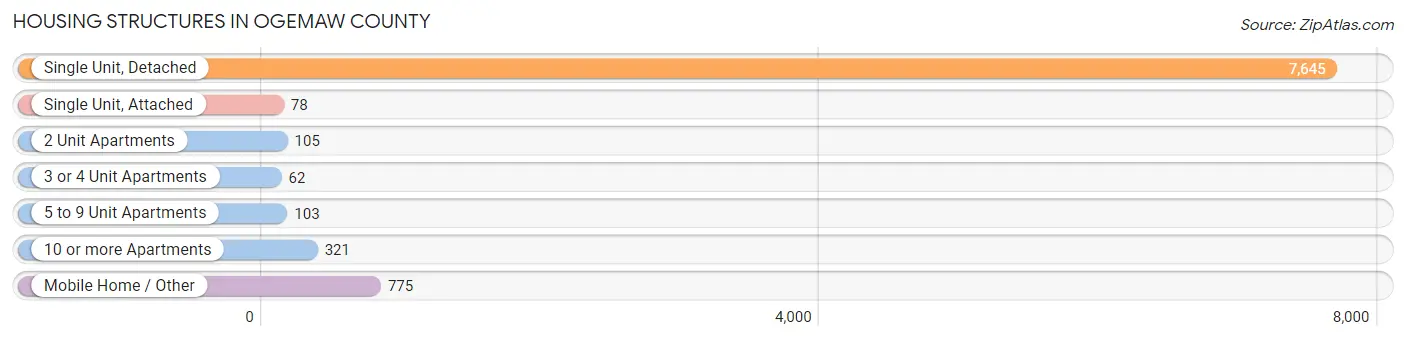
| Structure Type | # Housing Units | % Housing Units |
| Single Unit, Detached | 7,645 | 84.1% |
| Single Unit, Attached | 78 | 0.9% |
| 2 Unit Apartments | 105 | 1.2% |
| 3 or 4 Unit Apartments | 62 | 0.7% |
| 5 to 9 Unit Apartments | 103 | 1.1% |
| 10 or more Apartments | 321 | 3.5% |
| Mobile Home / Other | 775 | 8.5% |
| Total | 9,089 | 100.0% |
Housing Structures by Occupancy in Ogemaw County
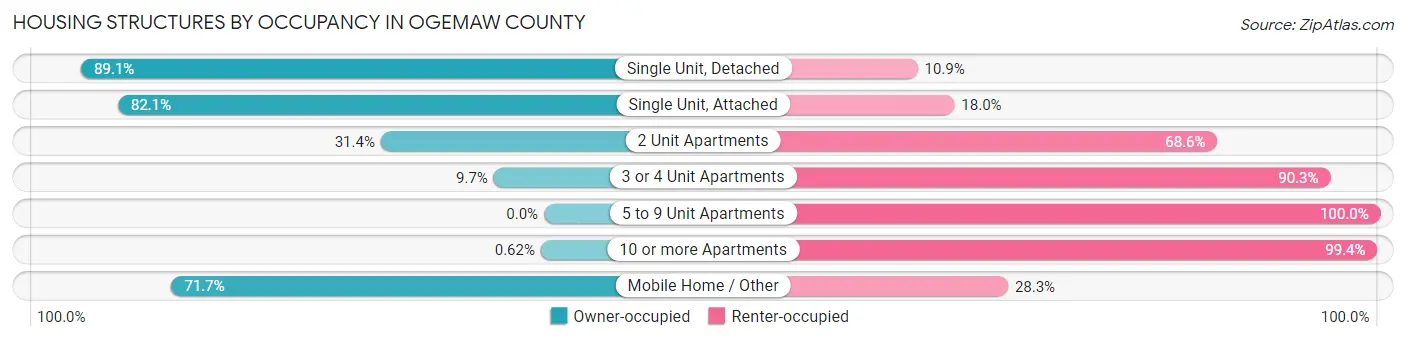
| Structure Type | Owner-occupied | Renter-occupied |
| Single Unit, Detached | 6,815 (89.1%) | 830 (10.9%) |
| Single Unit, Attached | 64 (82.1%) | 14 (17.9%) |
| 2 Unit Apartments | 33 (31.4%) | 72 (68.6%) |
| 3 or 4 Unit Apartments | 6 (9.7%) | 56 (90.3%) |
| 5 to 9 Unit Apartments | 0 (0.0%) | 103 (100.0%) |
| 10 or more Apartments | 2 (0.6%) | 319 (99.4%) |
| Mobile Home / Other | 556 (71.7%) | 219 (28.3%) |
| Total | 7,476 (82.3%) | 1,613 (17.7%) |
Housing Structures by Number of Rooms in Ogemaw County
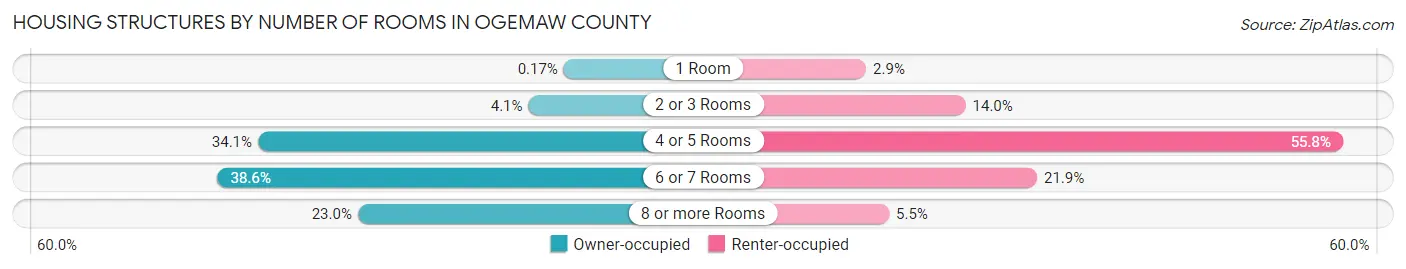
| Number of Rooms | Owner-occupied | Renter-occupied |
| 1 Room | 13 (0.2%) | 47 (2.9%) |
| 2 or 3 Rooms | 306 (4.1%) | 225 (14.0%) |
| 4 or 5 Rooms | 2,550 (34.1%) | 900 (55.8%) |
| 6 or 7 Rooms | 2,885 (38.6%) | 353 (21.9%) |
| 8 or more Rooms | 1,722 (23.0%) | 88 (5.5%) |
| Total | 7,476 (100.0%) | 1,613 (100.0%) |
Housing Structure by Heating Type in Ogemaw County
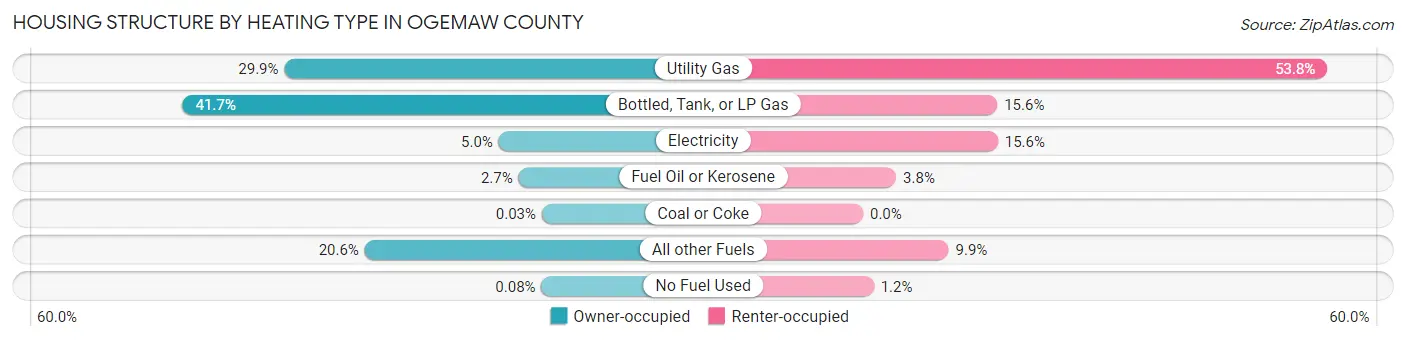
| Heating Type | Owner-occupied | Renter-occupied |
| Utility Gas | 2,234 (29.9%) | 868 (53.8%) |
| Bottled, Tank, or LP Gas | 3,116 (41.7%) | 251 (15.6%) |
| Electricity | 376 (5.0%) | 252 (15.6%) |
| Fuel Oil or Kerosene | 204 (2.7%) | 62 (3.8%) |
| Coal or Coke | 2 (0.0%) | 0 (0.0%) |
| All other Fuels | 1,538 (20.6%) | 160 (9.9%) |
| No Fuel Used | 6 (0.1%) | 20 (1.2%) |
| Total | 7,476 (100.0%) | 1,613 (100.0%) |
Household Vehicle Usage in Ogemaw County
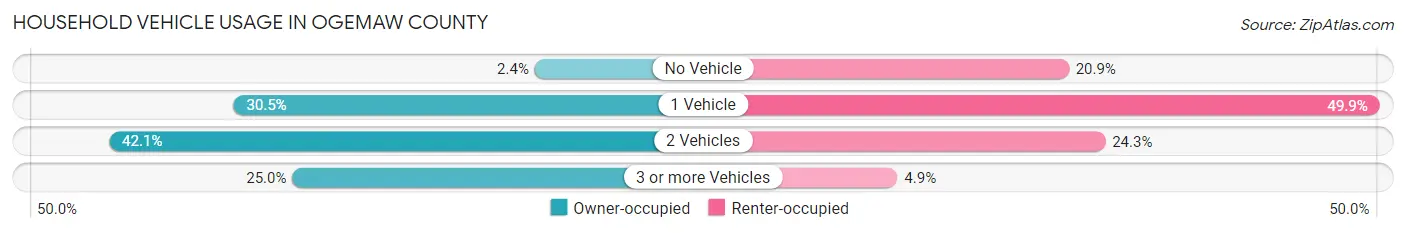
| Vehicles per Household | Owner-occupied | Renter-occupied |
| No Vehicle | 178 (2.4%) | 337 (20.9%) |
| 1 Vehicle | 2,280 (30.5%) | 805 (49.9%) |
| 2 Vehicles | 3,148 (42.1%) | 392 (24.3%) |
| 3 or more Vehicles | 1,870 (25.0%) | 79 (4.9%) |
| Total | 7,476 (100.0%) | 1,613 (100.0%) |
Real Estate & Mortgages in Ogemaw County
Real Estate and Mortgage Overview in Ogemaw County
| Characteristic | Without Mortgage | With Mortgage |
| Housing Units | 3,884 | 3,592 |
| Median Property Value | $120,400 | $131,000 |
| Median Household Income | $45,957 | $323 |
| Monthly Housing Costs | $436 | $46 |
| Real Estate Taxes | $1,330 | $86 |
Property Value by Mortgage Status in Ogemaw County
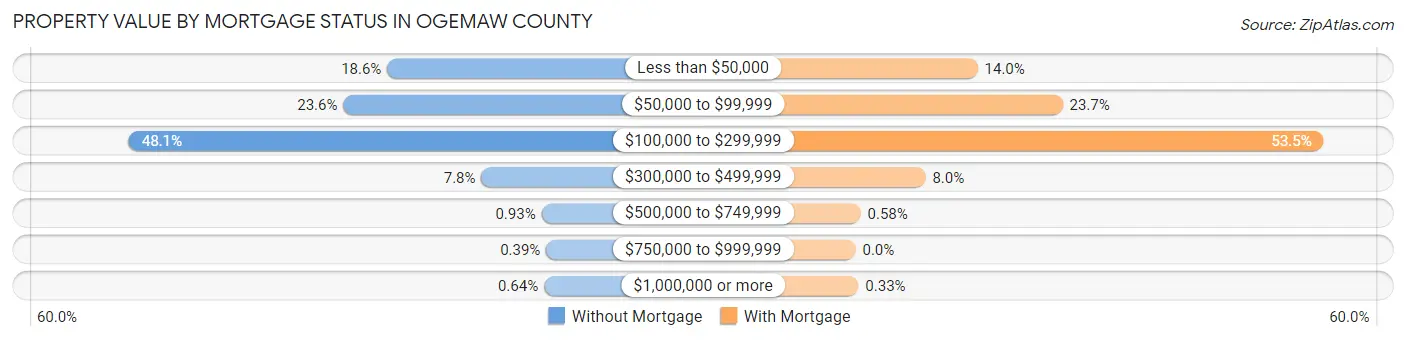
| Property Value | Without Mortgage | With Mortgage |
| Less than $50,000 | 721 (18.6%) | 501 (14.0%) |
| $50,000 to $99,999 | 916 (23.6%) | 850 (23.7%) |
| $100,000 to $299,999 | 1,868 (48.1%) | 1,921 (53.5%) |
| $300,000 to $499,999 | 303 (7.8%) | 287 (8.0%) |
| $500,000 to $749,999 | 36 (0.9%) | 21 (0.6%) |
| $750,000 to $999,999 | 15 (0.4%) | 0 (0.0%) |
| $1,000,000 or more | 25 (0.6%) | 12 (0.3%) |
| Total | 3,884 (100.0%) | 3,592 (100.0%) |
Household Income by Mortgage Status in Ogemaw County
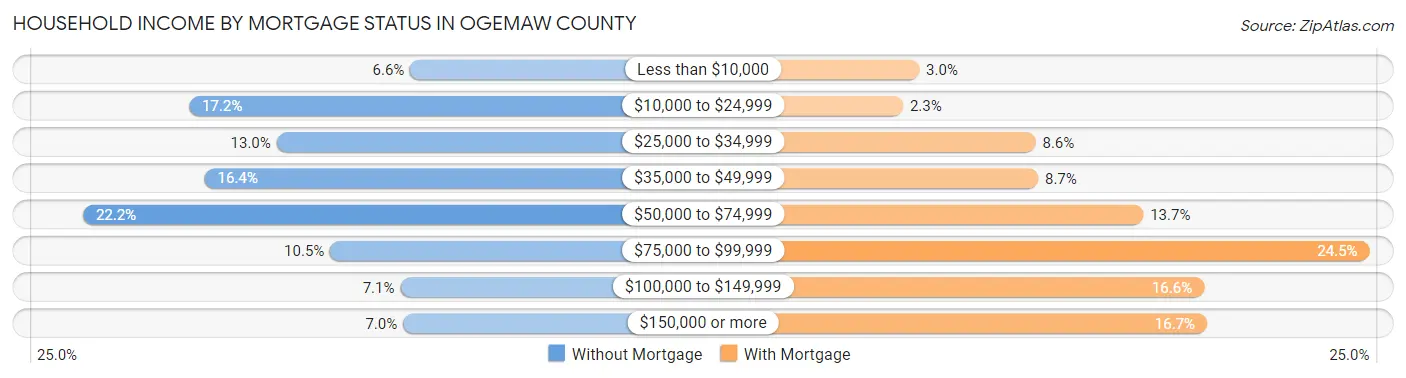
| Household Income | Without Mortgage | With Mortgage |
| Less than $10,000 | 258 (6.6%) | 109 (3.0%) |
| $10,000 to $24,999 | 667 (17.2%) | 81 (2.3%) |
| $25,000 to $34,999 | 505 (13.0%) | 308 (8.6%) |
| $35,000 to $49,999 | 638 (16.4%) | 312 (8.7%) |
| $50,000 to $74,999 | 863 (22.2%) | 492 (13.7%) |
| $75,000 to $99,999 | 406 (10.4%) | 879 (24.5%) |
| $100,000 to $149,999 | 276 (7.1%) | 596 (16.6%) |
| $150,000 or more | 271 (7.0%) | 601 (16.7%) |
| Total | 3,884 (100.0%) | 3,592 (100.0%) |
Property Value to Household Income Ratio in Ogemaw County
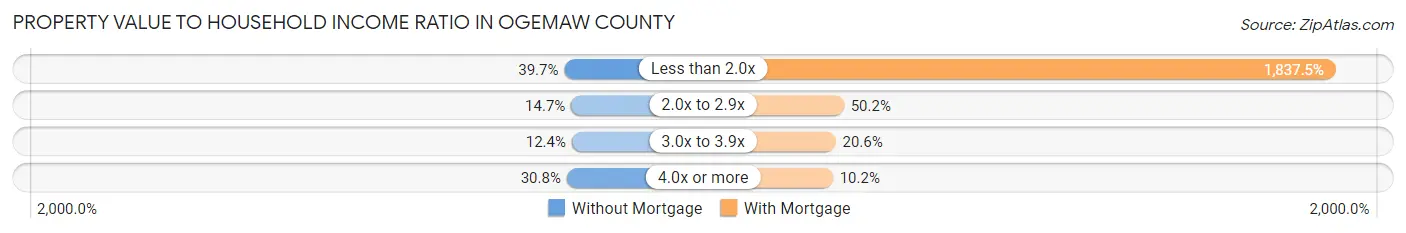
| Value-to-Income Ratio | Without Mortgage | With Mortgage |
| Less than 2.0x | 1,540 (39.7%) | 66,003 (1,837.5%) |
| 2.0x to 2.9x | 571 (14.7%) | 1,804 (50.2%) |
| 3.0x to 3.9x | 483 (12.4%) | 739 (20.6%) |
| 4.0x or more | 1,198 (30.8%) | 367 (10.2%) |
| Total | 3,884 (100.0%) | 3,592 (100.0%) |
Real Estate Taxes by Mortgage Status in Ogemaw County
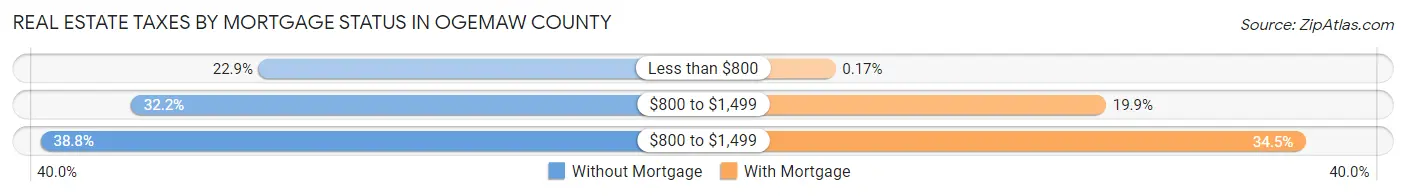
| Property Taxes | Without Mortgage | With Mortgage |
| Less than $800 | 889 (22.9%) | 6 (0.2%) |
| $800 to $1,499 | 1,252 (32.2%) | 716 (19.9%) |
| $800 to $1,499 | 1,508 (38.8%) | 1,239 (34.5%) |
| Total | 3,884 (100.0%) | 3,592 (100.0%) |
Health & Disability in Ogemaw County
Health Insurance Coverage by Age in Ogemaw County
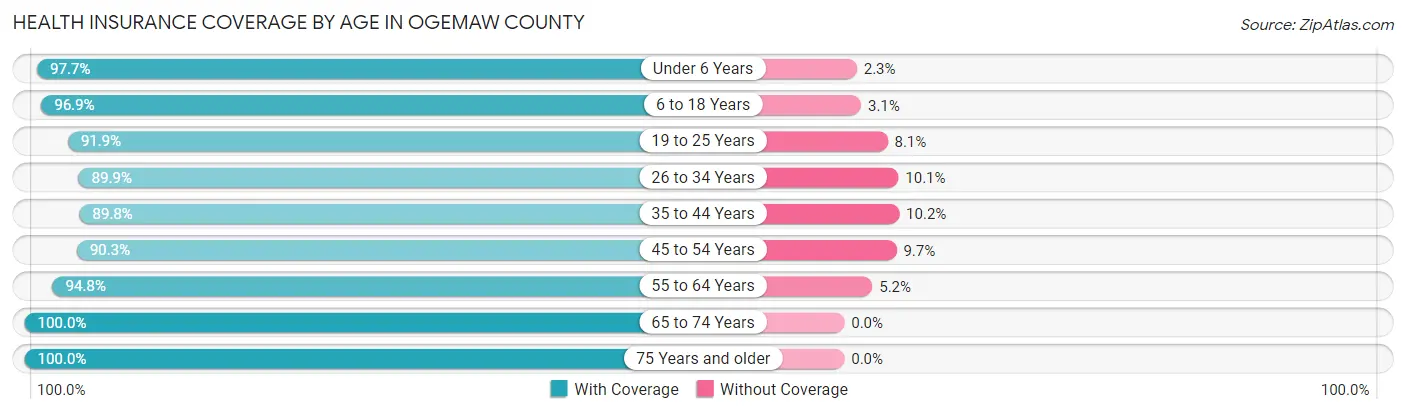
| Age Bracket | With Coverage | Without Coverage |
| Under 6 Years | 1,046 (97.7%) | 25 (2.3%) |
| 6 to 18 Years | 2,791 (96.9%) | 90 (3.1%) |
| 19 to 25 Years | 1,198 (91.9%) | 105 (8.1%) |
| 26 to 34 Years | 1,606 (89.9%) | 180 (10.1%) |
| 35 to 44 Years | 1,860 (89.8%) | 212 (10.2%) |
| 45 to 54 Years | 2,105 (90.3%) | 227 (9.7%) |
| 55 to 64 Years | 3,538 (94.8%) | 195 (5.2%) |
| 65 to 74 Years | 3,239 (100.0%) | 0 (0.0%) |
| 75 Years and older | 2,121 (100.0%) | 0 (0.0%) |
| Total | 19,504 (95.0%) | 1,034 (5.0%) |
Health Insurance Coverage by Citizenship Status in Ogemaw County
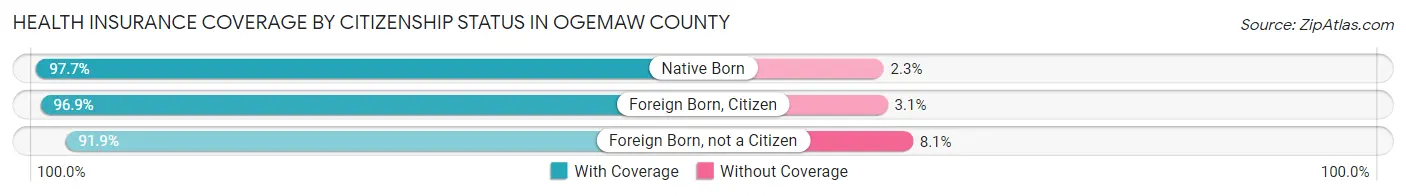
| Citizenship Status | With Coverage | Without Coverage |
| Native Born | 1,046 (97.7%) | 25 (2.3%) |
| Foreign Born, Citizen | 2,791 (96.9%) | 90 (3.1%) |
| Foreign Born, not a Citizen | 1,198 (91.9%) | 105 (8.1%) |
Health Insurance Coverage by Household Income in Ogemaw County
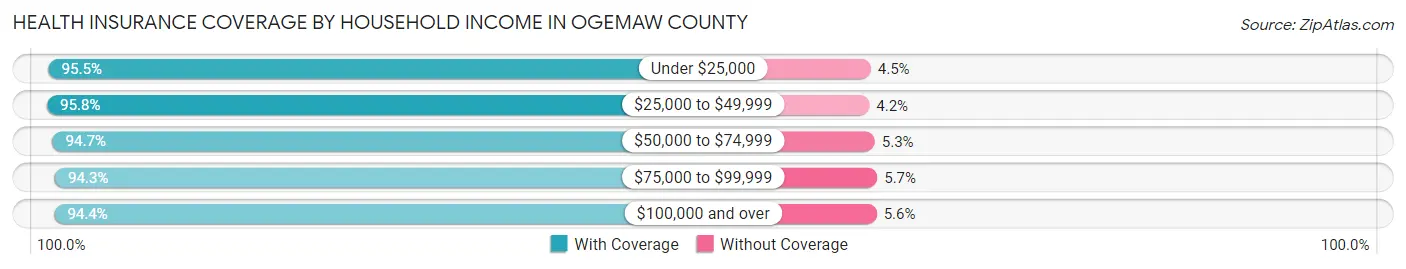
| Household Income | With Coverage | Without Coverage |
| Under $25,000 | 3,386 (95.5%) | 160 (4.5%) |
| $25,000 to $49,999 | 4,630 (95.8%) | 204 (4.2%) |
| $50,000 to $74,999 | 4,339 (94.7%) | 241 (5.3%) |
| $75,000 to $99,999 | 2,807 (94.3%) | 170 (5.7%) |
| $100,000 and over | 4,317 (94.4%) | 256 (5.6%) |
Public vs Private Health Insurance Coverage by Age in Ogemaw County
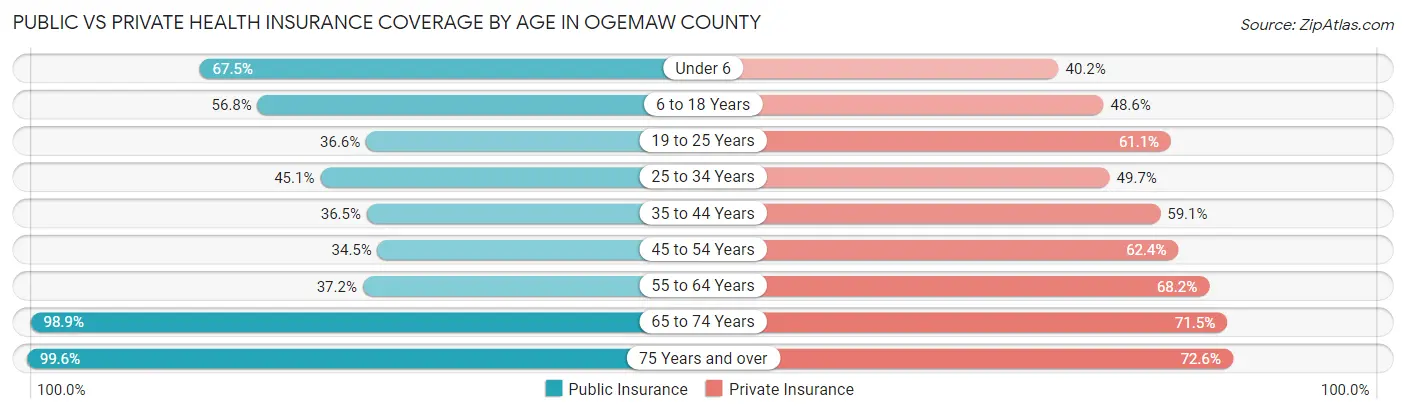
| Age Bracket | Public Insurance | Private Insurance |
| Under 6 | 723 (67.5%) | 431 (40.2%) |
| 6 to 18 Years | 1,635 (56.8%) | 1,400 (48.6%) |
| 19 to 25 Years | 477 (36.6%) | 796 (61.1%) |
| 25 to 34 Years | 806 (45.1%) | 888 (49.7%) |
| 35 to 44 Years | 756 (36.5%) | 1,225 (59.1%) |
| 45 to 54 Years | 804 (34.5%) | 1,456 (62.4%) |
| 55 to 64 Years | 1,390 (37.2%) | 2,544 (68.1%) |
| 65 to 74 Years | 3,203 (98.9%) | 2,316 (71.5%) |
| 75 Years and over | 2,112 (99.6%) | 1,539 (72.6%) |
| Total | 11,906 (58.0%) | 12,595 (61.3%) |
Disability Status by Sex by Age in Ogemaw County
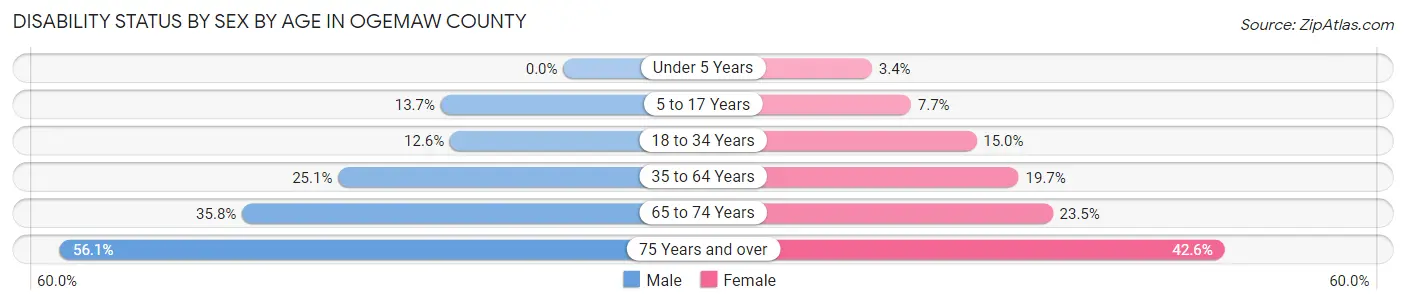
| Age Bracket | Male | Female |
| Under 5 Years | 0 (0.0%) | 16 (3.4%) |
| 5 to 17 Years | 204 (13.7%) | 104 (7.7%) |
| 18 to 34 Years | 206 (12.6%) | 245 (15.0%) |
| 35 to 64 Years | 1,038 (25.1%) | 787 (19.7%) |
| 65 to 74 Years | 578 (35.8%) | 381 (23.5%) |
| 75 Years and over | 584 (56.0%) | 460 (42.6%) |
Disability Class by Sex by Age in Ogemaw County
Disability Class: Hearing Difficulty
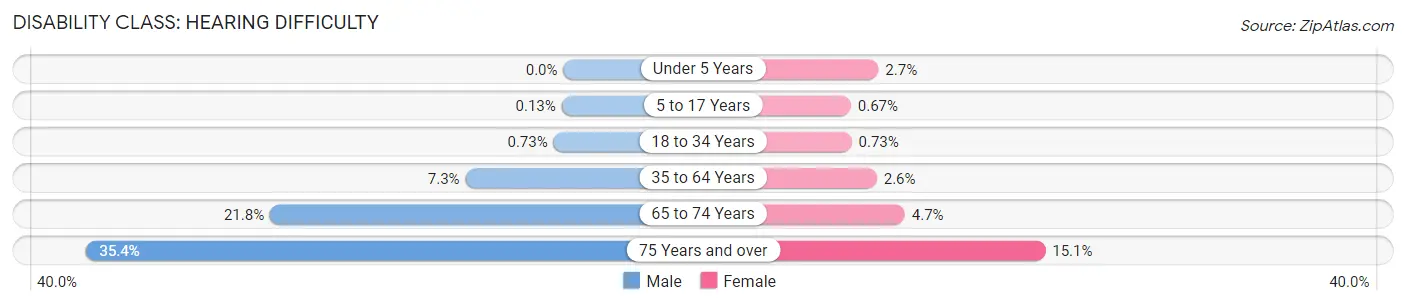
| Age Bracket | Male | Female |
| Under 5 Years | 0 (0.0%) | 13 (2.7%) |
| 5 to 17 Years | 2 (0.1%) | 9 (0.7%) |
| 18 to 34 Years | 12 (0.7%) | 12 (0.7%) |
| 35 to 64 Years | 301 (7.3%) | 104 (2.6%) |
| 65 to 74 Years | 352 (21.8%) | 76 (4.7%) |
| 75 Years and over | 369 (35.4%) | 163 (15.1%) |
Disability Class: Vision Difficulty

| Age Bracket | Male | Female |
| Under 5 Years | 0 (0.0%) | 3 (0.6%) |
| 5 to 17 Years | 12 (0.8%) | 23 (1.7%) |
| 18 to 34 Years | 27 (1.7%) | 104 (6.4%) |
| 35 to 64 Years | 134 (3.2%) | 142 (3.5%) |
| 65 to 74 Years | 102 (6.3%) | 40 (2.5%) |
| 75 Years and over | 124 (11.9%) | 71 (6.6%) |
Disability Class: Cognitive Difficulty
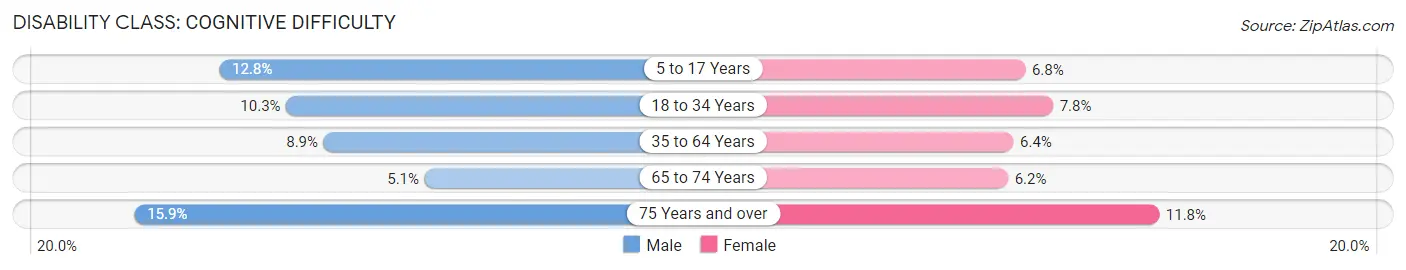
| Age Bracket | Male | Female |
| 5 to 17 Years | 191 (12.8%) | 92 (6.8%) |
| 18 to 34 Years | 168 (10.3%) | 128 (7.8%) |
| 35 to 64 Years | 368 (8.9%) | 254 (6.4%) |
| 65 to 74 Years | 83 (5.1%) | 100 (6.2%) |
| 75 Years and over | 166 (15.9%) | 127 (11.8%) |
Disability Class: Ambulatory Difficulty
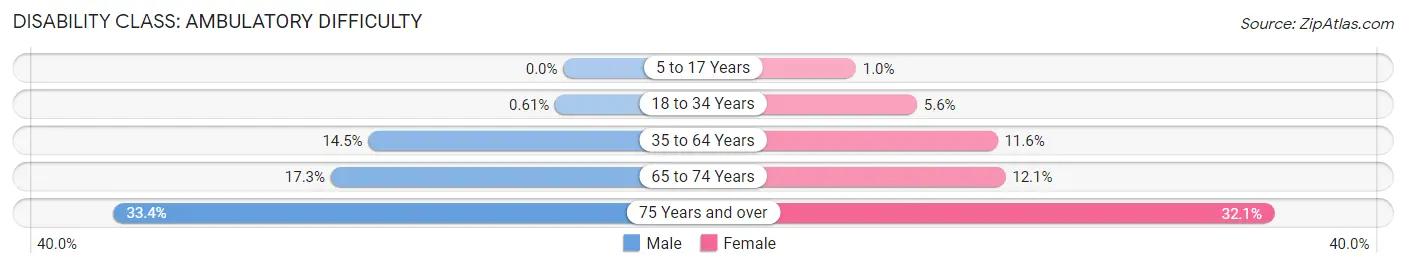
| Age Bracket | Male | Female |
| 5 to 17 Years | 0 (0.0%) | 14 (1.0%) |
| 18 to 34 Years | 10 (0.6%) | 91 (5.6%) |
| 35 to 64 Years | 599 (14.5%) | 462 (11.6%) |
| 65 to 74 Years | 279 (17.3%) | 197 (12.1%) |
| 75 Years and over | 348 (33.4%) | 346 (32.1%) |
Disability Class: Self-Care Difficulty
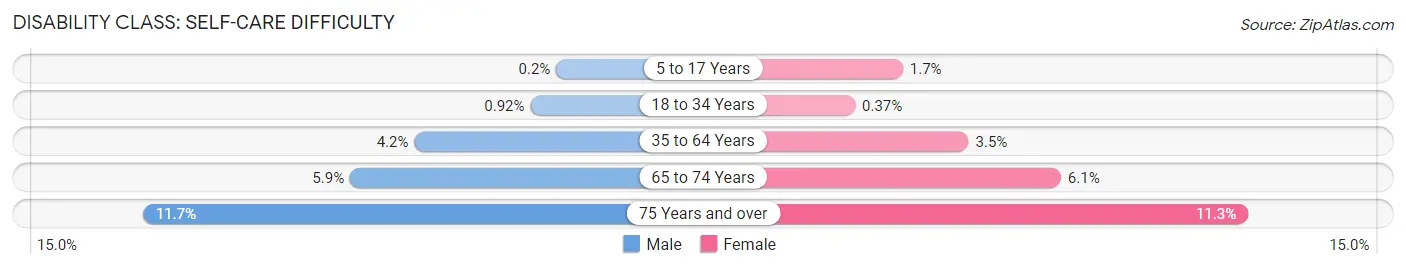
| Age Bracket | Male | Female |
| 5 to 17 Years | 3 (0.2%) | 23 (1.7%) |
| 18 to 34 Years | 15 (0.9%) | 6 (0.4%) |
| 35 to 64 Years | 172 (4.2%) | 141 (3.5%) |
| 65 to 74 Years | 96 (5.9%) | 99 (6.1%) |
| 75 Years and over | 122 (11.7%) | 122 (11.3%) |
Technology Access in Ogemaw County
Computing Device Access in Ogemaw County
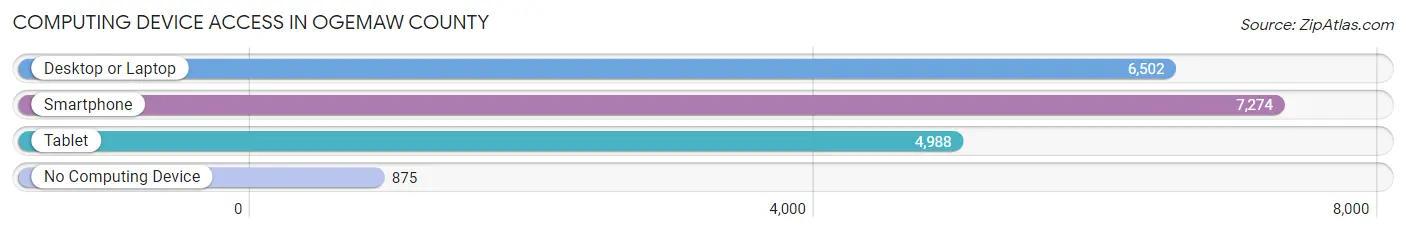
| Device Type | # Households | % Households |
| Desktop or Laptop | 6,502 | 71.5% |
| Smartphone | 7,274 | 80.0% |
| Tablet | 4,988 | 54.9% |
| No Computing Device | 875 | 9.6% |
| Total | 9,089 | 100.0% |
Internet Access in Ogemaw County
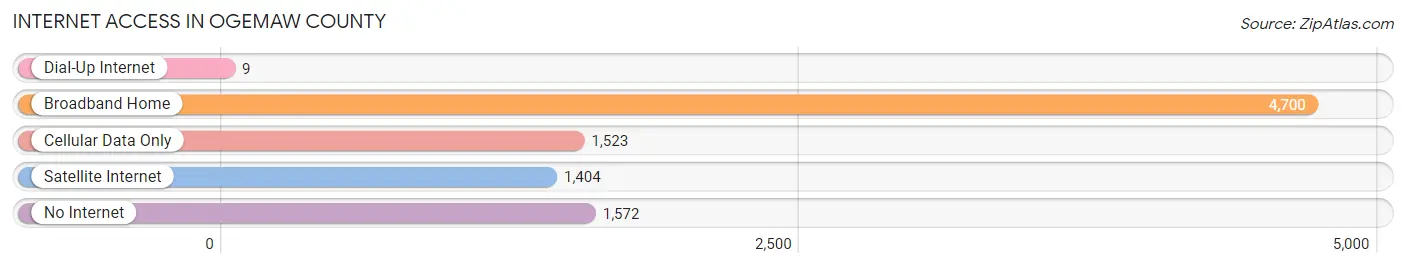
| Internet Type | # Households | % Households |
| Dial-Up Internet | 9 | 0.1% |
| Broadband Home | 4,700 | 51.7% |
| Cellular Data Only | 1,523 | 16.8% |
| Satellite Internet | 1,404 | 15.4% |
| No Internet | 1,572 | 17.3% |
| Total | 9,089 | 100.0% |
Ogemaw County Summary
Ogemaw County is located in the northeastern part of Michigan’s Lower Peninsula. It is bordered by Iosco County to the north, Arenac County to the east, Midland County to the south, and Roscommon County to the west. The county seat is West Branch, and the largest city is West Branch. The county has a total area of 590 square miles, of which 586 square miles is land and 4.2 square miles is water.
History
Ogemaw County was established in 1840 and was named after the Ojibwe word for “big water”. The county was originally part of Midland County, but was split off in 1840. The first settlers in the area were lumberjacks and farmers, and the county was largely rural until the late 19th century. In 1881, the Michigan Central Railroad was built through the county, connecting it to the rest of the state. This led to the development of several small towns, including West Branch, which became the county seat.
Geography
Ogemaw County is located in the northeastern part of Michigan’s Lower Peninsula. It is bordered by Iosco County to the north, Arenac County to the east, Midland County to the south, and Roscommon County to the west. The county has a total area of 590 square miles, of which 586 square miles is land and 4.2 square miles is water. The terrain is mostly rolling hills and forests, with some marshland and lakes. The Au Sable River runs through the county, and there are several smaller rivers and streams. The county is home to several state parks, including Hartwick Pines State Park and Rifle River State Recreation Area.
Economy
The economy of Ogemaw County is largely based on agriculture and tourism. The county is home to several farms, which produce a variety of crops, including corn, soybeans, wheat, and hay. The county is also home to several wineries and breweries, which attract tourists from around the state. In addition, the county is home to several manufacturing companies, including automotive parts suppliers and furniture makers.
Demographics
As of the 2010 census, the population of Ogemaw County was 21,699. The population is largely white (94.3%), with small percentages of African American (2.2%), Native American (1.2%), Asian (0.5%), and other races (1.8%). The median household income is $41,945, and the median age is 44.7 years. The county has a higher-than-average poverty rate (17.2%), and the unemployment rate is 8.2%.
Conclusion
Ogemaw County is a rural county located in the northeastern part of Michigan’s Lower Peninsula. It has a long history of agriculture and tourism, and its economy is largely based on these industries. The population is largely white, with a median household income of $41,945 and a median age of 44.7 years. The county has a higher-than-average poverty rate and an unemployment rate of 8.2%.
Common Questions
What is Per Capita Income in Ogemaw County?
Per Capita income in Ogemaw County is $28,837.
What is the Median Family Income in Ogemaw County?
Median Family Income in Ogemaw County is $61,625.
What is the Median Household income in Ogemaw County?
Median Household Income in Ogemaw County is $50,377.
What is Income or Wage Gap in Ogemaw County?
Income or Wage Gap in Ogemaw County is 25.5%.
Women in Ogemaw County earn 74.5 cents for every dollar earned by a man.
What is Family Income Deficit in Ogemaw County?
Family Income Deficit in Ogemaw County is $10,791.
Families that are below poverty line in Ogemaw County earn $10,791 less on average than the poverty threshold level.
What is Inequality or Gini Index in Ogemaw County?
Inequality or Gini Index in Ogemaw County is 0.44.
What is the Total Population of Ogemaw County?
Total Population of Ogemaw County is 20,820.
What is the Total Male Population of Ogemaw County?
Total Male Population of Ogemaw County is 10,528.
What is the Total Female Population of Ogemaw County?
Total Female Population of Ogemaw County is 10,292.
What is the Ratio of Males per 100 Females in Ogemaw County?
There are 102.29 Males per 100 Females in Ogemaw County.
What is the Ratio of Females per 100 Males in Ogemaw County?
There are 97.76 Females per 100 Males in Ogemaw County.
What is the Median Population Age in Ogemaw County?
Median Population Age in Ogemaw County is 50.6 Years.
What is the Average Family Size in Ogemaw County
Average Family Size in Ogemaw County is 2.7 People.
What is the Average Household Size in Ogemaw County
Average Household Size in Ogemaw County is 2.3 People.
How Large is the Labor Force in Ogemaw County?
There are 8,303 People in the Labor Forcein in Ogemaw County.
What is the Percentage of People in the Labor Force in Ogemaw County?
47.1% of People are in the Labor Force in Ogemaw County.
What is the Unemployment Rate in Ogemaw County?
Unemployment Rate in Ogemaw County is 7.1%.