Newaygo County, MI Map & Demographics
Newaygo County Map
Newaygo County Overview
$29,687
PER CAPITA INCOME
$70,051
AVG FAMILY INCOME
$59,065
AVG HOUSEHOLD INCOME
37.2%
WAGE / INCOME GAP [ % ]
62.8¢/ $1
WAGE / INCOME GAP [ $ ]
$9,261
FAMILY INCOME DEFICIT
0.43
INEQUALITY / GINI INDEX
50,130
TOTAL POPULATION
25,483
MALE POPULATION
24,647
FEMALE POPULATION
103.39
MALES / 100 FEMALES
96.72
FEMALES / 100 MALES
42.4
MEDIAN AGE
3.1
AVG FAMILY SIZE
2.6
AVG HOUSEHOLD SIZE
22,635
LABOR FORCE [ PEOPLE ]
56.0%
PERCENT IN LABOR FORCE
4.7%
UNEMPLOYMENT RATE
Newaygo County Area Codes
Income in Newaygo County
Income Overview in Newaygo County
Per Capita Income in Newaygo County is $29,687, while median incomes of families and households are $70,051 and $59,065 respectively.
| Characteristic | Number | Measure |
| Per Capita Income | 50,130 | $29,687 |
| Median Family Income | 13,333 | $70,051 |
| Mean Family Income | 13,333 | $84,913 |
| Median Household Income | 19,047 | $59,065 |
| Mean Household Income | 19,047 | $74,773 |
| Income Deficit | 13,333 | $9,261 |
| Wage / Income Gap (%) | 50,130 | 37.15% |
| Wage / Income Gap ($) | 50,130 | 62.85¢ per $1 |
| Gini / Inequality Index | 50,130 | 0.43 |
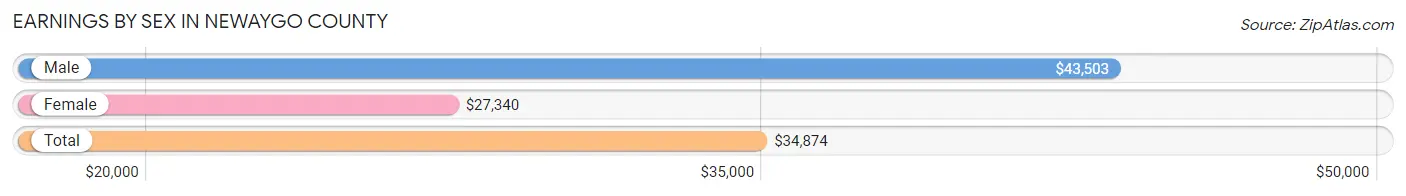
Earnings by Sex in Newaygo County
Average Earnings in Newaygo County are $34,874, $43,503 for men and $27,340 for women, a difference of 37.1%.
| Sex | Number | Average Earnings |
| Male | 12,710 (53.1%) | $43,503 |
| Female | 11,230 (46.9%) | $27,340 |
| Total | 23,940 (100.0%) | $34,874 |
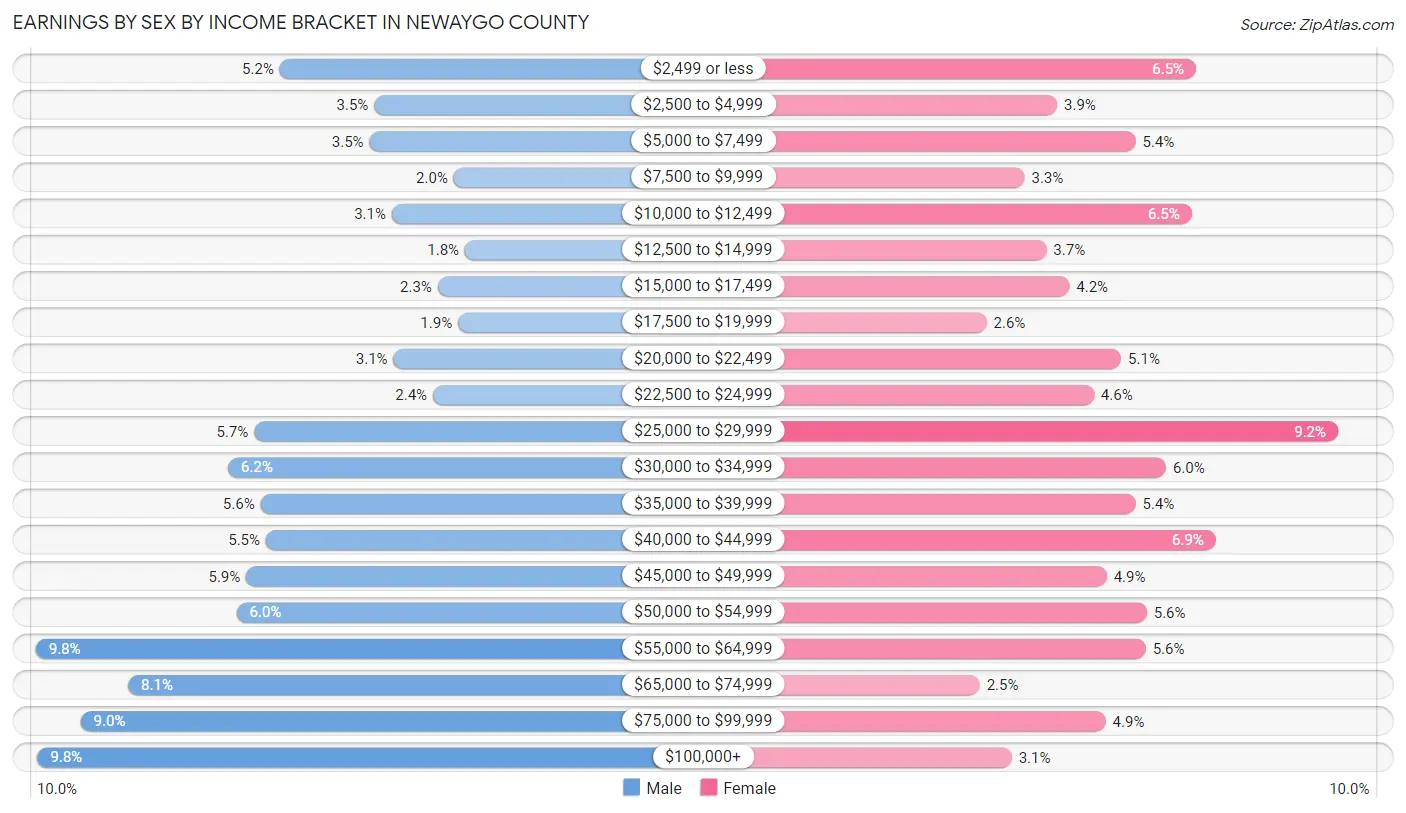
Earnings by Sex by Income Bracket in Newaygo County
The most common earnings brackets in Newaygo County are $55,000 to $64,999 for men (1,244 | 9.8%) and $25,000 to $29,999 for women (1,033 | 9.2%).
| Income | Male | Female |
| $2,499 or less | 663 (5.2%) | 735 (6.5%) |
| $2,500 to $4,999 | 438 (3.5%) | 442 (3.9%) |
| $5,000 to $7,499 | 450 (3.5%) | 607 (5.4%) |
| $7,500 to $9,999 | 249 (2.0%) | 374 (3.3%) |
| $10,000 to $12,499 | 396 (3.1%) | 725 (6.5%) |
| $12,500 to $14,999 | 222 (1.8%) | 420 (3.7%) |
| $15,000 to $17,499 | 287 (2.3%) | 468 (4.2%) |
| $17,500 to $19,999 | 239 (1.9%) | 294 (2.6%) |
| $20,000 to $22,499 | 393 (3.1%) | 577 (5.1%) |
| $22,500 to $24,999 | 299 (2.4%) | 520 (4.6%) |
| $25,000 to $29,999 | 724 (5.7%) | 1,033 (9.2%) |
| $30,000 to $34,999 | 787 (6.2%) | 672 (6.0%) |
| $35,000 to $39,999 | 709 (5.6%) | 608 (5.4%) |
| $40,000 to $44,999 | 696 (5.5%) | 776 (6.9%) |
| $45,000 to $49,999 | 744 (5.9%) | 547 (4.9%) |
| $50,000 to $54,999 | 767 (6.0%) | 631 (5.6%) |
| $55,000 to $64,999 | 1,244 (9.8%) | 629 (5.6%) |
| $65,000 to $74,999 | 1,025 (8.1%) | 280 (2.5%) |
| $75,000 to $99,999 | 1,137 (8.9%) | 545 (4.9%) |
| $100,000+ | 1,241 (9.8%) | 347 (3.1%) |
| Total | 12,710 (100.0%) | 11,230 (100.0%) |
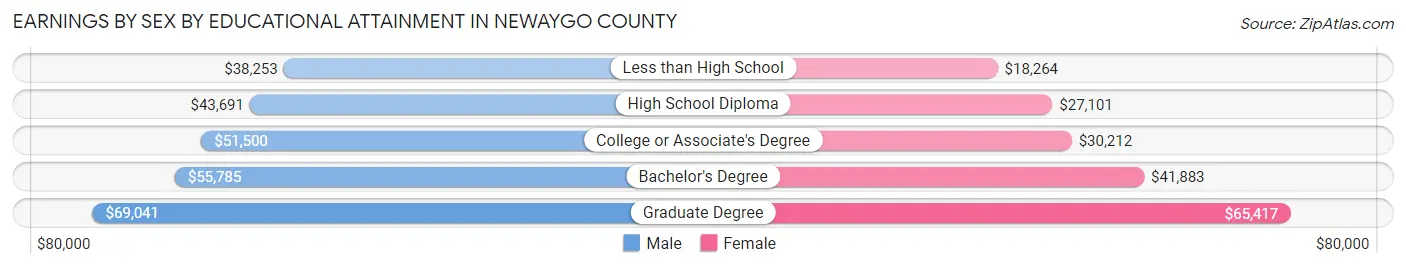
Earnings by Sex by Educational Attainment in Newaygo County
Average earnings in Newaygo County are $48,518 for men and $31,045 for women, a difference of 36.0%. Men with an educational attainment of graduate degree enjoy the highest average annual earnings of $69,041, while those with less than high school education earn the least with $38,253. Women with an educational attainment of graduate degree earn the most with the average annual earnings of $65,417, while those with less than high school education have the smallest earnings of $18,264.
| Educational Attainment | Male Income | Female Income |
| Less than High School | $38,253 | $18,264 |
| High School Diploma | $43,691 | $27,101 |
| College or Associate's Degree | $51,500 | $30,212 |
| Bachelor's Degree | $55,785 | $41,883 |
| Graduate Degree | $69,041 | $65,417 |
| Total | $48,518 | $31,045 |
Family Income in Newaygo County
Family Income Brackets in Newaygo County
According to the Newaygo County family income data, there are 2,840 families falling into the $50,000 to $74,999 income range, which is the most common income bracket and makes up 21.3% of all families. Conversely, the less than $10,000 income bracket is the least frequent group with only 293 families (2.2%) belonging to this category.
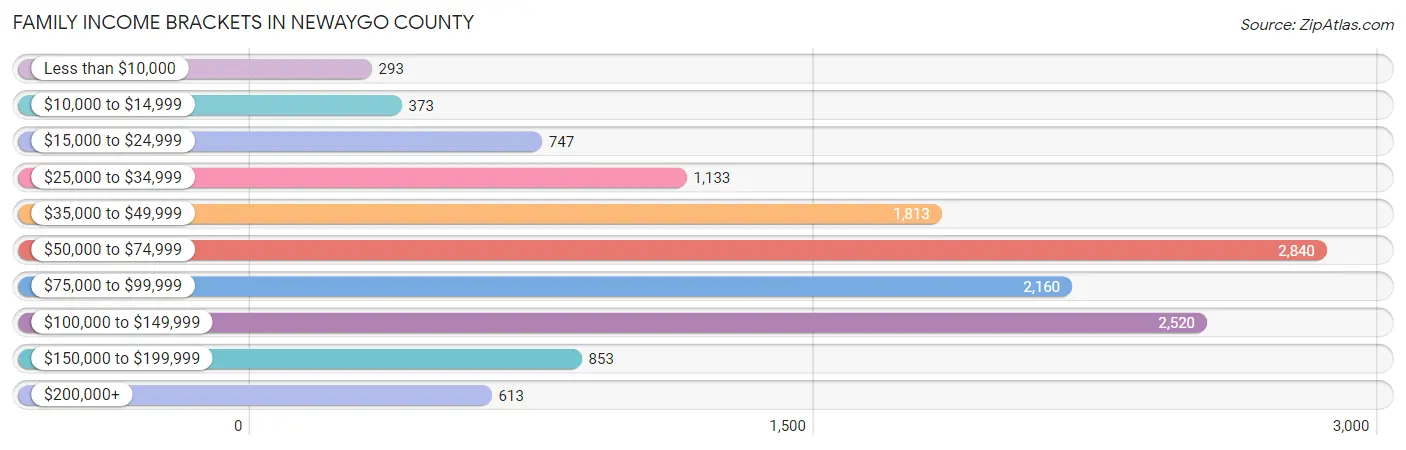
| Income Bracket | # Families | % Families |
| Less than $10,000 | 293 | 2.2% |
| $10,000 to $14,999 | 373 | 2.8% |
| $15,000 to $24,999 | 747 | 5.6% |
| $25,000 to $34,999 | 1,133 | 8.5% |
| $35,000 to $49,999 | 1,813 | 13.6% |
| $50,000 to $74,999 | 2,840 | 21.3% |
| $75,000 to $99,999 | 2,160 | 16.2% |
| $100,000 to $149,999 | 2,520 | 18.9% |
| $150,000 to $199,999 | 853 | 6.4% |
| $200,000+ | 613 | 4.6% |
Family Income by Famaliy Size in Newaygo County
6-person families (459 | 3.4%) account for the highest median family income in Newaygo County with $94,195 per family, while 2-person families (7,222 | 54.2%) have the highest median income of $32,483 per family member.
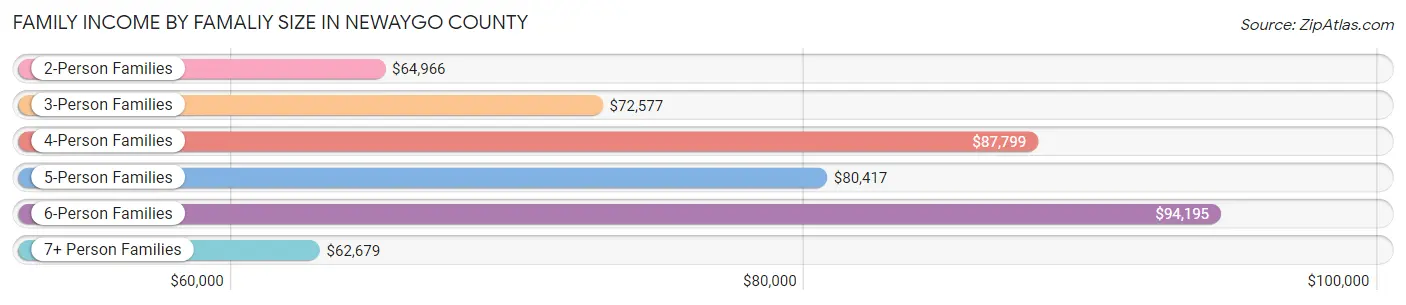
| Income Bracket | # Families | Median Income |
| 2-Person Families | 7,222 (54.2%) | $64,966 |
| 3-Person Families | 2,476 (18.6%) | $72,577 |
| 4-Person Families | 1,833 (13.8%) | $87,799 |
| 5-Person Families | 872 (6.5%) | $80,417 |
| 6-Person Families | 459 (3.4%) | $94,195 |
| 7+ Person Families | 471 (3.5%) | $62,679 |
| Total | 13,333 (100.0%) | $70,051 |
Family Income by Number of Earners in Newaygo County
The median family income in Newaygo County is $70,051, with families comprising 3+ earners (1,379) having the highest median family income of $119,813, while families with no earners (2,867) have the lowest median family income of $41,676, accounting for 10.3% and 21.5% of families, respectively.
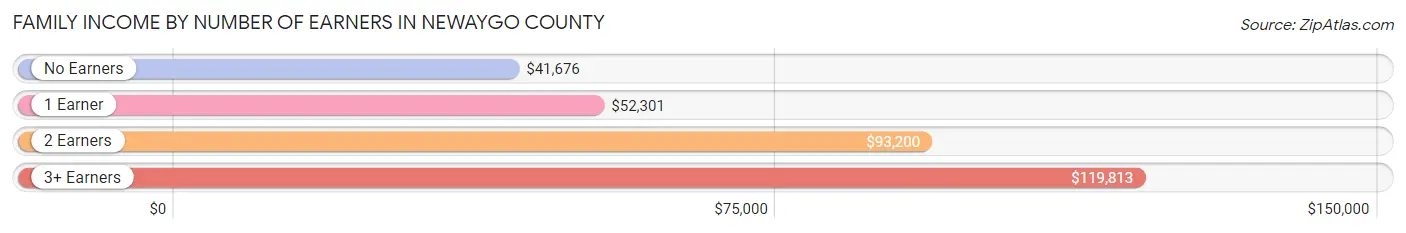
| Number of Earners | # Families | Median Income |
| No Earners | 2,867 (21.5%) | $41,676 |
| 1 Earner | 4,178 (31.3%) | $52,301 |
| 2 Earners | 4,909 (36.8%) | $93,200 |
| 3+ Earners | 1,379 (10.3%) | $119,813 |
| Total | 13,333 (100.0%) | $70,051 |
Household Income in Newaygo County
Household Income Brackets in Newaygo County
With 3,809 households falling in the category, the $50,000 to $74,999 income range is the most frequent in Newaygo County, accounting for 20.0% of all households. In contrast, only 781 households (4.1%) fall into the $200,000+ income bracket, making it the least populous group.
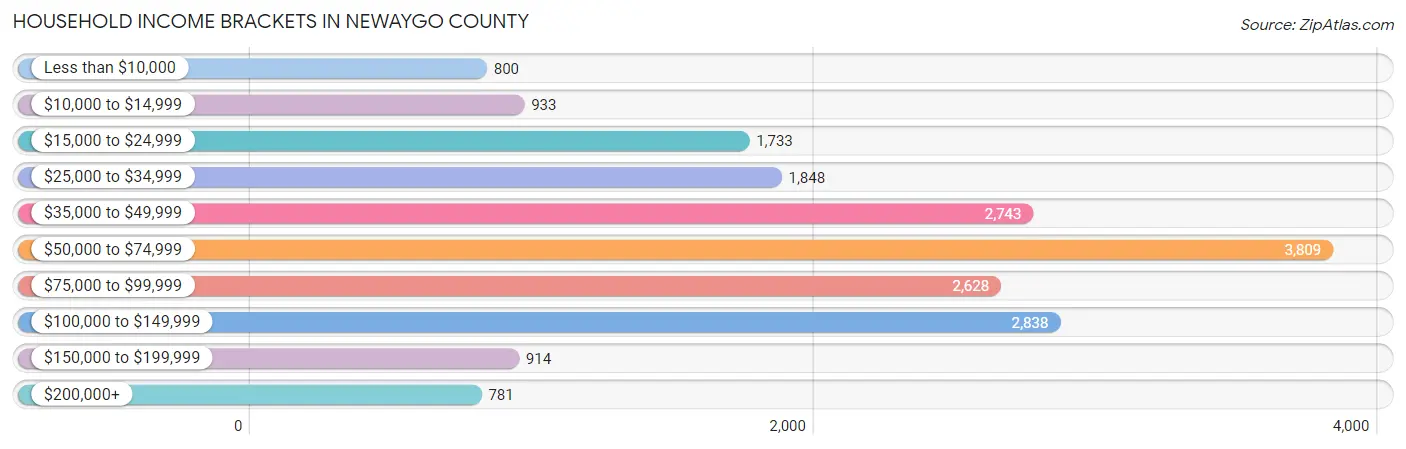
| Income Bracket | # Households | % Households |
| Less than $10,000 | 800 | 4.2% |
| $10,000 to $14,999 | 933 | 4.9% |
| $15,000 to $24,999 | 1,733 | 9.1% |
| $25,000 to $34,999 | 1,848 | 9.7% |
| $35,000 to $49,999 | 2,743 | 14.4% |
| $50,000 to $74,999 | 3,809 | 20.0% |
| $75,000 to $99,999 | 2,628 | 13.8% |
| $100,000 to $149,999 | 2,838 | 14.9% |
| $150,000 to $199,999 | 914 | 4.8% |
| $200,000+ | 781 | 4.1% |
Household Income by Householder Age in Newaygo County
The median household income in Newaygo County is $59,065, with the highest median household income of $68,097 found in the 45 to 64 years age bracket for the primary householder. A total of 7,689 households (40.4%) fall into this category. Meanwhile, the 65+ years age bracket for the primary householder has the lowest median household income of $44,245, with 6,064 households (31.8%) in this group.
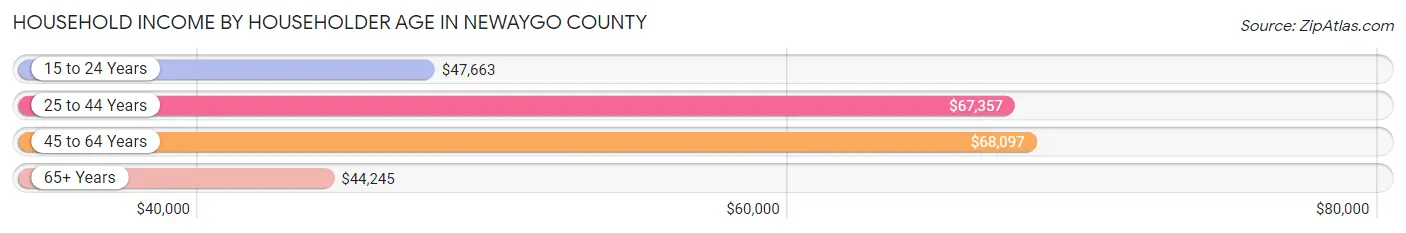
| Income Bracket | # Households | Median Income |
| 15 to 24 Years | 439 (2.3%) | $47,663 |
| 25 to 44 Years | 4,855 (25.5%) | $67,357 |
| 45 to 64 Years | 7,689 (40.4%) | $68,097 |
| 65+ Years | 6,064 (31.8%) | $44,245 |
| Total | 19,047 (100.0%) | $59,065 |
Poverty in Newaygo County
Income Below Poverty by Sex and Age in Newaygo County
With 14.2% poverty level for males and 16.3% for females among the residents of Newaygo County, 5 year old males and 12 to 14 year old females are the most vulnerable to poverty, with 131 males (46.6%) and 354 females (33.8%) in their respective age groups living below the poverty level.
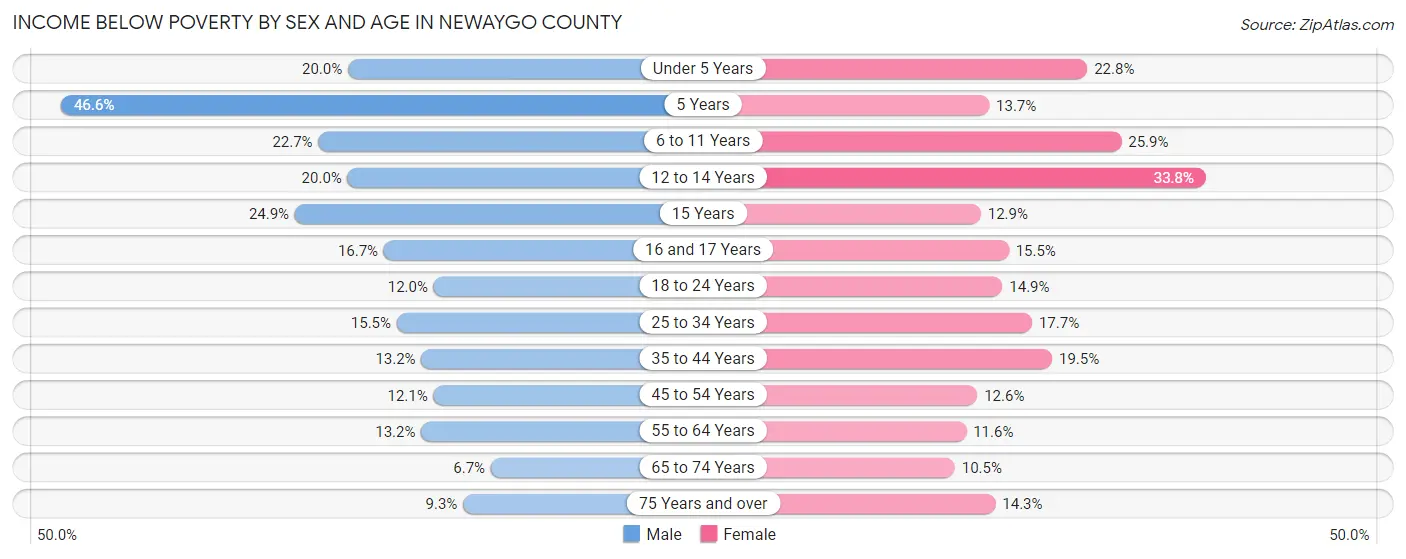
| Age Bracket | Male | Female |
| Under 5 Years | 258 (20.0%) | 321 (22.8%) |
| 5 Years | 131 (46.6%) | 35 (13.7%) |
| 6 to 11 Years | 449 (22.7%) | 427 (25.9%) |
| 12 to 14 Years | 201 (20.0%) | 354 (33.8%) |
| 15 Years | 67 (24.9%) | 52 (12.9%) |
| 16 and 17 Years | 132 (16.7%) | 92 (15.5%) |
| 18 to 24 Years | 232 (12.0%) | 274 (14.9%) |
| 25 to 34 Years | 449 (15.4%) | 486 (17.6%) |
| 35 to 44 Years | 375 (13.2%) | 529 (19.5%) |
| 45 to 54 Years | 366 (12.0%) | 369 (12.6%) |
| 55 to 64 Years | 533 (13.2%) | 442 (11.6%) |
| 65 to 74 Years | 208 (6.7%) | 306 (10.5%) |
| 75 Years and over | 149 (9.3%) | 300 (14.2%) |
| Total | 3,550 (14.2%) | 3,987 (16.3%) |
Income Above Poverty by Sex and Age in Newaygo County
According to the poverty statistics in Newaygo County, males aged 65 to 74 years and females aged 65 to 74 years are the age groups that are most secure financially, with 93.3% of males and 89.5% of females in these age groups living above the poverty line.
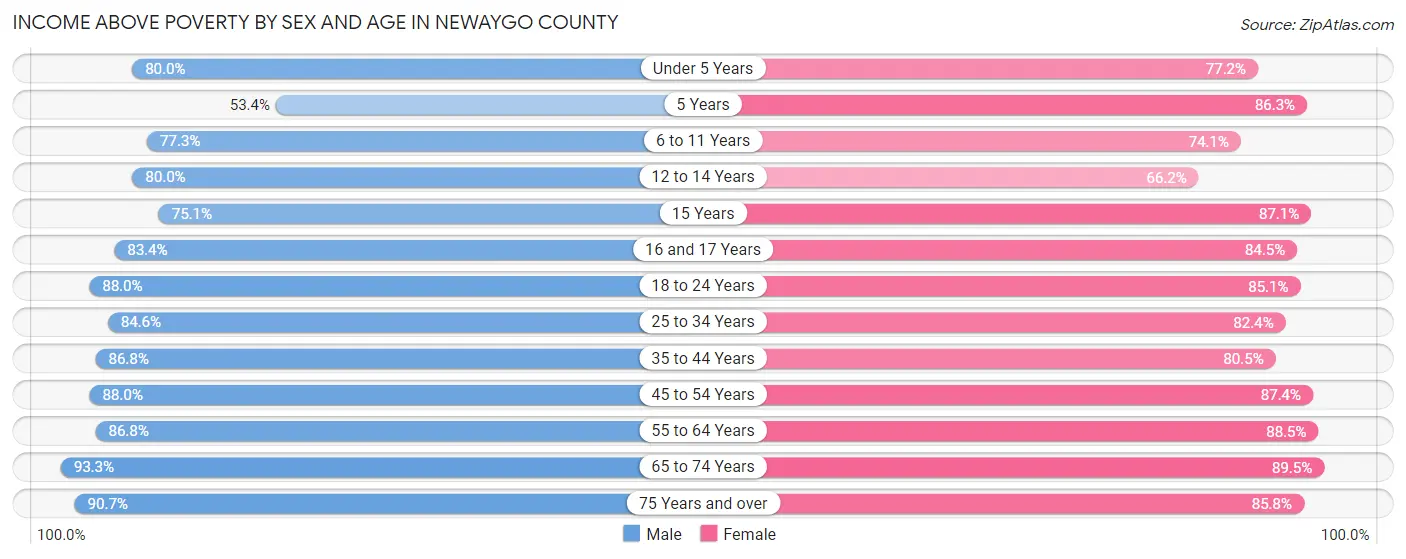
| Age Bracket | Male | Female |
| Under 5 Years | 1,033 (80.0%) | 1,088 (77.2%) |
| 5 Years | 150 (53.4%) | 221 (86.3%) |
| 6 to 11 Years | 1,526 (77.3%) | 1,219 (74.1%) |
| 12 to 14 Years | 803 (80.0%) | 694 (66.2%) |
| 15 Years | 202 (75.1%) | 351 (87.1%) |
| 16 and 17 Years | 661 (83.4%) | 502 (84.5%) |
| 18 to 24 Years | 1,698 (88.0%) | 1,565 (85.1%) |
| 25 to 34 Years | 2,458 (84.6%) | 2,267 (82.4%) |
| 35 to 44 Years | 2,473 (86.8%) | 2,183 (80.5%) |
| 45 to 54 Years | 2,672 (87.9%) | 2,567 (87.4%) |
| 55 to 64 Years | 3,511 (86.8%) | 3,386 (88.4%) |
| 65 to 74 Years | 2,886 (93.3%) | 2,612 (89.5%) |
| 75 Years and over | 1,453 (90.7%) | 1,806 (85.8%) |
| Total | 21,526 (85.8%) | 20,461 (83.7%) |
Income Below Poverty Among Married-Couple Families in Newaygo County
The poverty statistics for married-couple families in Newaygo County show that 6.3% or 653 of the total 10,404 families live below the poverty line. Families with 5 or more children have the highest poverty rate of 77.6%, comprising of 159 families. On the other hand, families with no children have the lowest poverty rate of 3.6%, which includes 250 families.
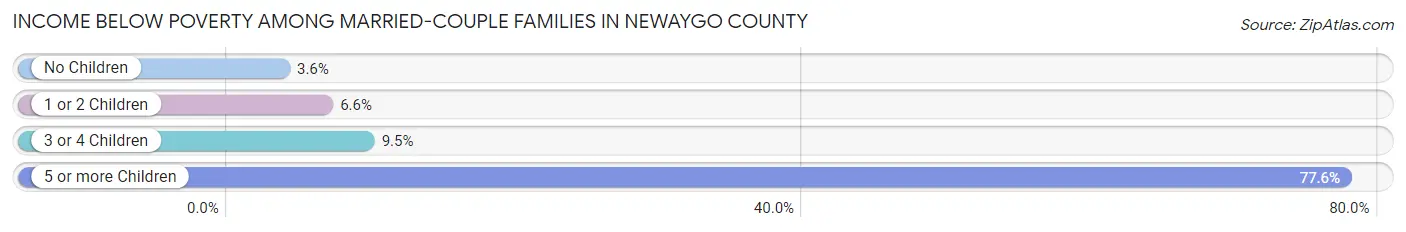
| Children | Above Poverty | Below Poverty |
| No Children | 6,658 (96.4%) | 250 (3.6%) |
| 1 or 2 Children | 2,239 (93.4%) | 159 (6.6%) |
| 3 or 4 Children | 808 (90.5%) | 85 (9.5%) |
| 5 or more Children | 46 (22.4%) | 159 (77.6%) |
| Total | 9,751 (93.7%) | 653 (6.3%) |
Income Below Poverty Among Single-Parent Households in Newaygo County
According to the poverty data in Newaygo County, 23.2% or 254 single-father households and 28.5% or 523 single-mother households are living below the poverty line. Among single-father households, those with 3 or 4 children have the highest poverty rate, with 21 households (45.7%) experiencing poverty. Likewise, among single-mother households, those with 5 or more children have the highest poverty rate, with 24 households (100.0%) falling below the poverty line.
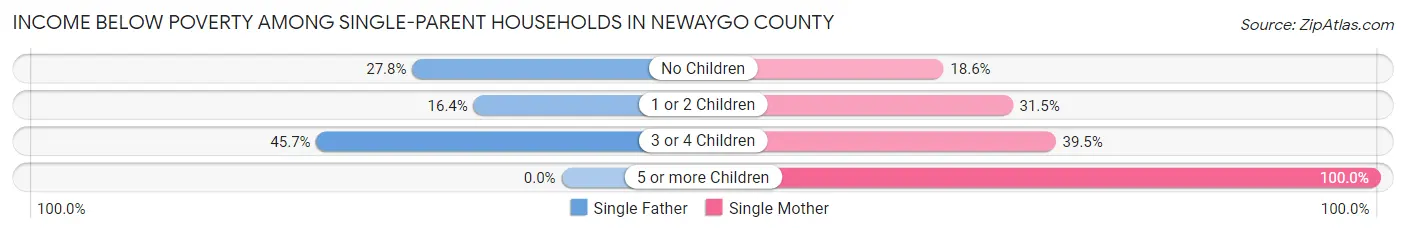
| Children | Single Father | Single Mother |
| No Children | 152 (27.8%) | 128 (18.6%) |
| 1 or 2 Children | 81 (16.4%) | 279 (31.5%) |
| 3 or 4 Children | 21 (45.7%) | 92 (39.5%) |
| 5 or more Children | 0 (0.0%) | 24 (100.0%) |
| Total | 254 (23.2%) | 523 (28.5%) |
Income Below Poverty Among Married-Couple vs Single-Parent Households in Newaygo County
The poverty data for Newaygo County shows that 653 of the married-couple family households (6.3%) and 777 of the single-parent households (26.5%) are living below the poverty level. Within the married-couple family households, those with 5 or more children have the highest poverty rate, with 159 households (77.6%) falling below the poverty line. Among the single-parent households, those with 5 or more children have the highest poverty rate, with 24 household (75.0%) living below poverty.
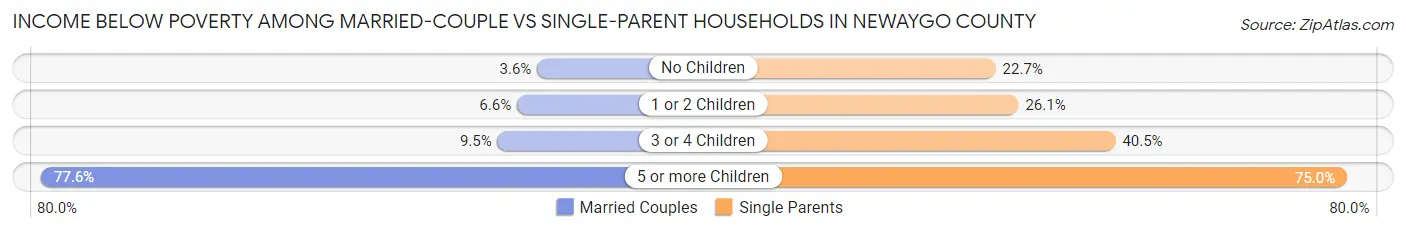
| Children | Married-Couple Families | Single-Parent Households |
| No Children | 250 (3.6%) | 280 (22.7%) |
| 1 or 2 Children | 159 (6.6%) | 360 (26.1%) |
| 3 or 4 Children | 85 (9.5%) | 113 (40.5%) |
| 5 or more Children | 159 (77.6%) | 24 (75.0%) |
| Total | 653 (6.3%) | 777 (26.5%) |
Race in Newaygo County
The most populous races in Newaygo County are White / Caucasian (45,537 | 90.8%), Hispanic or Latino (3,048 | 6.1%), and Two or more Races (2,245 | 4.5%).
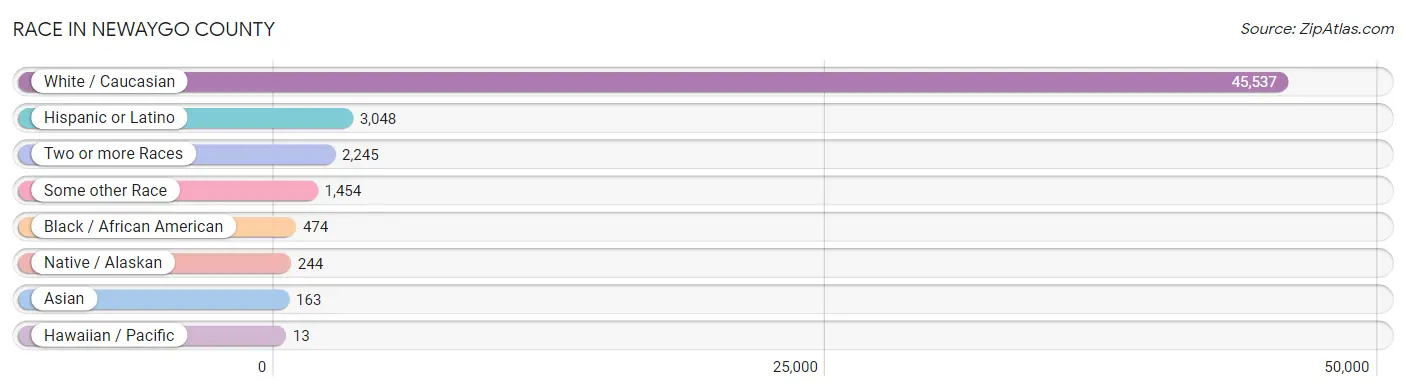
| Race | # Population | % Population |
| Asian | 163 | 0.3% |
| Black / African American | 474 | 0.9% |
| Hawaiian / Pacific | 13 | 0.0% |
| Hispanic or Latino | 3,048 | 6.1% |
| Native / Alaskan | 244 | 0.5% |
| White / Caucasian | 45,537 | 90.8% |
| Two or more Races | 2,245 | 4.5% |
| Some other Race | 1,454 | 2.9% |
| Total | 50,130 | 100.0% |
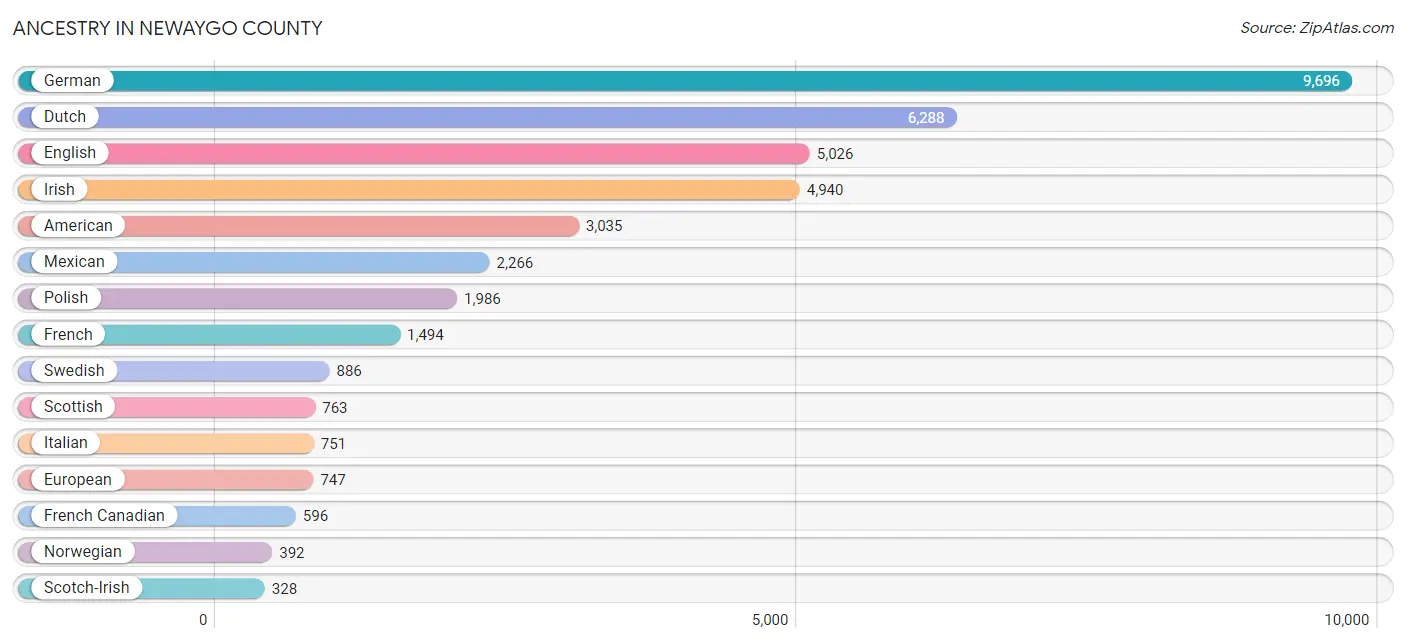
Ancestry in Newaygo County
The most populous ancestries reported in Newaygo County are German (9,696 | 19.3%), Dutch (6,288 | 12.5%), English (5,026 | 10.0%), Irish (4,940 | 9.9%), and American (3,035 | 6.0%), together accounting for 57.8% of all Newaygo County residents.
| Ancestry | # Population | % Population |
| African | 5 | 0.0% |
| American | 3,035 | 6.0% |
| Apache | 8 | 0.0% |
| Arab | 142 | 0.3% |
| Armenian | 3 | 0.0% |
| Australian | 18 | 0.0% |
| Austrian | 65 | 0.1% |
| Belgian | 150 | 0.3% |
| Bhutanese | 17 | 0.0% |
| Blackfeet | 14 | 0.0% |
| Bolivian | 8 | 0.0% |
| Brazilian | 13 | 0.0% |
| British | 255 | 0.5% |
| Bulgarian | 22 | 0.0% |
| Burmese | 80 | 0.2% |
| Canadian | 88 | 0.2% |
| Central American | 232 | 0.5% |
| Central American Indian | 4 | 0.0% |
| Cherokee | 92 | 0.2% |
| Chippewa | 117 | 0.2% |
| Choctaw | 2 | 0.0% |
| Comanche | 14 | 0.0% |
| Costa Rican | 4 | 0.0% |
| Cree | 1 | 0.0% |
| Croatian | 17 | 0.0% |
| Crow | 2 | 0.0% |
| Cuban | 3 | 0.0% |
| Czech | 119 | 0.2% |
| Czechoslovakian | 59 | 0.1% |
| Danish | 301 | 0.6% |
| Dominican | 58 | 0.1% |
| Dutch | 6,288 | 12.5% |
| Eastern European | 90 | 0.2% |
| English | 5,026 | 10.0% |
| Ethiopian | 9 | 0.0% |
| European | 747 | 1.5% |
| Finnish | 129 | 0.3% |
| French | 1,494 | 3.0% |
| French American Indian | 59 | 0.1% |
| French Canadian | 596 | 1.2% |
| German | 9,696 | 19.3% |
| Greek | 44 | 0.1% |
| Guamanian / Chamorro | 20 | 0.0% |
| Guatemalan | 195 | 0.4% |
| Haitian | 27 | 0.1% |
| Honduran | 29 | 0.1% |
| Hungarian | 88 | 0.2% |
| Icelander | 22 | 0.0% |
| Indian (Asian) | 10 | 0.0% |
| Inupiat | 2 | 0.0% |
| Iranian | 10 | 0.0% |
| Irish | 4,940 | 9.9% |
| Italian | 751 | 1.5% |
| Jamaican | 13 | 0.0% |
| Japanese | 1 | 0.0% |
| Jordanian | 1 | 0.0% |
| Korean | 160 | 0.3% |
| Latvian | 2 | 0.0% |
| Lebanese | 67 | 0.1% |
| Lithuanian | 238 | 0.5% |
| Macedonian | 3 | 0.0% |
| Maltese | 22 | 0.0% |
| Menominee | 5 | 0.0% |
| Mexican | 2,266 | 4.5% |
| Native Hawaiian | 13 | 0.0% |
| Northern European | 35 | 0.1% |
| Norwegian | 392 | 0.8% |
| Osage | 1 | 0.0% |
| Ottawa | 93 | 0.2% |
| Pakistani | 19 | 0.0% |
| Palestinian | 43 | 0.1% |
| Panamanian | 2 | 0.0% |
| Paraguayan | 4 | 0.0% |
| Pennsylvania German | 32 | 0.1% |
| Polish | 1,986 | 4.0% |
| Portuguese | 8 | 0.0% |
| Potawatomi | 12 | 0.0% |
| Puerto Rican | 145 | 0.3% |
| Romanian | 1 | 0.0% |
| Russian | 195 | 0.4% |
| Salvadoran | 2 | 0.0% |
| Scandinavian | 169 | 0.3% |
| Scotch-Irish | 328 | 0.6% |
| Scottish | 763 | 1.5% |
| Serbian | 3 | 0.0% |
| Sioux | 6 | 0.0% |
| Slavic | 1 | 0.0% |
| Slovak | 26 | 0.1% |
| Slovene | 36 | 0.1% |
| South American | 12 | 0.0% |
| Spaniard | 21 | 0.0% |
| Spanish | 26 | 0.1% |
| Sri Lankan | 22 | 0.0% |
| Subsaharan African | 14 | 0.0% |
| Swedish | 886 | 1.8% |
| Swiss | 242 | 0.5% |
| Syrian | 9 | 0.0% |
| Thai | 25 | 0.1% |
| Trinidadian and Tobagonian | 9 | 0.0% |
| Ukrainian | 91 | 0.2% |
| Welsh | 148 | 0.3% |
| West Indian | 2 | 0.0% |
| Yugoslavian | 21 | 0.0% | View All 103 Rows |
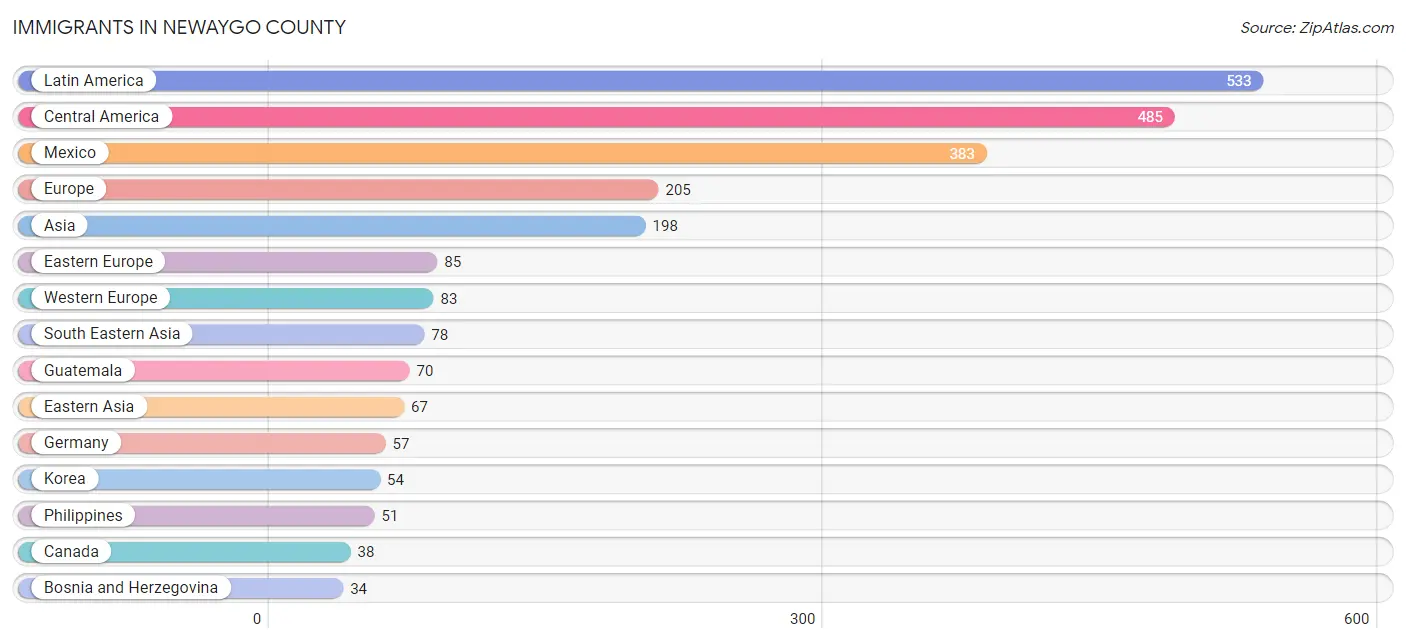
Immigrants in Newaygo County
The most numerous immigrant groups reported in Newaygo County came from Latin America (533 | 1.1%), Central America (485 | 1.0%), Mexico (383 | 0.8%), Europe (205 | 0.4%), and Asia (198 | 0.4%), together accounting for 3.6% of all Newaygo County residents.
| Immigration Origin | # Population | % Population |
| Africa | 12 | 0.0% |
| Asia | 198 | 0.4% |
| Austria | 10 | 0.0% |
| Bolivia | 8 | 0.0% |
| Bosnia and Herzegovina | 34 | 0.1% |
| Brazil | 10 | 0.0% |
| Bulgaria | 8 | 0.0% |
| Cambodia | 1 | 0.0% |
| Canada | 38 | 0.1% |
| Caribbean | 30 | 0.1% |
| Central America | 485 | 1.0% |
| China | 7 | 0.0% |
| Congo | 3 | 0.0% |
| Costa Rica | 4 | 0.0% |
| Dominican Republic | 12 | 0.0% |
| Eastern Africa | 9 | 0.0% |
| Eastern Asia | 67 | 0.1% |
| Eastern Europe | 85 | 0.2% |
| El Salvador | 4 | 0.0% |
| Ethiopia | 9 | 0.0% |
| Europe | 205 | 0.4% |
| Germany | 57 | 0.1% |
| Greece | 20 | 0.0% |
| Guatemala | 70 | 0.1% |
| Haiti | 18 | 0.0% |
| Honduras | 24 | 0.1% |
| India | 15 | 0.0% |
| Iraq | 22 | 0.0% |
| Italy | 1 | 0.0% |
| Japan | 6 | 0.0% |
| Jordan | 8 | 0.0% |
| Korea | 54 | 0.1% |
| Latin America | 533 | 1.1% |
| Lithuania | 18 | 0.0% |
| Mexico | 383 | 0.8% |
| Middle Africa | 3 | 0.0% |
| Netherlands | 16 | 0.0% |
| Northern Europe | 16 | 0.0% |
| Philippines | 51 | 0.1% |
| Poland | 17 | 0.0% |
| Russia | 3 | 0.0% |
| South America | 18 | 0.0% |
| South Central Asia | 15 | 0.0% |
| South Eastern Asia | 78 | 0.2% |
| Southern Europe | 21 | 0.0% |
| Sweden | 7 | 0.0% |
| Thailand | 19 | 0.0% |
| Ukraine | 5 | 0.0% |
| Vietnam | 7 | 0.0% |
| Western Asia | 30 | 0.1% |
| Western Europe | 83 | 0.2% | View All 51 Rows |
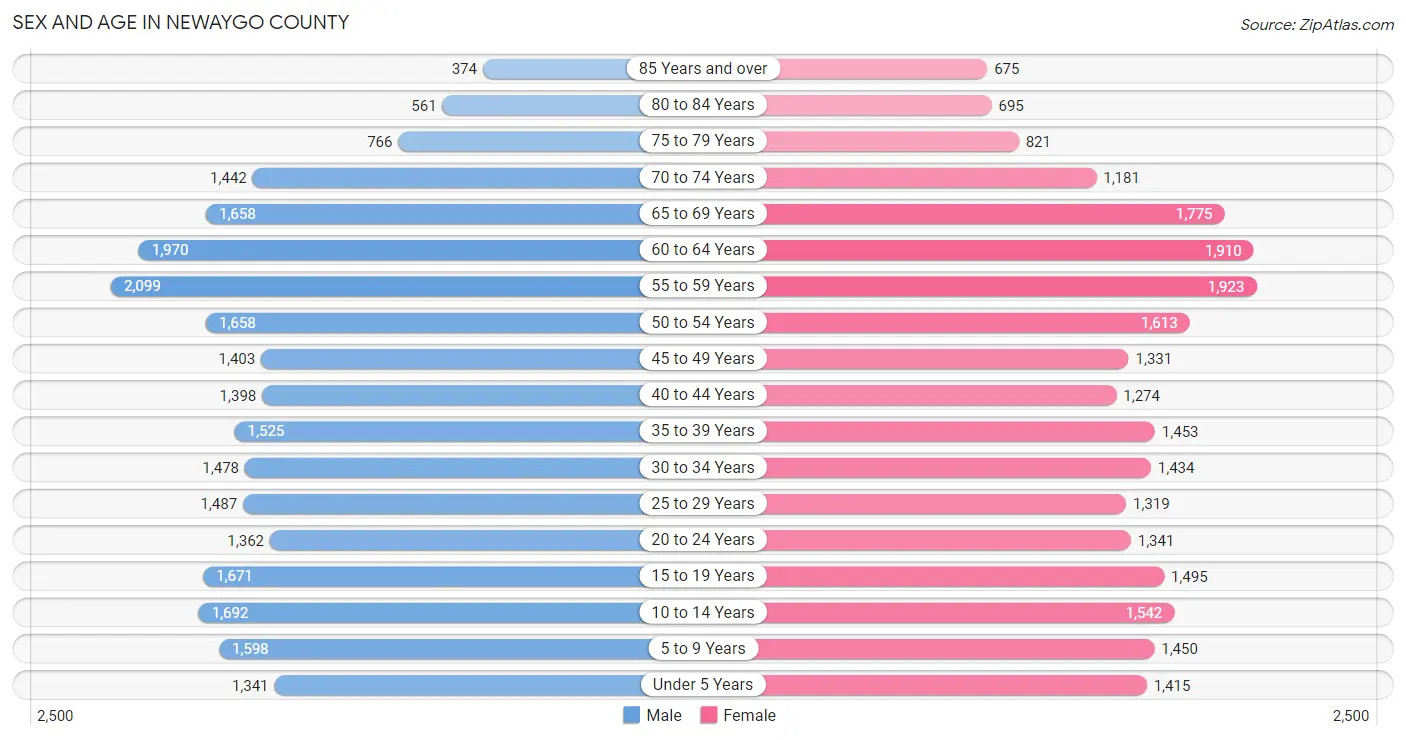
Sex and Age in Newaygo County
Sex and Age in Newaygo County
The most populous age groups in Newaygo County are 55 to 59 Years (2,099 | 8.2%) for men and 55 to 59 Years (1,923 | 7.8%) for women.
| Age Bracket | Male | Female |
| Under 5 Years | 1,341 (5.3%) | 1,415 (5.7%) |
| 5 to 9 Years | 1,598 (6.3%) | 1,450 (5.9%) |
| 10 to 14 Years | 1,692 (6.6%) | 1,542 (6.3%) |
| 15 to 19 Years | 1,671 (6.6%) | 1,495 (6.1%) |
| 20 to 24 Years | 1,362 (5.3%) | 1,341 (5.4%) |
| 25 to 29 Years | 1,487 (5.8%) | 1,319 (5.3%) |
| 30 to 34 Years | 1,478 (5.8%) | 1,434 (5.8%) |
| 35 to 39 Years | 1,525 (6.0%) | 1,453 (5.9%) |
| 40 to 44 Years | 1,398 (5.5%) | 1,274 (5.2%) |
| 45 to 49 Years | 1,403 (5.5%) | 1,331 (5.4%) |
| 50 to 54 Years | 1,658 (6.5%) | 1,613 (6.5%) |
| 55 to 59 Years | 2,099 (8.2%) | 1,923 (7.8%) |
| 60 to 64 Years | 1,970 (7.7%) | 1,910 (7.7%) |
| 65 to 69 Years | 1,658 (6.5%) | 1,775 (7.2%) |
| 70 to 74 Years | 1,442 (5.7%) | 1,181 (4.8%) |
| 75 to 79 Years | 766 (3.0%) | 821 (3.3%) |
| 80 to 84 Years | 561 (2.2%) | 695 (2.8%) |
| 85 Years and over | 374 (1.5%) | 675 (2.7%) |
| Total | 25,483 (100.0%) | 24,647 (100.0%) |
Families and Households in Newaygo County
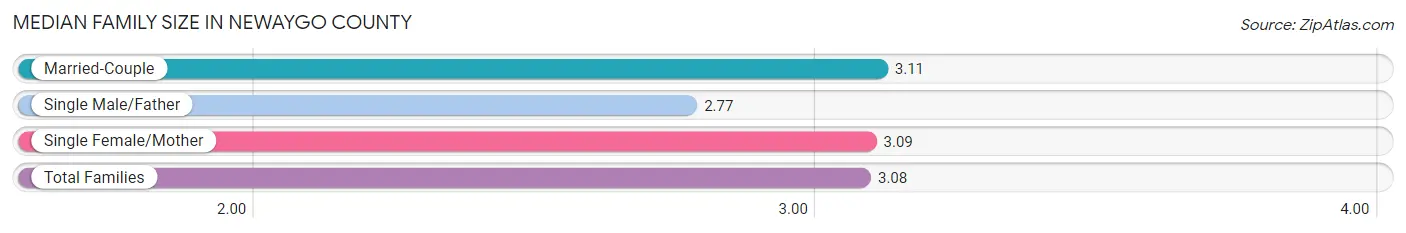
Median Family Size in Newaygo County
The median family size in Newaygo County is 3.08 persons per family, with married-couple families (10,404 | 78.0%) accounting for the largest median family size of 3.11 persons per family. On the other hand, single male/father families (1,096 | 8.2%) represent the smallest median family size with 2.77 persons per family.
| Family Type | # Families | Family Size |
| Married-Couple | 10,404 (78.0%) | 3.11 |
| Single Male/Father | 1,096 (8.2%) | 2.77 |
| Single Female/Mother | 1,833 (13.8%) | 3.09 |
| Total Families | 13,333 (100.0%) | 3.08 |
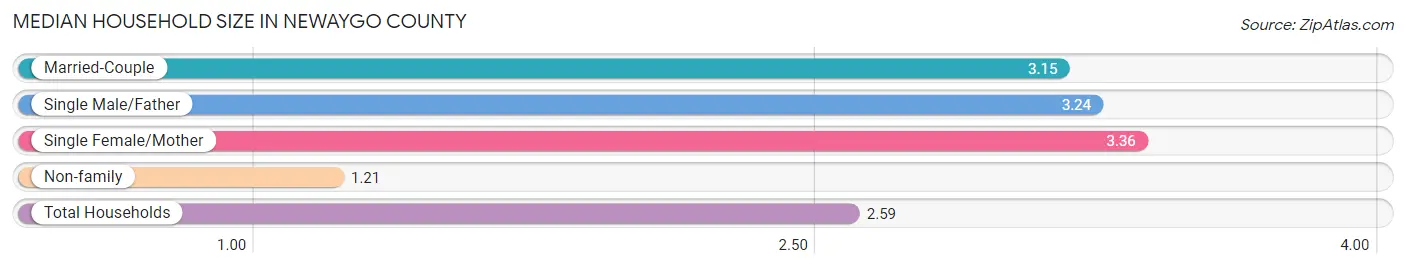
Median Household Size in Newaygo County
The median household size in Newaygo County is 2.59 persons per household, with single female/mother households (1,833 | 9.6%) accounting for the largest median household size of 3.36 persons per household. non-family households (5,714 | 30.0%) represent the smallest median household size with 1.21 persons per household.
| Household Type | # Households | Household Size |
| Married-Couple | 10,404 (54.6%) | 3.15 |
| Single Male/Father | 1,096 (5.8%) | 3.24 |
| Single Female/Mother | 1,833 (9.6%) | 3.36 |
| Non-family | 5,714 (30.0%) | 1.21 |
| Total Households | 19,047 (100.0%) | 2.59 |
Household Size by Marriage Status in Newaygo County
Out of a total of 19,047 households in Newaygo County, 13,333 (70.0%) are family households, while 5,714 (30.0%) are nonfamily households. The most numerous type of family households are 2-person households, comprising 6,710, and the most common type of nonfamily households are 1-person households, comprising 4,905.
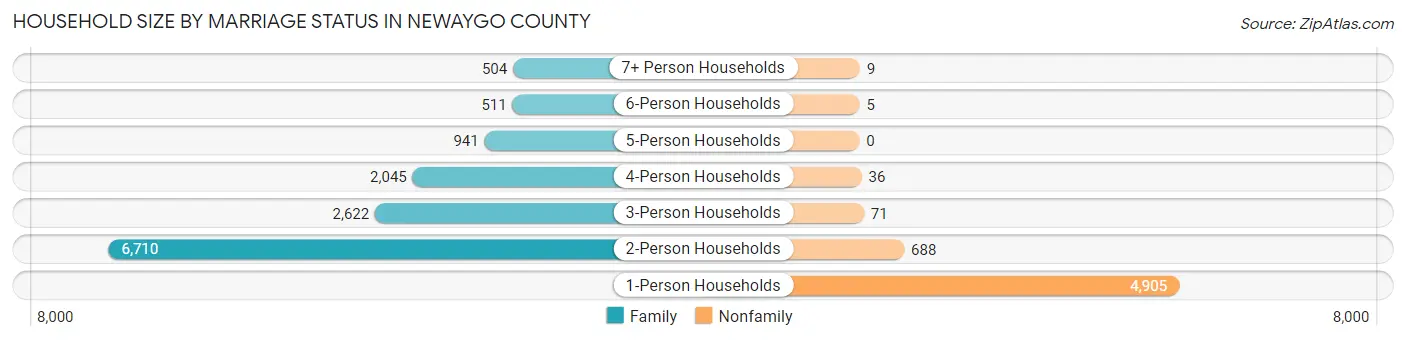
| Household Size | Family Households | Nonfamily Households |
| 1-Person Households | - | 4,905 (25.8%) |
| 2-Person Households | 6,710 (35.2%) | 688 (3.6%) |
| 3-Person Households | 2,622 (13.8%) | 71 (0.4%) |
| 4-Person Households | 2,045 (10.7%) | 36 (0.2%) |
| 5-Person Households | 941 (4.9%) | 0 (0.0%) |
| 6-Person Households | 511 (2.7%) | 5 (0.0%) |
| 7+ Person Households | 504 (2.6%) | 9 (0.1%) |
| Total | 13,333 (70.0%) | 5,714 (30.0%) |
Female Fertility in Newaygo County
Fertility by Age in Newaygo County
Average fertility rate in Newaygo County is 66.0 births per 1,000 women. Women in the age bracket of 20 to 34 years have the highest fertility rate with 118.0 births per 1,000 women. Women in the age bracket of 20 to 34 years acount for 73.5% of all women with births.
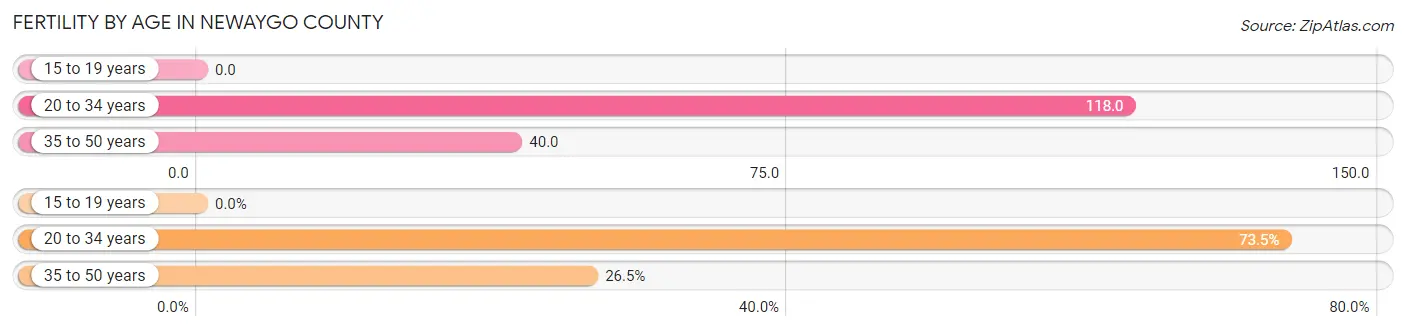
| Age Bracket | Women with Births | Births / 1,000 Women |
| 15 to 19 years | 0 (0.0%) | 0.0 |
| 20 to 34 years | 483 (73.5%) | 118.0 |
| 35 to 50 years | 174 (26.5%) | 40.0 |
| Total | 657 (100.0%) | 66.0 |
Fertility by Age by Marriage Status in Newaygo County
64.4% of women with births (657) in Newaygo County are married. The highest percentage of unmarried women with births falls into 20 to 34 years age bracket with 41.4% of them unmarried at the time of birth, while the lowest percentage of unmarried women with births belong to 35 to 50 years age bracket with 19.5% of them unmarried.
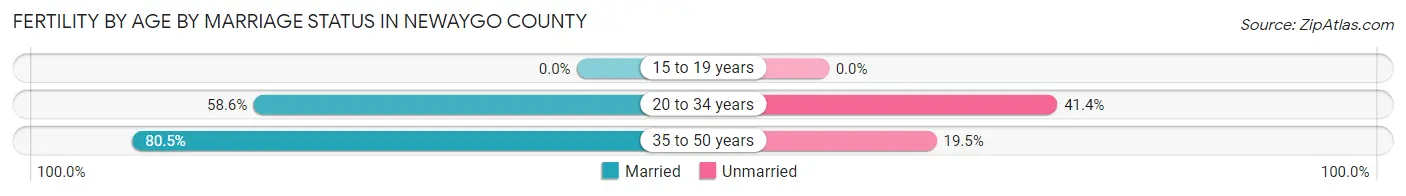
| Age Bracket | Married | Unmarried |
| 15 to 19 years | 0 (0.0%) | 0 (0.0%) |
| 20 to 34 years | 283 (58.6%) | 200 (41.4%) |
| 35 to 50 years | 140 (80.5%) | 34 (19.5%) |
| Total | 423 (64.4%) | 234 (35.6%) |
Fertility by Education in Newaygo County
Average fertility rate in Newaygo County is 66.0 births per 1,000 women. Women with the education attainment of college or associate's degree have the highest fertility rate of 105.0 births per 1,000 women, while women with the education attainment of less than high school have the lowest fertility at 23.0 births per 1,000 women. Women with the education attainment of college or associate's degree represent 57.7% of all women with births.
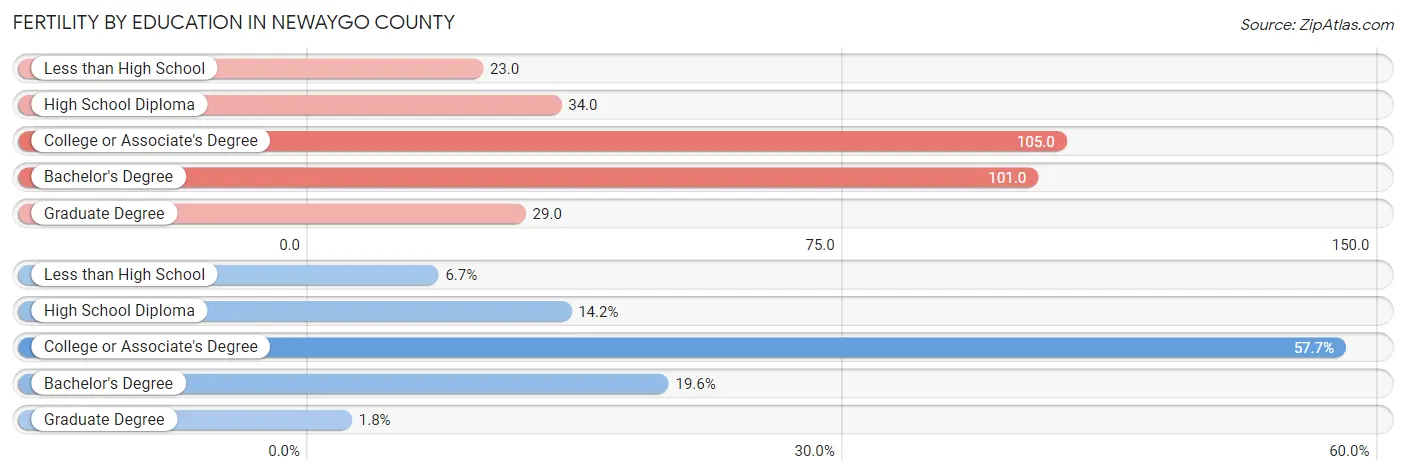
| Educational Attainment | Women with Births | Births / 1,000 Women |
| Less than High School | 44 (6.7%) | 23.0 |
| High School Diploma | 93 (14.2%) | 34.0 |
| College or Associate's Degree | 379 (57.7%) | 105.0 |
| Bachelor's Degree | 129 (19.6%) | 101.0 |
| Graduate Degree | 12 (1.8%) | 29.0 |
| Total | 657 (100.0%) | 66.0 |
Fertility by Education by Marriage Status in Newaygo County
35.6% of women with births in Newaygo County are unmarried. Women with the educational attainment of graduate degree are most likely to be married with 100.0% of them married at childbirth, while women with the educational attainment of high school diploma are least likely to be married with 64.5% of them unmarried at childbirth.
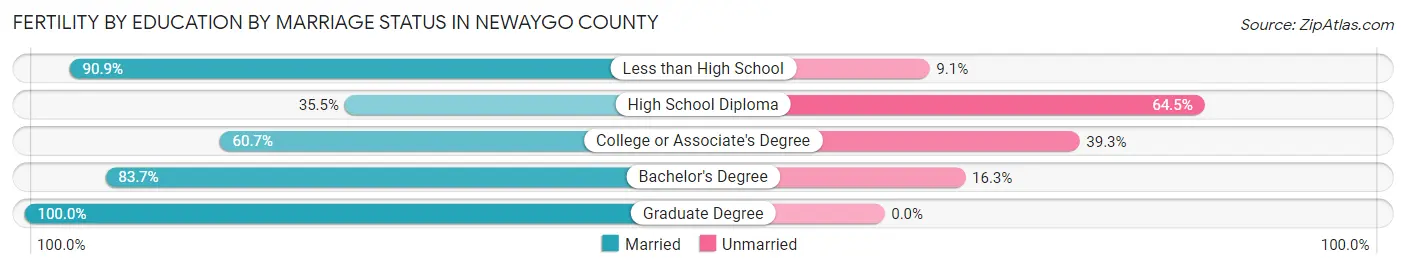
| Educational Attainment | Married | Unmarried |
| Less than High School | 40 (90.9%) | 4 (9.1%) |
| High School Diploma | 33 (35.5%) | 60 (64.5%) |
| College or Associate's Degree | 230 (60.7%) | 149 (39.3%) |
| Bachelor's Degree | 108 (83.7%) | 21 (16.3%) |
| Graduate Degree | 12 (100.0%) | 0 (0.0%) |
| Total | 423 (64.4%) | 234 (35.6%) |
Employment Characteristics in Newaygo County
Employment by Class of Employer in Newaygo County
Among the 21,259 employed individuals in Newaygo County, private company employees (14,762 | 69.4%), not-for-profit organizations (1,957 | 9.2%), and local government employees (1,707 | 8.0%) make up the most common classes of employment.
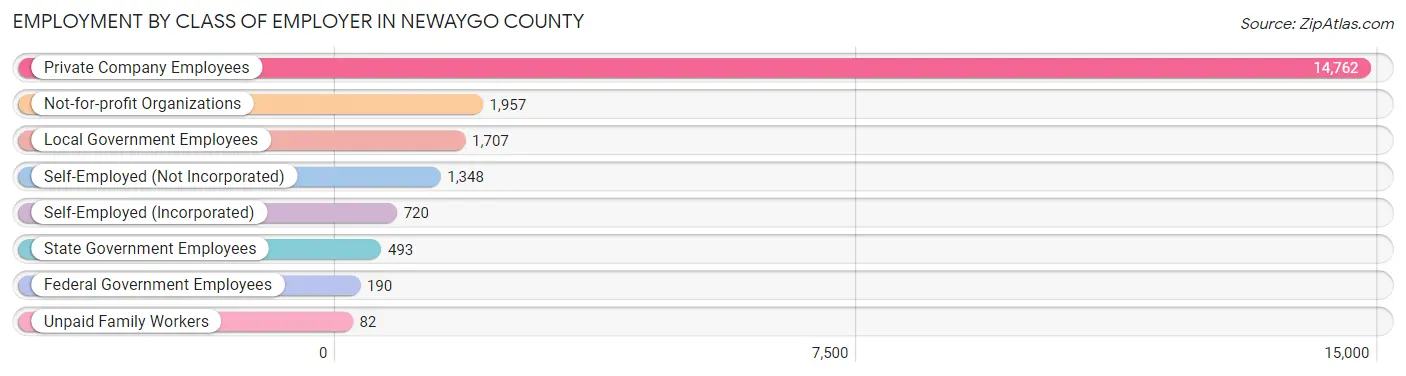
| Employer Class | # Employees | % Employees |
| Private Company Employees | 14,762 | 69.4% |
| Self-Employed (Incorporated) | 720 | 3.4% |
| Self-Employed (Not Incorporated) | 1,348 | 6.3% |
| Not-for-profit Organizations | 1,957 | 9.2% |
| Local Government Employees | 1,707 | 8.0% |
| State Government Employees | 493 | 2.3% |
| Federal Government Employees | 190 | 0.9% |
| Unpaid Family Workers | 82 | 0.4% |
| Total | 21,259 | 100.0% |
Employment Status by Age in Newaygo County
According to the labor force statistics for Newaygo County, out of the total population over 16 years of age (40,420), 56.0% or 22,635 individuals are in the labor force, with 4.7% or 1,064 of them unemployed. The age group with the highest labor force participation rate is 25 to 29 years, with 82.8% or 2,323 individuals in the labor force. Within the labor force, the 16 to 19 years age range has the highest percentage of unemployed individuals, with 14.7% or 158 of them being unemployed.
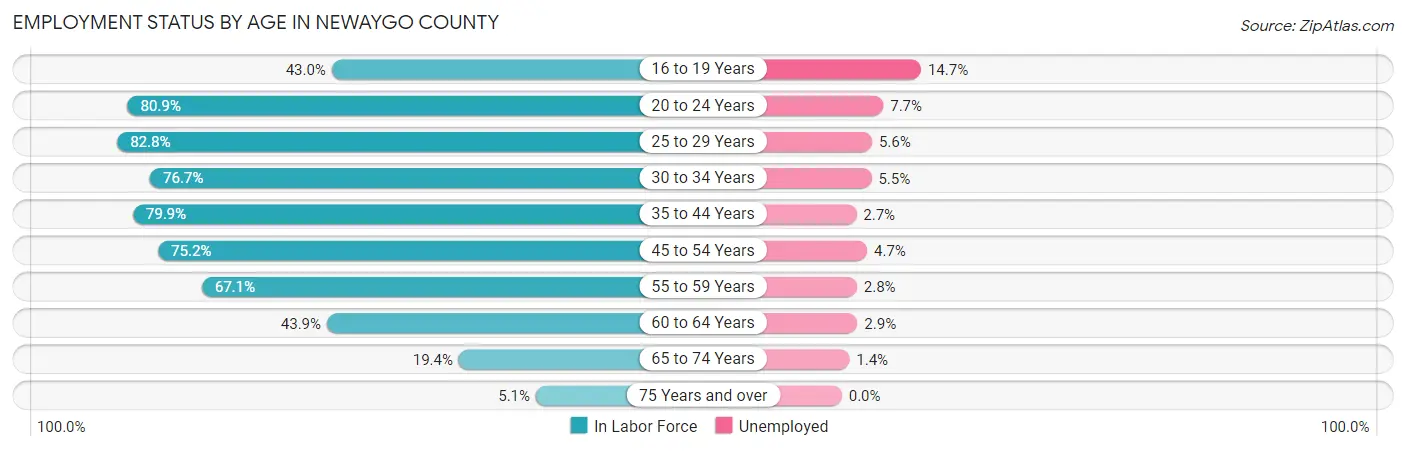
| Age Bracket | In Labor Force | Unemployed |
| 16 to 19 Years | 1,072 (43.0%) | 158 (14.7%) |
| 20 to 24 Years | 2,187 (80.9%) | 168 (7.7%) |
| 25 to 29 Years | 2,323 (82.8%) | 130 (5.6%) |
| 30 to 34 Years | 2,234 (76.7%) | 123 (5.5%) |
| 35 to 44 Years | 4,514 (79.9%) | 122 (2.7%) |
| 45 to 54 Years | 4,516 (75.2%) | 212 (4.7%) |
| 55 to 59 Years | 2,699 (67.1%) | 76 (2.8%) |
| 60 to 64 Years | 1,703 (43.9%) | 49 (2.9%) |
| 65 to 74 Years | 1,175 (19.4%) | 16 (1.4%) |
| 75 Years and over | 198 (5.1%) | 0 (0.0%) |
| Total | 22,635 (56.0%) | 1,064 (4.7%) |
Employment Status by Educational Attainment in Newaygo County
According to labor force statistics for Newaygo County, 71.2% of individuals (17,996) out of the total population between 25 and 64 years of age (25,275) are in the labor force, with 4.0% or 720 of them being unemployed. The group with the highest labor force participation rate are those with the educational attainment of bachelor's degree or higher, with 83.4% or 3,743 individuals in the labor force. Within the labor force, individuals with less than high school education have the highest percentage of unemployment, with 7.0% or 84 of them being unemployed.
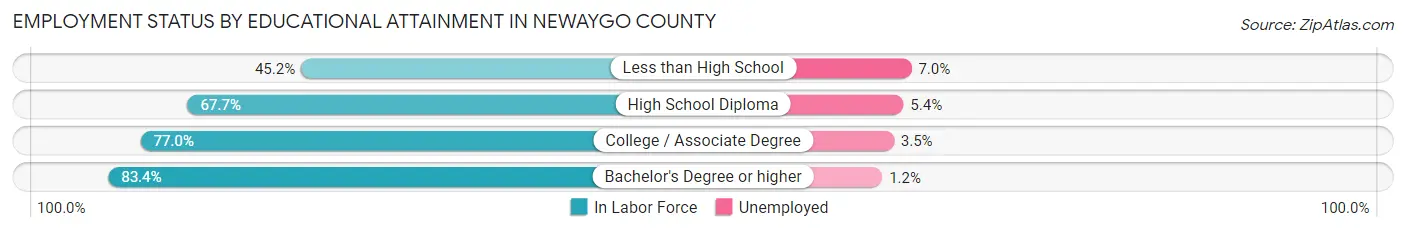
| Educational Attainment | In Labor Force | Unemployed |
| Less than High School | 1,204 (45.2%) | 186 (7.0%) |
| High School Diploma | 6,666 (67.7%) | 532 (5.4%) |
| College / Associate Degree | 6,373 (77.0%) | 290 (3.5%) |
| Bachelor's Degree or higher | 3,743 (83.4%) | 54 (1.2%) |
| Total | 17,996 (71.2%) | 1,011 (4.0%) |
Employment Occupations by Sex in Newaygo County
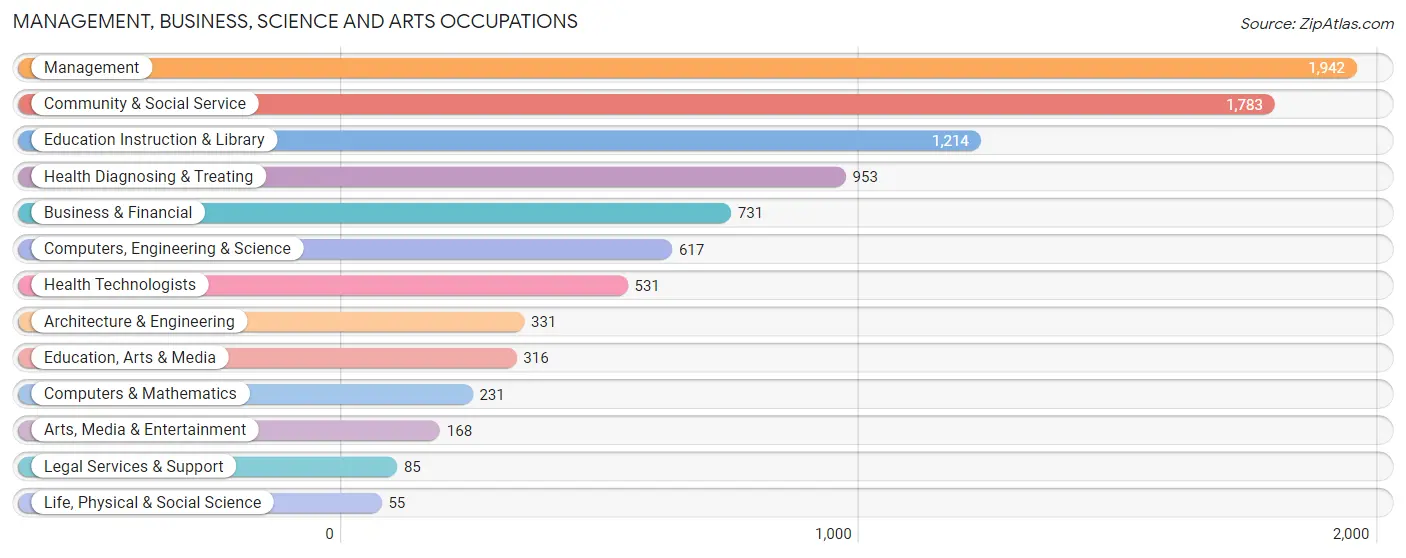
Management, Business, Science and Arts Occupations
The most common Management, Business, Science and Arts occupations in Newaygo County are Management (1,942 | 9.0%), Community & Social Service (1,783 | 8.3%), Education Instruction & Library (1,214 | 5.6%), Health Diagnosing & Treating (953 | 4.4%), and Business & Financial (731 | 3.4%).
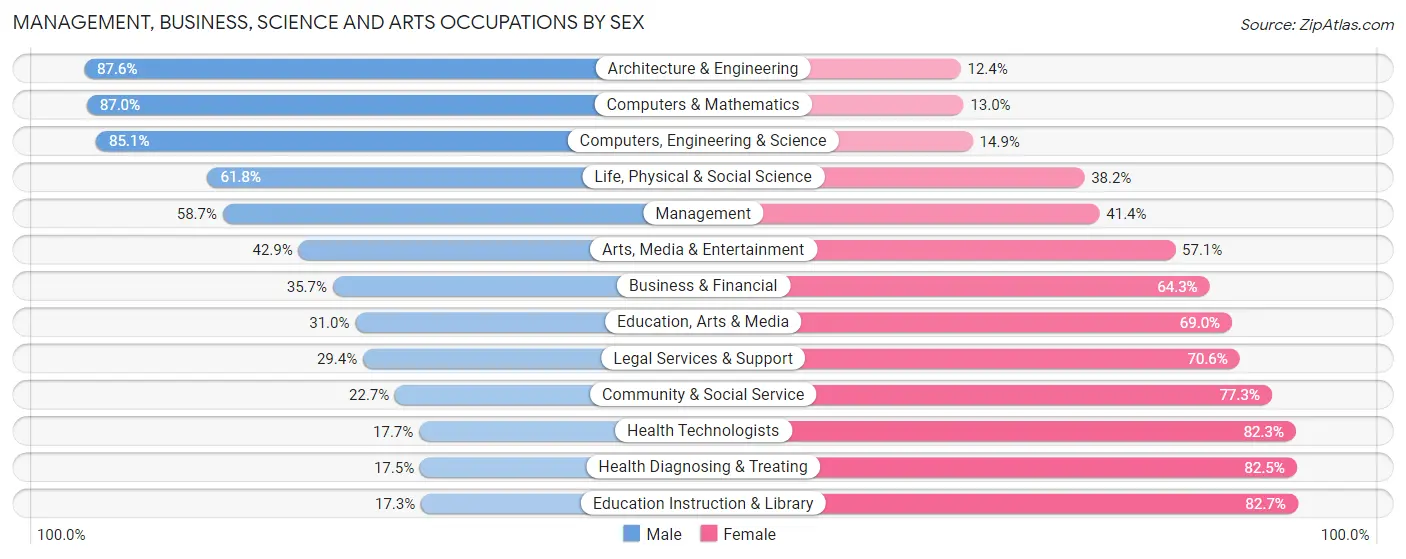
Management, Business, Science and Arts Occupations by Sex
Within the Management, Business, Science and Arts occupations in Newaygo County, the most male-oriented occupations are Architecture & Engineering (87.6%), Computers & Mathematics (87.0%), and Computers, Engineering & Science (85.1%), while the most female-oriented occupations are Education Instruction & Library (82.7%), Health Diagnosing & Treating (82.5%), and Health Technologists (82.3%).
| Occupation | Male | Female |
| Management | 1,139 (58.7%) | 803 (41.3%) |
| Business & Financial | 261 (35.7%) | 470 (64.3%) |
| Computers, Engineering & Science | 525 (85.1%) | 92 (14.9%) |
| Computers & Mathematics | 201 (87.0%) | 30 (13.0%) |
| Architecture & Engineering | 290 (87.6%) | 41 (12.4%) |
| Life, Physical & Social Science | 34 (61.8%) | 21 (38.2%) |
| Community & Social Service | 405 (22.7%) | 1,378 (77.3%) |
| Education, Arts & Media | 98 (31.0%) | 218 (69.0%) |
| Legal Services & Support | 25 (29.4%) | 60 (70.6%) |
| Education Instruction & Library | 210 (17.3%) | 1,004 (82.7%) |
| Arts, Media & Entertainment | 72 (42.9%) | 96 (57.1%) |
| Health Diagnosing & Treating | 167 (17.5%) | 786 (82.5%) |
| Health Technologists | 94 (17.7%) | 437 (82.3%) |
| Total (Category) | 2,497 (41.4%) | 3,529 (58.6%) |
| Total (Overall) | 11,385 (52.8%) | 10,175 (47.2%) |
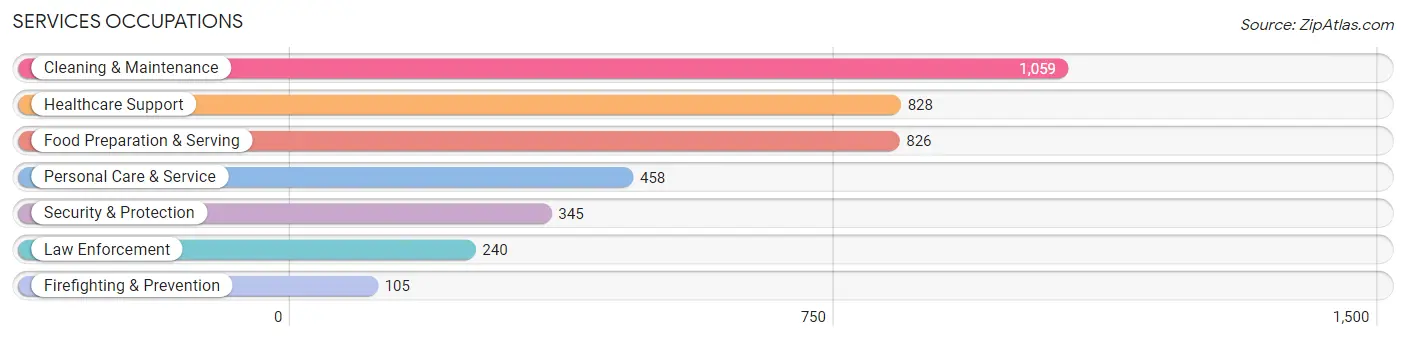
Services Occupations
The most common Services occupations in Newaygo County are Cleaning & Maintenance (1,059 | 4.9%), Healthcare Support (828 | 3.8%), Food Preparation & Serving (826 | 3.8%), Personal Care & Service (458 | 2.1%), and Security & Protection (345 | 1.6%).
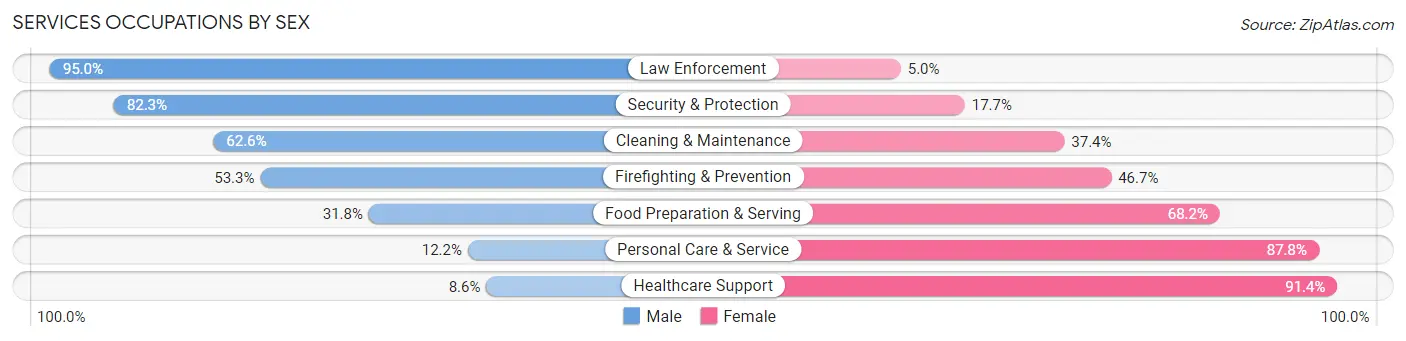
Services Occupations by Sex
Within the Services occupations in Newaygo County, the most male-oriented occupations are Law Enforcement (95.0%), Security & Protection (82.3%), and Cleaning & Maintenance (62.6%), while the most female-oriented occupations are Healthcare Support (91.4%), Personal Care & Service (87.8%), and Food Preparation & Serving (68.2%).
| Occupation | Male | Female |
| Healthcare Support | 71 (8.6%) | 757 (91.4%) |
| Security & Protection | 284 (82.3%) | 61 (17.7%) |
| Firefighting & Prevention | 56 (53.3%) | 49 (46.7%) |
| Law Enforcement | 228 (95.0%) | 12 (5.0%) |
| Food Preparation & Serving | 263 (31.8%) | 563 (68.2%) |
| Cleaning & Maintenance | 663 (62.6%) | 396 (37.4%) |
| Personal Care & Service | 56 (12.2%) | 402 (87.8%) |
| Total (Category) | 1,337 (38.0%) | 2,179 (62.0%) |
| Total (Overall) | 11,385 (52.8%) | 10,175 (47.2%) |
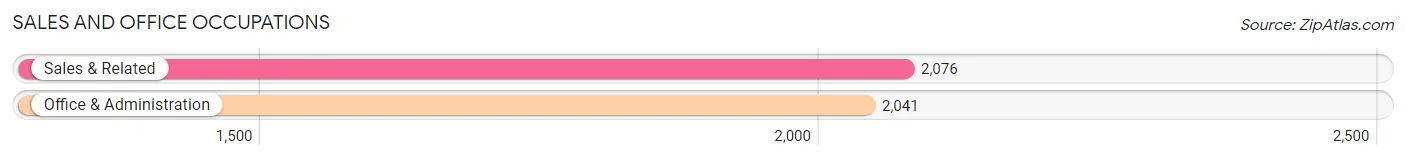
Sales and Office Occupations
The most common Sales and Office occupations in Newaygo County are Sales & Related (2,076 | 9.6%), and Office & Administration (2,041 | 9.5%).
Sales and Office Occupations by Sex
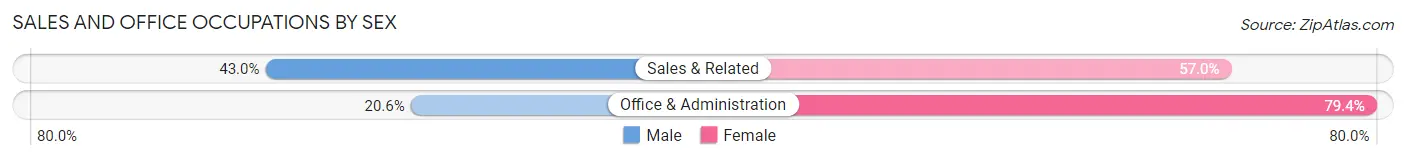
| Occupation | Male | Female |
| Sales & Related | 892 (43.0%) | 1,184 (57.0%) |
| Office & Administration | 421 (20.6%) | 1,620 (79.4%) |
| Total (Category) | 1,313 (31.9%) | 2,804 (68.1%) |
| Total (Overall) | 11,385 (52.8%) | 10,175 (47.2%) |
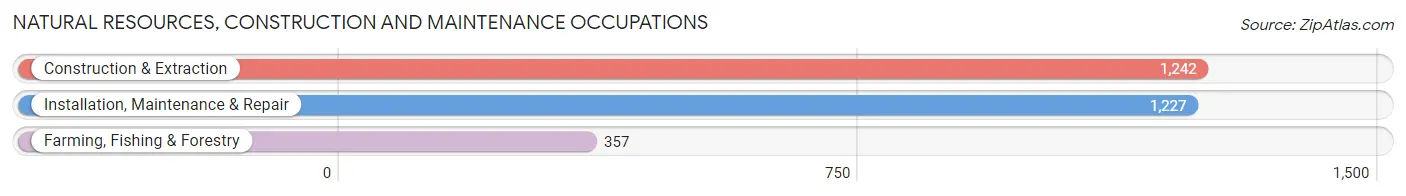
Natural Resources, Construction and Maintenance Occupations
The most common Natural Resources, Construction and Maintenance occupations in Newaygo County are Construction & Extraction (1,242 | 5.8%), Installation, Maintenance & Repair (1,227 | 5.7%), and Farming, Fishing & Forestry (357 | 1.7%).
Natural Resources, Construction and Maintenance Occupations by Sex
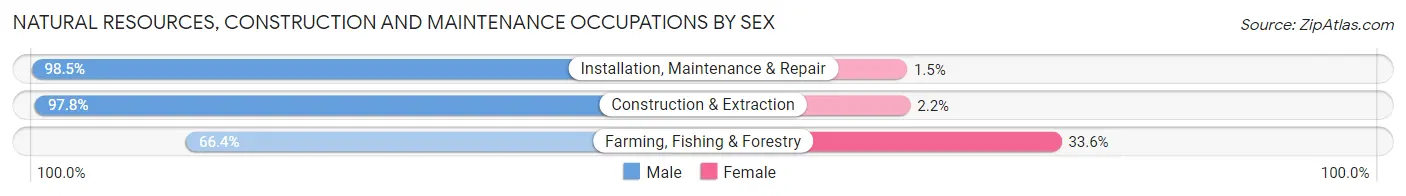
| Occupation | Male | Female |
| Farming, Fishing & Forestry | 237 (66.4%) | 120 (33.6%) |
| Construction & Extraction | 1,215 (97.8%) | 27 (2.2%) |
| Installation, Maintenance & Repair | 1,209 (98.5%) | 18 (1.5%) |
| Total (Category) | 2,661 (94.2%) | 165 (5.8%) |
| Total (Overall) | 11,385 (52.8%) | 10,175 (47.2%) |
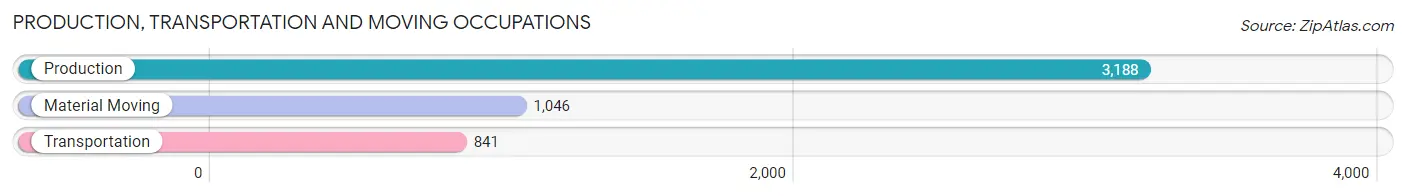
Production, Transportation and Moving Occupations
The most common Production, Transportation and Moving occupations in Newaygo County are Production (3,188 | 14.8%), Material Moving (1,046 | 4.9%), and Transportation (841 | 3.9%).
Production, Transportation and Moving Occupations by Sex
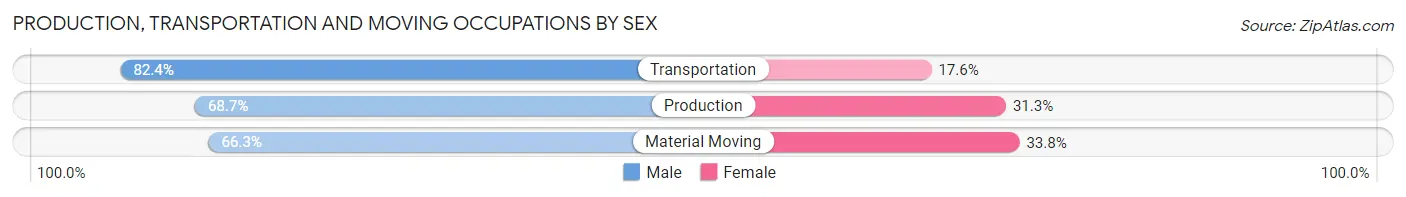
| Occupation | Male | Female |
| Production | 2,191 (68.7%) | 997 (31.3%) |
| Transportation | 693 (82.4%) | 148 (17.6%) |
| Material Moving | 693 (66.2%) | 353 (33.8%) |
| Total (Category) | 3,577 (70.5%) | 1,498 (29.5%) |
| Total (Overall) | 11,385 (52.8%) | 10,175 (47.2%) |
Employment Industries by Sex in Newaygo County
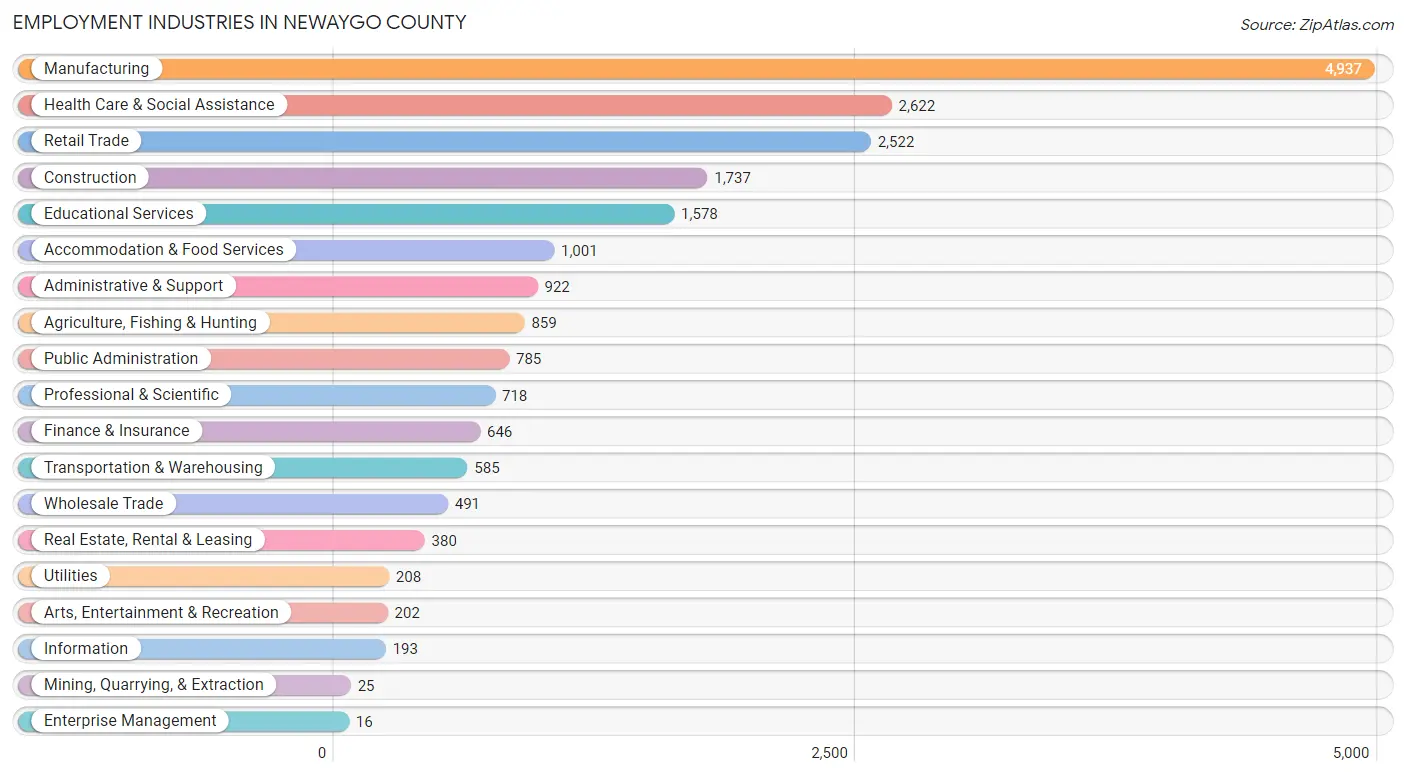
Employment Industries in Newaygo County
The major employment industries in Newaygo County include Manufacturing (4,937 | 22.9%), Health Care & Social Assistance (2,622 | 12.2%), Retail Trade (2,522 | 11.7%), Construction (1,737 | 8.1%), and Educational Services (1,578 | 7.3%).
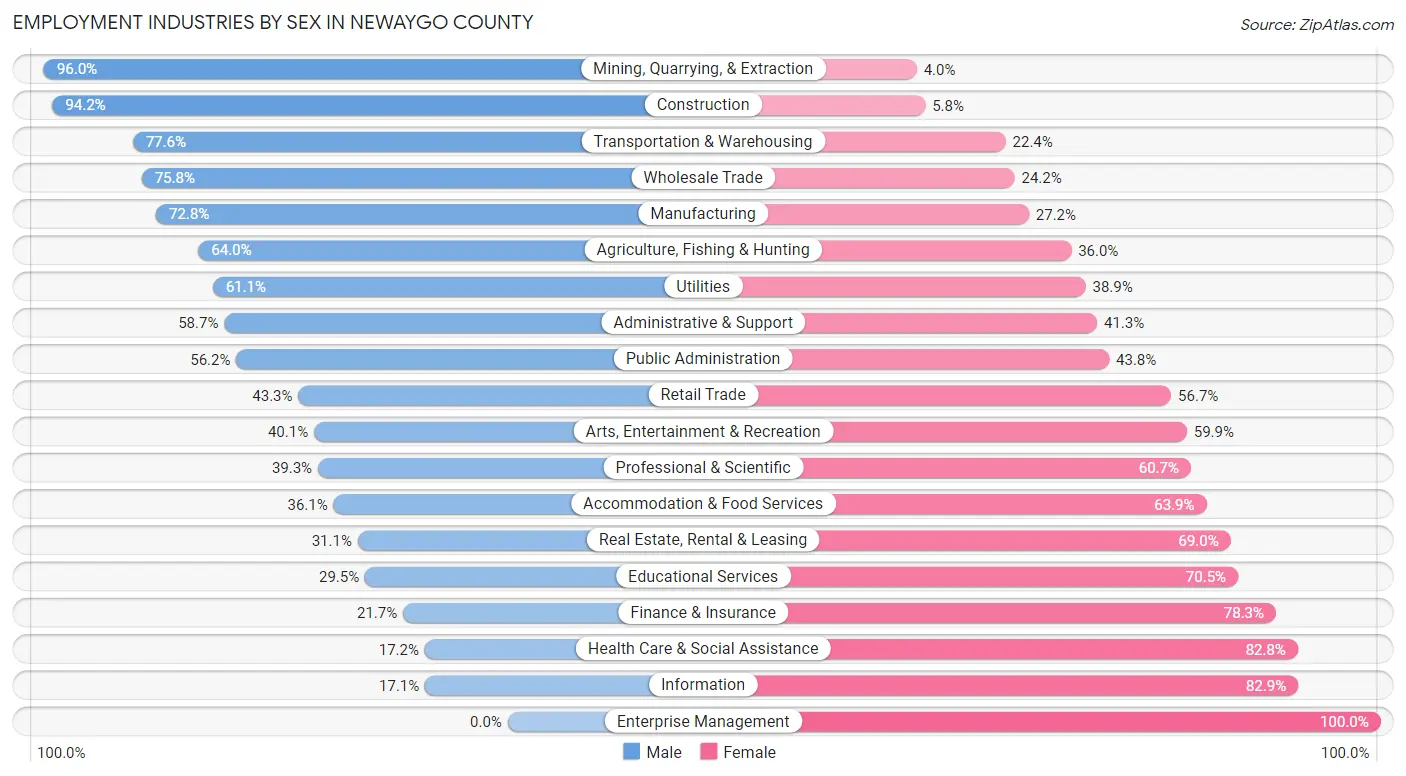
Employment Industries by Sex in Newaygo County
The Newaygo County industries that see more men than women are Mining, Quarrying, & Extraction (96.0%), Construction (94.2%), and Transportation & Warehousing (77.6%), whereas the industries that tend to have a higher number of women are Enterprise Management (100.0%), Information (82.9%), and Health Care & Social Assistance (82.8%).
| Industry | Male | Female |
| Agriculture, Fishing & Hunting | 550 (64.0%) | 309 (36.0%) |
| Mining, Quarrying, & Extraction | 24 (96.0%) | 1 (4.0%) |
| Construction | 1,637 (94.2%) | 100 (5.8%) |
| Manufacturing | 3,594 (72.8%) | 1,343 (27.2%) |
| Wholesale Trade | 372 (75.8%) | 119 (24.2%) |
| Retail Trade | 1,093 (43.3%) | 1,429 (56.7%) |
| Transportation & Warehousing | 454 (77.6%) | 131 (22.4%) |
| Utilities | 127 (61.1%) | 81 (38.9%) |
| Information | 33 (17.1%) | 160 (82.9%) |
| Finance & Insurance | 140 (21.7%) | 506 (78.3%) |
| Real Estate, Rental & Leasing | 118 (31.0%) | 262 (69.0%) |
| Professional & Scientific | 282 (39.3%) | 436 (60.7%) |
| Enterprise Management | 0 (0.0%) | 16 (100.0%) |
| Administrative & Support | 541 (58.7%) | 381 (41.3%) |
| Educational Services | 466 (29.5%) | 1,112 (70.5%) |
| Health Care & Social Assistance | 450 (17.2%) | 2,172 (82.8%) |
| Arts, Entertainment & Recreation | 81 (40.1%) | 121 (59.9%) |
| Accommodation & Food Services | 361 (36.1%) | 640 (63.9%) |
| Public Administration | 441 (56.2%) | 344 (43.8%) |
| Total | 11,385 (52.8%) | 10,175 (47.2%) |
Education in Newaygo County
School Enrollment in Newaygo County
The most common levels of schooling among the 10,287 students in Newaygo County are middle school (2,689 | 26.1%), high school (2,545 | 24.7%), and elementary school (2,281 | 22.2%).
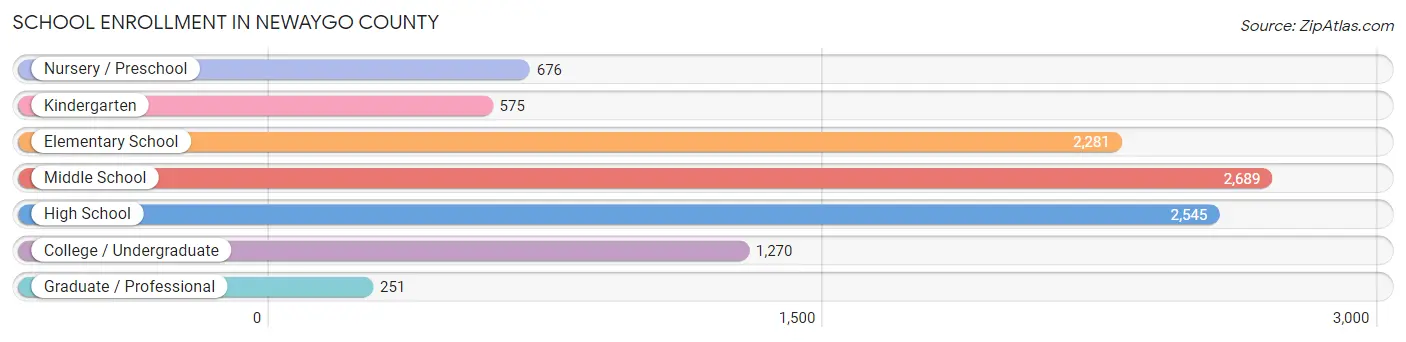
| School Level | # Students | % Students |
| Nursery / Preschool | 676 | 6.6% |
| Kindergarten | 575 | 5.6% |
| Elementary School | 2,281 | 22.2% |
| Middle School | 2,689 | 26.1% |
| High School | 2,545 | 24.7% |
| College / Undergraduate | 1,270 | 12.3% |
| Graduate / Professional | 251 | 2.4% |
| Total | 10,287 | 100.0% |
School Enrollment by Age by Funding Source in Newaygo County
Out of a total of 10,287 students who are enrolled in schools in Newaygo County, 1,605 (15.6%) attend a private institution, while the remaining 8,682 (84.4%) are enrolled in public schools. The age group of 35 years and over has the highest likelihood of being enrolled in private schools, with 163 (37.8% in the age bracket) enrolled. Conversely, the age group of 20 to 24 year olds has the lowest likelihood of being enrolled in a private school, with 480 (88.4% in the age bracket) attending a public institution.
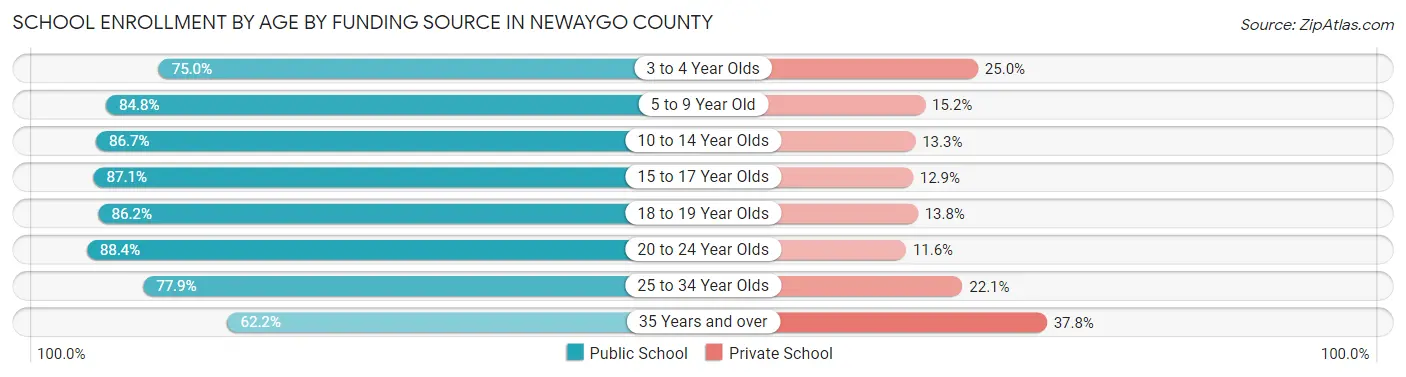
| Age Bracket | Public School | Private School |
| 3 to 4 Year Olds | 408 (75.0%) | 136 (25.0%) |
| 5 to 9 Year Old | 2,297 (84.8%) | 411 (15.2%) |
| 10 to 14 Year Olds | 2,744 (86.7%) | 422 (13.3%) |
| 15 to 17 Year Olds | 1,658 (87.1%) | 245 (12.9%) |
| 18 to 19 Year Olds | 594 (86.2%) | 95 (13.8%) |
| 20 to 24 Year Olds | 480 (88.4%) | 63 (11.6%) |
| 25 to 34 Year Olds | 236 (77.9%) | 67 (22.1%) |
| 35 Years and over | 268 (62.2%) | 163 (37.8%) |
| Total | 8,682 (84.4%) | 1,605 (15.6%) |
Educational Attainment by Field of Study in Newaygo County
Education (1,446 | 20.5%), business (1,260 | 17.8%), science & technology (1,038 | 14.7%), arts & humanities (685 | 9.7%), and engineering (435 | 6.2%) are the most common fields of study among 7,058 individuals in Newaygo County who have obtained a bachelor's degree or higher.
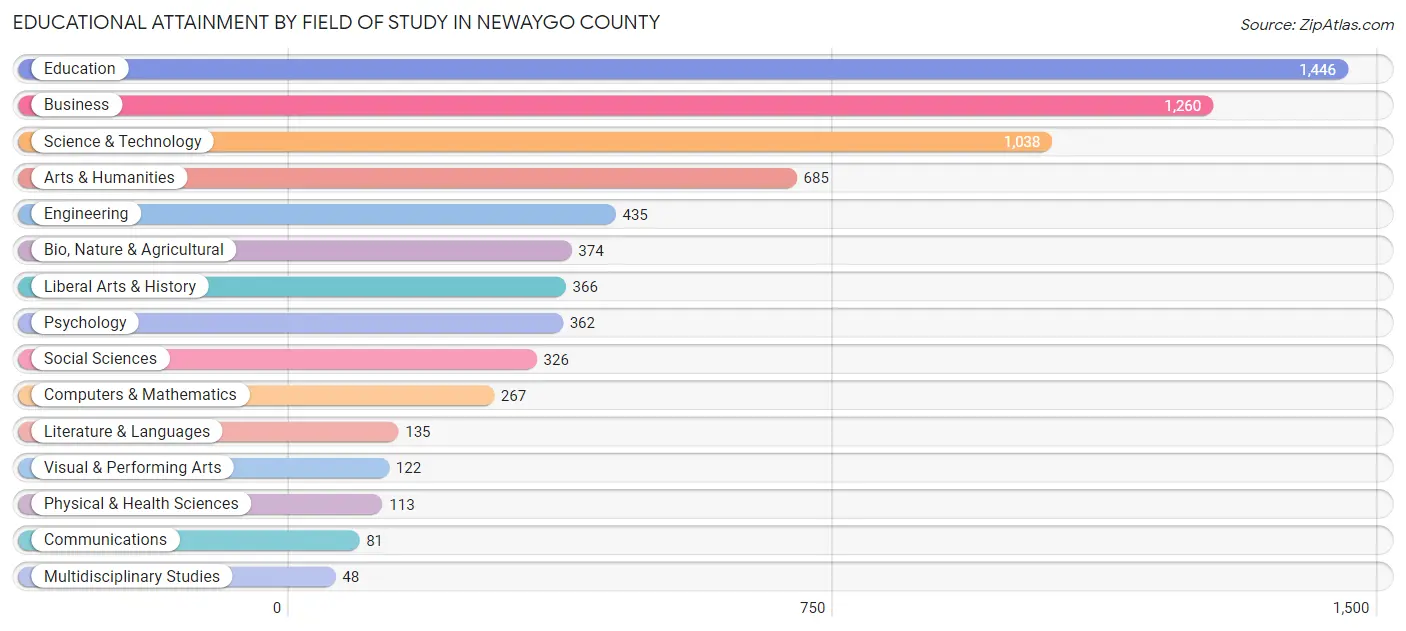
| Field of Study | # Graduates | % Graduates |
| Computers & Mathematics | 267 | 3.8% |
| Bio, Nature & Agricultural | 374 | 5.3% |
| Physical & Health Sciences | 113 | 1.6% |
| Psychology | 362 | 5.1% |
| Social Sciences | 326 | 4.6% |
| Engineering | 435 | 6.2% |
| Multidisciplinary Studies | 48 | 0.7% |
| Science & Technology | 1,038 | 14.7% |
| Business | 1,260 | 17.8% |
| Education | 1,446 | 20.5% |
| Literature & Languages | 135 | 1.9% |
| Liberal Arts & History | 366 | 5.2% |
| Visual & Performing Arts | 122 | 1.7% |
| Communications | 81 | 1.1% |
| Arts & Humanities | 685 | 9.7% |
| Total | 7,058 | 100.0% |
Transportation & Commute in Newaygo County
Vehicle Availability by Sex in Newaygo County
The most prevalent vehicle ownership categories in Newaygo County are males with 2 vehicles (4,867, accounting for 43.6%) and females with 2 vehicles (4,114, making up 48.8%).
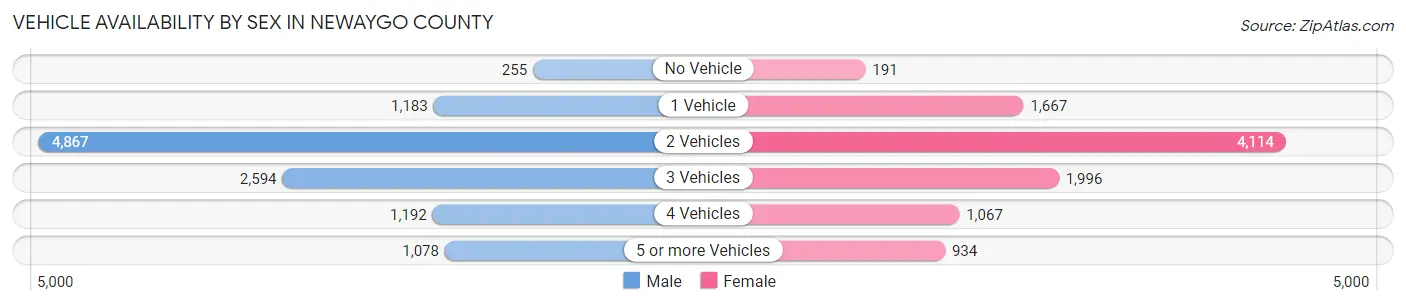
| Vehicles Available | Male | Female |
| No Vehicle | 255 (2.3%) | 191 (1.9%) |
| 1 Vehicle | 1,183 (10.6%) | 1,667 (16.7%) |
| 2 Vehicles | 4,867 (43.6%) | 4,114 (41.3%) |
| 3 Vehicles | 2,594 (23.2%) | 1,996 (20.0%) |
| 4 Vehicles | 1,192 (10.7%) | 1,067 (10.7%) |
| 5 or more Vehicles | 1,078 (9.7%) | 934 (9.4%) |
| Total | 11,169 (100.0%) | 9,969 (100.0%) |
Commute Time in Newaygo County
The most frequently occuring commute durations in Newaygo County are 15 to 19 minutes (2,719 commuters, 13.7%), 45 to 59 minutes (2,524 commuters, 12.7%), and 5 to 9 minutes (2,410 commuters, 12.1%).
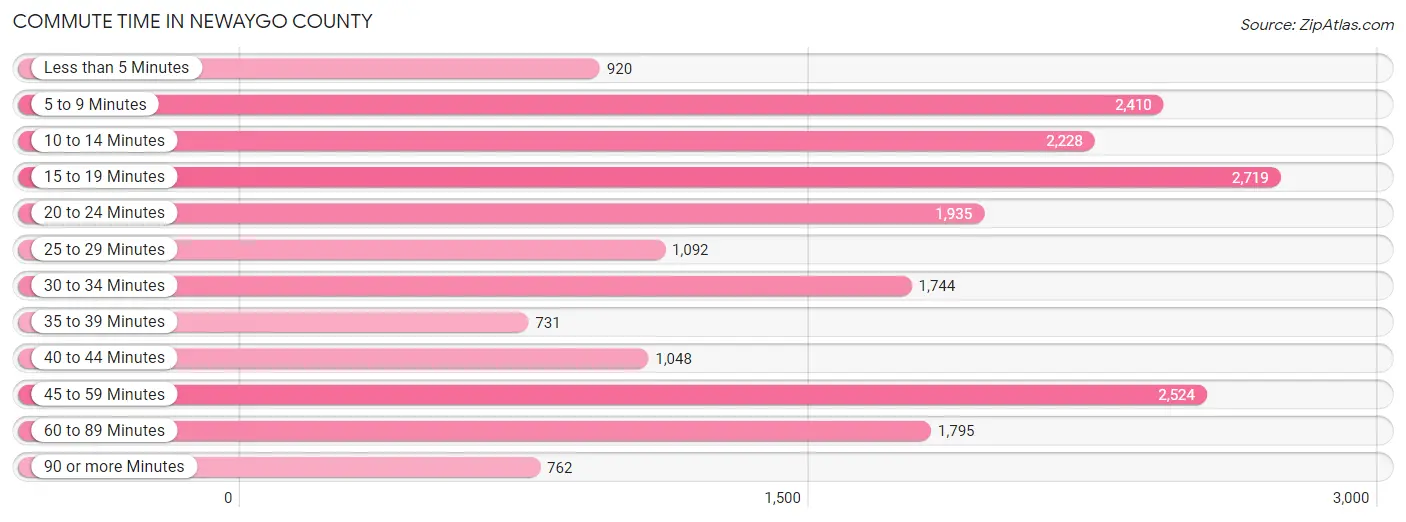
| Commute Time | # Commuters | % Commuters |
| Less than 5 Minutes | 920 | 4.6% |
| 5 to 9 Minutes | 2,410 | 12.1% |
| 10 to 14 Minutes | 2,228 | 11.2% |
| 15 to 19 Minutes | 2,719 | 13.7% |
| 20 to 24 Minutes | 1,935 | 9.7% |
| 25 to 29 Minutes | 1,092 | 5.5% |
| 30 to 34 Minutes | 1,744 | 8.8% |
| 35 to 39 Minutes | 731 | 3.7% |
| 40 to 44 Minutes | 1,048 | 5.3% |
| 45 to 59 Minutes | 2,524 | 12.7% |
| 60 to 89 Minutes | 1,795 | 9.0% |
| 90 or more Minutes | 762 | 3.8% |
Commute Time by Sex in Newaygo County
The most common commute times in Newaygo County are 45 to 59 minutes (1,818 commuters, 17.0%) for males and 15 to 19 minutes (1,665 commuters, 18.0%) for females.
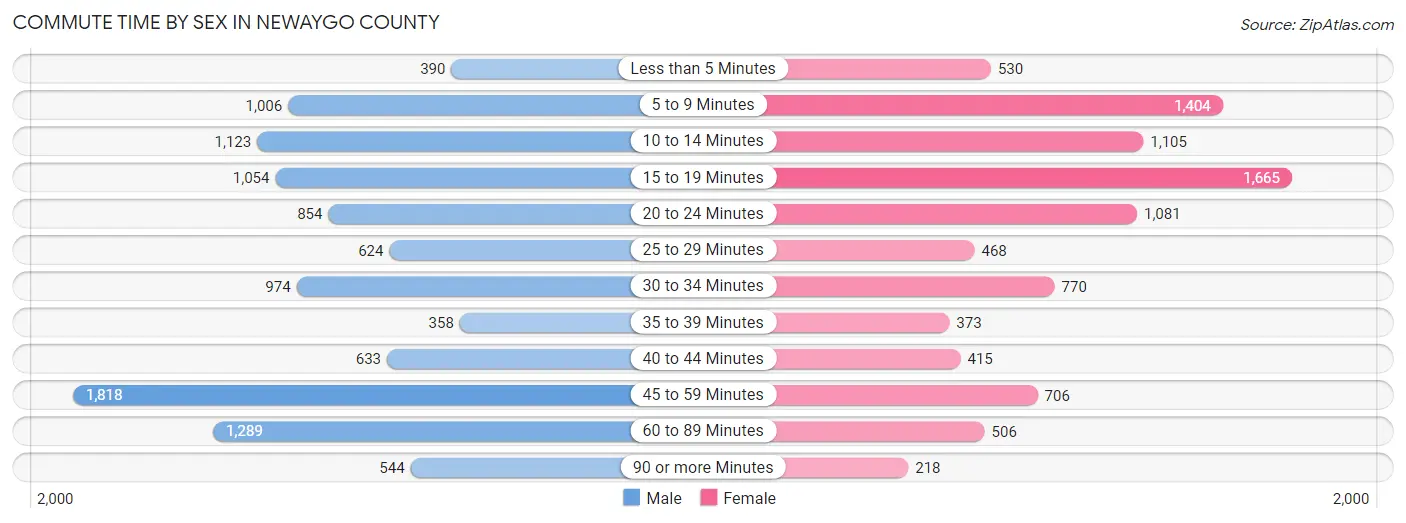
| Commute Time | Male | Female |
| Less than 5 Minutes | 390 (3.7%) | 530 (5.7%) |
| 5 to 9 Minutes | 1,006 (9.4%) | 1,404 (15.2%) |
| 10 to 14 Minutes | 1,123 (10.5%) | 1,105 (12.0%) |
| 15 to 19 Minutes | 1,054 (9.9%) | 1,665 (18.0%) |
| 20 to 24 Minutes | 854 (8.0%) | 1,081 (11.7%) |
| 25 to 29 Minutes | 624 (5.9%) | 468 (5.1%) |
| 30 to 34 Minutes | 974 (9.1%) | 770 (8.3%) |
| 35 to 39 Minutes | 358 (3.4%) | 373 (4.0%) |
| 40 to 44 Minutes | 633 (5.9%) | 415 (4.5%) |
| 45 to 59 Minutes | 1,818 (17.0%) | 706 (7.6%) |
| 60 to 89 Minutes | 1,289 (12.1%) | 506 (5.5%) |
| 90 or more Minutes | 544 (5.1%) | 218 (2.4%) |
Time of Departure to Work by Sex in Newaygo County
The most frequent times of departure to work in Newaygo County are 7:00 AM to 7:29 AM (1,544, 14.5%) for males and 7:00 AM to 7:29 AM (1,983, 21.5%) for females.
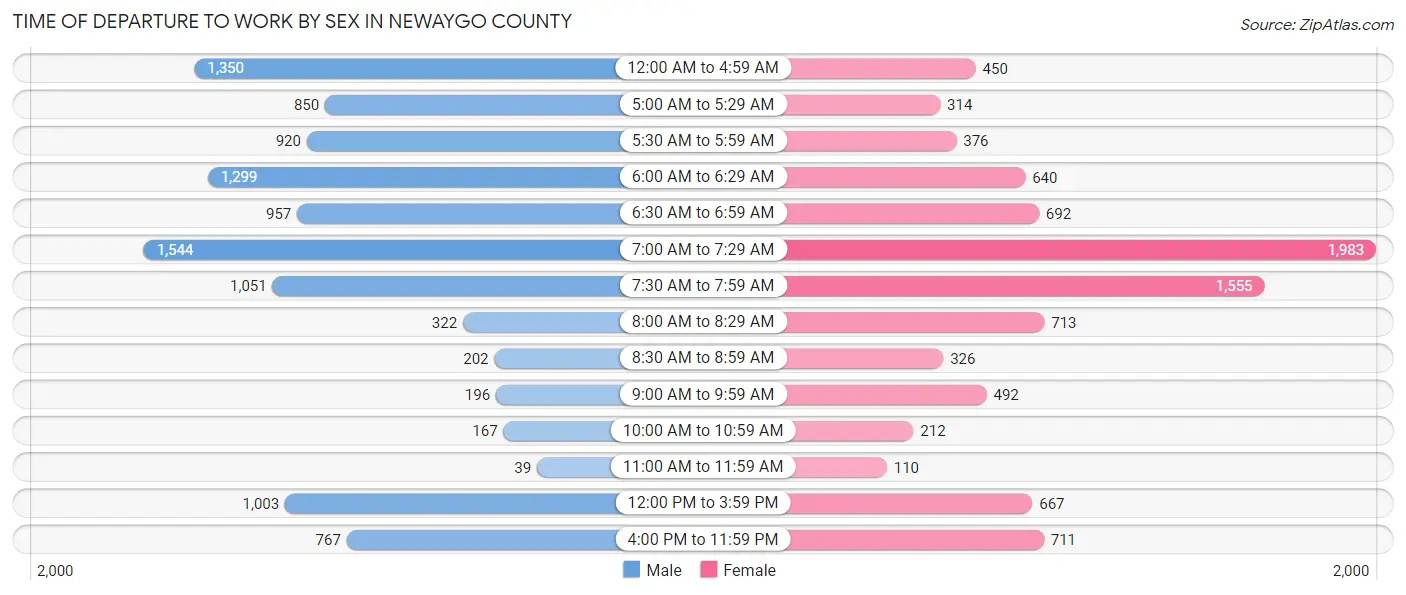
| Time of Departure | Male | Female |
| 12:00 AM to 4:59 AM | 1,350 (12.7%) | 450 (4.9%) |
| 5:00 AM to 5:29 AM | 850 (8.0%) | 314 (3.4%) |
| 5:30 AM to 5:59 AM | 920 (8.6%) | 376 (4.1%) |
| 6:00 AM to 6:29 AM | 1,299 (12.2%) | 640 (6.9%) |
| 6:30 AM to 6:59 AM | 957 (9.0%) | 692 (7.5%) |
| 7:00 AM to 7:29 AM | 1,544 (14.5%) | 1,983 (21.5%) |
| 7:30 AM to 7:59 AM | 1,051 (9.9%) | 1,555 (16.8%) |
| 8:00 AM to 8:29 AM | 322 (3.0%) | 713 (7.7%) |
| 8:30 AM to 8:59 AM | 202 (1.9%) | 326 (3.5%) |
| 9:00 AM to 9:59 AM | 196 (1.8%) | 492 (5.3%) |
| 10:00 AM to 10:59 AM | 167 (1.6%) | 212 (2.3%) |
| 11:00 AM to 11:59 AM | 39 (0.4%) | 110 (1.2%) |
| 12:00 PM to 3:59 PM | 1,003 (9.4%) | 667 (7.2%) |
| 4:00 PM to 11:59 PM | 767 (7.2%) | 711 (7.7%) |
| Total | 10,667 (100.0%) | 9,241 (100.0%) |
Housing Occupancy in Newaygo County
Occupancy by Ownership in Newaygo County
Of the total 19,047 dwellings in Newaygo County, owner-occupied units account for 16,297 (85.6%), while renter-occupied units make up 2,750 (14.4%).
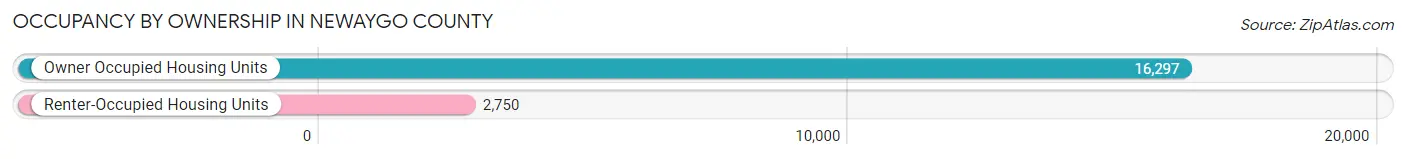
| Occupancy | # Housing Units | % Housing Units |
| Owner Occupied Housing Units | 16,297 | 85.6% |
| Renter-Occupied Housing Units | 2,750 | 14.4% |
| Total Occupied Housing Units | 19,047 | 100.0% |
Occupancy by Household Size in Newaygo County
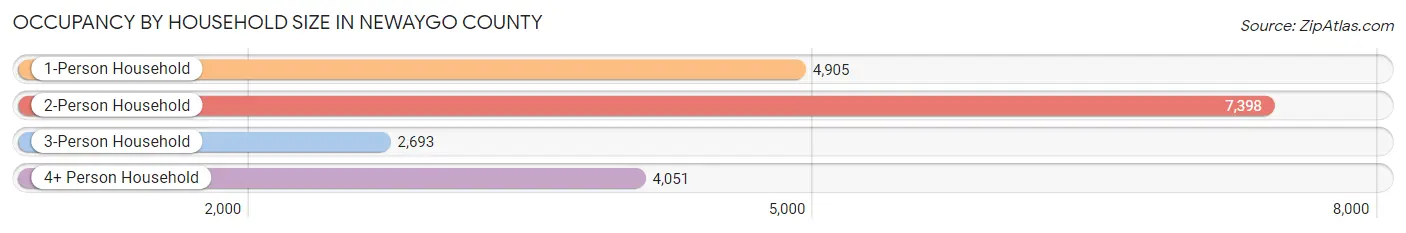
| Household Size | # Housing Units | % Housing Units |
| 1-Person Household | 4,905 | 25.8% |
| 2-Person Household | 7,398 | 38.8% |
| 3-Person Household | 2,693 | 14.1% |
| 4+ Person Household | 4,051 | 21.3% |
| Total Housing Units | 19,047 | 100.0% |
Occupancy by Ownership by Household Size in Newaygo County
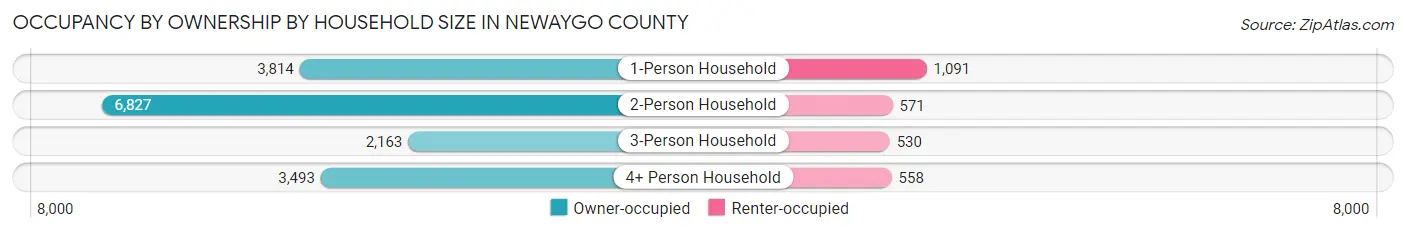
| Household Size | Owner-occupied | Renter-occupied |
| 1-Person Household | 3,814 (77.8%) | 1,091 (22.2%) |
| 2-Person Household | 6,827 (92.3%) | 571 (7.7%) |
| 3-Person Household | 2,163 (80.3%) | 530 (19.7%) |
| 4+ Person Household | 3,493 (86.2%) | 558 (13.8%) |
| Total Housing Units | 16,297 (85.6%) | 2,750 (14.4%) |
Occupancy by Educational Attainment in Newaygo County
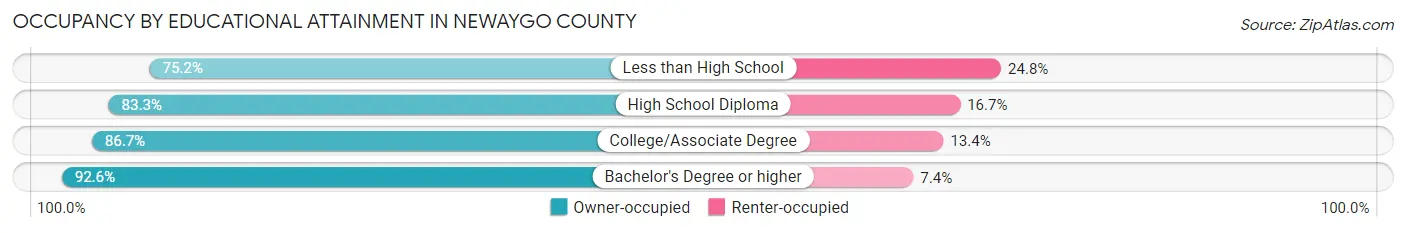
| Household Size | Owner-occupied | Renter-occupied |
| Less than High School | 1,275 (75.2%) | 420 (24.8%) |
| High School Diploma | 5,979 (83.3%) | 1,196 (16.7%) |
| College/Associate Degree | 5,556 (86.7%) | 856 (13.4%) |
| Bachelor's Degree or higher | 3,487 (92.6%) | 278 (7.4%) |
Occupancy by Age of Householder in Newaygo County
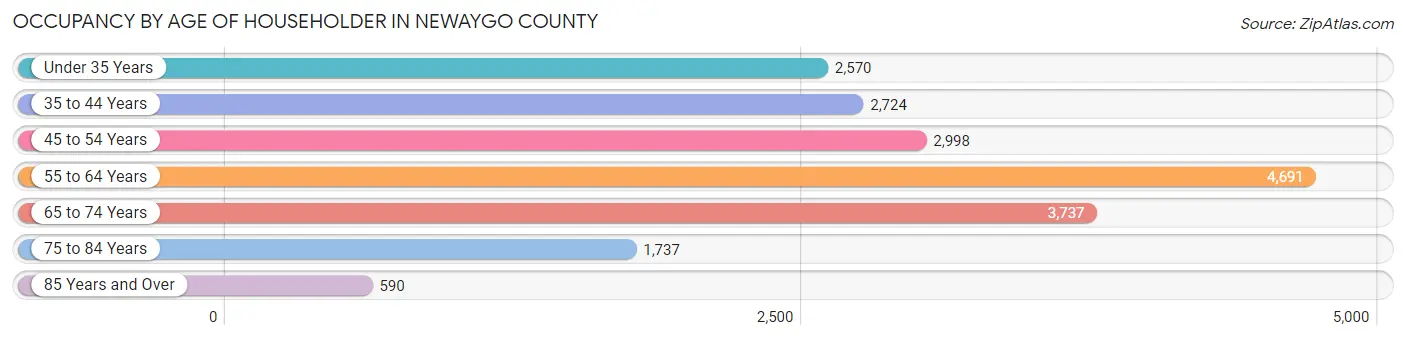
| Age Bracket | # Households | % Households |
| Under 35 Years | 2,570 | 13.5% |
| 35 to 44 Years | 2,724 | 14.3% |
| 45 to 54 Years | 2,998 | 15.7% |
| 55 to 64 Years | 4,691 | 24.6% |
| 65 to 74 Years | 3,737 | 19.6% |
| 75 to 84 Years | 1,737 | 9.1% |
| 85 Years and Over | 590 | 3.1% |
| Total | 19,047 | 100.0% |
Housing Finances in Newaygo County
Median Income by Occupancy in Newaygo County
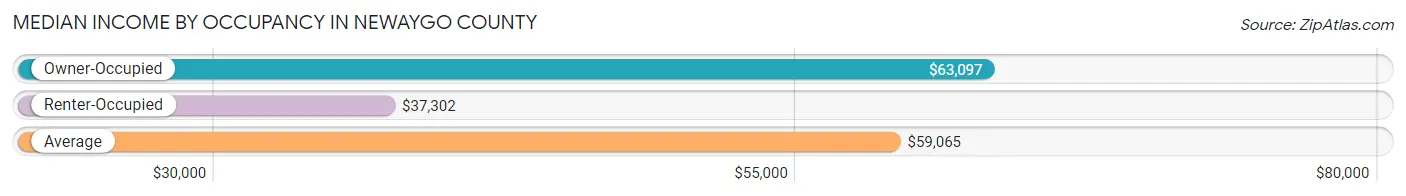
| Occupancy Type | # Households | Median Income |
| Owner-Occupied | 16,297 (85.6%) | $63,097 |
| Renter-Occupied | 2,750 (14.4%) | $37,302 |
| Average | 19,047 (100.0%) | $59,065 |
Occupancy by Householder Income Bracket in Newaygo County
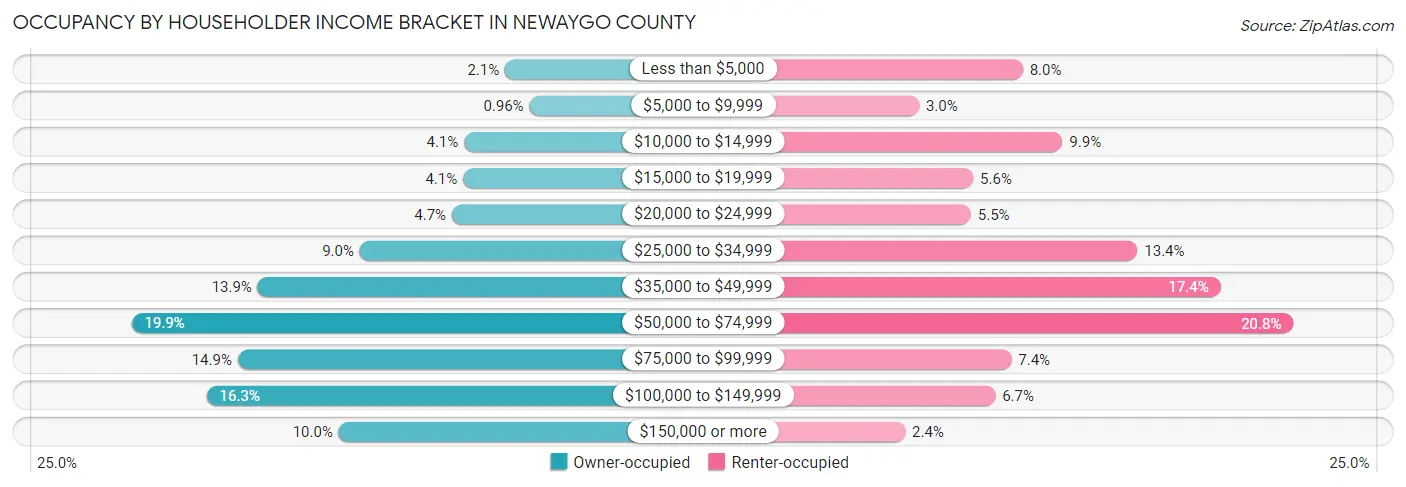
| Income Bracket | Owner-occupied | Renter-occupied |
| Less than $5,000 | 346 (2.1%) | 219 (8.0%) |
| $5,000 to $9,999 | 157 (1.0%) | 83 (3.0%) |
| $10,000 to $14,999 | 663 (4.1%) | 271 (9.9%) |
| $15,000 to $19,999 | 671 (4.1%) | 154 (5.6%) |
| $20,000 to $24,999 | 757 (4.6%) | 151 (5.5%) |
| $25,000 to $34,999 | 1,474 (9.0%) | 369 (13.4%) |
| $35,000 to $49,999 | 2,266 (13.9%) | 478 (17.4%) |
| $50,000 to $74,999 | 3,245 (19.9%) | 573 (20.8%) |
| $75,000 to $99,999 | 2,420 (14.8%) | 204 (7.4%) |
| $100,000 to $149,999 | 2,661 (16.3%) | 183 (6.7%) |
| $150,000 or more | 1,637 (10.0%) | 65 (2.4%) |
| Total | 16,297 (100.0%) | 2,750 (100.0%) |
Monthly Housing Cost Tiers in Newaygo County
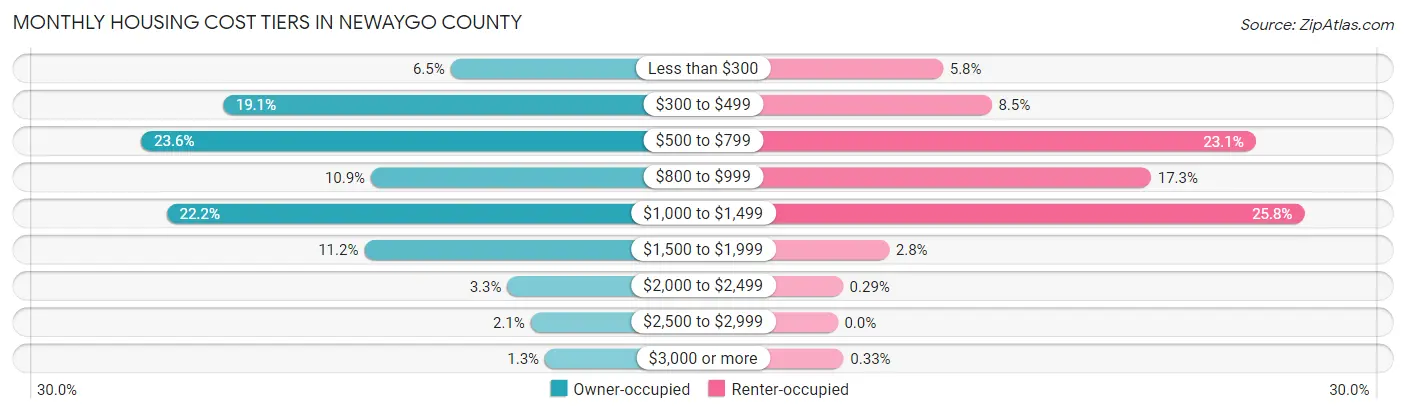
| Monthly Cost | Owner-occupied | Renter-occupied |
| Less than $300 | 1,054 (6.5%) | 160 (5.8%) |
| $300 to $499 | 3,105 (19.1%) | 234 (8.5%) |
| $500 to $799 | 3,840 (23.6%) | 635 (23.1%) |
| $800 to $999 | 1,771 (10.9%) | 476 (17.3%) |
| $1,000 to $1,499 | 3,611 (22.2%) | 709 (25.8%) |
| $1,500 to $1,999 | 1,832 (11.2%) | 78 (2.8%) |
| $2,000 to $2,499 | 544 (3.3%) | 8 (0.3%) |
| $2,500 to $2,999 | 334 (2.1%) | 0 (0.0%) |
| $3,000 or more | 206 (1.3%) | 9 (0.3%) |
| Total | 16,297 (100.0%) | 2,750 (100.0%) |
Physical Housing Characteristics in Newaygo County
Housing Structures in Newaygo County
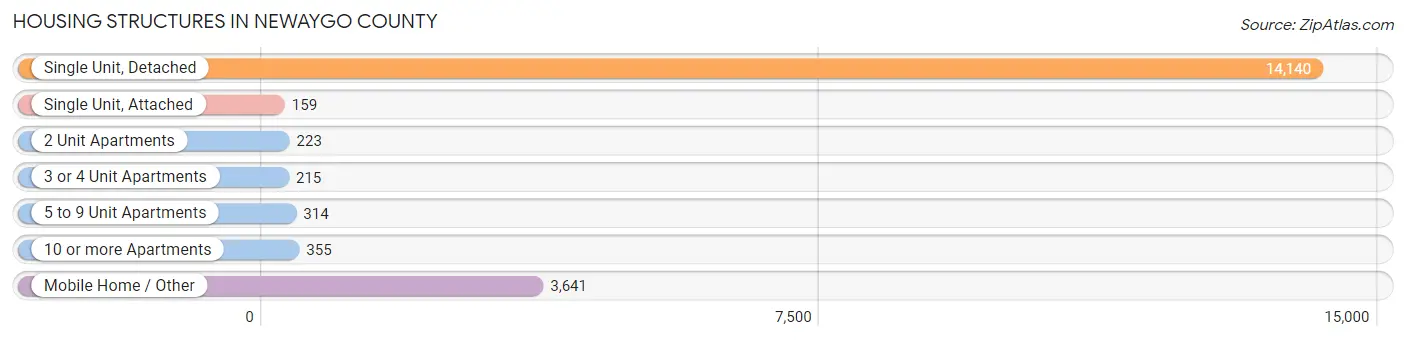
| Structure Type | # Housing Units | % Housing Units |
| Single Unit, Detached | 14,140 | 74.2% |
| Single Unit, Attached | 159 | 0.8% |
| 2 Unit Apartments | 223 | 1.2% |
| 3 or 4 Unit Apartments | 215 | 1.1% |
| 5 to 9 Unit Apartments | 314 | 1.7% |
| 10 or more Apartments | 355 | 1.9% |
| Mobile Home / Other | 3,641 | 19.1% |
| Total | 19,047 | 100.0% |
Housing Structures by Occupancy in Newaygo County
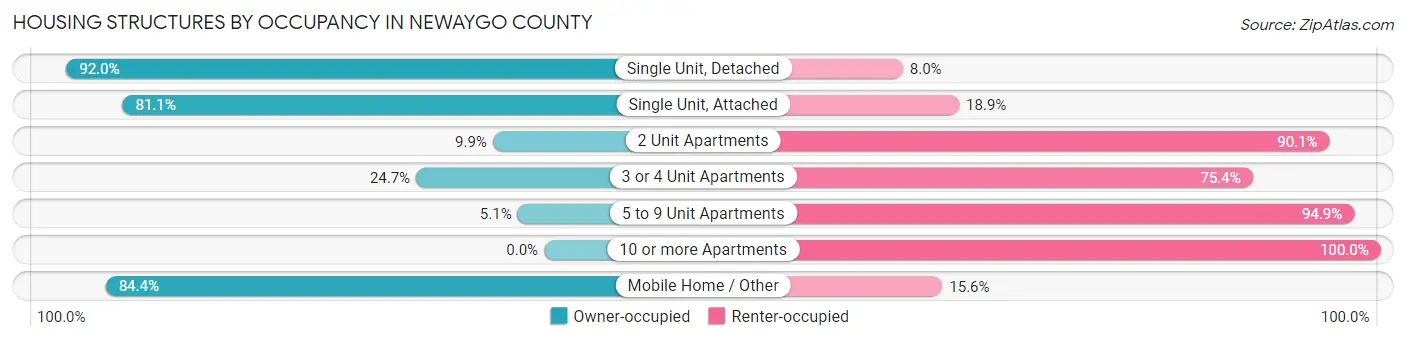
| Structure Type | Owner-occupied | Renter-occupied |
| Single Unit, Detached | 13,005 (92.0%) | 1,135 (8.0%) |
| Single Unit, Attached | 129 (81.1%) | 30 (18.9%) |
| 2 Unit Apartments | 22 (9.9%) | 201 (90.1%) |
| 3 or 4 Unit Apartments | 53 (24.6%) | 162 (75.3%) |
| 5 to 9 Unit Apartments | 16 (5.1%) | 298 (94.9%) |
| 10 or more Apartments | 0 (0.0%) | 355 (100.0%) |
| Mobile Home / Other | 3,072 (84.4%) | 569 (15.6%) |
| Total | 16,297 (85.6%) | 2,750 (14.4%) |
Housing Structures by Number of Rooms in Newaygo County
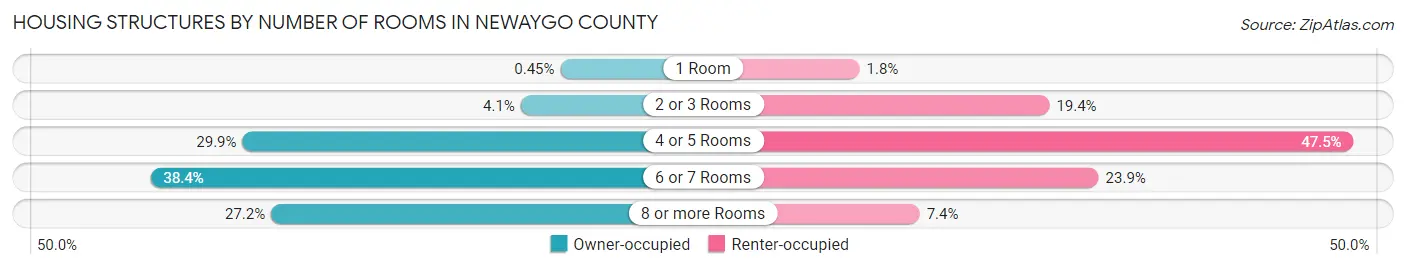
| Number of Rooms | Owner-occupied | Renter-occupied |
| 1 Room | 74 (0.4%) | 50 (1.8%) |
| 2 or 3 Rooms | 671 (4.1%) | 533 (19.4%) |
| 4 or 5 Rooms | 4,867 (29.9%) | 1,306 (47.5%) |
| 6 or 7 Rooms | 6,251 (38.4%) | 658 (23.9%) |
| 8 or more Rooms | 4,434 (27.2%) | 203 (7.4%) |
| Total | 16,297 (100.0%) | 2,750 (100.0%) |
Housing Structure by Heating Type in Newaygo County
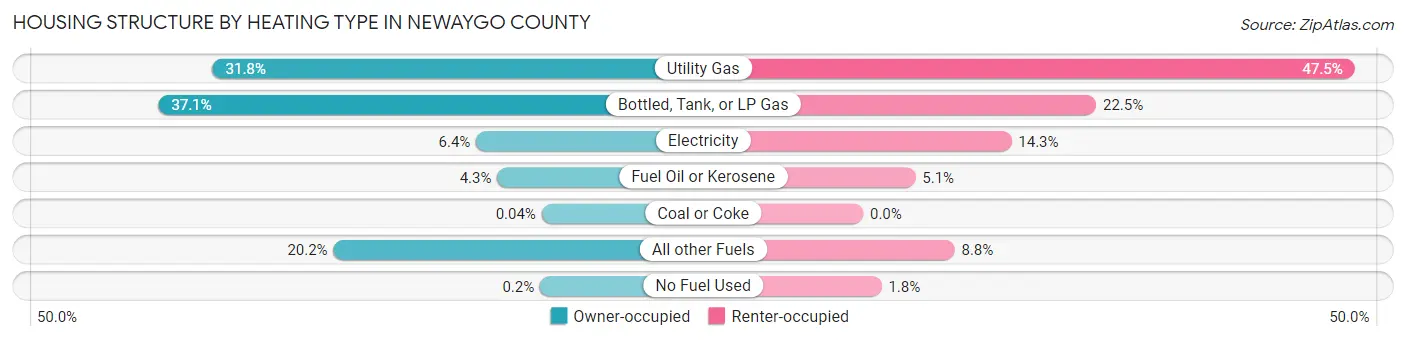
| Heating Type | Owner-occupied | Renter-occupied |
| Utility Gas | 5,188 (31.8%) | 1,306 (47.5%) |
| Bottled, Tank, or LP Gas | 6,041 (37.1%) | 619 (22.5%) |
| Electricity | 1,038 (6.4%) | 394 (14.3%) |
| Fuel Oil or Kerosene | 705 (4.3%) | 139 (5.1%) |
| Coal or Coke | 7 (0.0%) | 0 (0.0%) |
| All other Fuels | 3,285 (20.2%) | 243 (8.8%) |
| No Fuel Used | 33 (0.2%) | 49 (1.8%) |
| Total | 16,297 (100.0%) | 2,750 (100.0%) |
Household Vehicle Usage in Newaygo County
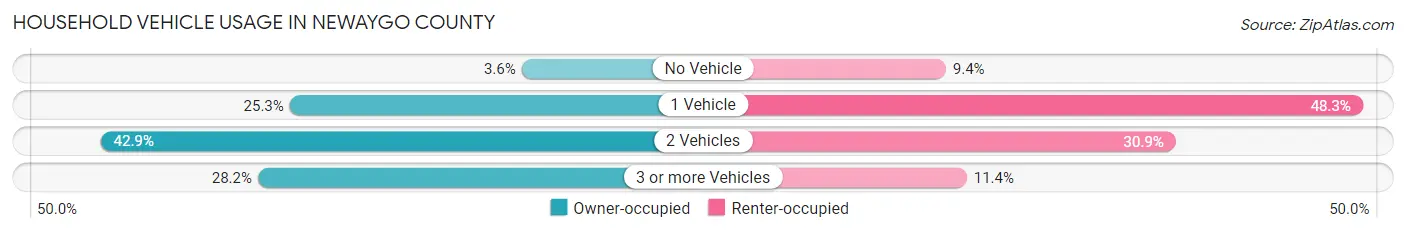
| Vehicles per Household | Owner-occupied | Renter-occupied |
| No Vehicle | 588 (3.6%) | 259 (9.4%) |
| 1 Vehicle | 4,117 (25.3%) | 1,329 (48.3%) |
| 2 Vehicles | 6,992 (42.9%) | 849 (30.9%) |
| 3 or more Vehicles | 4,600 (28.2%) | 313 (11.4%) |
| Total | 16,297 (100.0%) | 2,750 (100.0%) |
Real Estate & Mortgages in Newaygo County
Real Estate and Mortgage Overview in Newaygo County
| Characteristic | Without Mortgage | With Mortgage |
| Housing Units | 7,768 | 8,529 |
| Median Property Value | $153,300 | $171,900 |
| Median Household Income | $51,276 | $1,167 |
| Monthly Housing Costs | $491 | $199 |
| Real Estate Taxes | $1,814 | $379 |
Property Value by Mortgage Status in Newaygo County
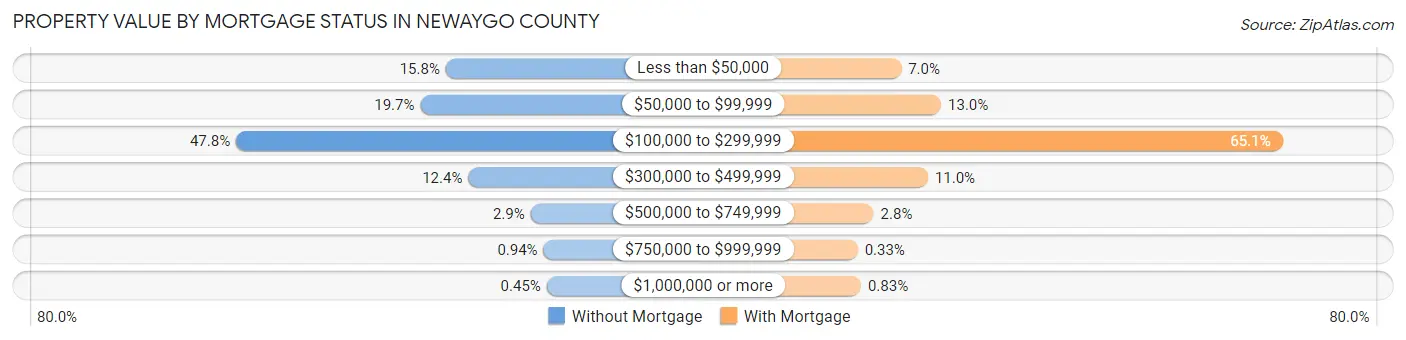
| Property Value | Without Mortgage | With Mortgage |
| Less than $50,000 | 1,230 (15.8%) | 594 (7.0%) |
| $50,000 to $99,999 | 1,530 (19.7%) | 1,112 (13.0%) |
| $100,000 to $299,999 | 3,712 (47.8%) | 5,548 (65.0%) |
| $300,000 to $499,999 | 963 (12.4%) | 941 (11.0%) |
| $500,000 to $749,999 | 225 (2.9%) | 235 (2.8%) |
| $750,000 to $999,999 | 73 (0.9%) | 28 (0.3%) |
| $1,000,000 or more | 35 (0.4%) | 71 (0.8%) |
| Total | 7,768 (100.0%) | 8,529 (100.0%) |
Household Income by Mortgage Status in Newaygo County
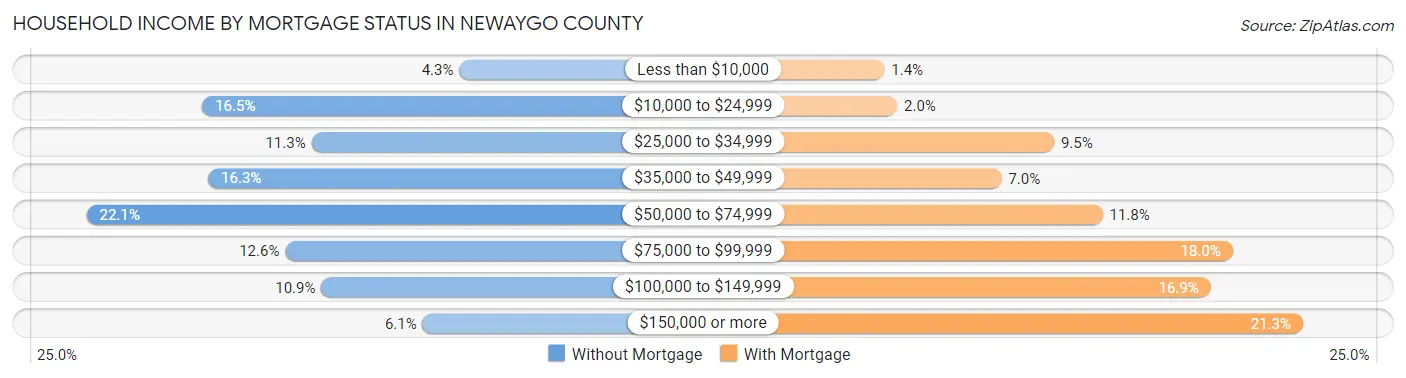
| Household Income | Without Mortgage | With Mortgage |
| Less than $10,000 | 334 (4.3%) | 117 (1.4%) |
| $10,000 to $24,999 | 1,285 (16.5%) | 169 (2.0%) |
| $25,000 to $34,999 | 881 (11.3%) | 806 (9.5%) |
| $35,000 to $49,999 | 1,263 (16.3%) | 593 (7.0%) |
| $50,000 to $74,999 | 1,713 (22.1%) | 1,003 (11.8%) |
| $75,000 to $99,999 | 978 (12.6%) | 1,532 (18.0%) |
| $100,000 to $149,999 | 844 (10.9%) | 1,442 (16.9%) |
| $150,000 or more | 470 (6.0%) | 1,817 (21.3%) |
| Total | 7,768 (100.0%) | 8,529 (100.0%) |
Property Value to Household Income Ratio in Newaygo County
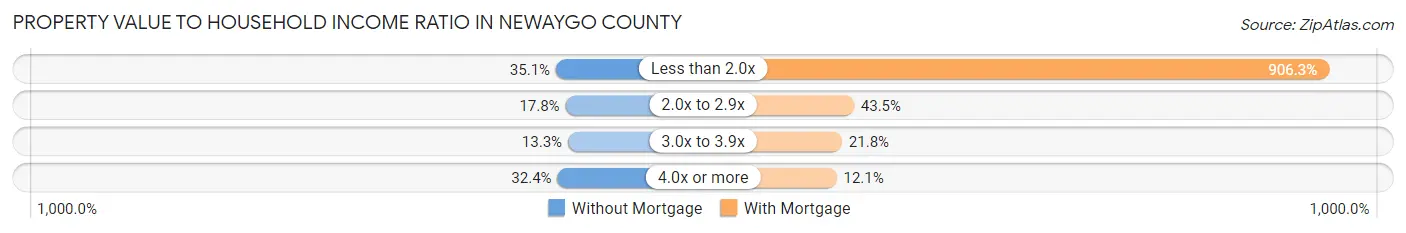
| Value-to-Income Ratio | Without Mortgage | With Mortgage |
| Less than 2.0x | 2,724 (35.1%) | 77,294 (906.2%) |
| 2.0x to 2.9x | 1,381 (17.8%) | 3,709 (43.5%) |
| 3.0x to 3.9x | 1,034 (13.3%) | 1,858 (21.8%) |
| 4.0x or more | 2,513 (32.4%) | 1,029 (12.1%) |
| Total | 7,768 (100.0%) | 8,529 (100.0%) |
Real Estate Taxes by Mortgage Status in Newaygo County
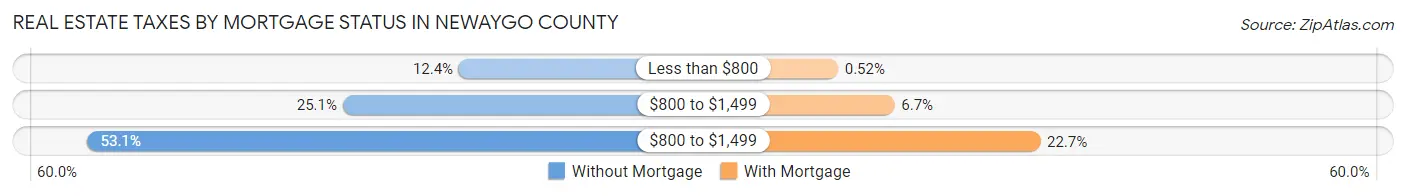
| Property Taxes | Without Mortgage | With Mortgage |
| Less than $800 | 963 (12.4%) | 44 (0.5%) |
| $800 to $1,499 | 1,952 (25.1%) | 573 (6.7%) |
| $800 to $1,499 | 4,124 (53.1%) | 1,934 (22.7%) |
| Total | 7,768 (100.0%) | 8,529 (100.0%) |
Health & Disability in Newaygo County
Health Insurance Coverage by Age in Newaygo County
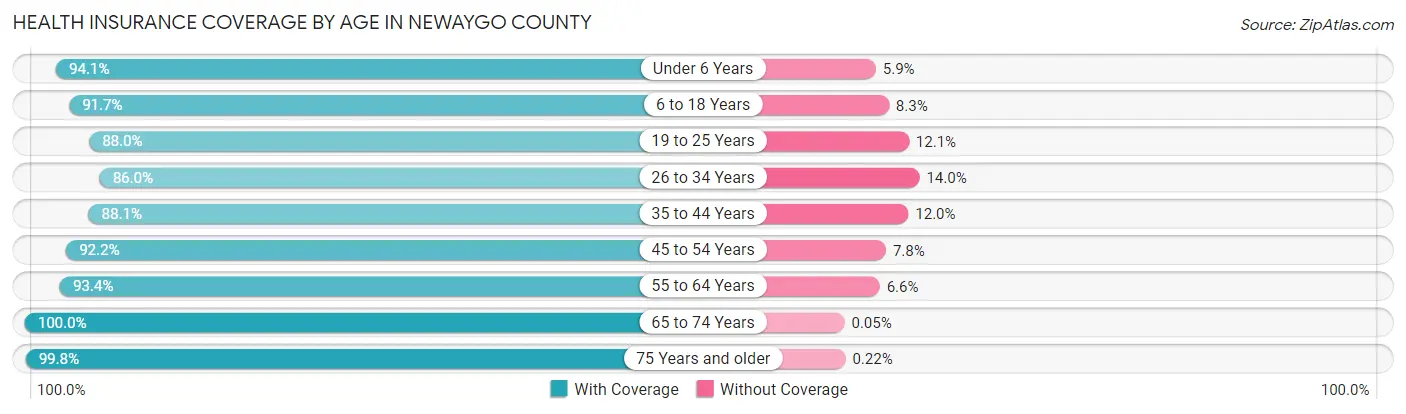
| Age Bracket | With Coverage | Without Coverage |
| Under 6 Years | 3,103 (94.1%) | 194 (5.9%) |
| 6 to 18 Years | 7,729 (91.7%) | 701 (8.3%) |
| 19 to 25 Years | 3,248 (87.9%) | 445 (12.0%) |
| 26 to 34 Years | 4,390 (86.0%) | 716 (14.0%) |
| 35 to 44 Years | 4,891 (88.0%) | 664 (11.9%) |
| 45 to 54 Years | 5,510 (92.2%) | 464 (7.8%) |
| 55 to 64 Years | 7,352 (93.4%) | 520 (6.6%) |
| 65 to 74 Years | 6,009 (100.0%) | 3 (0.1%) |
| 75 Years and older | 3,700 (99.8%) | 8 (0.2%) |
| Total | 45,932 (92.5%) | 3,715 (7.5%) |
Health Insurance Coverage by Citizenship Status in Newaygo County
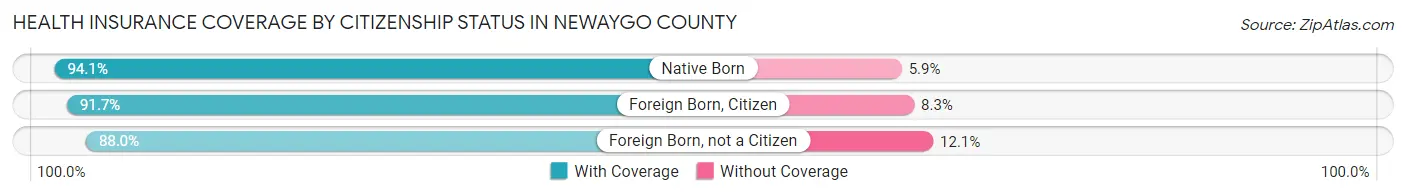
| Citizenship Status | With Coverage | Without Coverage |
| Native Born | 3,103 (94.1%) | 194 (5.9%) |
| Foreign Born, Citizen | 7,729 (91.7%) | 701 (8.3%) |
| Foreign Born, not a Citizen | 3,248 (87.9%) | 445 (12.0%) |
Health Insurance Coverage by Household Income in Newaygo County
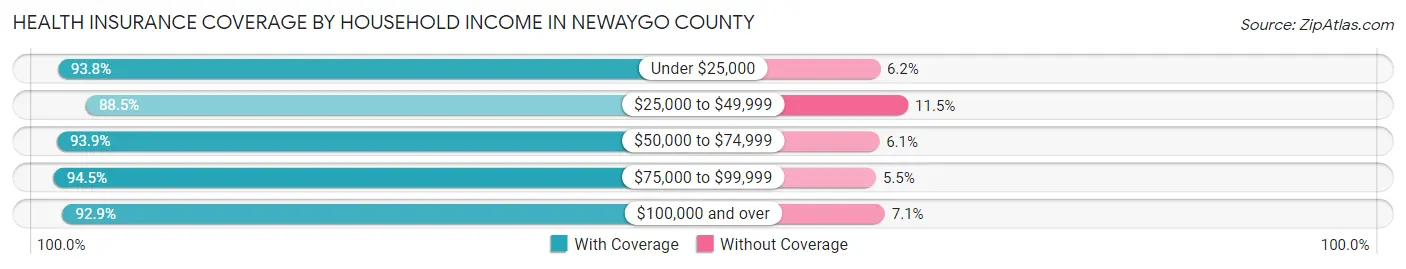
| Household Income | With Coverage | Without Coverage |
| Under $25,000 | 5,457 (93.8%) | 362 (6.2%) |
| $25,000 to $49,999 | 9,324 (88.5%) | 1,212 (11.5%) |
| $50,000 to $74,999 | 9,265 (93.9%) | 600 (6.1%) |
| $75,000 to $99,999 | 7,500 (94.5%) | 435 (5.5%) |
| $100,000 and over | 14,156 (92.9%) | 1,086 (7.1%) |
Public vs Private Health Insurance Coverage by Age in Newaygo County
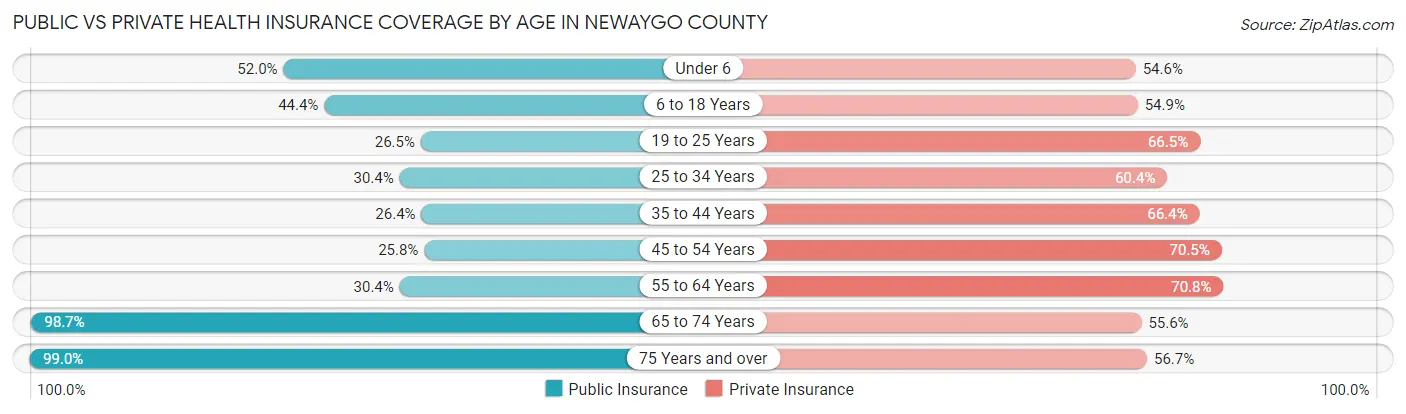
| Age Bracket | Public Insurance | Private Insurance |
| Under 6 | 1,713 (52.0%) | 1,799 (54.6%) |
| 6 to 18 Years | 3,742 (44.4%) | 4,631 (54.9%) |
| 19 to 25 Years | 977 (26.5%) | 2,455 (66.5%) |
| 25 to 34 Years | 1,552 (30.4%) | 3,084 (60.4%) |
| 35 to 44 Years | 1,464 (26.4%) | 3,688 (66.4%) |
| 45 to 54 Years | 1,543 (25.8%) | 4,211 (70.5%) |
| 55 to 64 Years | 2,392 (30.4%) | 5,573 (70.8%) |
| 65 to 74 Years | 5,936 (98.7%) | 3,344 (55.6%) |
| 75 Years and over | 3,671 (99.0%) | 2,101 (56.7%) |
| Total | 22,990 (46.3%) | 30,886 (62.2%) |
Disability Status by Sex by Age in Newaygo County
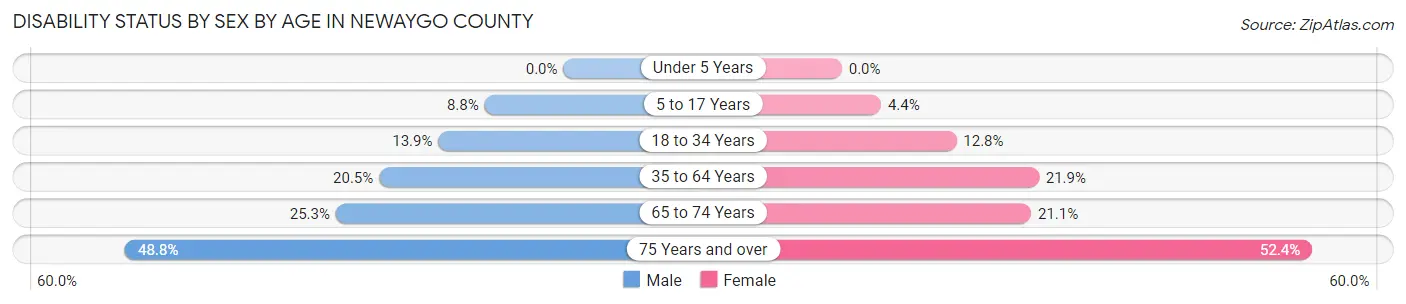
| Age Bracket | Male | Female |
| Under 5 Years | 0 (0.0%) | 0 (0.0%) |
| 5 to 17 Years | 382 (8.8%) | 174 (4.4%) |
| 18 to 34 Years | 674 (13.9%) | 586 (12.8%) |
| 35 to 64 Years | 2,037 (20.5%) | 2,079 (21.9%) |
| 65 to 74 Years | 784 (25.3%) | 615 (21.1%) |
| 75 Years and over | 782 (48.8%) | 1,103 (52.4%) |
Disability Class by Sex by Age in Newaygo County
Disability Class: Hearing Difficulty
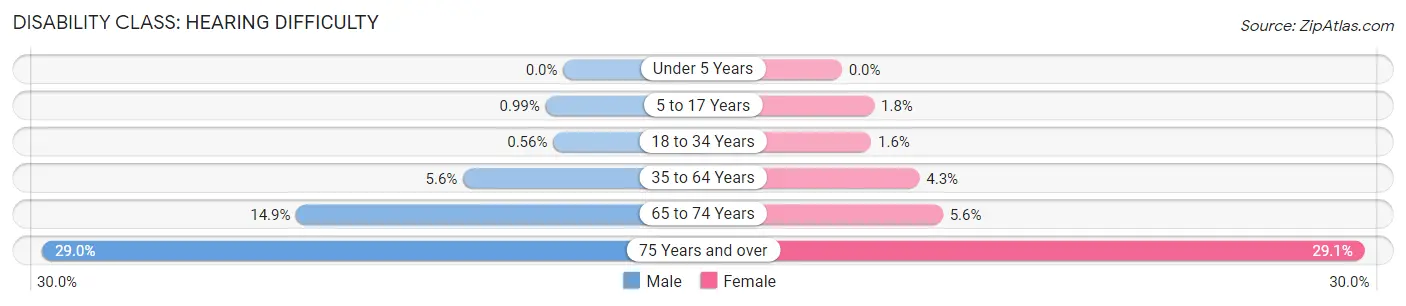
| Age Bracket | Male | Female |
| Under 5 Years | 0 (0.0%) | 0 (0.0%) |
| 5 to 17 Years | 43 (1.0%) | 72 (1.8%) |
| 18 to 34 Years | 27 (0.6%) | 75 (1.6%) |
| 35 to 64 Years | 554 (5.6%) | 409 (4.3%) |
| 65 to 74 Years | 460 (14.9%) | 164 (5.6%) |
| 75 Years and over | 465 (29.0%) | 613 (29.1%) |
Disability Class: Vision Difficulty
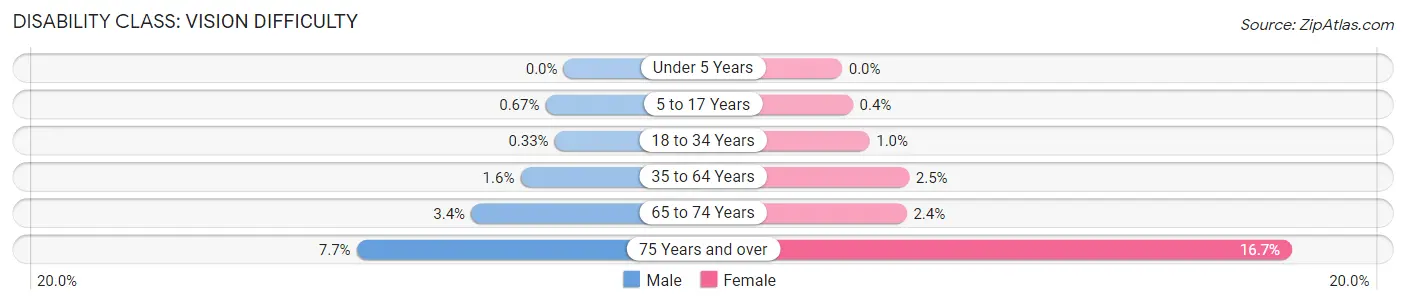
| Age Bracket | Male | Female |
| Under 5 Years | 0 (0.0%) | 0 (0.0%) |
| 5 to 17 Years | 29 (0.7%) | 16 (0.4%) |
| 18 to 34 Years | 16 (0.3%) | 47 (1.0%) |
| 35 to 64 Years | 159 (1.6%) | 236 (2.5%) |
| 65 to 74 Years | 106 (3.4%) | 70 (2.4%) |
| 75 Years and over | 123 (7.7%) | 352 (16.7%) |
Disability Class: Cognitive Difficulty
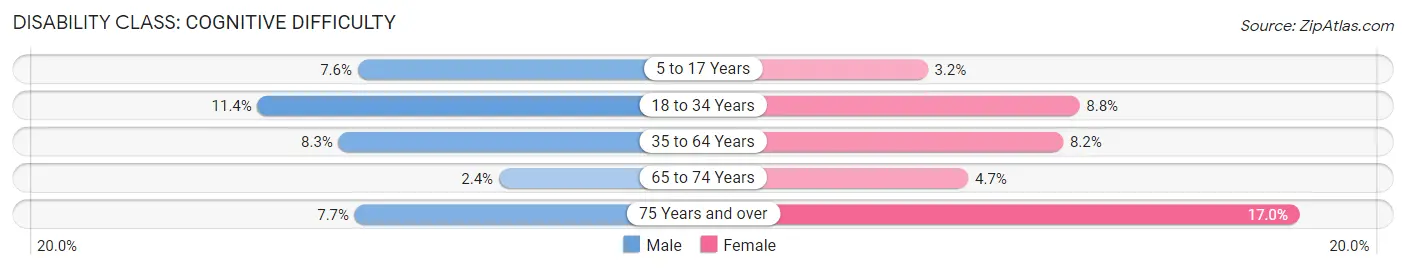
| Age Bracket | Male | Female |
| 5 to 17 Years | 332 (7.6%) | 127 (3.2%) |
| 18 to 34 Years | 549 (11.4%) | 405 (8.8%) |
| 35 to 64 Years | 828 (8.3%) | 778 (8.2%) |
| 65 to 74 Years | 74 (2.4%) | 137 (4.7%) |
| 75 Years and over | 124 (7.7%) | 358 (17.0%) |
Disability Class: Ambulatory Difficulty

| Age Bracket | Male | Female |
| 5 to 17 Years | 44 (1.0%) | 11 (0.3%) |
| 18 to 34 Years | 77 (1.6%) | 85 (1.8%) |
| 35 to 64 Years | 1,150 (11.6%) | 1,066 (11.3%) |
| 65 to 74 Years | 450 (14.5%) | 423 (14.5%) |
| 75 Years and over | 445 (27.8%) | 747 (35.5%) |
Disability Class: Self-Care Difficulty
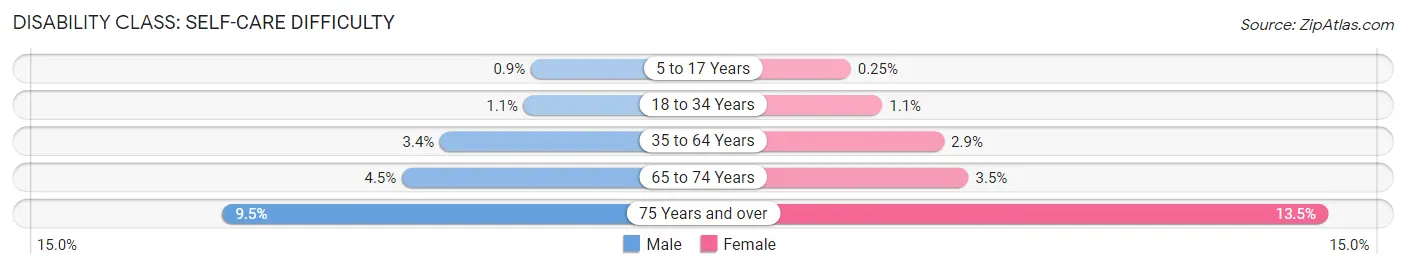
| Age Bracket | Male | Female |
| 5 to 17 Years | 39 (0.9%) | 10 (0.3%) |
| 18 to 34 Years | 53 (1.1%) | 52 (1.1%) |
| 35 to 64 Years | 340 (3.4%) | 270 (2.9%) |
| 65 to 74 Years | 139 (4.5%) | 103 (3.5%) |
| 75 Years and over | 152 (9.5%) | 285 (13.5%) |
Technology Access in Newaygo County
Computing Device Access in Newaygo County
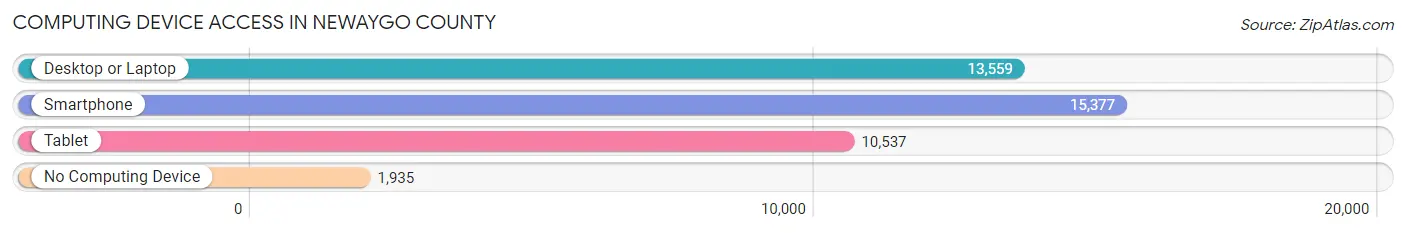
| Device Type | # Households | % Households |
| Desktop or Laptop | 13,559 | 71.2% |
| Smartphone | 15,377 | 80.7% |
| Tablet | 10,537 | 55.3% |
| No Computing Device | 1,935 | 10.2% |
| Total | 19,047 | 100.0% |
Internet Access in Newaygo County
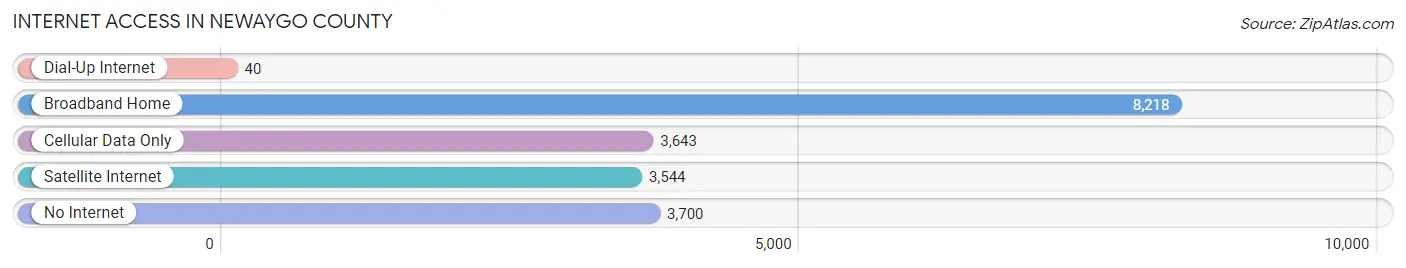
| Internet Type | # Households | % Households |
| Dial-Up Internet | 40 | 0.2% |
| Broadband Home | 8,218 | 43.1% |
| Cellular Data Only | 3,643 | 19.1% |
| Satellite Internet | 3,544 | 18.6% |
| No Internet | 3,700 | 19.4% |
| Total | 19,047 | 100.0% |
Newaygo County Summary
Newaygo County is located in the west-central region of Michigan’s Lower Peninsula. It is bordered by Lake Michigan to the west, Muskegon County to the north, Mecosta County to the east, and Montcalm County to the south. The county seat is White Cloud, and the largest city is Fremont. The county has a total area of 576 square miles, of which 571 square miles is land and 5.2 square miles is water.
History
Newaygo County was established in 1840 and was named after the Newaygo River, which was named by the Native Americans who lived in the area. The county was originally part of Kent County, and was later split off to form its own county. The first settlers in the area were mostly of Dutch and German descent, and they established small farms and businesses.
In the late 19th century, the lumber industry began to boom in the area, and the county became a major producer of lumber. The lumber industry was the main source of employment for many years, and it helped to shape the economy of the county.
In the early 20th century, the county began to diversify its economy, and it became a major producer of agricultural products, such as apples, cherries, and peaches. The county also became a popular tourist destination, and it is still known for its many lakes and rivers.
Geography
Newaygo County is located in the west-central region of Michigan’s Lower Peninsula. It is bordered by Lake Michigan to the west, Muskegon County to the north, Mecosta County to the east, and Montcalm County to the south. The county has a total area of 576 square miles, of which 571 square miles is land and 5.2 square miles is water.
The county is mostly flat, with some rolling hills in the northern and eastern parts. The highest point in the county is located in the northern part of the county, near the town of Grant, and it has an elevation of 1,092 feet. The county is home to several rivers, including the Muskegon, White, and Newaygo Rivers.
Economy
Newaygo County’s economy is largely based on agriculture and tourism. The county is a major producer of apples, cherries, and peaches, and it is also home to several wineries and breweries. Tourism is also an important part of the economy, and the county is home to several popular lakes and rivers, as well as several state parks.
The county is also home to several manufacturing companies, including furniture makers, automotive parts manufacturers, and food processing plants. The county is also home to several retail stores, restaurants, and other businesses.
Demographics
As of the 2010 census, the population of Newaygo County was 48,460. The population is mostly white (94.3%), with small percentages of African Americans (2.2%), Native Americans (1.2%), Asians (0.7%), and other races (1.6%). The median household income in the county is $41,945, and the median age is 40.7 years.
Conclusion
Newaygo County is a rural county located in the west-central region of Michigan’s Lower Peninsula. It is bordered by Lake Michigan to the west, Muskegon County to the north, Mecosta County to the east, and Montcalm County to the south. The county has a total area of 576 square miles, of which 571 square miles is land and 5.2 square miles is water. The county’s economy is largely based on agriculture and tourism, and it is home to several manufacturing companies, retail stores, restaurants, and other businesses. The population of Newaygo County is 48,460, and the median household income is $41,945.
Common Questions
What is Per Capita Income in Newaygo County?
Per Capita income in Newaygo County is $29,687.
What is the Median Family Income in Newaygo County?
Median Family Income in Newaygo County is $70,051.
What is the Median Household income in Newaygo County?
Median Household Income in Newaygo County is $59,065.
What is Income or Wage Gap in Newaygo County?
Income or Wage Gap in Newaygo County is 37.2%.
Women in Newaygo County earn 62.8 cents for every dollar earned by a man.
What is Family Income Deficit in Newaygo County?
Family Income Deficit in Newaygo County is $9,261.
Families that are below poverty line in Newaygo County earn $9,261 less on average than the poverty threshold level.
What is Inequality or Gini Index in Newaygo County?
Inequality or Gini Index in Newaygo County is 0.43.
What is the Total Population of Newaygo County?
Total Population of Newaygo County is 50,130.
What is the Total Male Population of Newaygo County?
Total Male Population of Newaygo County is 25,483.
What is the Total Female Population of Newaygo County?
Total Female Population of Newaygo County is 24,647.
What is the Ratio of Males per 100 Females in Newaygo County?
There are 103.39 Males per 100 Females in Newaygo County.
What is the Ratio of Females per 100 Males in Newaygo County?
There are 96.72 Females per 100 Males in Newaygo County.
What is the Median Population Age in Newaygo County?
Median Population Age in Newaygo County is 42.4 Years.
What is the Average Family Size in Newaygo County
Average Family Size in Newaygo County is 3.1 People.
What is the Average Household Size in Newaygo County
Average Household Size in Newaygo County is 2.6 People.
How Large is the Labor Force in Newaygo County?
There are 22,635 People in the Labor Forcein in Newaygo County.
What is the Percentage of People in the Labor Force in Newaygo County?
56.0% of People are in the Labor Force in Newaygo County.
What is the Unemployment Rate in Newaygo County?
Unemployment Rate in Newaygo County is 4.7%.