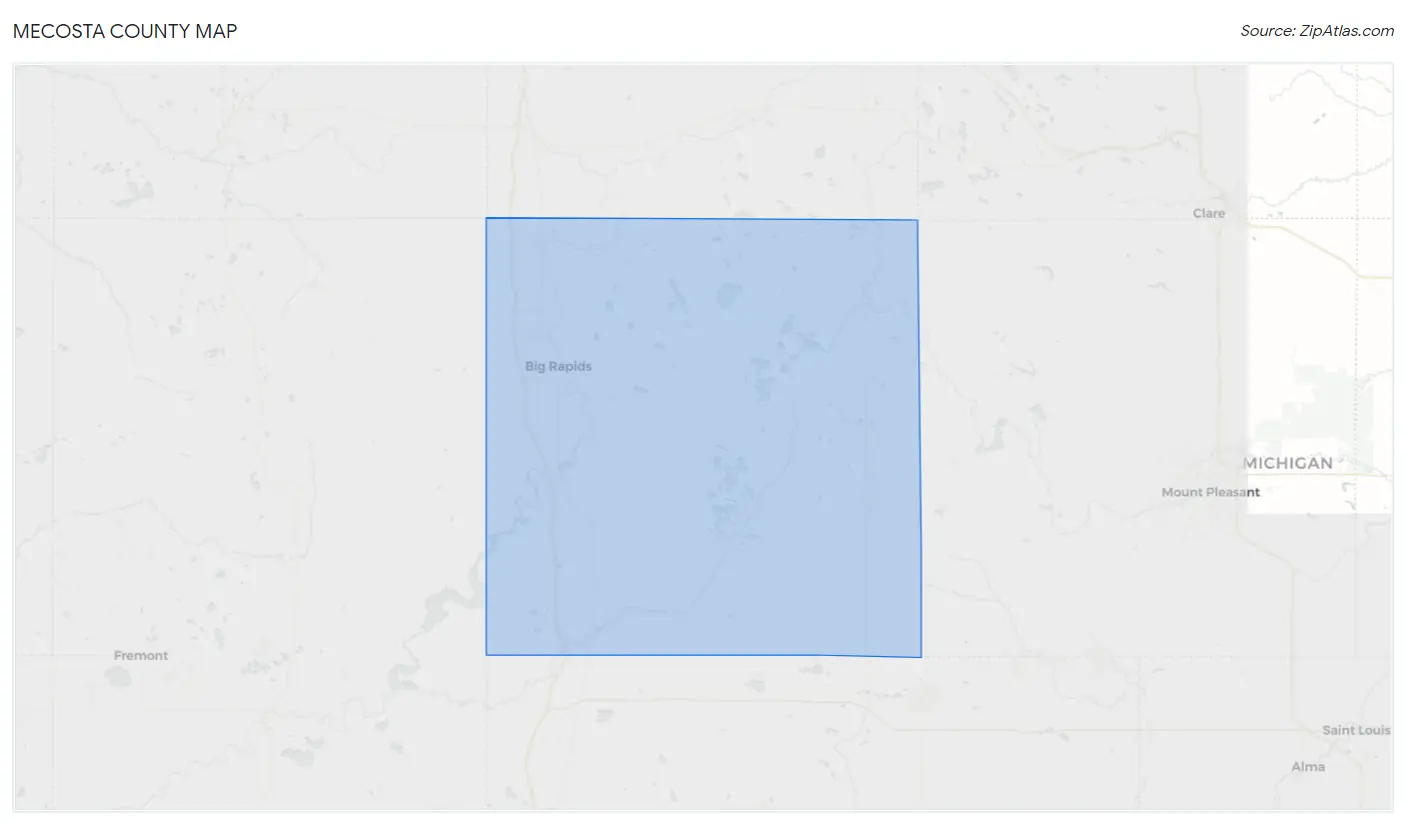
Mecosta County, MI Map & Demographics
Mecosta County Map
Mecosta County Overview
$27,692
PER CAPITA INCOME
$68,870
AVG FAMILY INCOME
$54,132
AVG HOUSEHOLD INCOME
25.1%
WAGE / INCOME GAP [ % ]
74.9¢/ $1
WAGE / INCOME GAP [ $ ]
$8,953
FAMILY INCOME DEFICIT
0.42
INEQUALITY / GINI INDEX
40,128
TOTAL POPULATION
20,158
MALE POPULATION
19,970
FEMALE POPULATION
100.94
MALES / 100 FEMALES
99.07
FEMALES / 100 MALES
40.6
MEDIAN AGE
2.9
AVG FAMILY SIZE
2.3
AVG HOUSEHOLD SIZE
17,779
LABOR FORCE [ PEOPLE ]
53.5%
PERCENT IN LABOR FORCE
5.5%
UNEMPLOYMENT RATE
Income in Mecosta County
Income Overview in Mecosta County
Per Capita Income in Mecosta County is $27,692, while median incomes of families and households are $68,870 and $54,132 respectively.
| Characteristic | Number | Measure |
| Per Capita Income | 40,128 | $27,692 |
| Median Family Income | 9,796 | $68,870 |
| Mean Family Income | 9,796 | $82,296 |
| Median Household Income | 16,103 | $54,132 |
| Mean Household Income | 16,103 | $68,387 |
| Income Deficit | 9,796 | $8,953 |
| Wage / Income Gap (%) | 40,128 | 25.05% |
| Wage / Income Gap ($) | 40,128 | 74.95¢ per $1 |
| Gini / Inequality Index | 40,128 | 0.42 |
Earnings by Sex in Mecosta County
Average Earnings in Mecosta County are $28,952, $33,178 for men and $24,866 for women, a difference of 25.1%.
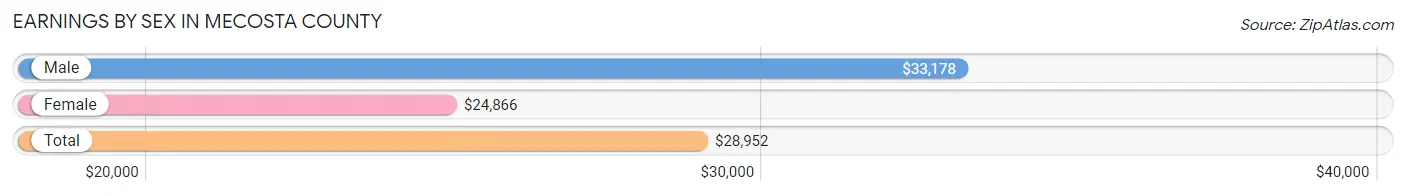
| Sex | Number | Average Earnings |
| Male | 10,562 (52.9%) | $33,178 |
| Female | 9,388 (47.1%) | $24,866 |
| Total | 19,950 (100.0%) | $28,952 |
Earnings by Sex by Income Bracket in Mecosta County
The most common earnings brackets in Mecosta County are $55,000 to $64,999 for men (787 | 7.4%) and $30,000 to $34,999 for women (728 | 7.7%).
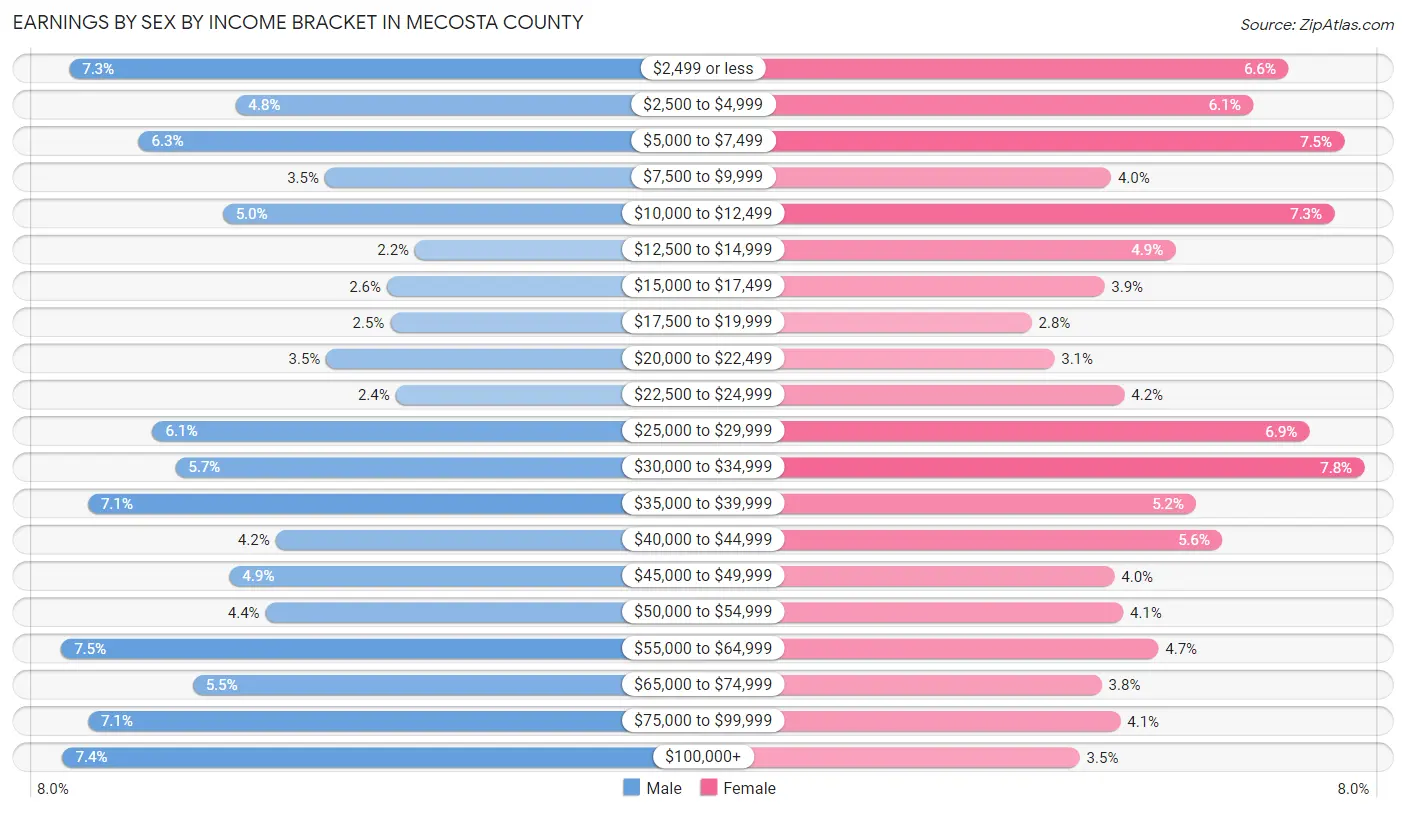
| Income | Male | Female |
| $2,499 or less | 774 (7.3%) | 621 (6.6%) |
| $2,500 to $4,999 | 511 (4.8%) | 571 (6.1%) |
| $5,000 to $7,499 | 664 (6.3%) | 699 (7.4%) |
| $7,500 to $9,999 | 370 (3.5%) | 372 (4.0%) |
| $10,000 to $12,499 | 531 (5.0%) | 685 (7.3%) |
| $12,500 to $14,999 | 227 (2.1%) | 462 (4.9%) |
| $15,000 to $17,499 | 271 (2.6%) | 362 (3.9%) |
| $17,500 to $19,999 | 266 (2.5%) | 260 (2.8%) |
| $20,000 to $22,499 | 368 (3.5%) | 292 (3.1%) |
| $22,500 to $24,999 | 258 (2.4%) | 391 (4.2%) |
| $25,000 to $29,999 | 642 (6.1%) | 651 (6.9%) |
| $30,000 to $34,999 | 606 (5.7%) | 728 (7.7%) |
| $35,000 to $39,999 | 745 (7.0%) | 491 (5.2%) |
| $40,000 to $44,999 | 448 (4.2%) | 528 (5.6%) |
| $45,000 to $49,999 | 521 (4.9%) | 376 (4.0%) |
| $50,000 to $54,999 | 464 (4.4%) | 389 (4.1%) |
| $55,000 to $64,999 | 787 (7.4%) | 438 (4.7%) |
| $65,000 to $74,999 | 579 (5.5%) | 359 (3.8%) |
| $75,000 to $99,999 | 745 (7.0%) | 385 (4.1%) |
| $100,000+ | 785 (7.4%) | 328 (3.5%) |
| Total | 10,562 (100.0%) | 9,388 (100.0%) |
Earnings by Sex by Educational Attainment in Mecosta County
Average earnings in Mecosta County are $42,929 for men and $32,995 for women, a difference of 23.1%. Men with an educational attainment of graduate degree enjoy the highest average annual earnings of $68,581, while those with high school diploma education earn the least with $39,470. Women with an educational attainment of graduate degree earn the most with the average annual earnings of $63,798, while those with less than high school education have the smallest earnings of $16,528.
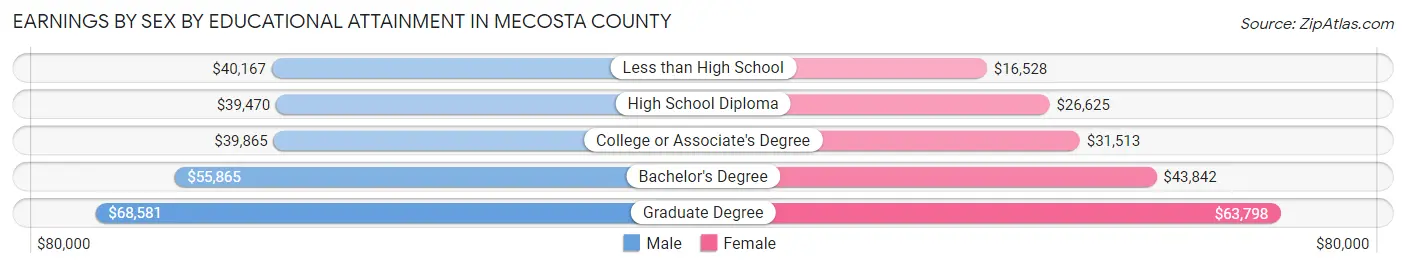
| Educational Attainment | Male Income | Female Income |
| Less than High School | $40,167 | $16,528 |
| High School Diploma | $39,470 | $26,625 |
| College or Associate's Degree | $39,865 | $31,513 |
| Bachelor's Degree | $55,865 | $43,842 |
| Graduate Degree | $68,581 | $63,798 |
| Total | $42,929 | $32,995 |
Family Income in Mecosta County
Family Income Brackets in Mecosta County
According to the Mecosta County family income data, there are 2,028 families falling into the $50,000 to $74,999 income range, which is the most common income bracket and makes up 20.7% of all families. Conversely, the less than $10,000 income bracket is the least frequent group with only 225 families (2.3%) belonging to this category.
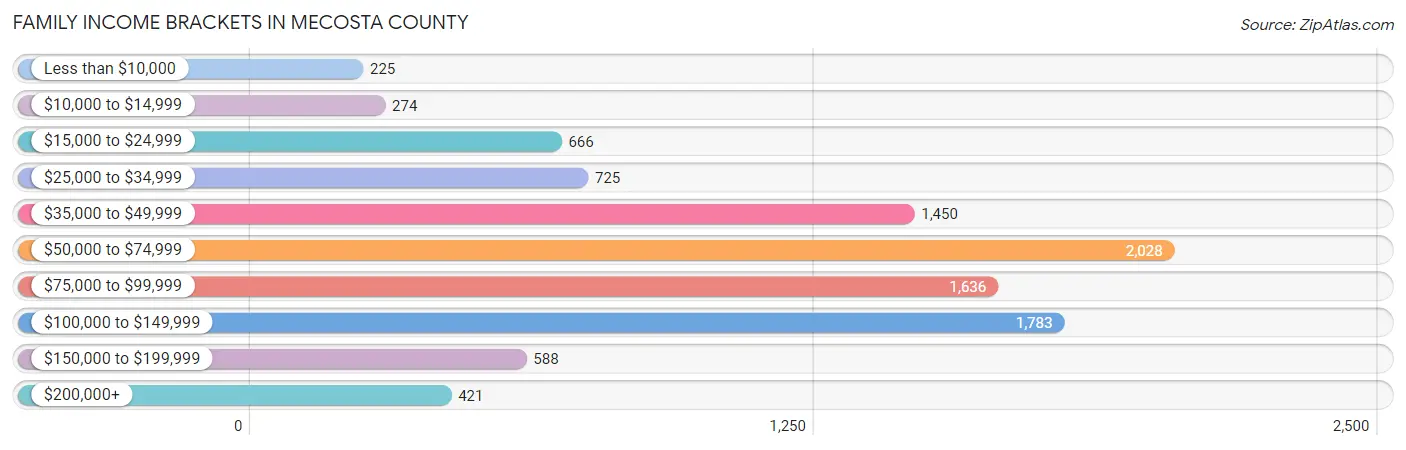
| Income Bracket | # Families | % Families |
| Less than $10,000 | 225 | 2.3% |
| $10,000 to $14,999 | 274 | 2.8% |
| $15,000 to $24,999 | 666 | 6.8% |
| $25,000 to $34,999 | 725 | 7.4% |
| $35,000 to $49,999 | 1,450 | 14.8% |
| $50,000 to $74,999 | 2,028 | 20.7% |
| $75,000 to $99,999 | 1,636 | 16.7% |
| $100,000 to $149,999 | 1,783 | 18.2% |
| $150,000 to $199,999 | 588 | 6.0% |
| $200,000+ | 421 | 4.3% |
Family Income by Famaliy Size in Mecosta County
7+ person families (195 | 2.0%) account for the highest median family income in Mecosta County with $95,464 per family, while 2-person families (5,269 | 53.8%) have the highest median income of $31,246 per family member.
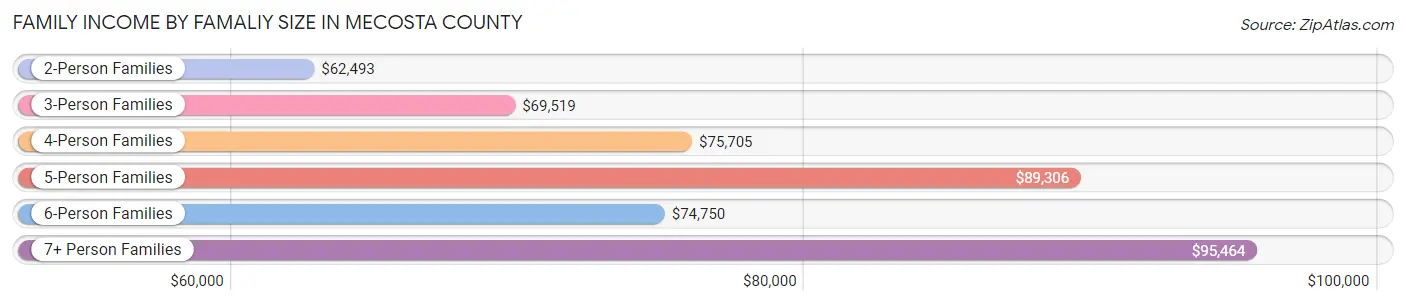
| Income Bracket | # Families | Median Income |
| 2-Person Families | 5,269 (53.8%) | $62,493 |
| 3-Person Families | 2,056 (21.0%) | $69,519 |
| 4-Person Families | 1,498 (15.3%) | $75,705 |
| 5-Person Families | 572 (5.8%) | $89,306 |
| 6-Person Families | 206 (2.1%) | $74,750 |
| 7+ Person Families | 195 (2.0%) | $95,464 |
| Total | 9,796 (100.0%) | $68,870 |
Family Income by Number of Earners in Mecosta County
The median family income in Mecosta County is $68,870, with families comprising 3+ earners (996) having the highest median family income of $110,234, while families with no earners (2,515) have the lowest median family income of $48,212, accounting for 10.2% and 25.7% of families, respectively.
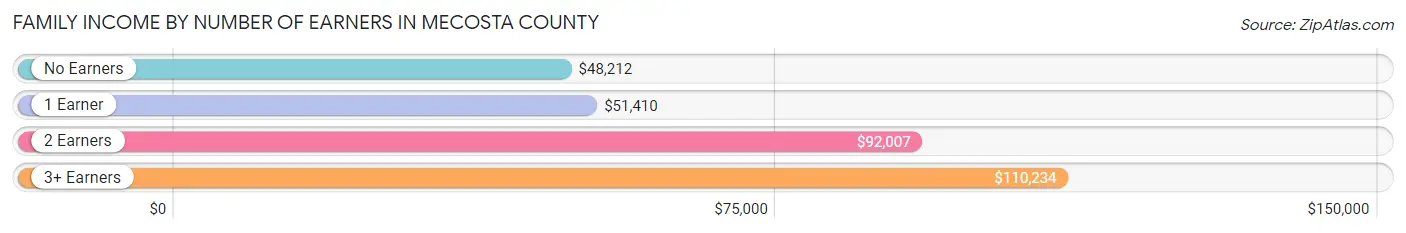
| Number of Earners | # Families | Median Income |
| No Earners | 2,515 (25.7%) | $48,212 |
| 1 Earner | 3,157 (32.2%) | $51,410 |
| 2 Earners | 3,128 (31.9%) | $92,007 |
| 3+ Earners | 996 (10.2%) | $110,234 |
| Total | 9,796 (100.0%) | $68,870 |
Household Income in Mecosta County
Household Income Brackets in Mecosta County
With 2,882 households falling in the category, the $50,000 to $74,999 income range is the most frequent in Mecosta County, accounting for 17.9% of all households. In contrast, only 451 households (2.8%) fall into the $200,000+ income bracket, making it the least populous group.
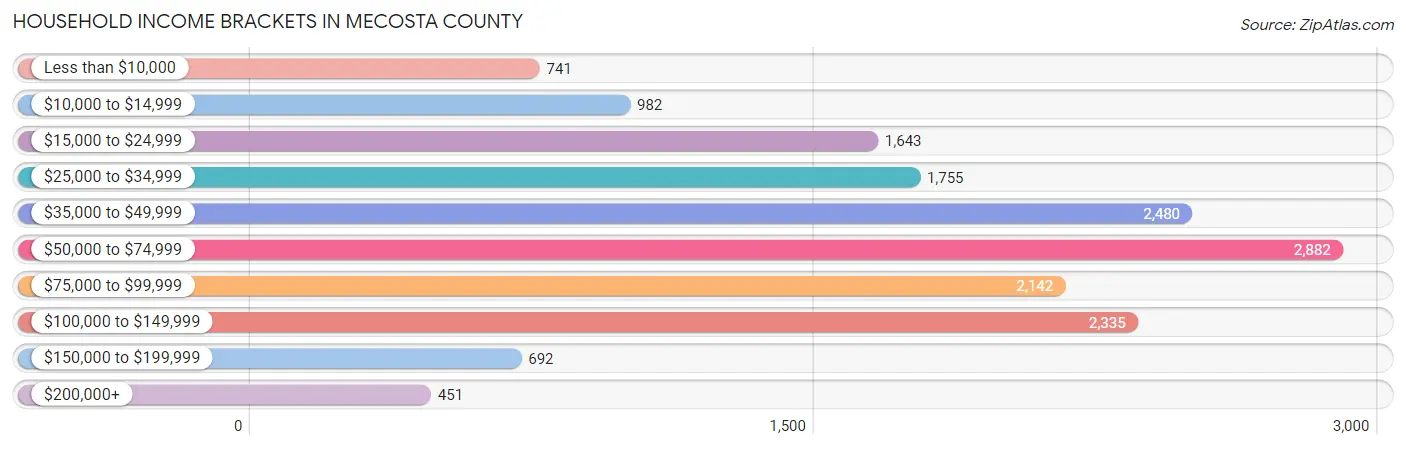
| Income Bracket | # Households | % Households |
| Less than $10,000 | 741 | 4.6% |
| $10,000 to $14,999 | 982 | 6.1% |
| $15,000 to $24,999 | 1,643 | 10.2% |
| $25,000 to $34,999 | 1,755 | 10.9% |
| $35,000 to $49,999 | 2,480 | 15.4% |
| $50,000 to $74,999 | 2,882 | 17.9% |
| $75,000 to $99,999 | 2,142 | 13.3% |
| $100,000 to $149,999 | 2,335 | 14.5% |
| $150,000 to $199,999 | 692 | 4.3% |
| $200,000+ | 451 | 2.8% |
Household Income by Householder Age in Mecosta County
The median household income in Mecosta County is $54,132, with the highest median household income of $70,611 found in the 45 to 64 years age bracket for the primary householder. A total of 5,775 households (35.9%) fall into this category. Meanwhile, the 15 to 24 years age bracket for the primary householder has the lowest median household income of $27,768, with 1,075 households (6.7%) in this group.
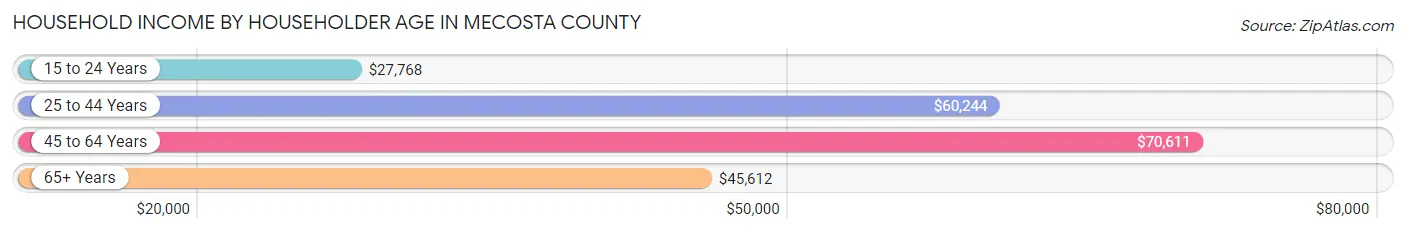
| Income Bracket | # Households | Median Income |
| 15 to 24 Years | 1,075 (6.7%) | $27,768 |
| 25 to 44 Years | 4,097 (25.4%) | $60,244 |
| 45 to 64 Years | 5,775 (35.9%) | $70,611 |
| 65+ Years | 5,156 (32.0%) | $45,612 |
| Total | 16,103 (100.0%) | $54,132 |
Poverty in Mecosta County
Income Below Poverty by Sex and Age in Mecosta County
With 18.5% poverty level for males and 17.4% for females among the residents of Mecosta County, 18 to 24 year old males and 18 to 24 year old females are the most vulnerable to poverty, with 1,064 males (56.1%) and 812 females (44.4%) in their respective age groups living below the poverty level.
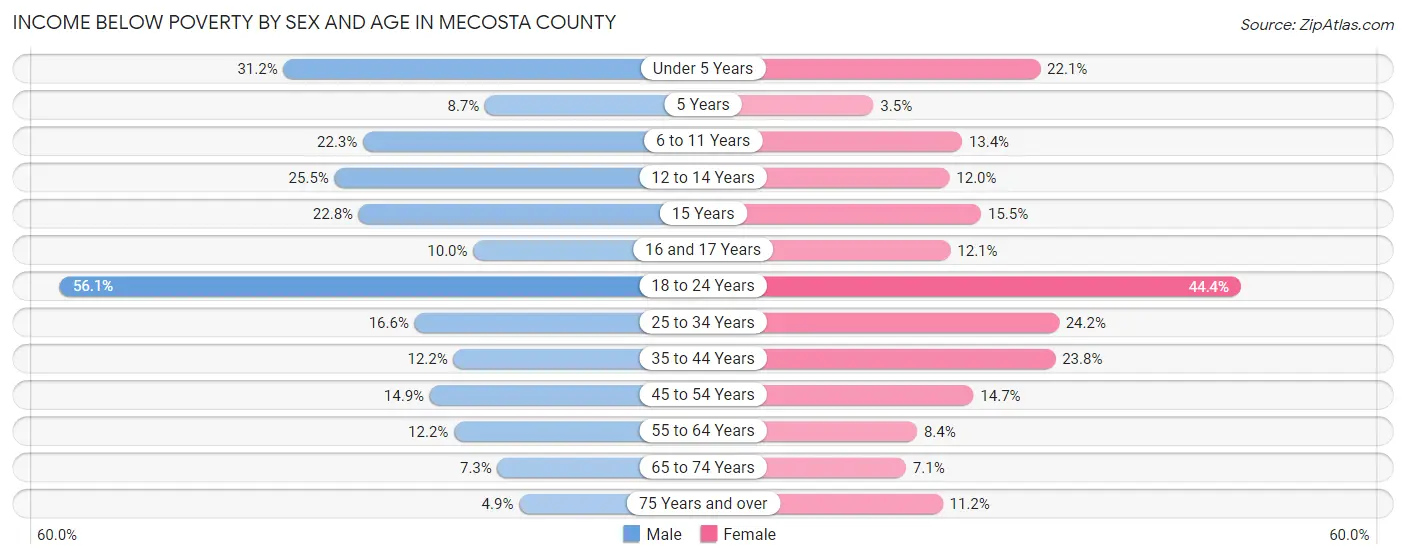
| Age Bracket | Male | Female |
| Under 5 Years | 322 (31.2%) | 220 (22.1%) |
| 5 Years | 21 (8.7%) | 8 (3.5%) |
| 6 to 11 Years | 273 (22.3%) | 163 (13.4%) |
| 12 to 14 Years | 175 (25.5%) | 77 (12.0%) |
| 15 Years | 51 (22.8%) | 49 (15.5%) |
| 16 and 17 Years | 51 (10.0%) | 44 (12.1%) |
| 18 to 24 Years | 1,064 (56.1%) | 812 (44.4%) |
| 25 to 34 Years | 365 (16.6%) | 515 (24.2%) |
| 35 to 44 Years | 246 (12.2%) | 486 (23.8%) |
| 45 to 54 Years | 323 (14.9%) | 321 (14.7%) |
| 55 to 64 Years | 353 (12.2%) | 240 (8.4%) |
| 65 to 74 Years | 172 (7.3%) | 174 (7.1%) |
| 75 Years and over | 65 (4.9%) | 188 (11.2%) |
| Total | 3,481 (18.5%) | 3,297 (17.4%) |
Income Above Poverty by Sex and Age in Mecosta County
According to the poverty statistics in Mecosta County, males aged 75 years and over and females aged 5 years are the age groups that are most secure financially, with 95.1% of males and 96.5% of females in these age groups living above the poverty line.
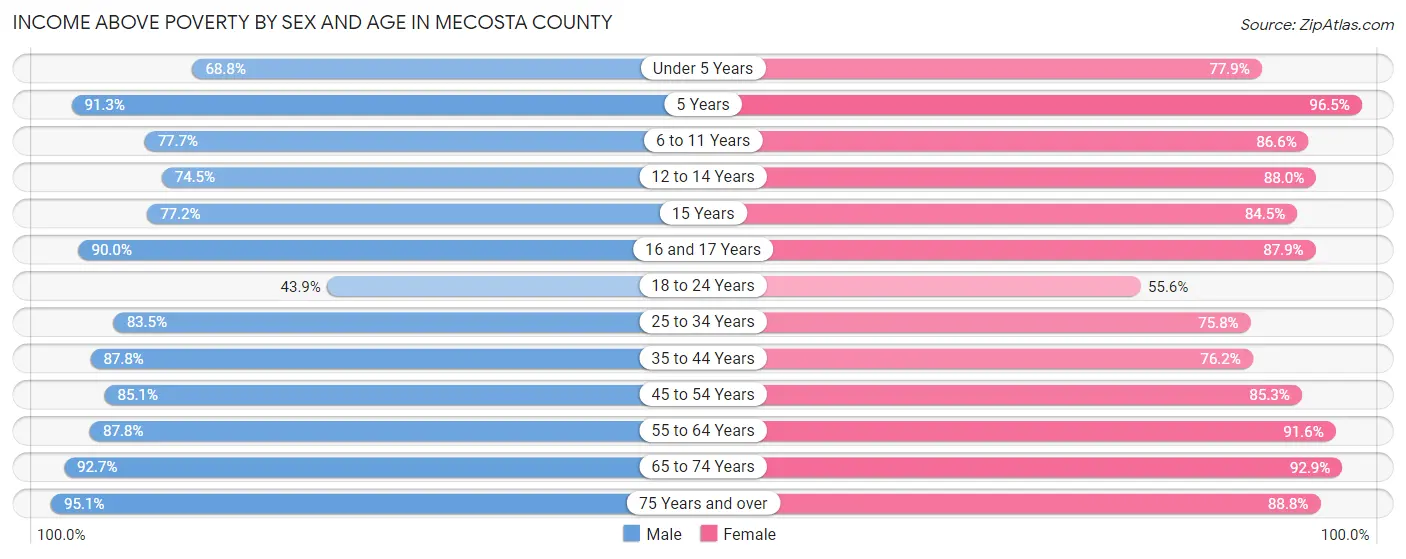
| Age Bracket | Male | Female |
| Under 5 Years | 711 (68.8%) | 776 (77.9%) |
| 5 Years | 220 (91.3%) | 219 (96.5%) |
| 6 to 11 Years | 951 (77.7%) | 1,055 (86.6%) |
| 12 to 14 Years | 512 (74.5%) | 566 (88.0%) |
| 15 Years | 173 (77.2%) | 267 (84.5%) |
| 16 and 17 Years | 458 (90.0%) | 320 (87.9%) |
| 18 to 24 Years | 834 (43.9%) | 1,015 (55.6%) |
| 25 to 34 Years | 1,841 (83.5%) | 1,617 (75.8%) |
| 35 to 44 Years | 1,766 (87.8%) | 1,559 (76.2%) |
| 45 to 54 Years | 1,851 (85.1%) | 1,869 (85.3%) |
| 55 to 64 Years | 2,549 (87.8%) | 2,627 (91.6%) |
| 65 to 74 Years | 2,179 (92.7%) | 2,263 (92.9%) |
| 75 Years and over | 1,259 (95.1%) | 1,488 (88.8%) |
| Total | 15,304 (81.5%) | 15,641 (82.6%) |
Income Below Poverty Among Married-Couple Families in Mecosta County
The poverty statistics for married-couple families in Mecosta County show that 5.2% or 386 of the total 7,369 families live below the poverty line. Families with 5 or more children have the highest poverty rate of 35.8%, comprising of 53 families. On the other hand, families with no children have the lowest poverty rate of 3.7%, which includes 185 families.
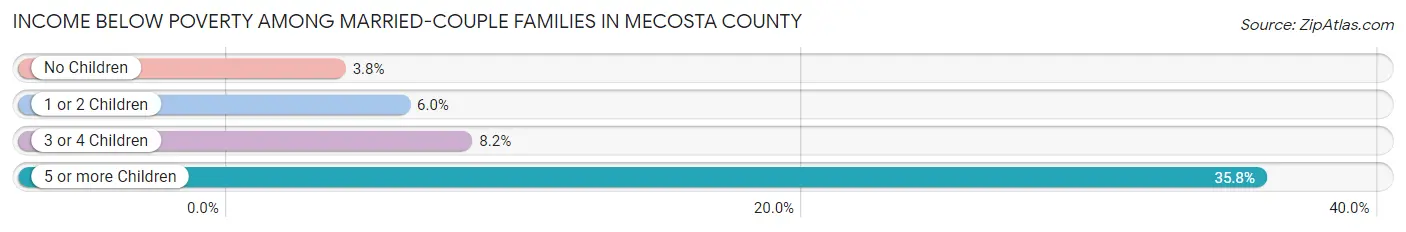
| Children | Above Poverty | Below Poverty |
| No Children | 4,744 (96.3%) | 185 (3.7%) |
| 1 or 2 Children | 1,694 (94.0%) | 108 (6.0%) |
| 3 or 4 Children | 450 (91.8%) | 40 (8.2%) |
| 5 or more Children | 95 (64.2%) | 53 (35.8%) |
| Total | 6,983 (94.8%) | 386 (5.2%) |
Income Below Poverty Among Single-Parent Households in Mecosta County
According to the poverty data in Mecosta County, 12.7% or 100 single-father households and 35.1% or 576 single-mother households are living below the poverty line. Among single-father households, those with 1 or 2 children have the highest poverty rate, with 66 households (16.1%) experiencing poverty. Likewise, among single-mother households, those with 5 or more children have the highest poverty rate, with 10 households (83.3%) falling below the poverty line.
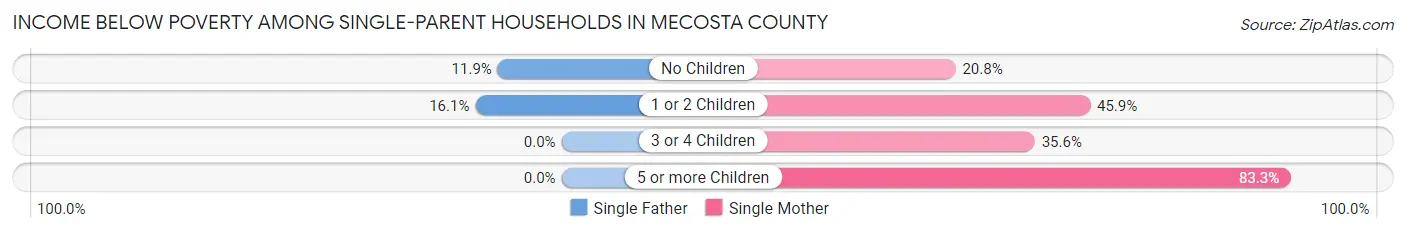
| Children | Single Father | Single Mother |
| No Children | 34 (11.9%) | 135 (20.8%) |
| 1 or 2 Children | 66 (16.1%) | 368 (45.9%) |
| 3 or 4 Children | 0 (0.0%) | 63 (35.6%) |
| 5 or more Children | 0 (0.0%) | 10 (83.3%) |
| Total | 100 (12.7%) | 576 (35.1%) |
Income Below Poverty Among Married-Couple vs Single-Parent Households in Mecosta County
The poverty data for Mecosta County shows that 386 of the married-couple family households (5.2%) and 676 of the single-parent households (27.9%) are living below the poverty level. Within the married-couple family households, those with 5 or more children have the highest poverty rate, with 53 households (35.8%) falling below the poverty line. Among the single-parent households, those with 5 or more children have the highest poverty rate, with 10 household (83.3%) living below poverty.
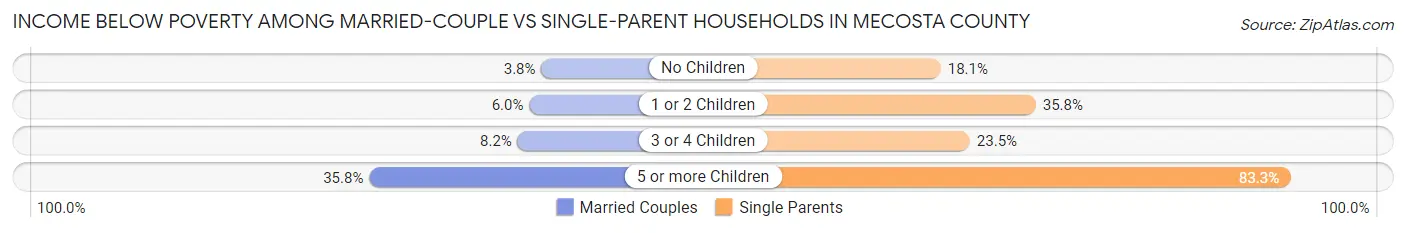
| Children | Married-Couple Families | Single-Parent Households |
| No Children | 185 (3.7%) | 169 (18.1%) |
| 1 or 2 Children | 108 (6.0%) | 434 (35.8%) |
| 3 or 4 Children | 40 (8.2%) | 63 (23.5%) |
| 5 or more Children | 53 (35.8%) | 10 (83.3%) |
| Total | 386 (5.2%) | 676 (27.9%) |
Race in Mecosta County
The most populous races in Mecosta County are White / Caucasian (36,638 | 91.3%), Two or more Races (1,532 | 3.8%), and Hispanic or Latino (1,064 | 2.6%).
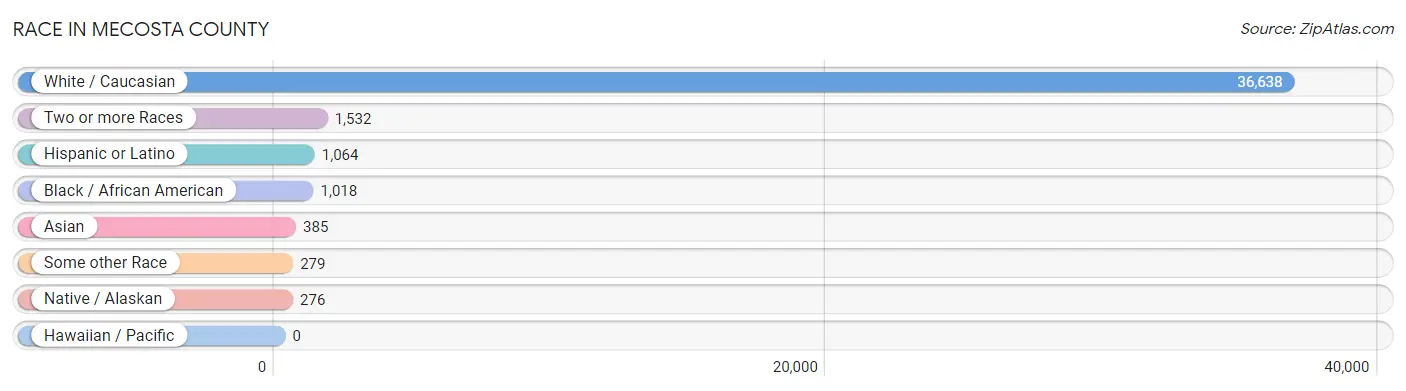
| Race | # Population | % Population |
| Asian | 385 | 1.0% |
| Black / African American | 1,018 | 2.5% |
| Hawaiian / Pacific | 0 | 0.0% |
| Hispanic or Latino | 1,064 | 2.6% |
| Native / Alaskan | 276 | 0.7% |
| White / Caucasian | 36,638 | 91.3% |
| Two or more Races | 1,532 | 3.8% |
| Some other Race | 279 | 0.7% |
| Total | 40,128 | 100.0% |
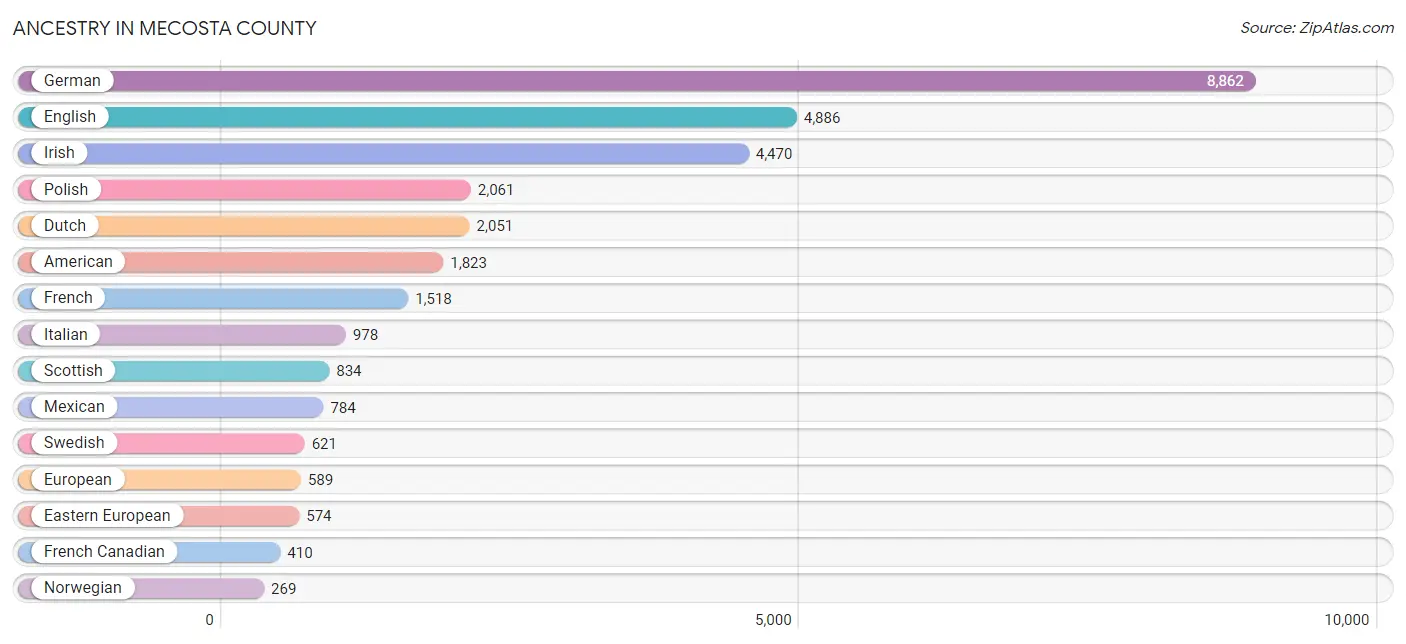
Ancestry in Mecosta County
The most populous ancestries reported in Mecosta County are German (8,862 | 22.1%), English (4,886 | 12.2%), Irish (4,470 | 11.1%), Polish (2,061 | 5.1%), and Dutch (2,051 | 5.1%), together accounting for 55.7% of all Mecosta County residents.
| Ancestry | # Population | % Population |
| Afghan | 21 | 0.1% |
| African | 24 | 0.1% |
| Albanian | 4 | 0.0% |
| American | 1,823 | 4.5% |
| Arab | 123 | 0.3% |
| Armenian | 15 | 0.0% |
| Australian | 1 | 0.0% |
| Austrian | 105 | 0.3% |
| Belgian | 143 | 0.4% |
| Belizean | 17 | 0.0% |
| Bhutanese | 17 | 0.0% |
| Blackfeet | 24 | 0.1% |
| Brazilian | 2 | 0.0% |
| British | 135 | 0.3% |
| Burmese | 74 | 0.2% |
| Canadian | 112 | 0.3% |
| Celtic | 4 | 0.0% |
| Central American | 32 | 0.1% |
| Central American Indian | 8 | 0.0% |
| Cherokee | 66 | 0.2% |
| Cheyenne | 3 | 0.0% |
| Chickasaw | 7 | 0.0% |
| Chinese | 8 | 0.0% |
| Chippewa | 184 | 0.5% |
| Creek | 27 | 0.1% |
| Croatian | 10 | 0.0% |
| Crow | 4 | 0.0% |
| Cuban | 26 | 0.1% |
| Czech | 105 | 0.3% |
| Czechoslovakian | 63 | 0.2% |
| Danish | 229 | 0.6% |
| Dominican | 1 | 0.0% |
| Dutch | 2,051 | 5.1% |
| Eastern European | 574 | 1.4% |
| Egyptian | 21 | 0.1% |
| English | 4,886 | 12.2% |
| European | 589 | 1.5% |
| Finnish | 232 | 0.6% |
| French | 1,518 | 3.8% |
| French American Indian | 30 | 0.1% |
| French Canadian | 410 | 1.0% |
| German | 8,862 | 22.1% |
| Greek | 39 | 0.1% |
| Guatemalan | 8 | 0.0% |
| Honduran | 24 | 0.1% |
| Hungarian | 257 | 0.6% |
| Indian (Asian) | 114 | 0.3% |
| Indonesian | 22 | 0.1% |
| Inupiat | 4 | 0.0% |
| Iraqi | 3 | 0.0% |
| Irish | 4,470 | 11.1% |
| Iroquois | 126 | 0.3% |
| Italian | 978 | 2.4% |
| Jamaican | 1 | 0.0% |
| Korean | 59 | 0.2% |
| Lebanese | 72 | 0.2% |
| Lithuanian | 71 | 0.2% |
| Lumbee | 10 | 0.0% |
| Luxembourger | 40 | 0.1% |
| Macedonian | 17 | 0.0% |
| Malaysian | 36 | 0.1% |
| Maltese | 13 | 0.0% |
| Mexican | 784 | 1.9% |
| Moroccan | 9 | 0.0% |
| Native Hawaiian | 8 | 0.0% |
| Navajo | 36 | 0.1% |
| Northern European | 21 | 0.1% |
| Norwegian | 269 | 0.7% |
| Ottawa | 22 | 0.1% |
| Pakistani | 6 | 0.0% |
| Pennsylvania German | 120 | 0.3% |
| Polish | 2,061 | 5.1% |
| Portuguese | 13 | 0.0% |
| Potawatomi | 11 | 0.0% |
| Puerto Rican | 103 | 0.3% |
| Romanian | 38 | 0.1% |
| Russian | 171 | 0.4% |
| Scandinavian | 93 | 0.2% |
| Scotch-Irish | 196 | 0.5% |
| Scottish | 834 | 2.1% |
| Sioux | 4 | 0.0% |
| Slovak | 36 | 0.1% |
| South African | 3 | 0.0% |
| South American | 24 | 0.1% |
| Spaniard | 34 | 0.1% |
| Spanish | 20 | 0.1% |
| Sri Lankan | 8 | 0.0% |
| Subsaharan African | 27 | 0.1% |
| Swedish | 621 | 1.5% |
| Swiss | 140 | 0.4% |
| Syrian | 10 | 0.0% |
| Thai | 143 | 0.4% |
| Turkish | 41 | 0.1% |
| Ukrainian | 34 | 0.1% |
| Venezuelan | 24 | 0.1% |
| Vietnamese | 23 | 0.1% |
| Welsh | 198 | 0.5% | View All 97 Rows |
Immigrants in Mecosta County
The most numerous immigrant groups reported in Mecosta County came from Asia (237 | 0.6%), Europe (144 | 0.4%), Latin America (115 | 0.3%), South Central Asia (106 | 0.3%), and Central America (81 | 0.2%), together accounting for 1.7% of all Mecosta County residents.
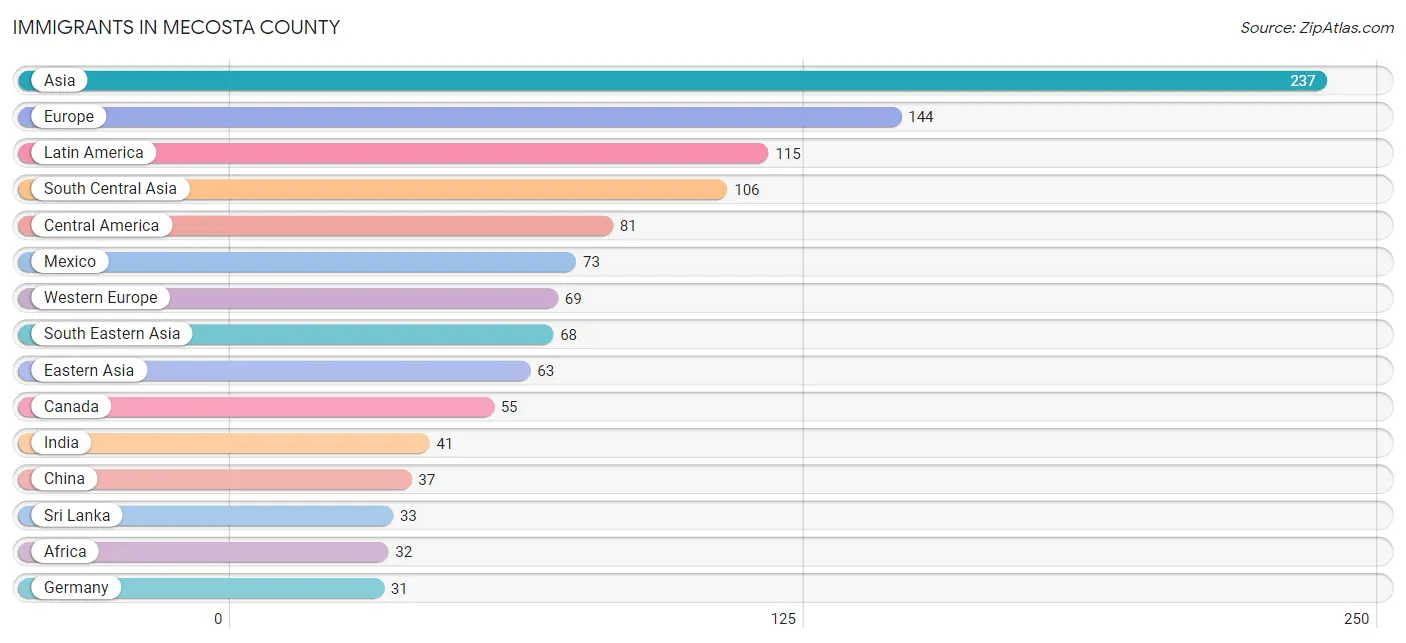
| Immigration Origin | # Population | % Population |
| Afghanistan | 9 | 0.0% |
| Africa | 32 | 0.1% |
| Asia | 237 | 0.6% |
| Bangladesh | 23 | 0.1% |
| Brazil | 2 | 0.0% |
| Canada | 55 | 0.1% |
| Caribbean | 8 | 0.0% |
| Central America | 81 | 0.2% |
| China | 37 | 0.1% |
| Cuba | 8 | 0.0% |
| Czechoslovakia | 7 | 0.0% |
| Denmark | 1 | 0.0% |
| Eastern Asia | 63 | 0.2% |
| Eastern Europe | 24 | 0.1% |
| Egypt | 21 | 0.1% |
| England | 9 | 0.0% |
| Europe | 144 | 0.4% |
| France | 16 | 0.0% |
| Germany | 31 | 0.1% |
| Guatemala | 8 | 0.0% |
| Hong Kong | 5 | 0.0% |
| India | 41 | 0.1% |
| Ireland | 11 | 0.0% |
| Japan | 19 | 0.1% |
| Korea | 7 | 0.0% |
| Latin America | 115 | 0.3% |
| Mexico | 73 | 0.2% |
| Netherlands | 22 | 0.1% |
| Northern Africa | 29 | 0.1% |
| Northern Europe | 30 | 0.1% |
| Oceania | 2 | 0.0% |
| Philippines | 28 | 0.1% |
| Romania | 2 | 0.0% |
| Russia | 15 | 0.0% |
| Scotland | 4 | 0.0% |
| South Africa | 3 | 0.0% |
| South America | 26 | 0.1% |
| South Central Asia | 106 | 0.3% |
| South Eastern Asia | 68 | 0.2% |
| Southern Europe | 21 | 0.1% |
| Spain | 21 | 0.1% |
| Sri Lanka | 33 | 0.1% |
| Thailand | 6 | 0.0% |
| Venezuela | 24 | 0.1% |
| Vietnam | 12 | 0.0% |
| Western Europe | 69 | 0.2% | View All 46 Rows |
Sex and Age in Mecosta County
Sex and Age in Mecosta County
The most populous age groups in Mecosta County are 20 to 24 Years (2,350 | 11.7%) for men and 20 to 24 Years (1,913 | 9.6%) for women.
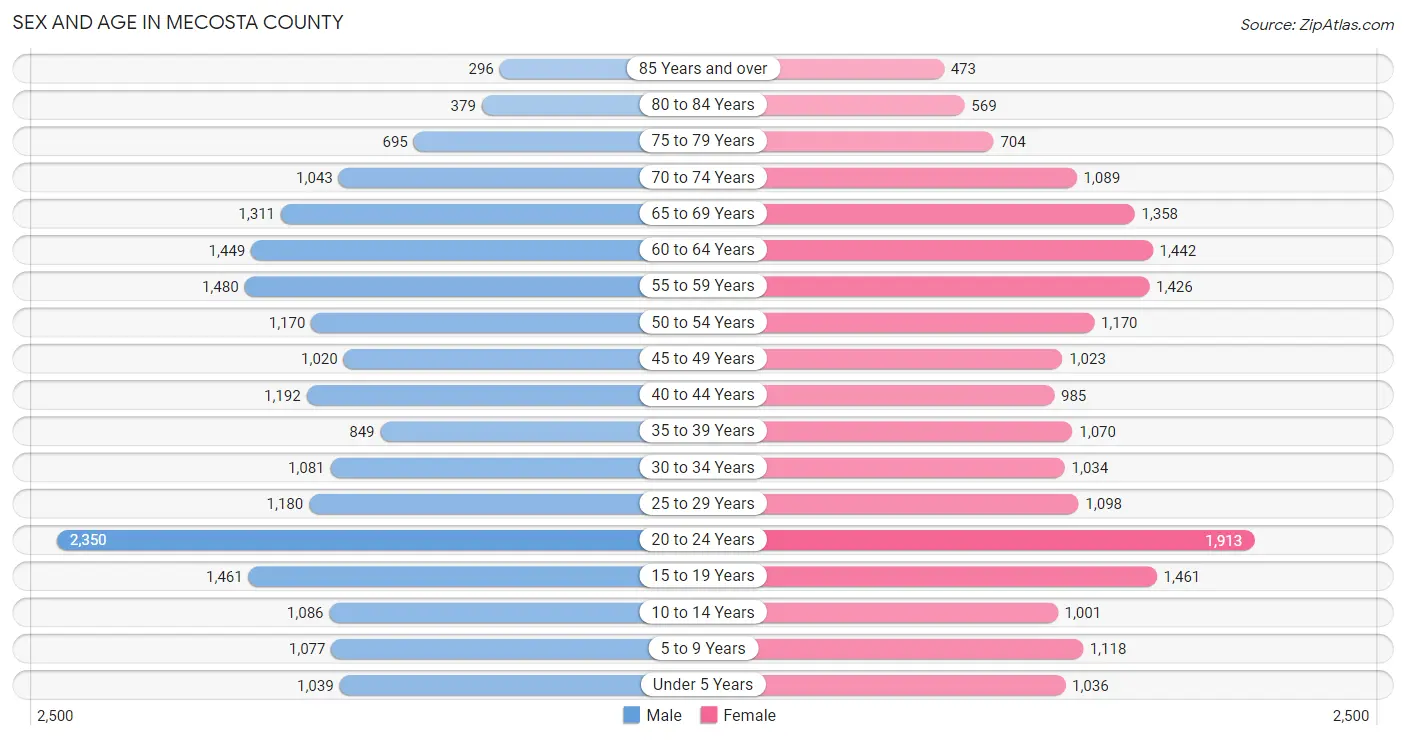
| Age Bracket | Male | Female |
| Under 5 Years | 1,039 (5.1%) | 1,036 (5.2%) |
| 5 to 9 Years | 1,077 (5.3%) | 1,118 (5.6%) |
| 10 to 14 Years | 1,086 (5.4%) | 1,001 (5.0%) |
| 15 to 19 Years | 1,461 (7.2%) | 1,461 (7.3%) |
| 20 to 24 Years | 2,350 (11.7%) | 1,913 (9.6%) |
| 25 to 29 Years | 1,180 (5.9%) | 1,098 (5.5%) |
| 30 to 34 Years | 1,081 (5.4%) | 1,034 (5.2%) |
| 35 to 39 Years | 849 (4.2%) | 1,070 (5.4%) |
| 40 to 44 Years | 1,192 (5.9%) | 985 (4.9%) |
| 45 to 49 Years | 1,020 (5.1%) | 1,023 (5.1%) |
| 50 to 54 Years | 1,170 (5.8%) | 1,170 (5.9%) |
| 55 to 59 Years | 1,480 (7.3%) | 1,426 (7.1%) |
| 60 to 64 Years | 1,449 (7.2%) | 1,442 (7.2%) |
| 65 to 69 Years | 1,311 (6.5%) | 1,358 (6.8%) |
| 70 to 74 Years | 1,043 (5.2%) | 1,089 (5.4%) |
| 75 to 79 Years | 695 (3.5%) | 704 (3.5%) |
| 80 to 84 Years | 379 (1.9%) | 569 (2.9%) |
| 85 Years and over | 296 (1.5%) | 473 (2.4%) |
| Total | 20,158 (100.0%) | 19,970 (100.0%) |
Families and Households in Mecosta County
Median Family Size in Mecosta County
The median family size in Mecosta County is 2.86 persons per family, with married-couple families (7,369 | 75.2%) accounting for the largest median family size of 2.96 persons per family. On the other hand, single female/mother families (1,639 | 16.7%) represent the smallest median family size with 2.57 persons per family.
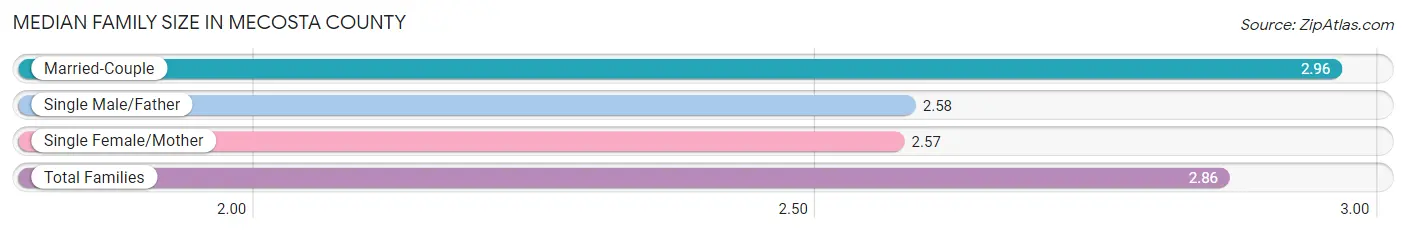
| Family Type | # Families | Family Size |
| Married-Couple | 7,369 (75.2%) | 2.96 |
| Single Male/Father | 788 (8.0%) | 2.58 |
| Single Female/Mother | 1,639 (16.7%) | 2.57 |
| Total Families | 9,796 (100.0%) | 2.86 |
Median Household Size in Mecosta County
The median household size in Mecosta County is 2.34 persons per household, with married-couple households (7,369 | 45.8%) accounting for the largest median household size of 2.98 persons per household. non-family households (6,307 | 39.2%) represent the smallest median household size with 1.38 persons per household.
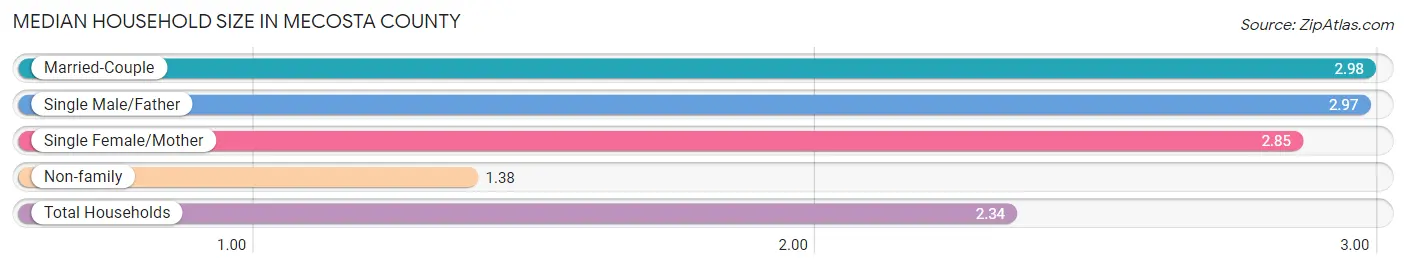
| Household Type | # Households | Household Size |
| Married-Couple | 7,369 (45.8%) | 2.98 |
| Single Male/Father | 788 (4.9%) | 2.97 |
| Single Female/Mother | 1,639 (10.2%) | 2.85 |
| Non-family | 6,307 (39.2%) | 1.38 |
| Total Households | 16,103 (100.0%) | 2.34 |
Household Size by Marriage Status in Mecosta County
Out of a total of 16,103 households in Mecosta County, 9,796 (60.8%) are family households, while 6,307 (39.2%) are nonfamily households. The most numerous type of family households are 2-person households, comprising 4,783, and the most common type of nonfamily households are 1-person households, comprising 4,684.
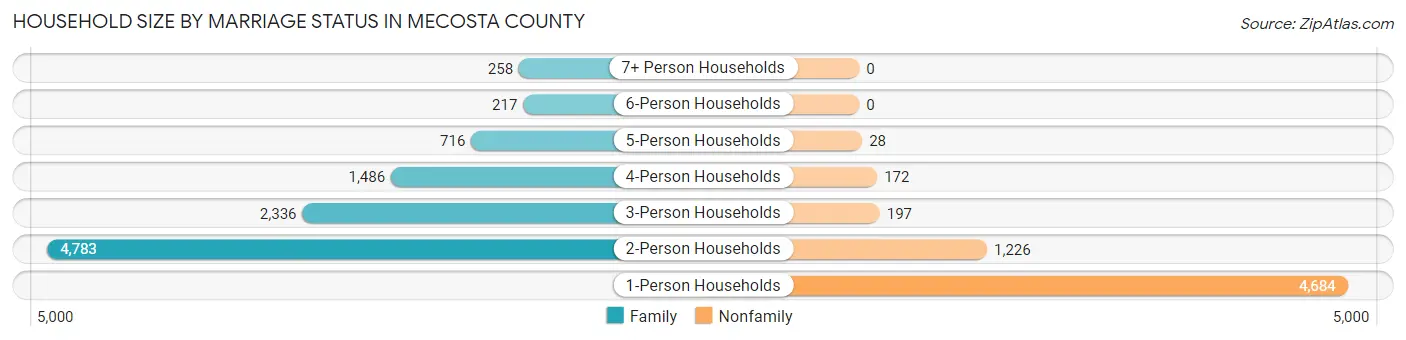
| Household Size | Family Households | Nonfamily Households |
| 1-Person Households | - | 4,684 (29.1%) |
| 2-Person Households | 4,783 (29.7%) | 1,226 (7.6%) |
| 3-Person Households | 2,336 (14.5%) | 197 (1.2%) |
| 4-Person Households | 1,486 (9.2%) | 172 (1.1%) |
| 5-Person Households | 716 (4.4%) | 28 (0.2%) |
| 6-Person Households | 217 (1.3%) | 0 (0.0%) |
| 7+ Person Households | 258 (1.6%) | 0 (0.0%) |
| Total | 9,796 (60.8%) | 6,307 (39.2%) |
Female Fertility in Mecosta County
Fertility by Age in Mecosta County
Average fertility rate in Mecosta County is 52.0 births per 1,000 women. Women in the age bracket of 20 to 34 years have the highest fertility rate with 75.0 births per 1,000 women. Women in the age bracket of 20 to 34 years acount for 65.9% of all women with births.
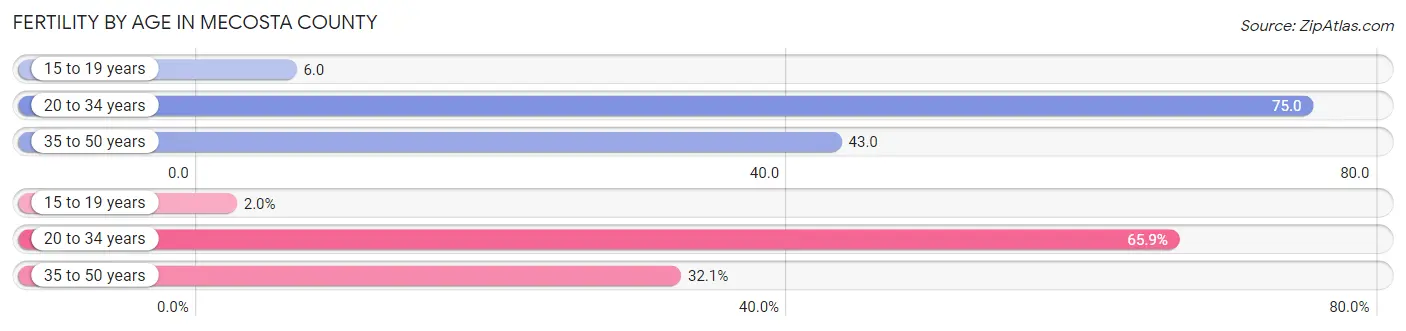
| Age Bracket | Women with Births | Births / 1,000 Women |
| 15 to 19 years | 9 (1.9%) | 6.0 |
| 20 to 34 years | 304 (65.9%) | 75.0 |
| 35 to 50 years | 148 (32.1%) | 43.0 |
| Total | 461 (100.0%) | 52.0 |
Fertility by Age by Marriage Status in Mecosta County
64.2% of women with births (461) in Mecosta County are married. The highest percentage of unmarried women with births falls into 15 to 19 years age bracket with 100.0% of them unmarried at the time of birth, while the lowest percentage of unmarried women with births belong to 20 to 34 years age bracket with 21.7% of them unmarried.
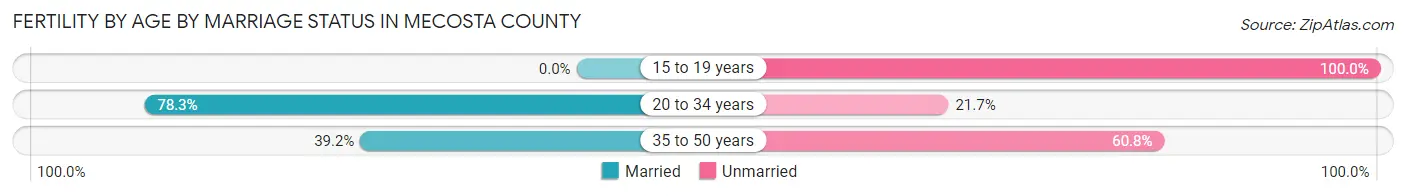
| Age Bracket | Married | Unmarried |
| 15 to 19 years | 0 (0.0%) | 9 (100.0%) |
| 20 to 34 years | 238 (78.3%) | 66 (21.7%) |
| 35 to 50 years | 58 (39.2%) | 90 (60.8%) |
| Total | 296 (64.2%) | 165 (35.8%) |
Fertility by Education in Mecosta County
Average fertility rate in Mecosta County is 52.0 births per 1,000 women. Women with the education attainment of high school diploma have the highest fertility rate of 92.0 births per 1,000 women, while women with the education attainment of college or associate's degree have the lowest fertility at 28.0 births per 1,000 women. Women with the education attainment of high school diploma represent 44.3% of all women with births.
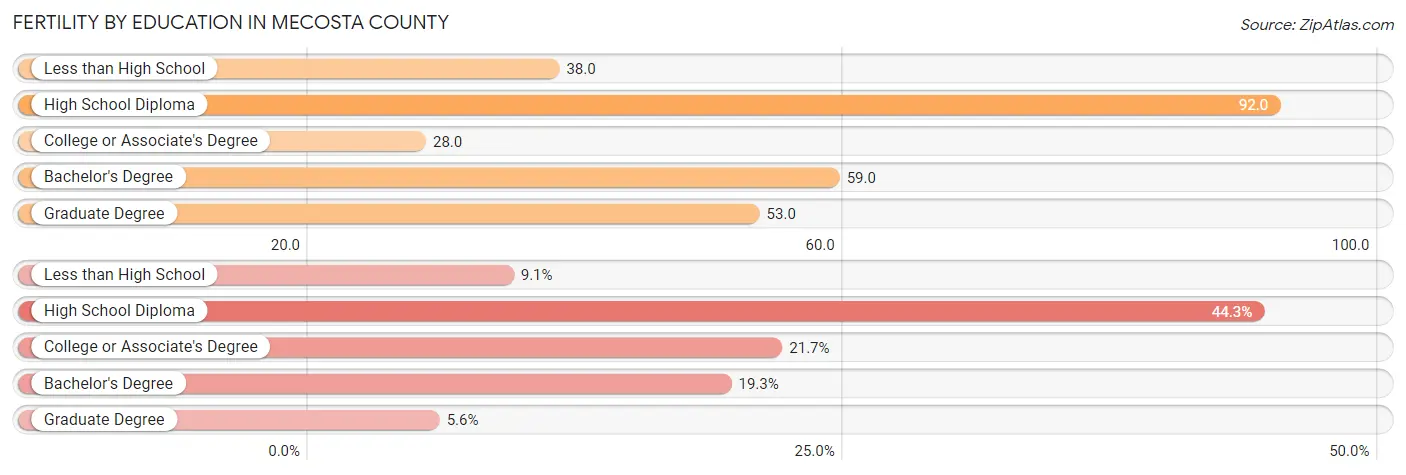
| Educational Attainment | Women with Births | Births / 1,000 Women |
| Less than High School | 42 (9.1%) | 38.0 |
| High School Diploma | 204 (44.3%) | 92.0 |
| College or Associate's Degree | 100 (21.7%) | 28.0 |
| Bachelor's Degree | 89 (19.3%) | 59.0 |
| Graduate Degree | 26 (5.6%) | 53.0 |
| Total | 461 (100.0%) | 52.0 |
Fertility by Education by Marriage Status in Mecosta County
35.8% of women with births in Mecosta County are unmarried. Women with the educational attainment of graduate degree are most likely to be married with 100.0% of them married at childbirth, while women with the educational attainment of high school diploma are least likely to be married with 63.7% of them unmarried at childbirth.
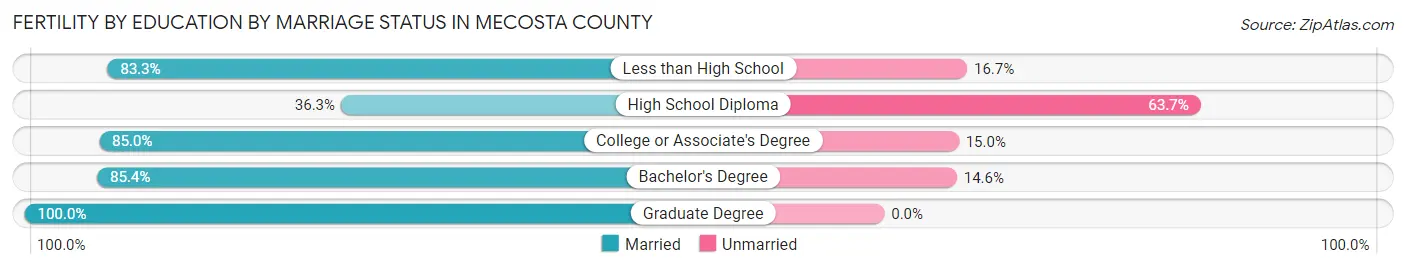
| Educational Attainment | Married | Unmarried |
| Less than High School | 35 (83.3%) | 7 (16.7%) |
| High School Diploma | 74 (36.3%) | 130 (63.7%) |
| College or Associate's Degree | 85 (85.0%) | 15 (15.0%) |
| Bachelor's Degree | 76 (85.4%) | 13 (14.6%) |
| Graduate Degree | 26 (100.0%) | 0 (0.0%) |
| Total | 296 (64.2%) | 165 (35.8%) |
Employment Characteristics in Mecosta County
Employment by Class of Employer in Mecosta County
Among the 16,342 employed individuals in Mecosta County, private company employees (11,000 | 67.3%), not-for-profit organizations (1,580 | 9.7%), and local government employees (1,299 | 8.0%) make up the most common classes of employment.
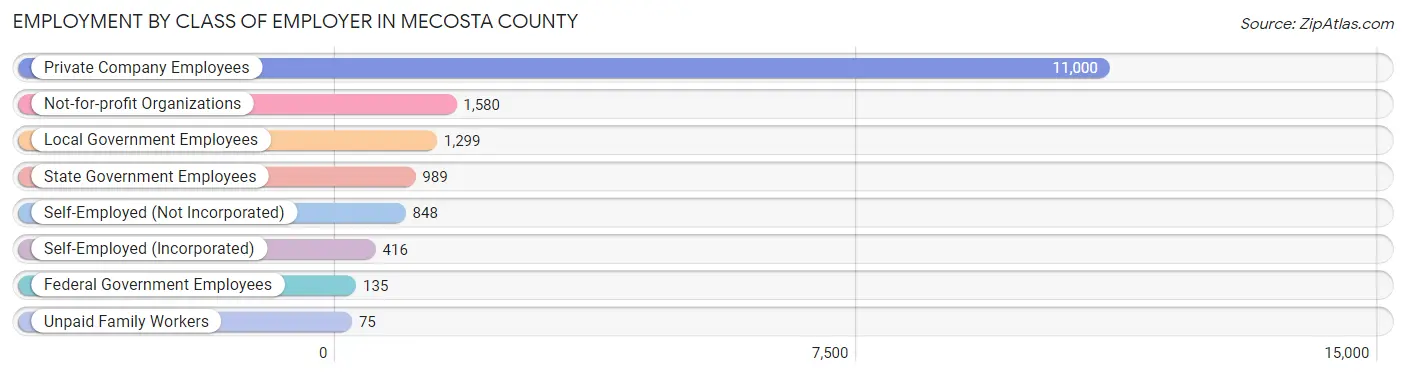
| Employer Class | # Employees | % Employees |
| Private Company Employees | 11,000 | 67.3% |
| Self-Employed (Incorporated) | 416 | 2.5% |
| Self-Employed (Not Incorporated) | 848 | 5.2% |
| Not-for-profit Organizations | 1,580 | 9.7% |
| Local Government Employees | 1,299 | 8.0% |
| State Government Employees | 989 | 6.0% |
| Federal Government Employees | 135 | 0.8% |
| Unpaid Family Workers | 75 | 0.5% |
| Total | 16,342 | 100.0% |
Employment Status by Age in Mecosta County
According to the labor force statistics for Mecosta County, out of the total population over 16 years of age (33,231), 53.5% or 17,779 individuals are in the labor force, with 5.5% or 978 of them unemployed. The age group with the highest labor force participation rate is 25 to 29 years, with 85.6% or 1,950 individuals in the labor force. Within the labor force, the 16 to 19 years age range has the highest percentage of unemployed individuals, with 17.2% or 168 of them being unemployed.
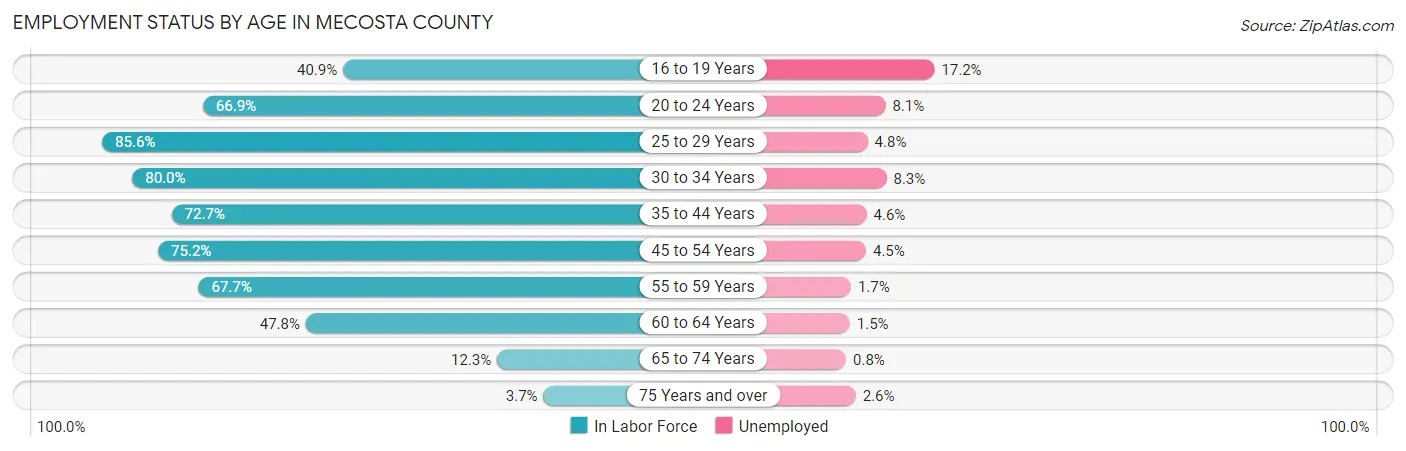
| Age Bracket | In Labor Force | Unemployed |
| 16 to 19 Years | 974 (40.9%) | 168 (17.2%) |
| 20 to 24 Years | 2,852 (66.9%) | 231 (8.1%) |
| 25 to 29 Years | 1,950 (85.6%) | 94 (4.8%) |
| 30 to 34 Years | 1,692 (80.0%) | 140 (8.3%) |
| 35 to 44 Years | 2,978 (72.7%) | 137 (4.6%) |
| 45 to 54 Years | 3,296 (75.2%) | 148 (4.5%) |
| 55 to 59 Years | 1,967 (67.7%) | 33 (1.7%) |
| 60 to 64 Years | 1,382 (47.8%) | 21 (1.5%) |
| 65 to 74 Years | 591 (12.3%) | 5 (0.8%) |
| 75 Years and over | 115 (3.7%) | 3 (2.6%) |
| Total | 17,779 (53.5%) | 978 (5.5%) |
Employment Status by Educational Attainment in Mecosta County
According to labor force statistics for Mecosta County, 71.1% of individuals (13,274) out of the total population between 25 and 64 years of age (18,669) are in the labor force, with 4.3% or 571 of them being unemployed. The group with the highest labor force participation rate are those with the educational attainment of bachelor's degree or higher, with 78.5% or 3,430 individuals in the labor force. Within the labor force, individuals with less than high school education have the highest percentage of unemployment, with 9.4% or 77 of them being unemployed.
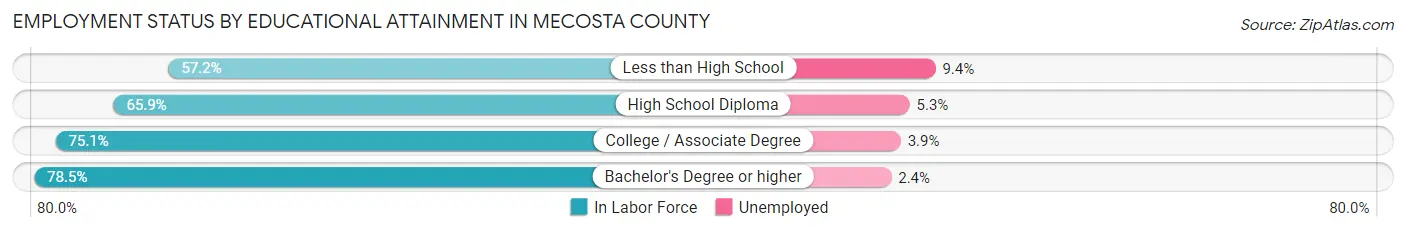
| Educational Attainment | In Labor Force | Unemployed |
| Less than High School | 821 (57.2%) | 135 (9.4%) |
| High School Diploma | 4,622 (65.9%) | 372 (5.3%) |
| College / Associate Degree | 4,393 (75.1%) | 228 (3.9%) |
| Bachelor's Degree or higher | 3,430 (78.5%) | 105 (2.4%) |
| Total | 13,274 (71.1%) | 803 (4.3%) |
Employment Occupations by Sex in Mecosta County
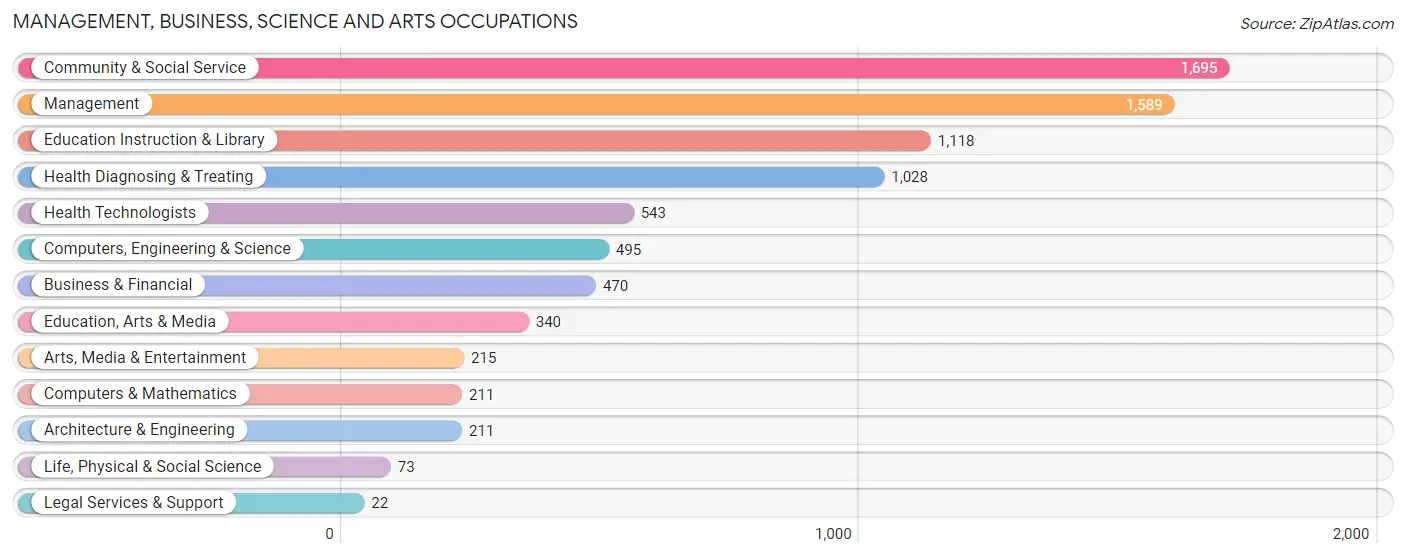
Management, Business, Science and Arts Occupations
The most common Management, Business, Science and Arts occupations in Mecosta County are Community & Social Service (1,695 | 10.1%), Management (1,589 | 9.5%), Education Instruction & Library (1,118 | 6.7%), Health Diagnosing & Treating (1,028 | 6.1%), and Health Technologists (543 | 3.2%).
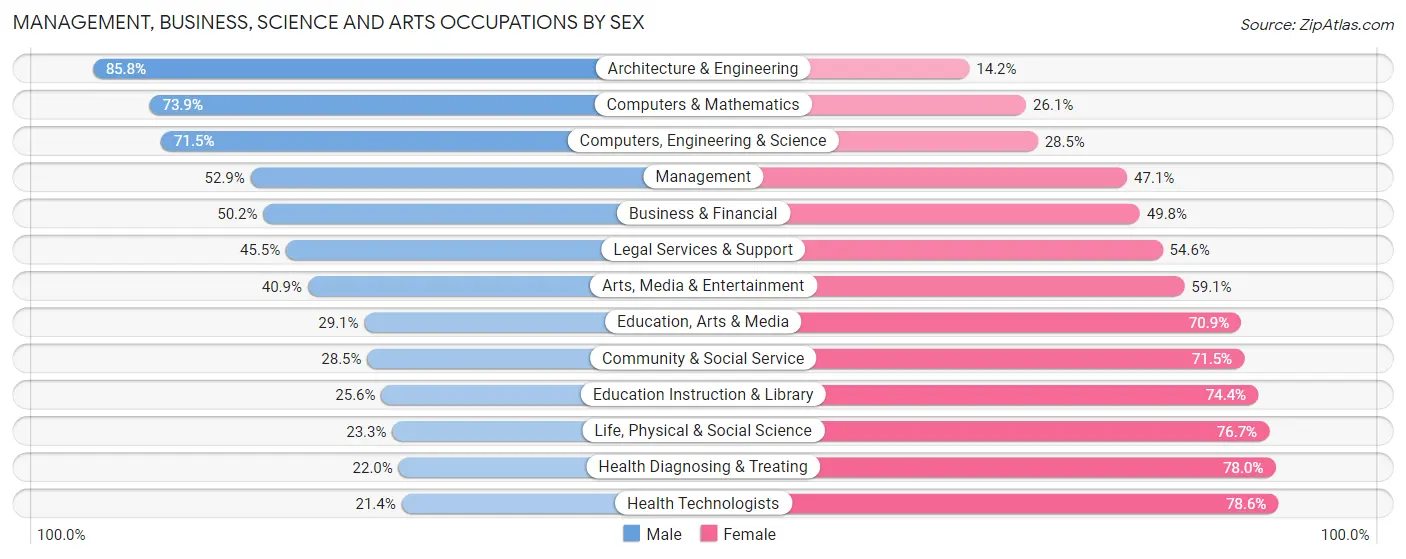
Management, Business, Science and Arts Occupations by Sex
Within the Management, Business, Science and Arts occupations in Mecosta County, the most male-oriented occupations are Architecture & Engineering (85.8%), Computers & Mathematics (73.9%), and Computers, Engineering & Science (71.5%), while the most female-oriented occupations are Health Technologists (78.6%), Health Diagnosing & Treating (78.0%), and Life, Physical & Social Science (76.7%).
| Occupation | Male | Female |
| Management | 840 (52.9%) | 749 (47.1%) |
| Business & Financial | 236 (50.2%) | 234 (49.8%) |
| Computers, Engineering & Science | 354 (71.5%) | 141 (28.5%) |
| Computers & Mathematics | 156 (73.9%) | 55 (26.1%) |
| Architecture & Engineering | 181 (85.8%) | 30 (14.2%) |
| Life, Physical & Social Science | 17 (23.3%) | 56 (76.7%) |
| Community & Social Service | 483 (28.5%) | 1,212 (71.5%) |
| Education, Arts & Media | 99 (29.1%) | 241 (70.9%) |
| Legal Services & Support | 10 (45.5%) | 12 (54.5%) |
| Education Instruction & Library | 286 (25.6%) | 832 (74.4%) |
| Arts, Media & Entertainment | 88 (40.9%) | 127 (59.1%) |
| Health Diagnosing & Treating | 226 (22.0%) | 802 (78.0%) |
| Health Technologists | 116 (21.4%) | 427 (78.6%) |
| Total (Category) | 2,139 (40.5%) | 3,138 (59.5%) |
| Total (Overall) | 8,609 (51.2%) | 8,199 (48.8%) |
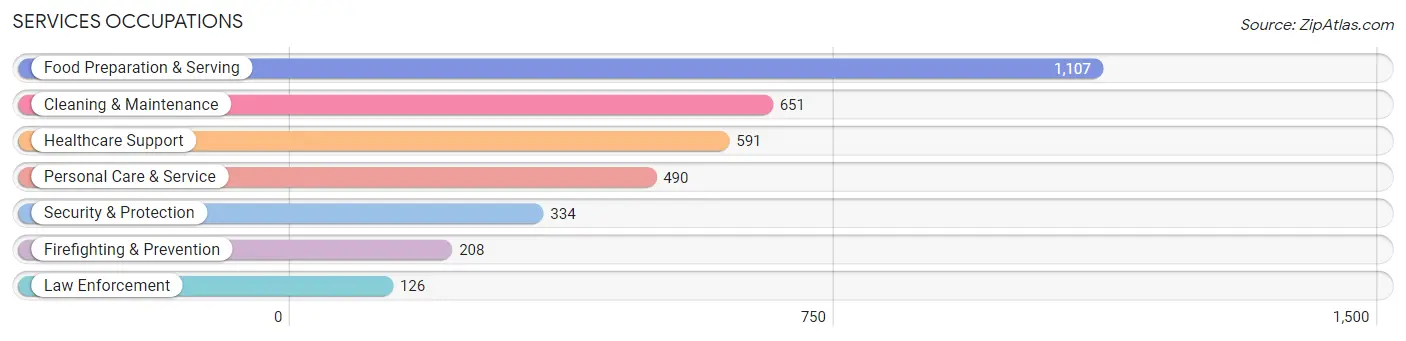
Services Occupations
The most common Services occupations in Mecosta County are Food Preparation & Serving (1,107 | 6.6%), Cleaning & Maintenance (651 | 3.9%), Healthcare Support (591 | 3.5%), Personal Care & Service (490 | 2.9%), and Security & Protection (334 | 2.0%).
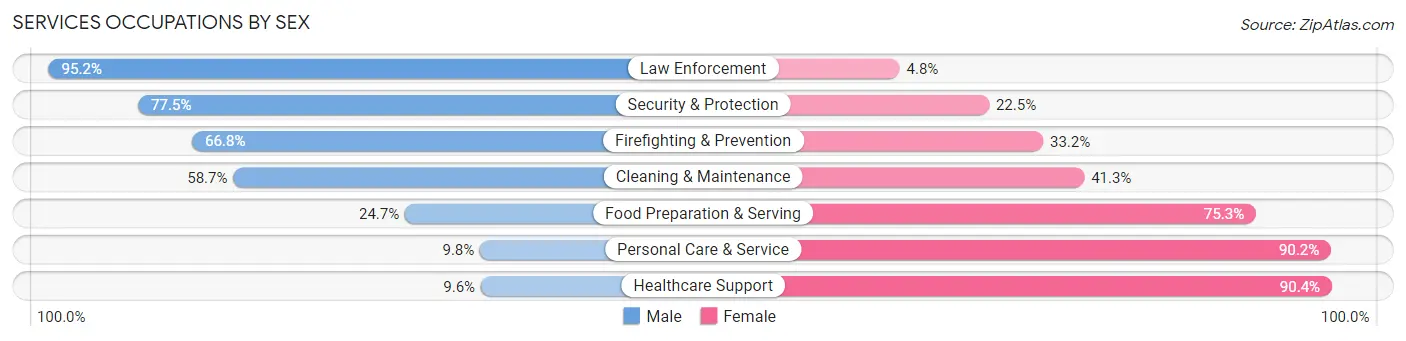
Services Occupations by Sex
Within the Services occupations in Mecosta County, the most male-oriented occupations are Law Enforcement (95.2%), Security & Protection (77.5%), and Firefighting & Prevention (66.8%), while the most female-oriented occupations are Healthcare Support (90.4%), Personal Care & Service (90.2%), and Food Preparation & Serving (75.3%).
| Occupation | Male | Female |
| Healthcare Support | 57 (9.6%) | 534 (90.4%) |
| Security & Protection | 259 (77.5%) | 75 (22.5%) |
| Firefighting & Prevention | 139 (66.8%) | 69 (33.2%) |
| Law Enforcement | 120 (95.2%) | 6 (4.8%) |
| Food Preparation & Serving | 273 (24.7%) | 834 (75.3%) |
| Cleaning & Maintenance | 382 (58.7%) | 269 (41.3%) |
| Personal Care & Service | 48 (9.8%) | 442 (90.2%) |
| Total (Category) | 1,019 (32.1%) | 2,154 (67.9%) |
| Total (Overall) | 8,609 (51.2%) | 8,199 (48.8%) |
Sales and Office Occupations
The most common Sales and Office occupations in Mecosta County are Office & Administration (1,603 | 9.5%), and Sales & Related (1,414 | 8.4%).

Sales and Office Occupations by Sex
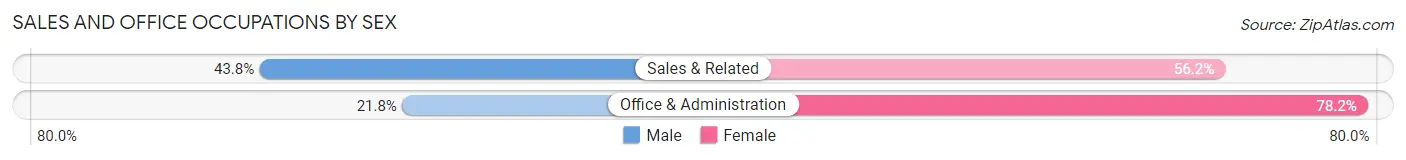
| Occupation | Male | Female |
| Sales & Related | 619 (43.8%) | 795 (56.2%) |
| Office & Administration | 350 (21.8%) | 1,253 (78.2%) |
| Total (Category) | 969 (32.1%) | 2,048 (67.9%) |
| Total (Overall) | 8,609 (51.2%) | 8,199 (48.8%) |
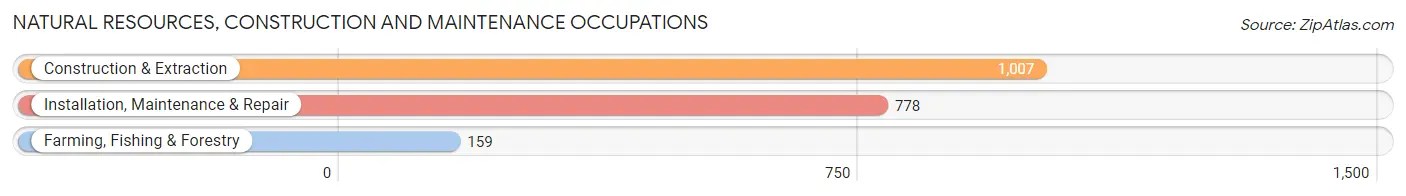
Natural Resources, Construction and Maintenance Occupations
The most common Natural Resources, Construction and Maintenance occupations in Mecosta County are Construction & Extraction (1,007 | 6.0%), Installation, Maintenance & Repair (778 | 4.6%), and Farming, Fishing & Forestry (159 | 0.9%).
Natural Resources, Construction and Maintenance Occupations by Sex
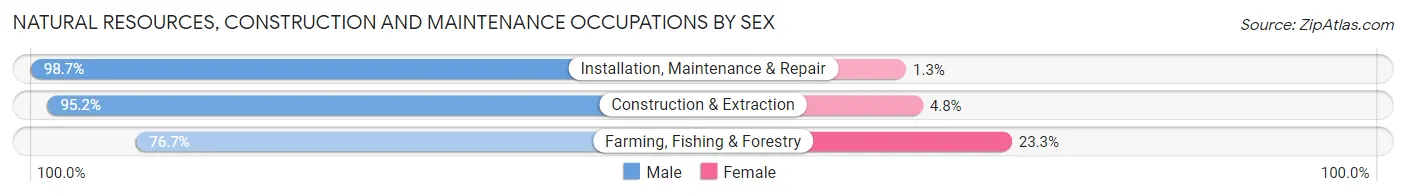
| Occupation | Male | Female |
| Farming, Fishing & Forestry | 122 (76.7%) | 37 (23.3%) |
| Construction & Extraction | 959 (95.2%) | 48 (4.8%) |
| Installation, Maintenance & Repair | 768 (98.7%) | 10 (1.3%) |
| Total (Category) | 1,849 (95.1%) | 95 (4.9%) |
| Total (Overall) | 8,609 (51.2%) | 8,199 (48.8%) |
Production, Transportation and Moving Occupations
The most common Production, Transportation and Moving occupations in Mecosta County are Production (1,608 | 9.6%), Material Moving (1,025 | 6.1%), and Transportation (764 | 4.5%).
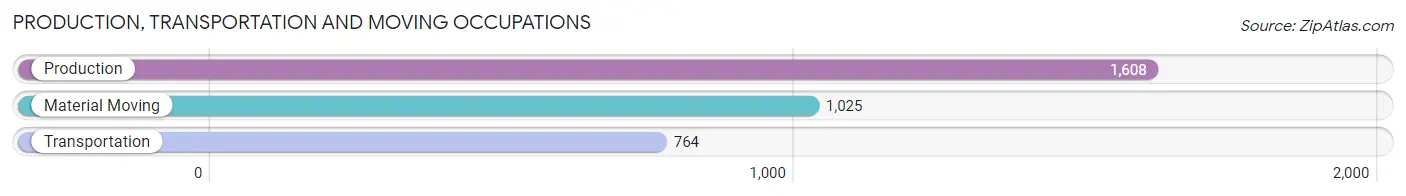
Production, Transportation and Moving Occupations by Sex
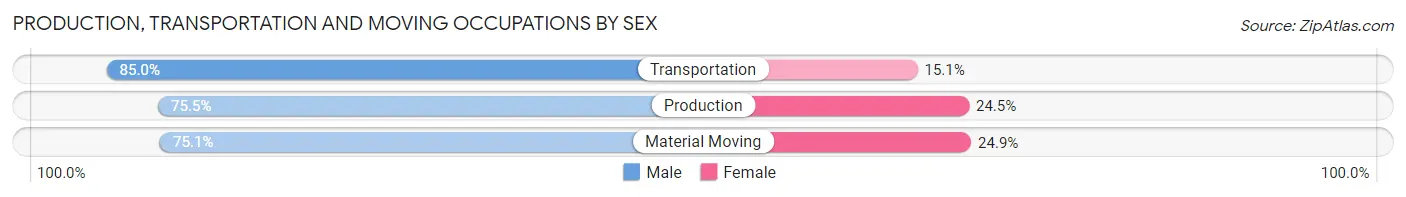
| Occupation | Male | Female |
| Production | 1,214 (75.5%) | 394 (24.5%) |
| Transportation | 649 (85.0%) | 115 (15.0%) |
| Material Moving | 770 (75.1%) | 255 (24.9%) |
| Total (Category) | 2,633 (77.5%) | 764 (22.5%) |
| Total (Overall) | 8,609 (51.2%) | 8,199 (48.8%) |
Employment Industries by Sex in Mecosta County
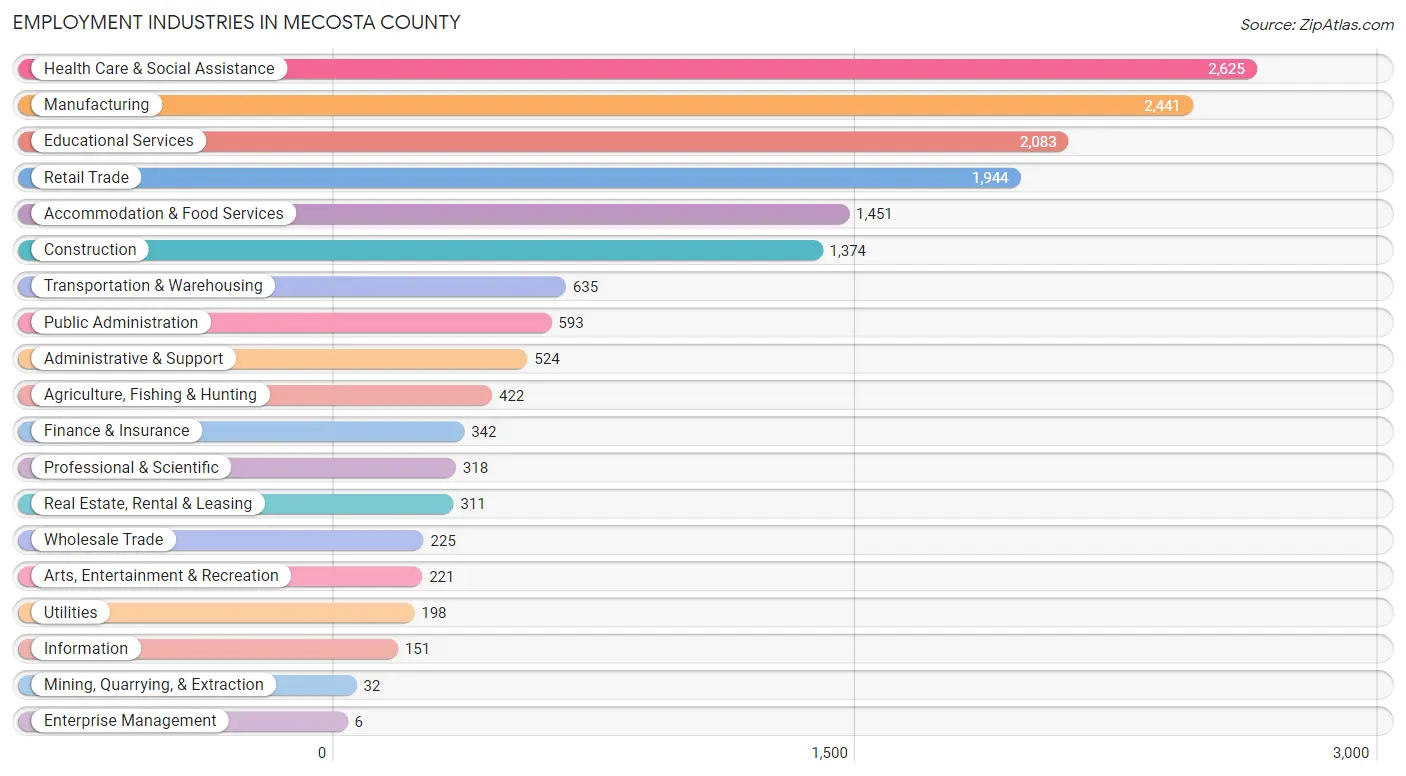
Employment Industries in Mecosta County
The major employment industries in Mecosta County include Health Care & Social Assistance (2,625 | 15.6%), Manufacturing (2,441 | 14.5%), Educational Services (2,083 | 12.4%), Retail Trade (1,944 | 11.6%), and Accommodation & Food Services (1,451 | 8.6%).
Employment Industries by Sex in Mecosta County
The Mecosta County industries that see more men than women are Enterprise Management (100.0%), Construction (89.5%), and Utilities (88.9%), whereas the industries that tend to have a higher number of women are Health Care & Social Assistance (87.5%), Finance & Insurance (79.5%), and Educational Services (62.5%).
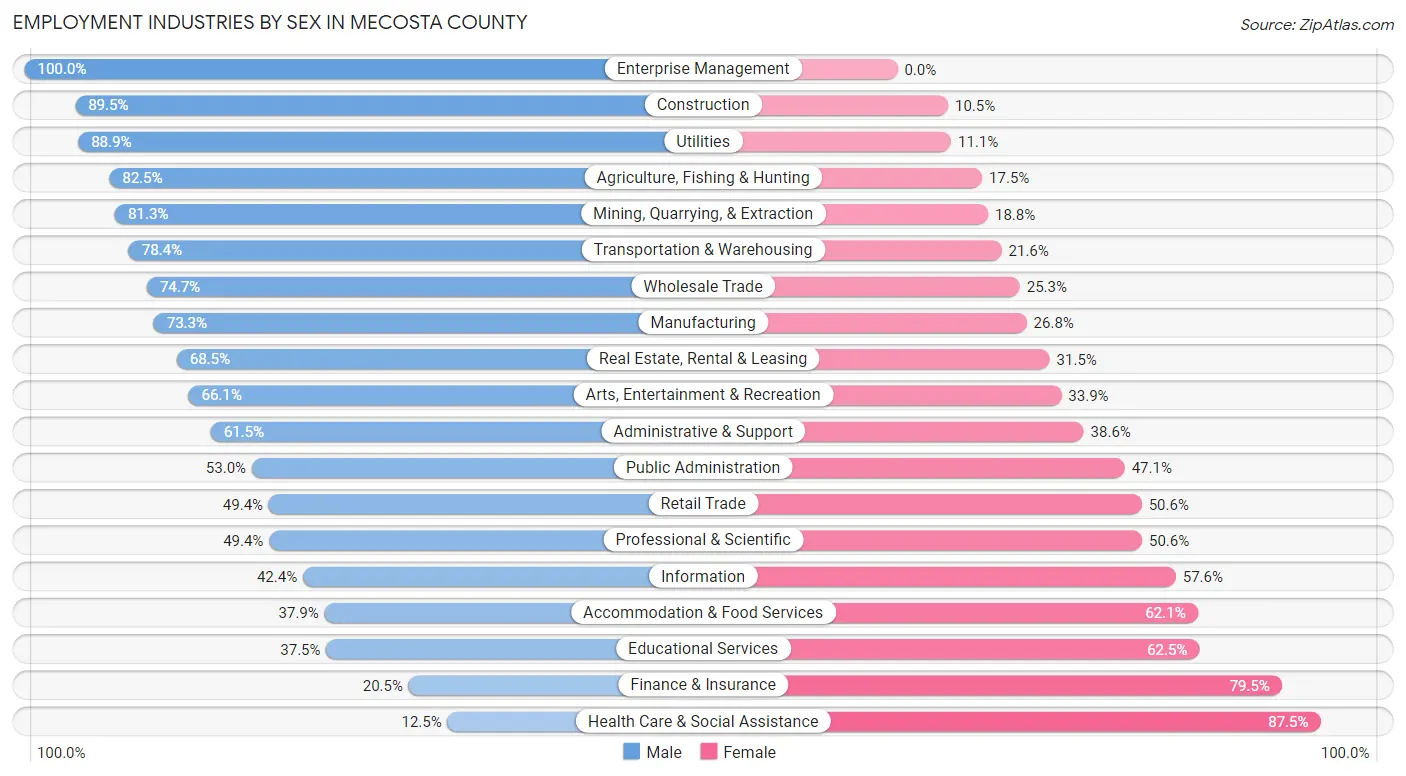
| Industry | Male | Female |
| Agriculture, Fishing & Hunting | 348 (82.5%) | 74 (17.5%) |
| Mining, Quarrying, & Extraction | 26 (81.2%) | 6 (18.8%) |
| Construction | 1,230 (89.5%) | 144 (10.5%) |
| Manufacturing | 1,788 (73.3%) | 653 (26.8%) |
| Wholesale Trade | 168 (74.7%) | 57 (25.3%) |
| Retail Trade | 961 (49.4%) | 983 (50.6%) |
| Transportation & Warehousing | 498 (78.4%) | 137 (21.6%) |
| Utilities | 176 (88.9%) | 22 (11.1%) |
| Information | 64 (42.4%) | 87 (57.6%) |
| Finance & Insurance | 70 (20.5%) | 272 (79.5%) |
| Real Estate, Rental & Leasing | 213 (68.5%) | 98 (31.5%) |
| Professional & Scientific | 157 (49.4%) | 161 (50.6%) |
| Enterprise Management | 6 (100.0%) | 0 (0.0%) |
| Administrative & Support | 322 (61.5%) | 202 (38.6%) |
| Educational Services | 782 (37.5%) | 1,301 (62.5%) |
| Health Care & Social Assistance | 327 (12.5%) | 2,298 (87.5%) |
| Arts, Entertainment & Recreation | 146 (66.1%) | 75 (33.9%) |
| Accommodation & Food Services | 550 (37.9%) | 901 (62.1%) |
| Public Administration | 314 (52.9%) | 279 (47.0%) |
| Total | 8,609 (51.2%) | 8,199 (48.8%) |
Education in Mecosta County
School Enrollment in Mecosta County
The most common levels of schooling among the 10,719 students in Mecosta County are college / undergraduate (4,566 | 42.6%), elementary school (1,660 | 15.5%), and middle school (1,565 | 14.6%).
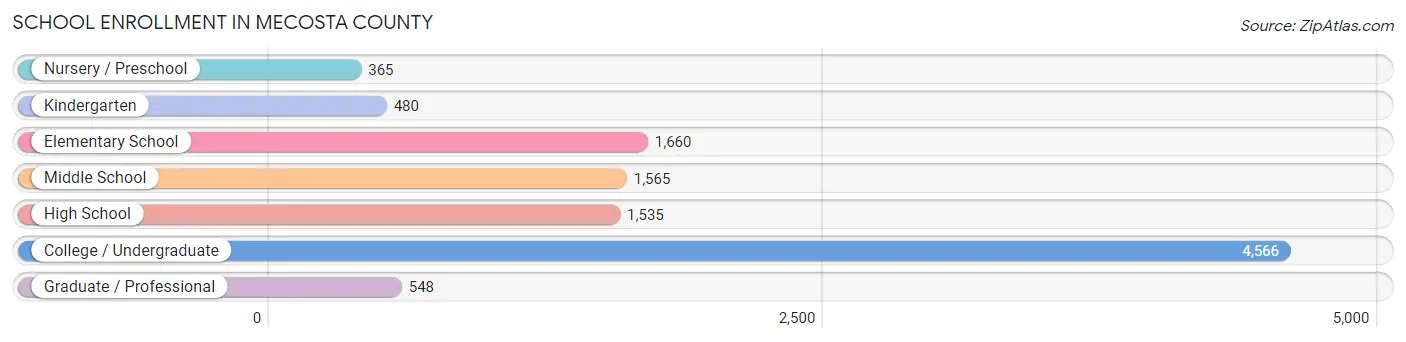
| School Level | # Students | % Students |
| Nursery / Preschool | 365 | 3.4% |
| Kindergarten | 480 | 4.5% |
| Elementary School | 1,660 | 15.5% |
| Middle School | 1,565 | 14.6% |
| High School | 1,535 | 14.3% |
| College / Undergraduate | 4,566 | 42.6% |
| Graduate / Professional | 548 | 5.1% |
| Total | 10,719 | 100.0% |
School Enrollment by Age by Funding Source in Mecosta County
Out of a total of 10,719 students who are enrolled in schools in Mecosta County, 1,619 (15.1%) attend a private institution, while the remaining 9,100 (84.9%) are enrolled in public schools. The age group of 25 to 34 year olds has the highest likelihood of being enrolled in private schools, with 145 (32.6% in the age bracket) enrolled. Conversely, the age group of 15 to 17 year olds has the lowest likelihood of being enrolled in a private school, with 1,244 (94.7% in the age bracket) attending a public institution.
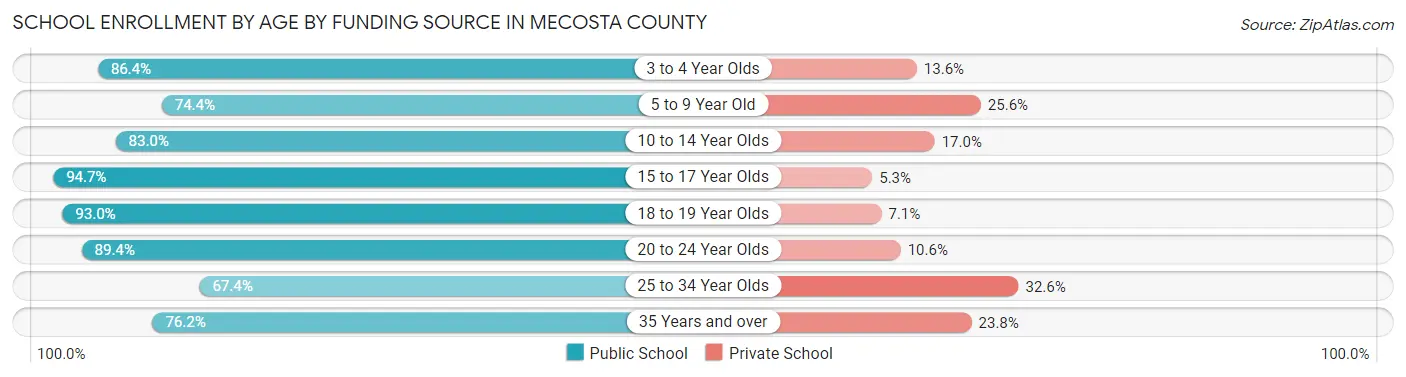
| Age Bracket | Public School | Private School |
| 3 to 4 Year Olds | 209 (86.4%) | 33 (13.6%) |
| 5 to 9 Year Old | 1,503 (74.4%) | 516 (25.6%) |
| 10 to 14 Year Olds | 1,645 (83.0%) | 336 (17.0%) |
| 15 to 17 Year Olds | 1,244 (94.7%) | 70 (5.3%) |
| 18 to 19 Year Olds | 1,187 (92.9%) | 90 (7.0%) |
| 20 to 24 Year Olds | 2,674 (89.4%) | 318 (10.6%) |
| 25 to 34 Year Olds | 300 (67.4%) | 145 (32.6%) |
| 35 Years and over | 342 (76.2%) | 107 (23.8%) |
| Total | 9,100 (84.9%) | 1,619 (15.1%) |
Educational Attainment by Field of Study in Mecosta County
Education (1,271 | 18.5%), business (1,230 | 17.9%), science & technology (873 | 12.7%), arts & humanities (840 | 12.3%), and bio, nature & agricultural (361 | 5.3%) are the most common fields of study among 6,854 individuals in Mecosta County who have obtained a bachelor's degree or higher.
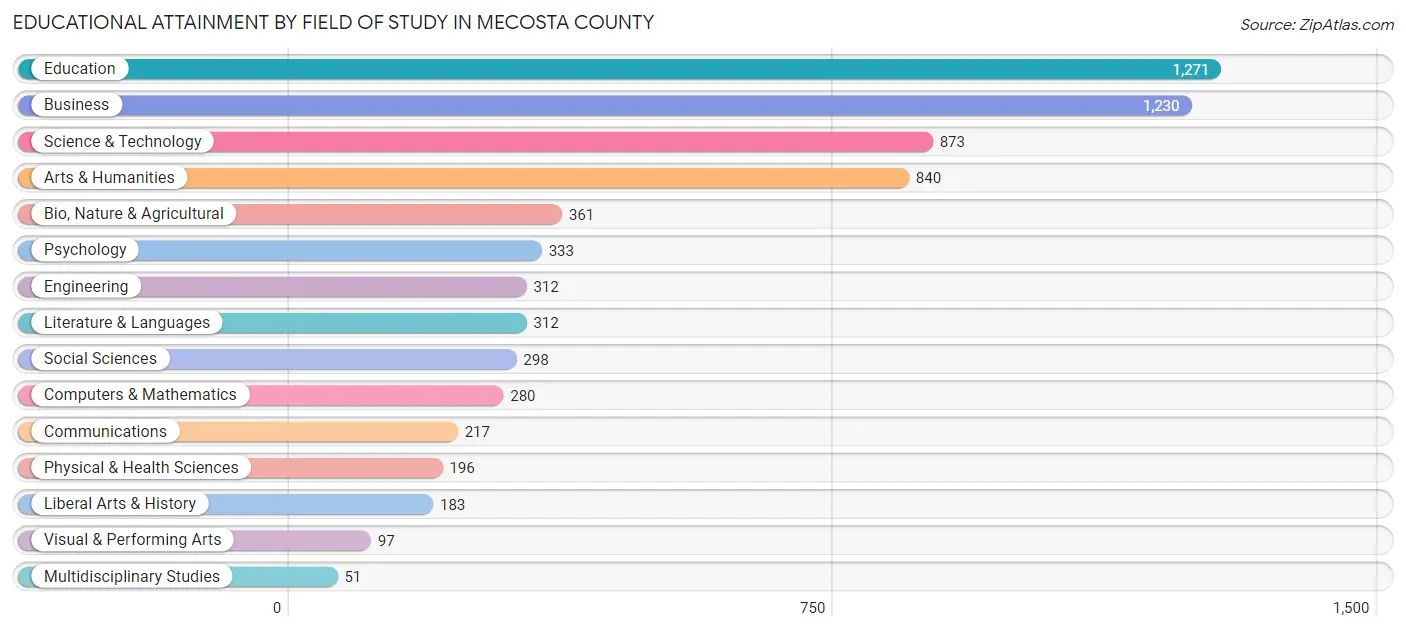
| Field of Study | # Graduates | % Graduates |
| Computers & Mathematics | 280 | 4.1% |
| Bio, Nature & Agricultural | 361 | 5.3% |
| Physical & Health Sciences | 196 | 2.9% |
| Psychology | 333 | 4.9% |
| Social Sciences | 298 | 4.3% |
| Engineering | 312 | 4.5% |
| Multidisciplinary Studies | 51 | 0.7% |
| Science & Technology | 873 | 12.7% |
| Business | 1,230 | 17.9% |
| Education | 1,271 | 18.5% |
| Literature & Languages | 312 | 4.5% |
| Liberal Arts & History | 183 | 2.7% |
| Visual & Performing Arts | 97 | 1.4% |
| Communications | 217 | 3.2% |
| Arts & Humanities | 840 | 12.3% |
| Total | 6,854 | 100.0% |
Transportation & Commute in Mecosta County
Vehicle Availability by Sex in Mecosta County
The most prevalent vehicle ownership categories in Mecosta County are males with 2 vehicles (3,357, accounting for 42.0%) and females with 2 vehicles (2,759, making up 44.6%).
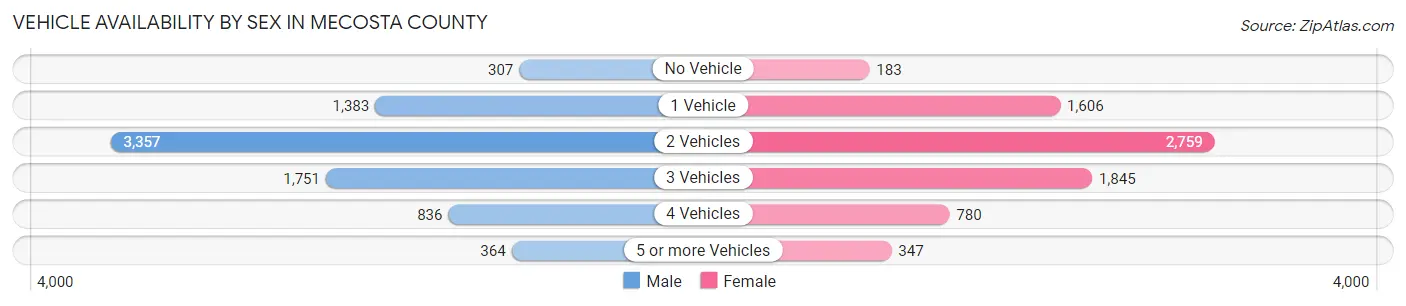
| Vehicles Available | Male | Female |
| No Vehicle | 307 (3.8%) | 183 (2.4%) |
| 1 Vehicle | 1,383 (17.3%) | 1,606 (21.4%) |
| 2 Vehicles | 3,357 (42.0%) | 2,759 (36.7%) |
| 3 Vehicles | 1,751 (21.9%) | 1,845 (24.5%) |
| 4 Vehicles | 836 (10.4%) | 780 (10.4%) |
| 5 or more Vehicles | 364 (4.5%) | 347 (4.6%) |
| Total | 7,998 (100.0%) | 7,520 (100.0%) |
Commute Time in Mecosta County
The most frequently occuring commute durations in Mecosta County are 5 to 9 minutes (2,562 commuters, 16.6%), 10 to 14 minutes (2,397 commuters, 15.5%), and 15 to 19 minutes (2,159 commuters, 14.0%).
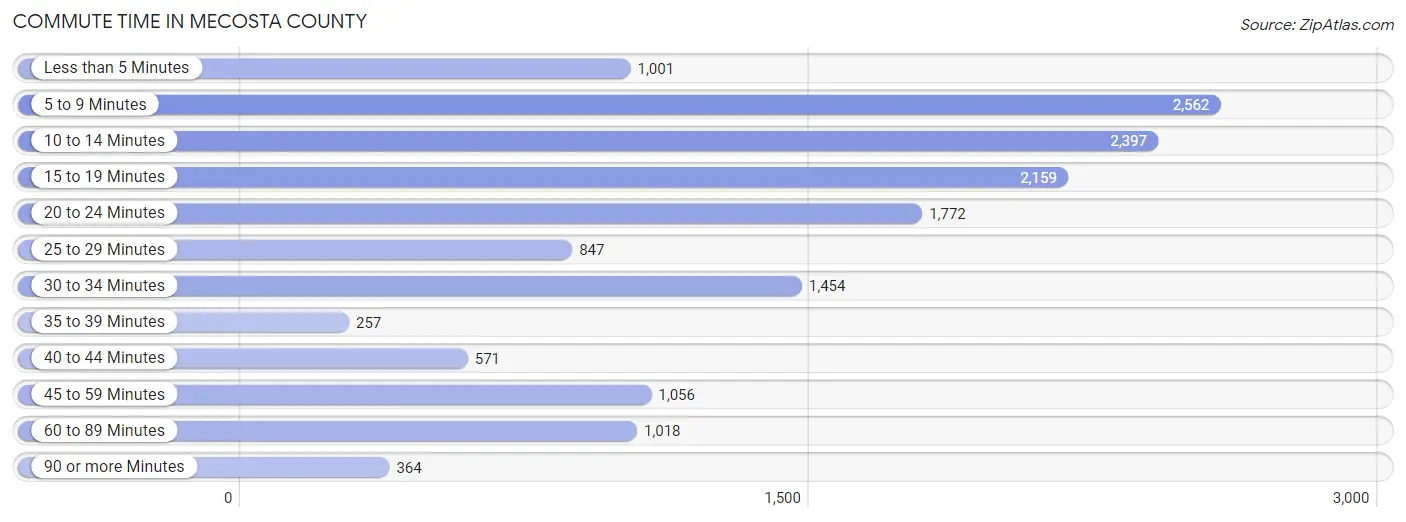
| Commute Time | # Commuters | % Commuters |
| Less than 5 Minutes | 1,001 | 6.5% |
| 5 to 9 Minutes | 2,562 | 16.6% |
| 10 to 14 Minutes | 2,397 | 15.5% |
| 15 to 19 Minutes | 2,159 | 14.0% |
| 20 to 24 Minutes | 1,772 | 11.5% |
| 25 to 29 Minutes | 847 | 5.5% |
| 30 to 34 Minutes | 1,454 | 9.4% |
| 35 to 39 Minutes | 257 | 1.7% |
| 40 to 44 Minutes | 571 | 3.7% |
| 45 to 59 Minutes | 1,056 | 6.8% |
| 60 to 89 Minutes | 1,018 | 6.6% |
| 90 or more Minutes | 364 | 2.4% |
Commute Time by Sex in Mecosta County
The most common commute times in Mecosta County are 5 to 9 minutes (1,204 commuters, 15.1%) for males and 5 to 9 minutes (1,358 commuters, 18.1%) for females.
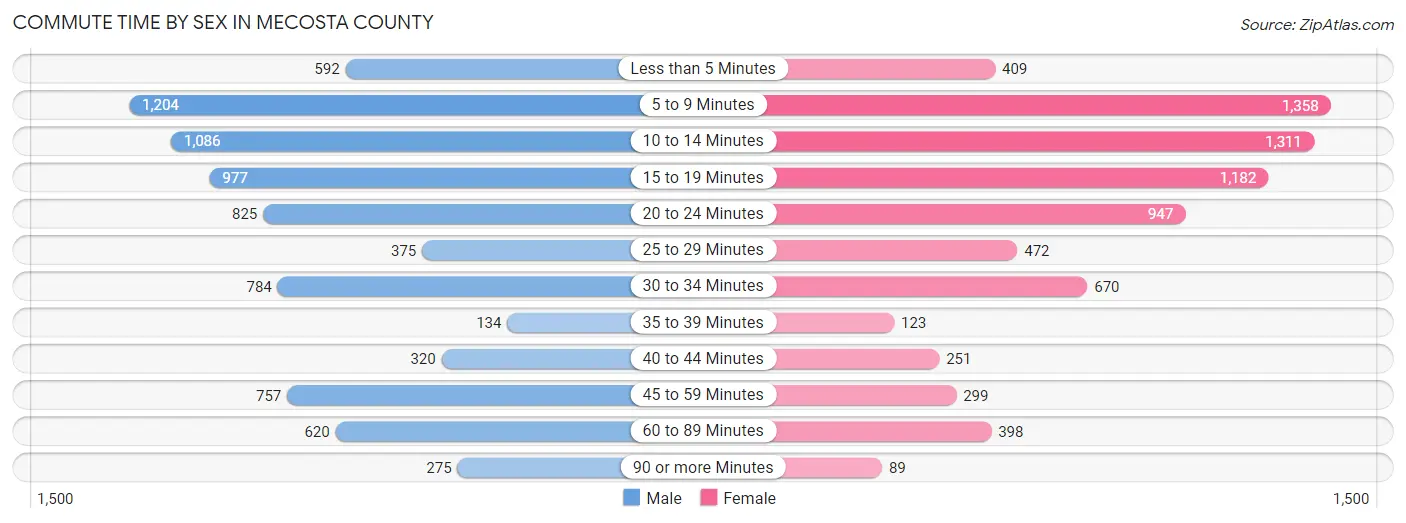
| Commute Time | Male | Female |
| Less than 5 Minutes | 592 (7.4%) | 409 (5.4%) |
| 5 to 9 Minutes | 1,204 (15.1%) | 1,358 (18.1%) |
| 10 to 14 Minutes | 1,086 (13.7%) | 1,311 (17.5%) |
| 15 to 19 Minutes | 977 (12.3%) | 1,182 (15.7%) |
| 20 to 24 Minutes | 825 (10.4%) | 947 (12.6%) |
| 25 to 29 Minutes | 375 (4.7%) | 472 (6.3%) |
| 30 to 34 Minutes | 784 (9.9%) | 670 (8.9%) |
| 35 to 39 Minutes | 134 (1.7%) | 123 (1.6%) |
| 40 to 44 Minutes | 320 (4.0%) | 251 (3.3%) |
| 45 to 59 Minutes | 757 (9.5%) | 299 (4.0%) |
| 60 to 89 Minutes | 620 (7.8%) | 398 (5.3%) |
| 90 or more Minutes | 275 (3.5%) | 89 (1.2%) |
Time of Departure to Work by Sex in Mecosta County
The most frequent times of departure to work in Mecosta County are 7:30 AM to 7:59 AM (937, 11.8%) for males and 7:30 AM to 7:59 AM (1,095, 14.6%) for females.
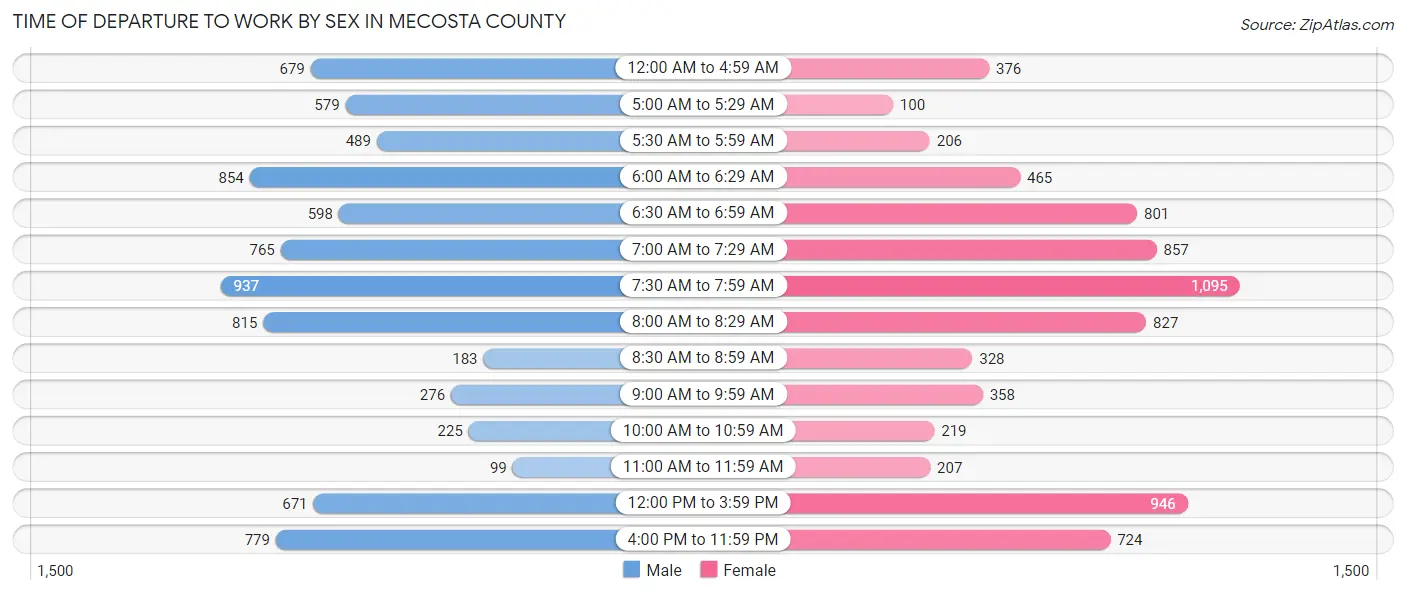
| Time of Departure | Male | Female |
| 12:00 AM to 4:59 AM | 679 (8.5%) | 376 (5.0%) |
| 5:00 AM to 5:29 AM | 579 (7.3%) | 100 (1.3%) |
| 5:30 AM to 5:59 AM | 489 (6.1%) | 206 (2.7%) |
| 6:00 AM to 6:29 AM | 854 (10.7%) | 465 (6.2%) |
| 6:30 AM to 6:59 AM | 598 (7.5%) | 801 (10.7%) |
| 7:00 AM to 7:29 AM | 765 (9.6%) | 857 (11.4%) |
| 7:30 AM to 7:59 AM | 937 (11.8%) | 1,095 (14.6%) |
| 8:00 AM to 8:29 AM | 815 (10.2%) | 827 (11.0%) |
| 8:30 AM to 8:59 AM | 183 (2.3%) | 328 (4.4%) |
| 9:00 AM to 9:59 AM | 276 (3.5%) | 358 (4.8%) |
| 10:00 AM to 10:59 AM | 225 (2.8%) | 219 (2.9%) |
| 11:00 AM to 11:59 AM | 99 (1.3%) | 207 (2.8%) |
| 12:00 PM to 3:59 PM | 671 (8.4%) | 946 (12.6%) |
| 4:00 PM to 11:59 PM | 779 (9.8%) | 724 (9.6%) |
| Total | 7,949 (100.0%) | 7,509 (100.0%) |
Housing Occupancy in Mecosta County
Occupancy by Ownership in Mecosta County
Of the total 16,103 dwellings in Mecosta County, owner-occupied units account for 12,230 (75.9%), while renter-occupied units make up 3,873 (24.0%).
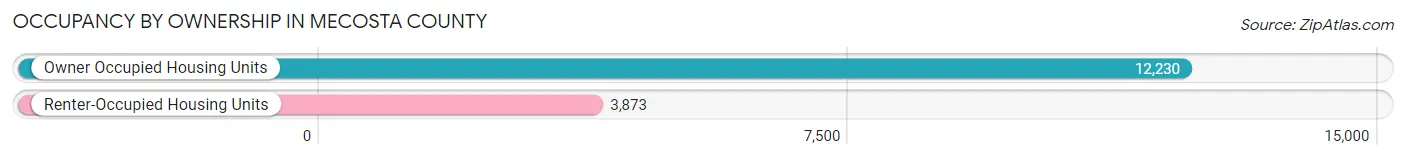
| Occupancy | # Housing Units | % Housing Units |
| Owner Occupied Housing Units | 12,230 | 75.9% |
| Renter-Occupied Housing Units | 3,873 | 24.0% |
| Total Occupied Housing Units | 16,103 | 100.0% |
Occupancy by Household Size in Mecosta County
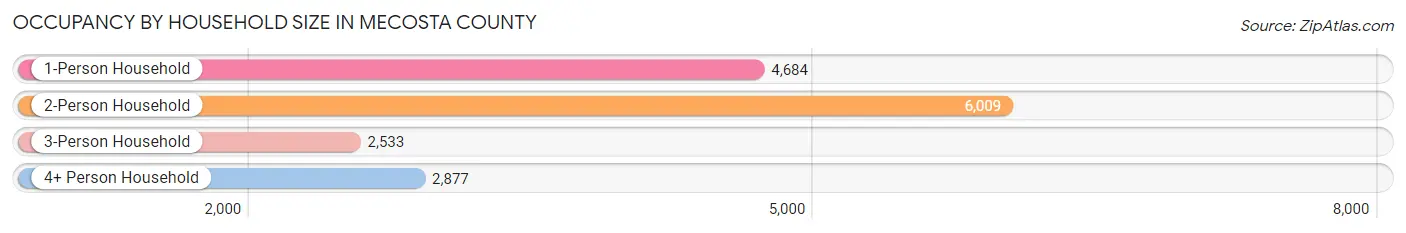
| Household Size | # Housing Units | % Housing Units |
| 1-Person Household | 4,684 | 29.1% |
| 2-Person Household | 6,009 | 37.3% |
| 3-Person Household | 2,533 | 15.7% |
| 4+ Person Household | 2,877 | 17.9% |
| Total Housing Units | 16,103 | 100.0% |
Occupancy by Ownership by Household Size in Mecosta County
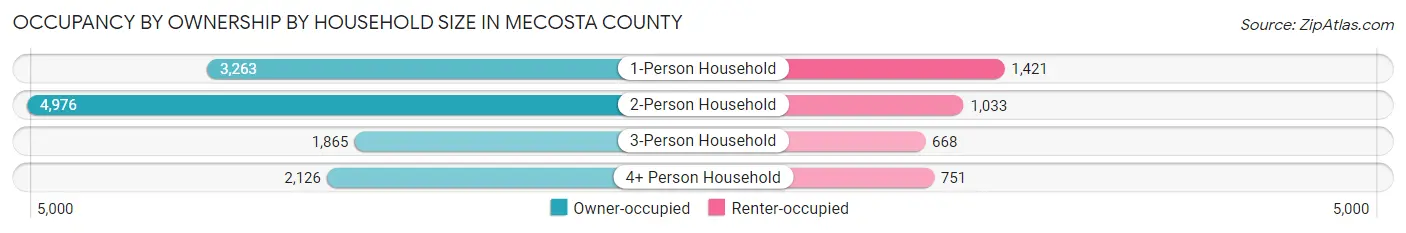
| Household Size | Owner-occupied | Renter-occupied |
| 1-Person Household | 3,263 (69.7%) | 1,421 (30.3%) |
| 2-Person Household | 4,976 (82.8%) | 1,033 (17.2%) |
| 3-Person Household | 1,865 (73.6%) | 668 (26.4%) |
| 4+ Person Household | 2,126 (73.9%) | 751 (26.1%) |
| Total Housing Units | 12,230 (75.9%) | 3,873 (24.0%) |
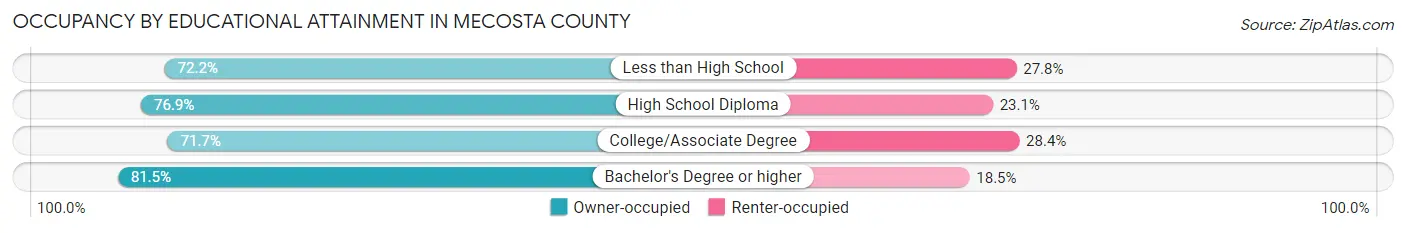
Occupancy by Educational Attainment in Mecosta County
| Household Size | Owner-occupied | Renter-occupied |
| Less than High School | 759 (72.2%) | 292 (27.8%) |
| High School Diploma | 4,135 (76.9%) | 1,242 (23.1%) |
| College/Associate Degree | 4,000 (71.7%) | 1,583 (28.3%) |
| Bachelor's Degree or higher | 3,336 (81.5%) | 756 (18.5%) |
Occupancy by Age of Householder in Mecosta County
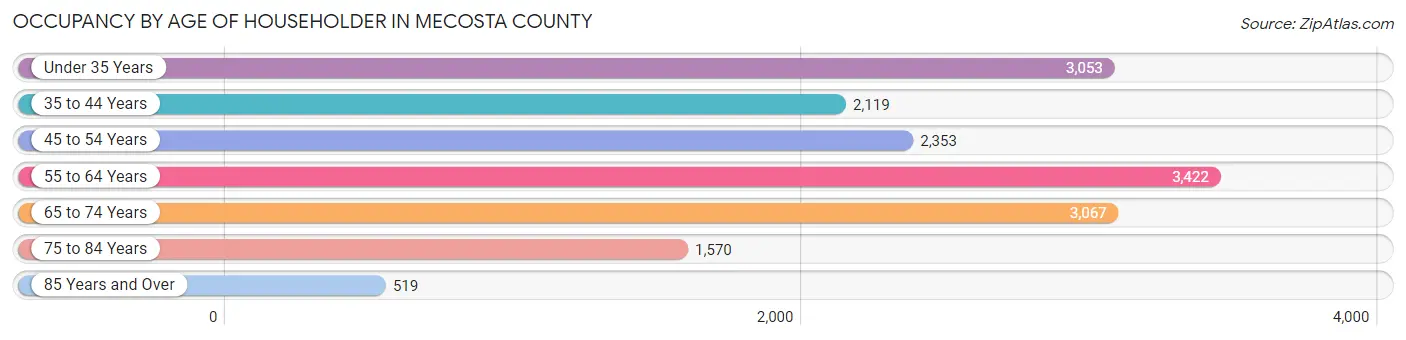
| Age Bracket | # Households | % Households |
| Under 35 Years | 3,053 | 19.0% |
| 35 to 44 Years | 2,119 | 13.2% |
| 45 to 54 Years | 2,353 | 14.6% |
| 55 to 64 Years | 3,422 | 21.2% |
| 65 to 74 Years | 3,067 | 19.1% |
| 75 to 84 Years | 1,570 | 9.8% |
| 85 Years and Over | 519 | 3.2% |
| Total | 16,103 | 100.0% |
Housing Finances in Mecosta County
Median Income by Occupancy in Mecosta County
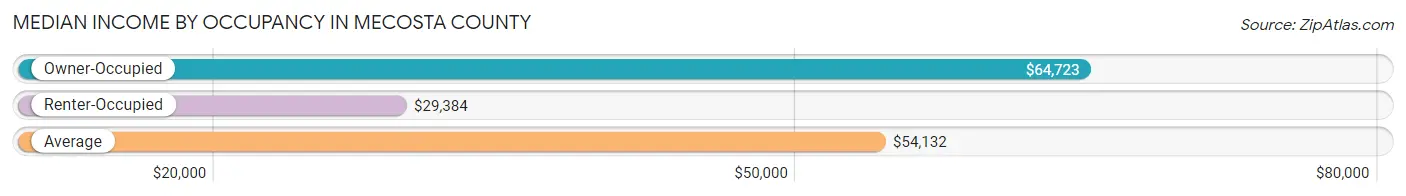
| Occupancy Type | # Households | Median Income |
| Owner-Occupied | 12,230 (75.9%) | $64,723 |
| Renter-Occupied | 3,873 (24.0%) | $29,384 |
| Average | 16,103 (100.0%) | $54,132 |
Occupancy by Householder Income Bracket in Mecosta County
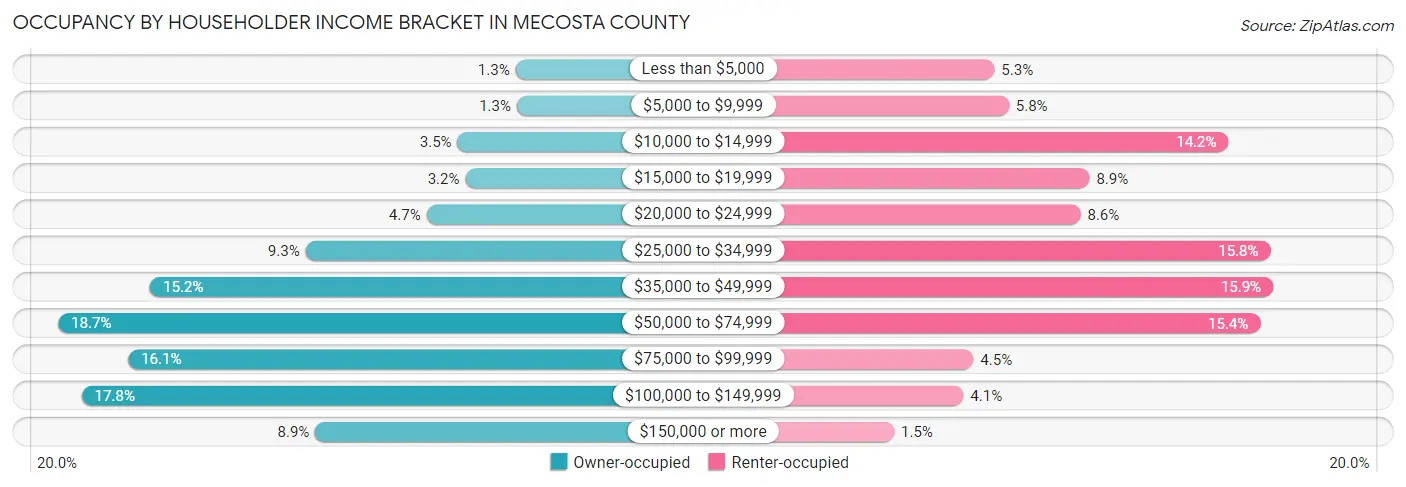
| Income Bracket | Owner-occupied | Renter-occupied |
| Less than $5,000 | 159 (1.3%) | 205 (5.3%) |
| $5,000 to $9,999 | 153 (1.3%) | 226 (5.8%) |
| $10,000 to $14,999 | 429 (3.5%) | 550 (14.2%) |
| $15,000 to $19,999 | 392 (3.2%) | 345 (8.9%) |
| $20,000 to $24,999 | 574 (4.7%) | 332 (8.6%) |
| $25,000 to $34,999 | 1,137 (9.3%) | 612 (15.8%) |
| $35,000 to $49,999 | 1,861 (15.2%) | 616 (15.9%) |
| $50,000 to $74,999 | 2,290 (18.7%) | 597 (15.4%) |
| $75,000 to $99,999 | 1,963 (16.1%) | 174 (4.5%) |
| $100,000 to $149,999 | 2,180 (17.8%) | 159 (4.1%) |
| $150,000 or more | 1,092 (8.9%) | 57 (1.5%) |
| Total | 12,230 (100.0%) | 3,873 (100.0%) |
Monthly Housing Cost Tiers in Mecosta County
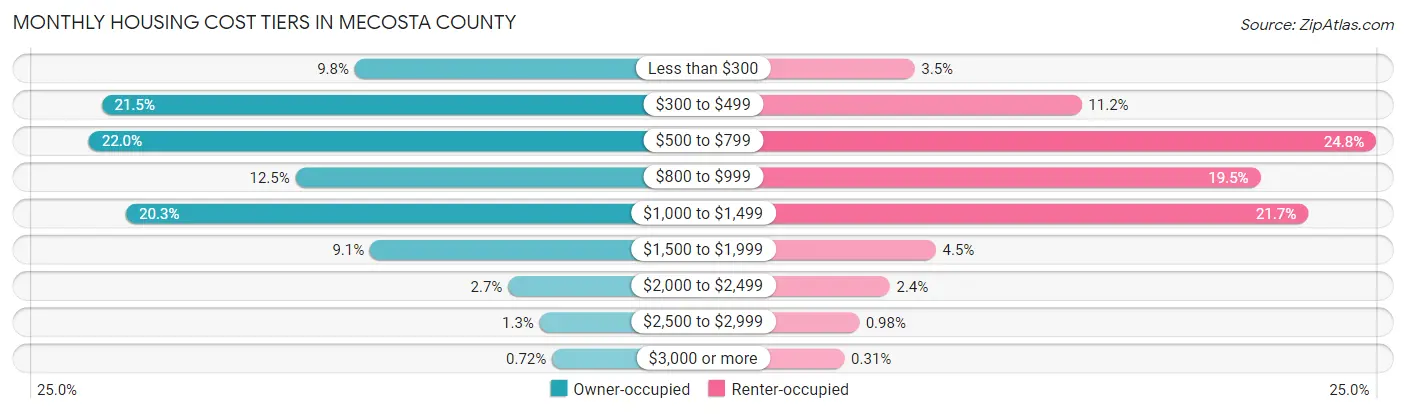
| Monthly Cost | Owner-occupied | Renter-occupied |
| Less than $300 | 1,198 (9.8%) | 137 (3.5%) |
| $300 to $499 | 2,624 (21.5%) | 435 (11.2%) |
| $500 to $799 | 2,695 (22.0%) | 960 (24.8%) |
| $800 to $999 | 1,533 (12.5%) | 754 (19.5%) |
| $1,000 to $1,499 | 2,486 (20.3%) | 839 (21.7%) |
| $1,500 to $1,999 | 1,113 (9.1%) | 175 (4.5%) |
| $2,000 to $2,499 | 335 (2.7%) | 93 (2.4%) |
| $2,500 to $2,999 | 158 (1.3%) | 38 (1.0%) |
| $3,000 or more | 88 (0.7%) | 12 (0.3%) |
| Total | 12,230 (100.0%) | 3,873 (100.0%) |
Physical Housing Characteristics in Mecosta County
Housing Structures in Mecosta County
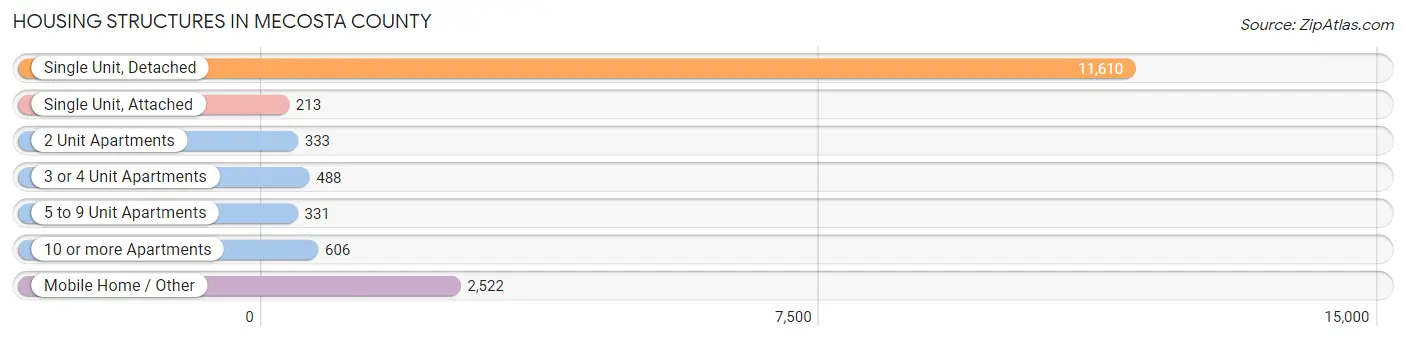
| Structure Type | # Housing Units | % Housing Units |
| Single Unit, Detached | 11,610 | 72.1% |
| Single Unit, Attached | 213 | 1.3% |
| 2 Unit Apartments | 333 | 2.1% |
| 3 or 4 Unit Apartments | 488 | 3.0% |
| 5 to 9 Unit Apartments | 331 | 2.1% |
| 10 or more Apartments | 606 | 3.8% |
| Mobile Home / Other | 2,522 | 15.7% |
| Total | 16,103 | 100.0% |
Housing Structures by Occupancy in Mecosta County
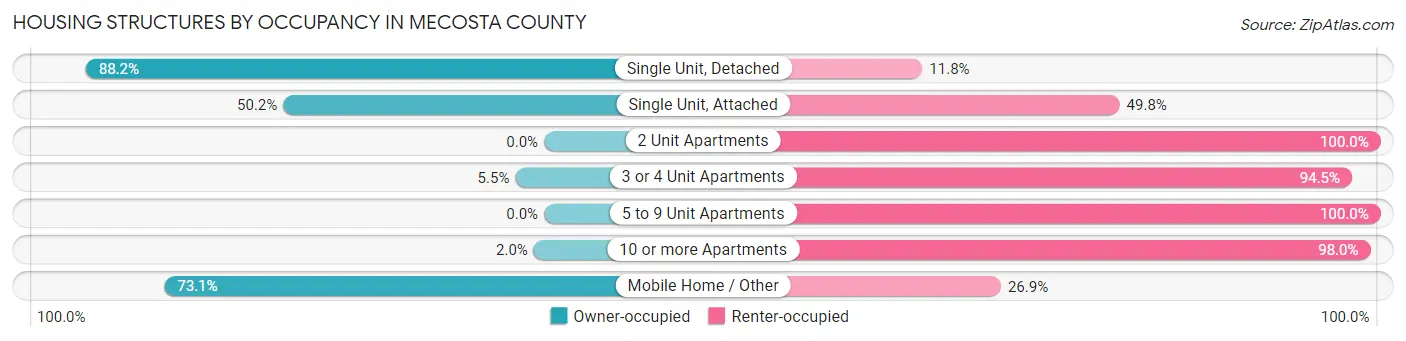
| Structure Type | Owner-occupied | Renter-occupied |
| Single Unit, Detached | 10,241 (88.2%) | 1,369 (11.8%) |
| Single Unit, Attached | 107 (50.2%) | 106 (49.8%) |
| 2 Unit Apartments | 0 (0.0%) | 333 (100.0%) |
| 3 or 4 Unit Apartments | 27 (5.5%) | 461 (94.5%) |
| 5 to 9 Unit Apartments | 0 (0.0%) | 331 (100.0%) |
| 10 or more Apartments | 12 (2.0%) | 594 (98.0%) |
| Mobile Home / Other | 1,843 (73.1%) | 679 (26.9%) |
| Total | 12,230 (75.9%) | 3,873 (24.0%) |
Housing Structures by Number of Rooms in Mecosta County
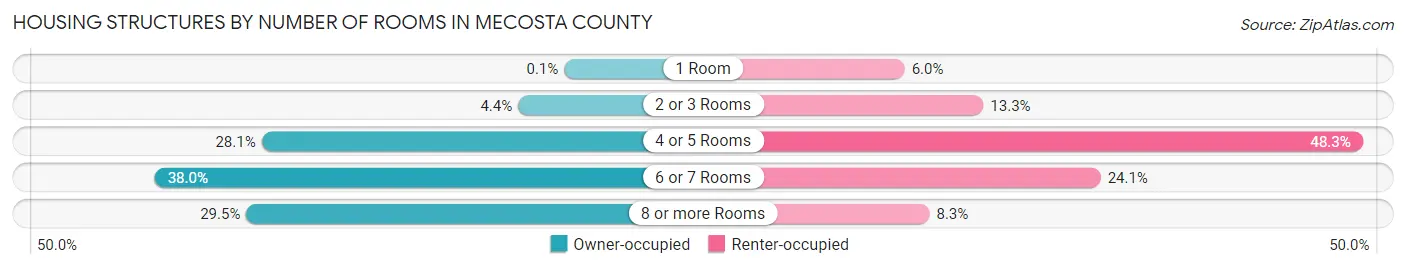
| Number of Rooms | Owner-occupied | Renter-occupied |
| 1 Room | 12 (0.1%) | 232 (6.0%) |
| 2 or 3 Rooms | 533 (4.4%) | 514 (13.3%) |
| 4 or 5 Rooms | 3,435 (28.1%) | 1,872 (48.3%) |
| 6 or 7 Rooms | 4,642 (38.0%) | 934 (24.1%) |
| 8 or more Rooms | 3,608 (29.5%) | 321 (8.3%) |
| Total | 12,230 (100.0%) | 3,873 (100.0%) |
Housing Structure by Heating Type in Mecosta County
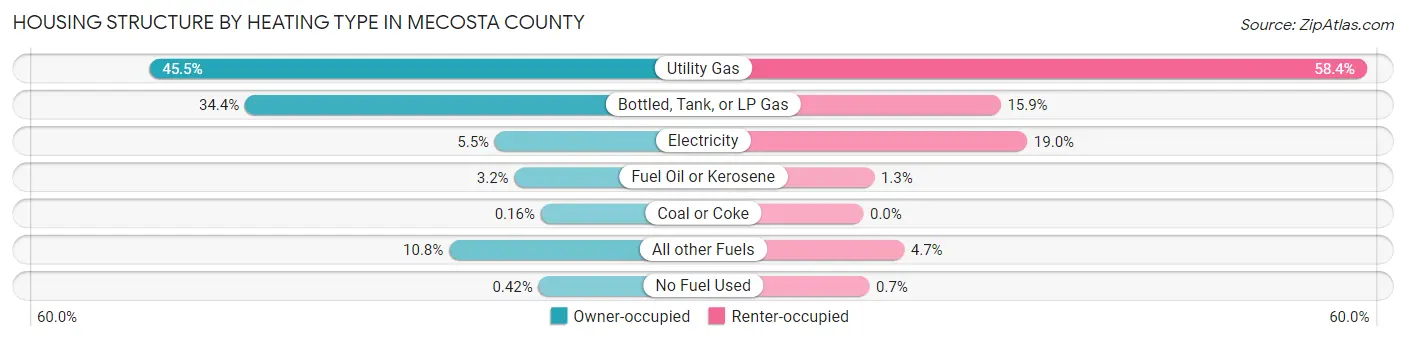
| Heating Type | Owner-occupied | Renter-occupied |
| Utility Gas | 5,569 (45.5%) | 2,261 (58.4%) |
| Bottled, Tank, or LP Gas | 4,212 (34.4%) | 617 (15.9%) |
| Electricity | 669 (5.5%) | 736 (19.0%) |
| Fuel Oil or Kerosene | 392 (3.2%) | 49 (1.3%) |
| Coal or Coke | 19 (0.2%) | 0 (0.0%) |
| All other Fuels | 1,318 (10.8%) | 183 (4.7%) |
| No Fuel Used | 51 (0.4%) | 27 (0.7%) |
| Total | 12,230 (100.0%) | 3,873 (100.0%) |
Household Vehicle Usage in Mecosta County
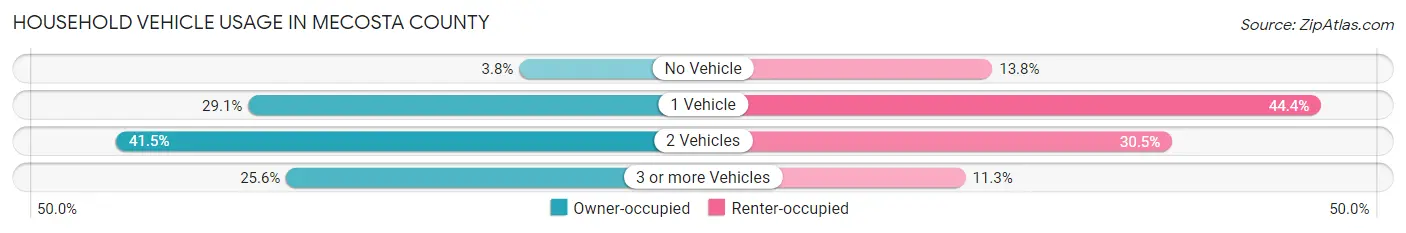
| Vehicles per Household | Owner-occupied | Renter-occupied |
| No Vehicle | 469 (3.8%) | 533 (13.8%) |
| 1 Vehicle | 3,562 (29.1%) | 1,721 (44.4%) |
| 2 Vehicles | 5,070 (41.5%) | 1,183 (30.5%) |
| 3 or more Vehicles | 3,129 (25.6%) | 436 (11.3%) |
| Total | 12,230 (100.0%) | 3,873 (100.0%) |
Real Estate & Mortgages in Mecosta County
Real Estate and Mortgage Overview in Mecosta County
| Characteristic | Without Mortgage | With Mortgage |
| Housing Units | 6,145 | 6,085 |
| Median Property Value | $132,700 | $167,200 |
| Median Household Income | $51,737 | $770 |
| Monthly Housing Costs | $449 | $86 |
| Real Estate Taxes | $1,478 | $286 |
Property Value by Mortgage Status in Mecosta County
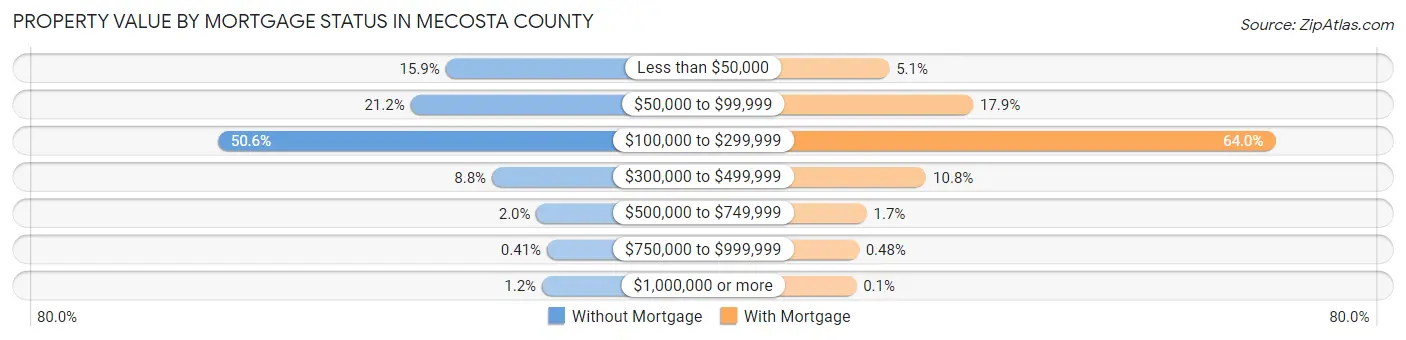
| Property Value | Without Mortgage | With Mortgage |
| Less than $50,000 | 974 (15.9%) | 312 (5.1%) |
| $50,000 to $99,999 | 1,303 (21.2%) | 1,089 (17.9%) |
| $100,000 to $299,999 | 3,107 (50.6%) | 3,892 (64.0%) |
| $300,000 to $499,999 | 540 (8.8%) | 655 (10.8%) |
| $500,000 to $749,999 | 124 (2.0%) | 102 (1.7%) |
| $750,000 to $999,999 | 25 (0.4%) | 29 (0.5%) |
| $1,000,000 or more | 72 (1.2%) | 6 (0.1%) |
| Total | 6,145 (100.0%) | 6,085 (100.0%) |
Household Income by Mortgage Status in Mecosta County
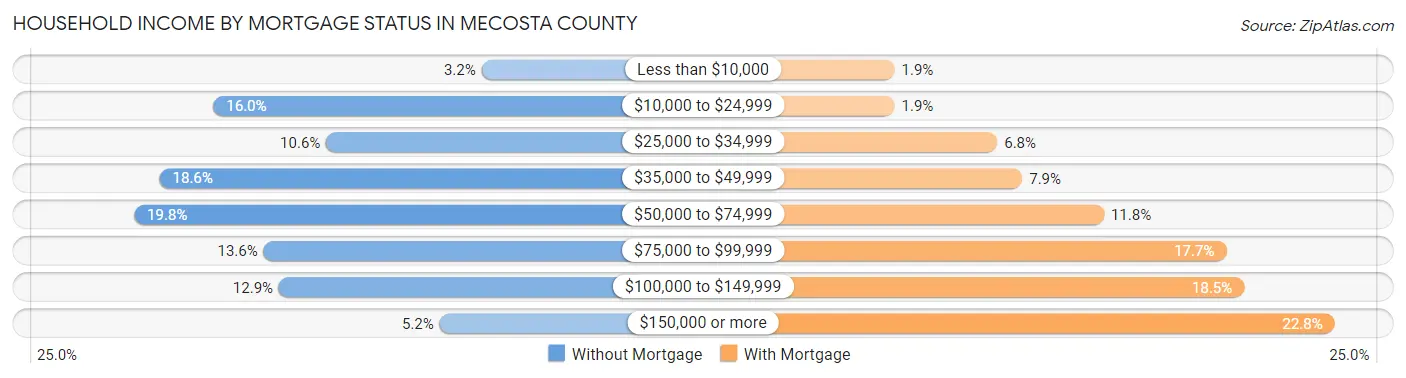
| Household Income | Without Mortgage | With Mortgage |
| Less than $10,000 | 199 (3.2%) | 113 (1.9%) |
| $10,000 to $24,999 | 984 (16.0%) | 113 (1.9%) |
| $25,000 to $34,999 | 654 (10.6%) | 411 (6.8%) |
| $35,000 to $49,999 | 1,141 (18.6%) | 483 (7.9%) |
| $50,000 to $74,999 | 1,216 (19.8%) | 720 (11.8%) |
| $75,000 to $99,999 | 837 (13.6%) | 1,074 (17.6%) |
| $100,000 to $149,999 | 792 (12.9%) | 1,126 (18.5%) |
| $150,000 or more | 322 (5.2%) | 1,388 (22.8%) |
| Total | 6,145 (100.0%) | 6,085 (100.0%) |
Property Value to Household Income Ratio in Mecosta County
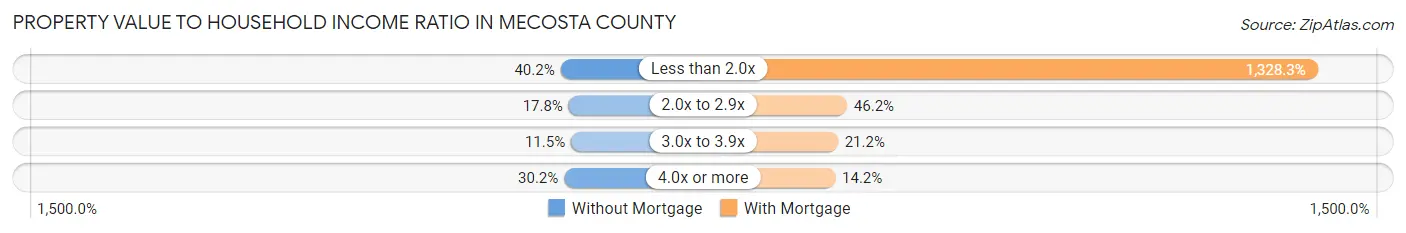
| Value-to-Income Ratio | Without Mortgage | With Mortgage |
| Less than 2.0x | 2,471 (40.2%) | 80,827 (1,328.3%) |
| 2.0x to 2.9x | 1,092 (17.8%) | 2,814 (46.2%) |
| 3.0x to 3.9x | 707 (11.5%) | 1,292 (21.2%) |
| 4.0x or more | 1,858 (30.2%) | 864 (14.2%) |
| Total | 6,145 (100.0%) | 6,085 (100.0%) |
Real Estate Taxes by Mortgage Status in Mecosta County
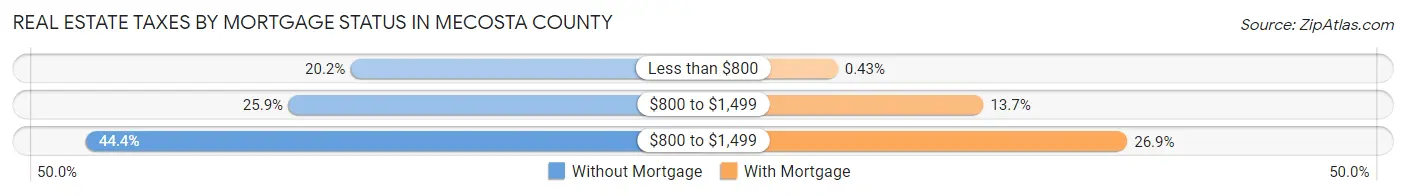
| Property Taxes | Without Mortgage | With Mortgage |
| Less than $800 | 1,240 (20.2%) | 26 (0.4%) |
| $800 to $1,499 | 1,589 (25.9%) | 836 (13.7%) |
| $800 to $1,499 | 2,727 (44.4%) | 1,635 (26.9%) |
| Total | 6,145 (100.0%) | 6,085 (100.0%) |
Health & Disability in Mecosta County
Health Insurance Coverage by Age in Mecosta County
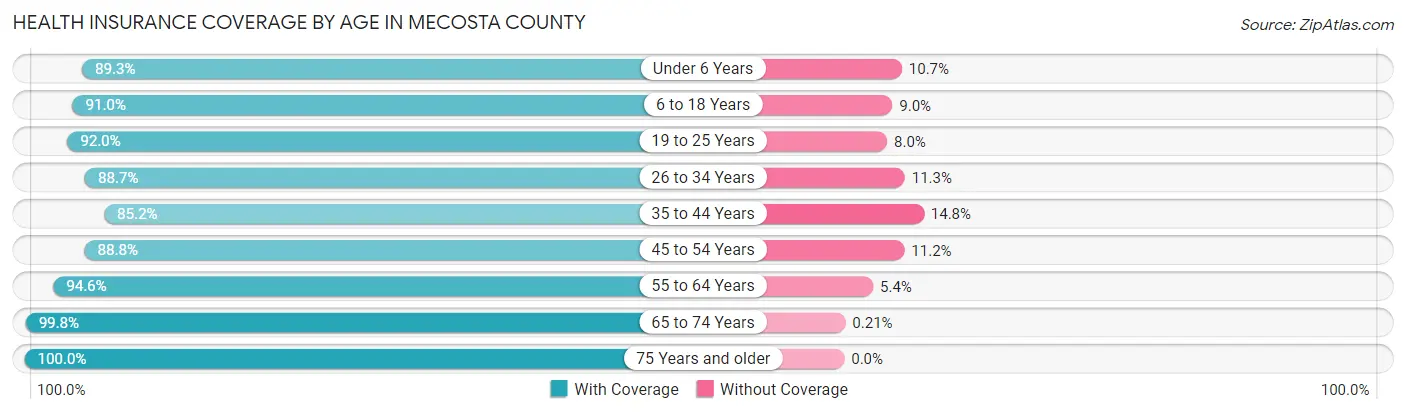
| Age Bracket | With Coverage | Without Coverage |
| Under 6 Years | 2,279 (89.3%) | 274 (10.7%) |
| 6 to 18 Years | 5,366 (91.0%) | 528 (9.0%) |
| 19 to 25 Years | 5,201 (92.0%) | 451 (8.0%) |
| 26 to 34 Years | 3,362 (88.7%) | 428 (11.3%) |
| 35 to 44 Years | 3,455 (85.2%) | 602 (14.8%) |
| 45 to 54 Years | 3,875 (88.8%) | 489 (11.2%) |
| 55 to 64 Years | 5,459 (94.6%) | 310 (5.4%) |
| 65 to 74 Years | 4,778 (99.8%) | 10 (0.2%) |
| 75 Years and older | 3,000 (100.0%) | 0 (0.0%) |
| Total | 36,775 (92.2%) | 3,092 (7.8%) |
Health Insurance Coverage by Citizenship Status in Mecosta County
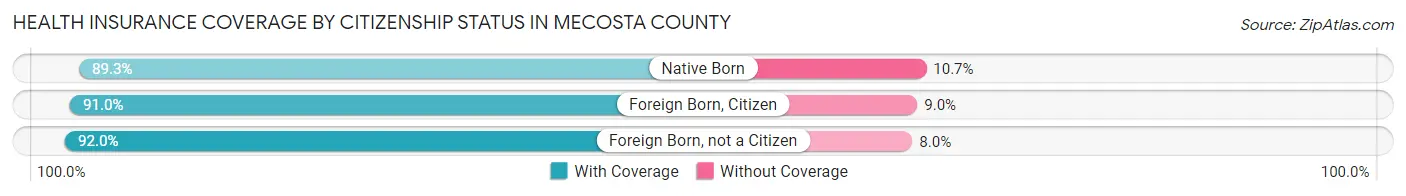
| Citizenship Status | With Coverage | Without Coverage |
| Native Born | 2,279 (89.3%) | 274 (10.7%) |
| Foreign Born, Citizen | 5,366 (91.0%) | 528 (9.0%) |
| Foreign Born, not a Citizen | 5,201 (92.0%) | 451 (8.0%) |
Health Insurance Coverage by Household Income in Mecosta County
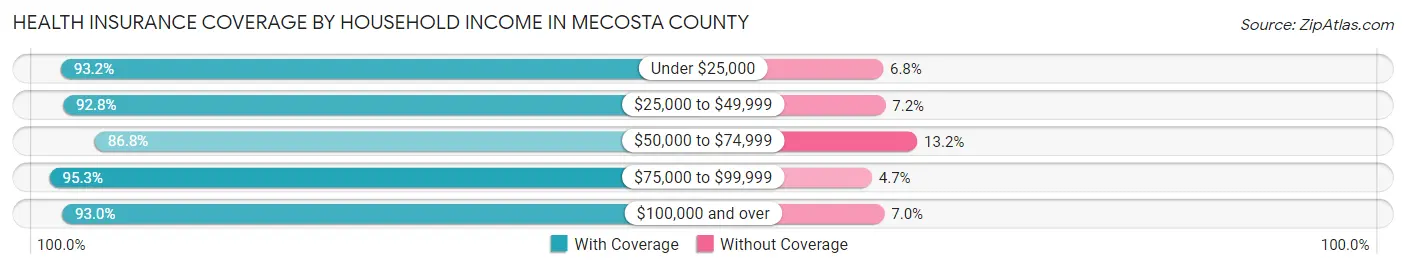
| Household Income | With Coverage | Without Coverage |
| Under $25,000 | 5,301 (93.2%) | 386 (6.8%) |
| $25,000 to $49,999 | 7,888 (92.8%) | 615 (7.2%) |
| $50,000 to $74,999 | 6,475 (86.8%) | 983 (13.2%) |
| $75,000 to $99,999 | 5,588 (95.3%) | 275 (4.7%) |
| $100,000 and over | 9,483 (93.0%) | 717 (7.0%) |
Public vs Private Health Insurance Coverage by Age in Mecosta County
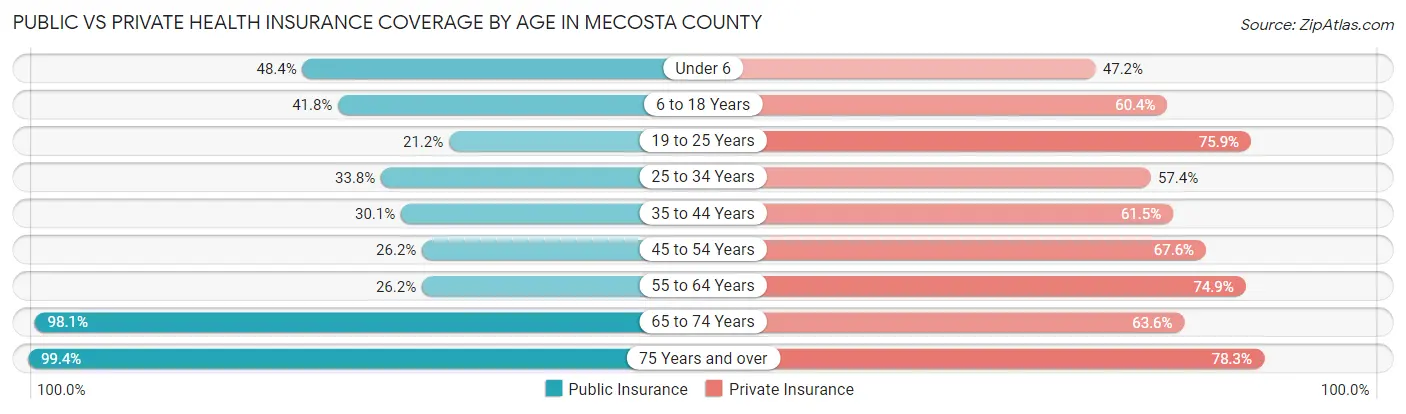
| Age Bracket | Public Insurance | Private Insurance |
| Under 6 | 1,236 (48.4%) | 1,204 (47.2%) |
| 6 to 18 Years | 2,463 (41.8%) | 3,561 (60.4%) |
| 19 to 25 Years | 1,199 (21.2%) | 4,292 (75.9%) |
| 25 to 34 Years | 1,282 (33.8%) | 2,176 (57.4%) |
| 35 to 44 Years | 1,222 (30.1%) | 2,494 (61.5%) |
| 45 to 54 Years | 1,144 (26.2%) | 2,949 (67.6%) |
| 55 to 64 Years | 1,514 (26.2%) | 4,323 (74.9%) |
| 65 to 74 Years | 4,699 (98.1%) | 3,044 (63.6%) |
| 75 Years and over | 2,981 (99.4%) | 2,350 (78.3%) |
| Total | 17,740 (44.5%) | 26,393 (66.2%) |
Disability Status by Sex by Age in Mecosta County
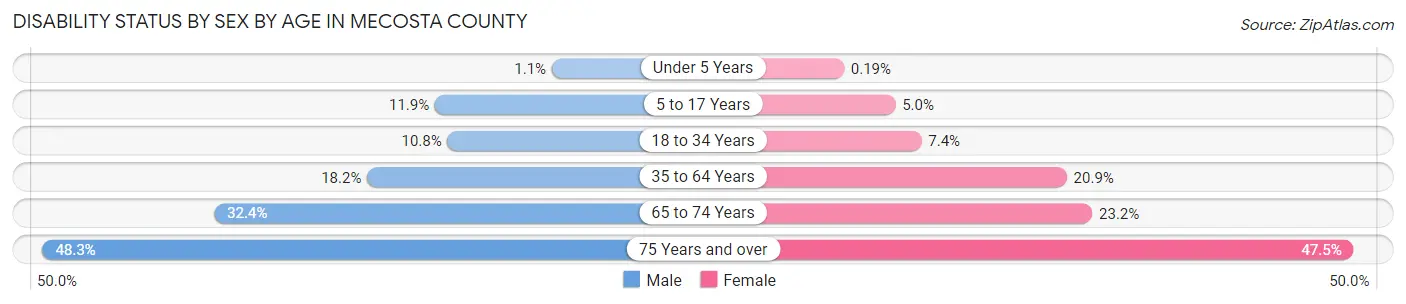
| Age Bracket | Male | Female |
| Under 5 Years | 11 (1.1%) | 2 (0.2%) |
| 5 to 17 Years | 345 (11.9%) | 141 (5.0%) |
| 18 to 34 Years | 569 (10.7%) | 353 (7.4%) |
| 35 to 64 Years | 1,290 (18.2%) | 1,482 (20.9%) |
| 65 to 74 Years | 762 (32.4%) | 566 (23.2%) |
| 75 Years and over | 640 (48.3%) | 796 (47.5%) |
Disability Class by Sex by Age in Mecosta County
Disability Class: Hearing Difficulty
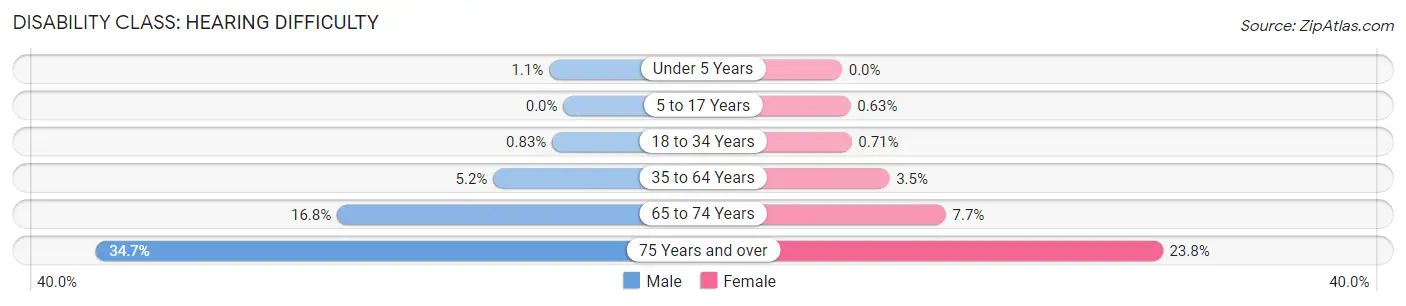
| Age Bracket | Male | Female |
| Under 5 Years | 11 (1.1%) | 0 (0.0%) |
| 5 to 17 Years | 0 (0.0%) | 18 (0.6%) |
| 18 to 34 Years | 44 (0.8%) | 34 (0.7%) |
| 35 to 64 Years | 369 (5.2%) | 250 (3.5%) |
| 65 to 74 Years | 395 (16.8%) | 188 (7.7%) |
| 75 Years and over | 459 (34.7%) | 399 (23.8%) |
Disability Class: Vision Difficulty
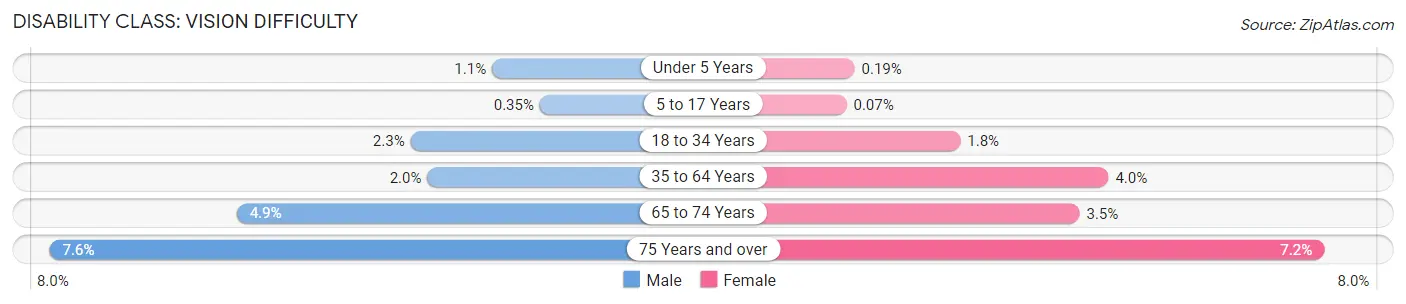
| Age Bracket | Male | Female |
| Under 5 Years | 11 (1.1%) | 2 (0.2%) |
| 5 to 17 Years | 10 (0.4%) | 2 (0.1%) |
| 18 to 34 Years | 120 (2.3%) | 84 (1.8%) |
| 35 to 64 Years | 143 (2.0%) | 281 (4.0%) |
| 65 to 74 Years | 114 (4.9%) | 86 (3.5%) |
| 75 Years and over | 101 (7.6%) | 120 (7.2%) |
Disability Class: Cognitive Difficulty
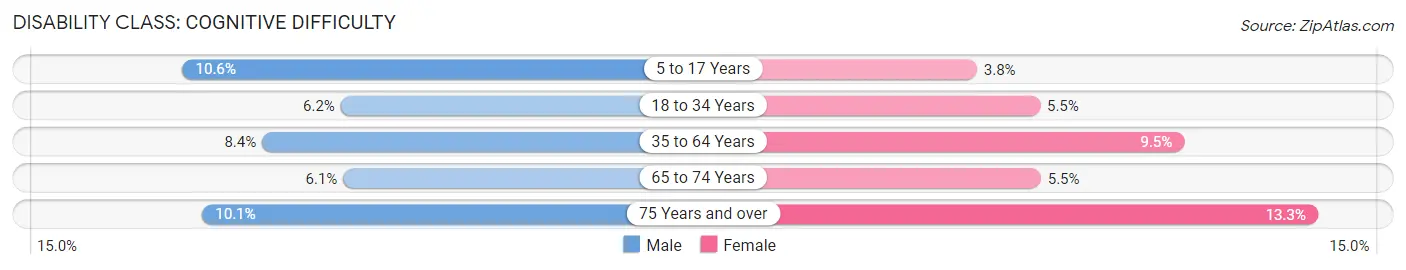
| Age Bracket | Male | Female |
| 5 to 17 Years | 307 (10.6%) | 107 (3.8%) |
| 18 to 34 Years | 328 (6.2%) | 264 (5.5%) |
| 35 to 64 Years | 595 (8.4%) | 677 (9.5%) |
| 65 to 74 Years | 144 (6.1%) | 135 (5.5%) |
| 75 Years and over | 133 (10.1%) | 222 (13.3%) |
Disability Class: Ambulatory Difficulty
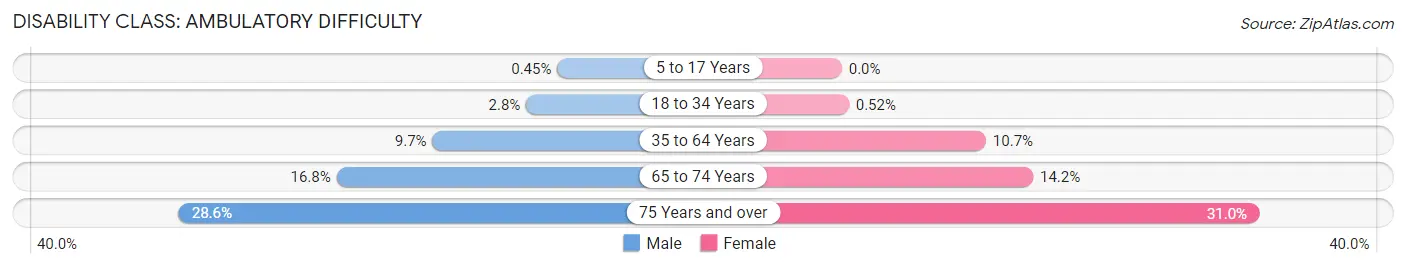
| Age Bracket | Male | Female |
| 5 to 17 Years | 13 (0.4%) | 0 (0.0%) |
| 18 to 34 Years | 146 (2.8%) | 25 (0.5%) |
| 35 to 64 Years | 689 (9.7%) | 760 (10.7%) |
| 65 to 74 Years | 396 (16.8%) | 346 (14.2%) |
| 75 Years and over | 378 (28.5%) | 519 (31.0%) |
Disability Class: Self-Care Difficulty
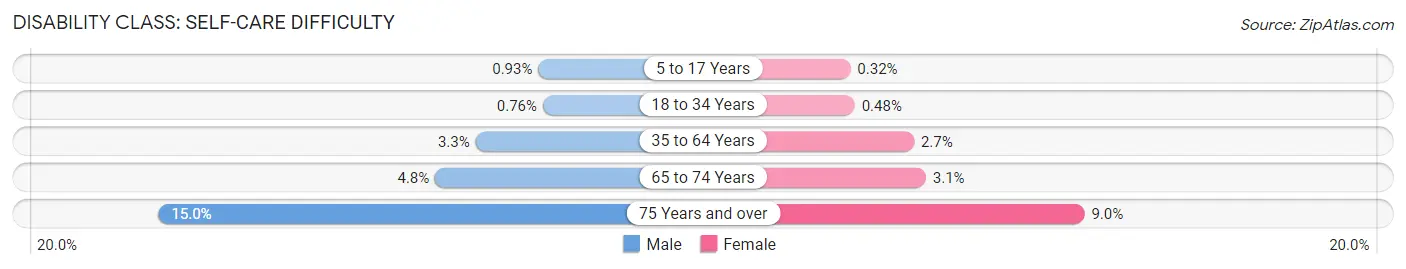
| Age Bracket | Male | Female |
| 5 to 17 Years | 27 (0.9%) | 9 (0.3%) |
| 18 to 34 Years | 40 (0.8%) | 23 (0.5%) |
| 35 to 64 Years | 231 (3.3%) | 190 (2.7%) |
| 65 to 74 Years | 112 (4.8%) | 76 (3.1%) |
| 75 Years and over | 199 (15.0%) | 151 (9.0%) |
Technology Access in Mecosta County
Computing Device Access in Mecosta County
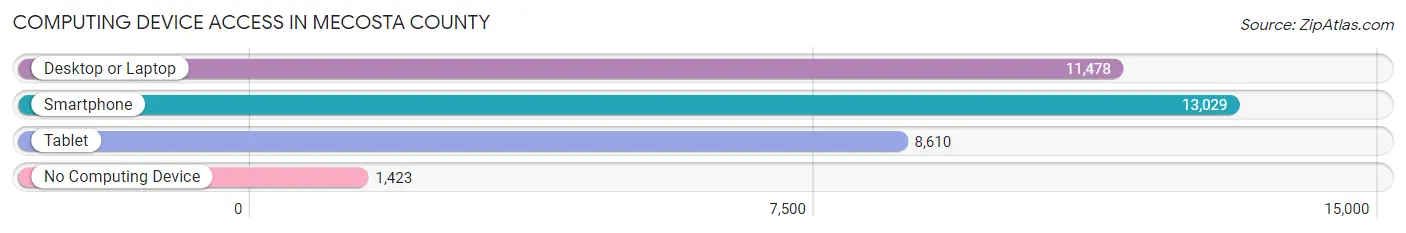
| Device Type | # Households | % Households |
| Desktop or Laptop | 11,478 | 71.3% |
| Smartphone | 13,029 | 80.9% |
| Tablet | 8,610 | 53.5% |
| No Computing Device | 1,423 | 8.8% |
| Total | 16,103 | 100.0% |
Internet Access in Mecosta County
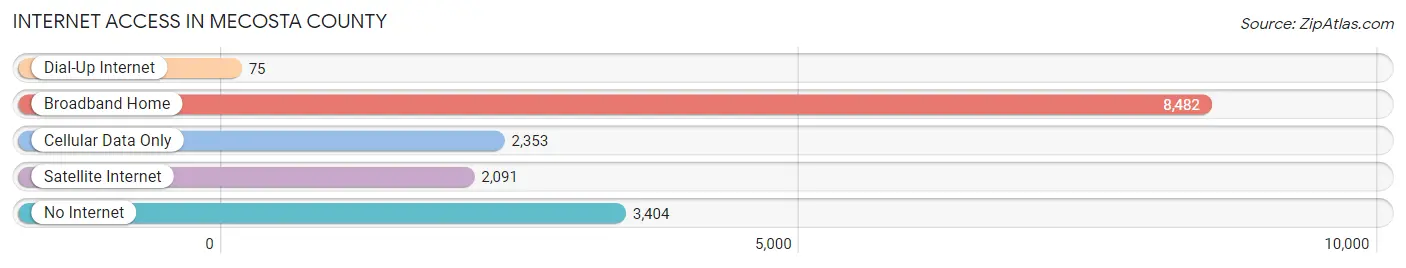
| Internet Type | # Households | % Households |
| Dial-Up Internet | 75 | 0.5% |
| Broadband Home | 8,482 | 52.7% |
| Cellular Data Only | 2,353 | 14.6% |
| Satellite Internet | 2,091 | 13.0% |
| No Internet | 3,404 | 21.1% |
| Total | 16,103 | 100.0% |
Mecosta County Summary
Mecosta County is located in the central part of Michigan’s Lower Peninsula. It is bordered by Newaygo County to the north, Osceola County to the east, Isabella County to the south, and Lake and Mason Counties to the west. The county seat is Big Rapids, and the county has a total area of 576 square miles.
History
Mecosta County was first settled in 1851 by a group of pioneers from New York. The county was officially organized in 1859 and named after Chief Mecosta of the Potawatomi tribe. The county was originally part of the larger Mecosta County, which included the present-day counties of Osceola, Isabella, and Lake. In 1869, the county was divided into its present-day boundaries.
The county was largely agricultural in its early years, with the main crops being wheat, corn, and potatoes. In the late 19th century, the lumber industry began to take off in the county, and by the early 20th century, it had become the main industry in the area. The lumber industry declined in the mid-20th century, and the county’s economy shifted to manufacturing and tourism.
Geography
Mecosta County is located in the central part of Michigan’s Lower Peninsula. It is bordered by Newaygo County to the north, Osceola County to the east, Isabella County to the south, and Lake and Mason Counties to the west. The county seat is Big Rapids, and the county has a total area of 576 square miles.
The county is mostly flat, with some rolling hills in the northern and western parts. The highest point in the county is located in the northwest corner, at an elevation of 1,092 feet. The county is drained by the Muskegon River, which flows through the center of the county.
Economy
Mecosta County’s economy is largely based on manufacturing and tourism. The county is home to several large manufacturing companies, including Ferris State University, which is the largest employer in the county. Other major employers include Big Rapids Products, Inc., Big Rapids Furniture, and Big Rapids Plastics.
The county is also home to several tourist attractions, including the Mecosta County Historical Museum, the Mecosta County Fairgrounds, and the Big Rapids Riverwalk. The county is also home to several state parks, including the Big Rapids State Recreation Area and the Mitchell State Park.
Demographics
As of the 2010 census, Mecosta County had a population of 42,798. The population was spread out with 24.3% under the age of 18, 11.2% from 18 to 24, 24.7% from 25 to 44, 24.2% from 45 to 64, and 15.6% who were 65 years of age or older. The median age was 36.7 years.
The racial makeup of the county was 92.2% White, 2.7% African American, 0.7% Native American, 1.2% Asian, 0.1% Pacific Islander, 1.3% from other races, and 2.0% from two or more races. Hispanic or Latino of any race were 4.2% of the population.
The median income for a household in the county was $41,945, and the median income for a family was $51,945. The per capita income for the county was $20,945. About 11.2% of families and 15.6% of the population were below the poverty line, including 22.2% of those under age 18 and 8.2% of those age 65 or over.
Common Questions
What is Per Capita Income in Mecosta County?
Per Capita income in Mecosta County is $27,692.
What is the Median Family Income in Mecosta County?
Median Family Income in Mecosta County is $68,870.
What is the Median Household income in Mecosta County?
Median Household Income in Mecosta County is $54,132.
What is Income or Wage Gap in Mecosta County?
Income or Wage Gap in Mecosta County is 25.1%.
Women in Mecosta County earn 74.9 cents for every dollar earned by a man.
What is Family Income Deficit in Mecosta County?
Family Income Deficit in Mecosta County is $8,953.
Families that are below poverty line in Mecosta County earn $8,953 less on average than the poverty threshold level.
What is Inequality or Gini Index in Mecosta County?
Inequality or Gini Index in Mecosta County is 0.42.
What is the Total Population of Mecosta County?
Total Population of Mecosta County is 40,128.
What is the Total Male Population of Mecosta County?
Total Male Population of Mecosta County is 20,158.
What is the Total Female Population of Mecosta County?
Total Female Population of Mecosta County is 19,970.
What is the Ratio of Males per 100 Females in Mecosta County?
There are 100.94 Males per 100 Females in Mecosta County.
What is the Ratio of Females per 100 Males in Mecosta County?
There are 99.07 Females per 100 Males in Mecosta County.
What is the Median Population Age in Mecosta County?
Median Population Age in Mecosta County is 40.6 Years.
What is the Average Family Size in Mecosta County
Average Family Size in Mecosta County is 2.9 People.
What is the Average Household Size in Mecosta County
Average Household Size in Mecosta County is 2.3 People.
How Large is the Labor Force in Mecosta County?
There are 17,779 People in the Labor Forcein in Mecosta County.
What is the Percentage of People in the Labor Force in Mecosta County?
53.5% of People are in the Labor Force in Mecosta County.
What is the Unemployment Rate in Mecosta County?
Unemployment Rate in Mecosta County is 5.5%.