Manistee County, MI Map & Demographics
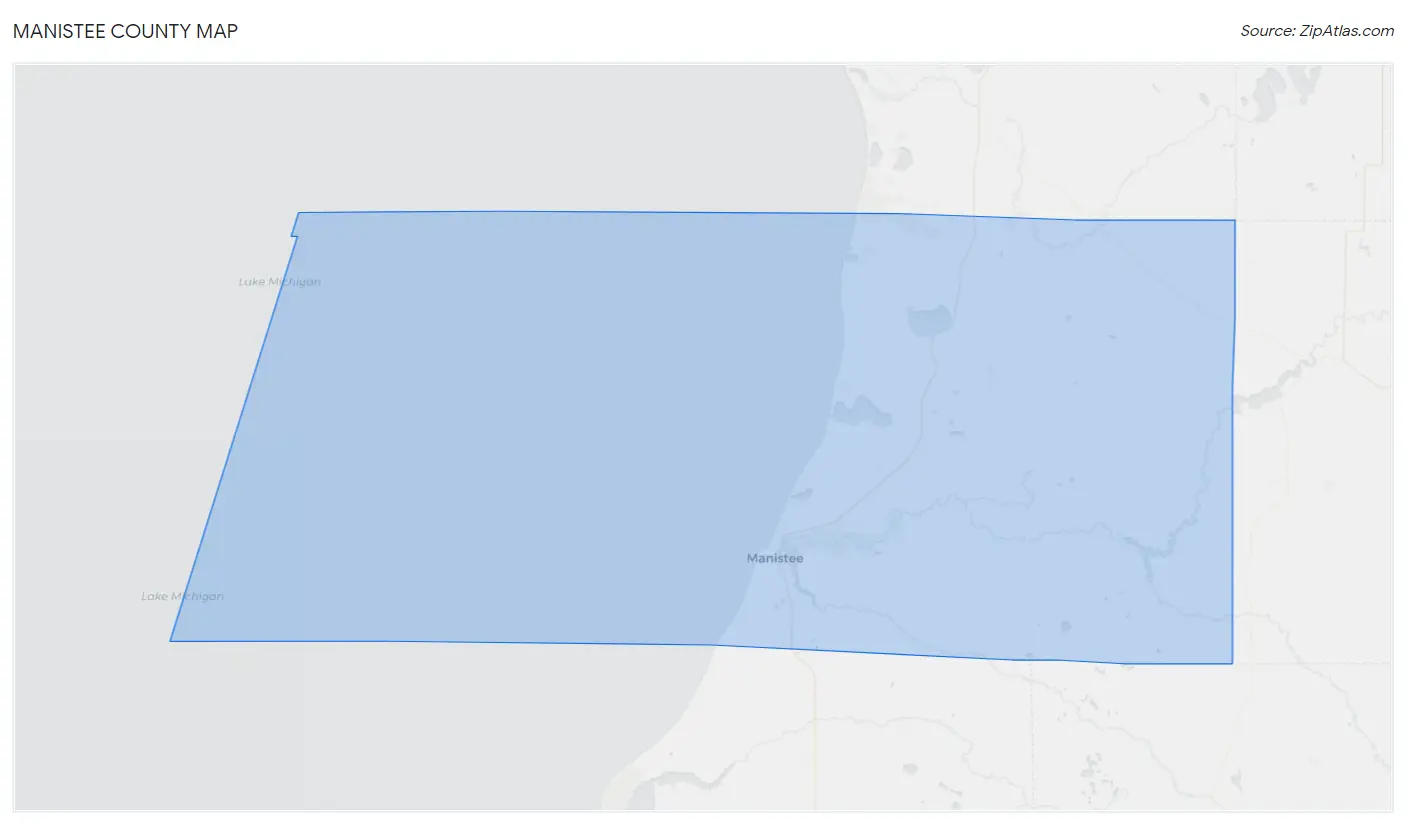
Manistee County Map
Manistee County Overview
$33,818
PER CAPITA INCOME
$75,342
AVG FAMILY INCOME
$59,467
AVG HOUSEHOLD INCOME
19.4%
WAGE / INCOME GAP [ % ]
80.6¢/ $1
WAGE / INCOME GAP [ $ ]
$10,613
FAMILY INCOME DEFICIT
0.46
INEQUALITY / GINI INDEX
25,058
TOTAL POPULATION
12,966
MALE POPULATION
12,092
FEMALE POPULATION
107.23
MALES / 100 FEMALES
93.26
FEMALES / 100 MALES
50.0
MEDIAN AGE
3.0
AVG FAMILY SIZE
2.4
AVG HOUSEHOLD SIZE
10,420
LABOR FORCE [ PEOPLE ]
48.8%
PERCENT IN LABOR FORCE
6.6%
UNEMPLOYMENT RATE
Manistee County Area Codes
Income in Manistee County
Income Overview in Manistee County
Per Capita Income in Manistee County is $33,818, while median incomes of families and households are $75,342 and $59,467 respectively.
| Characteristic | Number | Measure |
| Per Capita Income | 25,058 | $33,818 |
| Median Family Income | 6,195 | $75,342 |
| Mean Family Income | 6,195 | $97,083 |
| Median Household Income | 9,927 | $59,467 |
| Mean Household Income | 9,927 | $81,418 |
| Income Deficit | 6,195 | $10,613 |
| Wage / Income Gap (%) | 25,058 | 19.37% |
| Wage / Income Gap ($) | 25,058 | 80.63¢ per $1 |
| Gini / Inequality Index | 25,058 | 0.46 |
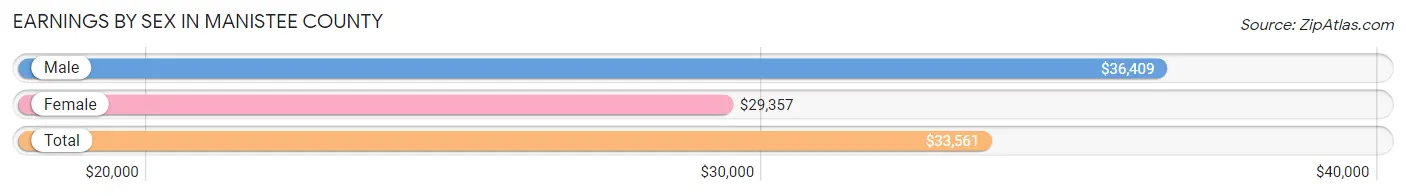
Earnings by Sex in Manistee County
Average Earnings in Manistee County are $33,561, $36,409 for men and $29,357 for women, a difference of 19.4%.
| Sex | Number | Average Earnings |
| Male | 6,353 (54.9%) | $36,409 |
| Female | 5,221 (45.1%) | $29,357 |
| Total | 11,574 (100.0%) | $33,561 |
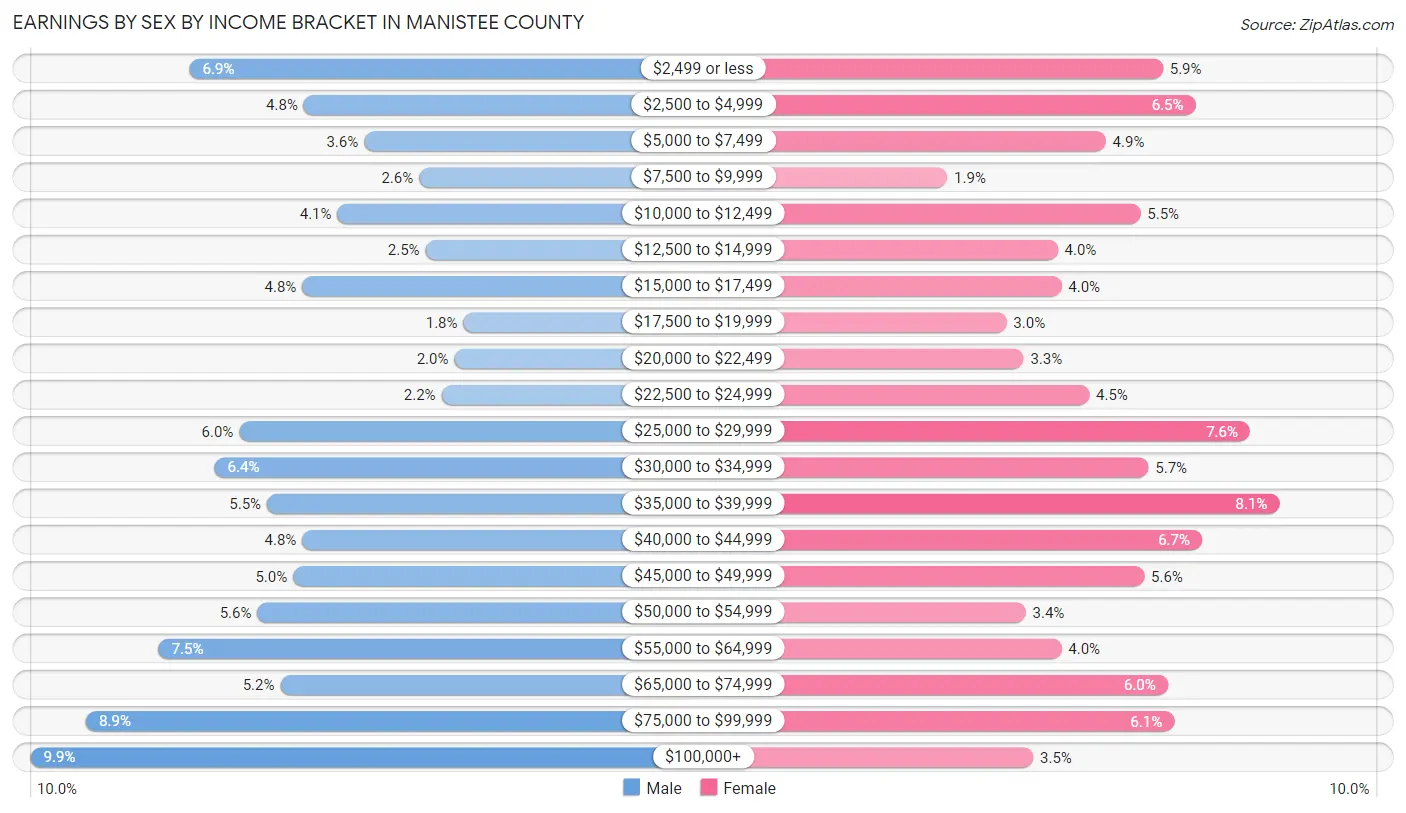
Earnings by Sex by Income Bracket in Manistee County
The most common earnings brackets in Manistee County are $100,000+ for men (628 | 9.9%) and $35,000 to $39,999 for women (423 | 8.1%).
| Income | Male | Female |
| $2,499 or less | 439 (6.9%) | 309 (5.9%) |
| $2,500 to $4,999 | 303 (4.8%) | 341 (6.5%) |
| $5,000 to $7,499 | 231 (3.6%) | 253 (4.9%) |
| $7,500 to $9,999 | 166 (2.6%) | 98 (1.9%) |
| $10,000 to $12,499 | 263 (4.1%) | 287 (5.5%) |
| $12,500 to $14,999 | 158 (2.5%) | 206 (4.0%) |
| $15,000 to $17,499 | 305 (4.8%) | 210 (4.0%) |
| $17,500 to $19,999 | 113 (1.8%) | 156 (3.0%) |
| $20,000 to $22,499 | 124 (1.9%) | 173 (3.3%) |
| $22,500 to $24,999 | 139 (2.2%) | 237 (4.5%) |
| $25,000 to $29,999 | 380 (6.0%) | 394 (7.5%) |
| $30,000 to $34,999 | 409 (6.4%) | 295 (5.7%) |
| $35,000 to $39,999 | 347 (5.5%) | 423 (8.1%) |
| $40,000 to $44,999 | 305 (4.8%) | 347 (6.7%) |
| $45,000 to $49,999 | 316 (5.0%) | 291 (5.6%) |
| $50,000 to $54,999 | 358 (5.6%) | 175 (3.4%) |
| $55,000 to $64,999 | 476 (7.5%) | 210 (4.0%) |
| $65,000 to $74,999 | 331 (5.2%) | 314 (6.0%) |
| $75,000 to $99,999 | 562 (8.8%) | 320 (6.1%) |
| $100,000+ | 628 (9.9%) | 182 (3.5%) |
| Total | 6,353 (100.0%) | 5,221 (100.0%) |
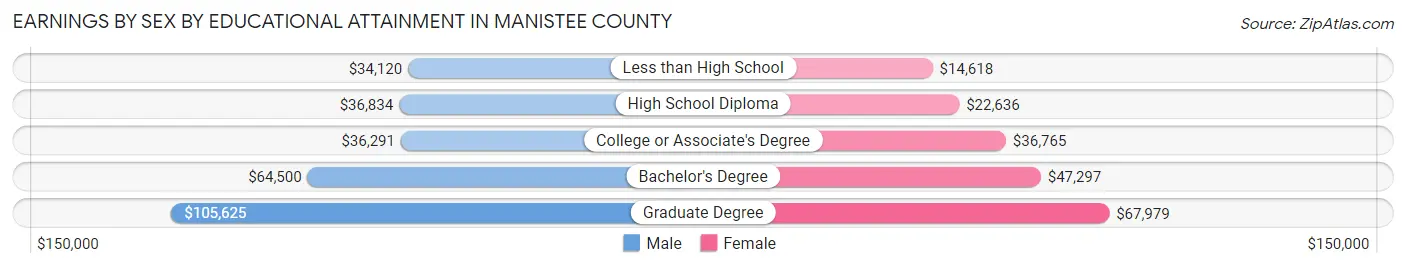
Earnings by Sex by Educational Attainment in Manistee County
Average earnings in Manistee County are $42,380 for men and $34,140 for women, a difference of 19.4%. Men with an educational attainment of graduate degree enjoy the highest average annual earnings of $105,625, while those with less than high school education earn the least with $34,120. Women with an educational attainment of graduate degree earn the most with the average annual earnings of $67,979, while those with less than high school education have the smallest earnings of $14,618.
| Educational Attainment | Male Income | Female Income |
| Less than High School | $34,120 | $14,618 |
| High School Diploma | $36,834 | $22,636 |
| College or Associate's Degree | $36,291 | $36,765 |
| Bachelor's Degree | $64,500 | $47,297 |
| Graduate Degree | $105,625 | $67,979 |
| Total | $42,380 | $34,140 |
Family Income in Manistee County
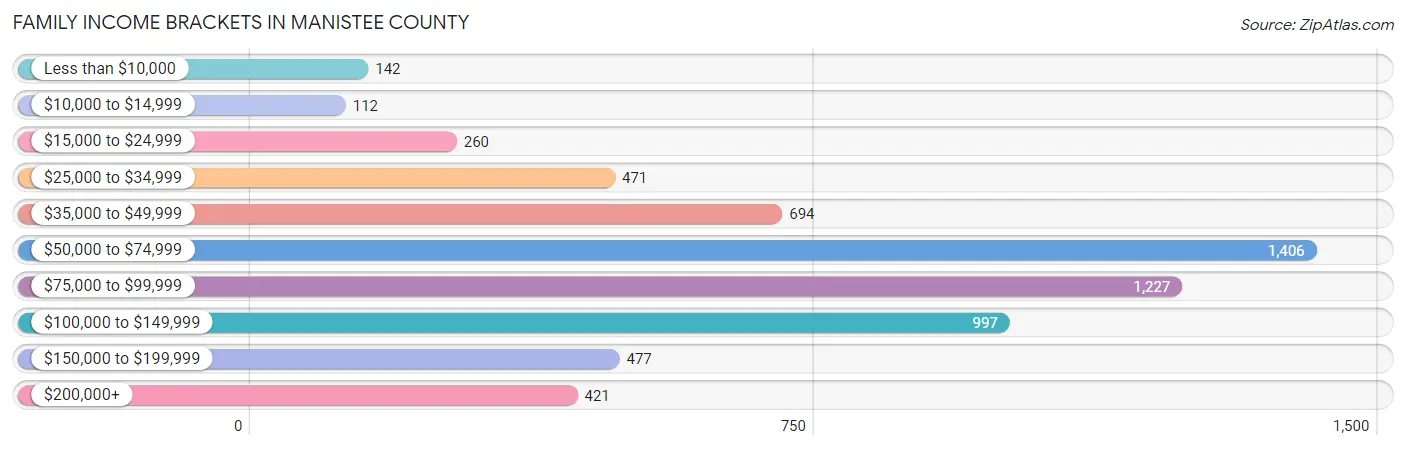
Family Income Brackets in Manistee County
According to the Manistee County family income data, there are 1,406 families falling into the $50,000 to $74,999 income range, which is the most common income bracket and makes up 22.7% of all families. Conversely, the $10,000 to $14,999 income bracket is the least frequent group with only 112 families (1.8%) belonging to this category.
| Income Bracket | # Families | % Families |
| Less than $10,000 | 142 | 2.3% |
| $10,000 to $14,999 | 112 | 1.8% |
| $15,000 to $24,999 | 260 | 4.2% |
| $25,000 to $34,999 | 471 | 7.6% |
| $35,000 to $49,999 | 694 | 11.2% |
| $50,000 to $74,999 | 1,406 | 22.7% |
| $75,000 to $99,999 | 1,227 | 19.8% |
| $100,000 to $149,999 | 997 | 16.1% |
| $150,000 to $199,999 | 477 | 7.7% |
| $200,000+ | 421 | 6.8% |
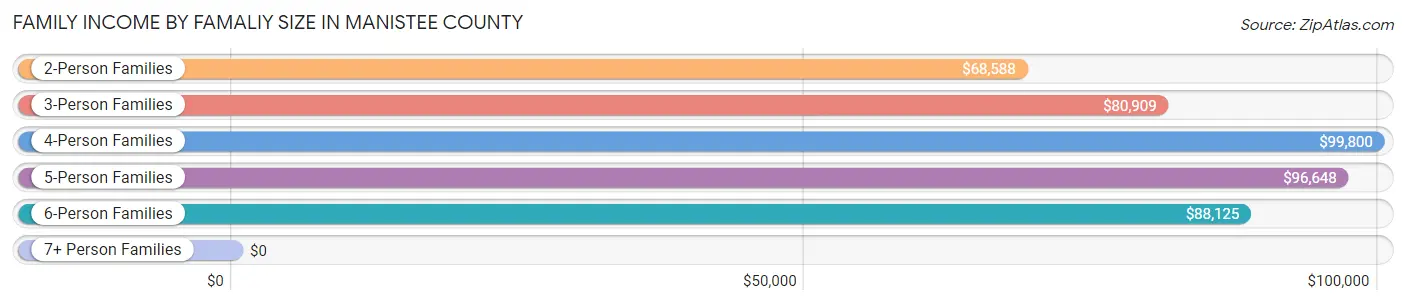
Family Income by Famaliy Size in Manistee County
4-person families (808 | 13.0%) account for the highest median family income in Manistee County with $99,800 per family, while 2-person families (3,858 | 62.3%) have the highest median income of $34,294 per family member.
| Income Bracket | # Families | Median Income |
| 2-Person Families | 3,858 (62.3%) | $68,588 |
| 3-Person Families | 1,008 (16.3%) | $80,909 |
| 4-Person Families | 808 (13.0%) | $99,800 |
| 5-Person Families | 375 (6.0%) | $96,648 |
| 6-Person Families | 75 (1.2%) | $88,125 |
| 7+ Person Families | 71 (1.1%) | $0 |
| Total | 6,195 (100.0%) | $75,342 |
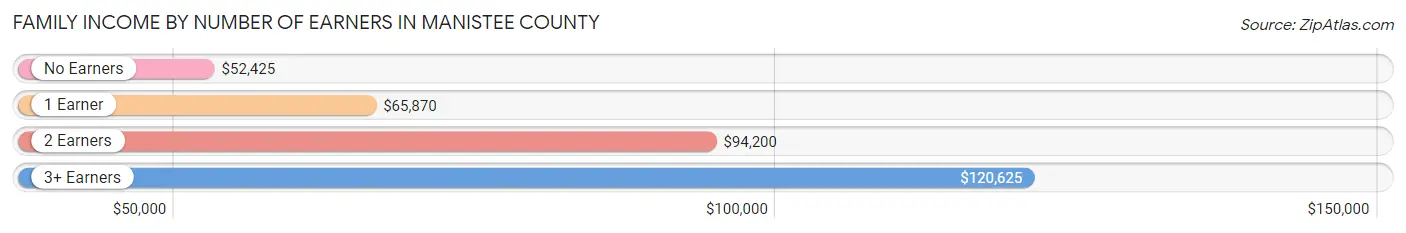
Family Income by Number of Earners in Manistee County
The median family income in Manistee County is $75,342, with families comprising 3+ earners (496) having the highest median family income of $120,625, while families with no earners (1,669) have the lowest median family income of $52,425, accounting for 8.0% and 26.9% of families, respectively.
| Number of Earners | # Families | Median Income |
| No Earners | 1,669 (26.9%) | $52,425 |
| 1 Earner | 1,926 (31.1%) | $65,870 |
| 2 Earners | 2,104 (34.0%) | $94,200 |
| 3+ Earners | 496 (8.0%) | $120,625 |
| Total | 6,195 (100.0%) | $75,342 |
Household Income in Manistee County
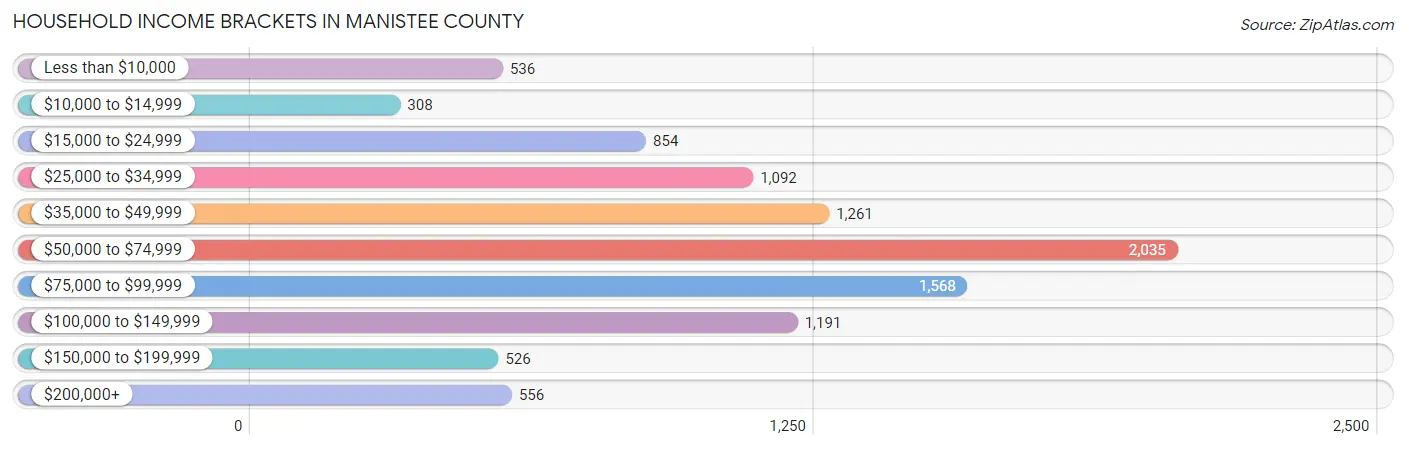
Household Income Brackets in Manistee County
With 2,035 households falling in the category, the $50,000 to $74,999 income range is the most frequent in Manistee County, accounting for 20.5% of all households. In contrast, only 308 households (3.1%) fall into the $10,000 to $14,999 income bracket, making it the least populous group.
| Income Bracket | # Households | % Households |
| Less than $10,000 | 536 | 5.4% |
| $10,000 to $14,999 | 308 | 3.1% |
| $15,000 to $24,999 | 854 | 8.6% |
| $25,000 to $34,999 | 1,092 | 11.0% |
| $35,000 to $49,999 | 1,261 | 12.7% |
| $50,000 to $74,999 | 2,035 | 20.5% |
| $75,000 to $99,999 | 1,568 | 15.8% |
| $100,000 to $149,999 | 1,191 | 12.0% |
| $150,000 to $199,999 | 526 | 5.3% |
| $200,000+ | 556 | 5.6% |
Household Income by Householder Age in Manistee County
The median household income in Manistee County is $59,467, with the highest median household income of $71,271 found in the 45 to 64 years age bracket for the primary householder. A total of 3,738 households (37.7%) fall into this category. Meanwhile, the 15 to 24 years age bracket for the primary householder has the lowest median household income of $36,306, with 208 households (2.1%) in this group.
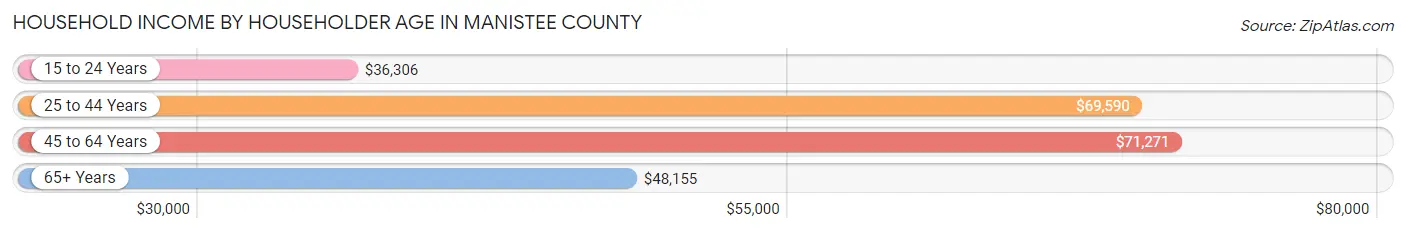
| Income Bracket | # Households | Median Income |
| 15 to 24 Years | 208 (2.1%) | $36,306 |
| 25 to 44 Years | 1,844 (18.6%) | $69,590 |
| 45 to 64 Years | 3,738 (37.7%) | $71,271 |
| 65+ Years | 4,137 (41.7%) | $48,155 |
| Total | 9,927 (100.0%) | $59,467 |
Poverty in Manistee County
Income Below Poverty by Sex and Age in Manistee County
With 9.9% poverty level for males and 12.6% for females among the residents of Manistee County, 16 and 17 year old males and 15 year old females are the most vulnerable to poverty, with 65 males (21.0%) and 51 females (28.8%) in their respective age groups living below the poverty level.
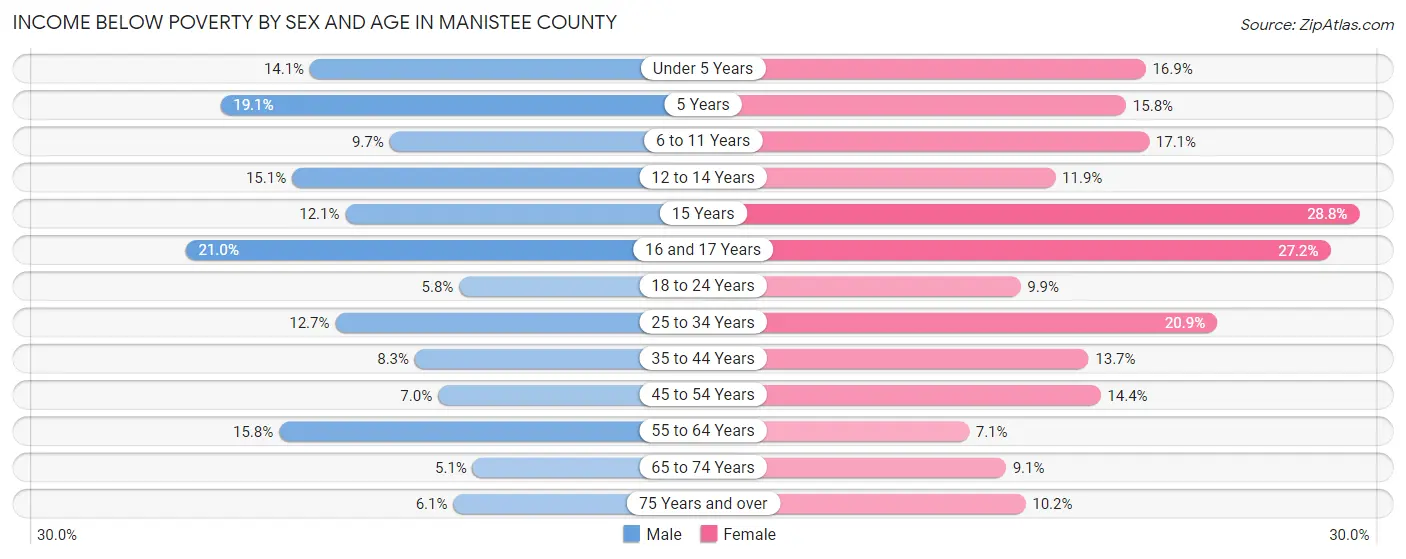
| Age Bracket | Male | Female |
| Under 5 Years | 67 (14.1%) | 81 (16.9%) |
| 5 Years | 17 (19.1%) | 28 (15.8%) |
| 6 to 11 Years | 57 (9.7%) | 106 (17.1%) |
| 12 to 14 Years | 71 (15.1%) | 50 (11.9%) |
| 15 Years | 17 (12.1%) | 51 (28.8%) |
| 16 and 17 Years | 65 (21.0%) | 65 (27.2%) |
| 18 to 24 Years | 47 (5.8%) | 77 (9.9%) |
| 25 to 34 Years | 144 (12.7%) | 220 (20.9%) |
| 35 to 44 Years | 94 (8.3%) | 158 (13.7%) |
| 45 to 54 Years | 104 (7.0%) | 201 (14.4%) |
| 55 to 64 Years | 303 (15.8%) | 152 (7.1%) |
| 65 to 74 Years | 102 (5.1%) | 177 (9.1%) |
| 75 Years and over | 71 (6.1%) | 142 (10.2%) |
| Total | 1,159 (9.9%) | 1,508 (12.6%) |
Income Above Poverty by Sex and Age in Manistee County
According to the poverty statistics in Manistee County, males aged 65 to 74 years and females aged 55 to 64 years are the age groups that are most secure financially, with 95.0% of males and 92.9% of females in these age groups living above the poverty line.
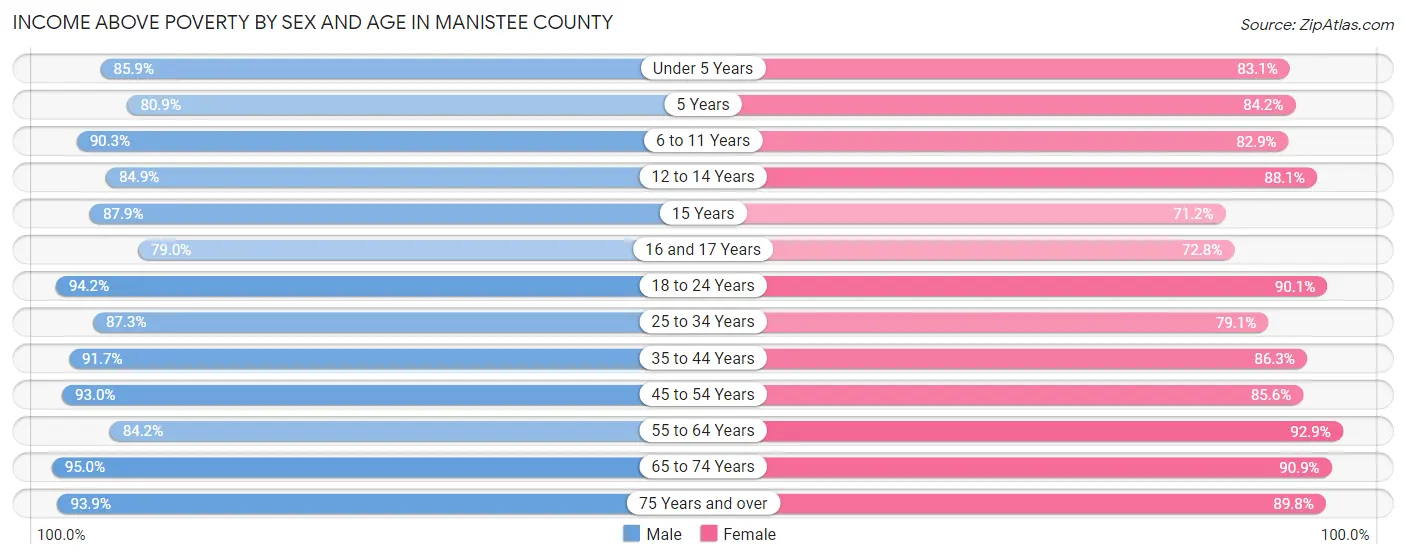
| Age Bracket | Male | Female |
| Under 5 Years | 408 (85.9%) | 398 (83.1%) |
| 5 Years | 72 (80.9%) | 149 (84.2%) |
| 6 to 11 Years | 532 (90.3%) | 514 (82.9%) |
| 12 to 14 Years | 399 (84.9%) | 371 (88.1%) |
| 15 Years | 123 (87.9%) | 126 (71.2%) |
| 16 and 17 Years | 244 (79.0%) | 174 (72.8%) |
| 18 to 24 Years | 763 (94.2%) | 698 (90.1%) |
| 25 to 34 Years | 990 (87.3%) | 833 (79.1%) |
| 35 to 44 Years | 1,042 (91.7%) | 993 (86.3%) |
| 45 to 54 Years | 1,386 (93.0%) | 1,195 (85.6%) |
| 55 to 64 Years | 1,611 (84.2%) | 1,997 (92.9%) |
| 65 to 74 Years | 1,916 (95.0%) | 1,761 (90.9%) |
| 75 Years and over | 1,088 (93.9%) | 1,247 (89.8%) |
| Total | 10,574 (90.1%) | 10,456 (87.4%) |
Income Below Poverty Among Married-Couple Families in Manistee County
The poverty statistics for married-couple families in Manistee County show that 3.6% or 182 of the total 5,046 families live below the poverty line. Families with 5 or more children have the highest poverty rate of 70.6%, comprising of 12 families. On the other hand, families with 3 or 4 children have the lowest poverty rate of 2.2%, which includes 6 families.
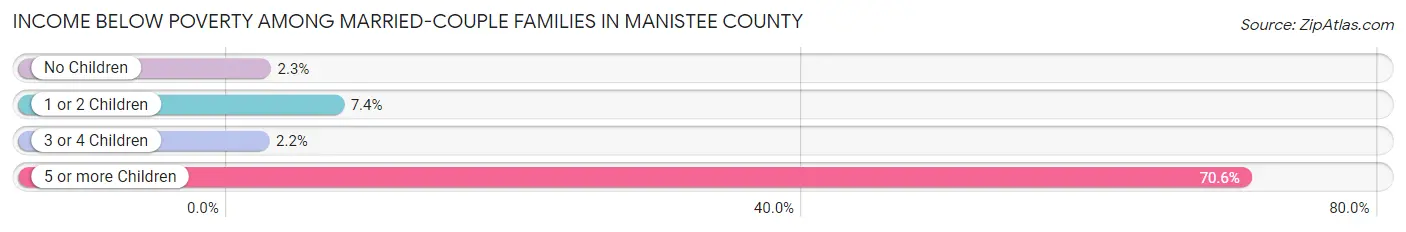
| Children | Above Poverty | Below Poverty |
| No Children | 3,568 (97.7%) | 83 (2.3%) |
| 1 or 2 Children | 1,019 (92.6%) | 81 (7.4%) |
| 3 or 4 Children | 272 (97.8%) | 6 (2.2%) |
| 5 or more Children | 5 (29.4%) | 12 (70.6%) |
| Total | 4,864 (96.4%) | 182 (3.6%) |
Income Below Poverty Among Single-Parent Households in Manistee County
According to the poverty data in Manistee County, 11.4% or 41 single-father households and 22.6% or 178 single-mother households are living below the poverty line. Among single-father households, those with 3 or 4 children have the highest poverty rate, with 16 households (61.5%) experiencing poverty. Likewise, among single-mother households, those with 3 or 4 children have the highest poverty rate, with 55 households (69.6%) falling below the poverty line.
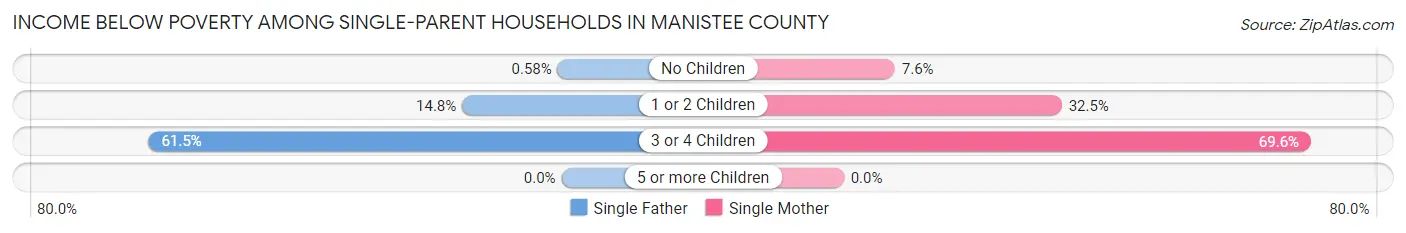
| Children | Single Father | Single Mother |
| No Children | 1 (0.6%) | 33 (7.6%) |
| 1 or 2 Children | 24 (14.8%) | 90 (32.5%) |
| 3 or 4 Children | 16 (61.5%) | 55 (69.6%) |
| 5 or more Children | 0 (0.0%) | 0 (0.0%) |
| Total | 41 (11.4%) | 178 (22.6%) |
Income Below Poverty Among Married-Couple vs Single-Parent Households in Manistee County
The poverty data for Manistee County shows that 182 of the married-couple family households (3.6%) and 219 of the single-parent households (19.1%) are living below the poverty level. Within the married-couple family households, those with 5 or more children have the highest poverty rate, with 12 households (70.6%) falling below the poverty line. Among the single-parent households, those with 3 or 4 children have the highest poverty rate, with 71 household (67.6%) living below poverty.
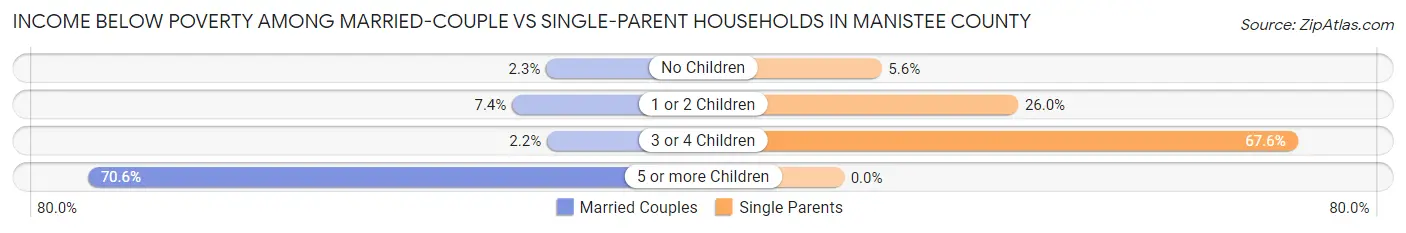
| Children | Married-Couple Families | Single-Parent Households |
| No Children | 83 (2.3%) | 34 (5.6%) |
| 1 or 2 Children | 81 (7.4%) | 114 (26.0%) |
| 3 or 4 Children | 6 (2.2%) | 71 (67.6%) |
| 5 or more Children | 12 (70.6%) | 0 (0.0%) |
| Total | 182 (3.6%) | 219 (19.1%) |
Race in Manistee County
The most populous races in Manistee County are White / Caucasian (22,362 | 89.2%), Two or more Races (1,409 | 5.6%), and Hispanic or Latino (901 | 3.6%).
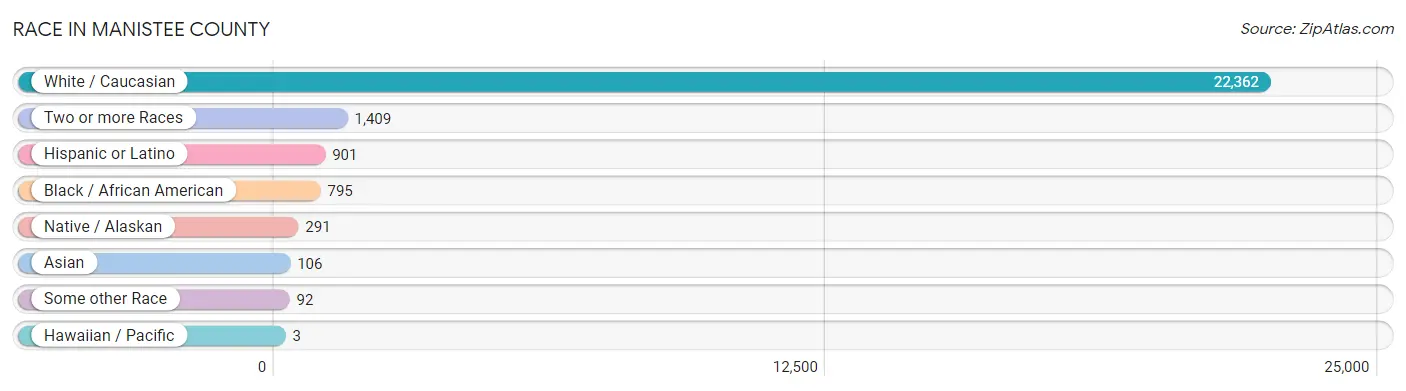
| Race | # Population | % Population |
| Asian | 106 | 0.4% |
| Black / African American | 795 | 3.2% |
| Hawaiian / Pacific | 3 | 0.0% |
| Hispanic or Latino | 901 | 3.6% |
| Native / Alaskan | 291 | 1.2% |
| White / Caucasian | 22,362 | 89.2% |
| Two or more Races | 1,409 | 5.6% |
| Some other Race | 92 | 0.4% |
| Total | 25,058 | 100.0% |
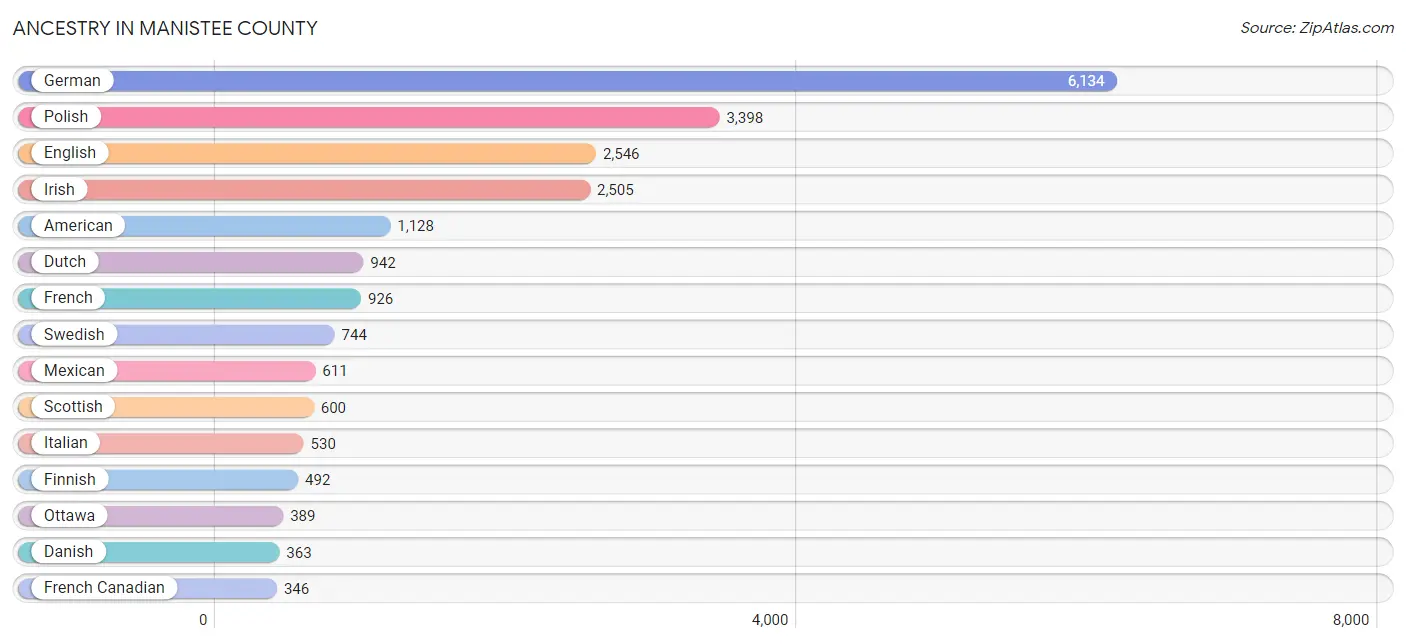
Ancestry in Manistee County
The most populous ancestries reported in Manistee County are German (6,134 | 24.5%), Polish (3,398 | 13.6%), English (2,546 | 10.2%), Irish (2,505 | 10.0%), and American (1,128 | 4.5%), together accounting for 62.7% of all Manistee County residents.
| Ancestry | # Population | % Population |
| African | 58 | 0.2% |
| Alaskan Athabascan | 1 | 0.0% |
| American | 1,128 | 4.5% |
| Apache | 10 | 0.0% |
| Arab | 238 | 0.9% |
| Argentinean | 3 | 0.0% |
| Armenian | 14 | 0.1% |
| Assyrian / Chaldean / Syriac | 137 | 0.5% |
| Austrian | 32 | 0.1% |
| Belgian | 74 | 0.3% |
| Bhutanese | 26 | 0.1% |
| Blackfeet | 42 | 0.2% |
| British | 133 | 0.5% |
| Burmese | 15 | 0.1% |
| Canadian | 45 | 0.2% |
| Central American | 41 | 0.2% |
| Cherokee | 50 | 0.2% |
| Chippewa | 140 | 0.6% |
| Choctaw | 1 | 0.0% |
| Colombian | 15 | 0.1% |
| Croatian | 21 | 0.1% |
| Cuban | 64 | 0.3% |
| Cypriot | 9 | 0.0% |
| Czech | 91 | 0.4% |
| Czechoslovakian | 27 | 0.1% |
| Danish | 363 | 1.5% |
| Dutch | 942 | 3.8% |
| Dutch West Indian | 2 | 0.0% |
| Eastern European | 21 | 0.1% |
| English | 2,546 | 10.2% |
| Estonian | 3 | 0.0% |
| European | 296 | 1.2% |
| Fijian | 1 | 0.0% |
| Finnish | 492 | 2.0% |
| French | 926 | 3.7% |
| French American Indian | 16 | 0.1% |
| French Canadian | 346 | 1.4% |
| German | 6,134 | 24.5% |
| Greek | 14 | 0.1% |
| Guamanian / Chamorro | 12 | 0.1% |
| Guatemalan | 23 | 0.1% |
| Guyanese | 3 | 0.0% |
| Haitian | 16 | 0.1% |
| Honduran | 2 | 0.0% |
| Hungarian | 242 | 1.0% |
| Indian (Asian) | 12 | 0.1% |
| Iraqi | 140 | 0.6% |
| Irish | 2,505 | 10.0% |
| Iroquois | 2 | 0.0% |
| Italian | 530 | 2.1% |
| Jamaican | 30 | 0.1% |
| Korean | 130 | 0.5% |
| Laotian | 2 | 0.0% |
| Latvian | 9 | 0.0% |
| Lebanese | 68 | 0.3% |
| Lithuanian | 69 | 0.3% |
| Macedonian | 7 | 0.0% |
| Mexican | 611 | 2.4% |
| Mexican American Indian | 6 | 0.0% |
| Moroccan | 16 | 0.1% |
| Native Hawaiian | 14 | 0.1% |
| Nicaraguan | 7 | 0.0% |
| Northern European | 6 | 0.0% |
| Norwegian | 311 | 1.2% |
| Ottawa | 389 | 1.5% |
| Pennsylvania German | 24 | 0.1% |
| Polish | 3,398 | 13.6% |
| Portuguese | 26 | 0.1% |
| Potawatomi | 40 | 0.2% |
| Puerto Rican | 66 | 0.3% |
| Romanian | 16 | 0.1% |
| Russian | 118 | 0.5% |
| Salvadoran | 9 | 0.0% |
| Samoan | 12 | 0.1% |
| Scandinavian | 96 | 0.4% |
| Scotch-Irish | 218 | 0.9% |
| Scottish | 600 | 2.4% |
| Sioux | 18 | 0.1% |
| Slavic | 42 | 0.2% |
| Slovak | 51 | 0.2% |
| Slovene | 11 | 0.0% |
| South American | 18 | 0.1% |
| Spaniard | 9 | 0.0% |
| Spanish | 24 | 0.1% |
| Sri Lankan | 19 | 0.1% |
| Subsaharan African | 58 | 0.2% |
| Swedish | 744 | 3.0% |
| Swiss | 116 | 0.5% |
| Syrian | 8 | 0.0% |
| Thai | 13 | 0.1% |
| Trinidadian and Tobagonian | 1 | 0.0% |
| Ukrainian | 77 | 0.3% |
| Welsh | 64 | 0.3% |
| West Indian | 5 | 0.0% |
| Yugoslavian | 26 | 0.1% | View All 95 Rows |
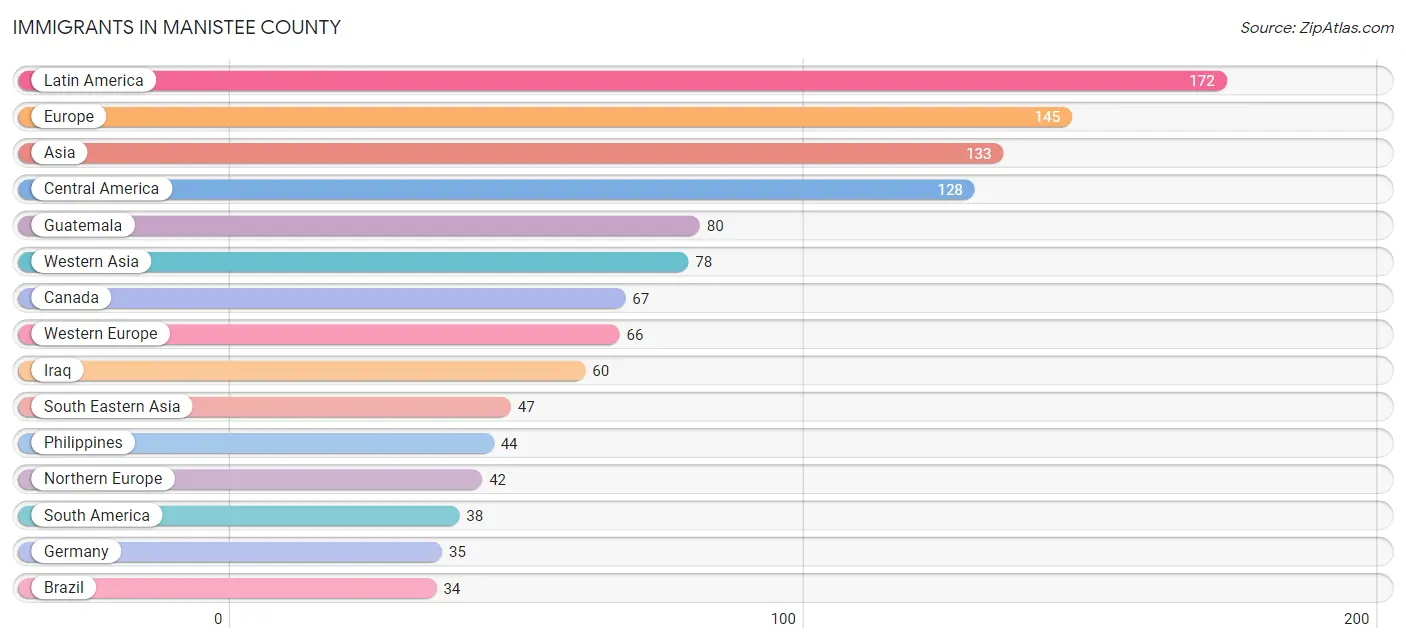
Immigrants in Manistee County
The most numerous immigrant groups reported in Manistee County came from Latin America (172 | 0.7%), Europe (145 | 0.6%), Asia (133 | 0.5%), Central America (128 | 0.5%), and Guatemala (80 | 0.3%), together accounting for 2.6% of all Manistee County residents.
| Immigration Origin | # Population | % Population |
| Africa | 6 | 0.0% |
| Asia | 133 | 0.5% |
| Australia | 9 | 0.0% |
| Belarus | 10 | 0.0% |
| Belgium | 14 | 0.1% |
| Brazil | 34 | 0.1% |
| Canada | 67 | 0.3% |
| Caribbean | 6 | 0.0% |
| Central America | 128 | 0.5% |
| Colombia | 1 | 0.0% |
| Cuba | 2 | 0.0% |
| Denmark | 3 | 0.0% |
| Eastern Africa | 6 | 0.0% |
| Eastern Asia | 5 | 0.0% |
| Eastern Europe | 26 | 0.1% |
| El Salvador | 9 | 0.0% |
| England | 8 | 0.0% |
| Ethiopia | 4 | 0.0% |
| Europe | 145 | 0.6% |
| France | 1 | 0.0% |
| Germany | 35 | 0.1% |
| Guatemala | 80 | 0.3% |
| Guyana | 3 | 0.0% |
| Honduras | 7 | 0.0% |
| Indonesia | 2 | 0.0% |
| Iraq | 60 | 0.2% |
| Italy | 11 | 0.0% |
| Jamaica | 4 | 0.0% |
| Japan | 3 | 0.0% |
| Korea | 2 | 0.0% |
| Latin America | 172 | 0.7% |
| Lebanon | 12 | 0.1% |
| Mexico | 31 | 0.1% |
| Netherlands | 16 | 0.1% |
| Nicaragua | 1 | 0.0% |
| North Macedonia | 4 | 0.0% |
| Northern Europe | 42 | 0.2% |
| Norway | 12 | 0.1% |
| Oceania | 9 | 0.0% |
| Philippines | 44 | 0.2% |
| South America | 38 | 0.2% |
| South Central Asia | 3 | 0.0% |
| South Eastern Asia | 47 | 0.2% |
| Southern Europe | 11 | 0.0% |
| Sri Lanka | 3 | 0.0% |
| Syria | 6 | 0.0% |
| Ukraine | 12 | 0.1% |
| Vietnam | 1 | 0.0% |
| Western Asia | 78 | 0.3% |
| Western Europe | 66 | 0.3% |
| Zimbabwe | 2 | 0.0% | View All 51 Rows |
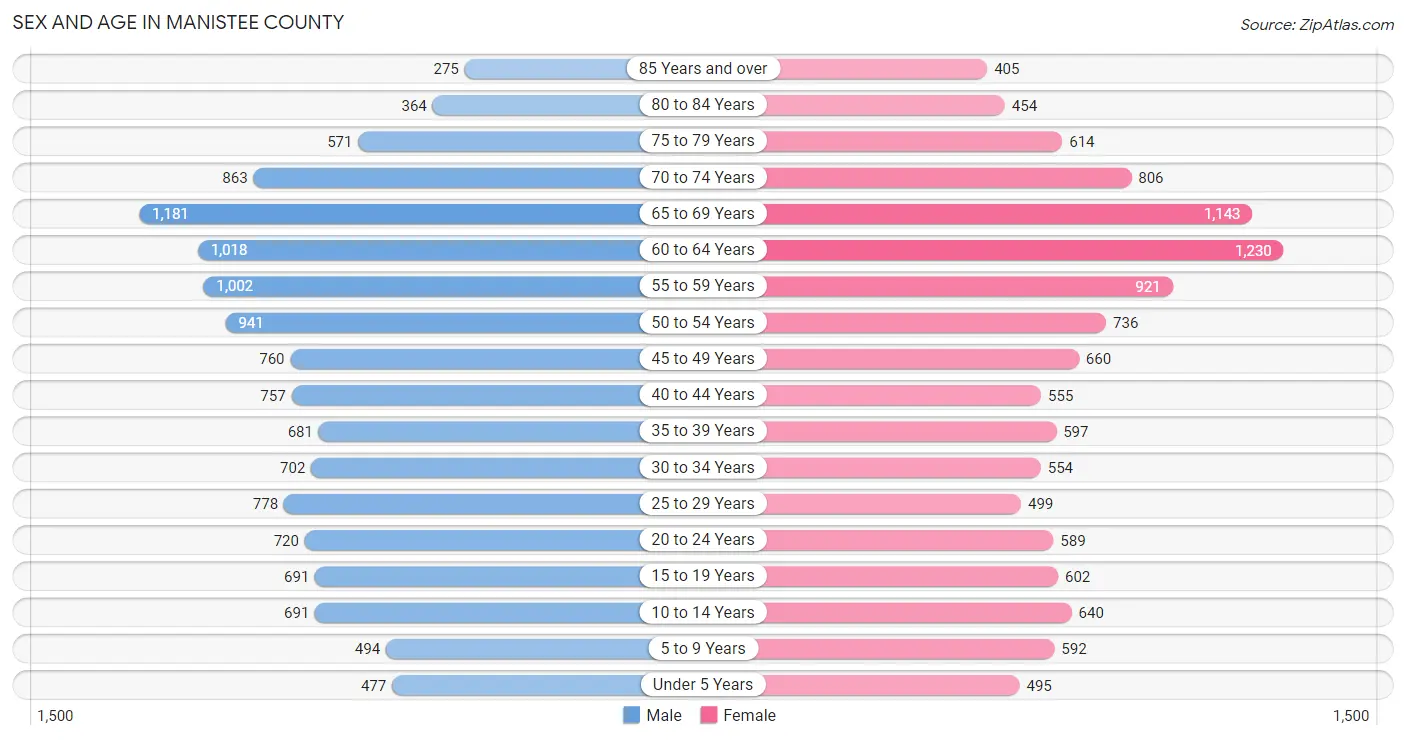
Sex and Age in Manistee County
Sex and Age in Manistee County
The most populous age groups in Manistee County are 65 to 69 Years (1,181 | 9.1%) for men and 60 to 64 Years (1,230 | 10.2%) for women.
| Age Bracket | Male | Female |
| Under 5 Years | 477 (3.7%) | 495 (4.1%) |
| 5 to 9 Years | 494 (3.8%) | 592 (4.9%) |
| 10 to 14 Years | 691 (5.3%) | 640 (5.3%) |
| 15 to 19 Years | 691 (5.3%) | 602 (5.0%) |
| 20 to 24 Years | 720 (5.6%) | 589 (4.9%) |
| 25 to 29 Years | 778 (6.0%) | 499 (4.1%) |
| 30 to 34 Years | 702 (5.4%) | 554 (4.6%) |
| 35 to 39 Years | 681 (5.2%) | 597 (4.9%) |
| 40 to 44 Years | 757 (5.8%) | 555 (4.6%) |
| 45 to 49 Years | 760 (5.9%) | 660 (5.5%) |
| 50 to 54 Years | 941 (7.3%) | 736 (6.1%) |
| 55 to 59 Years | 1,002 (7.7%) | 921 (7.6%) |
| 60 to 64 Years | 1,018 (7.9%) | 1,230 (10.2%) |
| 65 to 69 Years | 1,181 (9.1%) | 1,143 (9.5%) |
| 70 to 74 Years | 863 (6.7%) | 806 (6.7%) |
| 75 to 79 Years | 571 (4.4%) | 614 (5.1%) |
| 80 to 84 Years | 364 (2.8%) | 454 (3.7%) |
| 85 Years and over | 275 (2.1%) | 405 (3.4%) |
| Total | 12,966 (100.0%) | 12,092 (100.0%) |
Families and Households in Manistee County
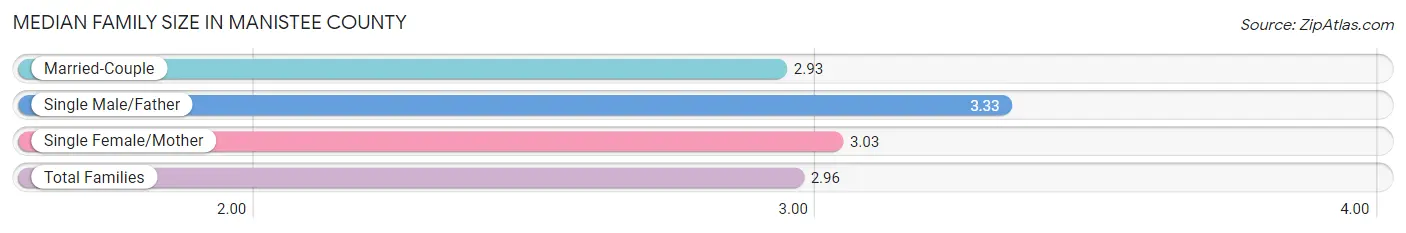
Median Family Size in Manistee County
The median family size in Manistee County is 2.96 persons per family, with single male/father families (360 | 5.8%) accounting for the largest median family size of 3.33 persons per family. On the other hand, married-couple families (5,046 | 81.5%) represent the smallest median family size with 2.93 persons per family.
| Family Type | # Families | Family Size |
| Married-Couple | 5,046 (81.5%) | 2.93 |
| Single Male/Father | 360 (5.8%) | 3.33 |
| Single Female/Mother | 789 (12.7%) | 3.03 |
| Total Families | 6,195 (100.0%) | 2.96 |
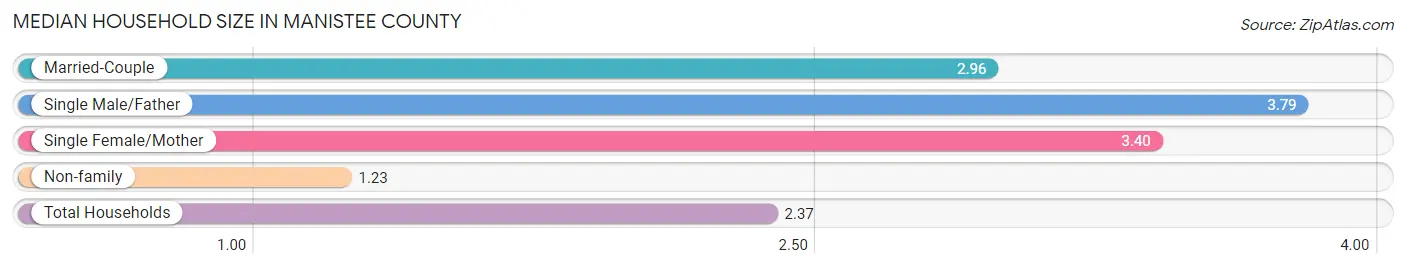
Median Household Size in Manistee County
The median household size in Manistee County is 2.37 persons per household, with single male/father households (360 | 3.6%) accounting for the largest median household size of 3.79 persons per household. non-family households (3,732 | 37.6%) represent the smallest median household size with 1.23 persons per household.
| Household Type | # Households | Household Size |
| Married-Couple | 5,046 (50.8%) | 2.96 |
| Single Male/Father | 360 (3.6%) | 3.79 |
| Single Female/Mother | 789 (8.0%) | 3.40 |
| Non-family | 3,732 (37.6%) | 1.23 |
| Total Households | 9,927 (100.0%) | 2.37 |
Household Size by Marriage Status in Manistee County
Out of a total of 9,927 households in Manistee County, 6,195 (62.4%) are family households, while 3,732 (37.6%) are nonfamily households. The most numerous type of family households are 2-person households, comprising 3,678, and the most common type of nonfamily households are 1-person households, comprising 3,015.
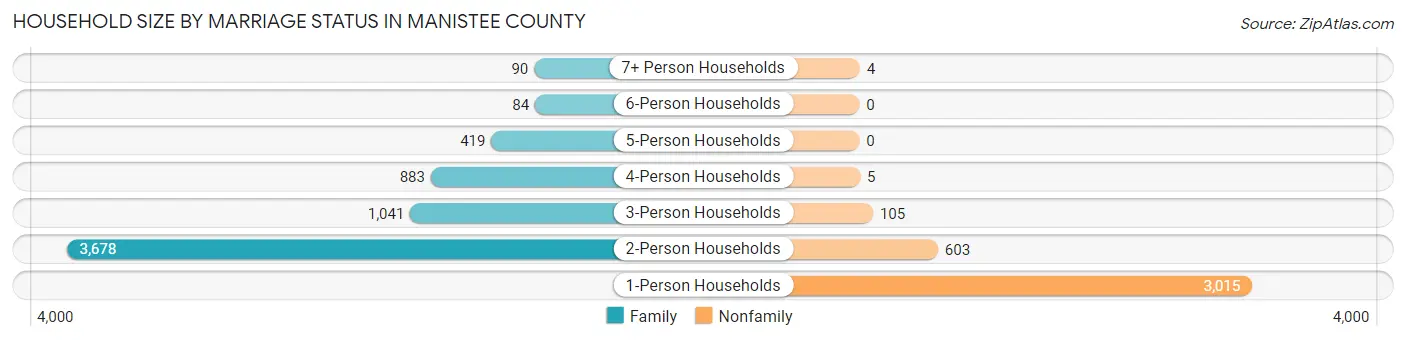
| Household Size | Family Households | Nonfamily Households |
| 1-Person Households | - | 3,015 (30.4%) |
| 2-Person Households | 3,678 (37.0%) | 603 (6.1%) |
| 3-Person Households | 1,041 (10.5%) | 105 (1.1%) |
| 4-Person Households | 883 (8.9%) | 5 (0.1%) |
| 5-Person Households | 419 (4.2%) | 0 (0.0%) |
| 6-Person Households | 84 (0.9%) | 0 (0.0%) |
| 7+ Person Households | 90 (0.9%) | 4 (0.0%) |
| Total | 6,195 (62.4%) | 3,732 (37.6%) |
Female Fertility in Manistee County
Fertility by Age in Manistee County
Average fertility rate in Manistee County is 36.0 births per 1,000 women. Women in the age bracket of 20 to 34 years have the highest fertility rate with 54.0 births per 1,000 women. Women in the age bracket of 20 to 34 years acount for 59.1% of all women with births.
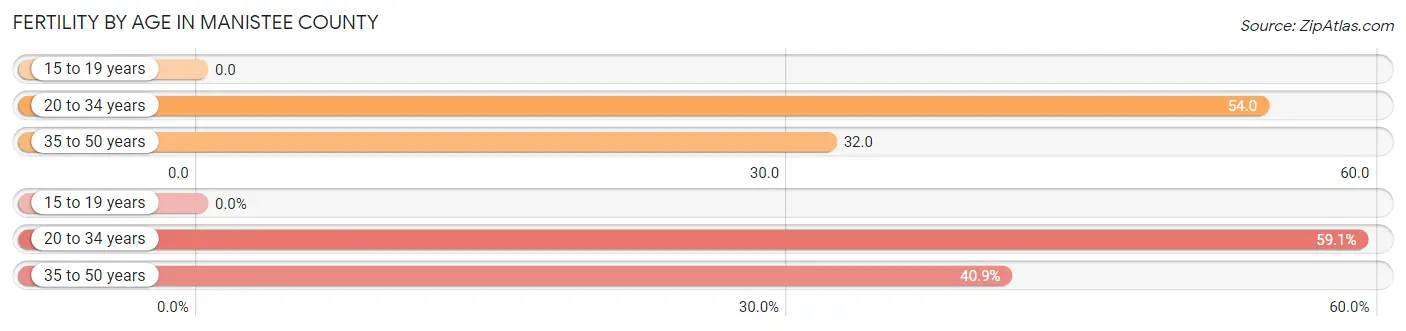
| Age Bracket | Women with Births | Births / 1,000 Women |
| 15 to 19 years | 0 (0.0%) | 0.0 |
| 20 to 34 years | 88 (59.1%) | 54.0 |
| 35 to 50 years | 61 (40.9%) | 32.0 |
| Total | 149 (100.0%) | 36.0 |
Fertility by Age by Marriage Status in Manistee County
53.7% of women with births (149) in Manistee County are married. The highest percentage of unmarried women with births falls into 35 to 50 years age bracket with 63.9% of them unmarried at the time of birth, while the lowest percentage of unmarried women with births belong to 20 to 34 years age bracket with 34.1% of them unmarried.
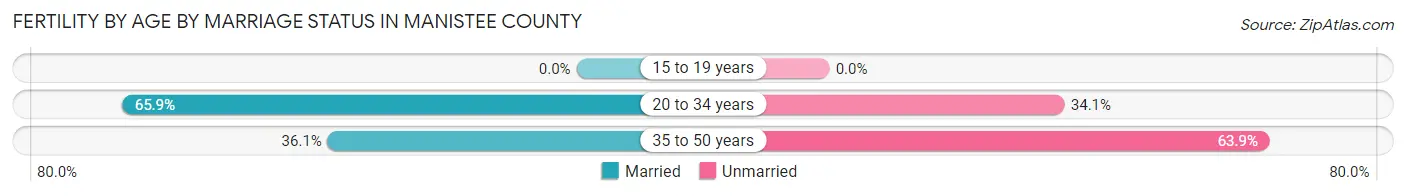
| Age Bracket | Married | Unmarried |
| 15 to 19 years | 0 (0.0%) | 0 (0.0%) |
| 20 to 34 years | 58 (65.9%) | 30 (34.1%) |
| 35 to 50 years | 22 (36.1%) | 39 (63.9%) |
| Total | 80 (53.7%) | 69 (46.3%) |
Fertility by Education in Manistee County
Average fertility rate in Manistee County is 36.0 births per 1,000 women. Women with the education attainment of less than high school have the highest fertility rate of 49.0 births per 1,000 women, while women with the education attainment of bachelor's degree have the lowest fertility at 11.0 births per 1,000 women. Women with the education attainment of college or associate's degree represent 31.5% of all women with births.
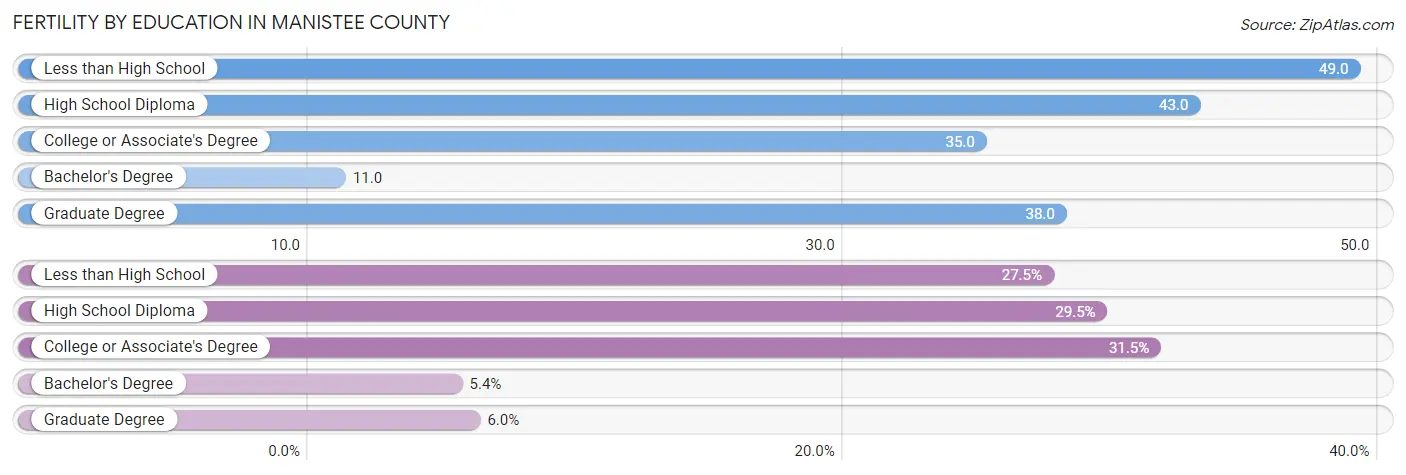
| Educational Attainment | Women with Births | Births / 1,000 Women |
| Less than High School | 41 (27.5%) | 49.0 |
| High School Diploma | 44 (29.5%) | 43.0 |
| College or Associate's Degree | 47 (31.5%) | 35.0 |
| Bachelor's Degree | 8 (5.4%) | 11.0 |
| Graduate Degree | 9 (6.0%) | 38.0 |
| Total | 149 (100.0%) | 36.0 |
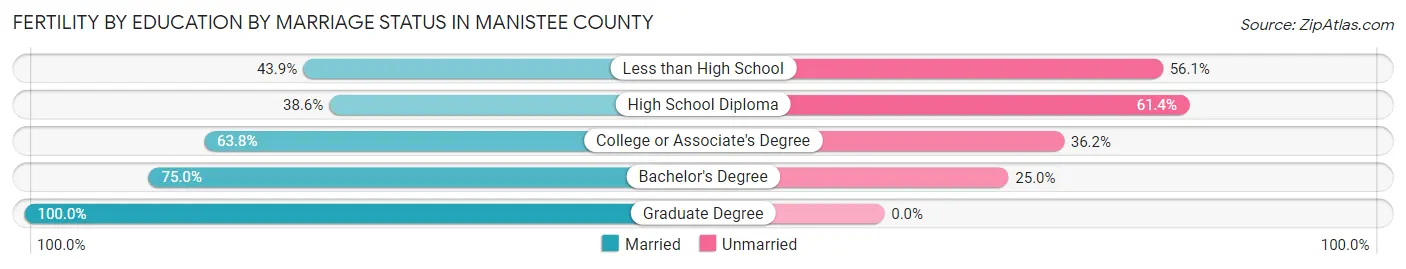
Fertility by Education by Marriage Status in Manistee County
46.3% of women with births in Manistee County are unmarried. Women with the educational attainment of graduate degree are most likely to be married with 100.0% of them married at childbirth, while women with the educational attainment of high school diploma are least likely to be married with 61.4% of them unmarried at childbirth.
| Educational Attainment | Married | Unmarried |
| Less than High School | 18 (43.9%) | 23 (56.1%) |
| High School Diploma | 17 (38.6%) | 27 (61.4%) |
| College or Associate's Degree | 30 (63.8%) | 17 (36.2%) |
| Bachelor's Degree | 6 (75.0%) | 2 (25.0%) |
| Graduate Degree | 9 (100.0%) | 0 (0.0%) |
| Total | 80 (53.7%) | 69 (46.3%) |
Employment Characteristics in Manistee County
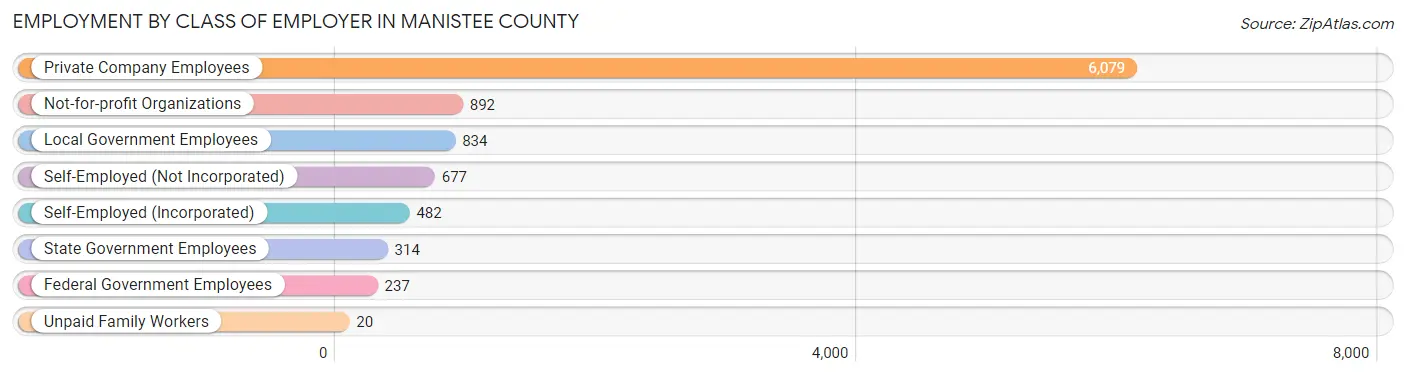
Employment by Class of Employer in Manistee County
Among the 9,535 employed individuals in Manistee County, private company employees (6,079 | 63.7%), not-for-profit organizations (892 | 9.4%), and local government employees (834 | 8.7%) make up the most common classes of employment.
| Employer Class | # Employees | % Employees |
| Private Company Employees | 6,079 | 63.7% |
| Self-Employed (Incorporated) | 482 | 5.1% |
| Self-Employed (Not Incorporated) | 677 | 7.1% |
| Not-for-profit Organizations | 892 | 9.4% |
| Local Government Employees | 834 | 8.7% |
| State Government Employees | 314 | 3.3% |
| Federal Government Employees | 237 | 2.5% |
| Unpaid Family Workers | 20 | 0.2% |
| Total | 9,535 | 100.0% |
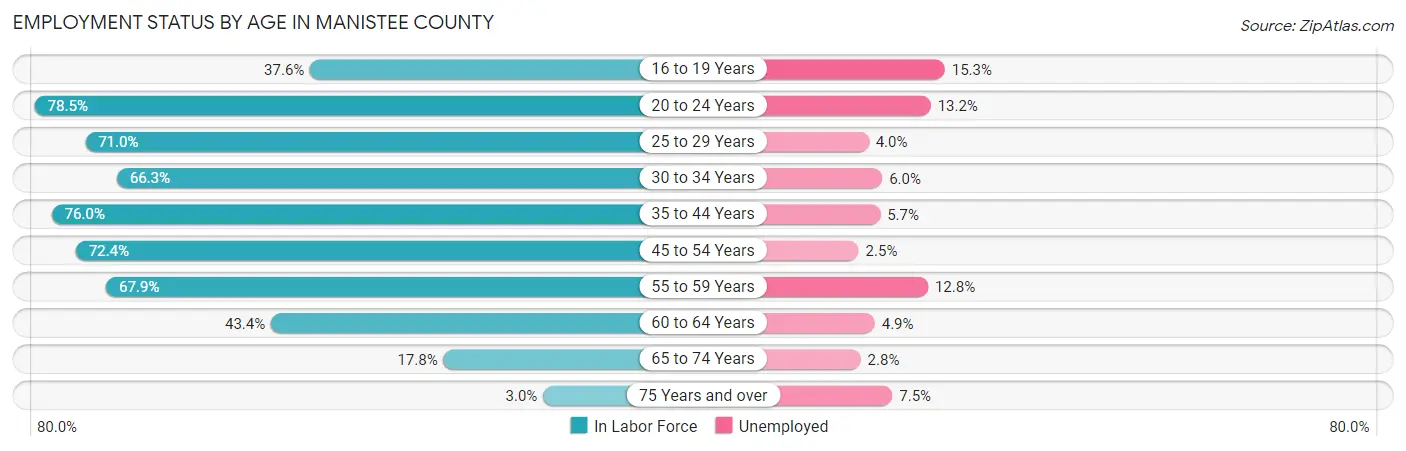
Employment Status by Age in Manistee County
According to the labor force statistics for Manistee County, out of the total population over 16 years of age (21,352), 48.8% or 10,420 individuals are in the labor force, with 6.6% or 688 of them unemployed. The age group with the highest labor force participation rate is 20 to 24 years, with 78.5% or 1,028 individuals in the labor force. Within the labor force, the 16 to 19 years age range has the highest percentage of unemployed individuals, with 15.3% or 56 of them being unemployed.
| Age Bracket | In Labor Force | Unemployed |
| 16 to 19 Years | 367 (37.6%) | 56 (15.3%) |
| 20 to 24 Years | 1,028 (78.5%) | 136 (13.2%) |
| 25 to 29 Years | 907 (71.0%) | 36 (4.0%) |
| 30 to 34 Years | 833 (66.3%) | 50 (6.0%) |
| 35 to 44 Years | 1,968 (76.0%) | 112 (5.7%) |
| 45 to 54 Years | 2,242 (72.4%) | 56 (2.5%) |
| 55 to 59 Years | 1,306 (67.9%) | 167 (12.8%) |
| 60 to 64 Years | 976 (43.4%) | 48 (4.9%) |
| 65 to 74 Years | 711 (17.8%) | 20 (2.8%) |
| 75 Years and over | 80 (3.0%) | 6 (7.5%) |
| Total | 10,420 (48.8%) | 688 (6.6%) |
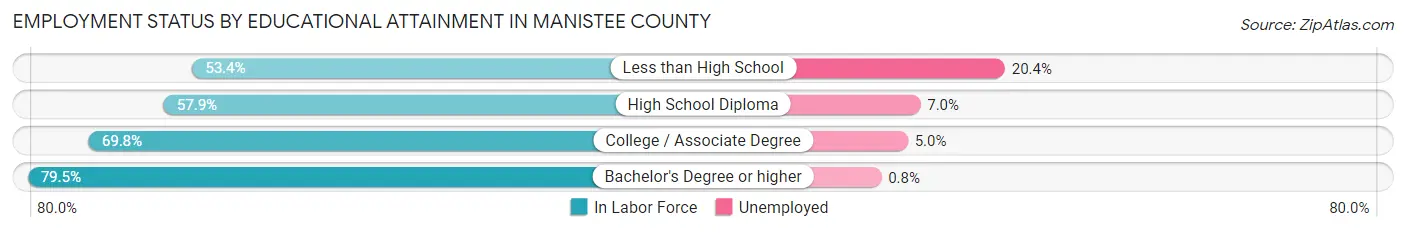
Employment Status by Educational Attainment in Manistee County
According to labor force statistics for Manistee County, 66.4% of individuals (8,228) out of the total population between 25 and 64 years of age (12,391) are in the labor force, with 5.7% or 469 of them being unemployed. The group with the highest labor force participation rate are those with the educational attainment of bachelor's degree or higher, with 79.5% or 2,138 individuals in the labor force. Within the labor force, individuals with less than high school education have the highest percentage of unemployment, with 20.4% or 134 of them being unemployed.
| Educational Attainment | In Labor Force | Unemployed |
| Less than High School | 657 (53.4%) | 251 (20.4%) |
| High School Diploma | 2,327 (57.9%) | 281 (7.0%) |
| College / Associate Degree | 3,107 (69.8%) | 223 (5.0%) |
| Bachelor's Degree or higher | 2,138 (79.5%) | 22 (0.8%) |
| Total | 8,228 (66.4%) | 706 (5.7%) |
Employment Occupations by Sex in Manistee County
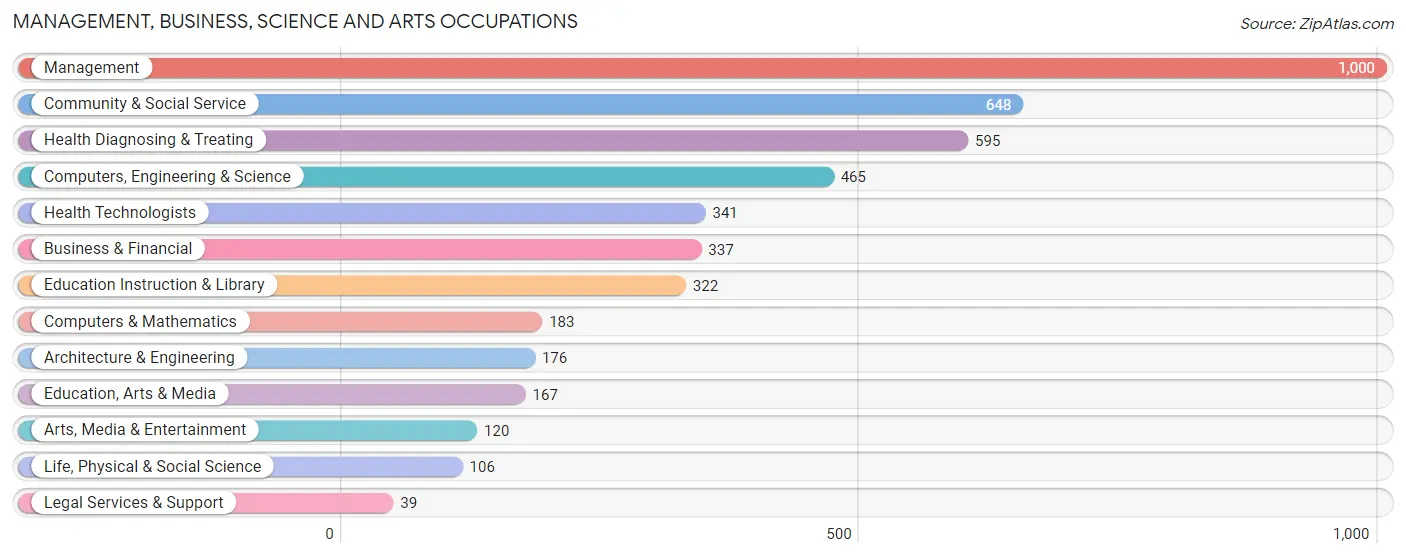
Management, Business, Science and Arts Occupations
The most common Management, Business, Science and Arts occupations in Manistee County are Management (1,000 | 10.3%), Community & Social Service (648 | 6.7%), Health Diagnosing & Treating (595 | 6.1%), Computers, Engineering & Science (465 | 4.8%), and Health Technologists (341 | 3.5%).
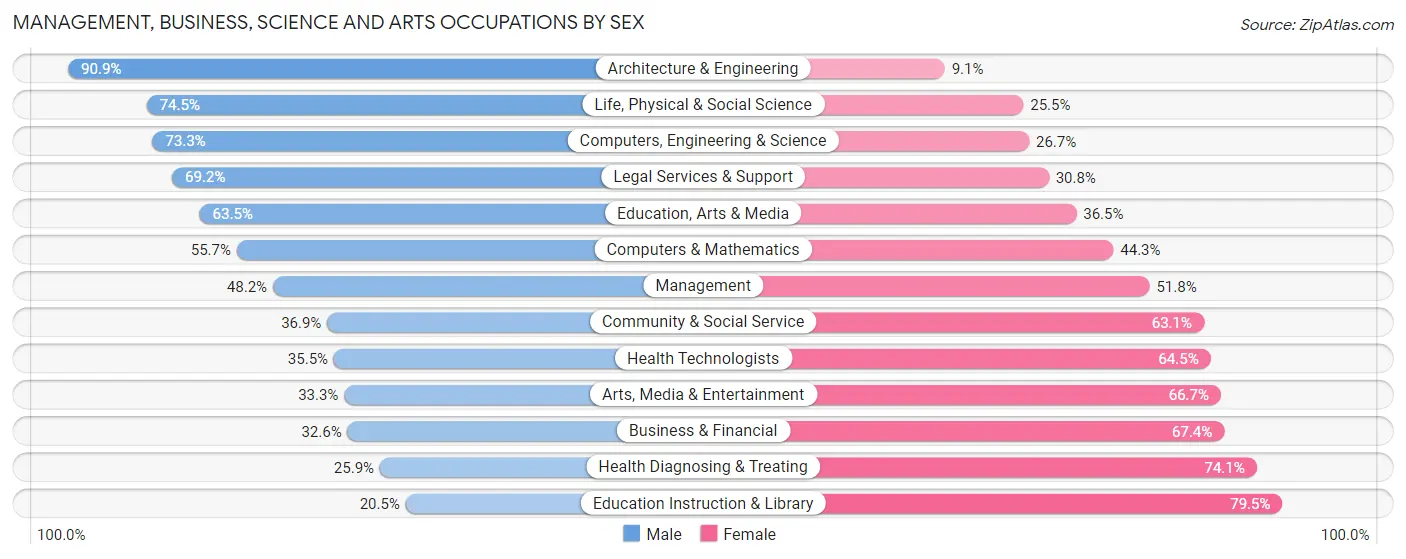
Management, Business, Science and Arts Occupations by Sex
Within the Management, Business, Science and Arts occupations in Manistee County, the most male-oriented occupations are Architecture & Engineering (90.9%), Life, Physical & Social Science (74.5%), and Computers, Engineering & Science (73.3%), while the most female-oriented occupations are Education Instruction & Library (79.5%), Health Diagnosing & Treating (74.1%), and Business & Financial (67.4%).
| Occupation | Male | Female |
| Management | 482 (48.2%) | 518 (51.8%) |
| Business & Financial | 110 (32.6%) | 227 (67.4%) |
| Computers, Engineering & Science | 341 (73.3%) | 124 (26.7%) |
| Computers & Mathematics | 102 (55.7%) | 81 (44.3%) |
| Architecture & Engineering | 160 (90.9%) | 16 (9.1%) |
| Life, Physical & Social Science | 79 (74.5%) | 27 (25.5%) |
| Community & Social Service | 239 (36.9%) | 409 (63.1%) |
| Education, Arts & Media | 106 (63.5%) | 61 (36.5%) |
| Legal Services & Support | 27 (69.2%) | 12 (30.8%) |
| Education Instruction & Library | 66 (20.5%) | 256 (79.5%) |
| Arts, Media & Entertainment | 40 (33.3%) | 80 (66.7%) |
| Health Diagnosing & Treating | 154 (25.9%) | 441 (74.1%) |
| Health Technologists | 121 (35.5%) | 220 (64.5%) |
| Total (Category) | 1,326 (43.5%) | 1,719 (56.5%) |
| Total (Overall) | 5,130 (52.9%) | 4,560 (47.1%) |
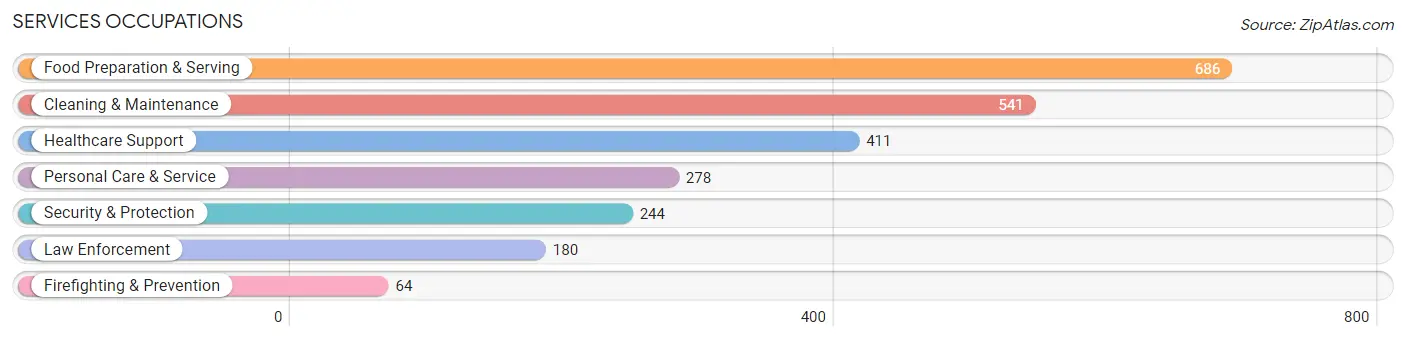
Services Occupations
The most common Services occupations in Manistee County are Food Preparation & Serving (686 | 7.1%), Cleaning & Maintenance (541 | 5.6%), Healthcare Support (411 | 4.2%), Personal Care & Service (278 | 2.9%), and Security & Protection (244 | 2.5%).
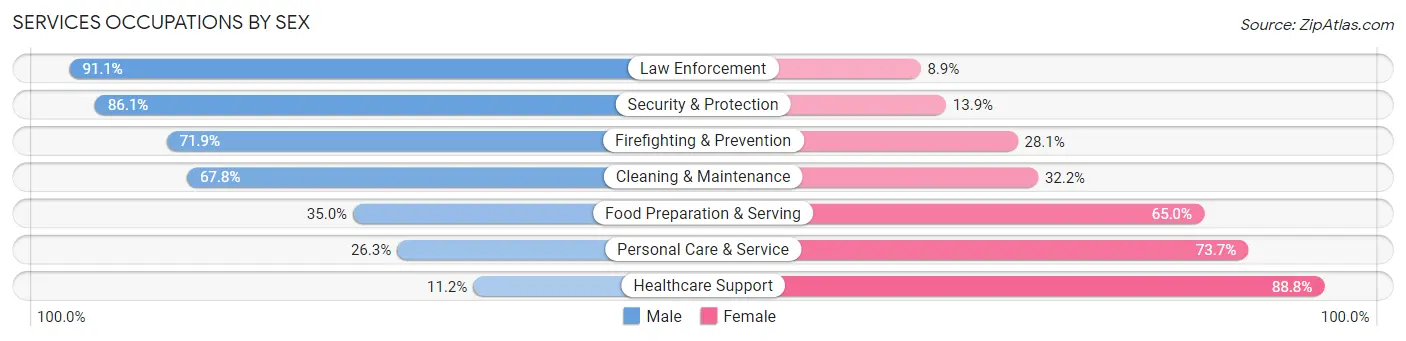
Services Occupations by Sex
Within the Services occupations in Manistee County, the most male-oriented occupations are Law Enforcement (91.1%), Security & Protection (86.1%), and Firefighting & Prevention (71.9%), while the most female-oriented occupations are Healthcare Support (88.8%), Personal Care & Service (73.7%), and Food Preparation & Serving (65.0%).
| Occupation | Male | Female |
| Healthcare Support | 46 (11.2%) | 365 (88.8%) |
| Security & Protection | 210 (86.1%) | 34 (13.9%) |
| Firefighting & Prevention | 46 (71.9%) | 18 (28.1%) |
| Law Enforcement | 164 (91.1%) | 16 (8.9%) |
| Food Preparation & Serving | 240 (35.0%) | 446 (65.0%) |
| Cleaning & Maintenance | 367 (67.8%) | 174 (32.2%) |
| Personal Care & Service | 73 (26.3%) | 205 (73.7%) |
| Total (Category) | 936 (43.3%) | 1,224 (56.7%) |
| Total (Overall) | 5,130 (52.9%) | 4,560 (47.1%) |
Sales and Office Occupations
The most common Sales and Office occupations in Manistee County are Office & Administration (1,090 | 11.3%), and Sales & Related (802 | 8.3%).

Sales and Office Occupations by Sex

| Occupation | Male | Female |
| Sales & Related | 417 (52.0%) | 385 (48.0%) |
| Office & Administration | 186 (17.1%) | 904 (82.9%) |
| Total (Category) | 603 (31.9%) | 1,289 (68.1%) |
| Total (Overall) | 5,130 (52.9%) | 4,560 (47.1%) |
Natural Resources, Construction and Maintenance Occupations
The most common Natural Resources, Construction and Maintenance occupations in Manistee County are Construction & Extraction (742 | 7.7%), Installation, Maintenance & Repair (385 | 4.0%), and Farming, Fishing & Forestry (88 | 0.9%).
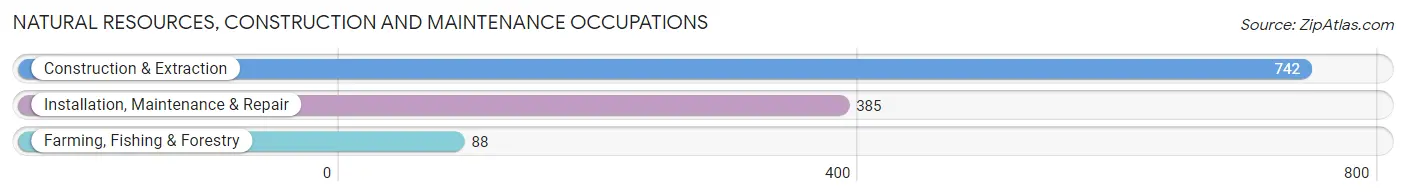
Natural Resources, Construction and Maintenance Occupations by Sex
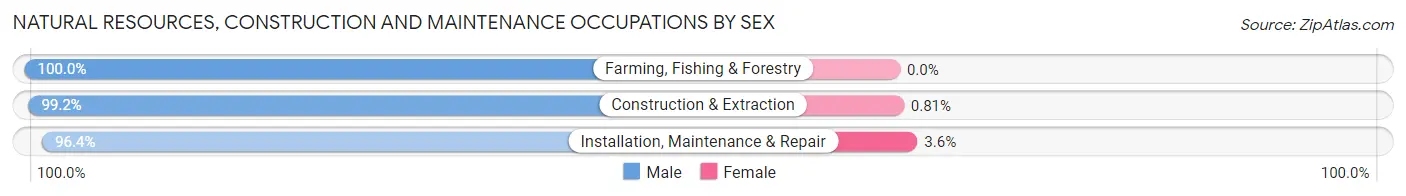
| Occupation | Male | Female |
| Farming, Fishing & Forestry | 88 (100.0%) | 0 (0.0%) |
| Construction & Extraction | 736 (99.2%) | 6 (0.8%) |
| Installation, Maintenance & Repair | 371 (96.4%) | 14 (3.6%) |
| Total (Category) | 1,195 (98.4%) | 20 (1.7%) |
| Total (Overall) | 5,130 (52.9%) | 4,560 (47.1%) |
Production, Transportation and Moving Occupations
The most common Production, Transportation and Moving occupations in Manistee County are Production (621 | 6.4%), Material Moving (474 | 4.9%), and Transportation (283 | 2.9%).
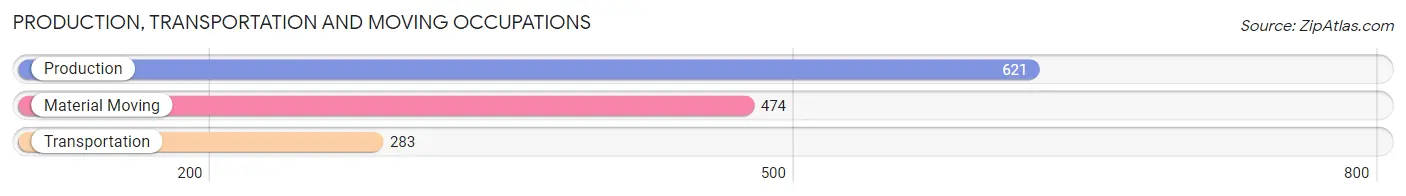
Production, Transportation and Moving Occupations by Sex
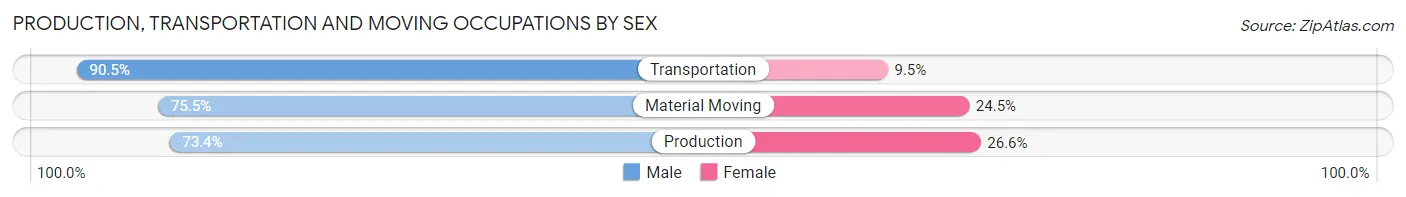
| Occupation | Male | Female |
| Production | 456 (73.4%) | 165 (26.6%) |
| Transportation | 256 (90.5%) | 27 (9.5%) |
| Material Moving | 358 (75.5%) | 116 (24.5%) |
| Total (Category) | 1,070 (77.6%) | 308 (22.4%) |
| Total (Overall) | 5,130 (52.9%) | 4,560 (47.1%) |
Employment Industries by Sex in Manistee County
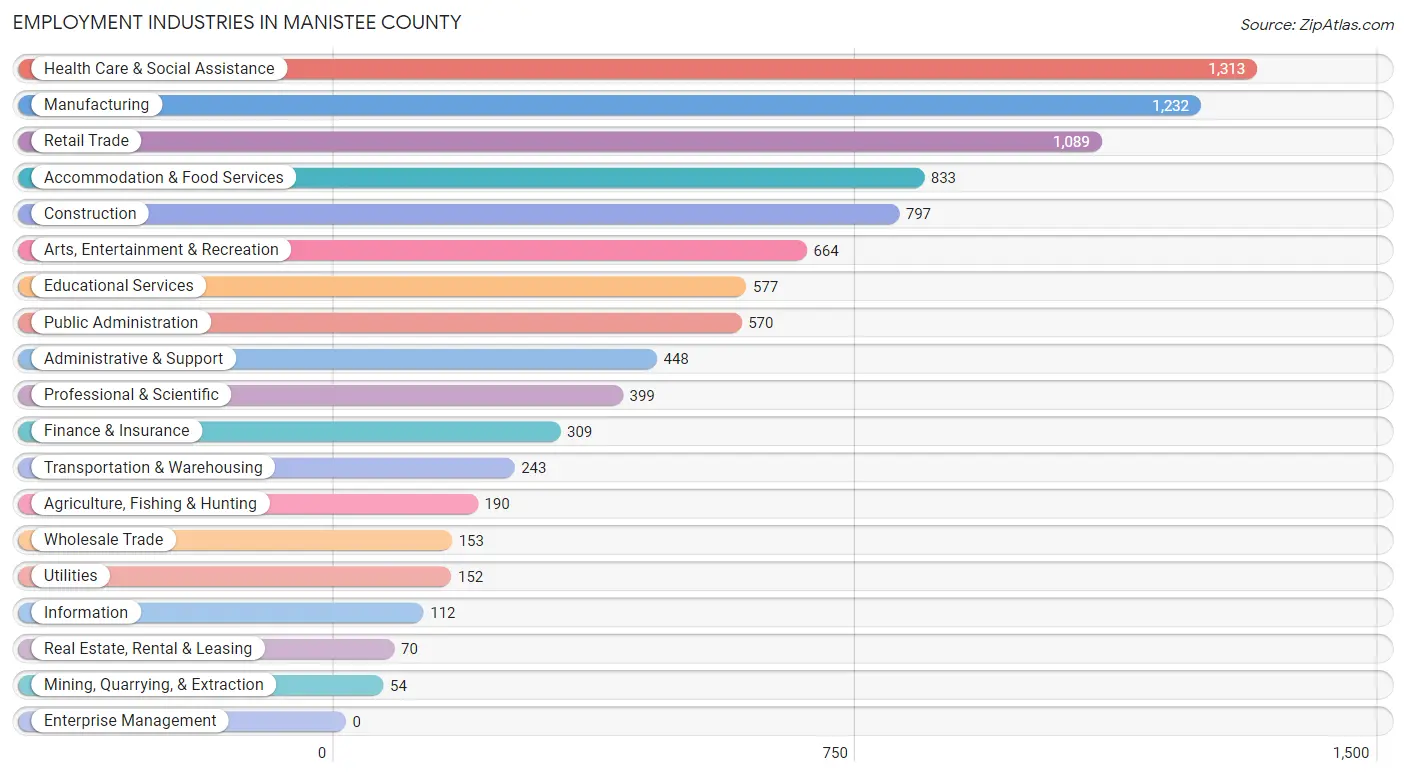
Employment Industries in Manistee County
The major employment industries in Manistee County include Health Care & Social Assistance (1,313 | 13.6%), Manufacturing (1,232 | 12.7%), Retail Trade (1,089 | 11.2%), Accommodation & Food Services (833 | 8.6%), and Construction (797 | 8.2%).
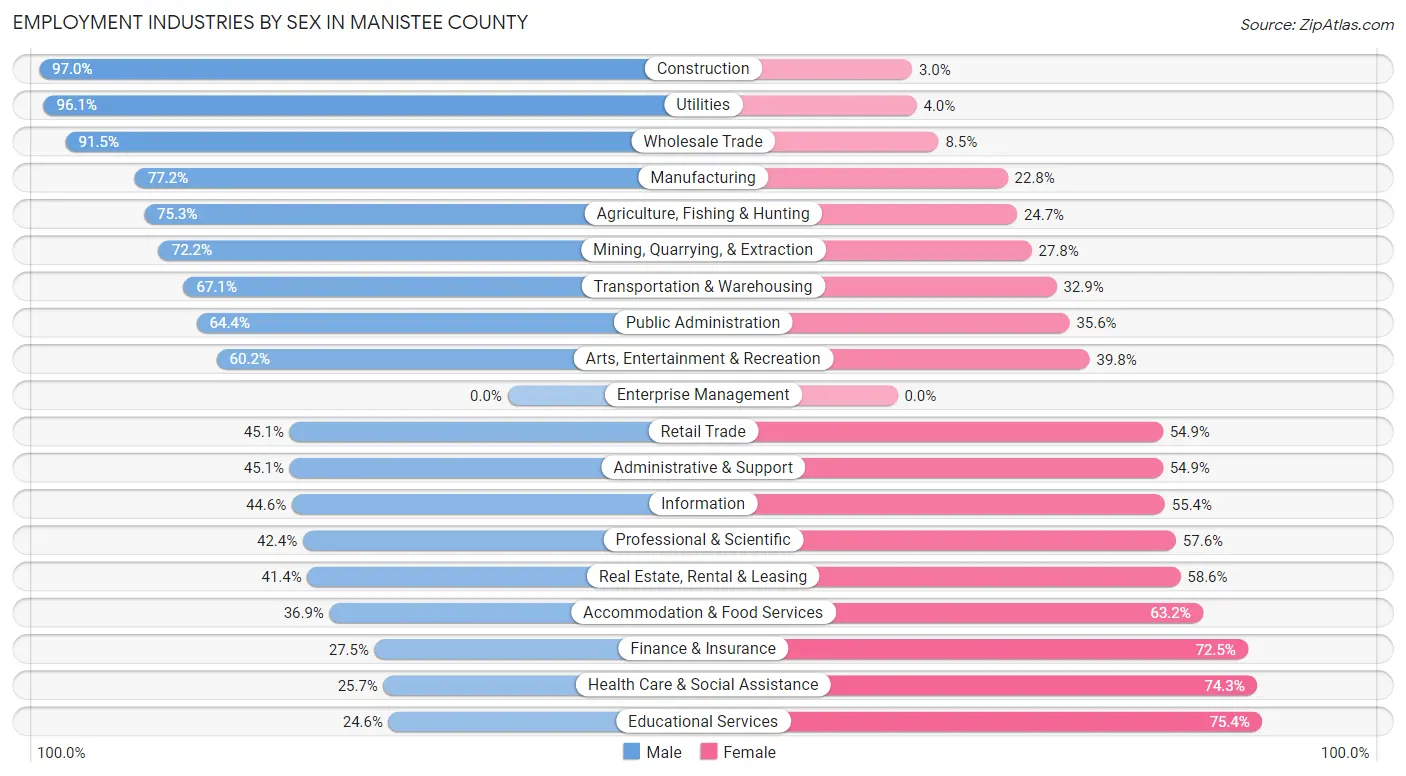
Employment Industries by Sex in Manistee County
The Manistee County industries that see more men than women are Construction (97.0%), Utilities (96.1%), and Wholesale Trade (91.5%), whereas the industries that tend to have a higher number of women are Educational Services (75.4%), Health Care & Social Assistance (74.3%), and Finance & Insurance (72.5%).
| Industry | Male | Female |
| Agriculture, Fishing & Hunting | 143 (75.3%) | 47 (24.7%) |
| Mining, Quarrying, & Extraction | 39 (72.2%) | 15 (27.8%) |
| Construction | 773 (97.0%) | 24 (3.0%) |
| Manufacturing | 951 (77.2%) | 281 (22.8%) |
| Wholesale Trade | 140 (91.5%) | 13 (8.5%) |
| Retail Trade | 491 (45.1%) | 598 (54.9%) |
| Transportation & Warehousing | 163 (67.1%) | 80 (32.9%) |
| Utilities | 146 (96.1%) | 6 (4.0%) |
| Information | 50 (44.6%) | 62 (55.4%) |
| Finance & Insurance | 85 (27.5%) | 224 (72.5%) |
| Real Estate, Rental & Leasing | 29 (41.4%) | 41 (58.6%) |
| Professional & Scientific | 169 (42.4%) | 230 (57.6%) |
| Enterprise Management | 0 (0.0%) | 0 (0.0%) |
| Administrative & Support | 202 (45.1%) | 246 (54.9%) |
| Educational Services | 142 (24.6%) | 435 (75.4%) |
| Health Care & Social Assistance | 337 (25.7%) | 976 (74.3%) |
| Arts, Entertainment & Recreation | 400 (60.2%) | 264 (39.8%) |
| Accommodation & Food Services | 307 (36.8%) | 526 (63.1%) |
| Public Administration | 367 (64.4%) | 203 (35.6%) |
| Total | 5,130 (52.9%) | 4,560 (47.1%) |
Education in Manistee County
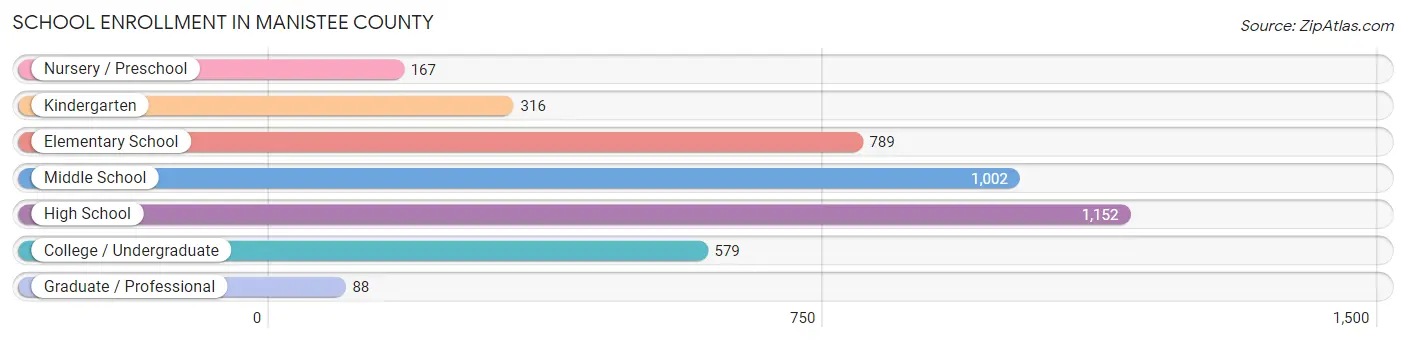
School Enrollment in Manistee County
The most common levels of schooling among the 4,093 students in Manistee County are high school (1,152 | 28.1%), middle school (1,002 | 24.5%), and elementary school (789 | 19.3%).
| School Level | # Students | % Students |
| Nursery / Preschool | 167 | 4.1% |
| Kindergarten | 316 | 7.7% |
| Elementary School | 789 | 19.3% |
| Middle School | 1,002 | 24.5% |
| High School | 1,152 | 28.1% |
| College / Undergraduate | 579 | 14.1% |
| Graduate / Professional | 88 | 2.1% |
| Total | 4,093 | 100.0% |
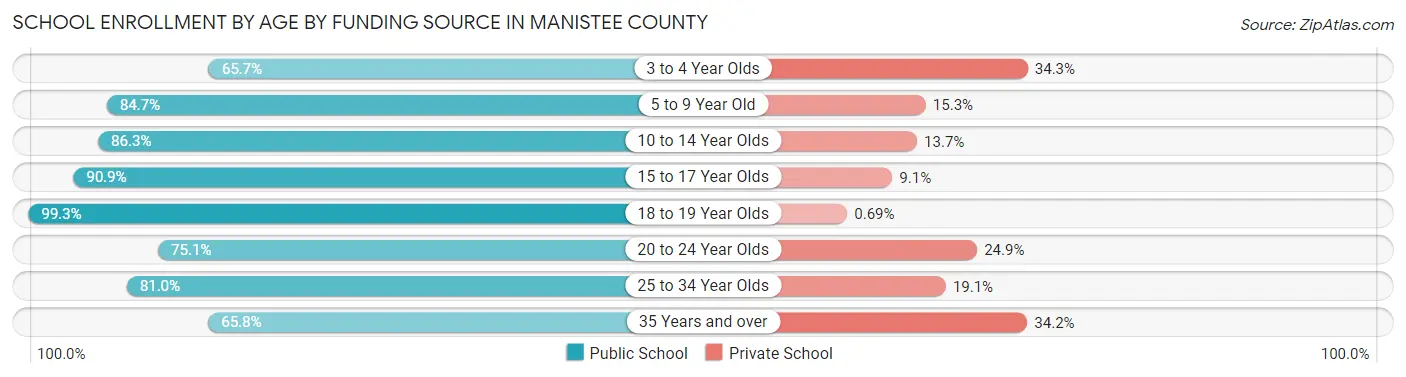
School Enrollment by Age by Funding Source in Manistee County
Out of a total of 4,093 students who are enrolled in schools in Manistee County, 606 (14.8%) attend a private institution, while the remaining 3,487 (85.2%) are enrolled in public schools. The age group of 3 to 4 year olds has the highest likelihood of being enrolled in private schools, with 47 (34.3% in the age bracket) enrolled. Conversely, the age group of 18 to 19 year olds has the lowest likelihood of being enrolled in a private school, with 289 (99.3% in the age bracket) attending a public institution.
| Age Bracket | Public School | Private School |
| 3 to 4 Year Olds | 90 (65.7%) | 47 (34.3%) |
| 5 to 9 Year Old | 851 (84.7%) | 154 (15.3%) |
| 10 to 14 Year Olds | 1,122 (86.3%) | 178 (13.7%) |
| 15 to 17 Year Olds | 701 (90.9%) | 70 (9.1%) |
| 18 to 19 Year Olds | 289 (99.3%) | 2 (0.7%) |
| 20 to 24 Year Olds | 160 (75.1%) | 53 (24.9%) |
| 25 to 34 Year Olds | 153 (80.9%) | 36 (19.1%) |
| 35 Years and over | 123 (65.8%) | 64 (34.2%) |
| Total | 3,487 (85.2%) | 606 (14.8%) |
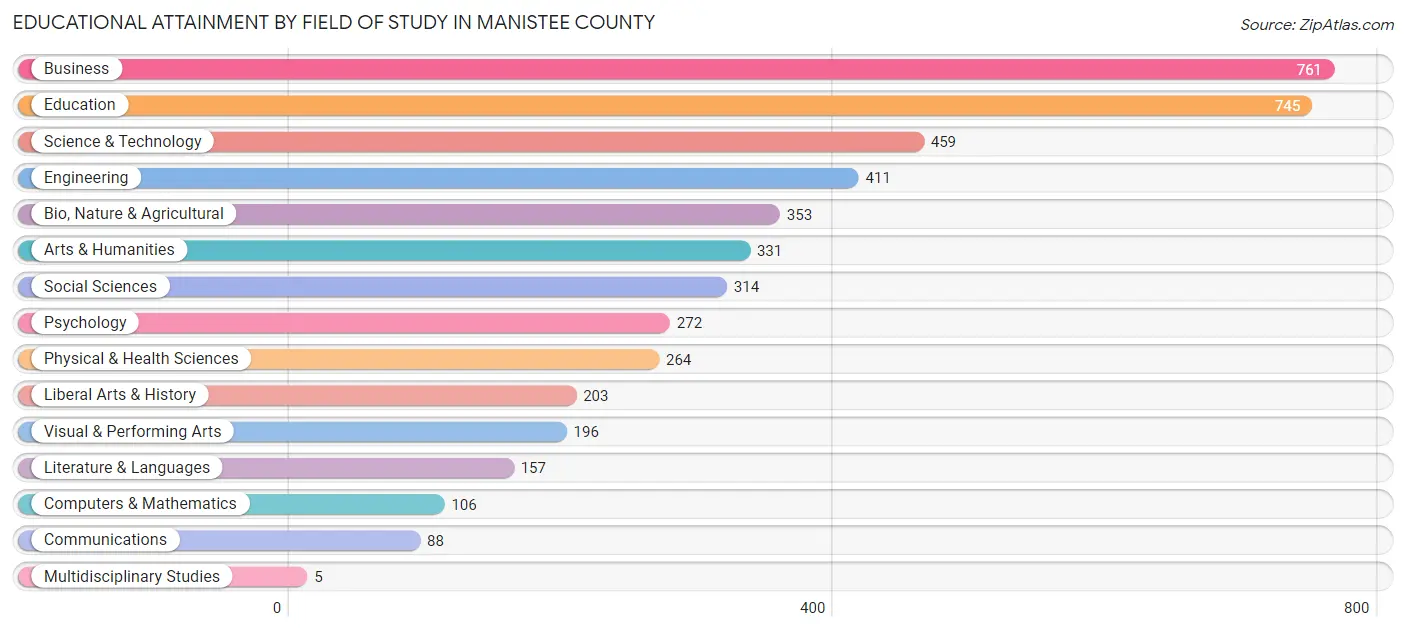
Educational Attainment by Field of Study in Manistee County
Business (761 | 16.3%), education (745 | 16.0%), science & technology (459 | 9.8%), engineering (411 | 8.8%), and bio, nature & agricultural (353 | 7.6%) are the most common fields of study among 4,665 individuals in Manistee County who have obtained a bachelor's degree or higher.
| Field of Study | # Graduates | % Graduates |
| Computers & Mathematics | 106 | 2.3% |
| Bio, Nature & Agricultural | 353 | 7.6% |
| Physical & Health Sciences | 264 | 5.7% |
| Psychology | 272 | 5.8% |
| Social Sciences | 314 | 6.7% |
| Engineering | 411 | 8.8% |
| Multidisciplinary Studies | 5 | 0.1% |
| Science & Technology | 459 | 9.8% |
| Business | 761 | 16.3% |
| Education | 745 | 16.0% |
| Literature & Languages | 157 | 3.4% |
| Liberal Arts & History | 203 | 4.3% |
| Visual & Performing Arts | 196 | 4.2% |
| Communications | 88 | 1.9% |
| Arts & Humanities | 331 | 7.1% |
| Total | 4,665 | 100.0% |
Transportation & Commute in Manistee County
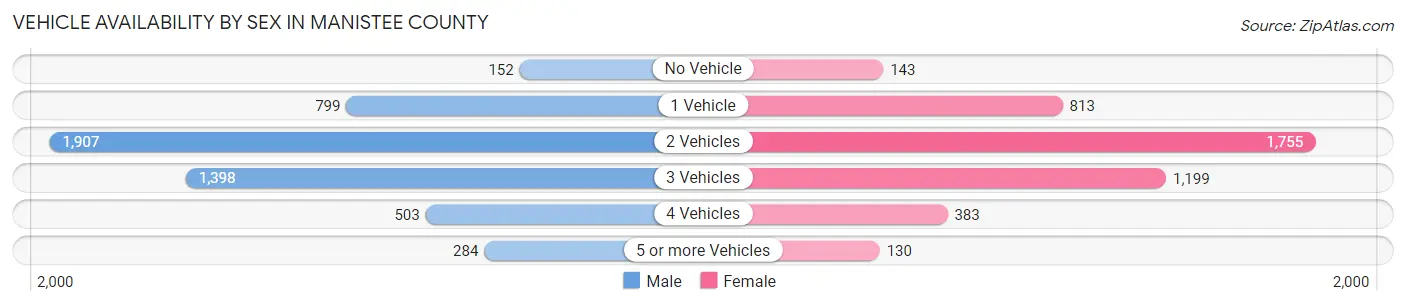
Vehicle Availability by Sex in Manistee County
The most prevalent vehicle ownership categories in Manistee County are males with 2 vehicles (1,907, accounting for 37.8%) and females with 2 vehicles (1,755, making up 43.1%).
| Vehicles Available | Male | Female |
| No Vehicle | 152 (3.0%) | 143 (3.2%) |
| 1 Vehicle | 799 (15.8%) | 813 (18.4%) |
| 2 Vehicles | 1,907 (37.8%) | 1,755 (39.7%) |
| 3 Vehicles | 1,398 (27.7%) | 1,199 (27.1%) |
| 4 Vehicles | 503 (10.0%) | 383 (8.7%) |
| 5 or more Vehicles | 284 (5.6%) | 130 (2.9%) |
| Total | 5,043 (100.0%) | 4,423 (100.0%) |
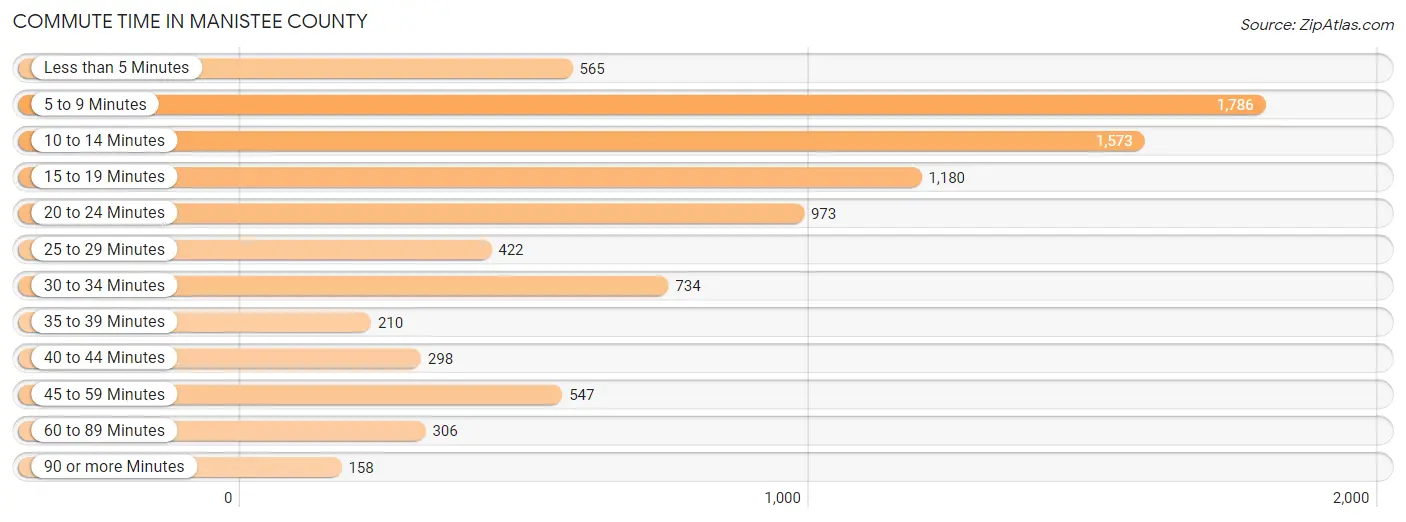
Commute Time in Manistee County
The most frequently occuring commute durations in Manistee County are 5 to 9 minutes (1,786 commuters, 20.4%), 10 to 14 minutes (1,573 commuters, 18.0%), and 15 to 19 minutes (1,180 commuters, 13.5%).
| Commute Time | # Commuters | % Commuters |
| Less than 5 Minutes | 565 | 6.5% |
| 5 to 9 Minutes | 1,786 | 20.4% |
| 10 to 14 Minutes | 1,573 | 18.0% |
| 15 to 19 Minutes | 1,180 | 13.5% |
| 20 to 24 Minutes | 973 | 11.1% |
| 25 to 29 Minutes | 422 | 4.8% |
| 30 to 34 Minutes | 734 | 8.4% |
| 35 to 39 Minutes | 210 | 2.4% |
| 40 to 44 Minutes | 298 | 3.4% |
| 45 to 59 Minutes | 547 | 6.2% |
| 60 to 89 Minutes | 306 | 3.5% |
| 90 or more Minutes | 158 | 1.8% |
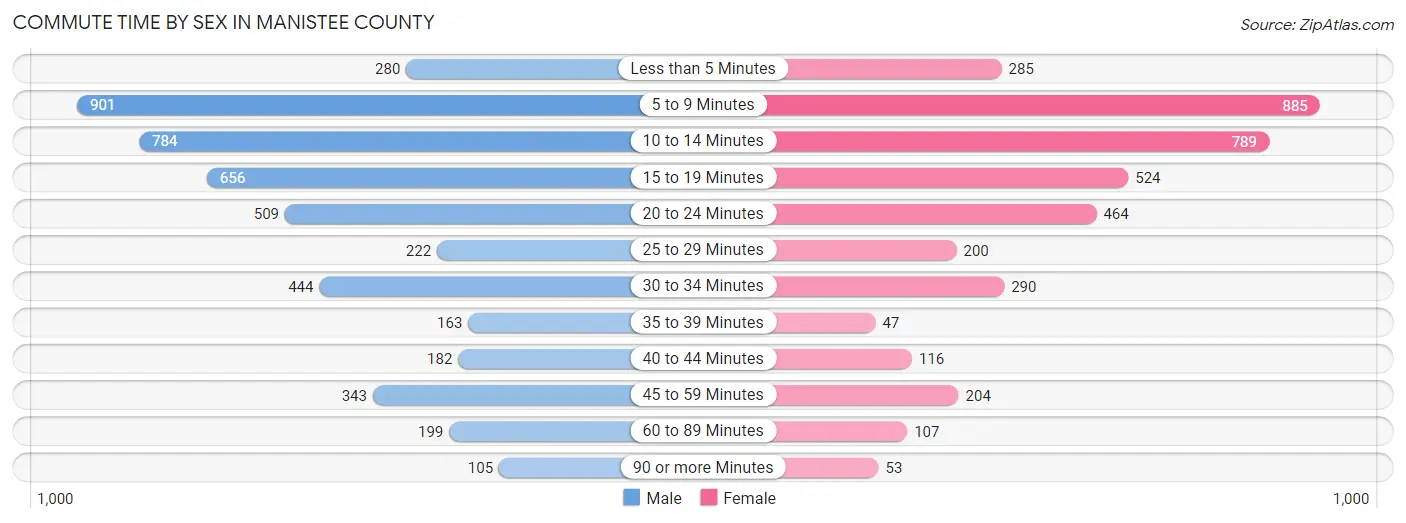
Commute Time by Sex in Manistee County
The most common commute times in Manistee County are 5 to 9 minutes (901 commuters, 18.8%) for males and 5 to 9 minutes (885 commuters, 22.3%) for females.
| Commute Time | Male | Female |
| Less than 5 Minutes | 280 (5.9%) | 285 (7.2%) |
| 5 to 9 Minutes | 901 (18.8%) | 885 (22.3%) |
| 10 to 14 Minutes | 784 (16.4%) | 789 (19.9%) |
| 15 to 19 Minutes | 656 (13.7%) | 524 (13.2%) |
| 20 to 24 Minutes | 509 (10.6%) | 464 (11.7%) |
| 25 to 29 Minutes | 222 (4.6%) | 200 (5.1%) |
| 30 to 34 Minutes | 444 (9.3%) | 290 (7.3%) |
| 35 to 39 Minutes | 163 (3.4%) | 47 (1.2%) |
| 40 to 44 Minutes | 182 (3.8%) | 116 (2.9%) |
| 45 to 59 Minutes | 343 (7.2%) | 204 (5.1%) |
| 60 to 89 Minutes | 199 (4.2%) | 107 (2.7%) |
| 90 or more Minutes | 105 (2.2%) | 53 (1.3%) |
Time of Departure to Work by Sex in Manistee County
The most frequent times of departure to work in Manistee County are 7:00 AM to 7:29 AM (697, 14.6%) for males and 7:30 AM to 7:59 AM (681, 17.2%) for females.
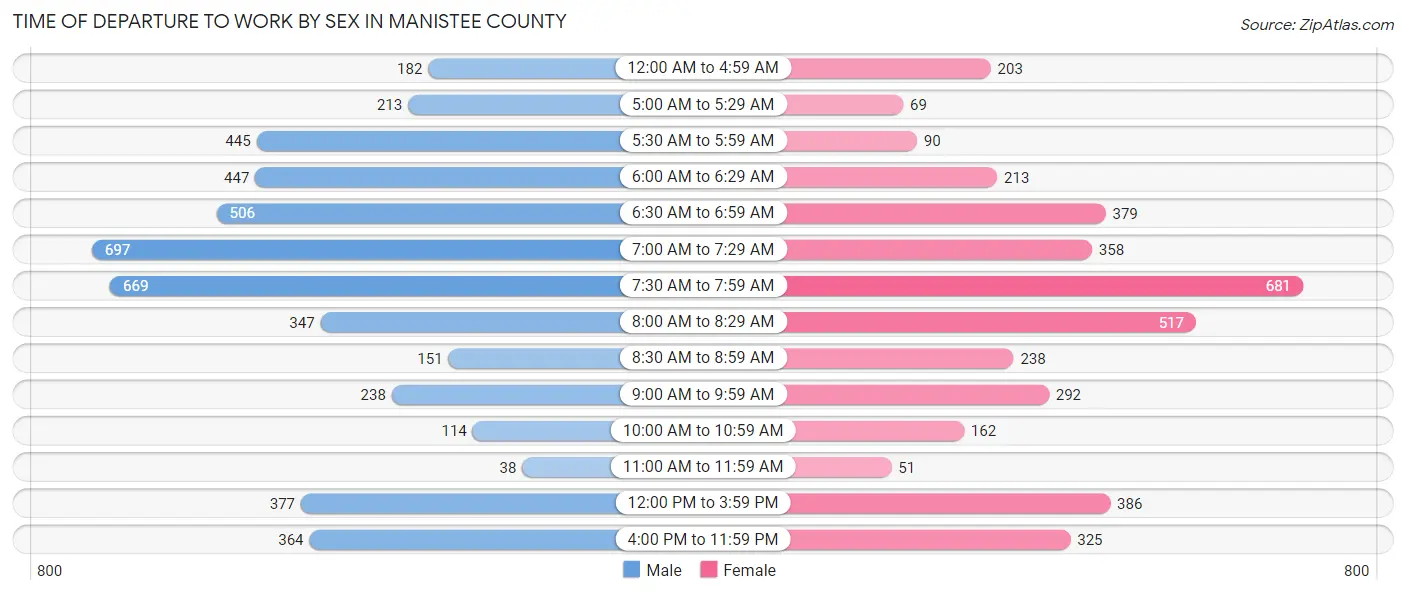
| Time of Departure | Male | Female |
| 12:00 AM to 4:59 AM | 182 (3.8%) | 203 (5.1%) |
| 5:00 AM to 5:29 AM | 213 (4.4%) | 69 (1.7%) |
| 5:30 AM to 5:59 AM | 445 (9.3%) | 90 (2.3%) |
| 6:00 AM to 6:29 AM | 447 (9.3%) | 213 (5.4%) |
| 6:30 AM to 6:59 AM | 506 (10.6%) | 379 (9.6%) |
| 7:00 AM to 7:29 AM | 697 (14.6%) | 358 (9.0%) |
| 7:30 AM to 7:59 AM | 669 (14.0%) | 681 (17.2%) |
| 8:00 AM to 8:29 AM | 347 (7.2%) | 517 (13.0%) |
| 8:30 AM to 8:59 AM | 151 (3.2%) | 238 (6.0%) |
| 9:00 AM to 9:59 AM | 238 (5.0%) | 292 (7.4%) |
| 10:00 AM to 10:59 AM | 114 (2.4%) | 162 (4.1%) |
| 11:00 AM to 11:59 AM | 38 (0.8%) | 51 (1.3%) |
| 12:00 PM to 3:59 PM | 377 (7.9%) | 386 (9.7%) |
| 4:00 PM to 11:59 PM | 364 (7.6%) | 325 (8.2%) |
| Total | 4,788 (100.0%) | 3,964 (100.0%) |
Housing Occupancy in Manistee County
Occupancy by Ownership in Manistee County
Of the total 9,927 dwellings in Manistee County, owner-occupied units account for 8,547 (86.1%), while renter-occupied units make up 1,380 (13.9%).
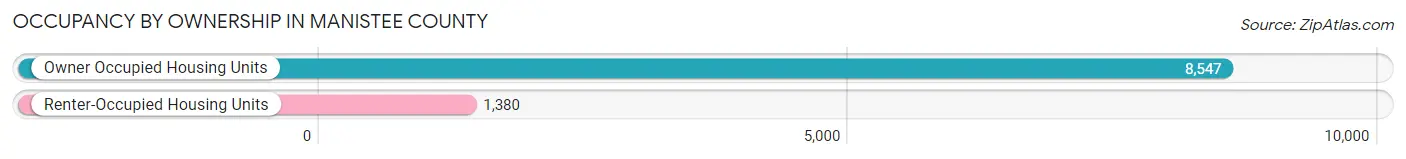
| Occupancy | # Housing Units | % Housing Units |
| Owner Occupied Housing Units | 8,547 | 86.1% |
| Renter-Occupied Housing Units | 1,380 | 13.9% |
| Total Occupied Housing Units | 9,927 | 100.0% |
Occupancy by Household Size in Manistee County
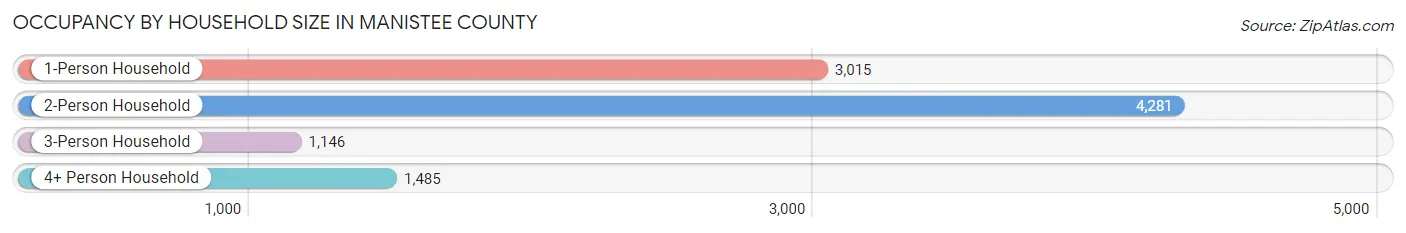
| Household Size | # Housing Units | % Housing Units |
| 1-Person Household | 3,015 | 30.4% |
| 2-Person Household | 4,281 | 43.1% |
| 3-Person Household | 1,146 | 11.5% |
| 4+ Person Household | 1,485 | 15.0% |
| Total Housing Units | 9,927 | 100.0% |
Occupancy by Ownership by Household Size in Manistee County
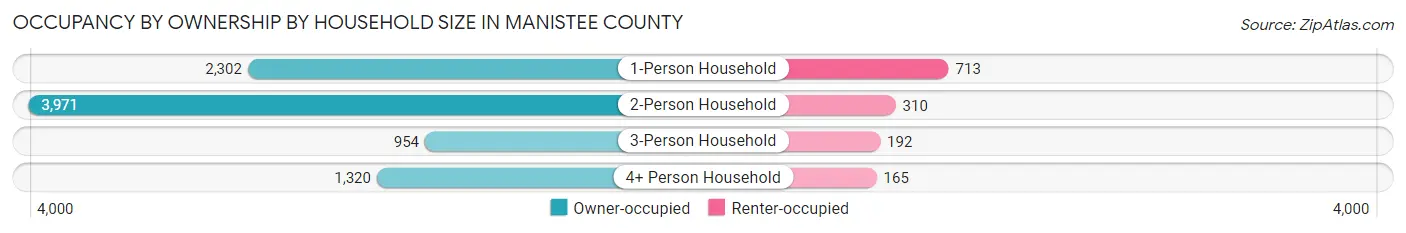
| Household Size | Owner-occupied | Renter-occupied |
| 1-Person Household | 2,302 (76.3%) | 713 (23.6%) |
| 2-Person Household | 3,971 (92.8%) | 310 (7.2%) |
| 3-Person Household | 954 (83.3%) | 192 (16.8%) |
| 4+ Person Household | 1,320 (88.9%) | 165 (11.1%) |
| Total Housing Units | 8,547 (86.1%) | 1,380 (13.9%) |
Occupancy by Educational Attainment in Manistee County
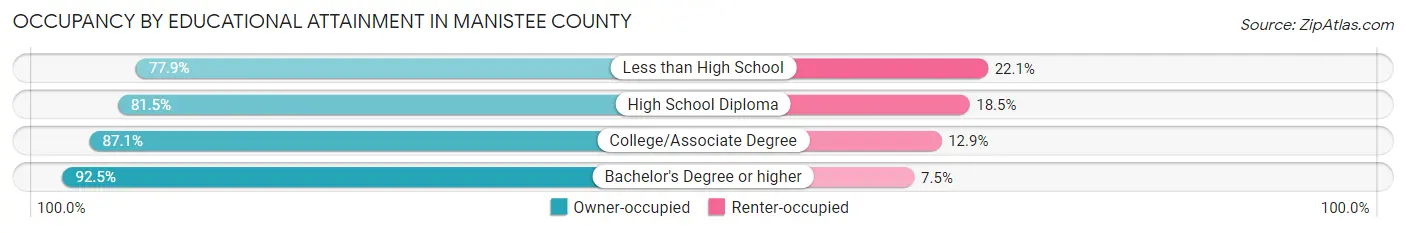
| Household Size | Owner-occupied | Renter-occupied |
| Less than High School | 518 (77.9%) | 147 (22.1%) |
| High School Diploma | 2,467 (81.5%) | 559 (18.5%) |
| College/Associate Degree | 3,315 (87.1%) | 491 (12.9%) |
| Bachelor's Degree or higher | 2,247 (92.5%) | 183 (7.5%) |
Occupancy by Age of Householder in Manistee County
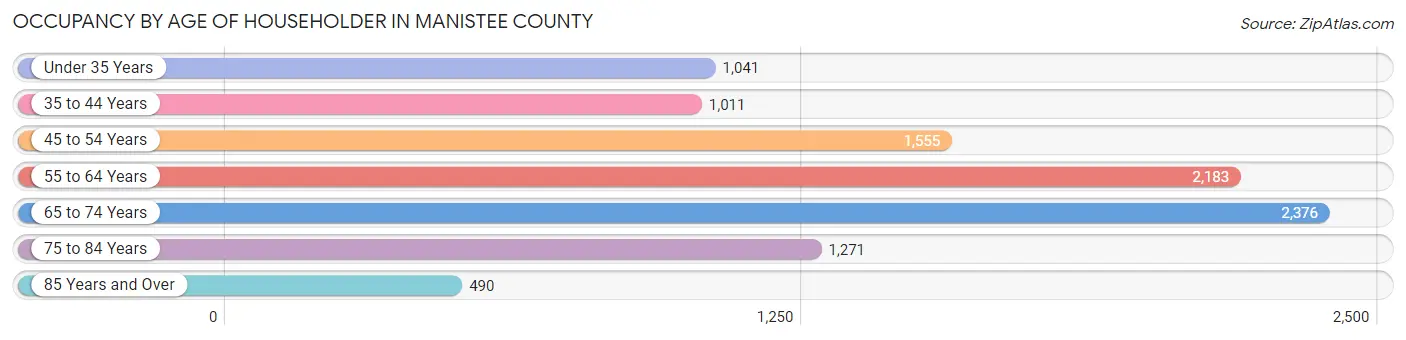
| Age Bracket | # Households | % Households |
| Under 35 Years | 1,041 | 10.5% |
| 35 to 44 Years | 1,011 | 10.2% |
| 45 to 54 Years | 1,555 | 15.7% |
| 55 to 64 Years | 2,183 | 22.0% |
| 65 to 74 Years | 2,376 | 23.9% |
| 75 to 84 Years | 1,271 | 12.8% |
| 85 Years and Over | 490 | 4.9% |
| Total | 9,927 | 100.0% |
Housing Finances in Manistee County
Median Income by Occupancy in Manistee County
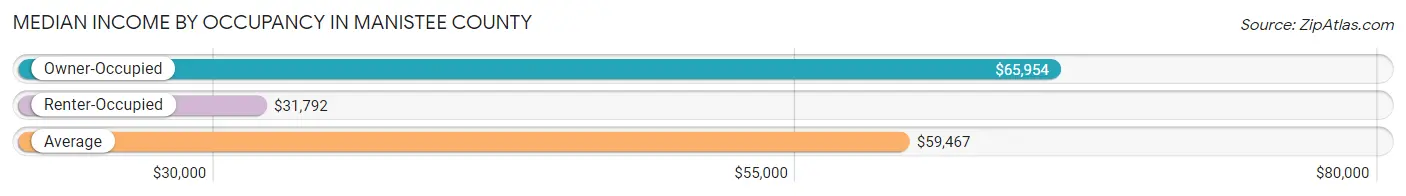
| Occupancy Type | # Households | Median Income |
| Owner-Occupied | 8,547 (86.1%) | $65,954 |
| Renter-Occupied | 1,380 (13.9%) | $31,792 |
| Average | 9,927 (100.0%) | $59,467 |
Occupancy by Householder Income Bracket in Manistee County
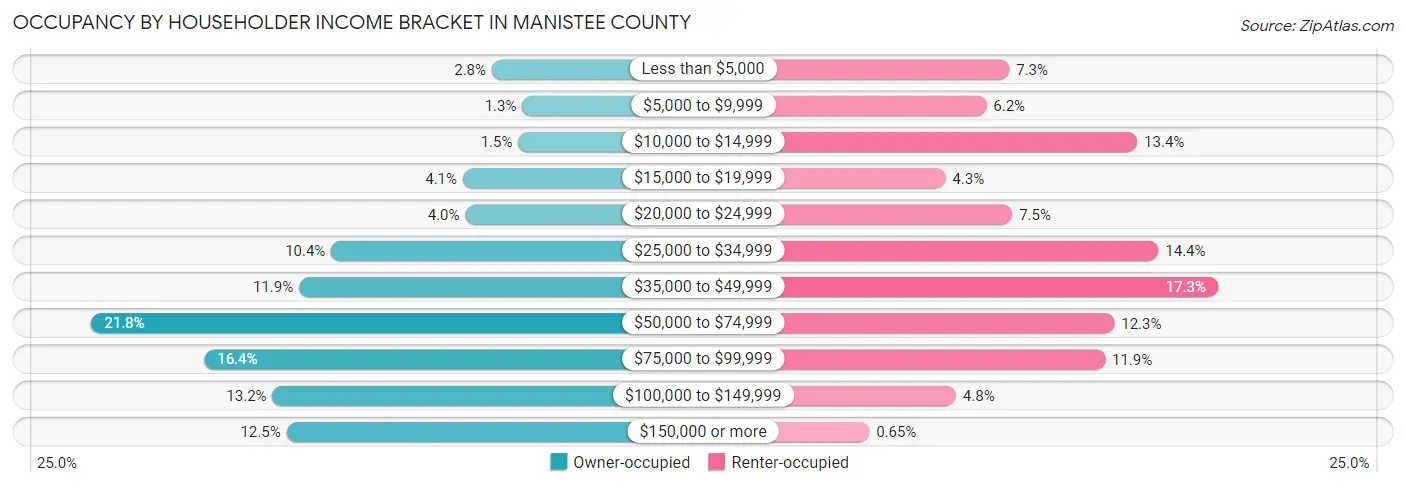
| Income Bracket | Owner-occupied | Renter-occupied |
| Less than $5,000 | 235 (2.8%) | 101 (7.3%) |
| $5,000 to $9,999 | 111 (1.3%) | 86 (6.2%) |
| $10,000 to $14,999 | 127 (1.5%) | 185 (13.4%) |
| $15,000 to $19,999 | 353 (4.1%) | 59 (4.3%) |
| $20,000 to $24,999 | 343 (4.0%) | 103 (7.5%) |
| $25,000 to $34,999 | 889 (10.4%) | 199 (14.4%) |
| $35,000 to $49,999 | 1,020 (11.9%) | 238 (17.2%) |
| $50,000 to $74,999 | 1,865 (21.8%) | 170 (12.3%) |
| $75,000 to $99,999 | 1,405 (16.4%) | 164 (11.9%) |
| $100,000 to $149,999 | 1,128 (13.2%) | 66 (4.8%) |
| $150,000 or more | 1,071 (12.5%) | 9 (0.6%) |
| Total | 8,547 (100.0%) | 1,380 (100.0%) |
Monthly Housing Cost Tiers in Manistee County
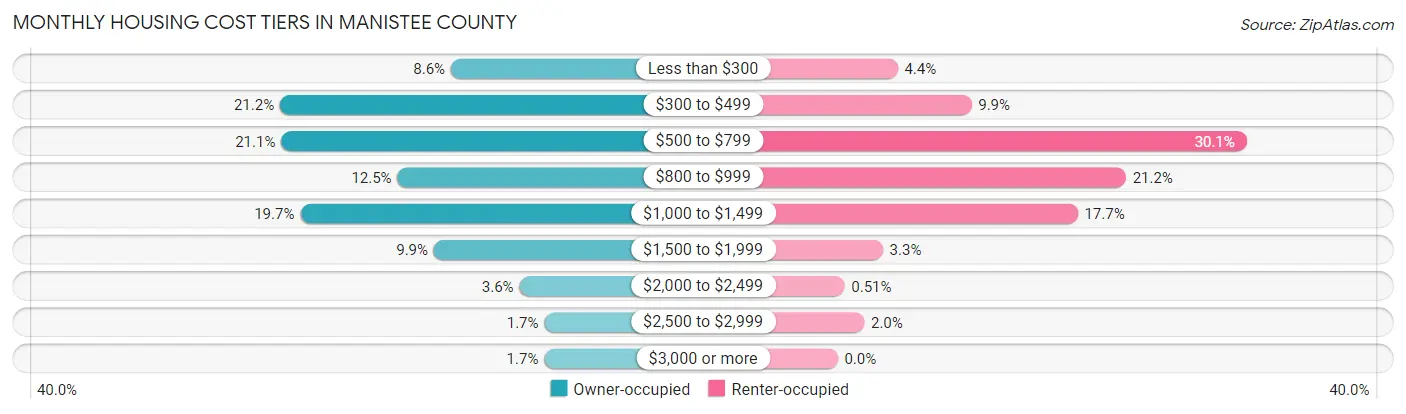
| Monthly Cost | Owner-occupied | Renter-occupied |
| Less than $300 | 735 (8.6%) | 61 (4.4%) |
| $300 to $499 | 1,811 (21.2%) | 136 (9.9%) |
| $500 to $799 | 1,803 (21.1%) | 416 (30.1%) |
| $800 to $999 | 1,072 (12.5%) | 293 (21.2%) |
| $1,000 to $1,499 | 1,684 (19.7%) | 244 (17.7%) |
| $1,500 to $1,999 | 843 (9.9%) | 46 (3.3%) |
| $2,000 to $2,499 | 304 (3.6%) | 7 (0.5%) |
| $2,500 to $2,999 | 147 (1.7%) | 27 (2.0%) |
| $3,000 or more | 148 (1.7%) | 0 (0.0%) |
| Total | 8,547 (100.0%) | 1,380 (100.0%) |
Physical Housing Characteristics in Manistee County
Housing Structures in Manistee County
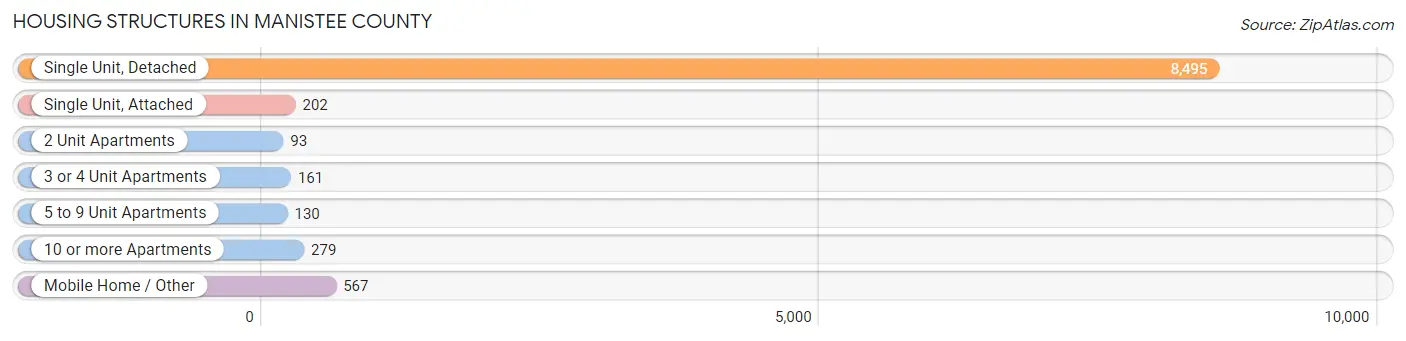
| Structure Type | # Housing Units | % Housing Units |
| Single Unit, Detached | 8,495 | 85.6% |
| Single Unit, Attached | 202 | 2.0% |
| 2 Unit Apartments | 93 | 0.9% |
| 3 or 4 Unit Apartments | 161 | 1.6% |
| 5 to 9 Unit Apartments | 130 | 1.3% |
| 10 or more Apartments | 279 | 2.8% |
| Mobile Home / Other | 567 | 5.7% |
| Total | 9,927 | 100.0% |
Housing Structures by Occupancy in Manistee County
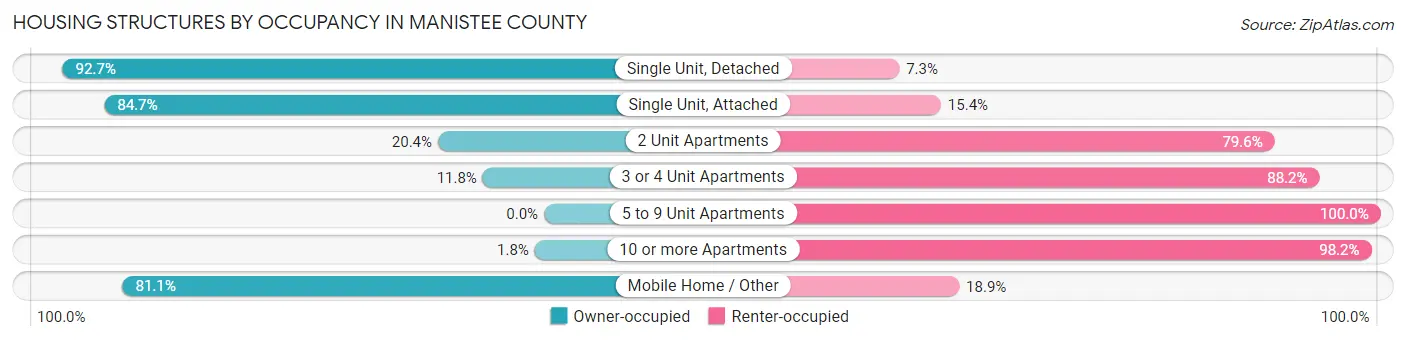
| Structure Type | Owner-occupied | Renter-occupied |
| Single Unit, Detached | 7,873 (92.7%) | 622 (7.3%) |
| Single Unit, Attached | 171 (84.7%) | 31 (15.3%) |
| 2 Unit Apartments | 19 (20.4%) | 74 (79.6%) |
| 3 or 4 Unit Apartments | 19 (11.8%) | 142 (88.2%) |
| 5 to 9 Unit Apartments | 0 (0.0%) | 130 (100.0%) |
| 10 or more Apartments | 5 (1.8%) | 274 (98.2%) |
| Mobile Home / Other | 460 (81.1%) | 107 (18.9%) |
| Total | 8,547 (86.1%) | 1,380 (13.9%) |
Housing Structures by Number of Rooms in Manistee County
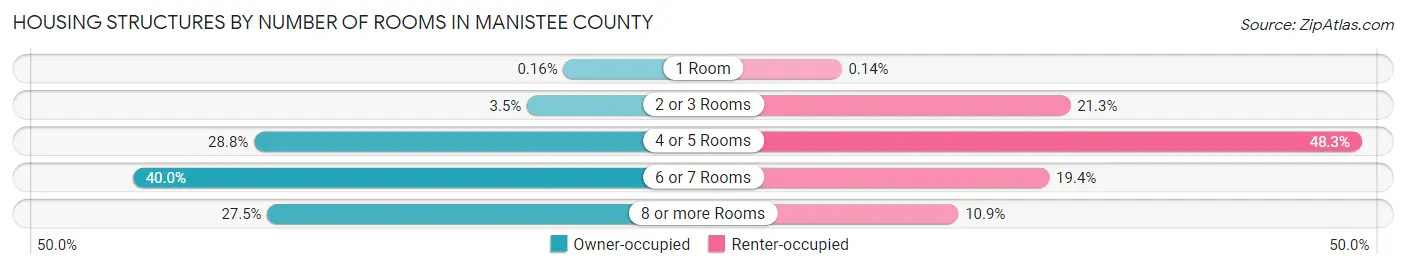
| Number of Rooms | Owner-occupied | Renter-occupied |
| 1 Room | 14 (0.2%) | 2 (0.1%) |
| 2 or 3 Rooms | 301 (3.5%) | 294 (21.3%) |
| 4 or 5 Rooms | 2,459 (28.8%) | 666 (48.3%) |
| 6 or 7 Rooms | 3,419 (40.0%) | 267 (19.4%) |
| 8 or more Rooms | 2,354 (27.5%) | 151 (10.9%) |
| Total | 8,547 (100.0%) | 1,380 (100.0%) |
Housing Structure by Heating Type in Manistee County
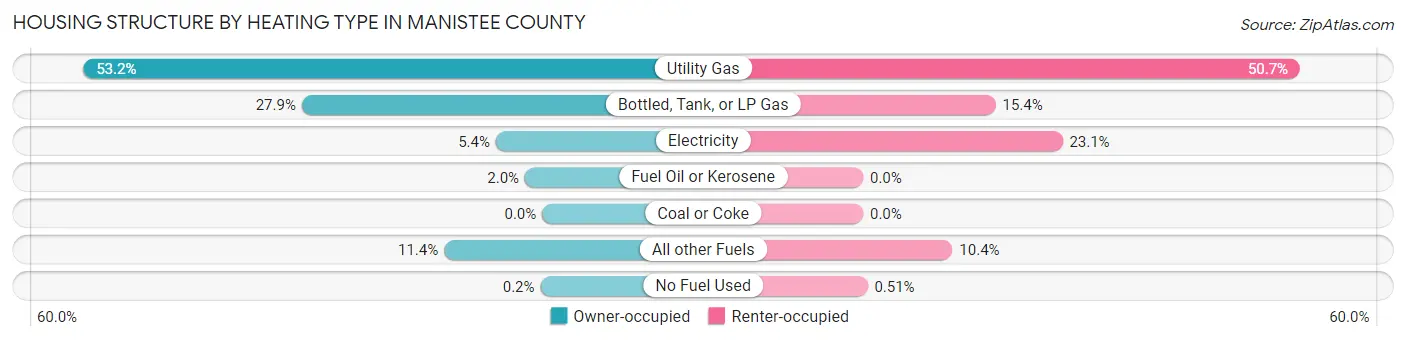
| Heating Type | Owner-occupied | Renter-occupied |
| Utility Gas | 4,547 (53.2%) | 699 (50.6%) |
| Bottled, Tank, or LP Gas | 2,382 (27.9%) | 212 (15.4%) |
| Electricity | 459 (5.4%) | 319 (23.1%) |
| Fuel Oil or Kerosene | 170 (2.0%) | 0 (0.0%) |
| Coal or Coke | 0 (0.0%) | 0 (0.0%) |
| All other Fuels | 972 (11.4%) | 143 (10.4%) |
| No Fuel Used | 17 (0.2%) | 7 (0.5%) |
| Total | 8,547 (100.0%) | 1,380 (100.0%) |
Household Vehicle Usage in Manistee County
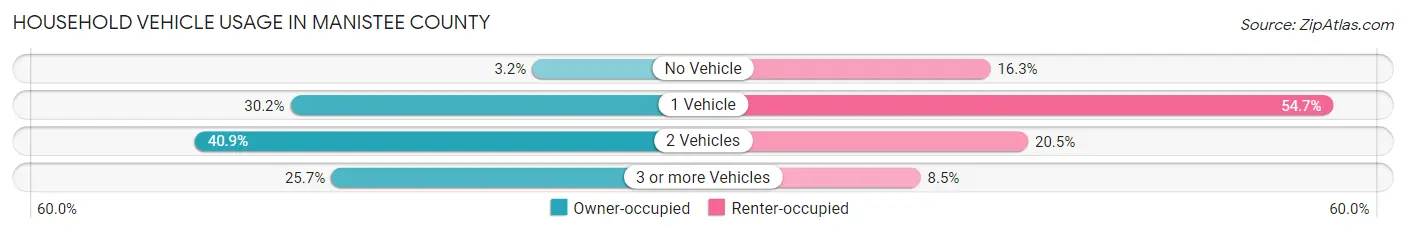
| Vehicles per Household | Owner-occupied | Renter-occupied |
| No Vehicle | 270 (3.2%) | 225 (16.3%) |
| 1 Vehicle | 2,584 (30.2%) | 755 (54.7%) |
| 2 Vehicles | 3,498 (40.9%) | 283 (20.5%) |
| 3 or more Vehicles | 2,195 (25.7%) | 117 (8.5%) |
| Total | 8,547 (100.0%) | 1,380 (100.0%) |
Real Estate & Mortgages in Manistee County
Real Estate and Mortgage Overview in Manistee County
| Characteristic | Without Mortgage | With Mortgage |
| Housing Units | 4,137 | 4,410 |
| Median Property Value | $142,200 | $170,500 |
| Median Household Income | $53,357 | $710 |
| Monthly Housing Costs | $448 | $125 |
| Real Estate Taxes | $1,661 | $274 |
Property Value by Mortgage Status in Manistee County
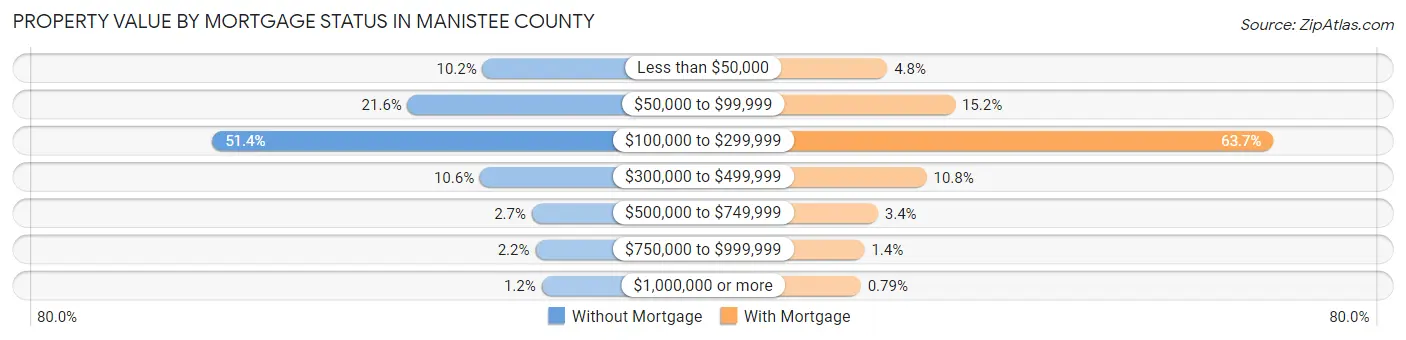
| Property Value | Without Mortgage | With Mortgage |
| Less than $50,000 | 423 (10.2%) | 213 (4.8%) |
| $50,000 to $99,999 | 895 (21.6%) | 668 (15.1%) |
| $100,000 to $299,999 | 2,127 (51.4%) | 2,807 (63.6%) |
| $300,000 to $499,999 | 439 (10.6%) | 477 (10.8%) |
| $500,000 to $749,999 | 112 (2.7%) | 150 (3.4%) |
| $750,000 to $999,999 | 90 (2.2%) | 60 (1.4%) |
| $1,000,000 or more | 51 (1.2%) | 35 (0.8%) |
| Total | 4,137 (100.0%) | 4,410 (100.0%) |
Household Income by Mortgage Status in Manistee County
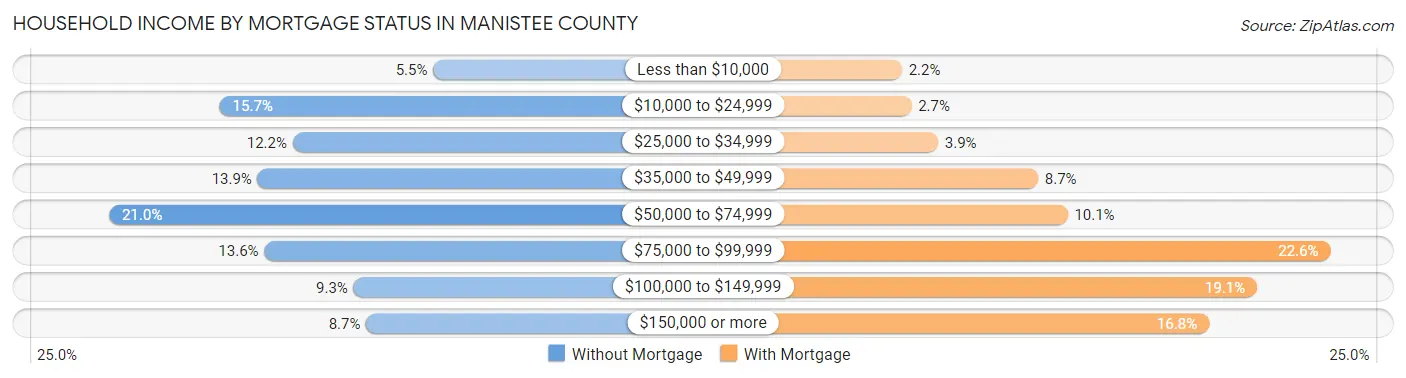
| Household Income | Without Mortgage | With Mortgage |
| Less than $10,000 | 229 (5.5%) | 97 (2.2%) |
| $10,000 to $24,999 | 650 (15.7%) | 117 (2.6%) |
| $25,000 to $34,999 | 506 (12.2%) | 173 (3.9%) |
| $35,000 to $49,999 | 575 (13.9%) | 383 (8.7%) |
| $50,000 to $74,999 | 868 (21.0%) | 445 (10.1%) |
| $75,000 to $99,999 | 562 (13.6%) | 997 (22.6%) |
| $100,000 to $149,999 | 386 (9.3%) | 843 (19.1%) |
| $150,000 or more | 361 (8.7%) | 742 (16.8%) |
| Total | 4,137 (100.0%) | 4,410 (100.0%) |
Property Value to Household Income Ratio in Manistee County
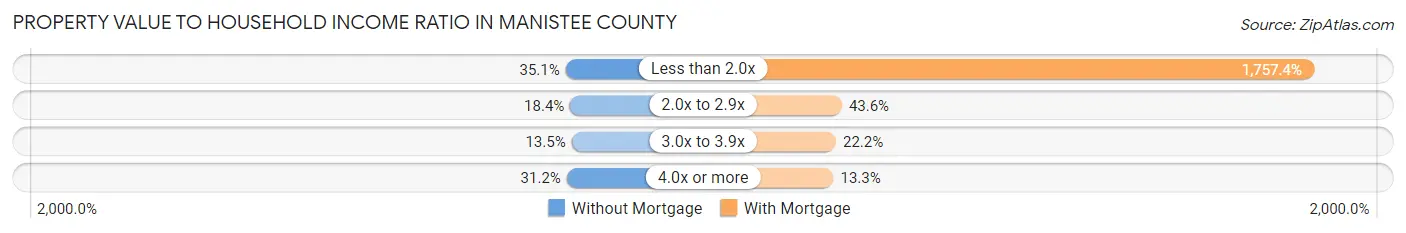
| Value-to-Income Ratio | Without Mortgage | With Mortgage |
| Less than 2.0x | 1,450 (35.0%) | 77,500 (1,757.4%) |
| 2.0x to 2.9x | 761 (18.4%) | 1,924 (43.6%) |
| 3.0x to 3.9x | 558 (13.5%) | 980 (22.2%) |
| 4.0x or more | 1,291 (31.2%) | 585 (13.3%) |
| Total | 4,137 (100.0%) | 4,410 (100.0%) |
Real Estate Taxes by Mortgage Status in Manistee County

| Property Taxes | Without Mortgage | With Mortgage |
| Less than $800 | 461 (11.1%) | 38 (0.9%) |
| $800 to $1,499 | 1,239 (29.9%) | 323 (7.3%) |
| $800 to $1,499 | 2,117 (51.2%) | 1,061 (24.1%) |
| Total | 4,137 (100.0%) | 4,410 (100.0%) |
Health & Disability in Manistee County
Health Insurance Coverage by Age in Manistee County
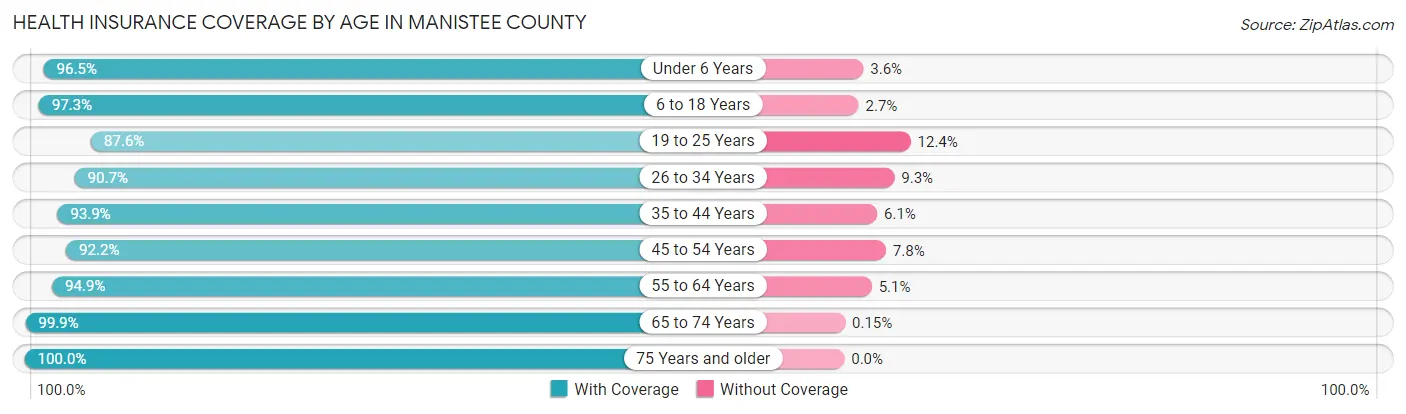
| Age Bracket | With Coverage | Without Coverage |
| Under 6 Years | 1,197 (96.5%) | 44 (3.5%) |
| 6 to 18 Years | 3,187 (97.3%) | 87 (2.7%) |
| 19 to 25 Years | 1,219 (87.6%) | 172 (12.4%) |
| 26 to 34 Years | 1,882 (90.7%) | 194 (9.3%) |
| 35 to 44 Years | 2,147 (93.9%) | 140 (6.1%) |
| 45 to 54 Years | 2,662 (92.2%) | 224 (7.8%) |
| 55 to 64 Years | 3,855 (94.9%) | 208 (5.1%) |
| 65 to 74 Years | 3,950 (99.9%) | 6 (0.2%) |
| 75 Years and older | 2,548 (100.0%) | 0 (0.0%) |
| Total | 22,647 (95.5%) | 1,075 (4.5%) |
Health Insurance Coverage by Citizenship Status in Manistee County

| Citizenship Status | With Coverage | Without Coverage |
| Native Born | 1,197 (96.5%) | 44 (3.5%) |
| Foreign Born, Citizen | 3,187 (97.3%) | 87 (2.7%) |
| Foreign Born, not a Citizen | 1,219 (87.6%) | 172 (12.4%) |
Health Insurance Coverage by Household Income in Manistee County
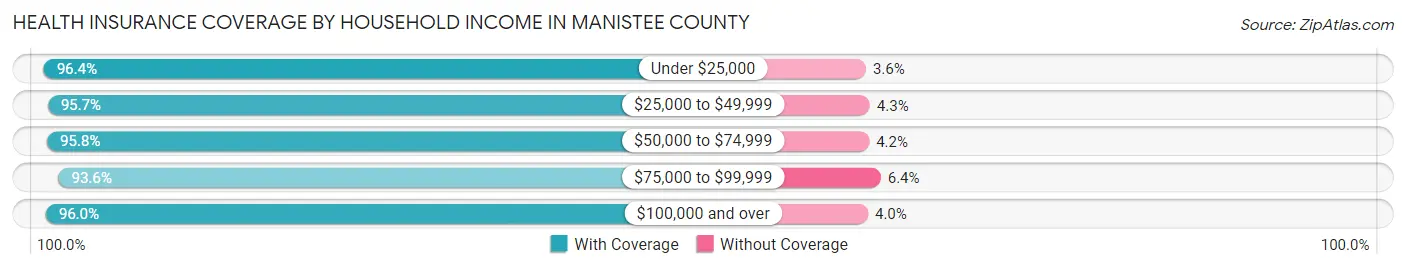
| Household Income | With Coverage | Without Coverage |
| Under $25,000 | 2,551 (96.4%) | 95 (3.6%) |
| $25,000 to $49,999 | 4,245 (95.7%) | 192 (4.3%) |
| $50,000 to $74,999 | 4,537 (95.8%) | 199 (4.2%) |
| $75,000 to $99,999 | 4,351 (93.6%) | 296 (6.4%) |
| $100,000 and over | 6,783 (96.0%) | 281 (4.0%) |
Public vs Private Health Insurance Coverage by Age in Manistee County
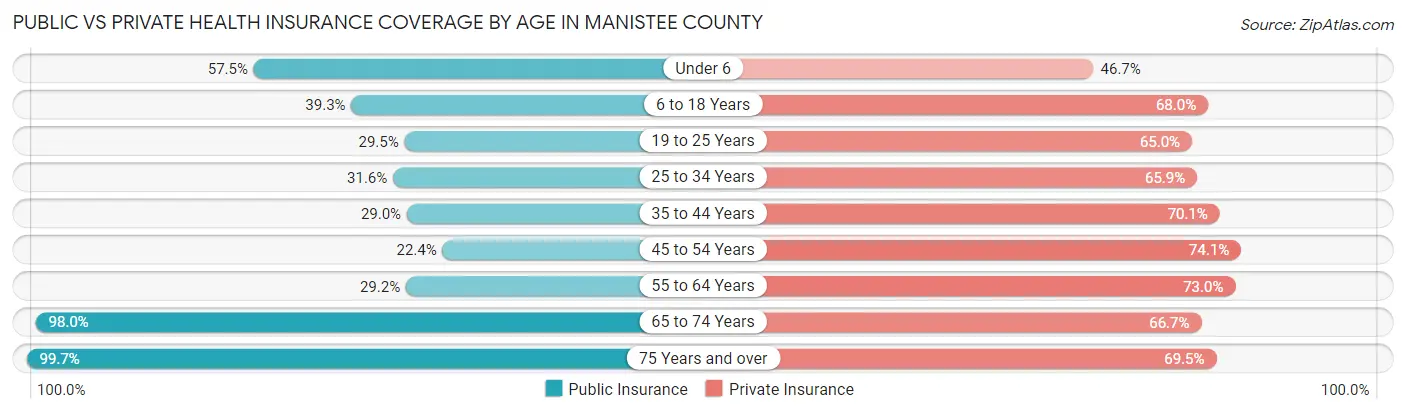
| Age Bracket | Public Insurance | Private Insurance |
| Under 6 | 713 (57.5%) | 580 (46.7%) |
| 6 to 18 Years | 1,288 (39.3%) | 2,225 (68.0%) |
| 19 to 25 Years | 410 (29.5%) | 904 (65.0%) |
| 25 to 34 Years | 656 (31.6%) | 1,369 (65.9%) |
| 35 to 44 Years | 664 (29.0%) | 1,604 (70.1%) |
| 45 to 54 Years | 647 (22.4%) | 2,139 (74.1%) |
| 55 to 64 Years | 1,187 (29.2%) | 2,967 (73.0%) |
| 65 to 74 Years | 3,876 (98.0%) | 2,640 (66.7%) |
| 75 Years and over | 2,539 (99.7%) | 1,771 (69.5%) |
| Total | 11,980 (50.5%) | 16,199 (68.3%) |
Disability Status by Sex by Age in Manistee County
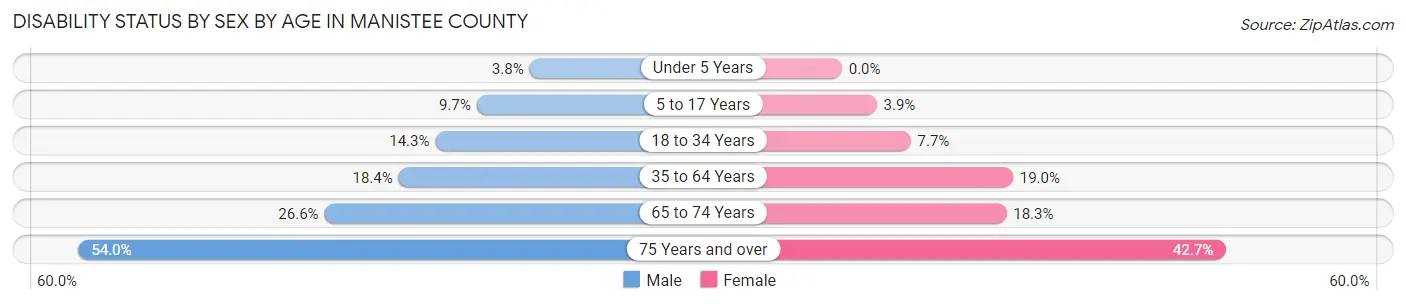
| Age Bracket | Male | Female |
| Under 5 Years | 18 (3.8%) | 0 (0.0%) |
| 5 to 17 Years | 158 (9.7%) | 64 (3.9%) |
| 18 to 34 Years | 271 (14.3%) | 140 (7.7%) |
| 35 to 64 Years | 833 (18.3%) | 894 (19.0%) |
| 65 to 74 Years | 537 (26.6%) | 355 (18.3%) |
| 75 Years and over | 626 (54.0%) | 593 (42.7%) |
Disability Class by Sex by Age in Manistee County
Disability Class: Hearing Difficulty
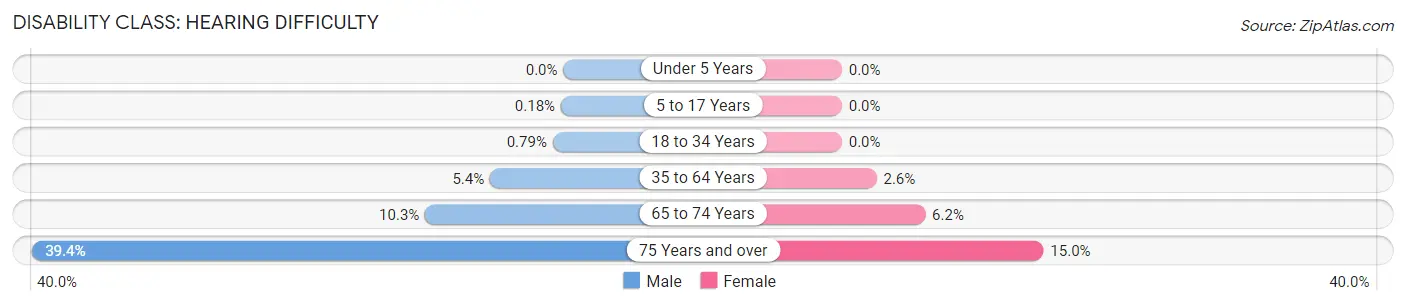
| Age Bracket | Male | Female |
| Under 5 Years | 0 (0.0%) | 0 (0.0%) |
| 5 to 17 Years | 3 (0.2%) | 0 (0.0%) |
| 18 to 34 Years | 15 (0.8%) | 0 (0.0%) |
| 35 to 64 Years | 247 (5.4%) | 121 (2.6%) |
| 65 to 74 Years | 207 (10.3%) | 120 (6.2%) |
| 75 Years and over | 457 (39.4%) | 208 (15.0%) |
Disability Class: Vision Difficulty
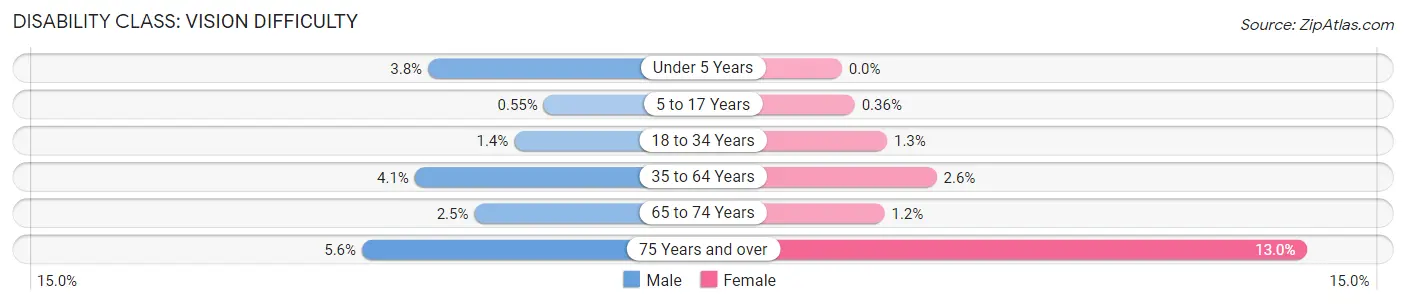
| Age Bracket | Male | Female |
| Under 5 Years | 18 (3.8%) | 0 (0.0%) |
| 5 to 17 Years | 9 (0.5%) | 6 (0.4%) |
| 18 to 34 Years | 26 (1.4%) | 23 (1.3%) |
| 35 to 64 Years | 188 (4.1%) | 124 (2.6%) |
| 65 to 74 Years | 50 (2.5%) | 23 (1.2%) |
| 75 Years and over | 65 (5.6%) | 180 (13.0%) |
Disability Class: Cognitive Difficulty
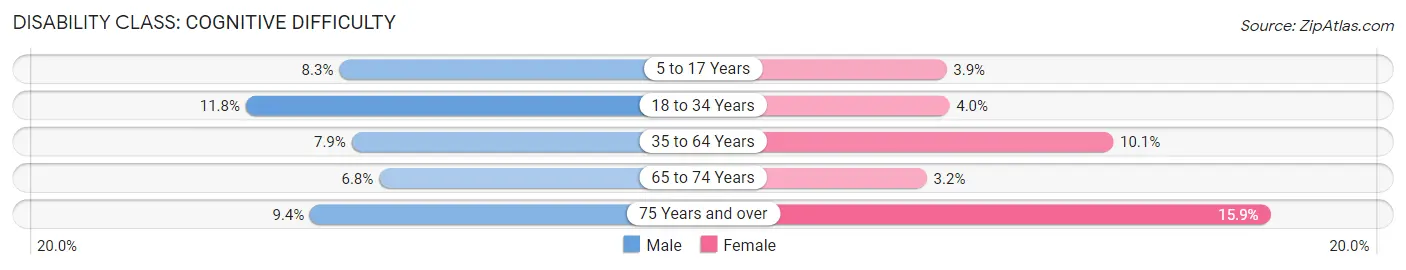
| Age Bracket | Male | Female |
| 5 to 17 Years | 136 (8.3%) | 64 (3.9%) |
| 18 to 34 Years | 224 (11.8%) | 73 (4.0%) |
| 35 to 64 Years | 357 (7.9%) | 473 (10.1%) |
| 65 to 74 Years | 138 (6.8%) | 61 (3.2%) |
| 75 Years and over | 109 (9.4%) | 221 (15.9%) |
Disability Class: Ambulatory Difficulty
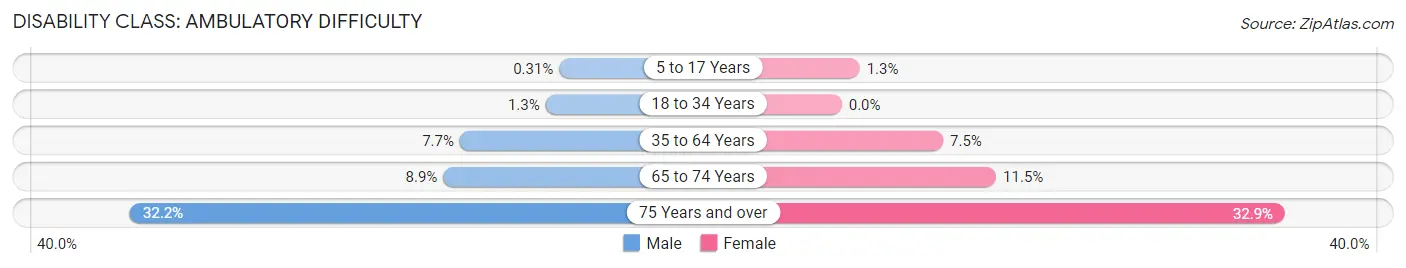
| Age Bracket | Male | Female |
| 5 to 17 Years | 5 (0.3%) | 22 (1.3%) |
| 18 to 34 Years | 25 (1.3%) | 0 (0.0%) |
| 35 to 64 Years | 349 (7.7%) | 353 (7.5%) |
| 65 to 74 Years | 180 (8.9%) | 222 (11.5%) |
| 75 Years and over | 373 (32.2%) | 457 (32.9%) |
Disability Class: Self-Care Difficulty
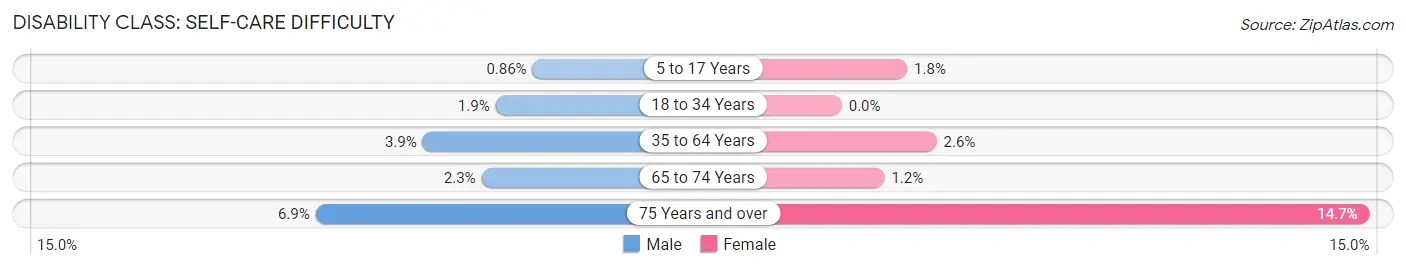
| Age Bracket | Male | Female |
| 5 to 17 Years | 14 (0.9%) | 30 (1.8%) |
| 18 to 34 Years | 36 (1.9%) | 0 (0.0%) |
| 35 to 64 Years | 178 (3.9%) | 124 (2.6%) |
| 65 to 74 Years | 46 (2.3%) | 23 (1.2%) |
| 75 Years and over | 80 (6.9%) | 204 (14.7%) |
Technology Access in Manistee County
Computing Device Access in Manistee County
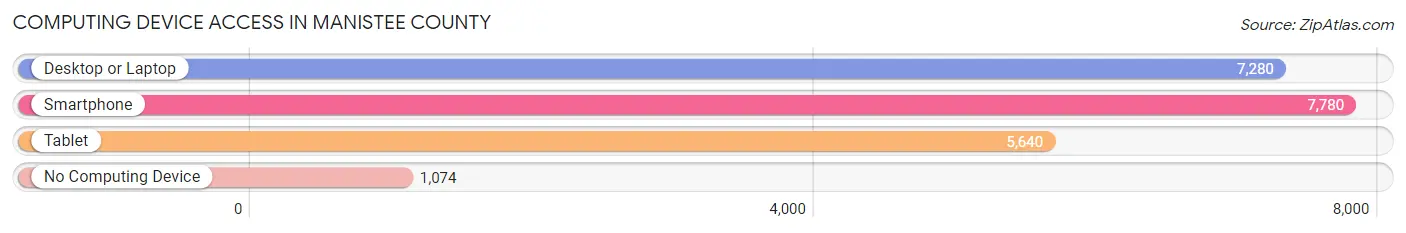
| Device Type | # Households | % Households |
| Desktop or Laptop | 7,280 | 73.3% |
| Smartphone | 7,780 | 78.4% |
| Tablet | 5,640 | 56.8% |
| No Computing Device | 1,074 | 10.8% |
| Total | 9,927 | 100.0% |
Internet Access in Manistee County
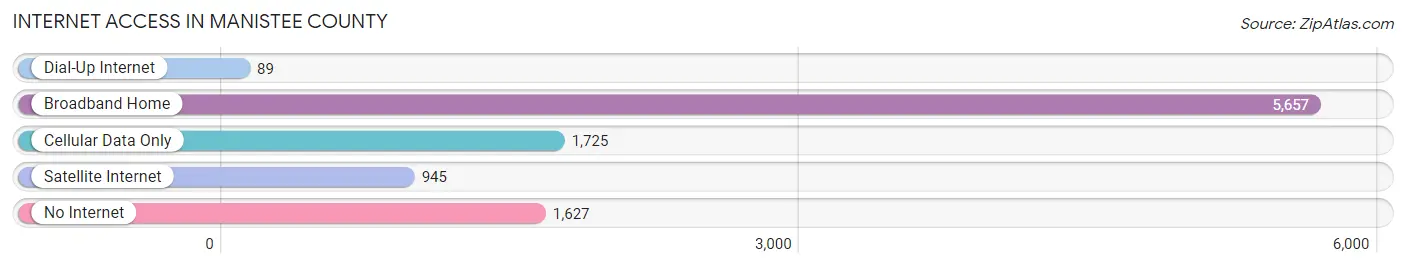
| Internet Type | # Households | % Households |
| Dial-Up Internet | 89 | 0.9% |
| Broadband Home | 5,657 | 57.0% |
| Cellular Data Only | 1,725 | 17.4% |
| Satellite Internet | 945 | 9.5% |
| No Internet | 1,627 | 16.4% |
| Total | 9,927 | 100.0% |
Manistee County Summary
Manistee County is located in the northwestern part of Michigan’s Lower Peninsula. It is bordered by Lake Michigan to the west, Mason County to the north, Lake County to the east, and Benzie County to the south. The county seat is Manistee, and the largest city is Manistee. The county has a total area of 1,190 square miles, of which 1,077 square miles is land and 113 square miles is water.
History
Manistee County was first settled in 1841 by a group of lumbermen from New England. The county was officially organized in 1855 and was named after the Manistee River, which was derived from the Ojibwe word “manistee” meaning “river with islands”. The county was initially a major lumber producer, and the lumber industry was the primary source of income for the county until the early 20th century.
In the late 19th century, the county began to diversify its economy with the development of the tourism industry. The county’s natural beauty and abundance of recreational opportunities attracted visitors from all over the country. The county also became a popular destination for summer homes and resorts.
Geography
Manistee County is located in the northwestern part of Michigan’s Lower Peninsula. It is bordered by Lake Michigan to the west, Mason County to the north, Lake County to the east, and Benzie County to the south. The county has a total area of 1,190 square miles, of which 1,077 square miles is land and 113 square miles is water.
The county is home to several rivers, including the Manistee River, the Big Manistee River, the Little Manistee River, and the Pine River. The county also contains several lakes, including Bear Lake, Portage Lake, and Lake Michigan. The county is mostly forested, with large areas of hardwood and coniferous trees.
Economy
Manistee County’s economy is largely based on tourism and recreation. The county is home to several state parks, including Manistee National Forest, Nordhouse Dunes Wilderness Area, and the Manistee River Trail. The county also has several popular beaches, including Manistee Beach, Stronach Beach, and Orchard Beach.
The county is also home to several manufacturing companies, including Manistee Manufacturing Company, Manistee Plastics, and Manistee Metal Products. The county also has several agricultural operations, including dairy farms, fruit orchards, and vegetable farms.
Demographics
As of the 2010 census, Manistee County had a population of 24,733. The racial makeup of the county was 94.2% White, 0.7% African American, 0.7% Native American, 0.5% Asian, 0.1% Pacific Islander, 2.2% from other races, and 1.6% from two or more races. Hispanic or Latino of any race were 4.3% of the population.
The median income for a household in the county was $37,945, and the median income for a family was $45,945. The per capita income for the county was $20,845. About 11.2% of families and 15.2% of the population were below the poverty line, including 22.2% of those under age 18 and 8.2% of those age 65 or over.
Common Questions
What is Per Capita Income in Manistee County?
Per Capita income in Manistee County is $33,818.
What is the Median Family Income in Manistee County?
Median Family Income in Manistee County is $75,342.
What is the Median Household income in Manistee County?
Median Household Income in Manistee County is $59,467.
What is Income or Wage Gap in Manistee County?
Income or Wage Gap in Manistee County is 19.4%.
Women in Manistee County earn 80.6 cents for every dollar earned by a man.
What is Family Income Deficit in Manistee County?
Family Income Deficit in Manistee County is $10,613.
Families that are below poverty line in Manistee County earn $10,613 less on average than the poverty threshold level.
What is Inequality or Gini Index in Manistee County?
Inequality or Gini Index in Manistee County is 0.46.
What is the Total Population of Manistee County?
Total Population of Manistee County is 25,058.
What is the Total Male Population of Manistee County?
Total Male Population of Manistee County is 12,966.
What is the Total Female Population of Manistee County?
Total Female Population of Manistee County is 12,092.
What is the Ratio of Males per 100 Females in Manistee County?
There are 107.23 Males per 100 Females in Manistee County.
What is the Ratio of Females per 100 Males in Manistee County?
There are 93.26 Females per 100 Males in Manistee County.
What is the Median Population Age in Manistee County?
Median Population Age in Manistee County is 50.0 Years.
What is the Average Family Size in Manistee County
Average Family Size in Manistee County is 3.0 People.
What is the Average Household Size in Manistee County
Average Household Size in Manistee County is 2.4 People.
How Large is the Labor Force in Manistee County?
There are 10,420 People in the Labor Forcein in Manistee County.
What is the Percentage of People in the Labor Force in Manistee County?
48.8% of People are in the Labor Force in Manistee County.
What is the Unemployment Rate in Manistee County?
Unemployment Rate in Manistee County is 6.6%.