Leelanau County, MI Map & Demographics
Leelanau County Map
Leelanau County Overview
$48,491
PER CAPITA INCOME
$101,453
AVG FAMILY INCOME
$82,345
AVG HOUSEHOLD INCOME
28.0%
WAGE / INCOME GAP [ % ]
72.0¢/ $1
WAGE / INCOME GAP [ $ ]
$10,327
FAMILY INCOME DEFICIT
0.46
INEQUALITY / GINI INDEX
22,426
TOTAL POPULATION
11,155
MALE POPULATION
11,271
FEMALE POPULATION
98.97
MALES / 100 FEMALES
101.04
FEMALES / 100 MALES
55.2
MEDIAN AGE
2.8
AVG FAMILY SIZE
2.4
AVG HOUSEHOLD SIZE
10,051
LABOR FORCE [ PEOPLE ]
51.8%
PERCENT IN LABOR FORCE
3.2%
UNEMPLOYMENT RATE
Leelanau County Area Codes
Income in Leelanau County
Income Overview in Leelanau County
Per Capita Income in Leelanau County is $48,491, while median incomes of families and households are $101,453 and $82,345 respectively.
| Characteristic | Number | Measure |
| Per Capita Income | 22,426 | $48,491 |
| Median Family Income | 6,509 | $101,453 |
| Mean Family Income | 6,509 | $129,022 |
| Median Household Income | 9,246 | $82,345 |
| Mean Household Income | 9,246 | $116,094 |
| Income Deficit | 6,509 | $10,327 |
| Wage / Income Gap (%) | 22,426 | 27.97% |
| Wage / Income Gap ($) | 22,426 | 72.03¢ per $1 |
| Gini / Inequality Index | 22,426 | 0.46 |
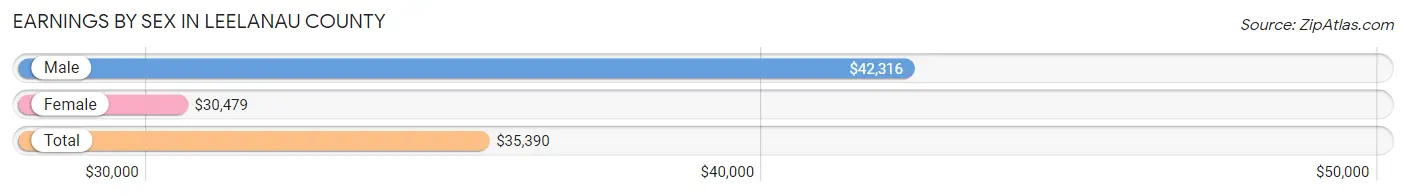
Earnings by Sex in Leelanau County
Average Earnings in Leelanau County are $35,390, $42,316 for men and $30,479 for women, a difference of 28.0%.
| Sex | Number | Average Earnings |
| Male | 5,591 (49.6%) | $42,316 |
| Female | 5,678 (50.4%) | $30,479 |
| Total | 11,269 (100.0%) | $35,390 |
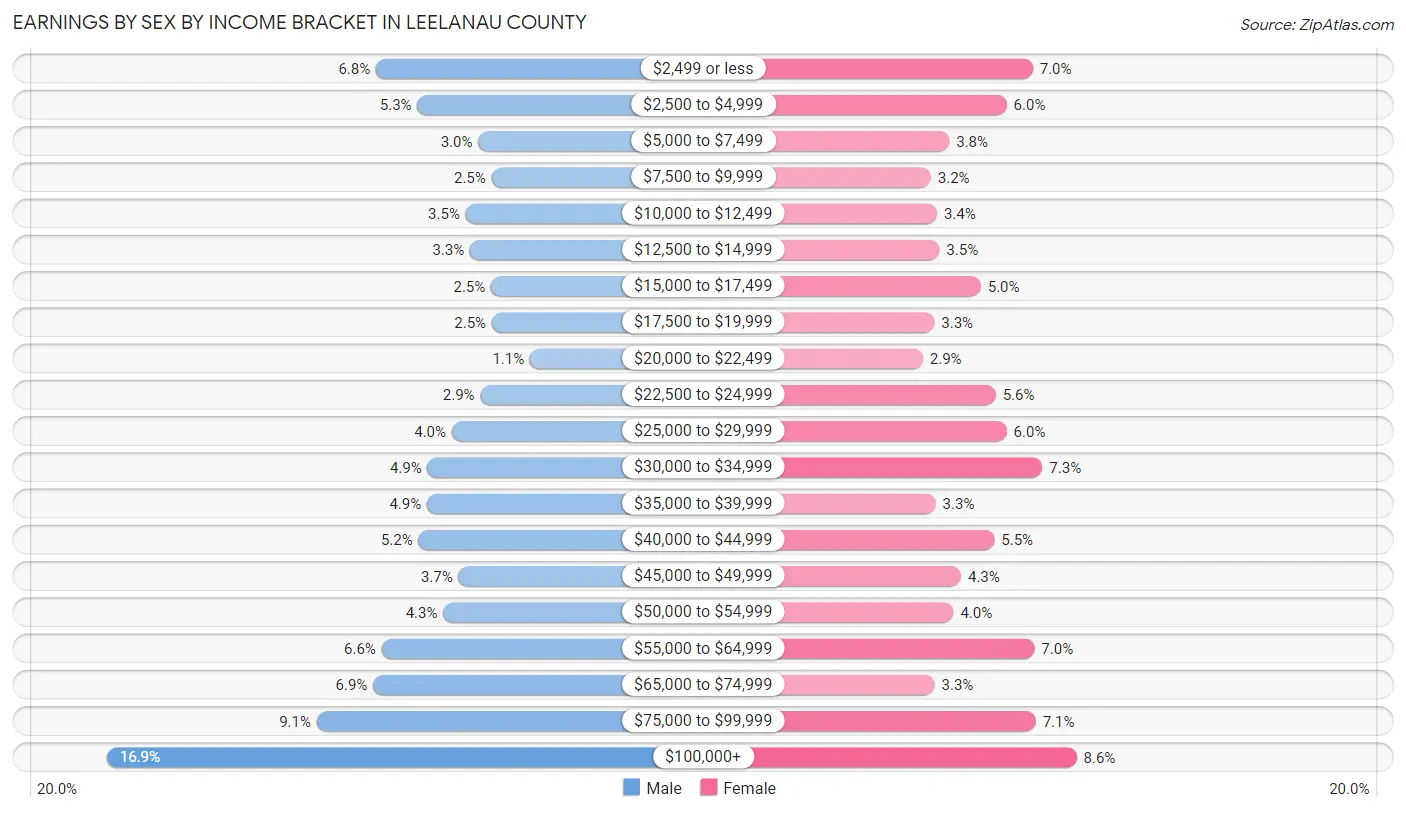
Earnings by Sex by Income Bracket in Leelanau County
The most common earnings brackets in Leelanau County are $100,000+ for men (946 | 16.9%) and $100,000+ for women (489 | 8.6%).
| Income | Male | Female |
| $2,499 or less | 382 (6.8%) | 396 (7.0%) |
| $2,500 to $4,999 | 295 (5.3%) | 340 (6.0%) |
| $5,000 to $7,499 | 168 (3.0%) | 218 (3.8%) |
| $7,500 to $9,999 | 140 (2.5%) | 179 (3.2%) |
| $10,000 to $12,499 | 194 (3.5%) | 192 (3.4%) |
| $12,500 to $14,999 | 185 (3.3%) | 197 (3.5%) |
| $15,000 to $17,499 | 141 (2.5%) | 285 (5.0%) |
| $17,500 to $19,999 | 139 (2.5%) | 186 (3.3%) |
| $20,000 to $22,499 | 59 (1.1%) | 162 (2.9%) |
| $22,500 to $24,999 | 163 (2.9%) | 317 (5.6%) |
| $25,000 to $29,999 | 223 (4.0%) | 340 (6.0%) |
| $30,000 to $34,999 | 274 (4.9%) | 416 (7.3%) |
| $35,000 to $39,999 | 275 (4.9%) | 189 (3.3%) |
| $40,000 to $44,999 | 293 (5.2%) | 314 (5.5%) |
| $45,000 to $49,999 | 209 (3.7%) | 243 (4.3%) |
| $50,000 to $54,999 | 241 (4.3%) | 227 (4.0%) |
| $55,000 to $64,999 | 370 (6.6%) | 399 (7.0%) |
| $65,000 to $74,999 | 388 (6.9%) | 187 (3.3%) |
| $75,000 to $99,999 | 506 (9.0%) | 402 (7.1%) |
| $100,000+ | 946 (16.9%) | 489 (8.6%) |
| Total | 5,591 (100.0%) | 5,678 (100.0%) |
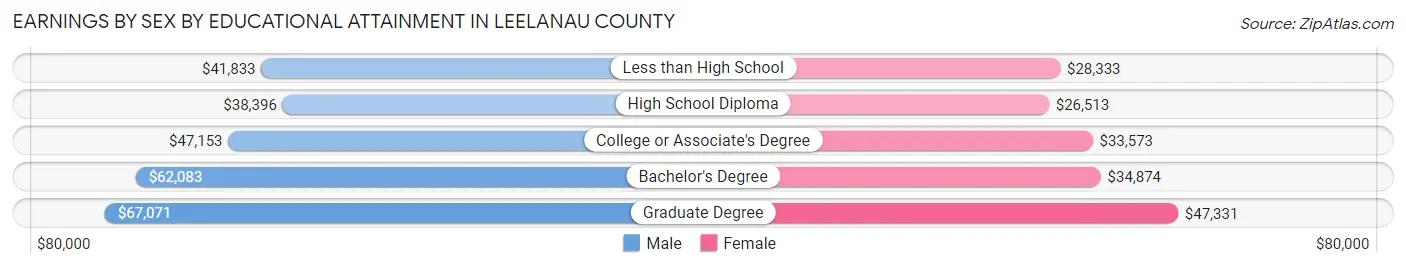
Earnings by Sex by Educational Attainment in Leelanau County
Average earnings in Leelanau County are $49,382 for men and $34,059 for women, a difference of 31.0%. Men with an educational attainment of graduate degree enjoy the highest average annual earnings of $67,071, while those with high school diploma education earn the least with $38,396. Women with an educational attainment of graduate degree earn the most with the average annual earnings of $47,331, while those with high school diploma education have the smallest earnings of $26,513.
| Educational Attainment | Male Income | Female Income |
| Less than High School | $41,833 | $28,333 |
| High School Diploma | $38,396 | $26,513 |
| College or Associate's Degree | $47,153 | $33,573 |
| Bachelor's Degree | $62,083 | $34,874 |
| Graduate Degree | $67,071 | $47,331 |
| Total | $49,382 | $34,059 |
Family Income in Leelanau County
Family Income Brackets in Leelanau County
According to the Leelanau County family income data, there are 1,647 families falling into the $100,000 to $149,999 income range, which is the most common income bracket and makes up 25.3% of all families. Conversely, the less than $10,000 income bracket is the least frequent group with only 78 families (1.2%) belonging to this category.
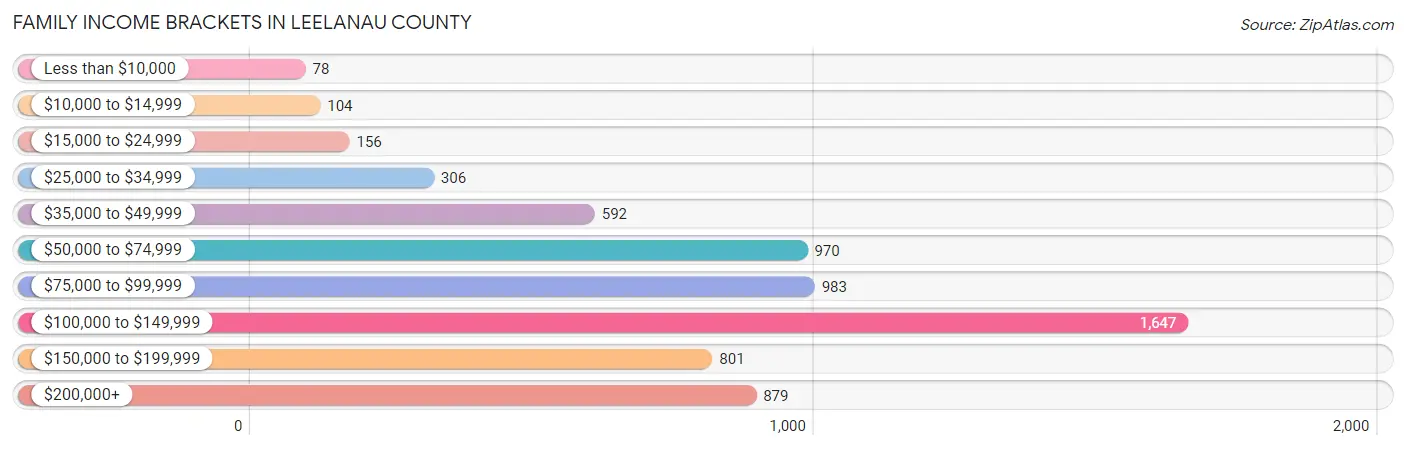
| Income Bracket | # Families | % Families |
| Less than $10,000 | 78 | 1.2% |
| $10,000 to $14,999 | 104 | 1.6% |
| $15,000 to $24,999 | 156 | 2.4% |
| $25,000 to $34,999 | 306 | 4.7% |
| $35,000 to $49,999 | 592 | 9.1% |
| $50,000 to $74,999 | 970 | 14.9% |
| $75,000 to $99,999 | 983 | 15.1% |
| $100,000 to $149,999 | 1,647 | 25.3% |
| $150,000 to $199,999 | 801 | 12.3% |
| $200,000+ | 879 | 13.5% |
Family Income by Famaliy Size in Leelanau County
6-person families (116 | 1.8%) account for the highest median family income in Leelanau County with $151,875 per family, while 2-person families (4,116 | 63.2%) have the highest median income of $46,448 per family member.
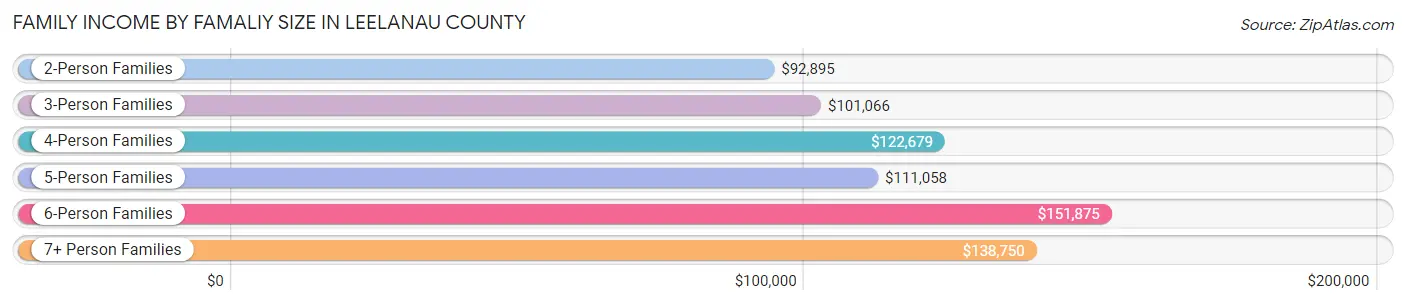
| Income Bracket | # Families | Median Income |
| 2-Person Families | 4,116 (63.2%) | $92,895 |
| 3-Person Families | 1,141 (17.5%) | $101,066 |
| 4-Person Families | 737 (11.3%) | $122,679 |
| 5-Person Families | 367 (5.6%) | $111,058 |
| 6-Person Families | 116 (1.8%) | $151,875 |
| 7+ Person Families | 32 (0.5%) | $138,750 |
| Total | 6,509 (100.0%) | $101,453 |
Family Income by Number of Earners in Leelanau County
The median family income in Leelanau County is $101,453, with families comprising 3+ earners (759) having the highest median family income of $136,250, while families with no earners (1,906) have the lowest median family income of $79,118, accounting for 11.7% and 29.3% of families, respectively.
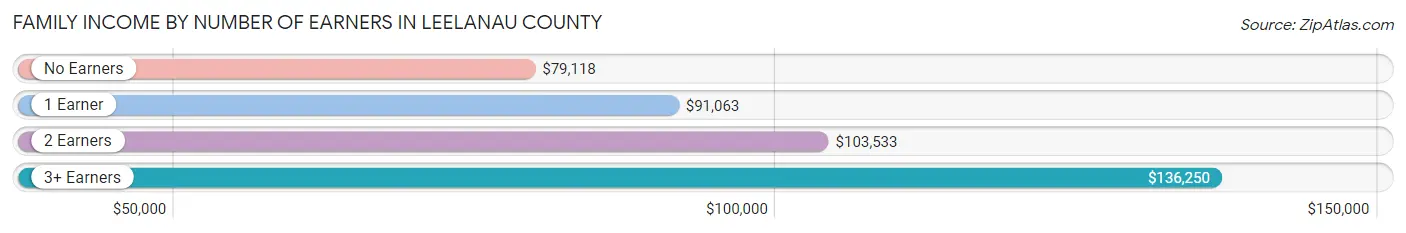
| Number of Earners | # Families | Median Income |
| No Earners | 1,906 (29.3%) | $79,118 |
| 1 Earner | 1,510 (23.2%) | $91,063 |
| 2 Earners | 2,334 (35.9%) | $103,533 |
| 3+ Earners | 759 (11.7%) | $136,250 |
| Total | 6,509 (100.0%) | $101,453 |
Household Income in Leelanau County
Household Income Brackets in Leelanau County
With 1,914 households falling in the category, the $100,000 to $149,999 income range is the most frequent in Leelanau County, accounting for 20.7% of all households. In contrast, only 139 households (1.5%) fall into the $10,000 to $14,999 income bracket, making it the least populous group.
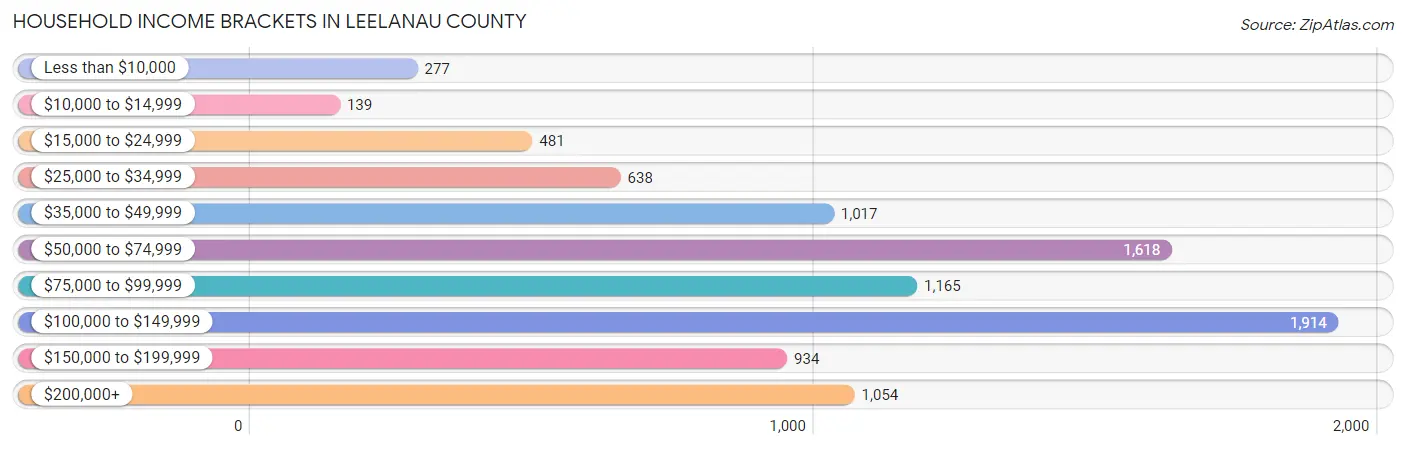
| Income Bracket | # Households | % Households |
| Less than $10,000 | 277 | 3.0% |
| $10,000 to $14,999 | 139 | 1.5% |
| $15,000 to $24,999 | 481 | 5.2% |
| $25,000 to $34,999 | 638 | 6.9% |
| $35,000 to $49,999 | 1,017 | 11.0% |
| $50,000 to $74,999 | 1,618 | 17.5% |
| $75,000 to $99,999 | 1,165 | 12.6% |
| $100,000 to $149,999 | 1,914 | 20.7% |
| $150,000 to $199,999 | 934 | 10.1% |
| $200,000+ | 1,054 | 11.4% |
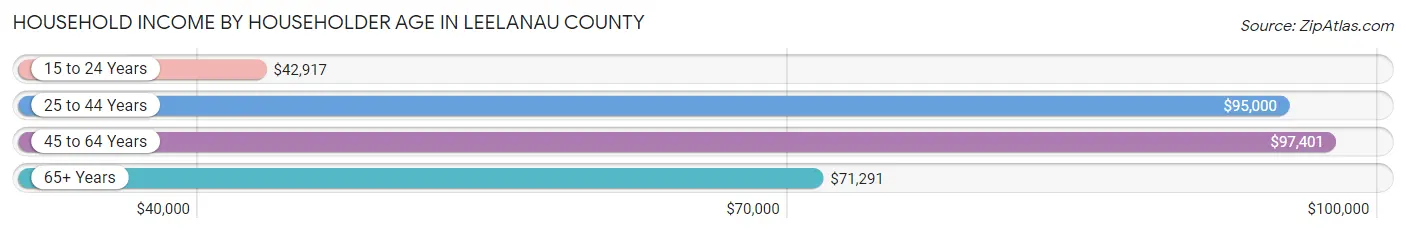
Household Income by Householder Age in Leelanau County
The median household income in Leelanau County is $82,345, with the highest median household income of $97,401 found in the 45 to 64 years age bracket for the primary householder. A total of 3,211 households (34.7%) fall into this category. Meanwhile, the 15 to 24 years age bracket for the primary householder has the lowest median household income of $42,917, with 90 households (1.0%) in this group.
| Income Bracket | # Households | Median Income |
| 15 to 24 Years | 90 (1.0%) | $42,917 |
| 25 to 44 Years | 1,560 (16.9%) | $95,000 |
| 45 to 64 Years | 3,211 (34.7%) | $97,401 |
| 65+ Years | 4,385 (47.4%) | $71,291 |
| Total | 9,246 (100.0%) | $82,345 |
Poverty in Leelanau County
Income Below Poverty by Sex and Age in Leelanau County
With 7.2% poverty level for males and 6.1% for females among the residents of Leelanau County, 15 year old males and 16 and 17 year old females are the most vulnerable to poverty, with 39 males (34.8%) and 37 females (18.1%) in their respective age groups living below the poverty level.
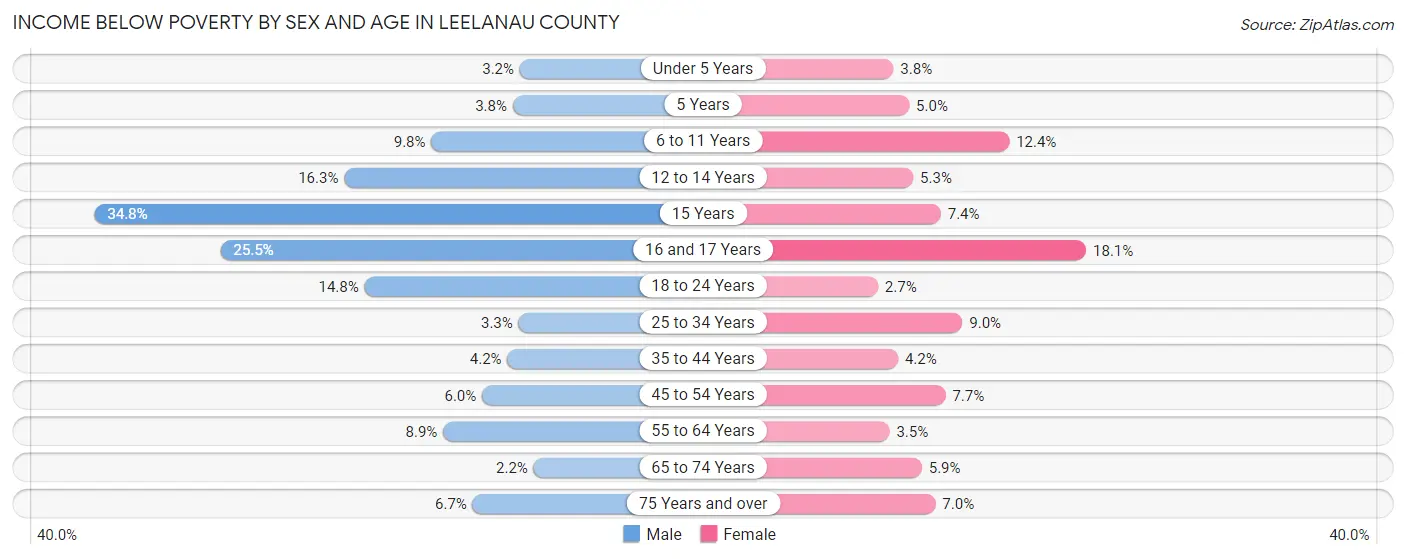
| Age Bracket | Male | Female |
| Under 5 Years | 12 (3.2%) | 16 (3.8%) |
| 5 Years | 3 (3.7%) | 4 (5.0%) |
| 6 to 11 Years | 59 (9.8%) | 67 (12.4%) |
| 12 to 14 Years | 54 (16.3%) | 17 (5.3%) |
| 15 Years | 39 (34.8%) | 10 (7.3%) |
| 16 and 17 Years | 69 (25.5%) | 37 (18.1%) |
| 18 to 24 Years | 106 (14.8%) | 17 (2.7%) |
| 25 to 34 Years | 30 (3.3%) | 84 (8.9%) |
| 35 to 44 Years | 45 (4.2%) | 43 (4.2%) |
| 45 to 54 Years | 71 (6.0%) | 86 (7.7%) |
| 55 to 64 Years | 170 (8.9%) | 74 (3.5%) |
| 65 to 74 Years | 47 (2.2%) | 131 (5.9%) |
| 75 Years and over | 91 (6.7%) | 101 (7.0%) |
| Total | 796 (7.2%) | 687 (6.1%) |
Income Above Poverty by Sex and Age in Leelanau County
According to the poverty statistics in Leelanau County, males aged 65 to 74 years and females aged 18 to 24 years are the age groups that are most secure financially, with 97.8% of males and 97.3% of females in these age groups living above the poverty line.
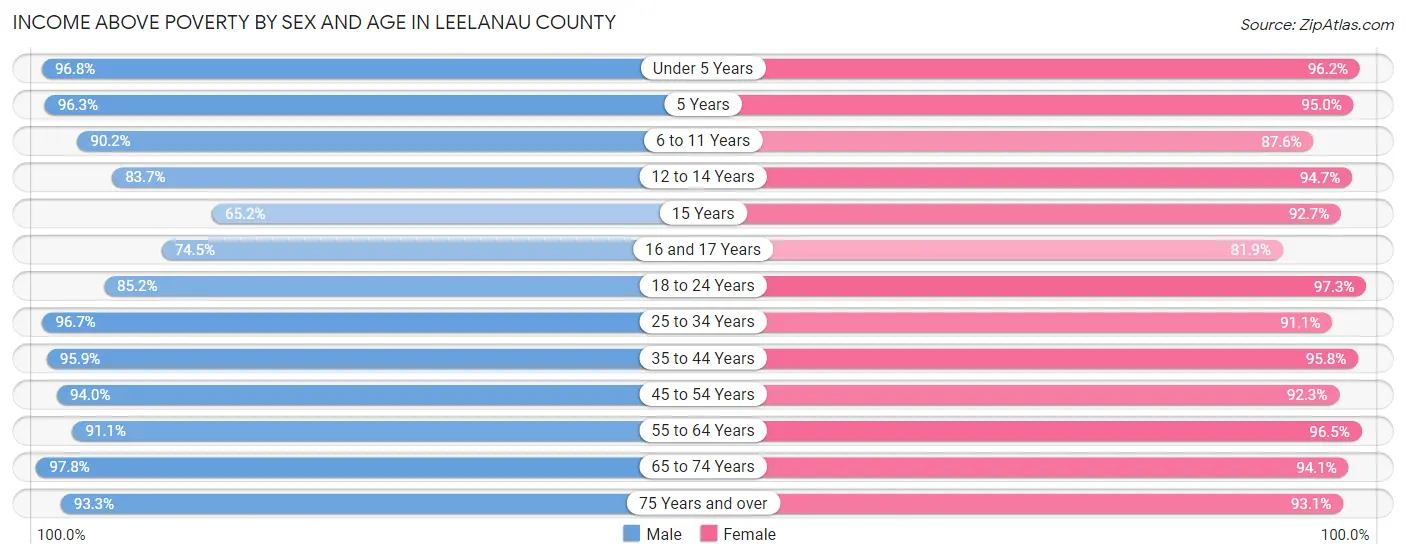
| Age Bracket | Male | Female |
| Under 5 Years | 359 (96.8%) | 402 (96.2%) |
| 5 Years | 77 (96.3%) | 76 (95.0%) |
| 6 to 11 Years | 543 (90.2%) | 472 (87.6%) |
| 12 to 14 Years | 278 (83.7%) | 304 (94.7%) |
| 15 Years | 73 (65.2%) | 126 (92.6%) |
| 16 and 17 Years | 202 (74.5%) | 167 (81.9%) |
| 18 to 24 Years | 612 (85.2%) | 617 (97.3%) |
| 25 to 34 Years | 874 (96.7%) | 855 (91.0%) |
| 35 to 44 Years | 1,040 (95.9%) | 987 (95.8%) |
| 45 to 54 Years | 1,106 (94.0%) | 1,031 (92.3%) |
| 55 to 64 Years | 1,736 (91.1%) | 2,018 (96.5%) |
| 65 to 74 Years | 2,086 (97.8%) | 2,075 (94.1%) |
| 75 Years and over | 1,261 (93.3%) | 1,353 (93.0%) |
| Total | 10,247 (92.8%) | 10,483 (93.9%) |
Income Below Poverty Among Married-Couple Families in Leelanau County
The poverty statistics for married-couple families in Leelanau County show that 1.8% or 104 of the total 5,618 families live below the poverty line. Families with 1 or 2 children have the highest poverty rate of 2.6%, comprising of 29 families. On the other hand, families with 5 or more children have the lowest poverty rate of 0.0%, which includes 0 families.
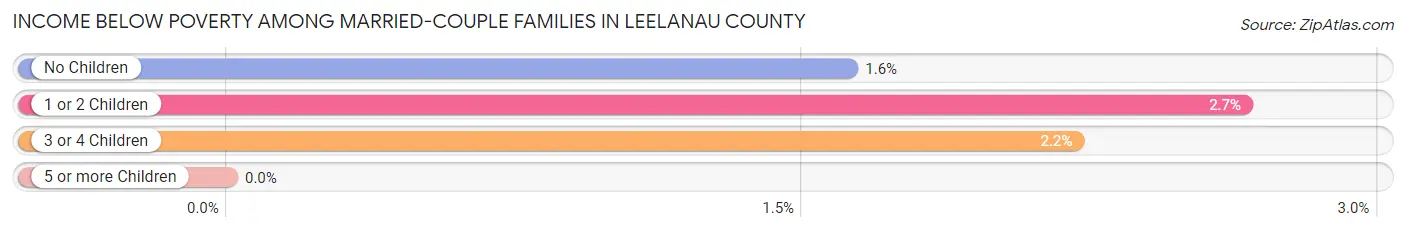
| Children | Above Poverty | Below Poverty |
| No Children | 4,121 (98.4%) | 68 (1.6%) |
| 1 or 2 Children | 1,064 (97.4%) | 29 (2.6%) |
| 3 or 4 Children | 310 (97.8%) | 7 (2.2%) |
| 5 or more Children | 19 (100.0%) | 0 (0.0%) |
| Total | 5,514 (98.2%) | 104 (1.8%) |
Income Below Poverty Among Single-Parent Households in Leelanau County
According to the poverty data in Leelanau County, 18.9% or 61 single-father households and 15.3% or 87 single-mother households are living below the poverty line. Among single-father households, those with 1 or 2 children have the highest poverty rate, with 37 households (36.6%) experiencing poverty. Likewise, among single-mother households, those with 3 or 4 children have the highest poverty rate, with 19 households (70.4%) falling below the poverty line.
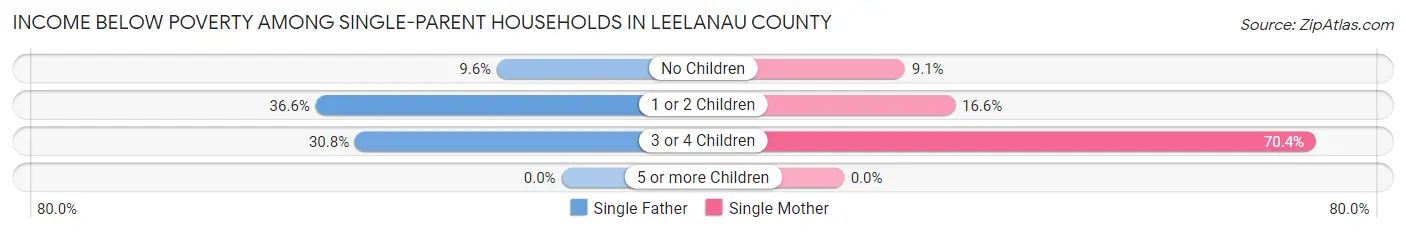
| Children | Single Father | Single Mother |
| No Children | 20 (9.6%) | 26 (9.1%) |
| 1 or 2 Children | 37 (36.6%) | 42 (16.6%) |
| 3 or 4 Children | 4 (30.8%) | 19 (70.4%) |
| 5 or more Children | 0 (0.0%) | 0 (0.0%) |
| Total | 61 (18.9%) | 87 (15.3%) |
Income Below Poverty Among Married-Couple vs Single-Parent Households in Leelanau County
The poverty data for Leelanau County shows that 104 of the married-couple family households (1.8%) and 148 of the single-parent households (16.6%) are living below the poverty level. Within the married-couple family households, those with 1 or 2 children have the highest poverty rate, with 29 households (2.6%) falling below the poverty line. Among the single-parent households, those with 3 or 4 children have the highest poverty rate, with 23 household (57.5%) living below poverty.
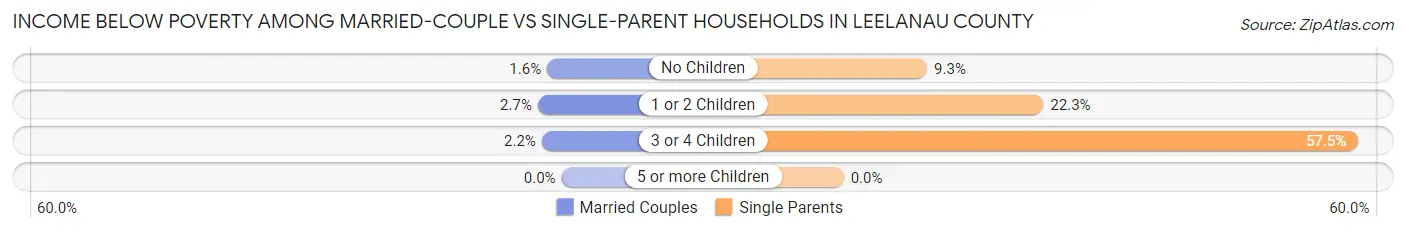
| Children | Married-Couple Families | Single-Parent Households |
| No Children | 68 (1.6%) | 46 (9.3%) |
| 1 or 2 Children | 29 (2.6%) | 79 (22.3%) |
| 3 or 4 Children | 7 (2.2%) | 23 (57.5%) |
| 5 or more Children | 0 (0.0%) | 0 (0.0%) |
| Total | 104 (1.8%) | 148 (16.6%) |
Race in Leelanau County
The most populous races in Leelanau County are White / Caucasian (20,433 | 91.1%), Hispanic or Latino (978 | 4.4%), and Two or more Races (875 | 3.9%).
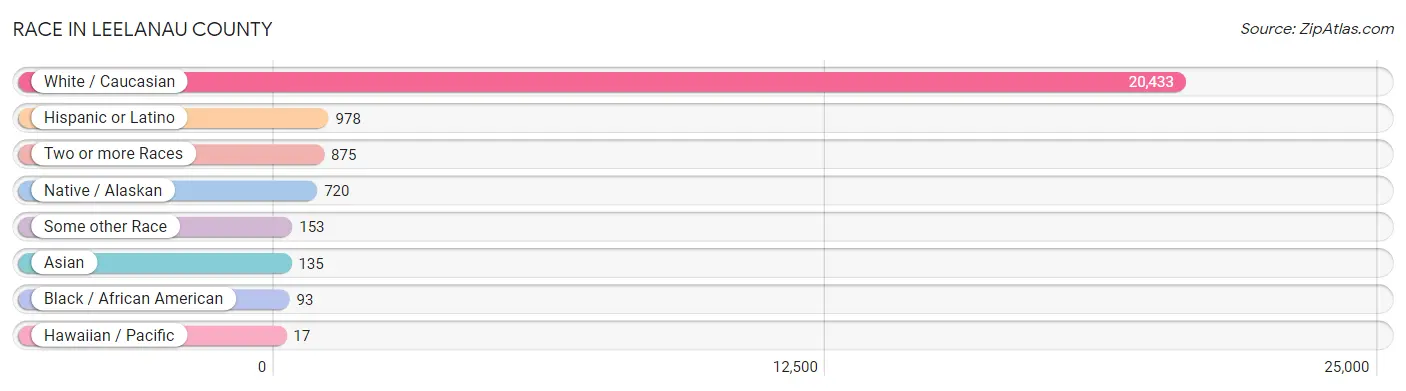
| Race | # Population | % Population |
| Asian | 135 | 0.6% |
| Black / African American | 93 | 0.4% |
| Hawaiian / Pacific | 17 | 0.1% |
| Hispanic or Latino | 978 | 4.4% |
| Native / Alaskan | 720 | 3.2% |
| White / Caucasian | 20,433 | 91.1% |
| Two or more Races | 875 | 3.9% |
| Some other Race | 153 | 0.7% |
| Total | 22,426 | 100.0% |
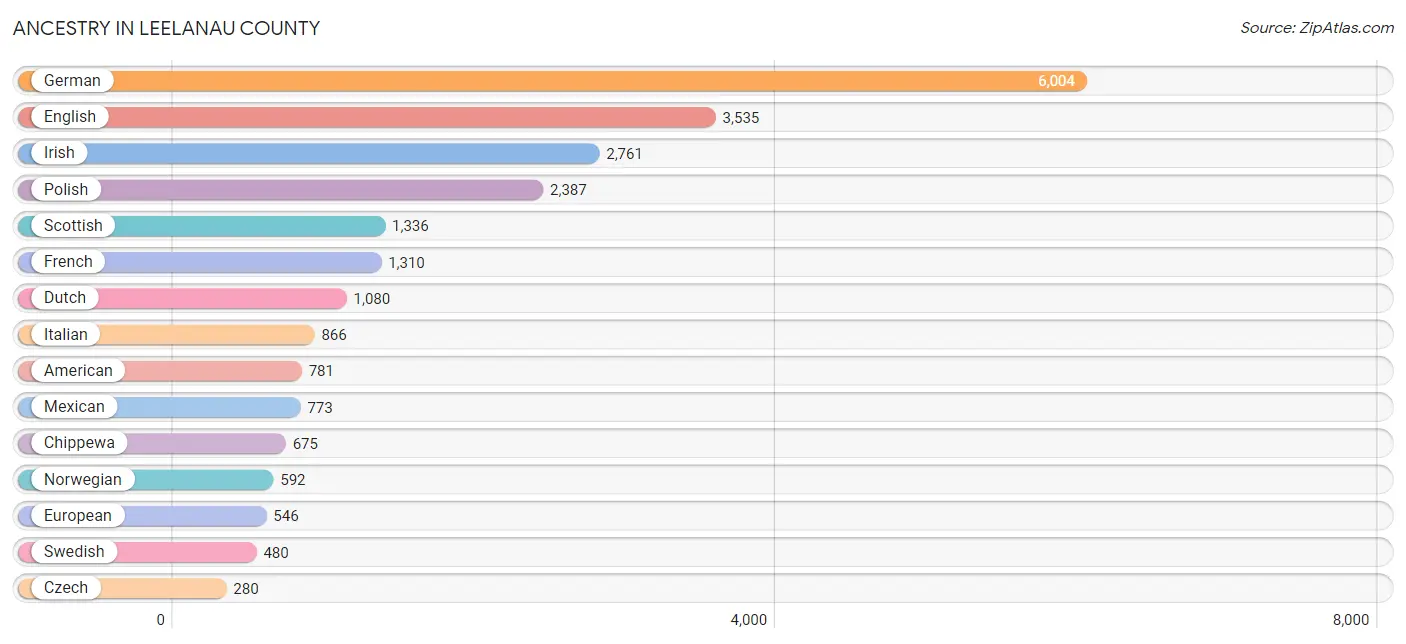
Ancestry in Leelanau County
The most populous ancestries reported in Leelanau County are German (6,004 | 26.8%), English (3,535 | 15.8%), Irish (2,761 | 12.3%), Polish (2,387 | 10.6%), and Scottish (1,336 | 6.0%), together accounting for 71.4% of all Leelanau County residents.
| Ancestry | # Population | % Population |
| African | 37 | 0.2% |
| American | 781 | 3.5% |
| Apache | 18 | 0.1% |
| Arab | 69 | 0.3% |
| Argentinean | 7 | 0.0% |
| Armenian | 69 | 0.3% |
| Assyrian / Chaldean / Syriac | 3 | 0.0% |
| Austrian | 56 | 0.3% |
| Basque | 10 | 0.0% |
| Belgian | 136 | 0.6% |
| Bhutanese | 29 | 0.1% |
| British | 71 | 0.3% |
| Bulgarian | 4 | 0.0% |
| Canadian | 78 | 0.4% |
| Central American | 35 | 0.2% |
| Cherokee | 21 | 0.1% |
| Chippewa | 675 | 3.0% |
| Choctaw | 25 | 0.1% |
| Colombian | 12 | 0.1% |
| Costa Rican | 10 | 0.0% |
| Croatian | 31 | 0.1% |
| Czech | 280 | 1.3% |
| Czechoslovakian | 51 | 0.2% |
| Danish | 144 | 0.6% |
| Dutch | 1,080 | 4.8% |
| Eastern European | 64 | 0.3% |
| Ecuadorian | 5 | 0.0% |
| Egyptian | 14 | 0.1% |
| English | 3,535 | 15.8% |
| European | 546 | 2.4% |
| Filipino | 12 | 0.1% |
| Finnish | 134 | 0.6% |
| French | 1,310 | 5.8% |
| French American Indian | 2 | 0.0% |
| French Canadian | 244 | 1.1% |
| German | 6,004 | 26.8% |
| Greek | 29 | 0.1% |
| Guatemalan | 11 | 0.1% |
| Honduran | 14 | 0.1% |
| Hungarian | 84 | 0.4% |
| Indian (Asian) | 41 | 0.2% |
| Irish | 2,761 | 12.3% |
| Iroquois | 15 | 0.1% |
| Italian | 866 | 3.9% |
| Kenyan | 1 | 0.0% |
| Korean | 47 | 0.2% |
| Latvian | 18 | 0.1% |
| Lebanese | 33 | 0.2% |
| Lithuanian | 96 | 0.4% |
| Luxembourger | 3 | 0.0% |
| Maltese | 7 | 0.0% |
| Mexican | 773 | 3.5% |
| Mexican American Indian | 27 | 0.1% |
| Native Hawaiian | 23 | 0.1% |
| Northern European | 59 | 0.3% |
| Norwegian | 592 | 2.6% |
| Ottawa | 82 | 0.4% |
| Palestinian | 6 | 0.0% |
| Pennsylvania German | 13 | 0.1% |
| Peruvian | 9 | 0.0% |
| Polish | 2,387 | 10.6% |
| Portuguese | 1 | 0.0% |
| Potawatomi | 14 | 0.1% |
| Puerto Rican | 9 | 0.0% |
| Romanian | 8 | 0.0% |
| Russian | 106 | 0.5% |
| Scandinavian | 173 | 0.8% |
| Scotch-Irish | 200 | 0.9% |
| Scottish | 1,336 | 6.0% |
| Serbian | 13 | 0.1% |
| Slavic | 33 | 0.2% |
| Slovak | 71 | 0.3% |
| Slovene | 10 | 0.0% |
| South American | 33 | 0.2% |
| Spaniard | 52 | 0.2% |
| Spanish | 46 | 0.2% |
| Sri Lankan | 4 | 0.0% |
| Subsaharan African | 38 | 0.2% |
| Swedish | 480 | 2.1% |
| Swiss | 99 | 0.4% |
| Syrian | 7 | 0.0% |
| Thai | 67 | 0.3% |
| Ukrainian | 117 | 0.5% |
| Welsh | 217 | 1.0% |
| Yugoslavian | 7 | 0.0% | View All 85 Rows |
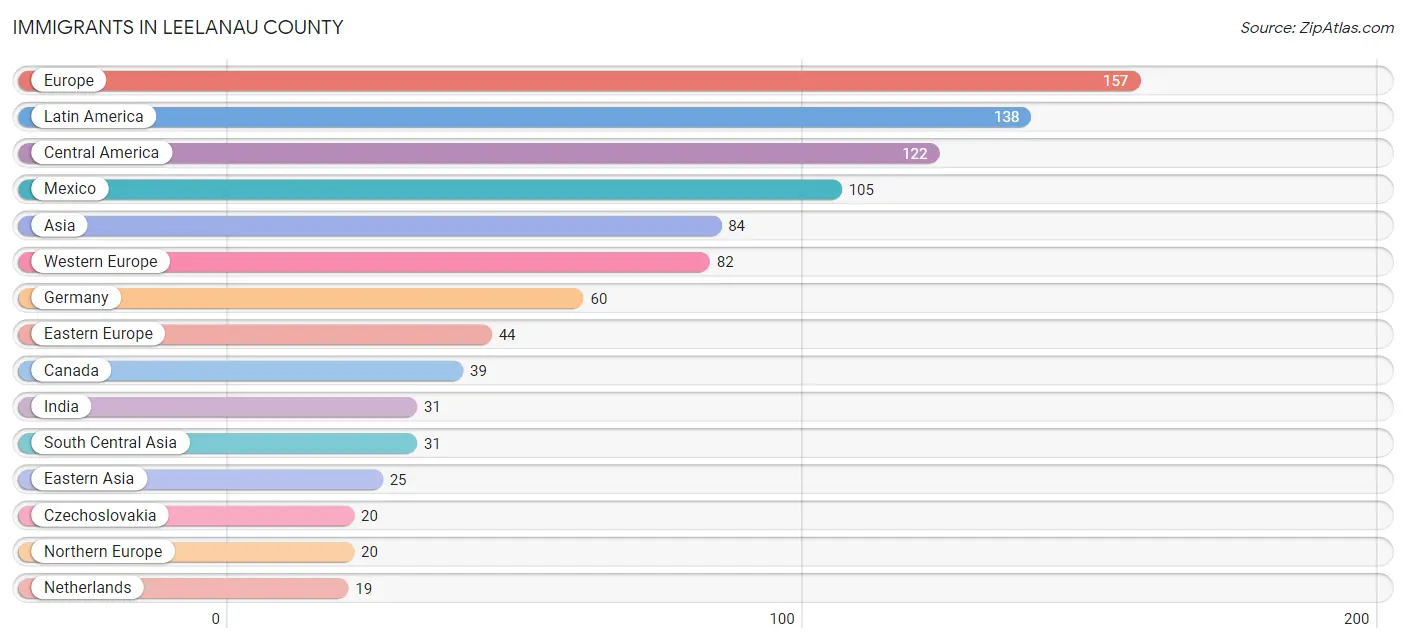
Immigrants in Leelanau County
The most numerous immigrant groups reported in Leelanau County came from Europe (157 | 0.7%), Latin America (138 | 0.6%), Central America (122 | 0.5%), Mexico (105 | 0.5%), and Asia (84 | 0.4%), together accounting for 2.7% of all Leelanau County residents.
| Immigration Origin | # Population | % Population |
| Africa | 10 | 0.0% |
| Argentina | 10 | 0.0% |
| Asia | 84 | 0.4% |
| Cameroon | 10 | 0.0% |
| Canada | 39 | 0.2% |
| Central America | 122 | 0.5% |
| China | 17 | 0.1% |
| Czechoslovakia | 20 | 0.1% |
| Eastern Asia | 25 | 0.1% |
| Eastern Europe | 44 | 0.2% |
| England | 3 | 0.0% |
| Europe | 157 | 0.7% |
| France | 3 | 0.0% |
| Germany | 60 | 0.3% |
| Guatemala | 11 | 0.1% |
| Honduras | 6 | 0.0% |
| Hong Kong | 3 | 0.0% |
| Hungary | 2 | 0.0% |
| India | 31 | 0.1% |
| Ireland | 4 | 0.0% |
| Italy | 7 | 0.0% |
| Japan | 8 | 0.0% |
| Latin America | 138 | 0.6% |
| Latvia | 3 | 0.0% |
| Lebanon | 9 | 0.0% |
| Mexico | 105 | 0.5% |
| Middle Africa | 10 | 0.0% |
| Netherlands | 19 | 0.1% |
| Northern Europe | 20 | 0.1% |
| Philippines | 19 | 0.1% |
| Poland | 3 | 0.0% |
| Russia | 5 | 0.0% |
| Scotland | 3 | 0.0% |
| South America | 16 | 0.1% |
| South Central Asia | 31 | 0.1% |
| South Eastern Asia | 19 | 0.1% |
| Southern Europe | 11 | 0.1% |
| Spain | 4 | 0.0% |
| Taiwan | 12 | 0.1% |
| Ukraine | 11 | 0.1% |
| Venezuela | 6 | 0.0% |
| Western Asia | 9 | 0.0% |
| Western Europe | 82 | 0.4% | View All 43 Rows |
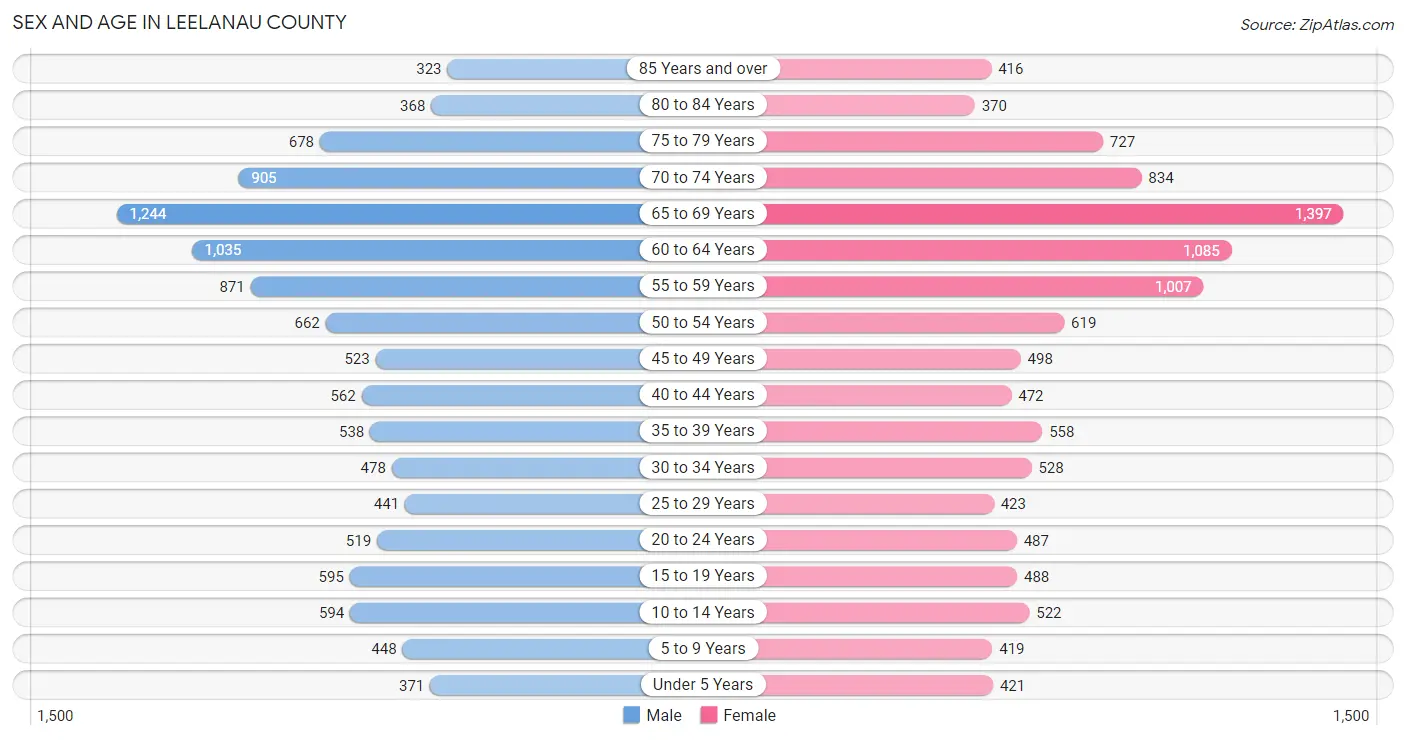
Sex and Age in Leelanau County
Sex and Age in Leelanau County
The most populous age groups in Leelanau County are 65 to 69 Years (1,244 | 11.2%) for men and 65 to 69 Years (1,397 | 12.4%) for women.
| Age Bracket | Male | Female |
| Under 5 Years | 371 (3.3%) | 421 (3.7%) |
| 5 to 9 Years | 448 (4.0%) | 419 (3.7%) |
| 10 to 14 Years | 594 (5.3%) | 522 (4.6%) |
| 15 to 19 Years | 595 (5.3%) | 488 (4.3%) |
| 20 to 24 Years | 519 (4.6%) | 487 (4.3%) |
| 25 to 29 Years | 441 (4.0%) | 423 (3.7%) |
| 30 to 34 Years | 478 (4.3%) | 528 (4.7%) |
| 35 to 39 Years | 538 (4.8%) | 558 (5.0%) |
| 40 to 44 Years | 562 (5.0%) | 472 (4.2%) |
| 45 to 49 Years | 523 (4.7%) | 498 (4.4%) |
| 50 to 54 Years | 662 (5.9%) | 619 (5.5%) |
| 55 to 59 Years | 871 (7.8%) | 1,007 (8.9%) |
| 60 to 64 Years | 1,035 (9.3%) | 1,085 (9.6%) |
| 65 to 69 Years | 1,244 (11.2%) | 1,397 (12.4%) |
| 70 to 74 Years | 905 (8.1%) | 834 (7.4%) |
| 75 to 79 Years | 678 (6.1%) | 727 (6.5%) |
| 80 to 84 Years | 368 (3.3%) | 370 (3.3%) |
| 85 Years and over | 323 (2.9%) | 416 (3.7%) |
| Total | 11,155 (100.0%) | 11,271 (100.0%) |
Families and Households in Leelanau County
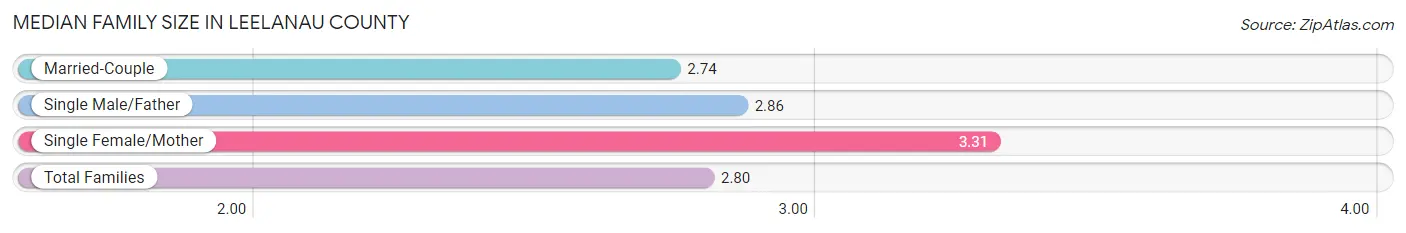
Median Family Size in Leelanau County
The median family size in Leelanau County is 2.80 persons per family, with single female/mother families (569 | 8.7%) accounting for the largest median family size of 3.31 persons per family. On the other hand, married-couple families (5,618 | 86.3%) represent the smallest median family size with 2.74 persons per family.
| Family Type | # Families | Family Size |
| Married-Couple | 5,618 (86.3%) | 2.74 |
| Single Male/Father | 322 (5.0%) | 2.86 |
| Single Female/Mother | 569 (8.7%) | 3.31 |
| Total Families | 6,509 (100.0%) | 2.80 |
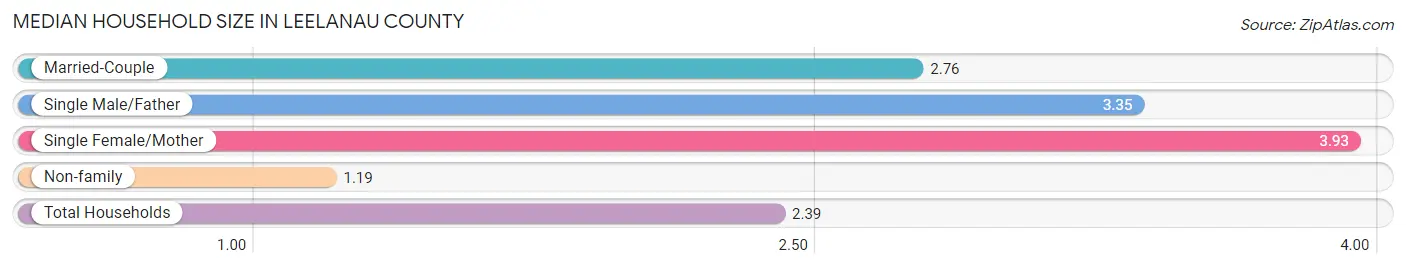
Median Household Size in Leelanau County
The median household size in Leelanau County is 2.39 persons per household, with single female/mother households (569 | 6.1%) accounting for the largest median household size of 3.93 persons per household. non-family households (2,737 | 29.6%) represent the smallest median household size with 1.19 persons per household.
| Household Type | # Households | Household Size |
| Married-Couple | 5,618 (60.8%) | 2.76 |
| Single Male/Father | 322 (3.5%) | 3.35 |
| Single Female/Mother | 569 (6.1%) | 3.93 |
| Non-family | 2,737 (29.6%) | 1.19 |
| Total Households | 9,246 (100.0%) | 2.39 |
Household Size by Marriage Status in Leelanau County
Out of a total of 9,246 households in Leelanau County, 6,509 (70.4%) are family households, while 2,737 (29.6%) are nonfamily households. The most numerous type of family households are 2-person households, comprising 3,946, and the most common type of nonfamily households are 1-person households, comprising 2,341.
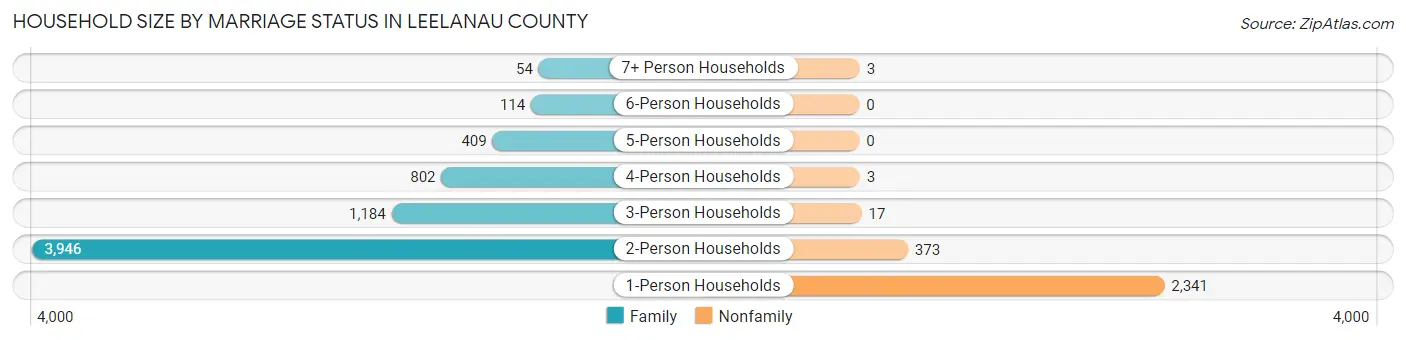
| Household Size | Family Households | Nonfamily Households |
| 1-Person Households | - | 2,341 (25.3%) |
| 2-Person Households | 3,946 (42.7%) | 373 (4.0%) |
| 3-Person Households | 1,184 (12.8%) | 17 (0.2%) |
| 4-Person Households | 802 (8.7%) | 3 (0.0%) |
| 5-Person Households | 409 (4.4%) | 0 (0.0%) |
| 6-Person Households | 114 (1.2%) | 0 (0.0%) |
| 7+ Person Households | 54 (0.6%) | 3 (0.0%) |
| Total | 6,509 (70.4%) | 2,737 (29.6%) |
Female Fertility in Leelanau County
Fertility by Age in Leelanau County
Average fertility rate in Leelanau County is 31.0 births per 1,000 women. Women in the age bracket of 20 to 34 years have the highest fertility rate with 52.0 births per 1,000 women. Women in the age bracket of 20 to 34 years acount for 67.6% of all women with births.
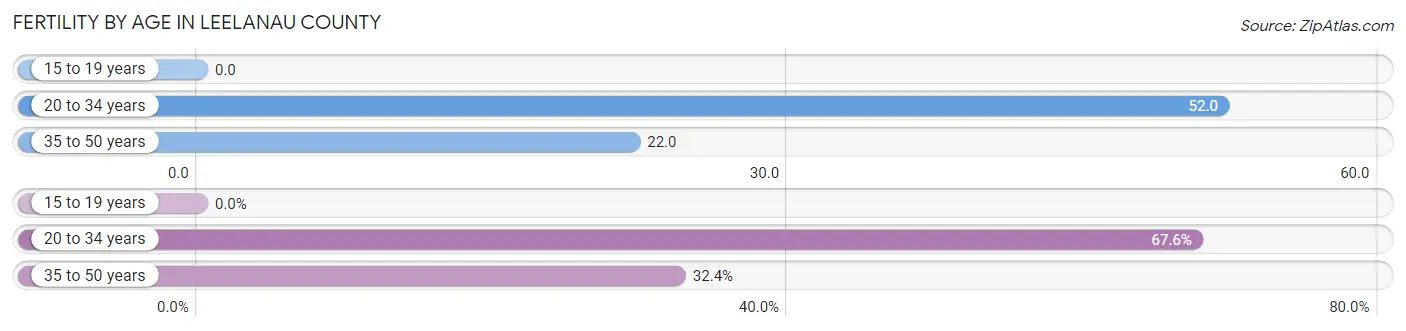
| Age Bracket | Women with Births | Births / 1,000 Women |
| 15 to 19 years | 0 (0.0%) | 0.0 |
| 20 to 34 years | 75 (67.6%) | 52.0 |
| 35 to 50 years | 36 (32.4%) | 22.0 |
| Total | 111 (100.0%) | 31.0 |
Fertility by Age by Marriage Status in Leelanau County
79.3% of women with births (111) in Leelanau County are married. The highest percentage of unmarried women with births falls into 20 to 34 years age bracket with 26.7% of them unmarried at the time of birth, while the lowest percentage of unmarried women with births belong to 35 to 50 years age bracket with 8.3% of them unmarried.
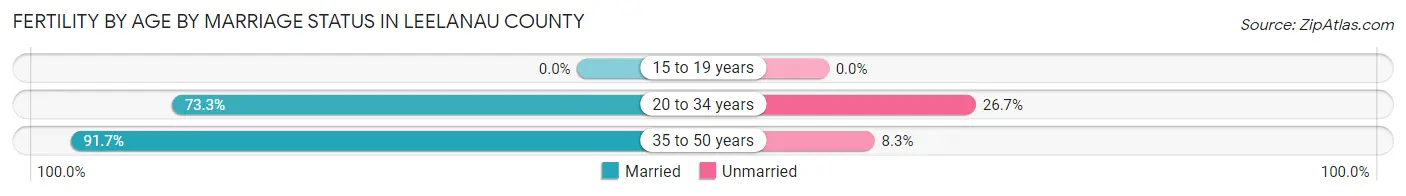
| Age Bracket | Married | Unmarried |
| 15 to 19 years | 0 (0.0%) | 0 (0.0%) |
| 20 to 34 years | 55 (73.3%) | 20 (26.7%) |
| 35 to 50 years | 33 (91.7%) | 3 (8.3%) |
| Total | 88 (79.3%) | 23 (20.7%) |
Fertility by Education in Leelanau County
Average fertility rate in Leelanau County is 31.0 births per 1,000 women. Women with the education attainment of bachelor's degree have the highest fertility rate of 71.0 births per 1,000 women, while women with the education attainment of graduate degree have the lowest fertility at 8.0 births per 1,000 women. Women with the education attainment of bachelor's degree represent 62.2% of all women with births.
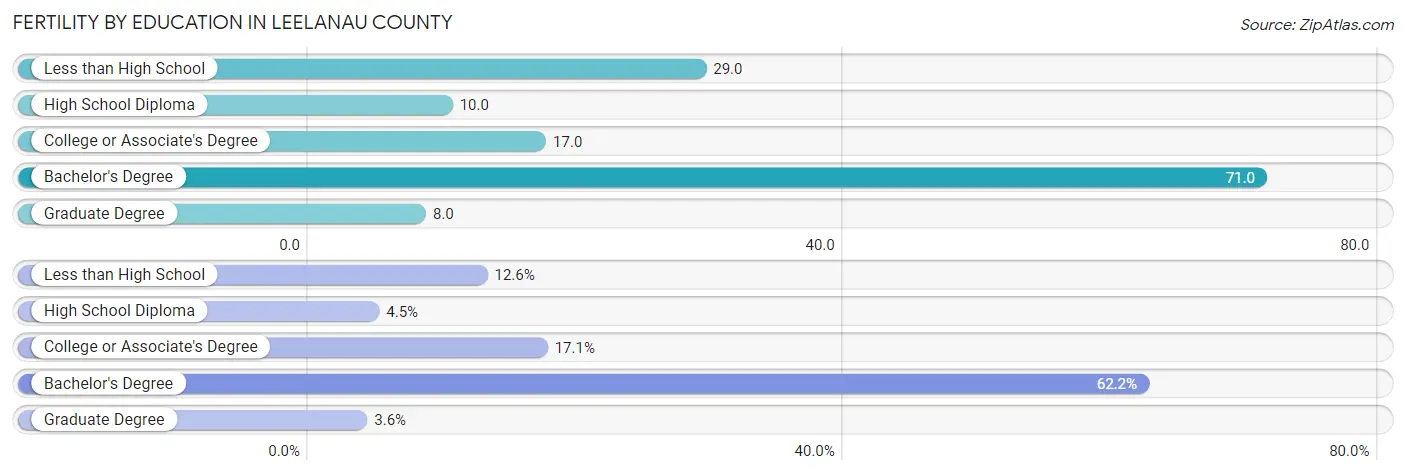
| Educational Attainment | Women with Births | Births / 1,000 Women |
| Less than High School | 14 (12.6%) | 29.0 |
| High School Diploma | 5 (4.5%) | 10.0 |
| College or Associate's Degree | 19 (17.1%) | 17.0 |
| Bachelor's Degree | 69 (62.2%) | 71.0 |
| Graduate Degree | 4 (3.6%) | 8.0 |
| Total | 111 (100.0%) | 31.0 |
Fertility by Education by Marriage Status in Leelanau County
20.7% of women with births in Leelanau County are unmarried. Women with the educational attainment of graduate degree are most likely to be married with 100.0% of them married at childbirth, while women with the educational attainment of less than high school are least likely to be married with 100.0% of them unmarried at childbirth.
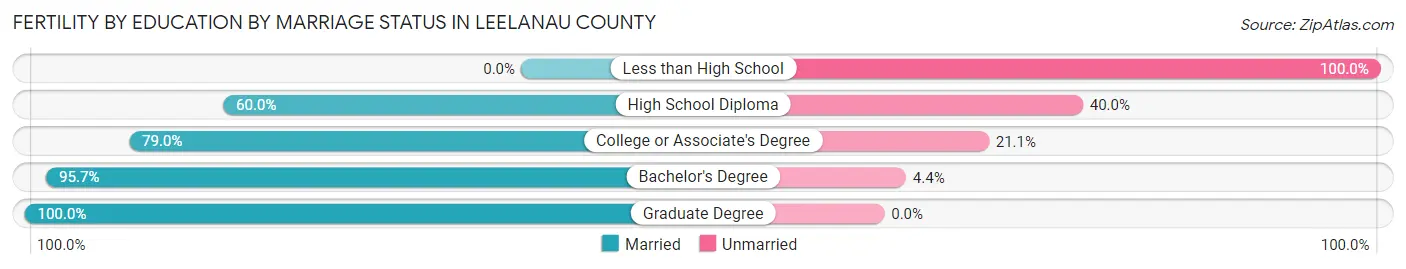
| Educational Attainment | Married | Unmarried |
| Less than High School | 0 (0.0%) | 14 (100.0%) |
| High School Diploma | 3 (60.0%) | 2 (40.0%) |
| College or Associate's Degree | 15 (78.9%) | 4 (21.0%) |
| Bachelor's Degree | 66 (95.7%) | 3 (4.3%) |
| Graduate Degree | 4 (100.0%) | 0 (0.0%) |
| Total | 88 (79.3%) | 23 (20.7%) |
Employment Characteristics in Leelanau County
Employment by Class of Employer in Leelanau County
Among the 9,470 employed individuals in Leelanau County, private company employees (5,313 | 56.1%), self-employed (not incorporated) (1,316 | 13.9%), and not-for-profit organizations (1,077 | 11.4%) make up the most common classes of employment.
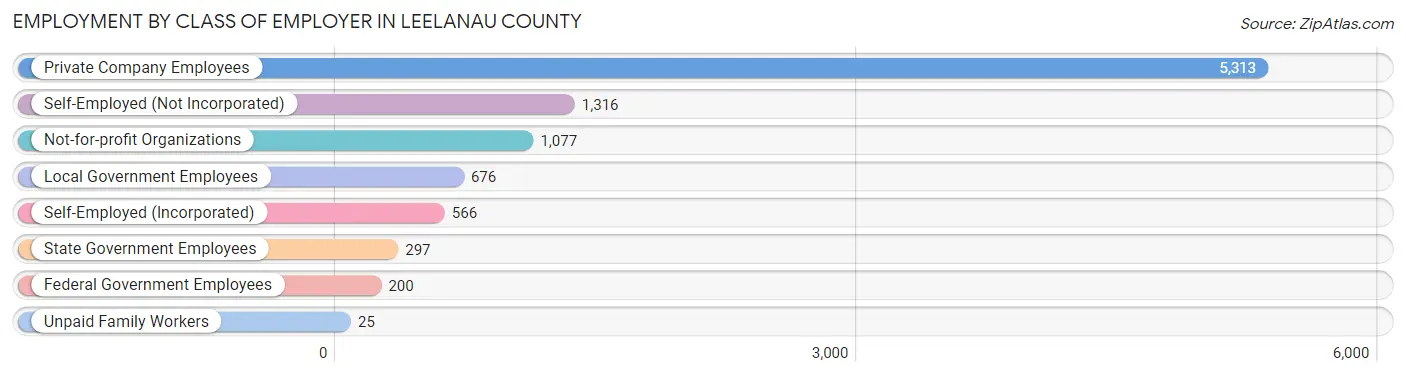
| Employer Class | # Employees | % Employees |
| Private Company Employees | 5,313 | 56.1% |
| Self-Employed (Incorporated) | 566 | 6.0% |
| Self-Employed (Not Incorporated) | 1,316 | 13.9% |
| Not-for-profit Organizations | 1,077 | 11.4% |
| Local Government Employees | 676 | 7.1% |
| State Government Employees | 297 | 3.1% |
| Federal Government Employees | 200 | 2.1% |
| Unpaid Family Workers | 25 | 0.3% |
| Total | 9,470 | 100.0% |
Employment Status by Age in Leelanau County
According to the labor force statistics for Leelanau County, out of the total population over 16 years of age (19,403), 51.8% or 10,051 individuals are in the labor force, with 3.2% or 322 of them unemployed. The age group with the highest labor force participation rate is 30 to 34 years, with 87.9% or 884 individuals in the labor force. Within the labor force, the 16 to 19 years age range has the highest percentage of unemployed individuals, with 15.9% or 46 of them being unemployed.
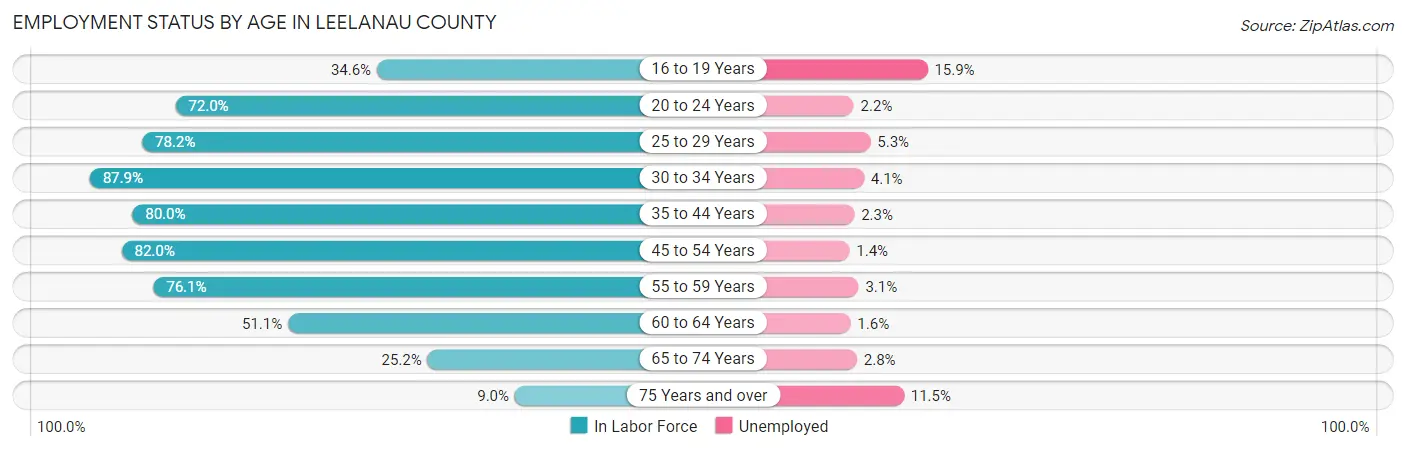
| Age Bracket | In Labor Force | Unemployed |
| 16 to 19 Years | 289 (34.6%) | 46 (15.9%) |
| 20 to 24 Years | 724 (72.0%) | 16 (2.2%) |
| 25 to 29 Years | 676 (78.2%) | 36 (5.3%) |
| 30 to 34 Years | 884 (87.9%) | 36 (4.1%) |
| 35 to 44 Years | 1,704 (80.0%) | 39 (2.3%) |
| 45 to 54 Years | 1,888 (82.0%) | 26 (1.4%) |
| 55 to 59 Years | 1,429 (76.1%) | 44 (3.1%) |
| 60 to 64 Years | 1,083 (51.1%) | 17 (1.6%) |
| 65 to 74 Years | 1,104 (25.2%) | 31 (2.8%) |
| 75 Years and over | 259 (9.0%) | 30 (11.5%) |
| Total | 10,051 (51.8%) | 322 (3.2%) |
Employment Status by Educational Attainment in Leelanau County
According to labor force statistics for Leelanau County, 74.4% of individuals (7,663) out of the total population between 25 and 64 years of age (10,300) are in the labor force, with 2.6% or 199 of them being unemployed. The group with the highest labor force participation rate are those with the educational attainment of bachelor's degree or higher, with 78.6% or 3,550 individuals in the labor force. Within the labor force, individuals with high school diploma education have the highest percentage of unemployment, with 7.4% or 112 of them being unemployed.
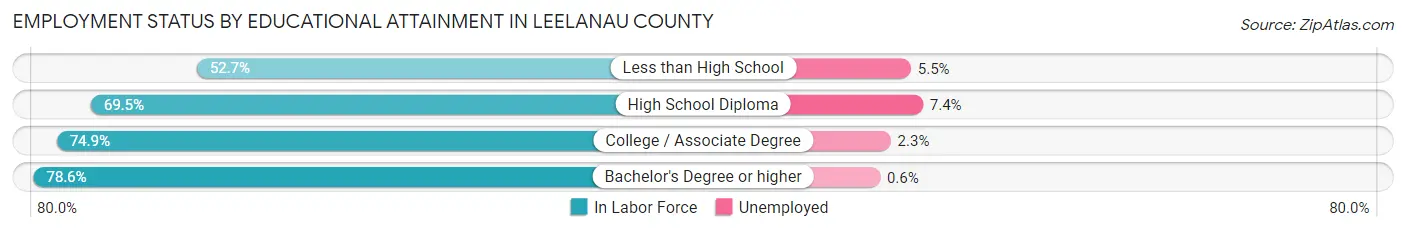
| Educational Attainment | In Labor Force | Unemployed |
| Less than High School | 238 (52.7%) | 25 (5.5%) |
| High School Diploma | 1,520 (69.5%) | 162 (7.4%) |
| College / Associate Degree | 2,355 (74.9%) | 72 (2.3%) |
| Bachelor's Degree or higher | 3,550 (78.6%) | 27 (0.6%) |
| Total | 7,663 (74.4%) | 268 (2.6%) |
Employment Occupations by Sex in Leelanau County
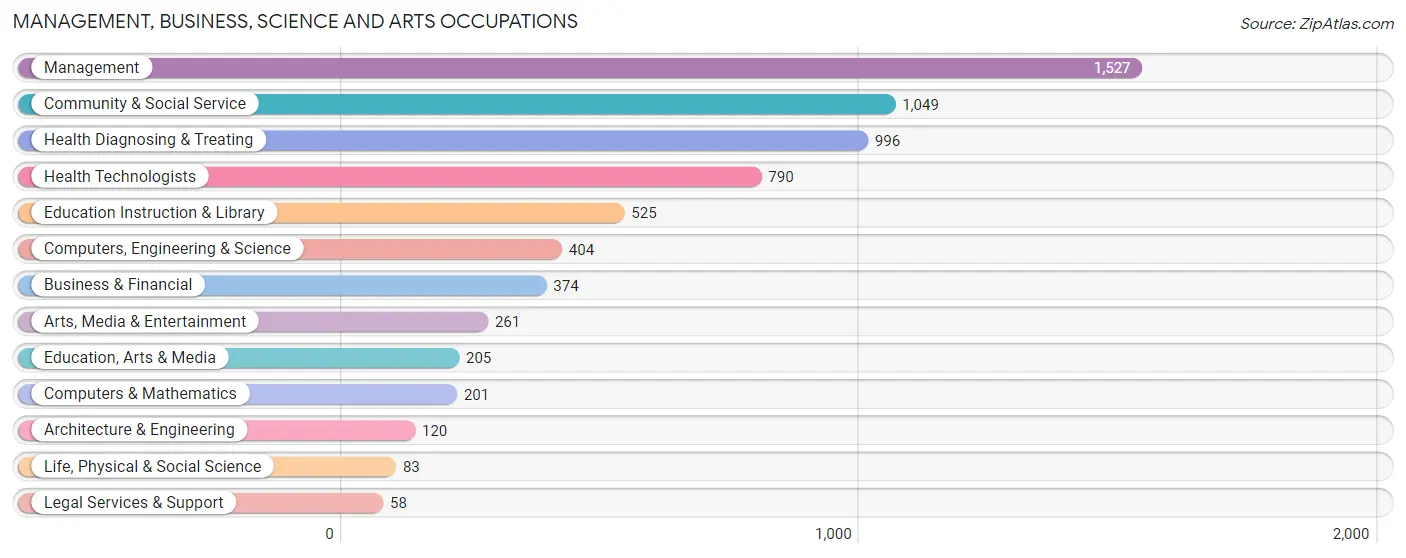
Management, Business, Science and Arts Occupations
The most common Management, Business, Science and Arts occupations in Leelanau County are Management (1,527 | 15.7%), Community & Social Service (1,049 | 10.8%), Health Diagnosing & Treating (996 | 10.2%), Health Technologists (790 | 8.1%), and Education Instruction & Library (525 | 5.4%).
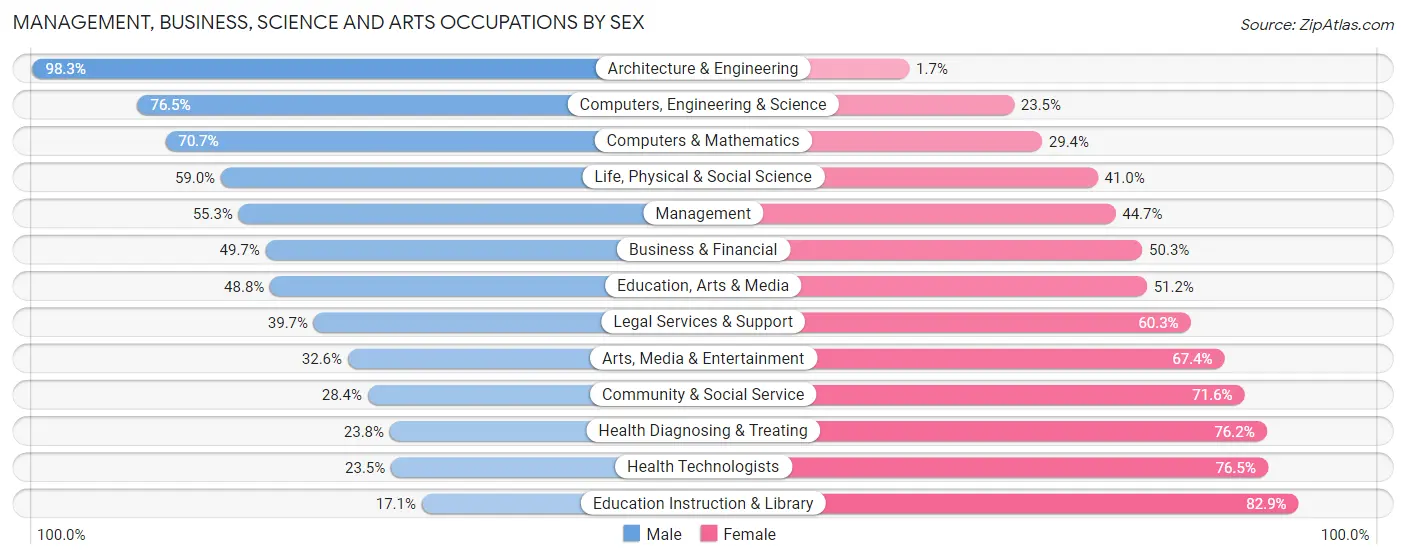
Management, Business, Science and Arts Occupations by Sex
Within the Management, Business, Science and Arts occupations in Leelanau County, the most male-oriented occupations are Architecture & Engineering (98.3%), Computers, Engineering & Science (76.5%), and Computers & Mathematics (70.7%), while the most female-oriented occupations are Education Instruction & Library (82.9%), Health Technologists (76.5%), and Health Diagnosing & Treating (76.2%).
| Occupation | Male | Female |
| Management | 845 (55.3%) | 682 (44.7%) |
| Business & Financial | 186 (49.7%) | 188 (50.3%) |
| Computers, Engineering & Science | 309 (76.5%) | 95 (23.5%) |
| Computers & Mathematics | 142 (70.7%) | 59 (29.3%) |
| Architecture & Engineering | 118 (98.3%) | 2 (1.7%) |
| Life, Physical & Social Science | 49 (59.0%) | 34 (41.0%) |
| Community & Social Service | 298 (28.4%) | 751 (71.6%) |
| Education, Arts & Media | 100 (48.8%) | 105 (51.2%) |
| Legal Services & Support | 23 (39.7%) | 35 (60.3%) |
| Education Instruction & Library | 90 (17.1%) | 435 (82.9%) |
| Arts, Media & Entertainment | 85 (32.6%) | 176 (67.4%) |
| Health Diagnosing & Treating | 237 (23.8%) | 759 (76.2%) |
| Health Technologists | 186 (23.5%) | 604 (76.5%) |
| Total (Category) | 1,875 (43.1%) | 2,475 (56.9%) |
| Total (Overall) | 4,830 (49.7%) | 4,890 (50.3%) |
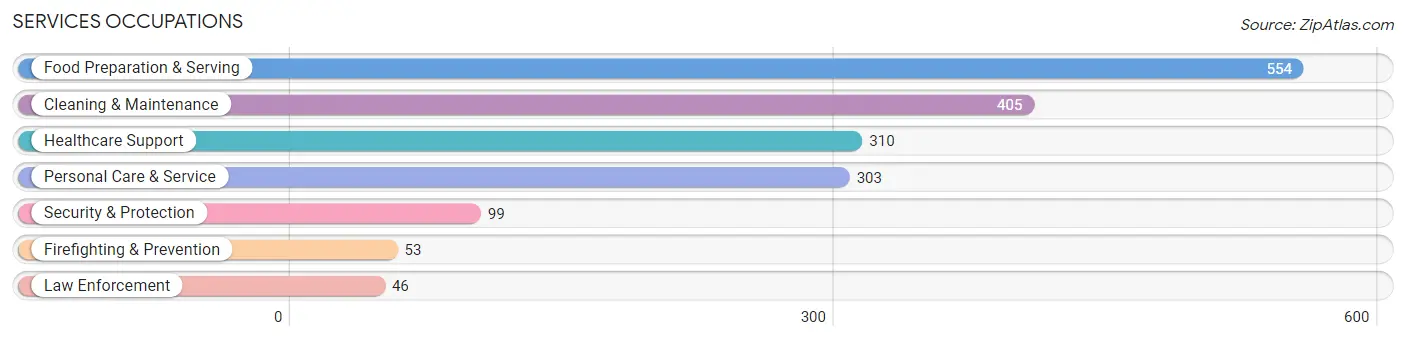
Services Occupations
The most common Services occupations in Leelanau County are Food Preparation & Serving (554 | 5.7%), Cleaning & Maintenance (405 | 4.2%), Healthcare Support (310 | 3.2%), Personal Care & Service (303 | 3.1%), and Security & Protection (99 | 1.0%).
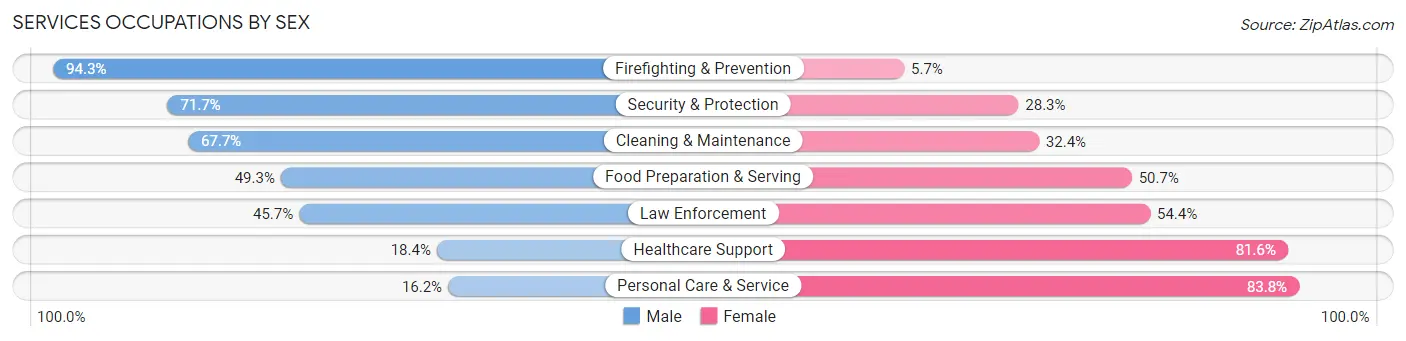
Services Occupations by Sex
Within the Services occupations in Leelanau County, the most male-oriented occupations are Firefighting & Prevention (94.3%), Security & Protection (71.7%), and Cleaning & Maintenance (67.6%), while the most female-oriented occupations are Personal Care & Service (83.8%), Healthcare Support (81.6%), and Law Enforcement (54.3%).
| Occupation | Male | Female |
| Healthcare Support | 57 (18.4%) | 253 (81.6%) |
| Security & Protection | 71 (71.7%) | 28 (28.3%) |
| Firefighting & Prevention | 50 (94.3%) | 3 (5.7%) |
| Law Enforcement | 21 (45.7%) | 25 (54.3%) |
| Food Preparation & Serving | 273 (49.3%) | 281 (50.7%) |
| Cleaning & Maintenance | 274 (67.6%) | 131 (32.4%) |
| Personal Care & Service | 49 (16.2%) | 254 (83.8%) |
| Total (Category) | 724 (43.3%) | 947 (56.7%) |
| Total (Overall) | 4,830 (49.7%) | 4,890 (50.3%) |
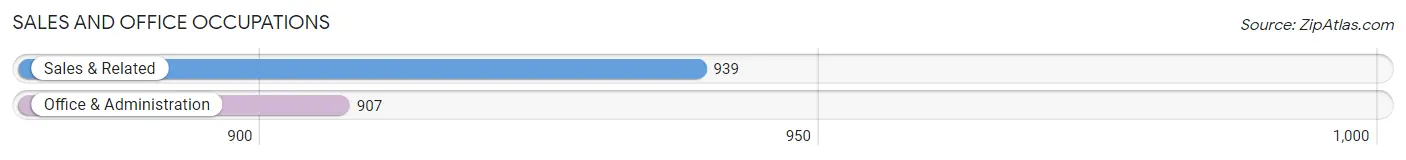
Sales and Office Occupations
The most common Sales and Office occupations in Leelanau County are Sales & Related (939 | 9.7%), and Office & Administration (907 | 9.3%).
Sales and Office Occupations by Sex
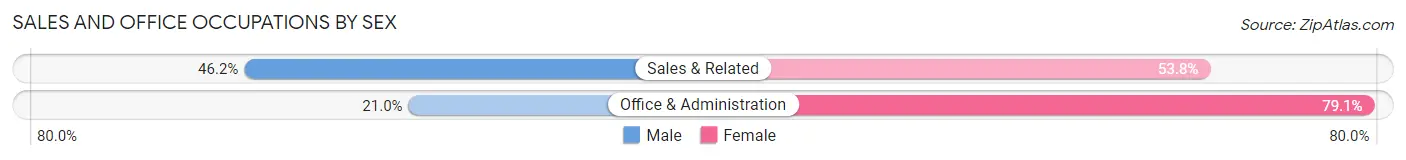
| Occupation | Male | Female |
| Sales & Related | 434 (46.2%) | 505 (53.8%) |
| Office & Administration | 190 (20.9%) | 717 (79.0%) |
| Total (Category) | 624 (33.8%) | 1,222 (66.2%) |
| Total (Overall) | 4,830 (49.7%) | 4,890 (50.3%) |
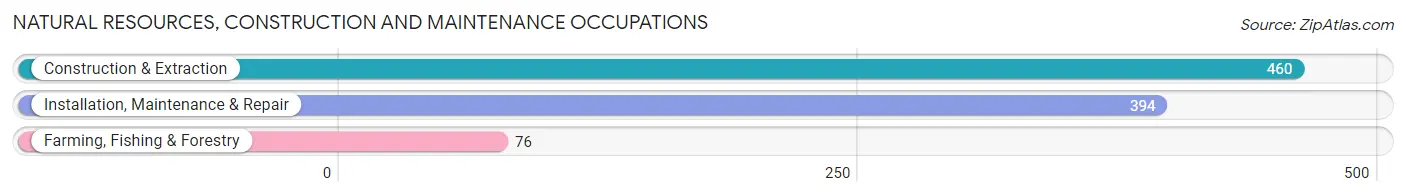
Natural Resources, Construction and Maintenance Occupations
The most common Natural Resources, Construction and Maintenance occupations in Leelanau County are Construction & Extraction (460 | 4.7%), Installation, Maintenance & Repair (394 | 4.1%), and Farming, Fishing & Forestry (76 | 0.8%).
Natural Resources, Construction and Maintenance Occupations by Sex
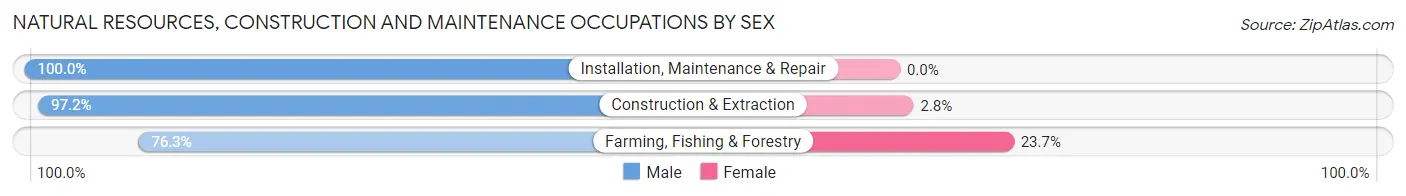
| Occupation | Male | Female |
| Farming, Fishing & Forestry | 58 (76.3%) | 18 (23.7%) |
| Construction & Extraction | 447 (97.2%) | 13 (2.8%) |
| Installation, Maintenance & Repair | 394 (100.0%) | 0 (0.0%) |
| Total (Category) | 899 (96.7%) | 31 (3.3%) |
| Total (Overall) | 4,830 (49.7%) | 4,890 (50.3%) |
Production, Transportation and Moving Occupations
The most common Production, Transportation and Moving occupations in Leelanau County are Production (476 | 4.9%), Transportation (280 | 2.9%), and Material Moving (167 | 1.7%).
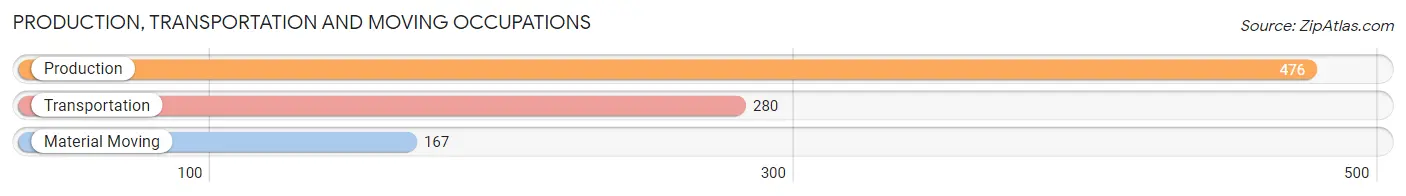
Production, Transportation and Moving Occupations by Sex
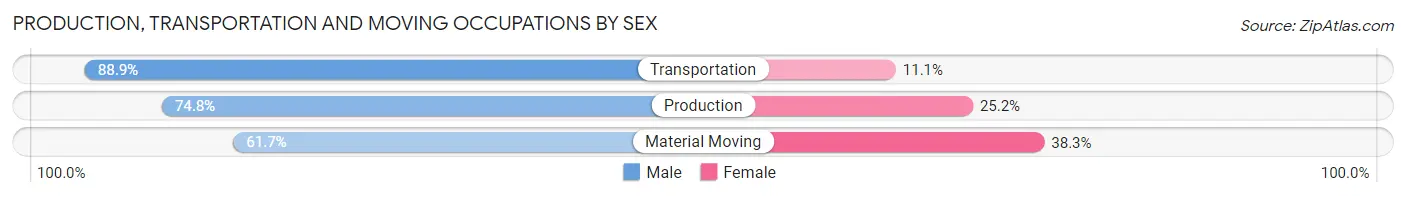
| Occupation | Male | Female |
| Production | 356 (74.8%) | 120 (25.2%) |
| Transportation | 249 (88.9%) | 31 (11.1%) |
| Material Moving | 103 (61.7%) | 64 (38.3%) |
| Total (Category) | 708 (76.7%) | 215 (23.3%) |
| Total (Overall) | 4,830 (49.7%) | 4,890 (50.3%) |
Employment Industries by Sex in Leelanau County
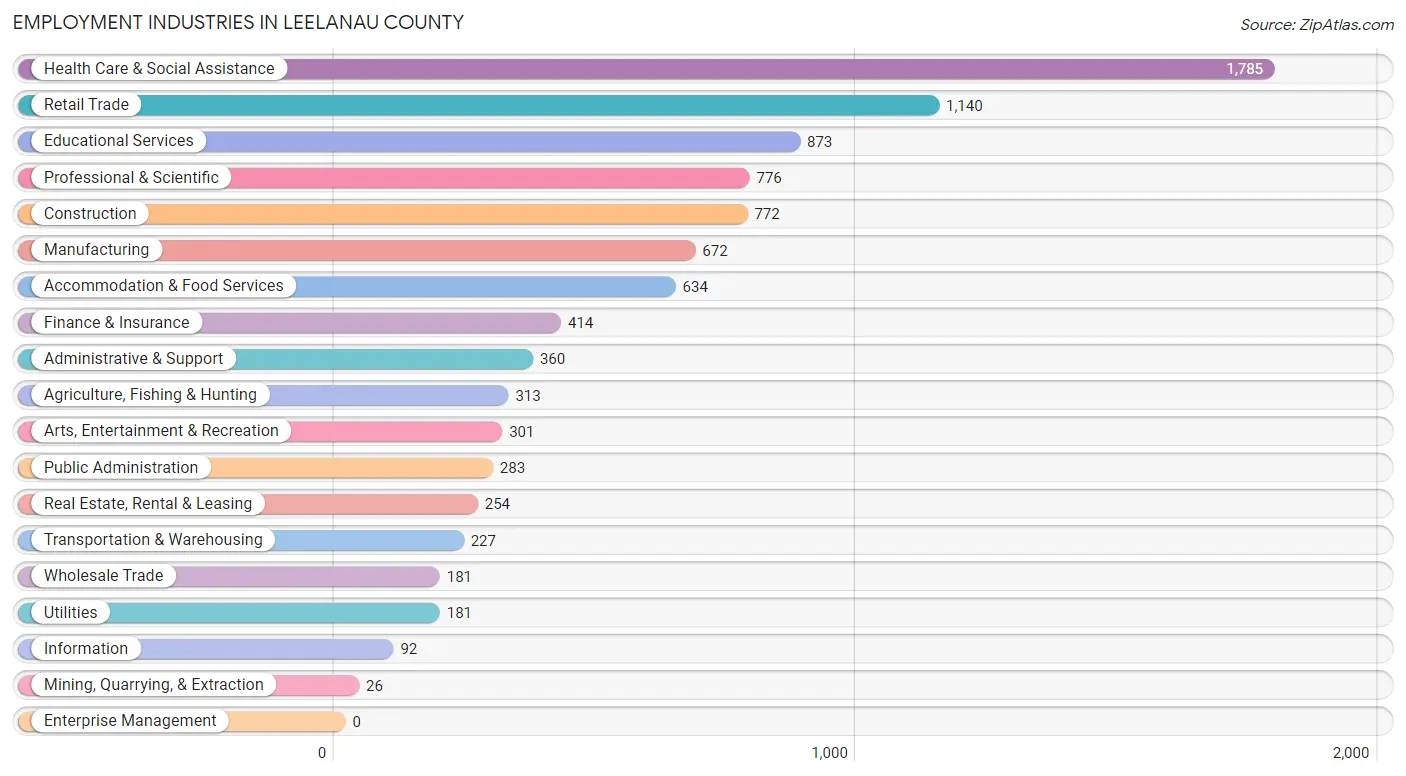
Employment Industries in Leelanau County
The major employment industries in Leelanau County include Health Care & Social Assistance (1,785 | 18.4%), Retail Trade (1,140 | 11.7%), Educational Services (873 | 9.0%), Professional & Scientific (776 | 8.0%), and Construction (772 | 7.9%).
Employment Industries by Sex in Leelanau County
The Leelanau County industries that see more men than women are Mining, Quarrying, & Extraction (100.0%), Utilities (100.0%), and Transportation & Warehousing (93.4%), whereas the industries that tend to have a higher number of women are Health Care & Social Assistance (80.3%), Educational Services (70.6%), and Finance & Insurance (60.1%).
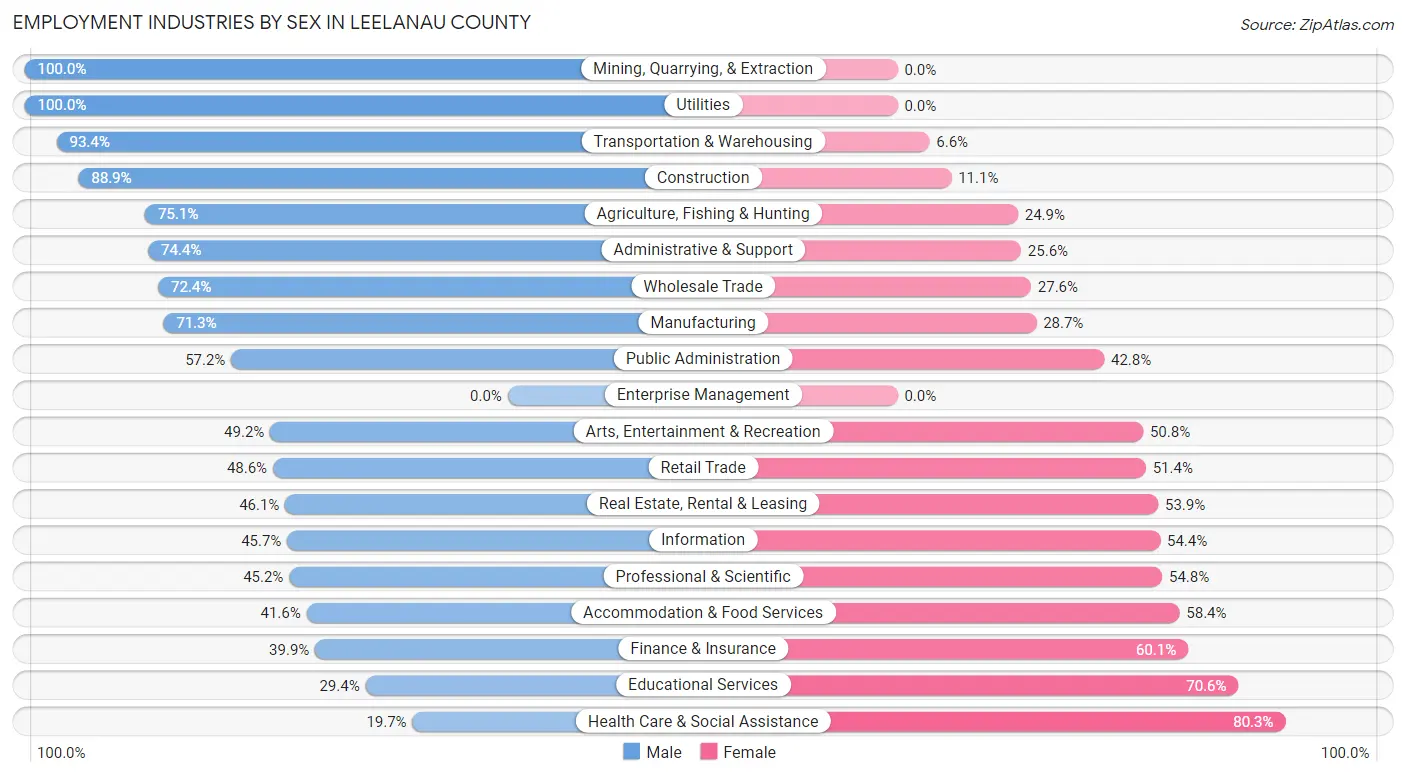
| Industry | Male | Female |
| Agriculture, Fishing & Hunting | 235 (75.1%) | 78 (24.9%) |
| Mining, Quarrying, & Extraction | 26 (100.0%) | 0 (0.0%) |
| Construction | 686 (88.9%) | 86 (11.1%) |
| Manufacturing | 479 (71.3%) | 193 (28.7%) |
| Wholesale Trade | 131 (72.4%) | 50 (27.6%) |
| Retail Trade | 554 (48.6%) | 586 (51.4%) |
| Transportation & Warehousing | 212 (93.4%) | 15 (6.6%) |
| Utilities | 181 (100.0%) | 0 (0.0%) |
| Information | 42 (45.7%) | 50 (54.3%) |
| Finance & Insurance | 165 (39.9%) | 249 (60.1%) |
| Real Estate, Rental & Leasing | 117 (46.1%) | 137 (53.9%) |
| Professional & Scientific | 351 (45.2%) | 425 (54.8%) |
| Enterprise Management | 0 (0.0%) | 0 (0.0%) |
| Administrative & Support | 268 (74.4%) | 92 (25.6%) |
| Educational Services | 257 (29.4%) | 616 (70.6%) |
| Health Care & Social Assistance | 352 (19.7%) | 1,433 (80.3%) |
| Arts, Entertainment & Recreation | 148 (49.2%) | 153 (50.8%) |
| Accommodation & Food Services | 264 (41.6%) | 370 (58.4%) |
| Public Administration | 162 (57.2%) | 121 (42.8%) |
| Total | 4,830 (49.7%) | 4,890 (50.3%) |
Education in Leelanau County
School Enrollment in Leelanau County
The most common levels of schooling among the 3,543 students in Leelanau County are middle school (862 | 24.3%), high school (832 | 23.5%), and elementary school (729 | 20.6%).
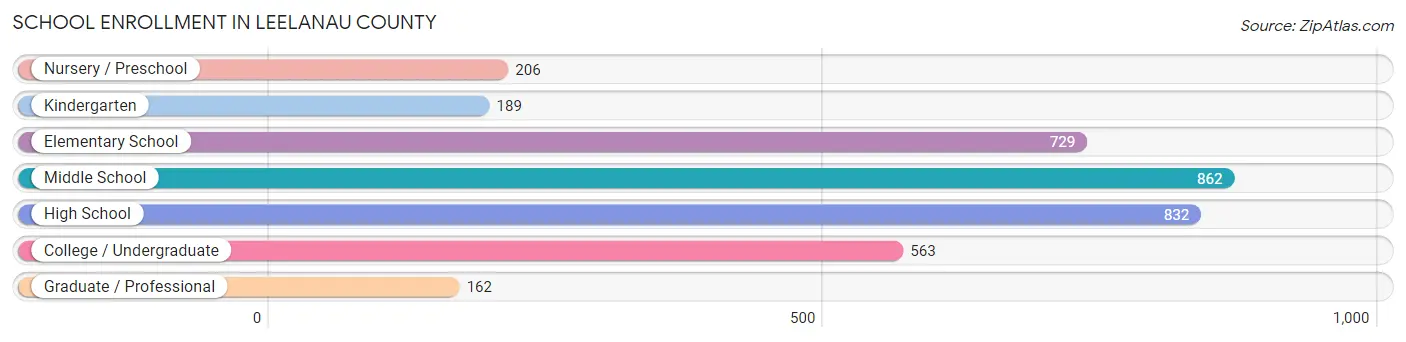
| School Level | # Students | % Students |
| Nursery / Preschool | 206 | 5.8% |
| Kindergarten | 189 | 5.3% |
| Elementary School | 729 | 20.6% |
| Middle School | 862 | 24.3% |
| High School | 832 | 23.5% |
| College / Undergraduate | 563 | 15.9% |
| Graduate / Professional | 162 | 4.6% |
| Total | 3,543 | 100.0% |
School Enrollment by Age by Funding Source in Leelanau County
Out of a total of 3,543 students who are enrolled in schools in Leelanau County, 723 (20.4%) attend a private institution, while the remaining 2,820 (79.6%) are enrolled in public schools. The age group of 3 to 4 year olds has the highest likelihood of being enrolled in private schools, with 47 (29.4% in the age bracket) enrolled. Conversely, the age group of 15 to 17 year olds has the lowest likelihood of being enrolled in a private school, with 616 (88.8% in the age bracket) attending a public institution.
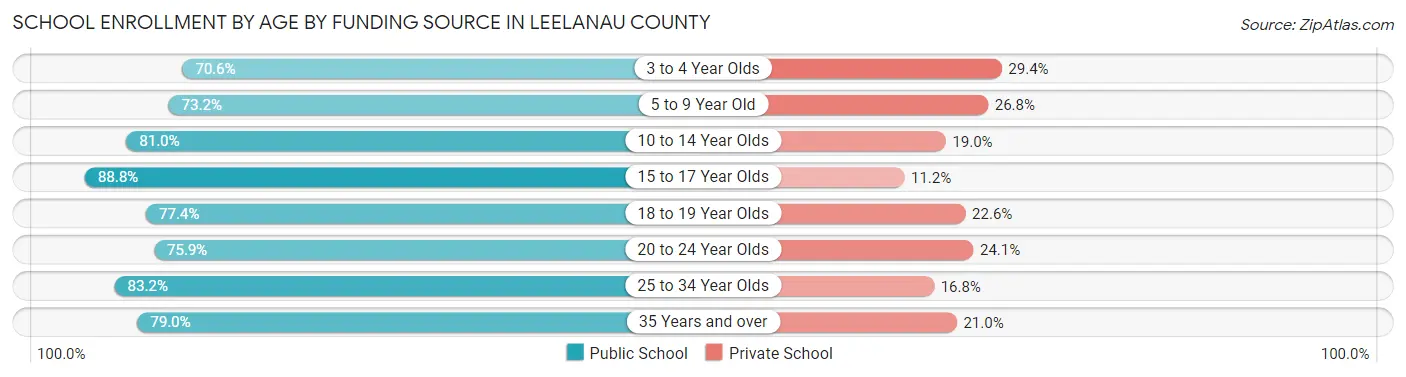
| Age Bracket | Public School | Private School |
| 3 to 4 Year Olds | 113 (70.6%) | 47 (29.4%) |
| 5 to 9 Year Old | 597 (73.2%) | 219 (26.8%) |
| 10 to 14 Year Olds | 859 (81.0%) | 201 (19.0%) |
| 15 to 17 Year Olds | 616 (88.8%) | 78 (11.2%) |
| 18 to 19 Year Olds | 106 (77.4%) | 31 (22.6%) |
| 20 to 24 Year Olds | 296 (75.9%) | 94 (24.1%) |
| 25 to 34 Year Olds | 139 (83.2%) | 28 (16.8%) |
| 35 Years and over | 94 (79.0%) | 25 (21.0%) |
| Total | 2,820 (79.6%) | 723 (20.4%) |
Educational Attainment by Field of Study in Leelanau County
Education (1,459 | 15.8%), business (1,451 | 15.7%), science & technology (1,066 | 11.5%), bio, nature & agricultural (771 | 8.3%), and social sciences (732 | 7.9%) are the most common fields of study among 9,253 individuals in Leelanau County who have obtained a bachelor's degree or higher.
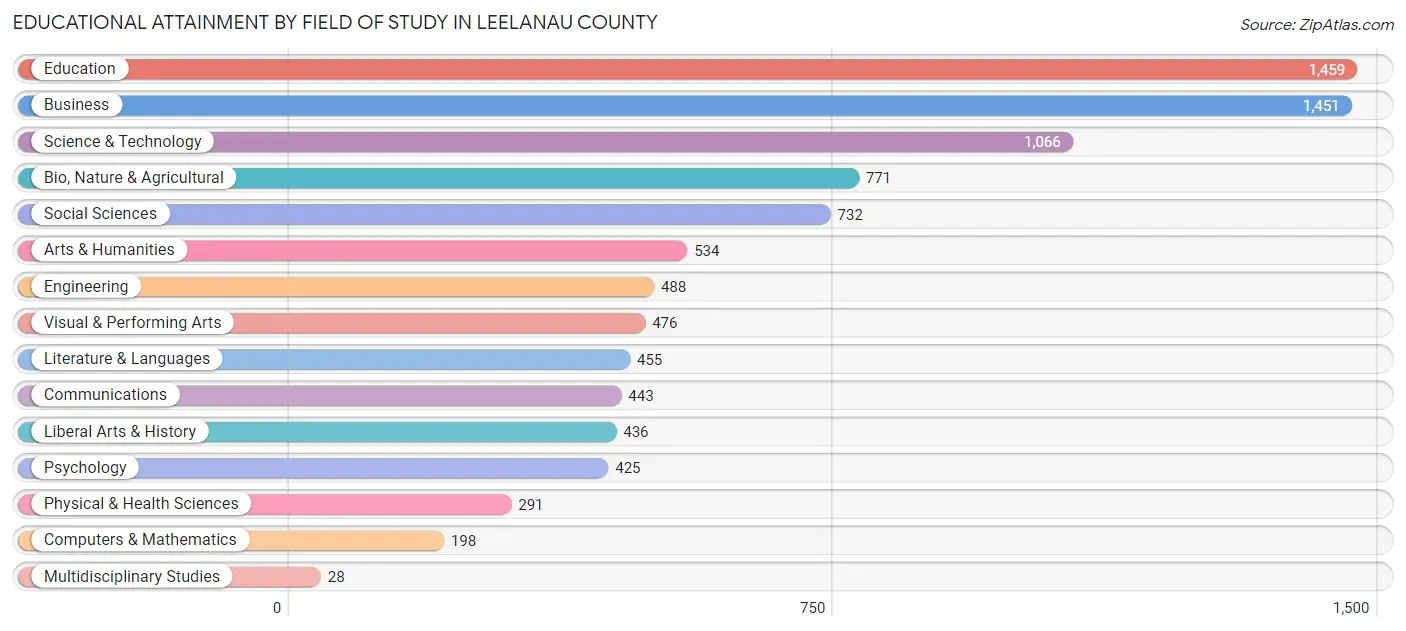
| Field of Study | # Graduates | % Graduates |
| Computers & Mathematics | 198 | 2.1% |
| Bio, Nature & Agricultural | 771 | 8.3% |
| Physical & Health Sciences | 291 | 3.1% |
| Psychology | 425 | 4.6% |
| Social Sciences | 732 | 7.9% |
| Engineering | 488 | 5.3% |
| Multidisciplinary Studies | 28 | 0.3% |
| Science & Technology | 1,066 | 11.5% |
| Business | 1,451 | 15.7% |
| Education | 1,459 | 15.8% |
| Literature & Languages | 455 | 4.9% |
| Liberal Arts & History | 436 | 4.7% |
| Visual & Performing Arts | 476 | 5.1% |
| Communications | 443 | 4.8% |
| Arts & Humanities | 534 | 5.8% |
| Total | 9,253 | 100.0% |
Transportation & Commute in Leelanau County
Vehicle Availability by Sex in Leelanau County
The most prevalent vehicle ownership categories in Leelanau County are males with 2 vehicles (1,900, accounting for 40.8%) and females with 2 vehicles (2,089, making up 39.8%).
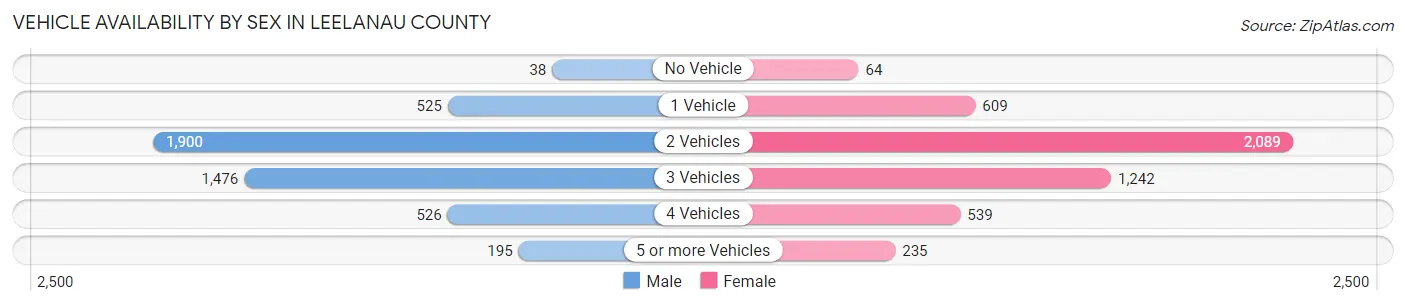
| Vehicles Available | Male | Female |
| No Vehicle | 38 (0.8%) | 64 (1.3%) |
| 1 Vehicle | 525 (11.3%) | 609 (12.8%) |
| 2 Vehicles | 1,900 (40.8%) | 2,089 (43.7%) |
| 3 Vehicles | 1,476 (31.7%) | 1,242 (26.0%) |
| 4 Vehicles | 526 (11.3%) | 539 (11.3%) |
| 5 or more Vehicles | 195 (4.2%) | 235 (4.9%) |
| Total | 4,660 (100.0%) | 4,778 (100.0%) |
Commute Time in Leelanau County
The most frequently occuring commute durations in Leelanau County are 20 to 24 minutes (1,353 commuters, 16.8%), 5 to 9 minutes (1,191 commuters, 14.7%), and 10 to 14 minutes (1,070 commuters, 13.3%).
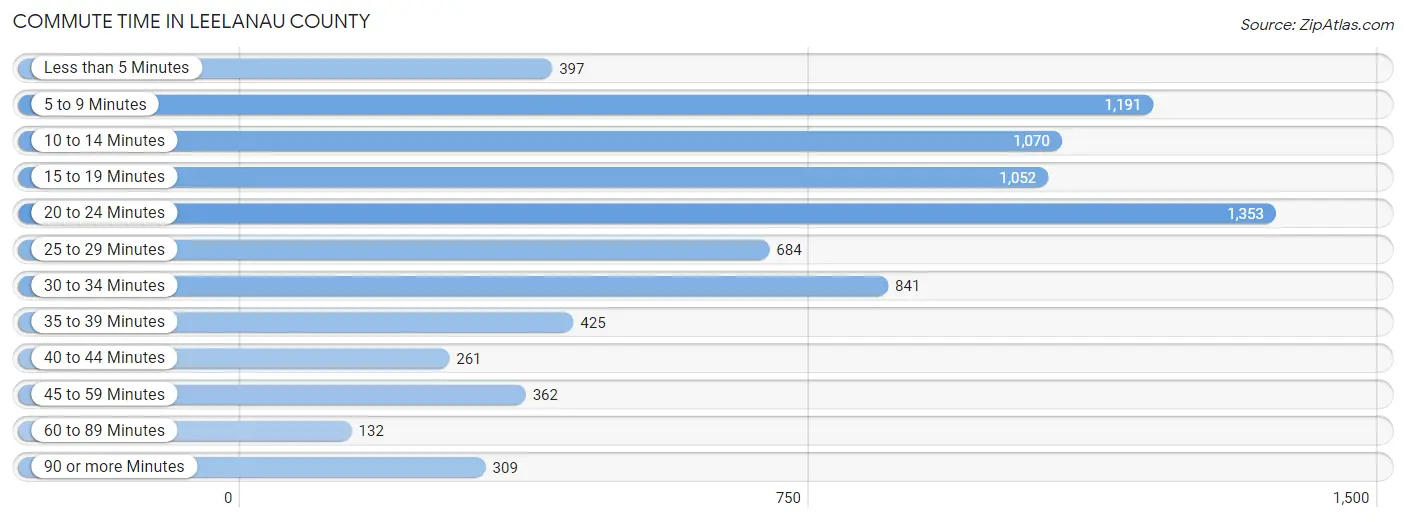
| Commute Time | # Commuters | % Commuters |
| Less than 5 Minutes | 397 | 4.9% |
| 5 to 9 Minutes | 1,191 | 14.7% |
| 10 to 14 Minutes | 1,070 | 13.3% |
| 15 to 19 Minutes | 1,052 | 13.0% |
| 20 to 24 Minutes | 1,353 | 16.8% |
| 25 to 29 Minutes | 684 | 8.5% |
| 30 to 34 Minutes | 841 | 10.4% |
| 35 to 39 Minutes | 425 | 5.3% |
| 40 to 44 Minutes | 261 | 3.2% |
| 45 to 59 Minutes | 362 | 4.5% |
| 60 to 89 Minutes | 132 | 1.6% |
| 90 or more Minutes | 309 | 3.8% |
Commute Time by Sex in Leelanau County
The most common commute times in Leelanau County are 20 to 24 minutes (705 commuters, 17.5%) for males and 10 to 14 minutes (658 commuters, 16.3%) for females.
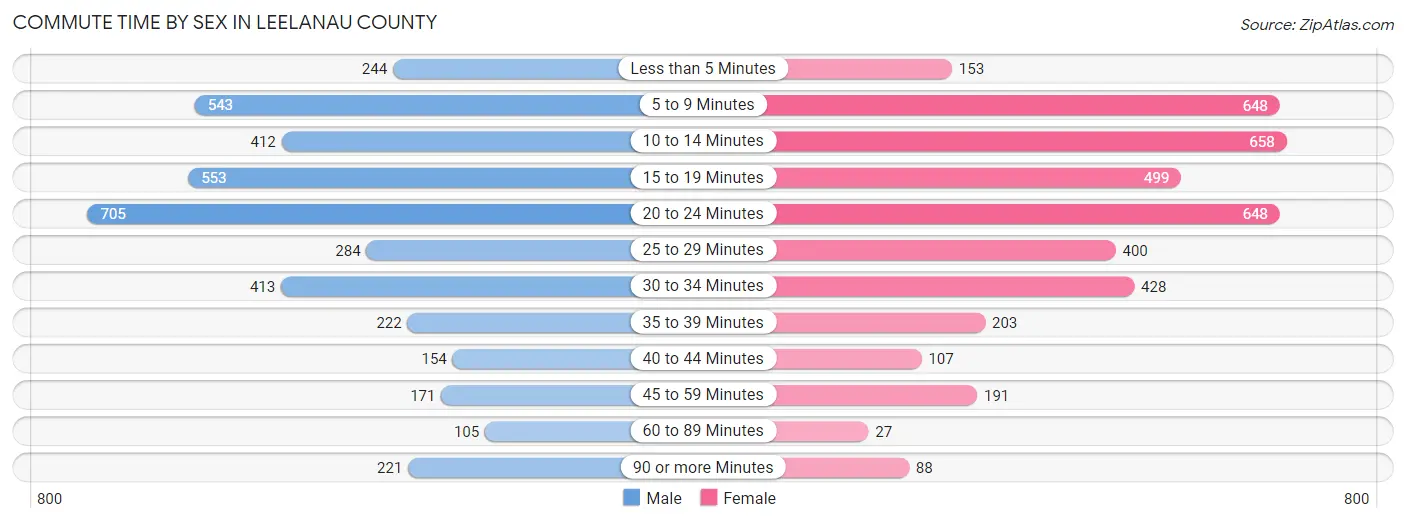
| Commute Time | Male | Female |
| Less than 5 Minutes | 244 (6.1%) | 153 (3.8%) |
| 5 to 9 Minutes | 543 (13.5%) | 648 (16.0%) |
| 10 to 14 Minutes | 412 (10.2%) | 658 (16.3%) |
| 15 to 19 Minutes | 553 (13.7%) | 499 (12.3%) |
| 20 to 24 Minutes | 705 (17.5%) | 648 (16.0%) |
| 25 to 29 Minutes | 284 (7.0%) | 400 (9.9%) |
| 30 to 34 Minutes | 413 (10.3%) | 428 (10.6%) |
| 35 to 39 Minutes | 222 (5.5%) | 203 (5.0%) |
| 40 to 44 Minutes | 154 (3.8%) | 107 (2.6%) |
| 45 to 59 Minutes | 171 (4.3%) | 191 (4.7%) |
| 60 to 89 Minutes | 105 (2.6%) | 27 (0.7%) |
| 90 or more Minutes | 221 (5.5%) | 88 (2.2%) |
Time of Departure to Work by Sex in Leelanau County
The most frequent times of departure to work in Leelanau County are 7:30 AM to 7:59 AM (665, 16.5%) for males and 7:30 AM to 7:59 AM (575, 14.2%) for females.
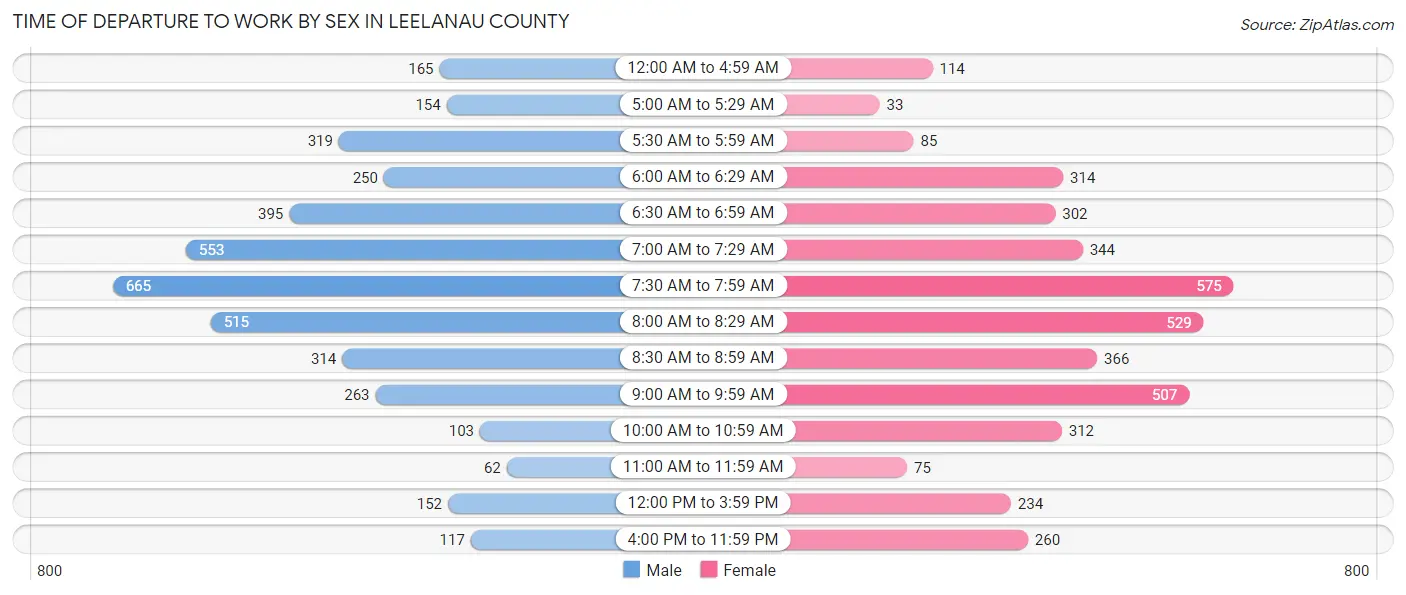
| Time of Departure | Male | Female |
| 12:00 AM to 4:59 AM | 165 (4.1%) | 114 (2.8%) |
| 5:00 AM to 5:29 AM | 154 (3.8%) | 33 (0.8%) |
| 5:30 AM to 5:59 AM | 319 (7.9%) | 85 (2.1%) |
| 6:00 AM to 6:29 AM | 250 (6.2%) | 314 (7.7%) |
| 6:30 AM to 6:59 AM | 395 (9.8%) | 302 (7.5%) |
| 7:00 AM to 7:29 AM | 553 (13.7%) | 344 (8.5%) |
| 7:30 AM to 7:59 AM | 665 (16.5%) | 575 (14.2%) |
| 8:00 AM to 8:29 AM | 515 (12.8%) | 529 (13.1%) |
| 8:30 AM to 8:59 AM | 314 (7.8%) | 366 (9.0%) |
| 9:00 AM to 9:59 AM | 263 (6.5%) | 507 (12.5%) |
| 10:00 AM to 10:59 AM | 103 (2.6%) | 312 (7.7%) |
| 11:00 AM to 11:59 AM | 62 (1.5%) | 75 (1.8%) |
| 12:00 PM to 3:59 PM | 152 (3.8%) | 234 (5.8%) |
| 4:00 PM to 11:59 PM | 117 (2.9%) | 260 (6.4%) |
| Total | 4,027 (100.0%) | 4,050 (100.0%) |
Housing Occupancy in Leelanau County
Occupancy by Ownership in Leelanau County
Of the total 9,246 dwellings in Leelanau County, owner-occupied units account for 8,311 (89.9%), while renter-occupied units make up 935 (10.1%).
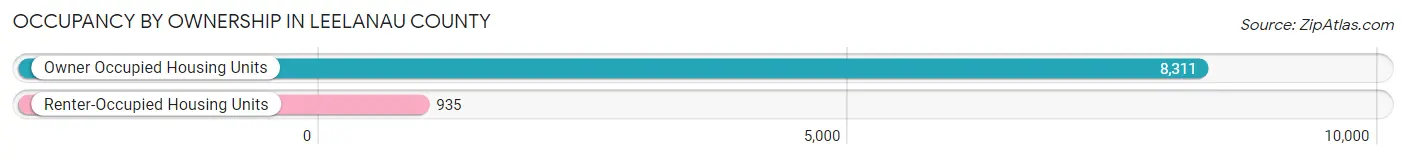
| Occupancy | # Housing Units | % Housing Units |
| Owner Occupied Housing Units | 8,311 | 89.9% |
| Renter-Occupied Housing Units | 935 | 10.1% |
| Total Occupied Housing Units | 9,246 | 100.0% |
Occupancy by Household Size in Leelanau County
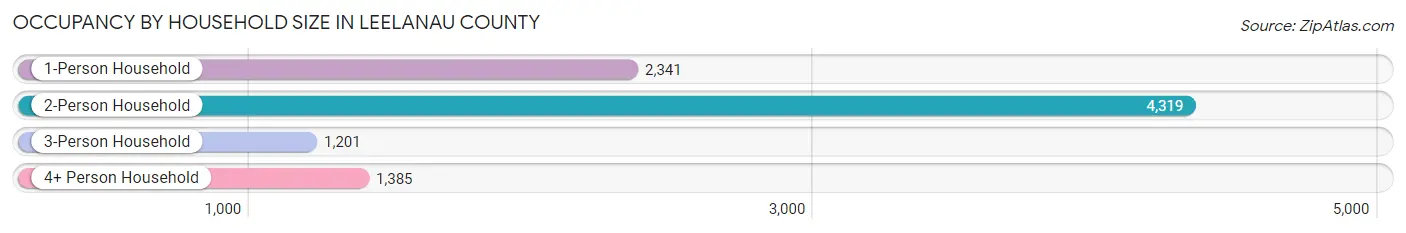
| Household Size | # Housing Units | % Housing Units |
| 1-Person Household | 2,341 | 25.3% |
| 2-Person Household | 4,319 | 46.7% |
| 3-Person Household | 1,201 | 13.0% |
| 4+ Person Household | 1,385 | 15.0% |
| Total Housing Units | 9,246 | 100.0% |
Occupancy by Ownership by Household Size in Leelanau County
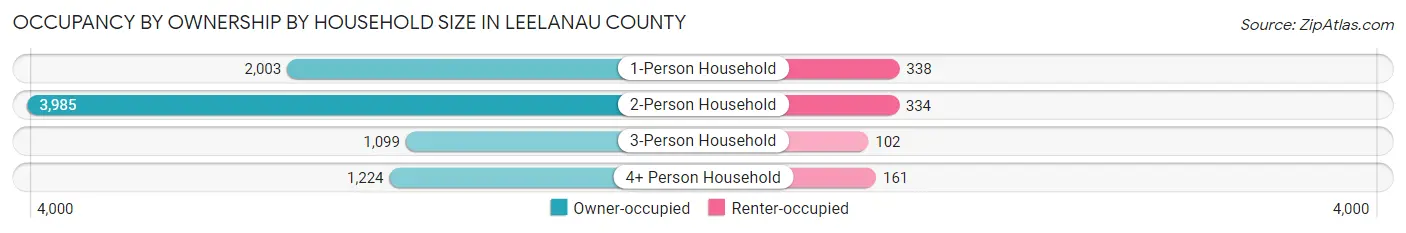
| Household Size | Owner-occupied | Renter-occupied |
| 1-Person Household | 2,003 (85.6%) | 338 (14.4%) |
| 2-Person Household | 3,985 (92.3%) | 334 (7.7%) |
| 3-Person Household | 1,099 (91.5%) | 102 (8.5%) |
| 4+ Person Household | 1,224 (88.4%) | 161 (11.6%) |
| Total Housing Units | 8,311 (89.9%) | 935 (10.1%) |
Occupancy by Educational Attainment in Leelanau County
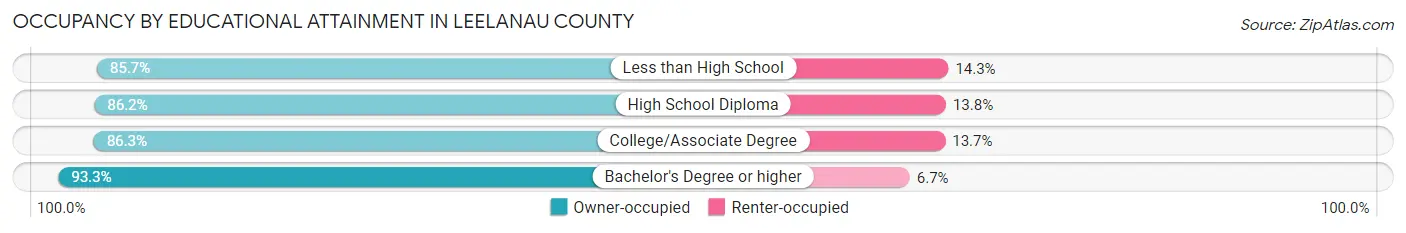
| Household Size | Owner-occupied | Renter-occupied |
| Less than High School | 263 (85.7%) | 44 (14.3%) |
| High School Diploma | 1,326 (86.2%) | 213 (13.8%) |
| College/Associate Degree | 2,253 (86.3%) | 358 (13.7%) |
| Bachelor's Degree or higher | 4,469 (93.3%) | 320 (6.7%) |
Occupancy by Age of Householder in Leelanau County
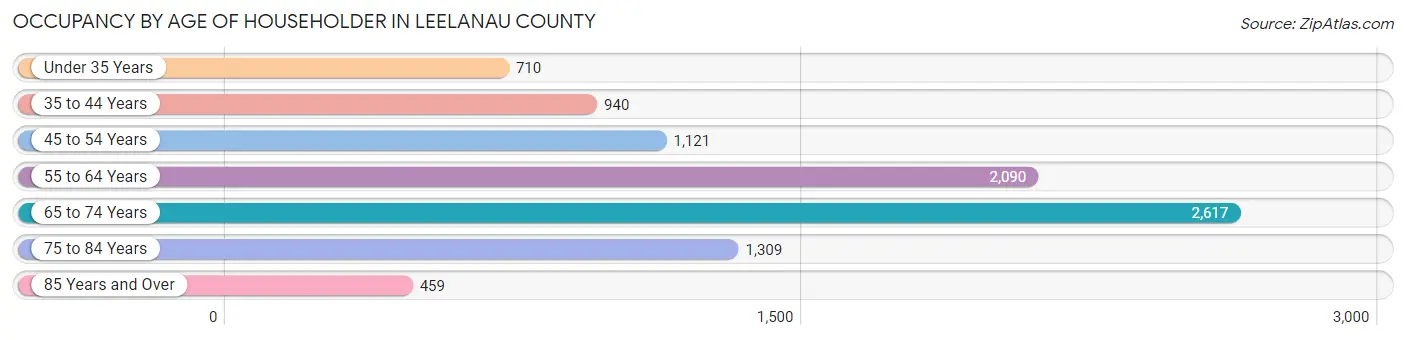
| Age Bracket | # Households | % Households |
| Under 35 Years | 710 | 7.7% |
| 35 to 44 Years | 940 | 10.2% |
| 45 to 54 Years | 1,121 | 12.1% |
| 55 to 64 Years | 2,090 | 22.6% |
| 65 to 74 Years | 2,617 | 28.3% |
| 75 to 84 Years | 1,309 | 14.2% |
| 85 Years and Over | 459 | 5.0% |
| Total | 9,246 | 100.0% |
Housing Finances in Leelanau County
Median Income by Occupancy in Leelanau County
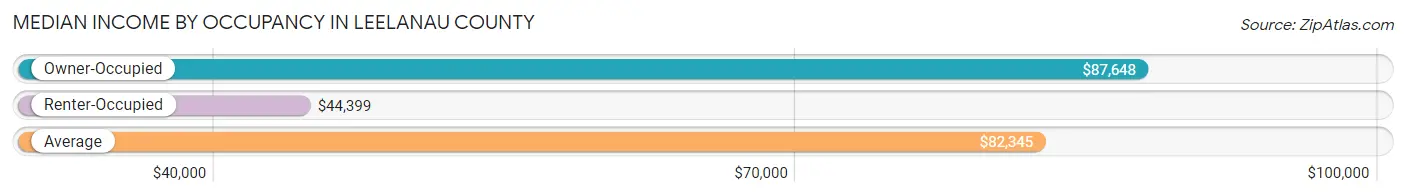
| Occupancy Type | # Households | Median Income |
| Owner-Occupied | 8,311 (89.9%) | $87,648 |
| Renter-Occupied | 935 (10.1%) | $44,399 |
| Average | 9,246 (100.0%) | $82,345 |
Occupancy by Householder Income Bracket in Leelanau County
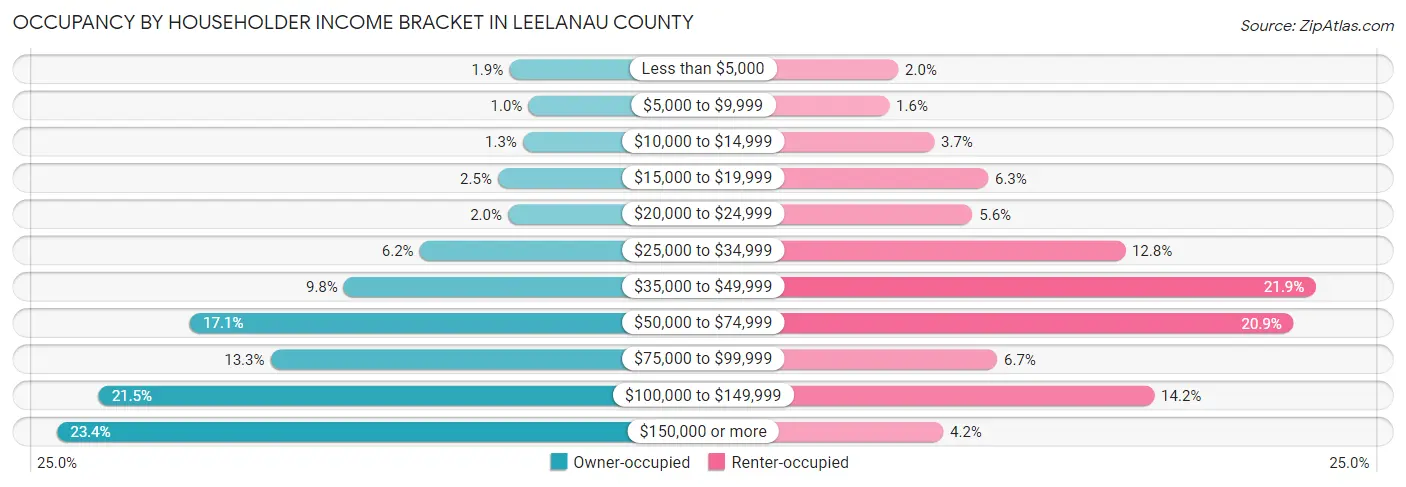
| Income Bracket | Owner-occupied | Renter-occupied |
| Less than $5,000 | 160 (1.9%) | 19 (2.0%) |
| $5,000 to $9,999 | 85 (1.0%) | 15 (1.6%) |
| $10,000 to $14,999 | 106 (1.3%) | 35 (3.7%) |
| $15,000 to $19,999 | 205 (2.5%) | 59 (6.3%) |
| $20,000 to $24,999 | 165 (2.0%) | 52 (5.6%) |
| $25,000 to $34,999 | 515 (6.2%) | 120 (12.8%) |
| $35,000 to $49,999 | 815 (9.8%) | 205 (21.9%) |
| $50,000 to $74,999 | 1,423 (17.1%) | 195 (20.9%) |
| $75,000 to $99,999 | 1,105 (13.3%) | 63 (6.7%) |
| $100,000 to $149,999 | 1,784 (21.5%) | 133 (14.2%) |
| $150,000 or more | 1,948 (23.4%) | 39 (4.2%) |
| Total | 8,311 (100.0%) | 935 (100.0%) |
Monthly Housing Cost Tiers in Leelanau County
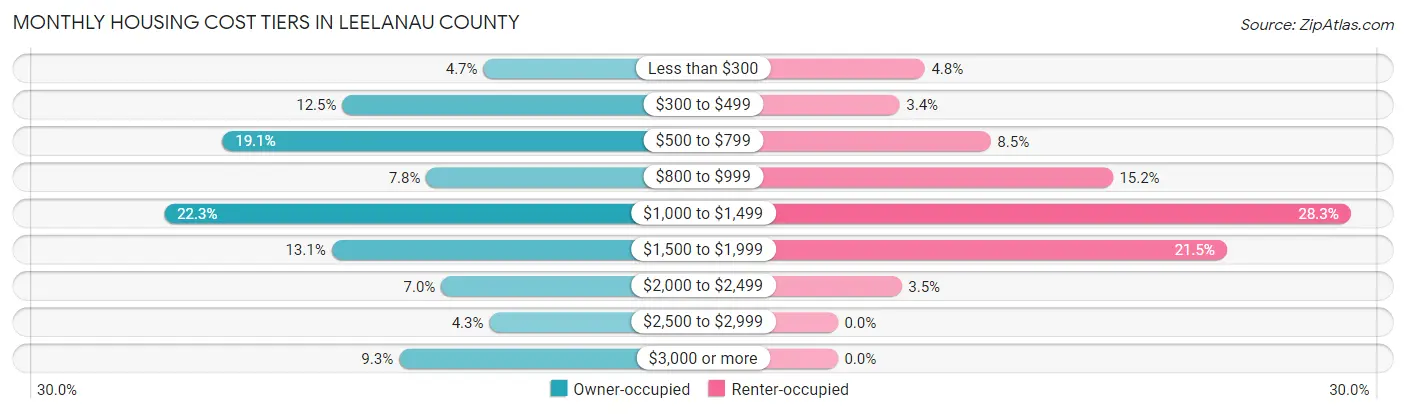
| Monthly Cost | Owner-occupied | Renter-occupied |
| Less than $300 | 387 (4.7%) | 45 (4.8%) |
| $300 to $499 | 1,035 (12.4%) | 32 (3.4%) |
| $500 to $799 | 1,586 (19.1%) | 79 (8.5%) |
| $800 to $999 | 649 (7.8%) | 142 (15.2%) |
| $1,000 to $1,499 | 1,853 (22.3%) | 265 (28.3%) |
| $1,500 to $1,999 | 1,085 (13.1%) | 201 (21.5%) |
| $2,000 to $2,499 | 581 (7.0%) | 33 (3.5%) |
| $2,500 to $2,999 | 360 (4.3%) | 0 (0.0%) |
| $3,000 or more | 775 (9.3%) | 0 (0.0%) |
| Total | 8,311 (100.0%) | 935 (100.0%) |
Physical Housing Characteristics in Leelanau County
Housing Structures in Leelanau County
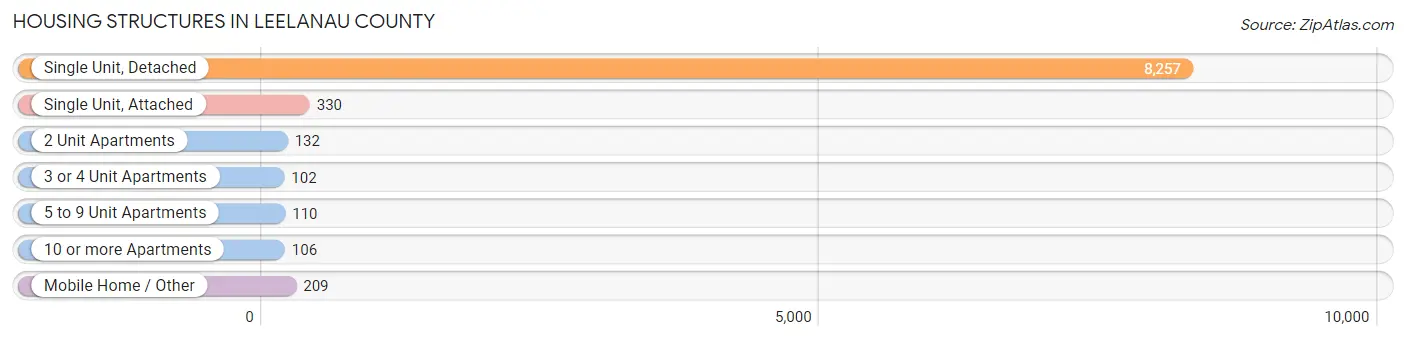
| Structure Type | # Housing Units | % Housing Units |
| Single Unit, Detached | 8,257 | 89.3% |
| Single Unit, Attached | 330 | 3.6% |
| 2 Unit Apartments | 132 | 1.4% |
| 3 or 4 Unit Apartments | 102 | 1.1% |
| 5 to 9 Unit Apartments | 110 | 1.2% |
| 10 or more Apartments | 106 | 1.1% |
| Mobile Home / Other | 209 | 2.3% |
| Total | 9,246 | 100.0% |
Housing Structures by Occupancy in Leelanau County
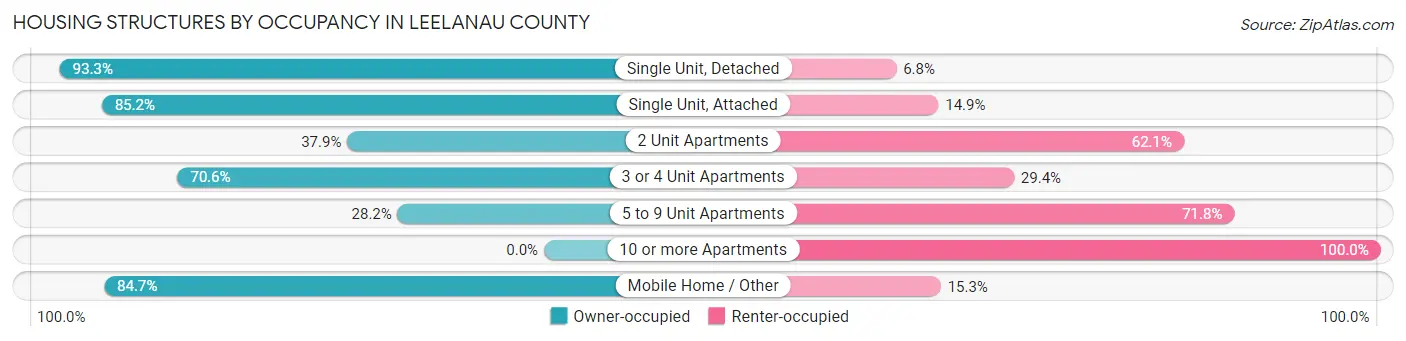
| Structure Type | Owner-occupied | Renter-occupied |
| Single Unit, Detached | 7,700 (93.2%) | 557 (6.8%) |
| Single Unit, Attached | 281 (85.2%) | 49 (14.8%) |
| 2 Unit Apartments | 50 (37.9%) | 82 (62.1%) |
| 3 or 4 Unit Apartments | 72 (70.6%) | 30 (29.4%) |
| 5 to 9 Unit Apartments | 31 (28.2%) | 79 (71.8%) |
| 10 or more Apartments | 0 (0.0%) | 106 (100.0%) |
| Mobile Home / Other | 177 (84.7%) | 32 (15.3%) |
| Total | 8,311 (89.9%) | 935 (10.1%) |
Housing Structures by Number of Rooms in Leelanau County
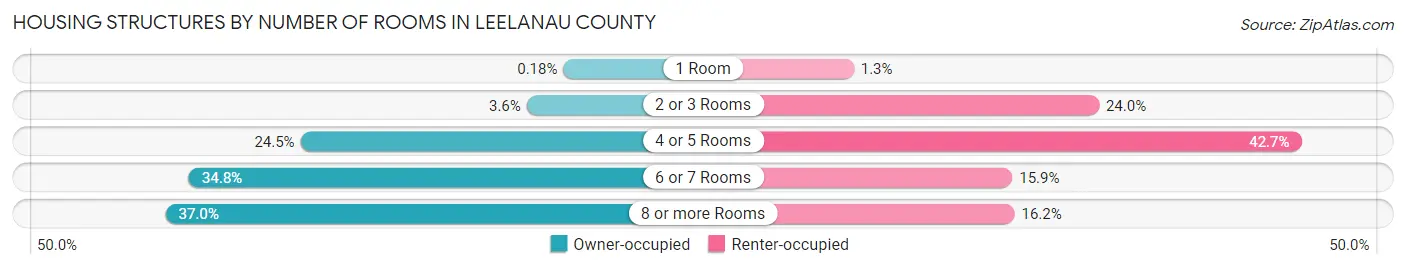
| Number of Rooms | Owner-occupied | Renter-occupied |
| 1 Room | 15 (0.2%) | 12 (1.3%) |
| 2 or 3 Rooms | 297 (3.6%) | 224 (24.0%) |
| 4 or 5 Rooms | 2,035 (24.5%) | 399 (42.7%) |
| 6 or 7 Rooms | 2,892 (34.8%) | 149 (15.9%) |
| 8 or more Rooms | 3,072 (37.0%) | 151 (16.2%) |
| Total | 8,311 (100.0%) | 935 (100.0%) |
Housing Structure by Heating Type in Leelanau County
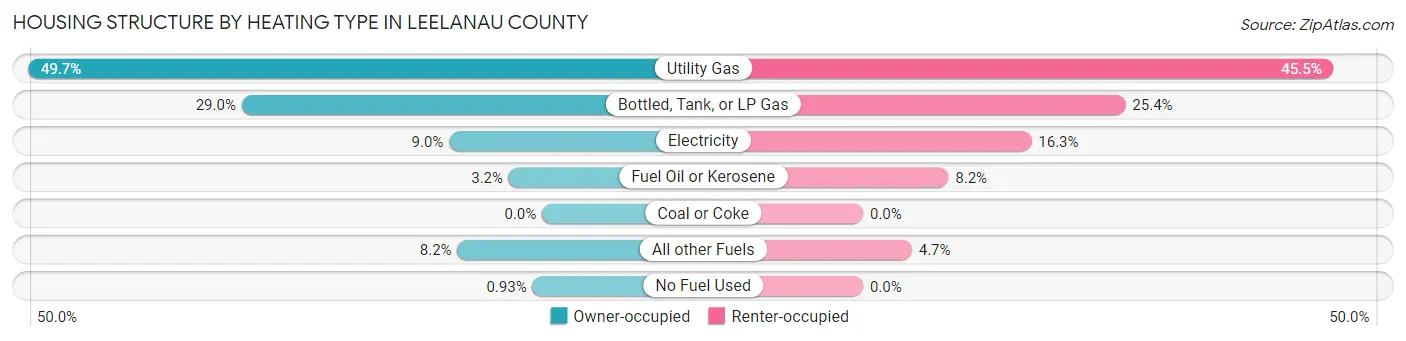
| Heating Type | Owner-occupied | Renter-occupied |
| Utility Gas | 4,129 (49.7%) | 425 (45.5%) |
| Bottled, Tank, or LP Gas | 2,412 (29.0%) | 237 (25.4%) |
| Electricity | 746 (9.0%) | 152 (16.3%) |
| Fuel Oil or Kerosene | 267 (3.2%) | 77 (8.2%) |
| Coal or Coke | 0 (0.0%) | 0 (0.0%) |
| All other Fuels | 680 (8.2%) | 44 (4.7%) |
| No Fuel Used | 77 (0.9%) | 0 (0.0%) |
| Total | 8,311 (100.0%) | 935 (100.0%) |
Household Vehicle Usage in Leelanau County
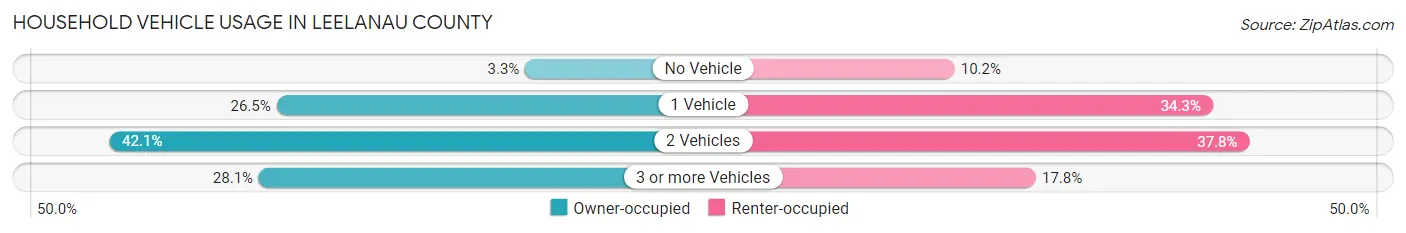
| Vehicles per Household | Owner-occupied | Renter-occupied |
| No Vehicle | 272 (3.3%) | 95 (10.2%) |
| 1 Vehicle | 2,201 (26.5%) | 321 (34.3%) |
| 2 Vehicles | 3,500 (42.1%) | 353 (37.8%) |
| 3 or more Vehicles | 2,338 (28.1%) | 166 (17.7%) |
| Total | 8,311 (100.0%) | 935 (100.0%) |
Real Estate & Mortgages in Leelanau County
Real Estate and Mortgage Overview in Leelanau County
| Characteristic | Without Mortgage | With Mortgage |
| Housing Units | 3,706 | 4,605 |
| Median Property Value | $391,100 | $357,200 |
| Median Household Income | $74,063 | $1,277 |
| Monthly Housing Costs | $584 | $744 |
| Real Estate Taxes | $2,887 | $69 |
Property Value by Mortgage Status in Leelanau County
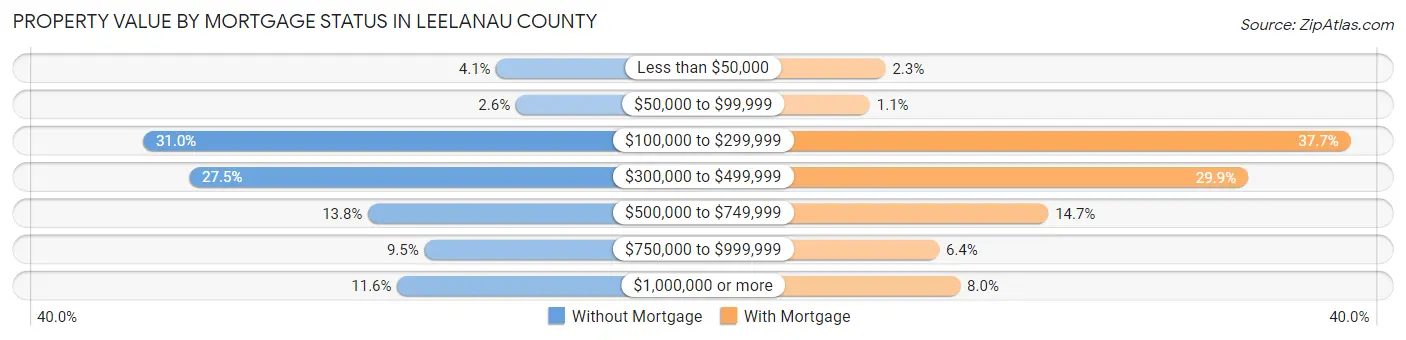
| Property Value | Without Mortgage | With Mortgage |
| Less than $50,000 | 150 (4.1%) | 105 (2.3%) |
| $50,000 to $99,999 | 95 (2.6%) | 50 (1.1%) |
| $100,000 to $299,999 | 1,148 (31.0%) | 1,737 (37.7%) |
| $300,000 to $499,999 | 1,018 (27.5%) | 1,377 (29.9%) |
| $500,000 to $749,999 | 512 (13.8%) | 676 (14.7%) |
| $750,000 to $999,999 | 353 (9.5%) | 293 (6.4%) |
| $1,000,000 or more | 430 (11.6%) | 367 (8.0%) |
| Total | 3,706 (100.0%) | 4,605 (100.0%) |
Household Income by Mortgage Status in Leelanau County
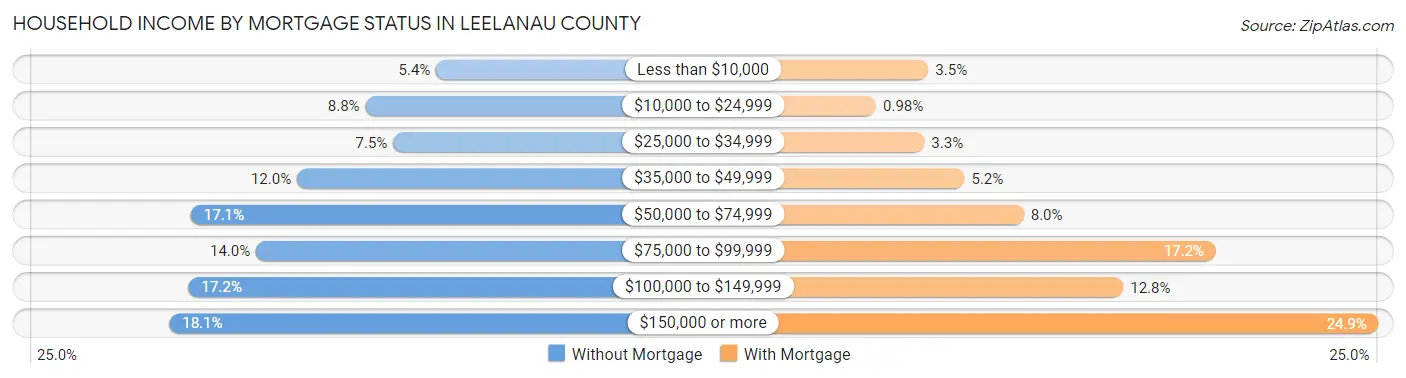
| Household Income | Without Mortgage | With Mortgage |
| Less than $10,000 | 200 (5.4%) | 160 (3.5%) |
| $10,000 to $24,999 | 325 (8.8%) | 45 (1.0%) |
| $25,000 to $34,999 | 276 (7.4%) | 151 (3.3%) |
| $35,000 to $49,999 | 446 (12.0%) | 239 (5.2%) |
| $50,000 to $74,999 | 633 (17.1%) | 369 (8.0%) |
| $75,000 to $99,999 | 518 (14.0%) | 790 (17.2%) |
| $100,000 to $149,999 | 637 (17.2%) | 587 (12.8%) |
| $150,000 or more | 671 (18.1%) | 1,147 (24.9%) |
| Total | 3,706 (100.0%) | 4,605 (100.0%) |
Property Value to Household Income Ratio in Leelanau County
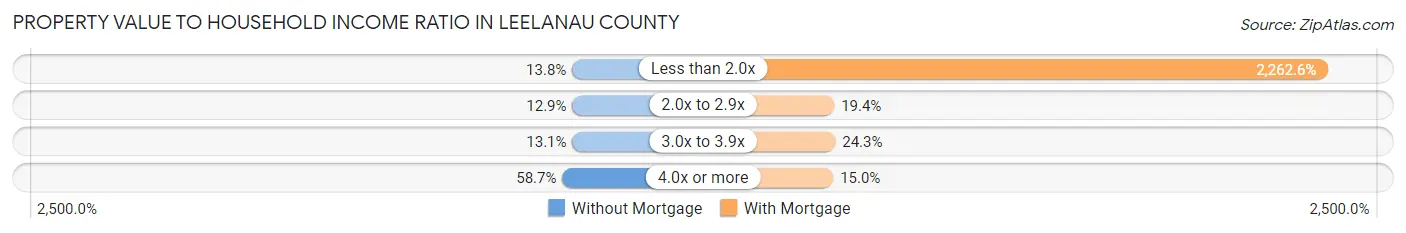
| Value-to-Income Ratio | Without Mortgage | With Mortgage |
| Less than 2.0x | 513 (13.8%) | 104,191 (2,262.6%) |
| 2.0x to 2.9x | 478 (12.9%) | 895 (19.4%) |
| 3.0x to 3.9x | 485 (13.1%) | 1,117 (24.3%) |
| 4.0x or more | 2,176 (58.7%) | 690 (15.0%) |
| Total | 3,706 (100.0%) | 4,605 (100.0%) |
Real Estate Taxes by Mortgage Status in Leelanau County
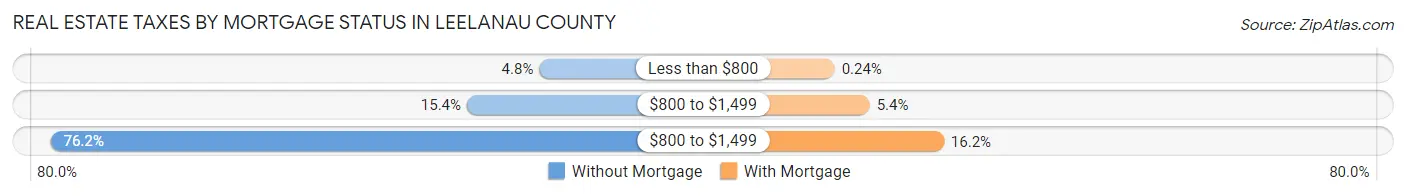
| Property Taxes | Without Mortgage | With Mortgage |
| Less than $800 | 178 (4.8%) | 11 (0.2%) |
| $800 to $1,499 | 570 (15.4%) | 247 (5.4%) |
| $800 to $1,499 | 2,824 (76.2%) | 746 (16.2%) |
| Total | 3,706 (100.0%) | 4,605 (100.0%) |
Health & Disability in Leelanau County
Health Insurance Coverage by Age in Leelanau County
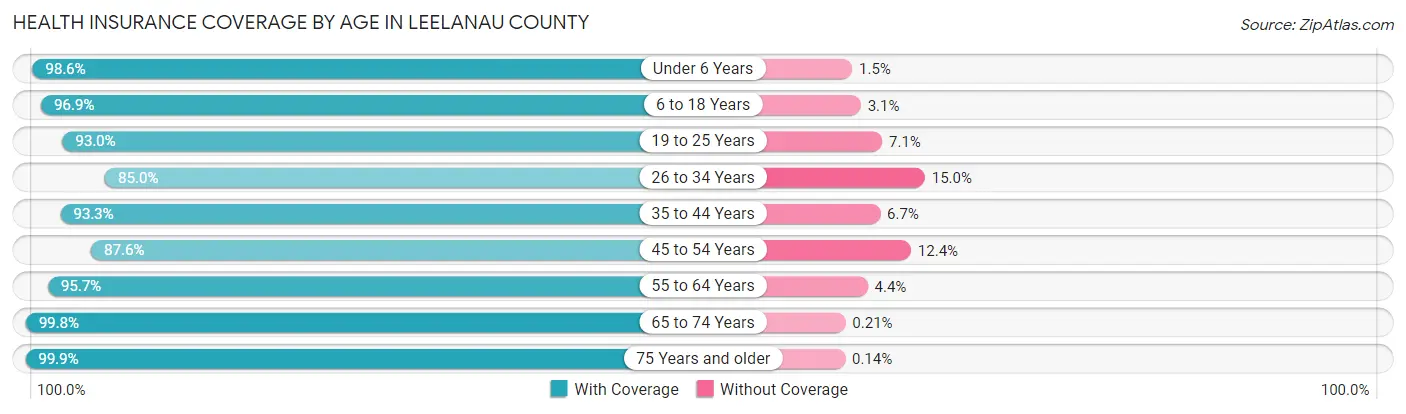
| Age Bracket | With Coverage | Without Coverage |
| Under 6 Years | 953 (98.6%) | 14 (1.5%) |
| 6 to 18 Years | 2,657 (96.9%) | 84 (3.1%) |
| 19 to 25 Years | 1,227 (92.9%) | 93 (7.0%) |
| 26 to 34 Years | 1,414 (85.0%) | 250 (15.0%) |
| 35 to 44 Years | 1,974 (93.3%) | 141 (6.7%) |
| 45 to 54 Years | 2,009 (87.6%) | 285 (12.4%) |
| 55 to 64 Years | 3,824 (95.7%) | 174 (4.3%) |
| 65 to 74 Years | 4,330 (99.8%) | 9 (0.2%) |
| 75 Years and older | 2,802 (99.9%) | 4 (0.1%) |
| Total | 21,190 (95.3%) | 1,054 (4.7%) |
Health Insurance Coverage by Citizenship Status in Leelanau County
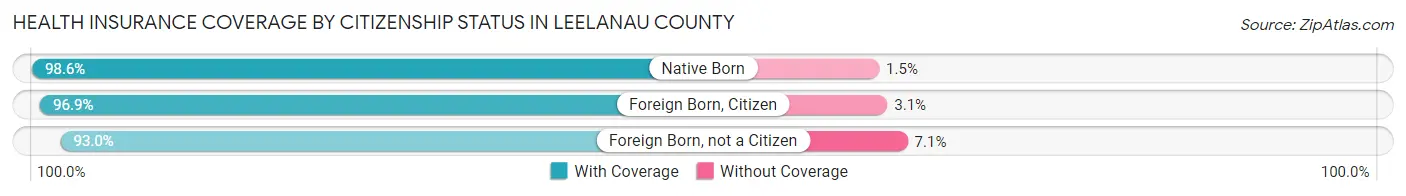
| Citizenship Status | With Coverage | Without Coverage |
| Native Born | 953 (98.6%) | 14 (1.5%) |
| Foreign Born, Citizen | 2,657 (96.9%) | 84 (3.1%) |
| Foreign Born, not a Citizen | 1,227 (92.9%) | 93 (7.0%) |
Health Insurance Coverage by Household Income in Leelanau County
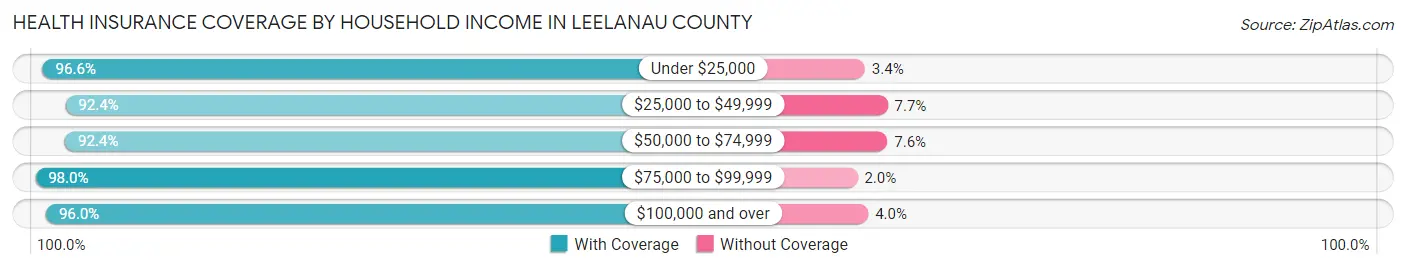
| Household Income | With Coverage | Without Coverage |
| Under $25,000 | 1,481 (96.6%) | 52 (3.4%) |
| $25,000 to $49,999 | 2,585 (92.3%) | 214 (7.6%) |
| $50,000 to $74,999 | 3,215 (92.4%) | 264 (7.6%) |
| $75,000 to $99,999 | 2,985 (98.0%) | 61 (2.0%) |
| $100,000 and over | 10,750 (96.0%) | 449 (4.0%) |
Public vs Private Health Insurance Coverage by Age in Leelanau County
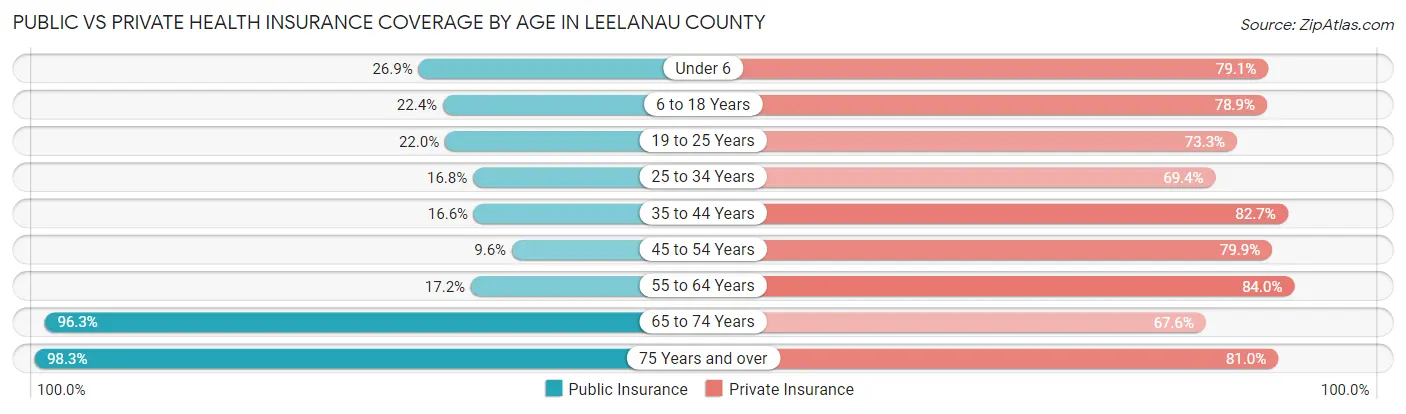
| Age Bracket | Public Insurance | Private Insurance |
| Under 6 | 260 (26.9%) | 765 (79.1%) |
| 6 to 18 Years | 613 (22.4%) | 2,162 (78.9%) |
| 19 to 25 Years | 290 (22.0%) | 968 (73.3%) |
| 25 to 34 Years | 279 (16.8%) | 1,154 (69.4%) |
| 35 to 44 Years | 351 (16.6%) | 1,750 (82.7%) |
| 45 to 54 Years | 219 (9.6%) | 1,832 (79.9%) |
| 55 to 64 Years | 686 (17.2%) | 3,357 (84.0%) |
| 65 to 74 Years | 4,179 (96.3%) | 2,931 (67.5%) |
| 75 Years and over | 2,757 (98.3%) | 2,272 (81.0%) |
| Total | 9,634 (43.3%) | 17,191 (77.3%) |
Disability Status by Sex by Age in Leelanau County
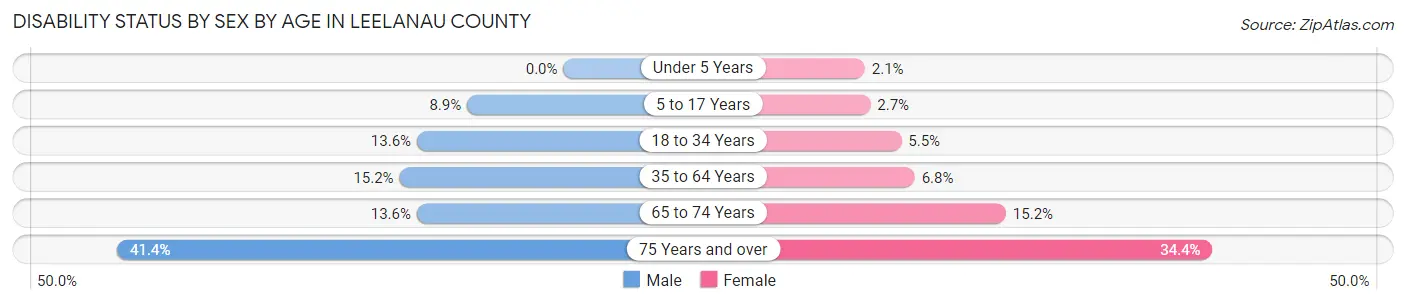
| Age Bracket | Male | Female |
| Under 5 Years | 0 (0.0%) | 9 (2.1%) |
| 5 to 17 Years | 127 (8.9%) | 34 (2.6%) |
| 18 to 34 Years | 221 (13.6%) | 87 (5.5%) |
| 35 to 64 Years | 634 (15.2%) | 287 (6.8%) |
| 65 to 74 Years | 290 (13.6%) | 336 (15.2%) |
| 75 Years and over | 560 (41.4%) | 500 (34.4%) |
Disability Class by Sex by Age in Leelanau County
Disability Class: Hearing Difficulty
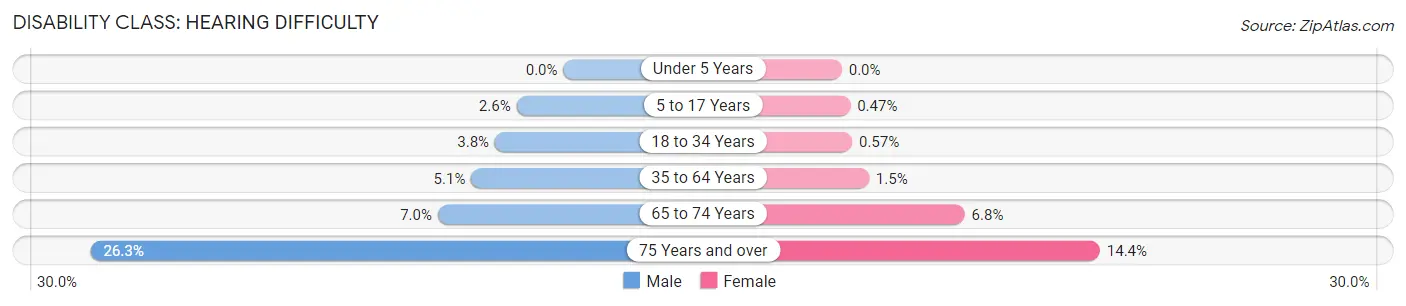
| Age Bracket | Male | Female |
| Under 5 Years | 0 (0.0%) | 0 (0.0%) |
| 5 to 17 Years | 37 (2.6%) | 6 (0.5%) |
| 18 to 34 Years | 62 (3.8%) | 9 (0.6%) |
| 35 to 64 Years | 214 (5.1%) | 64 (1.5%) |
| 65 to 74 Years | 149 (7.0%) | 151 (6.8%) |
| 75 Years and over | 356 (26.3%) | 209 (14.4%) |
Disability Class: Vision Difficulty
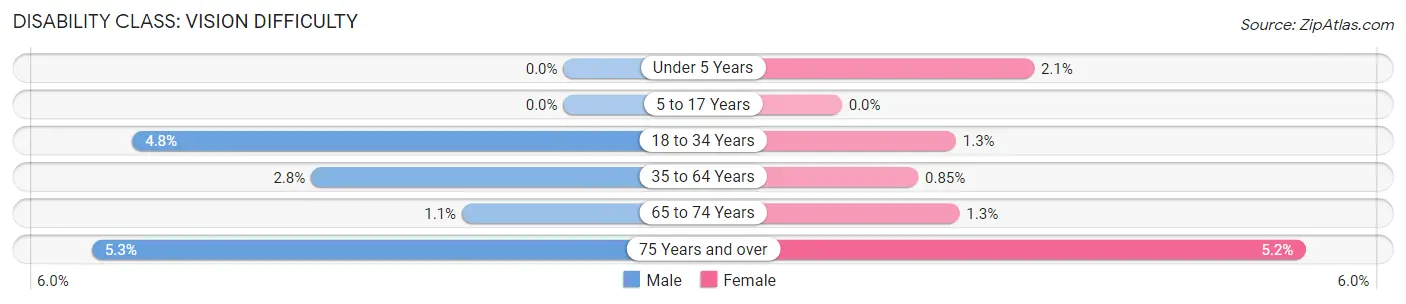
| Age Bracket | Male | Female |
| Under 5 Years | 0 (0.0%) | 9 (2.1%) |
| 5 to 17 Years | 0 (0.0%) | 0 (0.0%) |
| 18 to 34 Years | 78 (4.8%) | 20 (1.3%) |
| 35 to 64 Years | 117 (2.8%) | 36 (0.9%) |
| 65 to 74 Years | 24 (1.1%) | 29 (1.3%) |
| 75 Years and over | 71 (5.2%) | 75 (5.2%) |
Disability Class: Cognitive Difficulty
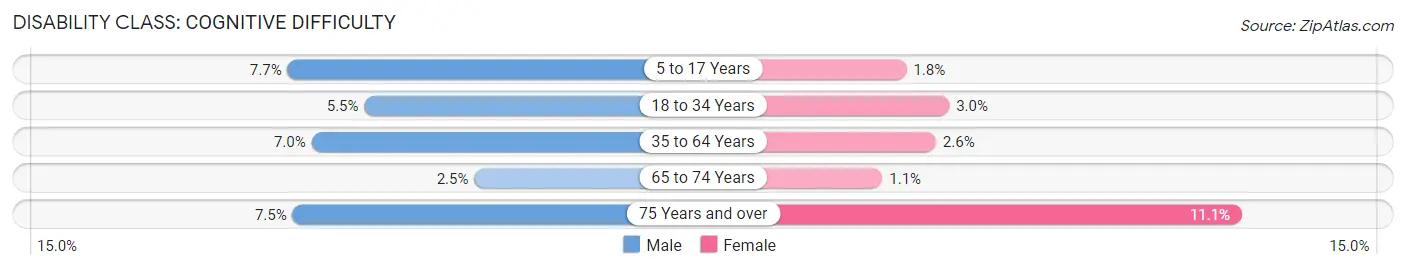
| Age Bracket | Male | Female |
| 5 to 17 Years | 109 (7.7%) | 23 (1.8%) |
| 18 to 34 Years | 90 (5.5%) | 47 (3.0%) |
| 35 to 64 Years | 292 (7.0%) | 111 (2.6%) |
| 65 to 74 Years | 53 (2.5%) | 25 (1.1%) |
| 75 Years and over | 102 (7.5%) | 162 (11.1%) |
Disability Class: Ambulatory Difficulty
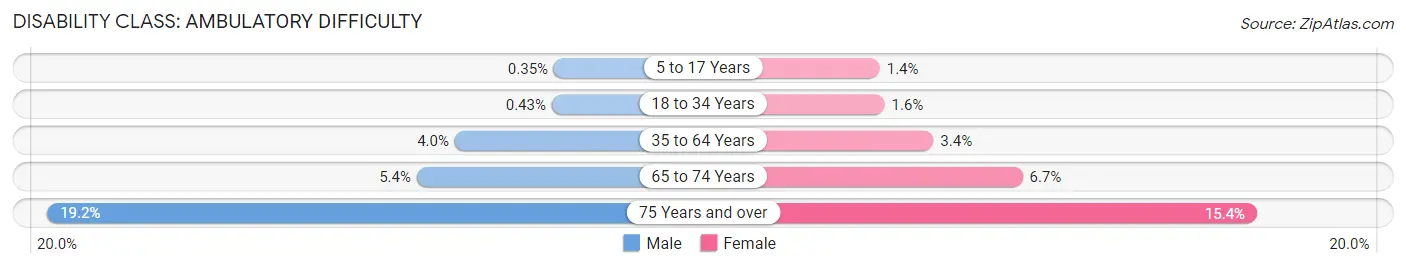
| Age Bracket | Male | Female |
| 5 to 17 Years | 5 (0.4%) | 18 (1.4%) |
| 18 to 34 Years | 7 (0.4%) | 25 (1.6%) |
| 35 to 64 Years | 168 (4.0%) | 144 (3.4%) |
| 65 to 74 Years | 116 (5.4%) | 148 (6.7%) |
| 75 Years and over | 259 (19.2%) | 224 (15.4%) |
Disability Class: Self-Care Difficulty
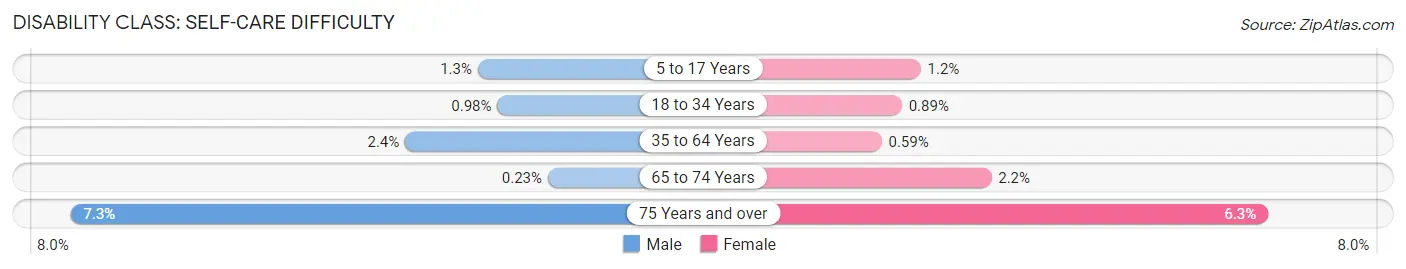
| Age Bracket | Male | Female |
| 5 to 17 Years | 18 (1.3%) | 15 (1.2%) |
| 18 to 34 Years | 16 (1.0%) | 14 (0.9%) |
| 35 to 64 Years | 98 (2.4%) | 25 (0.6%) |
| 65 to 74 Years | 5 (0.2%) | 49 (2.2%) |
| 75 Years and over | 99 (7.3%) | 92 (6.3%) |
Technology Access in Leelanau County
Computing Device Access in Leelanau County
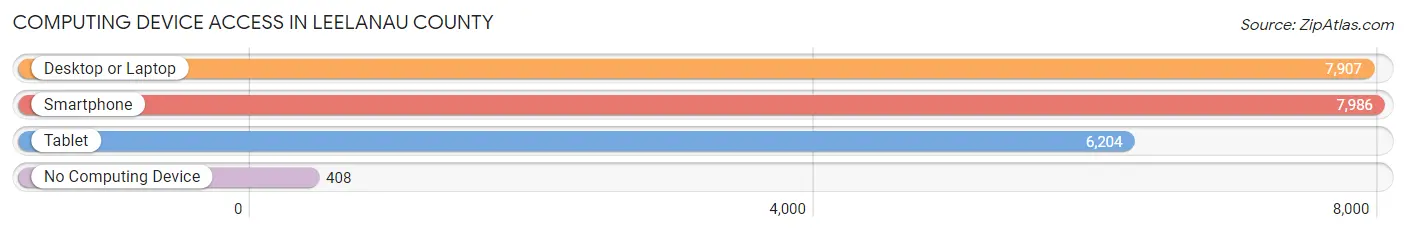
| Device Type | # Households | % Households |
| Desktop or Laptop | 7,907 | 85.5% |
| Smartphone | 7,986 | 86.4% |
| Tablet | 6,204 | 67.1% |
| No Computing Device | 408 | 4.4% |
| Total | 9,246 | 100.0% |
Internet Access in Leelanau County
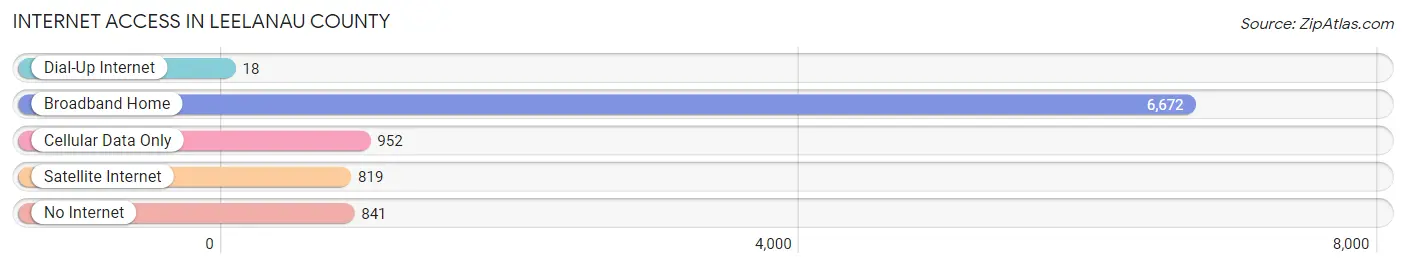
| Internet Type | # Households | % Households |
| Dial-Up Internet | 18 | 0.2% |
| Broadband Home | 6,672 | 72.2% |
| Cellular Data Only | 952 | 10.3% |
| Satellite Internet | 819 | 8.9% |
| No Internet | 841 | 9.1% |
| Total | 9,246 | 100.0% |
Leelanau County Summary
Leelanau County is a county located in the U.S. state of Michigan. As of the 2010 census, the population was 21,119. The county seat is Leland. The county is situated in the northwest part of the Lower Peninsula of Michigan, and is bounded by Lake Michigan to the west, Grand Traverse Bay to the east, and Grand Traverse County to the south.
History
Leelanau County was formed in 1863 from parts of Grand Traverse County. It was named after the Leelanau Peninsula, which is derived from an Ojibwe term meaning "land of delight." The county was originally inhabited by the Ojibwe people, who were the first to settle in the area.
The first European settlers arrived in the area in the early 1800s. The first permanent settlement was established in 1848 by a group of French-Canadian fur traders. The county was officially organized in 1863, and the first county seat was established in Leland.
Geography
Leelanau County is located in the northwest part of the Lower Peninsula of Michigan. It is bounded by Lake Michigan to the west, Grand Traverse Bay to the east, and Grand Traverse County to the south. The county has a total area of 1,092 square miles, of which 1,072 square miles is land and 20 square miles is water.
The county is home to several lakes, including Lake Leelanau, North Lake Leelanau, South Lake Leelanau, and Lake Michigan. The county also contains several islands, including North and South Manitou Islands, and the Sleeping Bear Dunes National Lakeshore.
Economy
The economy of Leelanau County is largely based on tourism and agriculture. The county is home to several wineries, and is known for its production of cherries, apples, and other fruits. The county also has a thriving fishing industry, and is home to several marinas and boat launches.
The county is also home to several resorts and hotels, as well as several golf courses. The county is also home to several state parks, including the Sleeping Bear Dunes National Lakeshore.
Demographics
As of the 2010 census, there were 21,119 people, 8,845 households, and 5,945 families residing in the county. The population density was 19.6 people per square mile. There were 10,945 housing units at an average density of 10.2 per square mile.
The racial makeup of the county was 95.2% White, 0.7% Black or African American, 0.7% Native American, 0.5% Asian, 0.1% Pacific Islander, 1.3% from other races, and 1.5% from two or more races. Hispanic or Latino of any race were 3.2% of the population.
The median income for a household in the county was $45,945, and the median income for a family was $54,945. The per capita income for the county was $25,945. About 8.2% of families and 11.2% of the population were below the poverty line, including 15.2% of those under age 18 and 6.2% of those age 65 or over.
Common Questions
What is Per Capita Income in Leelanau County?
Per Capita income in Leelanau County is $48,491.
What is the Median Family Income in Leelanau County?
Median Family Income in Leelanau County is $101,453.
What is the Median Household income in Leelanau County?
Median Household Income in Leelanau County is $82,345.
What is Income or Wage Gap in Leelanau County?
Income or Wage Gap in Leelanau County is 28.0%.
Women in Leelanau County earn 72.0 cents for every dollar earned by a man.
What is Family Income Deficit in Leelanau County?
Family Income Deficit in Leelanau County is $10,327.
Families that are below poverty line in Leelanau County earn $10,327 less on average than the poverty threshold level.
What is Inequality or Gini Index in Leelanau County?
Inequality or Gini Index in Leelanau County is 0.46.
What is the Total Population of Leelanau County?
Total Population of Leelanau County is 22,426.
What is the Total Male Population of Leelanau County?
Total Male Population of Leelanau County is 11,155.
What is the Total Female Population of Leelanau County?
Total Female Population of Leelanau County is 11,271.
What is the Ratio of Males per 100 Females in Leelanau County?
There are 98.97 Males per 100 Females in Leelanau County.
What is the Ratio of Females per 100 Males in Leelanau County?
There are 101.04 Females per 100 Males in Leelanau County.
What is the Median Population Age in Leelanau County?
Median Population Age in Leelanau County is 55.2 Years.
What is the Average Family Size in Leelanau County
Average Family Size in Leelanau County is 2.8 People.
What is the Average Household Size in Leelanau County
Average Household Size in Leelanau County is 2.4 People.
How Large is the Labor Force in Leelanau County?
There are 10,051 People in the Labor Forcein in Leelanau County.
What is the Percentage of People in the Labor Force in Leelanau County?
51.8% of People are in the Labor Force in Leelanau County.
What is the Unemployment Rate in Leelanau County?
Unemployment Rate in Leelanau County is 3.2%.