Lake County, MI Map & Demographics
Lake County Map
Lake County Overview
$25,695
PER CAPITA INCOME
$59,741
AVG FAMILY INCOME
$45,946
AVG HOUSEHOLD INCOME
21.4%
WAGE / INCOME GAP [ % ]
78.6¢/ $1
WAGE / INCOME GAP [ $ ]
$9,455
FAMILY INCOME DEFICIT
0.45
INEQUALITY / GINI INDEX
12,285
TOTAL POPULATION
6,753
MALE POPULATION
5,532
FEMALE POPULATION
122.07
MALES / 100 FEMALES
81.92
FEMALES / 100 MALES
51.8
MEDIAN AGE
3.6
AVG FAMILY SIZE
2.6
AVG HOUSEHOLD SIZE
4,366
LABOR FORCE [ PEOPLE ]
41.0%
PERCENT IN LABOR FORCE
7.5%
UNEMPLOYMENT RATE
Lake County Area Codes
Income in Lake County
Income Overview in Lake County
Per Capita Income in Lake County is $25,695, while median incomes of families and households are $59,741 and $45,946 respectively.
| Characteristic | Number | Measure |
| Per Capita Income | 12,285 | $25,695 |
| Median Family Income | 2,491 | $59,741 |
| Mean Family Income | 2,491 | $75,114 |
| Median Household Income | 4,549 | $45,946 |
| Mean Household Income | 4,549 | $58,943 |
| Income Deficit | 2,491 | $9,455 |
| Wage / Income Gap (%) | 12,285 | 21.43% |
| Wage / Income Gap ($) | 12,285 | 78.57¢ per $1 |
| Gini / Inequality Index | 12,285 | 0.45 |
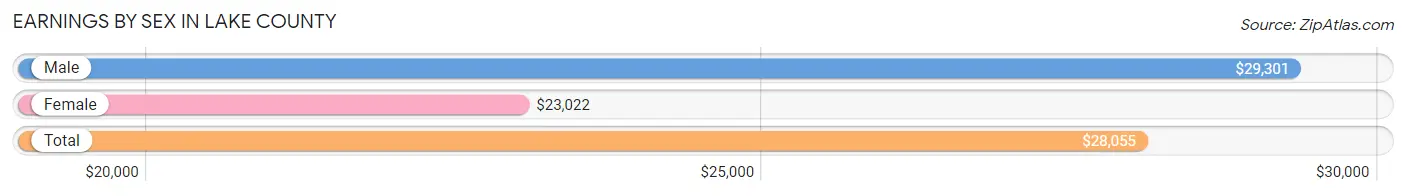
Earnings by Sex in Lake County
Average Earnings in Lake County are $28,055, $29,301 for men and $23,022 for women, a difference of 21.4%.
| Sex | Number | Average Earnings |
| Male | 2,773 (57.8%) | $29,301 |
| Female | 2,026 (42.2%) | $23,022 |
| Total | 4,799 (100.0%) | $28,055 |
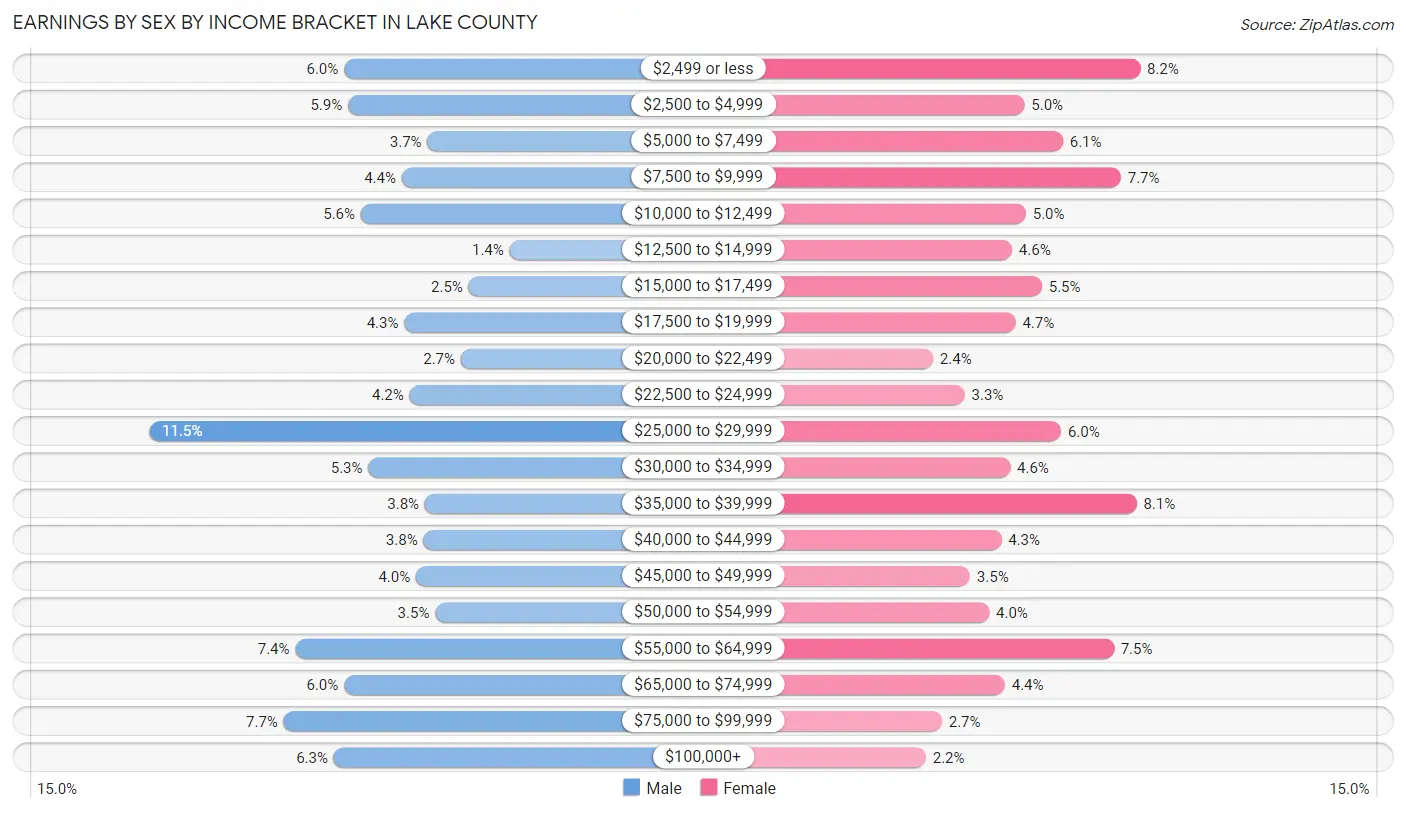
Earnings by Sex by Income Bracket in Lake County
The most common earnings brackets in Lake County are $25,000 to $29,999 for men (319 | 11.5%) and $2,499 or less for women (167 | 8.2%).
| Income | Male | Female |
| $2,499 or less | 167 (6.0%) | 167 (8.2%) |
| $2,500 to $4,999 | 164 (5.9%) | 101 (5.0%) |
| $5,000 to $7,499 | 102 (3.7%) | 123 (6.1%) |
| $7,500 to $9,999 | 122 (4.4%) | 156 (7.7%) |
| $10,000 to $12,499 | 154 (5.6%) | 102 (5.0%) |
| $12,500 to $14,999 | 38 (1.4%) | 94 (4.6%) |
| $15,000 to $17,499 | 70 (2.5%) | 111 (5.5%) |
| $17,500 to $19,999 | 120 (4.3%) | 96 (4.7%) |
| $20,000 to $22,499 | 76 (2.7%) | 49 (2.4%) |
| $22,500 to $24,999 | 116 (4.2%) | 67 (3.3%) |
| $25,000 to $29,999 | 319 (11.5%) | 122 (6.0%) |
| $30,000 to $34,999 | 148 (5.3%) | 93 (4.6%) |
| $35,000 to $39,999 | 104 (3.7%) | 165 (8.1%) |
| $40,000 to $44,999 | 105 (3.8%) | 88 (4.3%) |
| $45,000 to $49,999 | 111 (4.0%) | 70 (3.5%) |
| $50,000 to $54,999 | 96 (3.5%) | 81 (4.0%) |
| $55,000 to $64,999 | 205 (7.4%) | 152 (7.5%) |
| $65,000 to $74,999 | 167 (6.0%) | 90 (4.4%) |
| $75,000 to $99,999 | 214 (7.7%) | 54 (2.7%) |
| $100,000+ | 175 (6.3%) | 45 (2.2%) |
| Total | 2,773 (100.0%) | 2,026 (100.0%) |
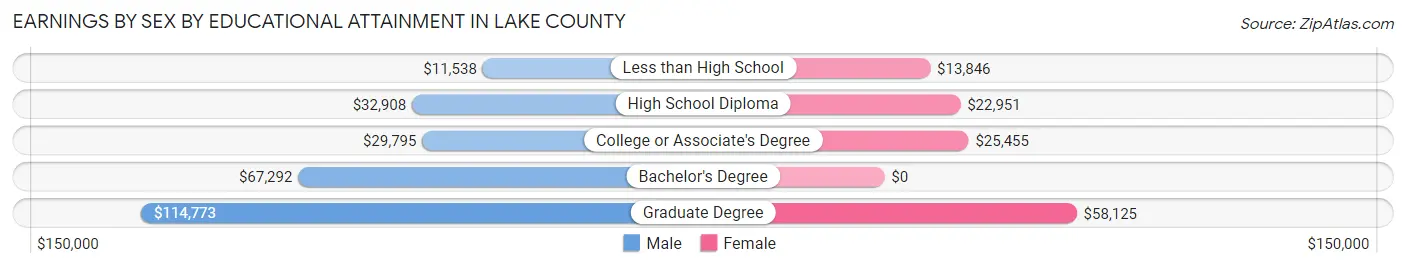
Earnings by Sex by Educational Attainment in Lake County
Average earnings in Lake County are $33,138 for men and $24,925 for women, a difference of 24.8%. Men with an educational attainment of graduate degree enjoy the highest average annual earnings of $114,773, while those with less than high school education earn the least with $11,538. Women with an educational attainment of graduate degree earn the most with the average annual earnings of $58,125, while those with less than high school education have the smallest earnings of $13,846.
| Educational Attainment | Male Income | Female Income |
| Less than High School | $11,538 | $13,846 |
| High School Diploma | $32,908 | $22,951 |
| College or Associate's Degree | $29,795 | $25,455 |
| Bachelor's Degree | $67,292 | $0 |
| Graduate Degree | $114,773 | $58,125 |
| Total | $33,138 | $24,925 |
Family Income in Lake County
Family Income Brackets in Lake County
According to the Lake County family income data, there are 673 families falling into the $50,000 to $74,999 income range, which is the most common income bracket and makes up 27.0% of all families. Conversely, the $10,000 to $14,999 income bracket is the least frequent group with only 60 families (2.4%) belonging to this category.
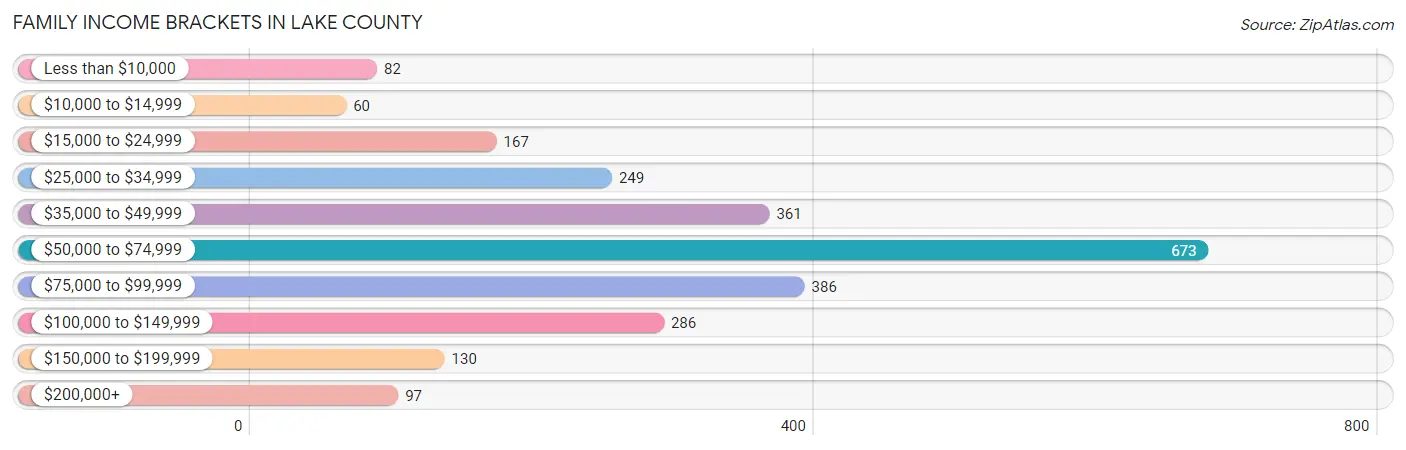
| Income Bracket | # Families | % Families |
| Less than $10,000 | 82 | 3.3% |
| $10,000 to $14,999 | 60 | 2.4% |
| $15,000 to $24,999 | 167 | 6.7% |
| $25,000 to $34,999 | 249 | 10.0% |
| $35,000 to $49,999 | 361 | 14.5% |
| $50,000 to $74,999 | 673 | 27.0% |
| $75,000 to $99,999 | 386 | 15.5% |
| $100,000 to $149,999 | 286 | 11.5% |
| $150,000 to $199,999 | 130 | 5.2% |
| $200,000+ | 97 | 3.9% |
Family Income by Famaliy Size in Lake County
7+ person families (33 | 1.3%) account for the highest median family income in Lake County with $69,375 per family, while 2-person families (1,665 | 66.8%) have the highest median income of $29,160 per family member.
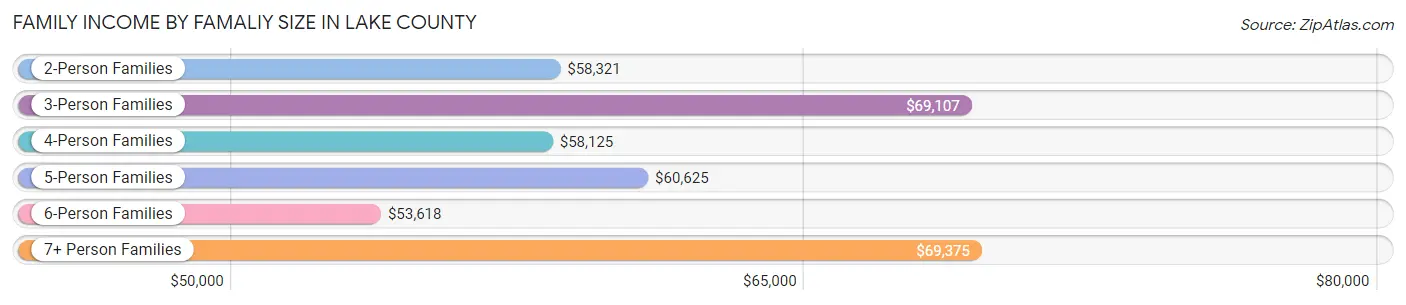
| Income Bracket | # Families | Median Income |
| 2-Person Families | 1,665 (66.8%) | $58,321 |
| 3-Person Families | 347 (13.9%) | $69,107 |
| 4-Person Families | 239 (9.6%) | $58,125 |
| 5-Person Families | 132 (5.3%) | $60,625 |
| 6-Person Families | 75 (3.0%) | $53,618 |
| 7+ Person Families | 33 (1.3%) | $69,375 |
| Total | 2,491 (100.0%) | $59,741 |
Family Income by Number of Earners in Lake County
The median family income in Lake County is $59,741, with families comprising 3+ earners (145) having the highest median family income of $134,750, while families with no earners (867) have the lowest median family income of $49,097, accounting for 5.8% and 34.8% of families, respectively.
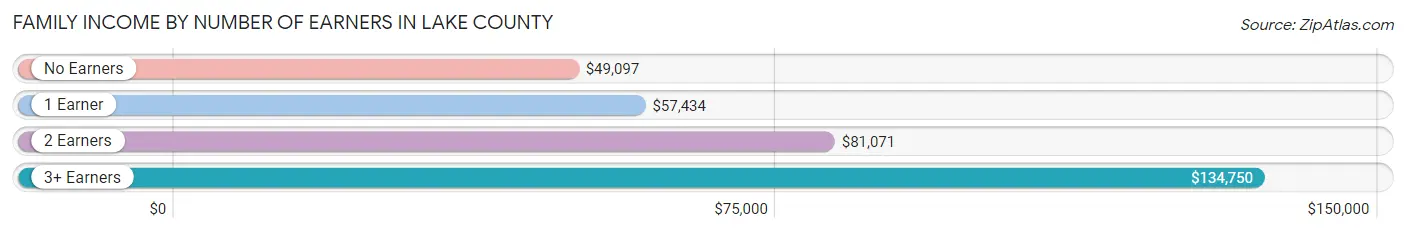
| Number of Earners | # Families | Median Income |
| No Earners | 867 (34.8%) | $49,097 |
| 1 Earner | 751 (30.1%) | $57,434 |
| 2 Earners | 728 (29.2%) | $81,071 |
| 3+ Earners | 145 (5.8%) | $134,750 |
| Total | 2,491 (100.0%) | $59,741 |
Household Income in Lake County
Household Income Brackets in Lake County
With 964 households falling in the category, the $50,000 to $74,999 income range is the most frequent in Lake County, accounting for 21.2% of all households. In contrast, only 105 households (2.3%) fall into the $200,000+ income bracket, making it the least populous group.
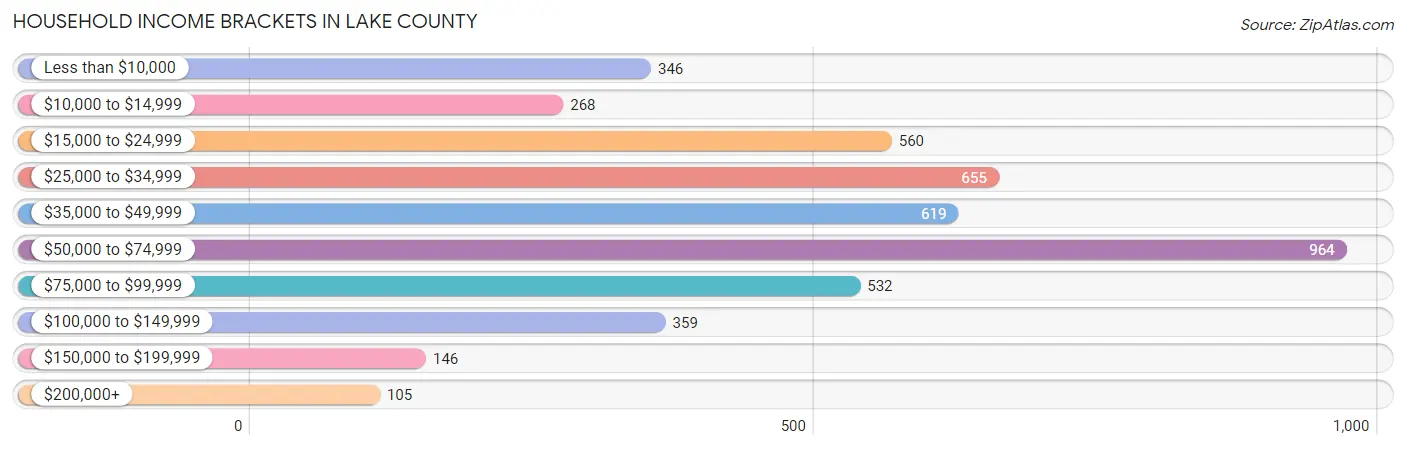
| Income Bracket | # Households | % Households |
| Less than $10,000 | 346 | 7.6% |
| $10,000 to $14,999 | 268 | 5.9% |
| $15,000 to $24,999 | 560 | 12.3% |
| $25,000 to $34,999 | 655 | 14.4% |
| $35,000 to $49,999 | 619 | 13.6% |
| $50,000 to $74,999 | 964 | 21.2% |
| $75,000 to $99,999 | 532 | 11.7% |
| $100,000 to $149,999 | 359 | 7.9% |
| $150,000 to $199,999 | 146 | 3.2% |
| $200,000+ | 105 | 2.3% |
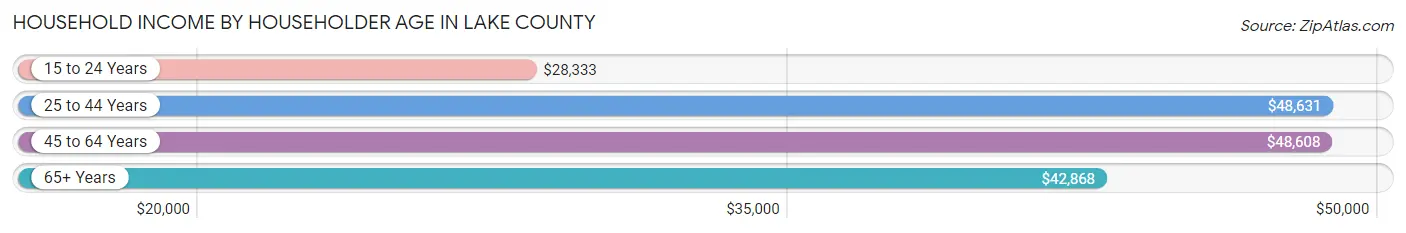
Household Income by Householder Age in Lake County
The median household income in Lake County is $45,946, with the highest median household income of $48,631 found in the 25 to 44 years age bracket for the primary householder. A total of 685 households (15.1%) fall into this category. Meanwhile, the 15 to 24 years age bracket for the primary householder has the lowest median household income of $28,333, with 68 households (1.5%) in this group.
| Income Bracket | # Households | Median Income |
| 15 to 24 Years | 68 (1.5%) | $28,333 |
| 25 to 44 Years | 685 (15.1%) | $48,631 |
| 45 to 64 Years | 1,871 (41.1%) | $48,608 |
| 65+ Years | 1,925 (42.3%) | $42,868 |
| Total | 4,549 (100.0%) | $45,946 |
Poverty in Lake County
Income Below Poverty by Sex and Age in Lake County
With 20.9% poverty level for males and 19.6% for females among the residents of Lake County, 25 to 34 year old males and 12 to 14 year old females are the most vulnerable to poverty, with 276 males (45.0%) and 67 females (42.9%) in their respective age groups living below the poverty level.
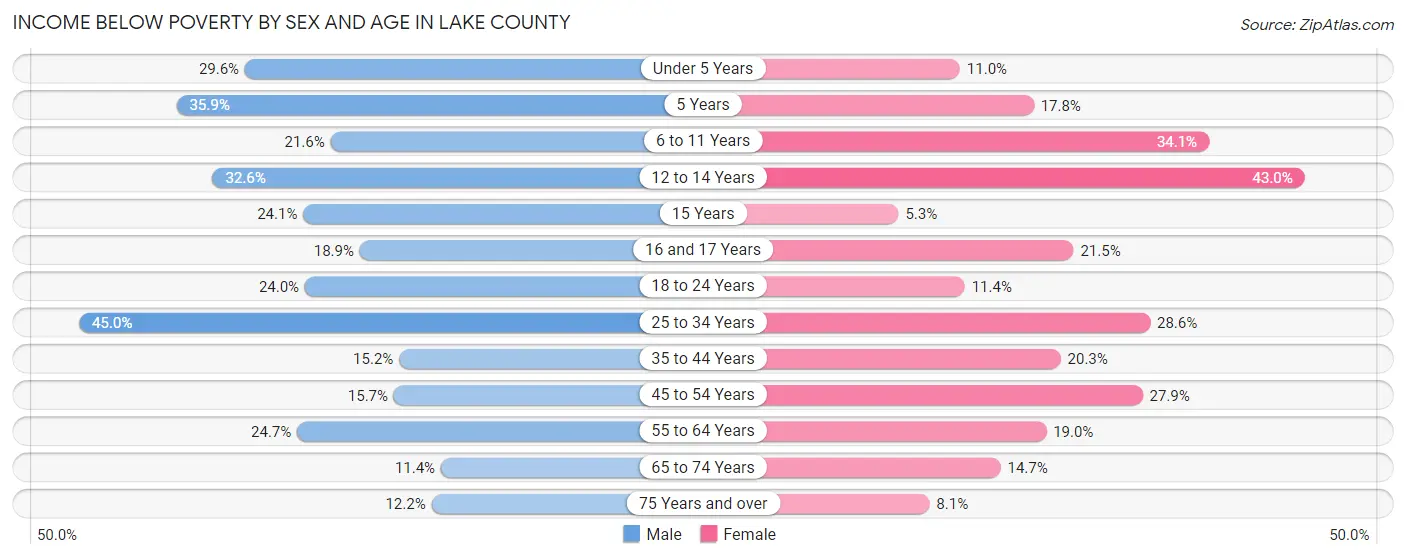
| Age Bracket | Male | Female |
| Under 5 Years | 73 (29.5%) | 24 (11.0%) |
| 5 Years | 14 (35.9%) | 13 (17.8%) |
| 6 to 11 Years | 67 (21.6%) | 92 (34.1%) |
| 12 to 14 Years | 56 (32.6%) | 67 (42.9%) |
| 15 Years | 21 (24.1%) | 2 (5.3%) |
| 16 and 17 Years | 17 (18.9%) | 23 (21.5%) |
| 18 to 24 Years | 106 (24.0%) | 38 (11.4%) |
| 25 to 34 Years | 276 (45.0%) | 121 (28.6%) |
| 35 to 44 Years | 112 (15.2%) | 105 (20.3%) |
| 45 to 54 Years | 143 (15.7%) | 182 (27.9%) |
| 55 to 64 Years | 276 (24.7%) | 206 (19.0%) |
| 65 to 74 Years | 131 (11.4%) | 143 (14.7%) |
| 75 Years and over | 77 (12.2%) | 49 (8.1%) |
| Total | 1,369 (20.9%) | 1,065 (19.6%) |
Income Above Poverty by Sex and Age in Lake County
According to the poverty statistics in Lake County, males aged 65 to 74 years and females aged 15 years are the age groups that are most secure financially, with 88.6% of males and 94.7% of females in these age groups living above the poverty line.
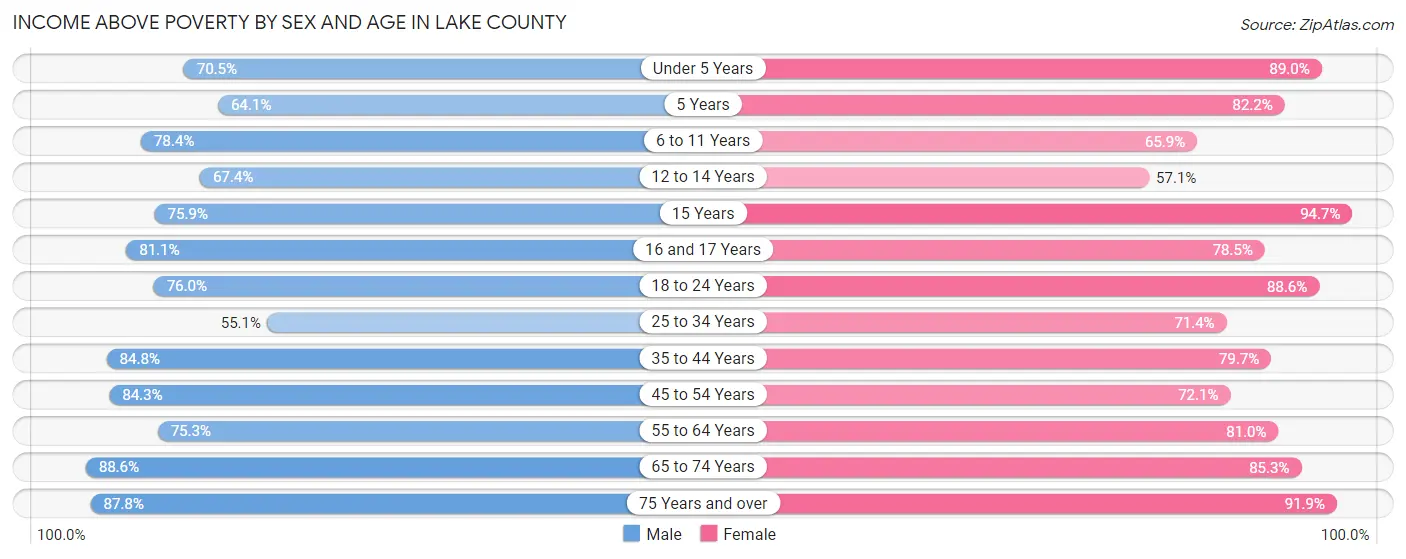
| Age Bracket | Male | Female |
| Under 5 Years | 174 (70.5%) | 195 (89.0%) |
| 5 Years | 25 (64.1%) | 60 (82.2%) |
| 6 to 11 Years | 243 (78.4%) | 178 (65.9%) |
| 12 to 14 Years | 116 (67.4%) | 89 (57.1%) |
| 15 Years | 66 (75.9%) | 36 (94.7%) |
| 16 and 17 Years | 73 (81.1%) | 84 (78.5%) |
| 18 to 24 Years | 336 (76.0%) | 295 (88.6%) |
| 25 to 34 Years | 338 (55.0%) | 302 (71.4%) |
| 35 to 44 Years | 623 (84.8%) | 412 (79.7%) |
| 45 to 54 Years | 766 (84.3%) | 470 (72.1%) |
| 55 to 64 Years | 841 (75.3%) | 880 (81.0%) |
| 65 to 74 Years | 1,022 (88.6%) | 828 (85.3%) |
| 75 Years and over | 552 (87.8%) | 554 (91.9%) |
| Total | 5,175 (79.1%) | 4,383 (80.4%) |
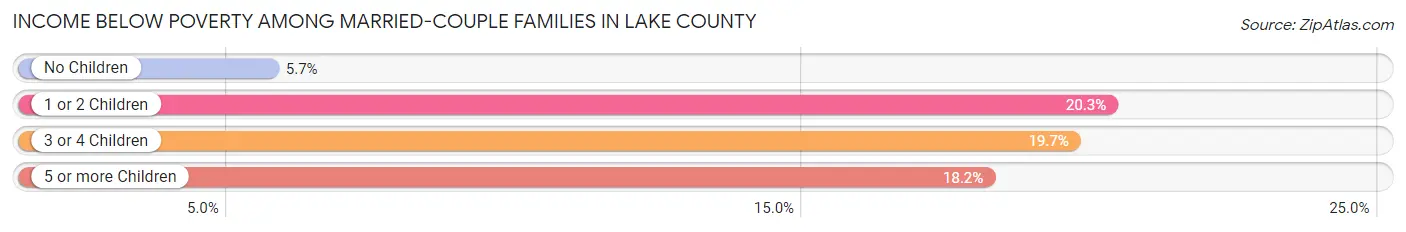
Income Below Poverty Among Married-Couple Families in Lake County
The poverty statistics for married-couple families in Lake County show that 8.9% or 182 of the total 2,049 families live below the poverty line. Families with 1 or 2 children have the highest poverty rate of 20.3%, comprising of 63 families. On the other hand, families with no children have the lowest poverty rate of 5.7%, which includes 91 families.
| Children | Above Poverty | Below Poverty |
| No Children | 1,504 (94.3%) | 91 (5.7%) |
| 1 or 2 Children | 247 (79.7%) | 63 (20.3%) |
| 3 or 4 Children | 98 (80.3%) | 24 (19.7%) |
| 5 or more Children | 18 (81.8%) | 4 (18.2%) |
| Total | 1,867 (91.1%) | 182 (8.9%) |
Income Below Poverty Among Single-Parent Households in Lake County
According to the poverty data in Lake County, 26.5% or 48 single-father households and 20.7% or 54 single-mother households are living below the poverty line. Among single-father households, those with 1 or 2 children have the highest poverty rate, with 32 households (45.1%) experiencing poverty. Likewise, among single-mother households, those with 5 or more children have the highest poverty rate, with 5 households (71.4%) falling below the poverty line.
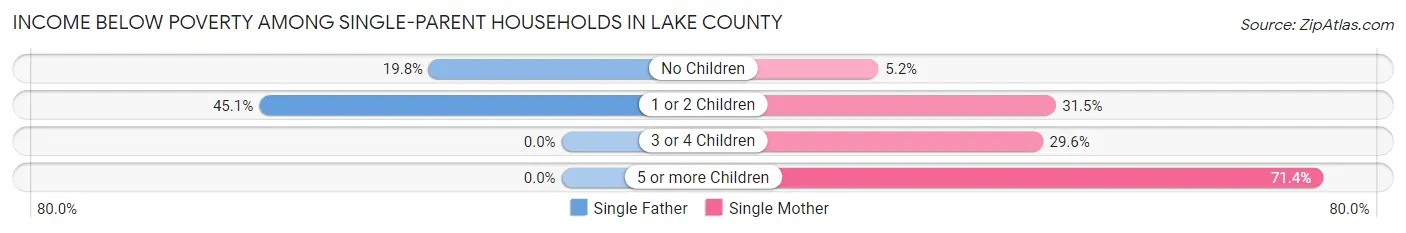
| Children | Single Father | Single Mother |
| No Children | 16 (19.8%) | 6 (5.2%) |
| 1 or 2 Children | 32 (45.1%) | 35 (31.5%) |
| 3 or 4 Children | 0 (0.0%) | 8 (29.6%) |
| 5 or more Children | 0 (0.0%) | 5 (71.4%) |
| Total | 48 (26.5%) | 54 (20.7%) |
Income Below Poverty Among Married-Couple vs Single-Parent Households in Lake County
The poverty data for Lake County shows that 182 of the married-couple family households (8.9%) and 102 of the single-parent households (23.1%) are living below the poverty level. Within the married-couple family households, those with 1 or 2 children have the highest poverty rate, with 63 households (20.3%) falling below the poverty line. Among the single-parent households, those with 5 or more children have the highest poverty rate, with 5 household (71.4%) living below poverty.
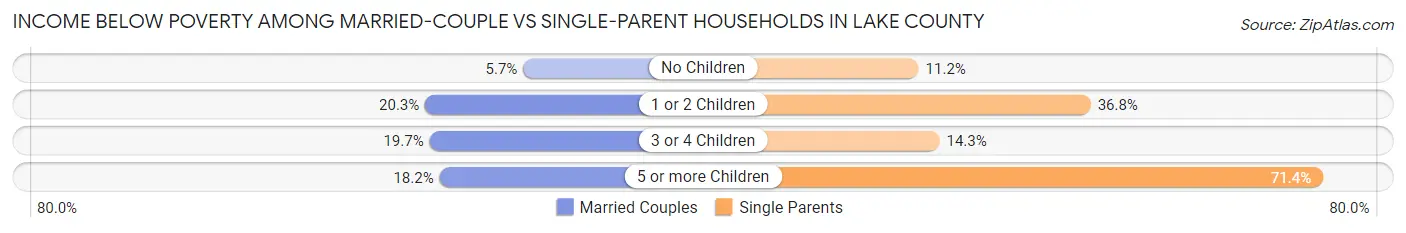
| Children | Married-Couple Families | Single-Parent Households |
| No Children | 91 (5.7%) | 22 (11.2%) |
| 1 or 2 Children | 63 (20.3%) | 67 (36.8%) |
| 3 or 4 Children | 24 (19.7%) | 8 (14.3%) |
| 5 or more Children | 4 (18.2%) | 5 (71.4%) |
| Total | 182 (8.9%) | 102 (23.1%) |
Race in Lake County
The most populous races in Lake County are White / Caucasian (10,121 | 82.4%), Black / African American (1,218 | 9.9%), and Two or more Races (625 | 5.1%).
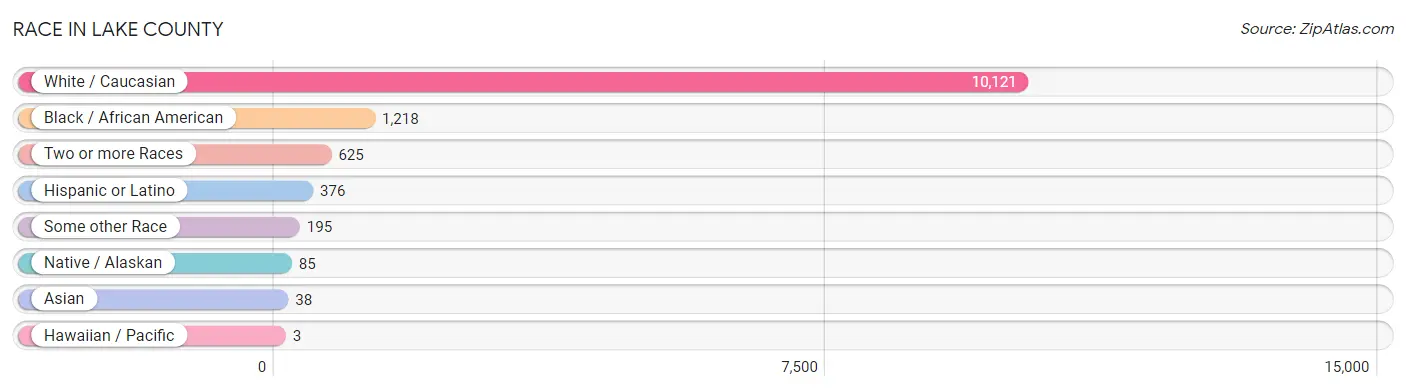
| Race | # Population | % Population |
| Asian | 38 | 0.3% |
| Black / African American | 1,218 | 9.9% |
| Hawaiian / Pacific | 3 | 0.0% |
| Hispanic or Latino | 376 | 3.1% |
| Native / Alaskan | 85 | 0.7% |
| White / Caucasian | 10,121 | 82.4% |
| Two or more Races | 625 | 5.1% |
| Some other Race | 195 | 1.6% |
| Total | 12,285 | 100.0% |
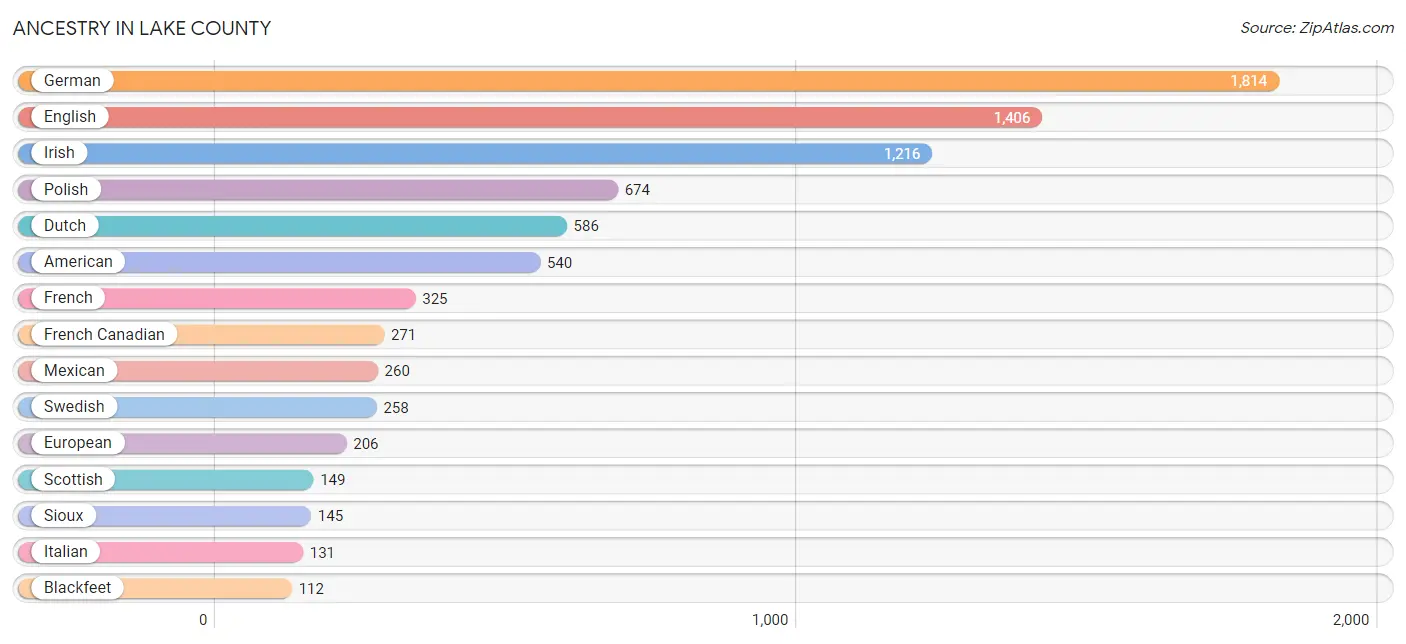
Ancestry in Lake County
The most populous ancestries reported in Lake County are German (1,814 | 14.8%), English (1,406 | 11.4%), Irish (1,216 | 9.9%), Polish (674 | 5.5%), and Dutch (586 | 4.8%), together accounting for 46.4% of all Lake County residents.
| Ancestry | # Population | % Population |
| African | 5 | 0.0% |
| American | 540 | 4.4% |
| Arab | 9 | 0.1% |
| Austrian | 28 | 0.2% |
| Belgian | 17 | 0.1% |
| Bhutanese | 13 | 0.1% |
| Blackfeet | 112 | 0.9% |
| British | 27 | 0.2% |
| Canadian | 87 | 0.7% |
| Central American | 14 | 0.1% |
| Central American Indian | 2 | 0.0% |
| Cherokee | 38 | 0.3% |
| Chippewa | 11 | 0.1% |
| Creek | 1 | 0.0% |
| Croatian | 11 | 0.1% |
| Czech | 61 | 0.5% |
| Czechoslovakian | 15 | 0.1% |
| Danish | 22 | 0.2% |
| Dutch | 586 | 4.8% |
| Eastern European | 57 | 0.5% |
| English | 1,406 | 11.4% |
| European | 206 | 1.7% |
| Finnish | 29 | 0.2% |
| French | 325 | 2.6% |
| French American Indian | 2 | 0.0% |
| French Canadian | 271 | 2.2% |
| German | 1,814 | 14.8% |
| Greek | 16 | 0.1% |
| Guatemalan | 9 | 0.1% |
| Hungarian | 44 | 0.4% |
| Irish | 1,216 | 9.9% |
| Iroquois | 1 | 0.0% |
| Israeli | 1 | 0.0% |
| Italian | 131 | 1.1% |
| Jamaican | 2 | 0.0% |
| Kenyan | 7 | 0.1% |
| Korean | 4 | 0.0% |
| Latvian | 9 | 0.1% |
| Lithuanian | 99 | 0.8% |
| Mexican | 260 | 2.1% |
| Norwegian | 69 | 0.6% |
| Osage | 1 | 0.0% |
| Ottawa | 17 | 0.1% |
| Panamanian | 5 | 0.0% |
| Pennsylvania German | 20 | 0.2% |
| Peruvian | 6 | 0.1% |
| Polish | 674 | 5.5% |
| Portuguese | 10 | 0.1% |
| Potawatomi | 5 | 0.0% |
| Pueblo | 2 | 0.0% |
| Puerto Rican | 37 | 0.3% |
| Romanian | 8 | 0.1% |
| Russian | 16 | 0.1% |
| Scandinavian | 23 | 0.2% |
| Scotch-Irish | 65 | 0.5% |
| Scottish | 149 | 1.2% |
| Seminole | 1 | 0.0% |
| Serbian | 2 | 0.0% |
| Sioux | 145 | 1.2% |
| Slavic | 5 | 0.0% |
| Slovak | 7 | 0.1% |
| South African | 1 | 0.0% |
| South American | 6 | 0.1% |
| South American Indian | 6 | 0.1% |
| Spaniard | 23 | 0.2% |
| Spanish | 9 | 0.1% |
| Sri Lankan | 25 | 0.2% |
| Subsaharan African | 13 | 0.1% |
| Swedish | 258 | 2.1% |
| Swiss | 32 | 0.3% |
| Syrian | 9 | 0.1% |
| Ukrainian | 29 | 0.2% |
| Welsh | 88 | 0.7% | View All 73 Rows |
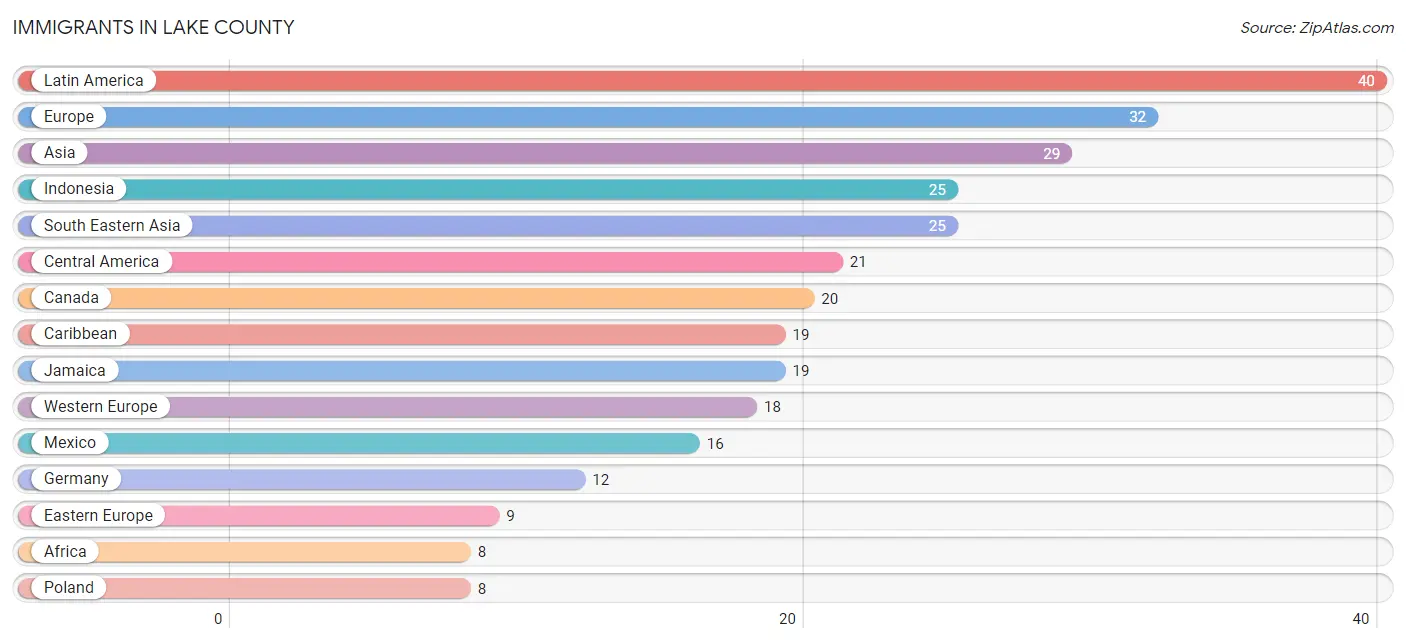
Immigrants in Lake County
The most numerous immigrant groups reported in Lake County came from Latin America (40 | 0.3%), Europe (32 | 0.3%), Asia (29 | 0.2%), Indonesia (25 | 0.2%), and South Eastern Asia (25 | 0.2%), together accounting for 1.2% of all Lake County residents.
| Immigration Origin | # Population | % Population |
| Africa | 8 | 0.1% |
| Asia | 29 | 0.2% |
| Australia | 2 | 0.0% |
| Belgium | 4 | 0.0% |
| Canada | 20 | 0.2% |
| Caribbean | 19 | 0.2% |
| Central America | 21 | 0.2% |
| Costa Rica | 2 | 0.0% |
| Eastern Africa | 7 | 0.1% |
| Eastern Asia | 3 | 0.0% |
| Eastern Europe | 9 | 0.1% |
| Europe | 32 | 0.3% |
| France | 2 | 0.0% |
| Germany | 12 | 0.1% |
| Guatemala | 3 | 0.0% |
| Indonesia | 25 | 0.2% |
| Jamaica | 19 | 0.2% |
| Japan | 3 | 0.0% |
| Kenya | 7 | 0.1% |
| Latin America | 40 | 0.3% |
| Mexico | 16 | 0.1% |
| Oceania | 2 | 0.0% |
| Poland | 8 | 0.1% |
| South Africa | 1 | 0.0% |
| South Central Asia | 1 | 0.0% |
| South Eastern Asia | 25 | 0.2% |
| Southern Europe | 5 | 0.0% |
| Spain | 5 | 0.0% |
| Ukraine | 1 | 0.0% |
| Uzbekistan | 1 | 0.0% |
| Western Europe | 18 | 0.2% | View All 31 Rows |
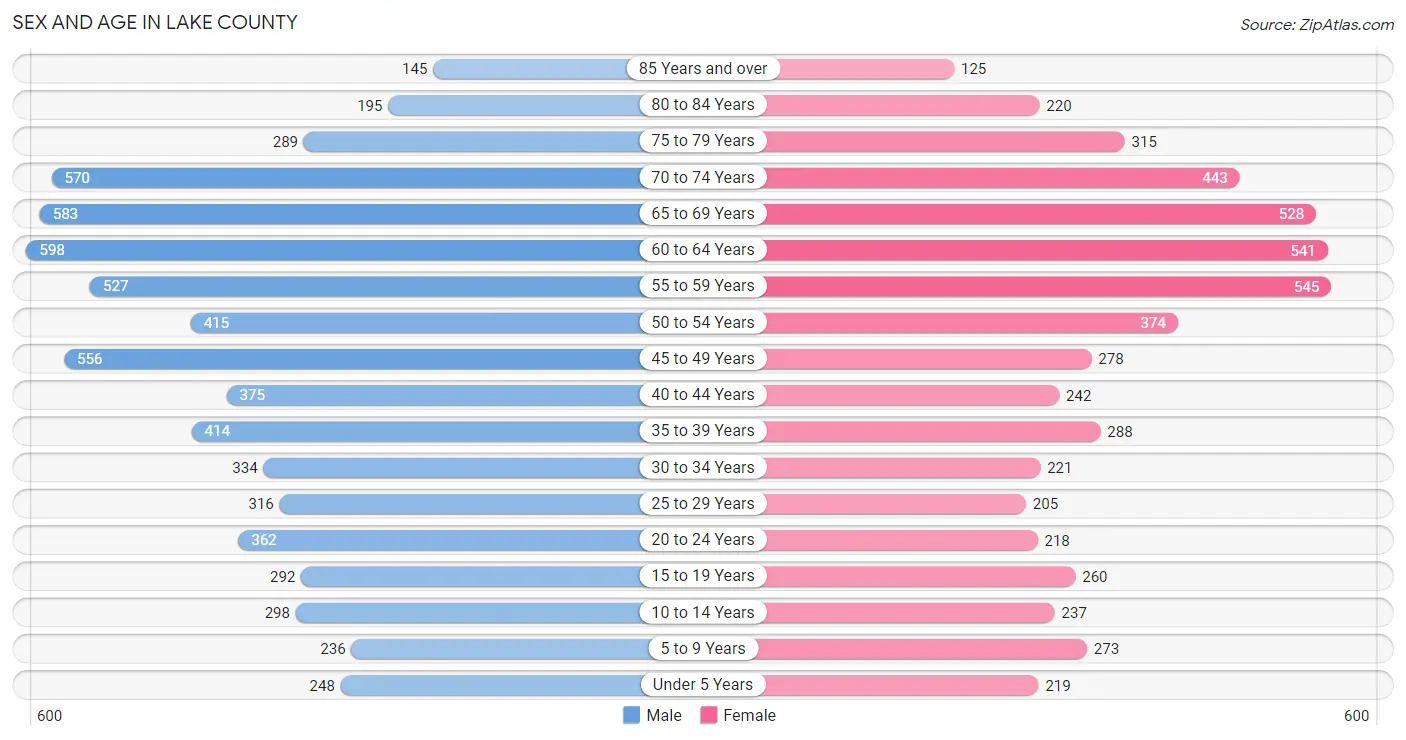
Sex and Age in Lake County
Sex and Age in Lake County
The most populous age groups in Lake County are 60 to 64 Years (598 | 8.9%) for men and 55 to 59 Years (545 | 9.9%) for women.
| Age Bracket | Male | Female |
| Under 5 Years | 248 (3.7%) | 219 (4.0%) |
| 5 to 9 Years | 236 (3.5%) | 273 (4.9%) |
| 10 to 14 Years | 298 (4.4%) | 237 (4.3%) |
| 15 to 19 Years | 292 (4.3%) | 260 (4.7%) |
| 20 to 24 Years | 362 (5.4%) | 218 (3.9%) |
| 25 to 29 Years | 316 (4.7%) | 205 (3.7%) |
| 30 to 34 Years | 334 (5.0%) | 221 (4.0%) |
| 35 to 39 Years | 414 (6.1%) | 288 (5.2%) |
| 40 to 44 Years | 375 (5.6%) | 242 (4.4%) |
| 45 to 49 Years | 556 (8.2%) | 278 (5.0%) |
| 50 to 54 Years | 415 (6.1%) | 374 (6.8%) |
| 55 to 59 Years | 527 (7.8%) | 545 (9.9%) |
| 60 to 64 Years | 598 (8.9%) | 541 (9.8%) |
| 65 to 69 Years | 583 (8.6%) | 528 (9.5%) |
| 70 to 74 Years | 570 (8.4%) | 443 (8.0%) |
| 75 to 79 Years | 289 (4.3%) | 315 (5.7%) |
| 80 to 84 Years | 195 (2.9%) | 220 (4.0%) |
| 85 Years and over | 145 (2.1%) | 125 (2.3%) |
| Total | 6,753 (100.0%) | 5,532 (100.0%) |
Families and Households in Lake County
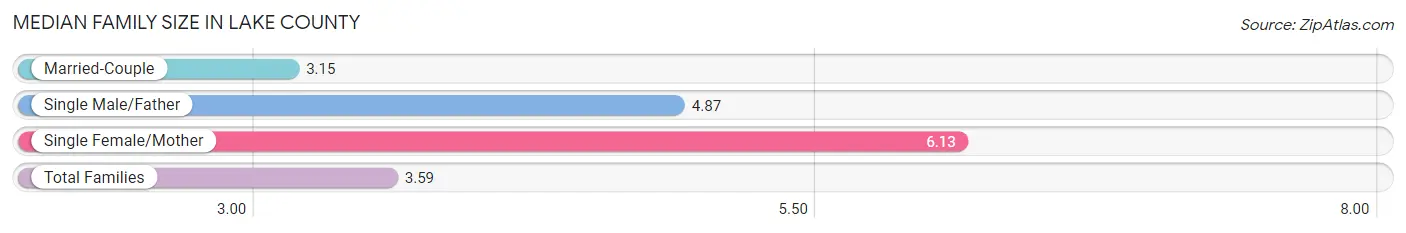
Median Family Size in Lake County
The median family size in Lake County is 3.59 persons per family, with single female/mother families (261 | 10.5%) accounting for the largest median family size of 6.13 persons per family. On the other hand, married-couple families (2,049 | 82.3%) represent the smallest median family size with 3.15 persons per family.
| Family Type | # Families | Family Size |
| Married-Couple | 2,049 (82.3%) | 3.15 |
| Single Male/Father | 181 (7.3%) | 4.87 |
| Single Female/Mother | 261 (10.5%) | 6.13 |
| Total Families | 2,491 (100.0%) | 3.59 |
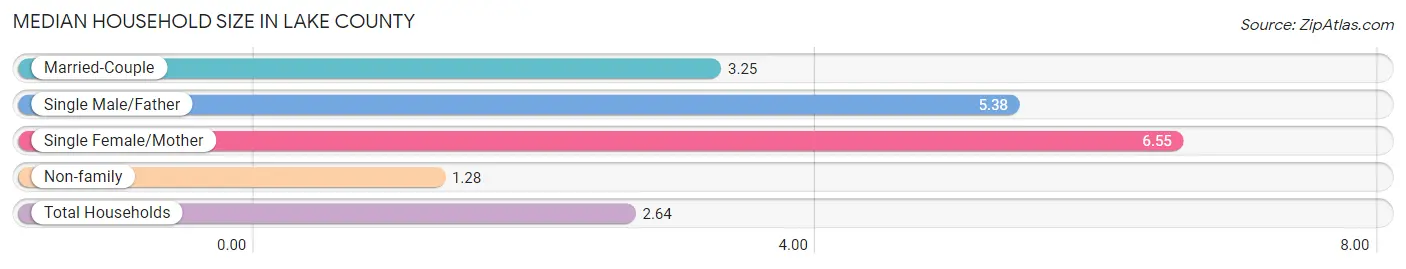
Median Household Size in Lake County
The median household size in Lake County is 2.64 persons per household, with single female/mother households (261 | 5.7%) accounting for the largest median household size of 6.55 persons per household. non-family households (2,058 | 45.2%) represent the smallest median household size with 1.28 persons per household.
| Household Type | # Households | Household Size |
| Married-Couple | 2,049 (45.0%) | 3.25 |
| Single Male/Father | 181 (4.0%) | 5.38 |
| Single Female/Mother | 261 (5.7%) | 6.55 |
| Non-family | 2,058 (45.2%) | 1.28 |
| Total Households | 4,549 (100.0%) | 2.64 |
Household Size by Marriage Status in Lake County
Out of a total of 4,549 households in Lake County, 2,491 (54.8%) are family households, while 2,058 (45.2%) are nonfamily households. The most numerous type of family households are 2-person households, comprising 1,585, and the most common type of nonfamily households are 1-person households, comprising 1,761.
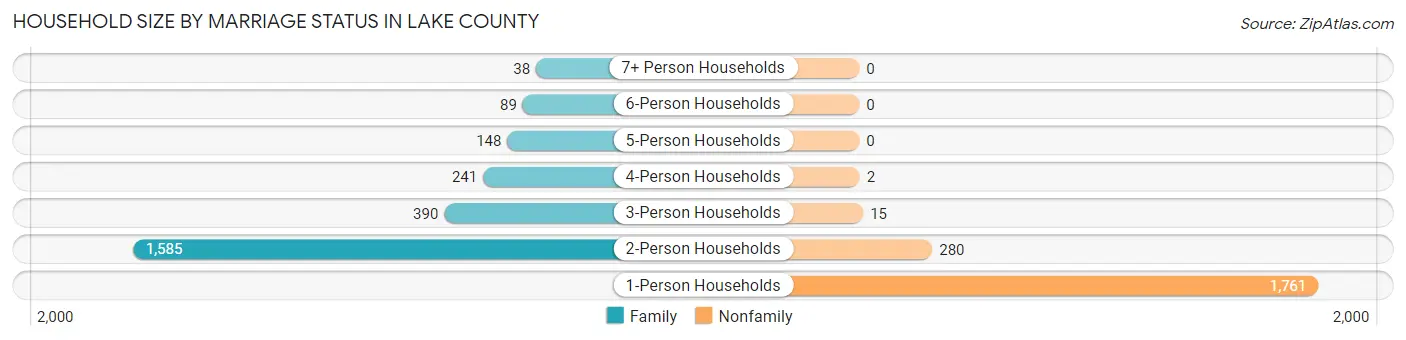
| Household Size | Family Households | Nonfamily Households |
| 1-Person Households | - | 1,761 (38.7%) |
| 2-Person Households | 1,585 (34.8%) | 280 (6.2%) |
| 3-Person Households | 390 (8.6%) | 15 (0.3%) |
| 4-Person Households | 241 (5.3%) | 2 (0.0%) |
| 5-Person Households | 148 (3.3%) | 0 (0.0%) |
| 6-Person Households | 89 (2.0%) | 0 (0.0%) |
| 7+ Person Households | 38 (0.8%) | 0 (0.0%) |
| Total | 2,491 (54.8%) | 2,058 (45.2%) |
Female Fertility in Lake County
Fertility by Age in Lake County
Average fertility rate in Lake County is 40.0 births per 1,000 women. Women in the age bracket of 20 to 34 years have the highest fertility rate with 93.0 births per 1,000 women. Women in the age bracket of 20 to 34 years acount for 83.3% of all women with births.
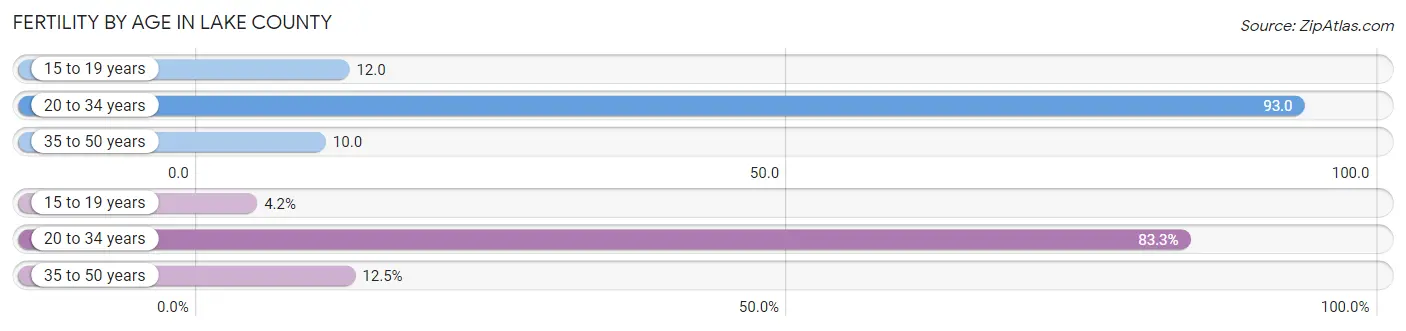
| Age Bracket | Women with Births | Births / 1,000 Women |
| 15 to 19 years | 3 (4.2%) | 12.0 |
| 20 to 34 years | 60 (83.3%) | 93.0 |
| 35 to 50 years | 9 (12.5%) | 10.0 |
| Total | 72 (100.0%) | 40.0 |
Fertility by Age by Marriage Status in Lake County
58.3% of women with births (72) in Lake County are married. The highest percentage of unmarried women with births falls into 15 to 19 years age bracket with 100.0% of them unmarried at the time of birth, while the lowest percentage of unmarried women with births belong to 35 to 50 years age bracket with 33.3% of them unmarried.
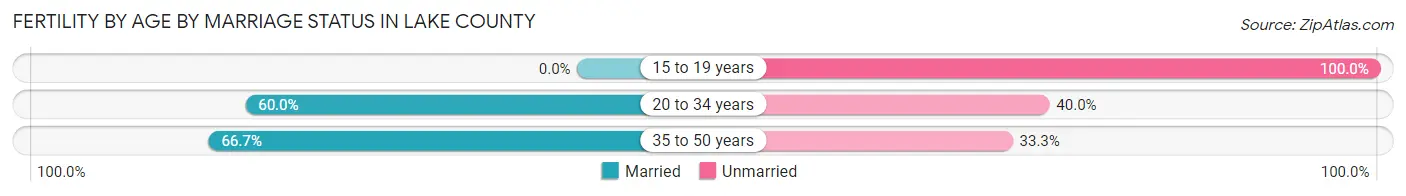
| Age Bracket | Married | Unmarried |
| 15 to 19 years | 0 (0.0%) | 3 (100.0%) |
| 20 to 34 years | 36 (60.0%) | 24 (40.0%) |
| 35 to 50 years | 6 (66.7%) | 3 (33.3%) |
| Total | 42 (58.3%) | 30 (41.7%) |
Fertility by Education in Lake County
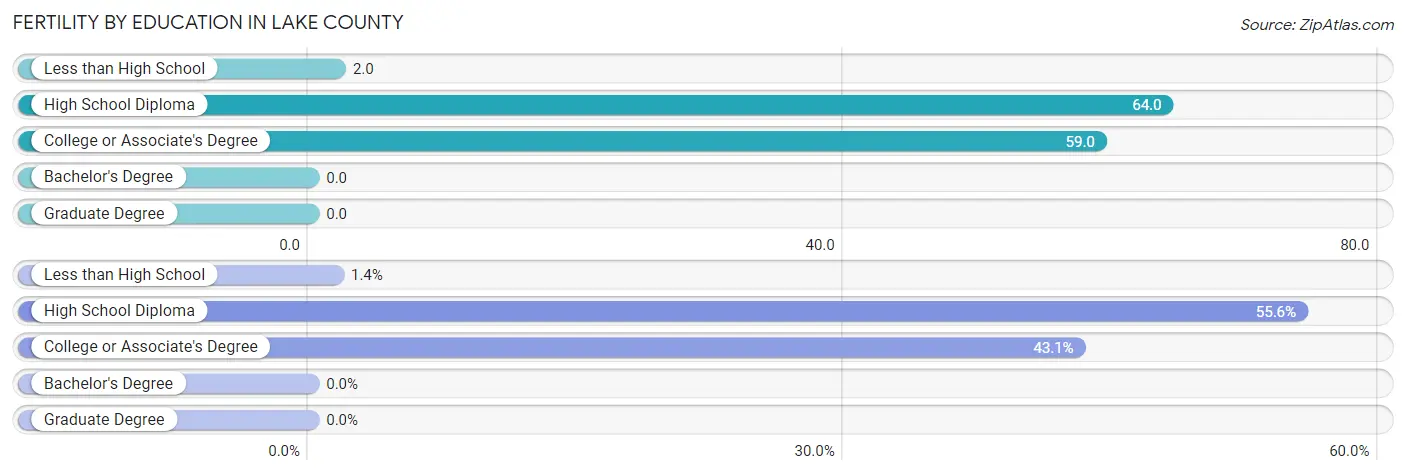
| Educational Attainment | Women with Births | Births / 1,000 Women |
| Less than High School | 1 (1.4%) | 2.0 |
| High School Diploma | 40 (55.6%) | 64.0 |
| College or Associate's Degree | 31 (43.1%) | 59.0 |
| Bachelor's Degree | 0 (0.0%) | 0.0 |
| Graduate Degree | 0 (0.0%) | 0.0 |
| Total | 72 (100.0%) | 40.0 |
Fertility by Education by Marriage Status in Lake County
41.7% of women with births in Lake County are unmarried. Women with the educational attainment of college or associate's degree are most likely to be married with 67.7% of them married at childbirth, while women with the educational attainment of less than high school are least likely to be married with 100.0% of them unmarried at childbirth.
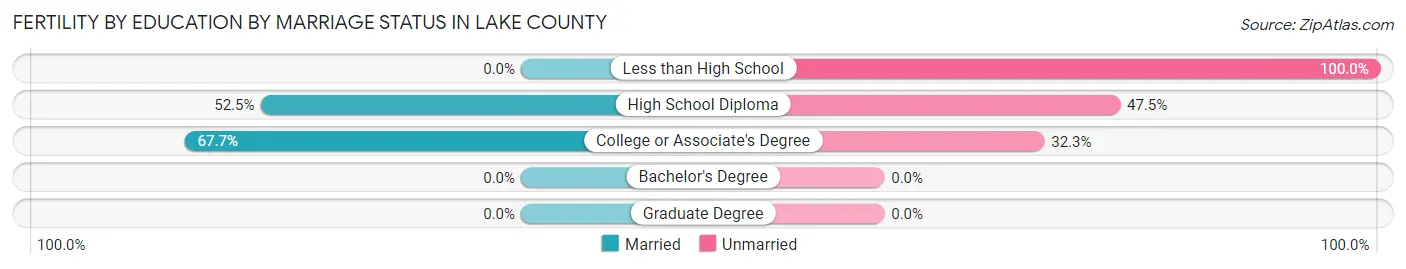
| Educational Attainment | Married | Unmarried |
| Less than High School | 0 (0.0%) | 1 (100.0%) |
| High School Diploma | 21 (52.5%) | 19 (47.5%) |
| College or Associate's Degree | 21 (67.7%) | 10 (32.3%) |
| Bachelor's Degree | 0 (0.0%) | 0 (0.0%) |
| Graduate Degree | 0 (0.0%) | 0 (0.0%) |
| Total | 42 (58.3%) | 30 (41.7%) |
Employment Characteristics in Lake County
Employment by Class of Employer in Lake County
Among the 3,935 employed individuals in Lake County, private company employees (2,621 | 66.6%), self-employed (not incorporated) (337 | 8.6%), and not-for-profit organizations (306 | 7.8%) make up the most common classes of employment.
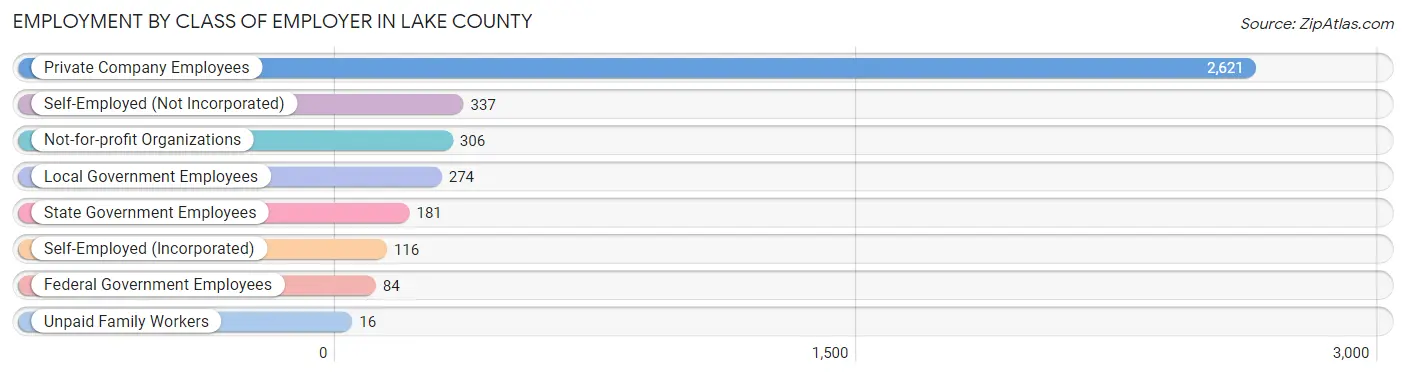
| Employer Class | # Employees | % Employees |
| Private Company Employees | 2,621 | 66.6% |
| Self-Employed (Incorporated) | 116 | 2.9% |
| Self-Employed (Not Incorporated) | 337 | 8.6% |
| Not-for-profit Organizations | 306 | 7.8% |
| Local Government Employees | 274 | 7.0% |
| State Government Employees | 181 | 4.6% |
| Federal Government Employees | 84 | 2.1% |
| Unpaid Family Workers | 16 | 0.4% |
| Total | 3,935 | 100.0% |
Employment Status by Age in Lake County
According to the labor force statistics for Lake County, out of the total population over 16 years of age (10,649), 41.0% or 4,366 individuals are in the labor force, with 7.5% or 327 of them unemployed. The age group with the highest labor force participation rate is 35 to 44 years, with 72.9% or 962 individuals in the labor force. Within the labor force, the 16 to 19 years age range has the highest percentage of unemployed individuals, with 19.7% or 40 of them being unemployed.
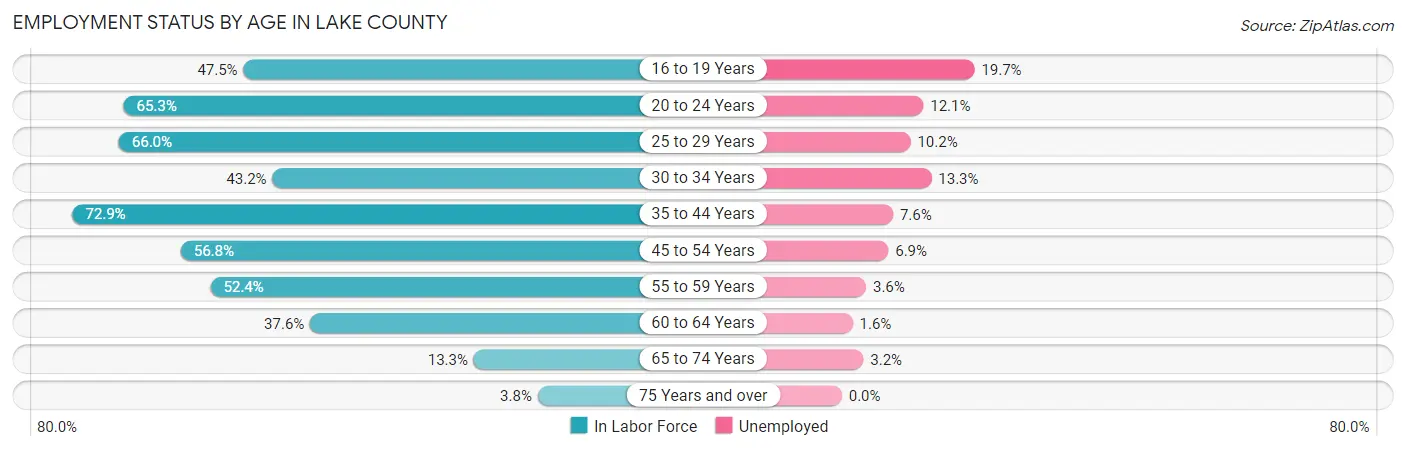
| Age Bracket | In Labor Force | Unemployed |
| 16 to 19 Years | 203 (47.5%) | 40 (19.7%) |
| 20 to 24 Years | 379 (65.3%) | 46 (12.1%) |
| 25 to 29 Years | 344 (66.0%) | 35 (10.2%) |
| 30 to 34 Years | 240 (43.2%) | 32 (13.3%) |
| 35 to 44 Years | 962 (72.9%) | 73 (7.6%) |
| 45 to 54 Years | 922 (56.8%) | 64 (6.9%) |
| 55 to 59 Years | 562 (52.4%) | 20 (3.6%) |
| 60 to 64 Years | 428 (37.6%) | 7 (1.6%) |
| 65 to 74 Years | 282 (13.3%) | 9 (3.2%) |
| 75 Years and over | 49 (3.8%) | 0 (0.0%) |
| Total | 4,366 (41.0%) | 327 (7.5%) |
Employment Status by Educational Attainment in Lake County
According to labor force statistics for Lake County, 55.5% of individuals (3,457) out of the total population between 25 and 64 years of age (6,229) are in the labor force, with 6.7% or 232 of them being unemployed. The group with the highest labor force participation rate are those with the educational attainment of bachelor's degree or higher, with 76.7% or 504 individuals in the labor force. Within the labor force, individuals with less than high school education have the highest percentage of unemployment, with 16.3% or 57 of them being unemployed.
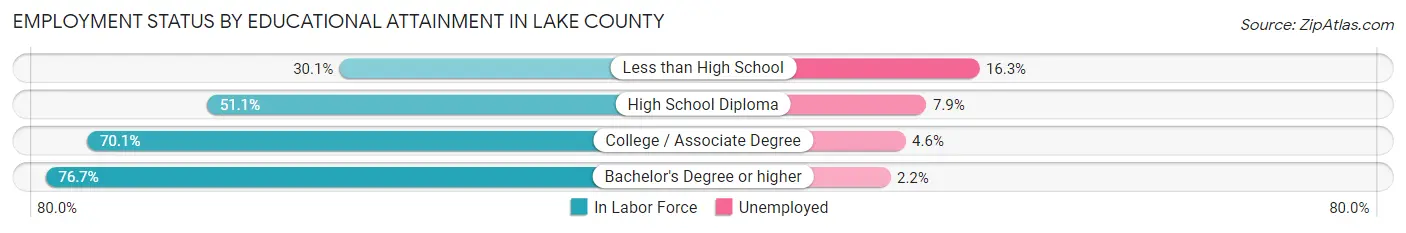
| Educational Attainment | In Labor Force | Unemployed |
| Less than High School | 349 (30.1%) | 189 (16.3%) |
| High School Diploma | 1,310 (51.1%) | 203 (7.9%) |
| College / Associate Degree | 1,295 (70.1%) | 85 (4.6%) |
| Bachelor's Degree or higher | 504 (76.7%) | 14 (2.2%) |
| Total | 3,457 (55.5%) | 417 (6.7%) |
Employment Occupations by Sex in Lake County
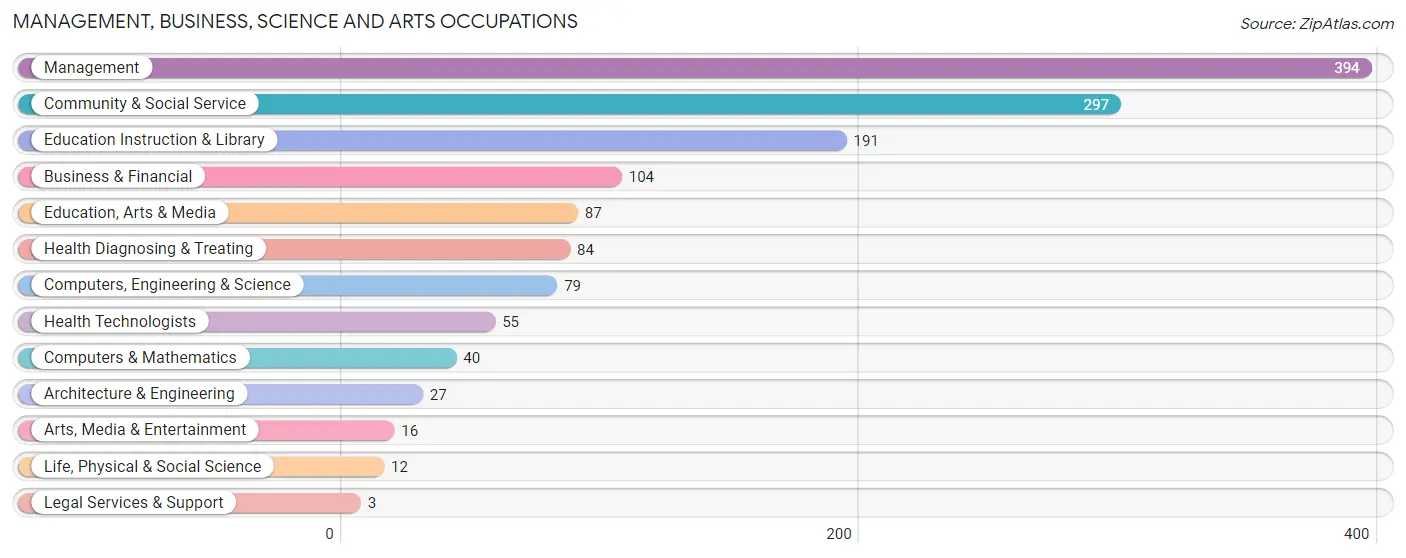
Management, Business, Science and Arts Occupations
The most common Management, Business, Science and Arts occupations in Lake County are Management (394 | 9.7%), Community & Social Service (297 | 7.3%), Education Instruction & Library (191 | 4.7%), Business & Financial (104 | 2.6%), and Education, Arts & Media (87 | 2.1%).
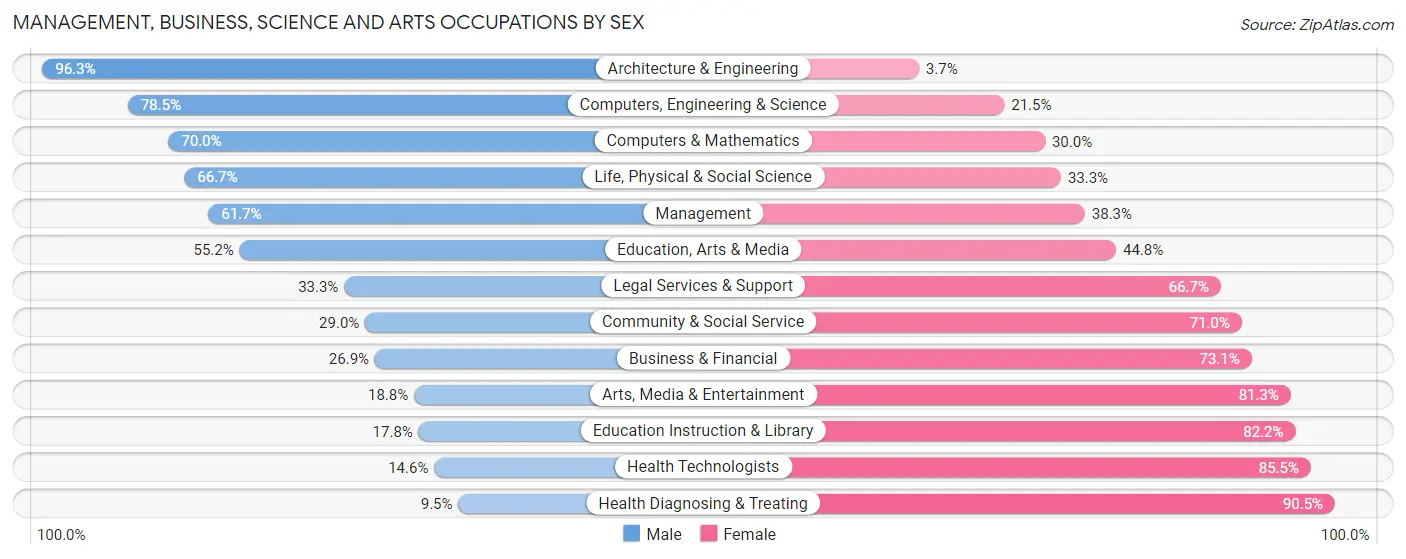
Management, Business, Science and Arts Occupations by Sex
Within the Management, Business, Science and Arts occupations in Lake County, the most male-oriented occupations are Architecture & Engineering (96.3%), Computers, Engineering & Science (78.5%), and Computers & Mathematics (70.0%), while the most female-oriented occupations are Health Diagnosing & Treating (90.5%), Health Technologists (85.5%), and Education Instruction & Library (82.2%).
| Occupation | Male | Female |
| Management | 243 (61.7%) | 151 (38.3%) |
| Business & Financial | 28 (26.9%) | 76 (73.1%) |
| Computers, Engineering & Science | 62 (78.5%) | 17 (21.5%) |
| Computers & Mathematics | 28 (70.0%) | 12 (30.0%) |
| Architecture & Engineering | 26 (96.3%) | 1 (3.7%) |
| Life, Physical & Social Science | 8 (66.7%) | 4 (33.3%) |
| Community & Social Service | 86 (29.0%) | 211 (71.0%) |
| Education, Arts & Media | 48 (55.2%) | 39 (44.8%) |
| Legal Services & Support | 1 (33.3%) | 2 (66.7%) |
| Education Instruction & Library | 34 (17.8%) | 157 (82.2%) |
| Arts, Media & Entertainment | 3 (18.8%) | 13 (81.2%) |
| Health Diagnosing & Treating | 8 (9.5%) | 76 (90.5%) |
| Health Technologists | 8 (14.5%) | 47 (85.5%) |
| Total (Category) | 427 (44.6%) | 531 (55.4%) |
| Total (Overall) | 2,332 (57.7%) | 1,712 (42.3%) |
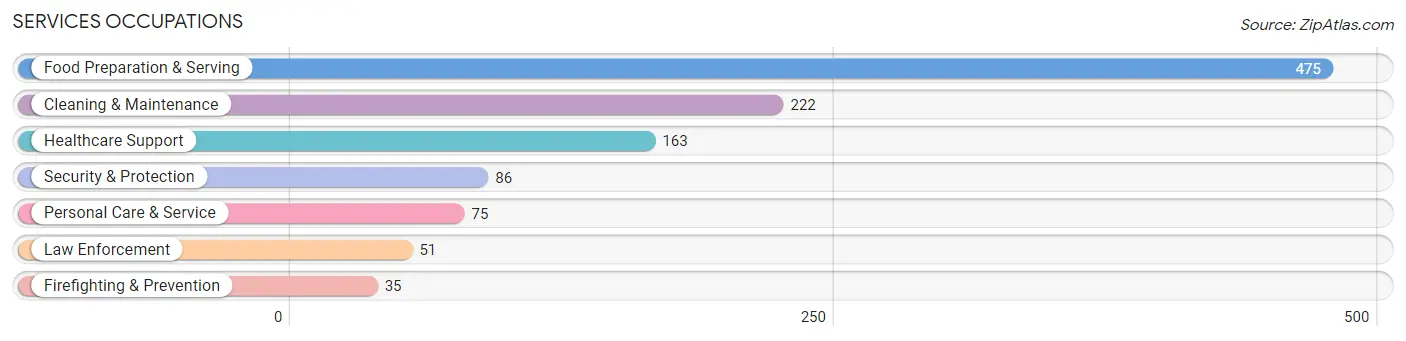
Services Occupations
The most common Services occupations in Lake County are Food Preparation & Serving (475 | 11.7%), Cleaning & Maintenance (222 | 5.5%), Healthcare Support (163 | 4.0%), Security & Protection (86 | 2.1%), and Personal Care & Service (75 | 1.8%).
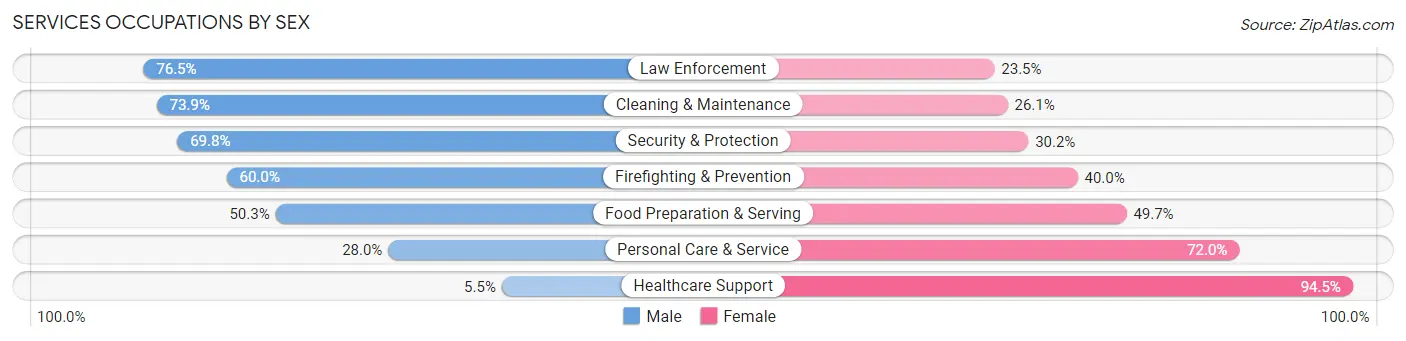
Services Occupations by Sex
Within the Services occupations in Lake County, the most male-oriented occupations are Law Enforcement (76.5%), Cleaning & Maintenance (73.9%), and Security & Protection (69.8%), while the most female-oriented occupations are Healthcare Support (94.5%), Personal Care & Service (72.0%), and Food Preparation & Serving (49.7%).
| Occupation | Male | Female |
| Healthcare Support | 9 (5.5%) | 154 (94.5%) |
| Security & Protection | 60 (69.8%) | 26 (30.2%) |
| Firefighting & Prevention | 21 (60.0%) | 14 (40.0%) |
| Law Enforcement | 39 (76.5%) | 12 (23.5%) |
| Food Preparation & Serving | 239 (50.3%) | 236 (49.7%) |
| Cleaning & Maintenance | 164 (73.9%) | 58 (26.1%) |
| Personal Care & Service | 21 (28.0%) | 54 (72.0%) |
| Total (Category) | 493 (48.3%) | 528 (51.7%) |
| Total (Overall) | 2,332 (57.7%) | 1,712 (42.3%) |
Sales and Office Occupations
The most common Sales and Office occupations in Lake County are Office & Administration (438 | 10.8%), and Sales & Related (361 | 8.9%).
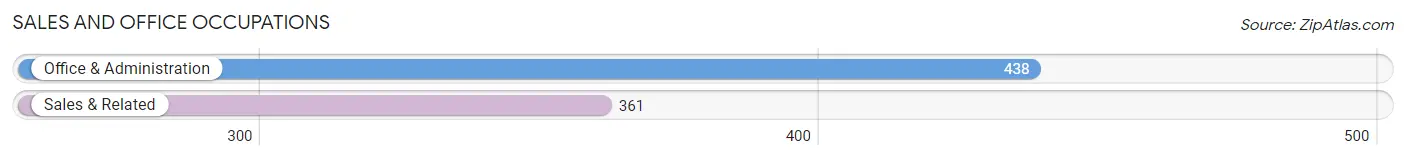
Sales and Office Occupations by Sex
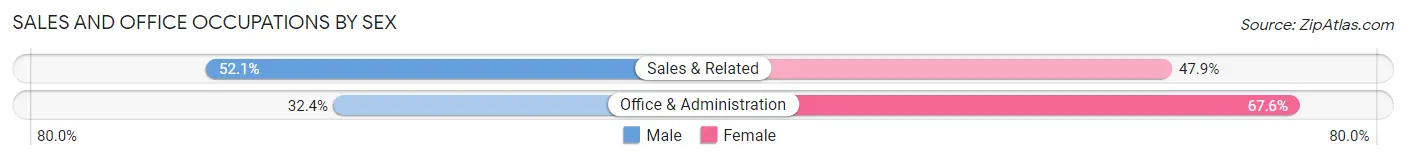
| Occupation | Male | Female |
| Sales & Related | 188 (52.1%) | 173 (47.9%) |
| Office & Administration | 142 (32.4%) | 296 (67.6%) |
| Total (Category) | 330 (41.3%) | 469 (58.7%) |
| Total (Overall) | 2,332 (57.7%) | 1,712 (42.3%) |
Natural Resources, Construction and Maintenance Occupations
The most common Natural Resources, Construction and Maintenance occupations in Lake County are Construction & Extraction (231 | 5.7%), Installation, Maintenance & Repair (211 | 5.2%), and Farming, Fishing & Forestry (51 | 1.3%).
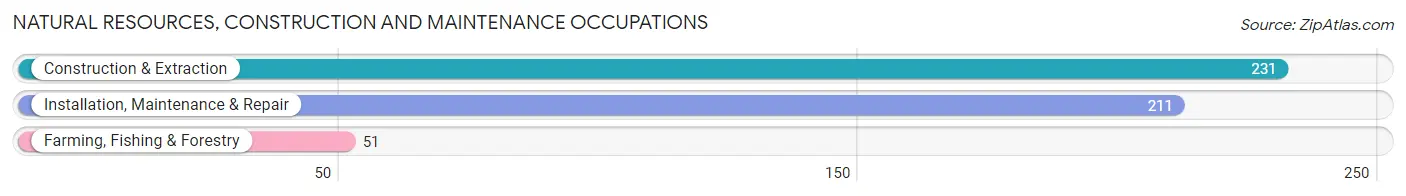
Natural Resources, Construction and Maintenance Occupations by Sex
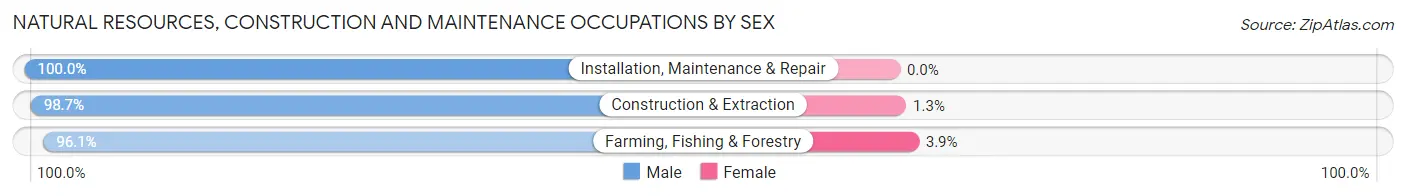
| Occupation | Male | Female |
| Farming, Fishing & Forestry | 49 (96.1%) | 2 (3.9%) |
| Construction & Extraction | 228 (98.7%) | 3 (1.3%) |
| Installation, Maintenance & Repair | 211 (100.0%) | 0 (0.0%) |
| Total (Category) | 488 (99.0%) | 5 (1.0%) |
| Total (Overall) | 2,332 (57.7%) | 1,712 (42.3%) |
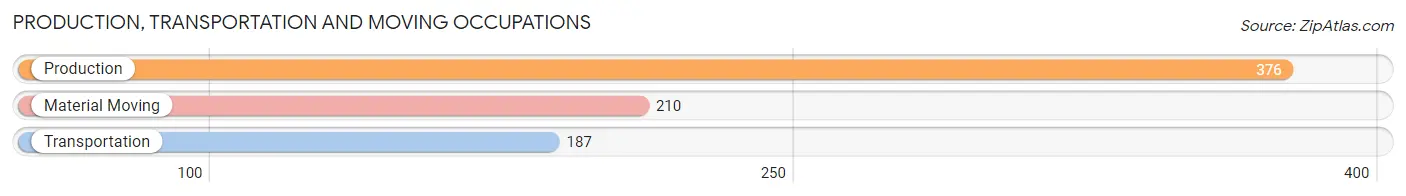
Production, Transportation and Moving Occupations
The most common Production, Transportation and Moving occupations in Lake County are Production (376 | 9.3%), Material Moving (210 | 5.2%), and Transportation (187 | 4.6%).
Production, Transportation and Moving Occupations by Sex
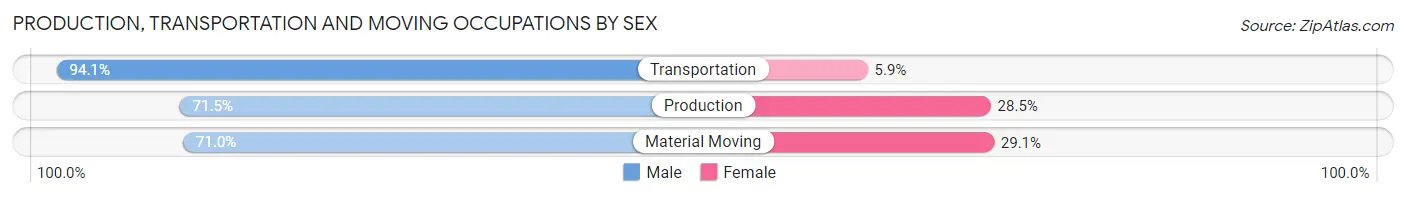
| Occupation | Male | Female |
| Production | 269 (71.5%) | 107 (28.5%) |
| Transportation | 176 (94.1%) | 11 (5.9%) |
| Material Moving | 149 (71.0%) | 61 (29.0%) |
| Total (Category) | 594 (76.8%) | 179 (23.2%) |
| Total (Overall) | 2,332 (57.7%) | 1,712 (42.3%) |
Employment Industries by Sex in Lake County
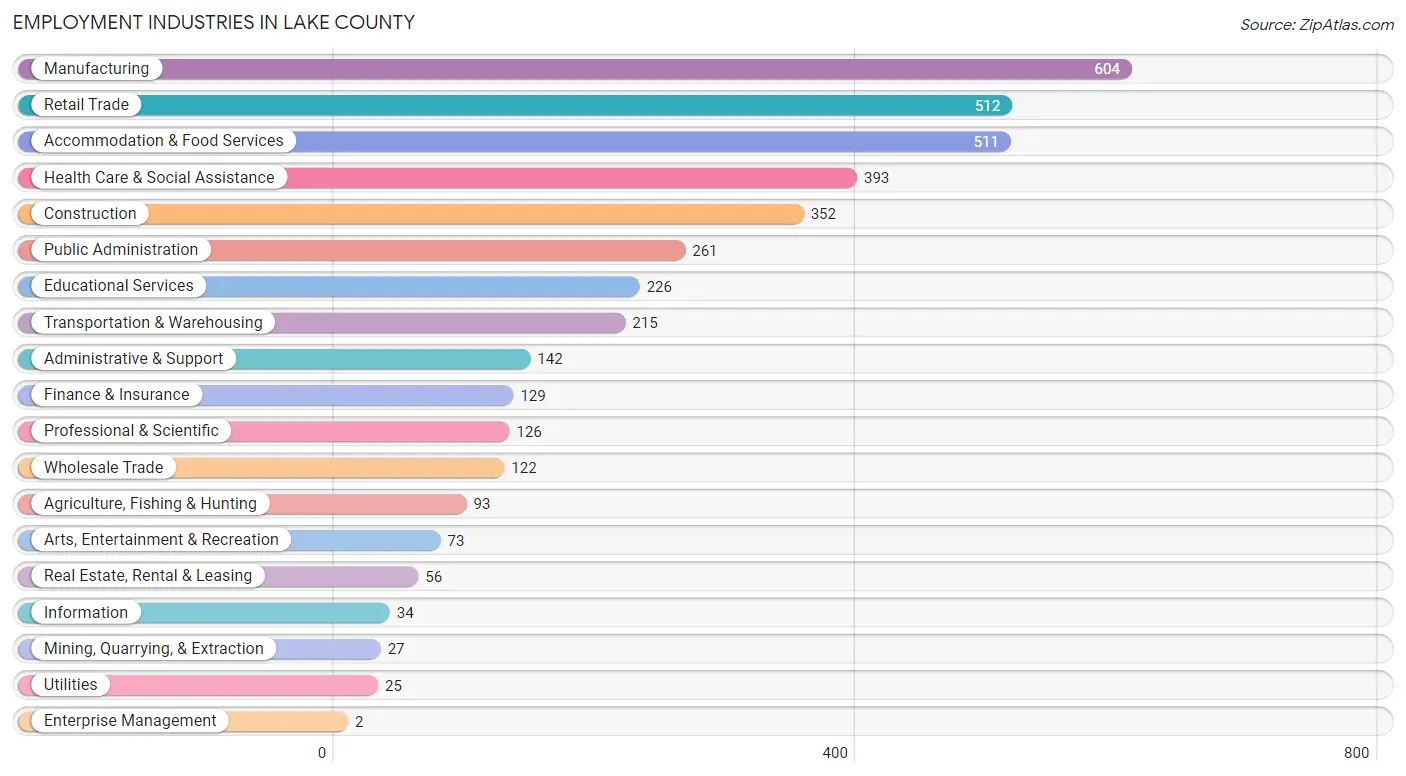
Employment Industries in Lake County
The major employment industries in Lake County include Manufacturing (604 | 14.9%), Retail Trade (512 | 12.7%), Accommodation & Food Services (511 | 12.6%), Health Care & Social Assistance (393 | 9.7%), and Construction (352 | 8.7%).
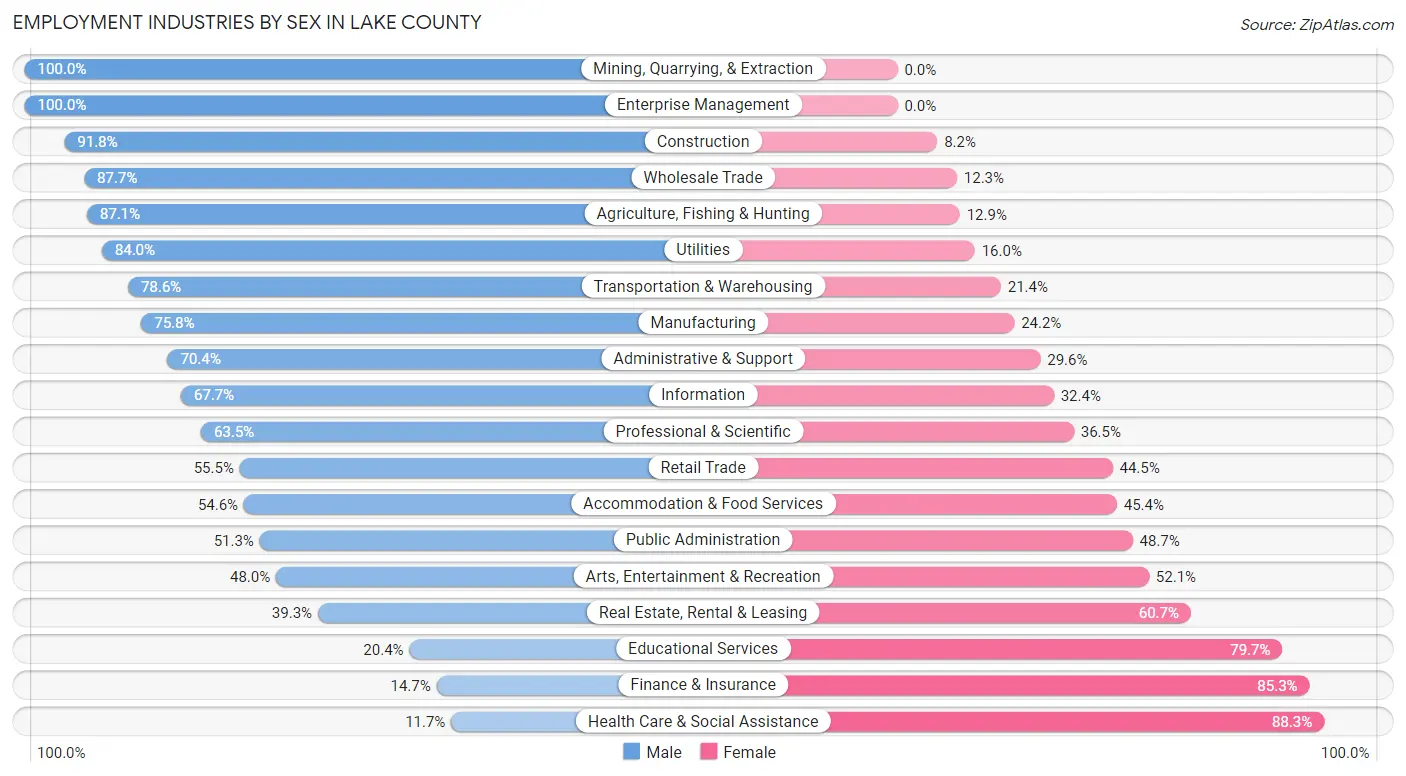
Employment Industries by Sex in Lake County
The Lake County industries that see more men than women are Mining, Quarrying, & Extraction (100.0%), Enterprise Management (100.0%), and Construction (91.8%), whereas the industries that tend to have a higher number of women are Health Care & Social Assistance (88.3%), Finance & Insurance (85.3%), and Educational Services (79.6%).
| Industry | Male | Female |
| Agriculture, Fishing & Hunting | 81 (87.1%) | 12 (12.9%) |
| Mining, Quarrying, & Extraction | 27 (100.0%) | 0 (0.0%) |
| Construction | 323 (91.8%) | 29 (8.2%) |
| Manufacturing | 458 (75.8%) | 146 (24.2%) |
| Wholesale Trade | 107 (87.7%) | 15 (12.3%) |
| Retail Trade | 284 (55.5%) | 228 (44.5%) |
| Transportation & Warehousing | 169 (78.6%) | 46 (21.4%) |
| Utilities | 21 (84.0%) | 4 (16.0%) |
| Information | 23 (67.6%) | 11 (32.4%) |
| Finance & Insurance | 19 (14.7%) | 110 (85.3%) |
| Real Estate, Rental & Leasing | 22 (39.3%) | 34 (60.7%) |
| Professional & Scientific | 80 (63.5%) | 46 (36.5%) |
| Enterprise Management | 2 (100.0%) | 0 (0.0%) |
| Administrative & Support | 100 (70.4%) | 42 (29.6%) |
| Educational Services | 46 (20.3%) | 180 (79.6%) |
| Health Care & Social Assistance | 46 (11.7%) | 347 (88.3%) |
| Arts, Entertainment & Recreation | 35 (47.9%) | 38 (52.0%) |
| Accommodation & Food Services | 279 (54.6%) | 232 (45.4%) |
| Public Administration | 134 (51.3%) | 127 (48.7%) |
| Total | 2,332 (57.7%) | 1,712 (42.3%) |
Education in Lake County
School Enrollment in Lake County
The most common levels of schooling among the 1,855 students in Lake County are high school (469 | 25.3%), middle school (454 | 24.5%), and elementary school (429 | 23.1%).
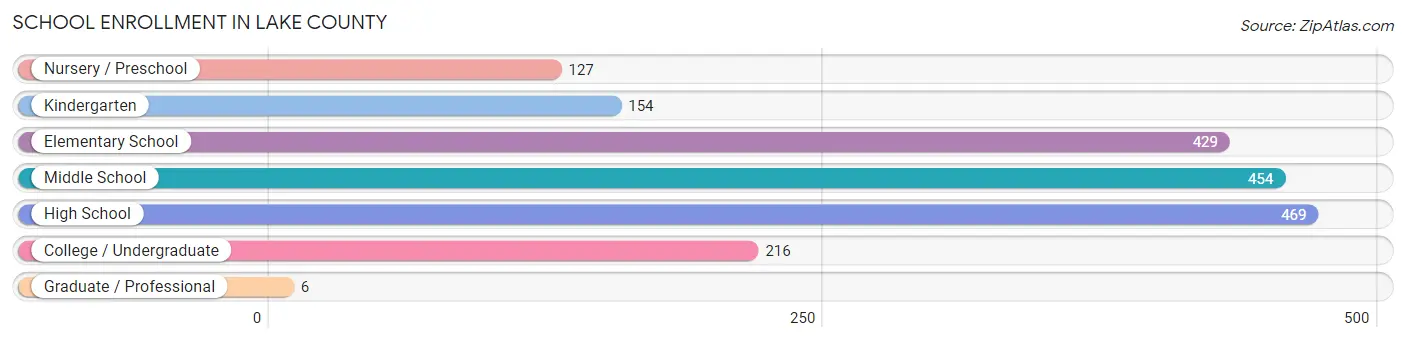
| School Level | # Students | % Students |
| Nursery / Preschool | 127 | 6.9% |
| Kindergarten | 154 | 8.3% |
| Elementary School | 429 | 23.1% |
| Middle School | 454 | 24.5% |
| High School | 469 | 25.3% |
| College / Undergraduate | 216 | 11.6% |
| Graduate / Professional | 6 | 0.3% |
| Total | 1,855 | 100.0% |
School Enrollment by Age by Funding Source in Lake County
Out of a total of 1,855 students who are enrolled in schools in Lake County, 275 (14.8%) attend a private institution, while the remaining 1,580 (85.2%) are enrolled in public schools. The age group of 35 years and over has the highest likelihood of being enrolled in private schools, with 23 (26.7% in the age bracket) enrolled. Conversely, the age group of 15 to 17 year olds has the lowest likelihood of being enrolled in a private school, with 279 (93.6% in the age bracket) attending a public institution.
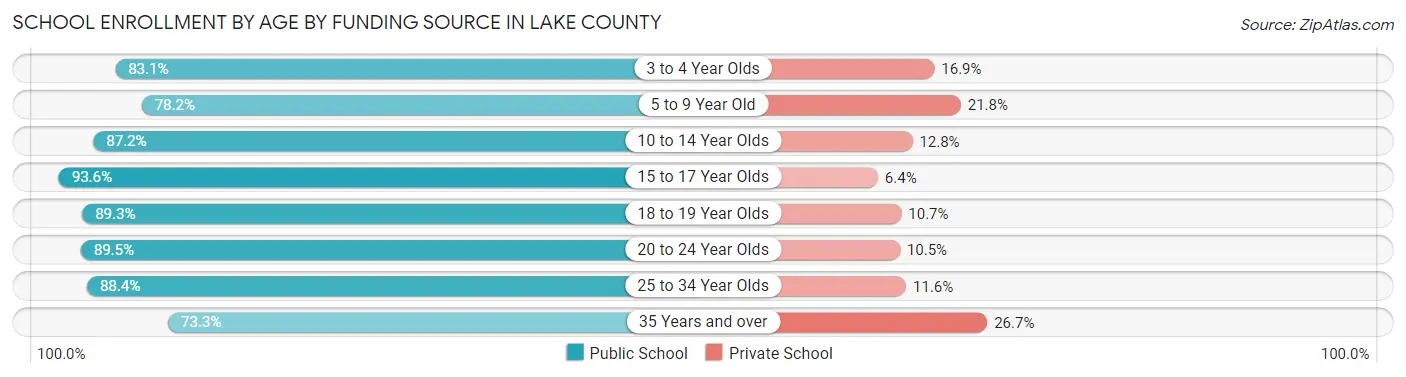
| Age Bracket | Public School | Private School |
| 3 to 4 Year Olds | 123 (83.1%) | 25 (16.9%) |
| 5 to 9 Year Old | 387 (78.2%) | 108 (21.8%) |
| 10 to 14 Year Olds | 463 (87.2%) | 68 (12.8%) |
| 15 to 17 Year Olds | 279 (93.6%) | 19 (6.4%) |
| 18 to 19 Year Olds | 133 (89.3%) | 16 (10.7%) |
| 20 to 24 Year Olds | 94 (89.5%) | 11 (10.5%) |
| 25 to 34 Year Olds | 38 (88.4%) | 5 (11.6%) |
| 35 Years and over | 63 (73.3%) | 23 (26.7%) |
| Total | 1,580 (85.2%) | 275 (14.8%) |
Educational Attainment by Field of Study in Lake County
Education (234 | 18.6%), business (222 | 17.7%), science & technology (181 | 14.4%), arts & humanities (170 | 13.5%), and psychology (114 | 9.1%) are the most common fields of study among 1,256 individuals in Lake County who have obtained a bachelor's degree or higher.
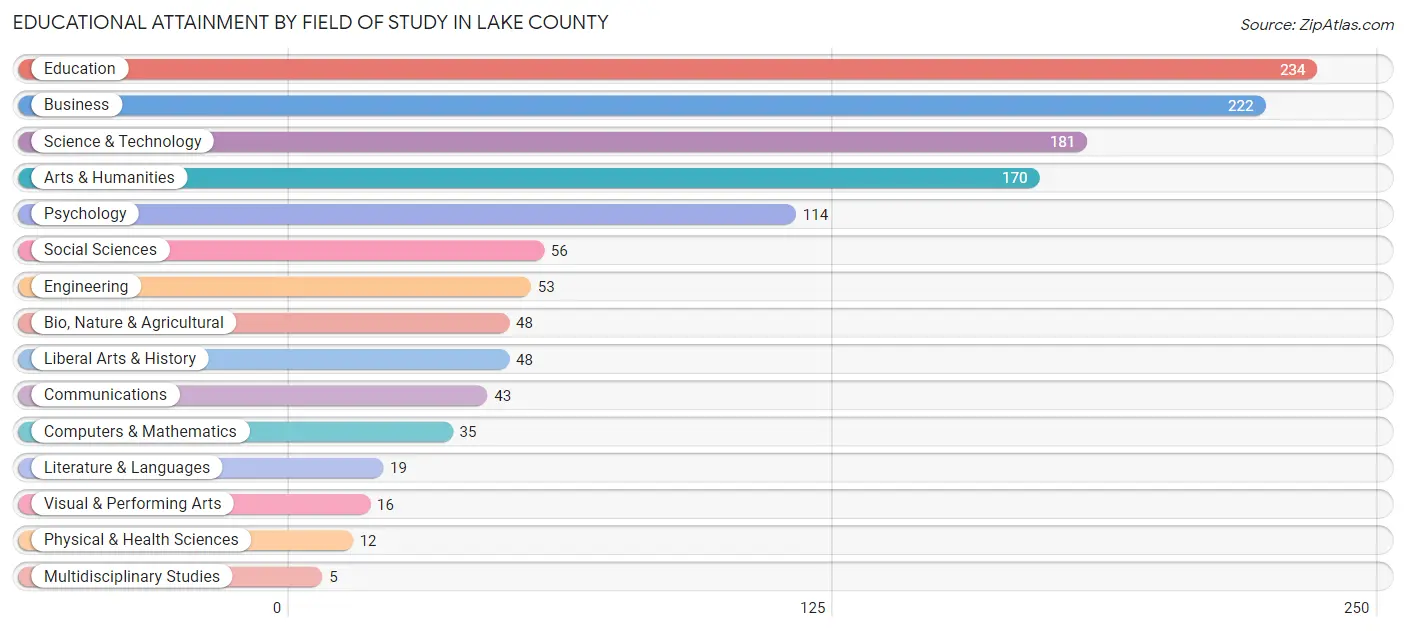
| Field of Study | # Graduates | % Graduates |
| Computers & Mathematics | 35 | 2.8% |
| Bio, Nature & Agricultural | 48 | 3.8% |
| Physical & Health Sciences | 12 | 1.0% |
| Psychology | 114 | 9.1% |
| Social Sciences | 56 | 4.5% |
| Engineering | 53 | 4.2% |
| Multidisciplinary Studies | 5 | 0.4% |
| Science & Technology | 181 | 14.4% |
| Business | 222 | 17.7% |
| Education | 234 | 18.6% |
| Literature & Languages | 19 | 1.5% |
| Liberal Arts & History | 48 | 3.8% |
| Visual & Performing Arts | 16 | 1.3% |
| Communications | 43 | 3.4% |
| Arts & Humanities | 170 | 13.5% |
| Total | 1,256 | 100.0% |
Transportation & Commute in Lake County
Vehicle Availability by Sex in Lake County
The most prevalent vehicle ownership categories in Lake County are males with 2 vehicles (788, accounting for 34.7%) and females with 2 vehicles (714, making up 47.3%).
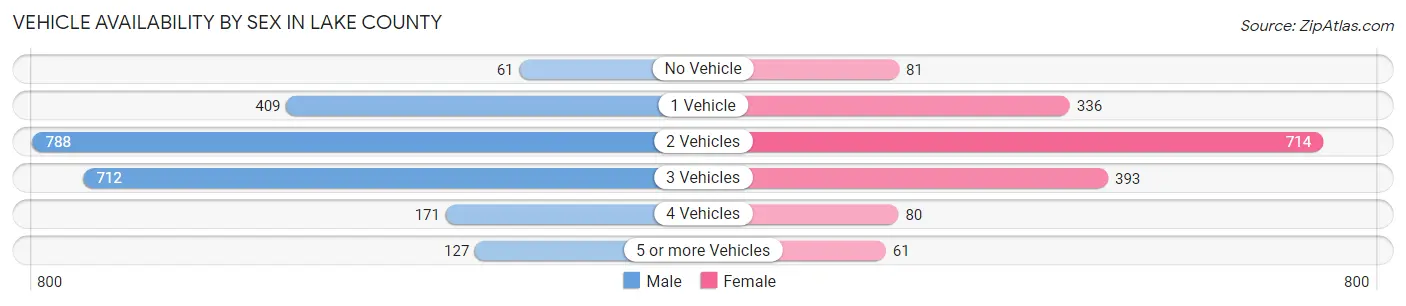
| Vehicles Available | Male | Female |
| No Vehicle | 61 (2.7%) | 81 (4.9%) |
| 1 Vehicle | 409 (18.0%) | 336 (20.2%) |
| 2 Vehicles | 788 (34.7%) | 714 (42.9%) |
| 3 Vehicles | 712 (31.4%) | 393 (23.6%) |
| 4 Vehicles | 171 (7.5%) | 80 (4.8%) |
| 5 or more Vehicles | 127 (5.6%) | 61 (3.7%) |
| Total | 2,268 (100.0%) | 1,665 (100.0%) |
Commute Time in Lake County
The most frequently occuring commute durations in Lake County are 30 to 34 minutes (596 commuters, 16.1%), 15 to 19 minutes (465 commuters, 12.5%), and 10 to 14 minutes (448 commuters, 12.1%).
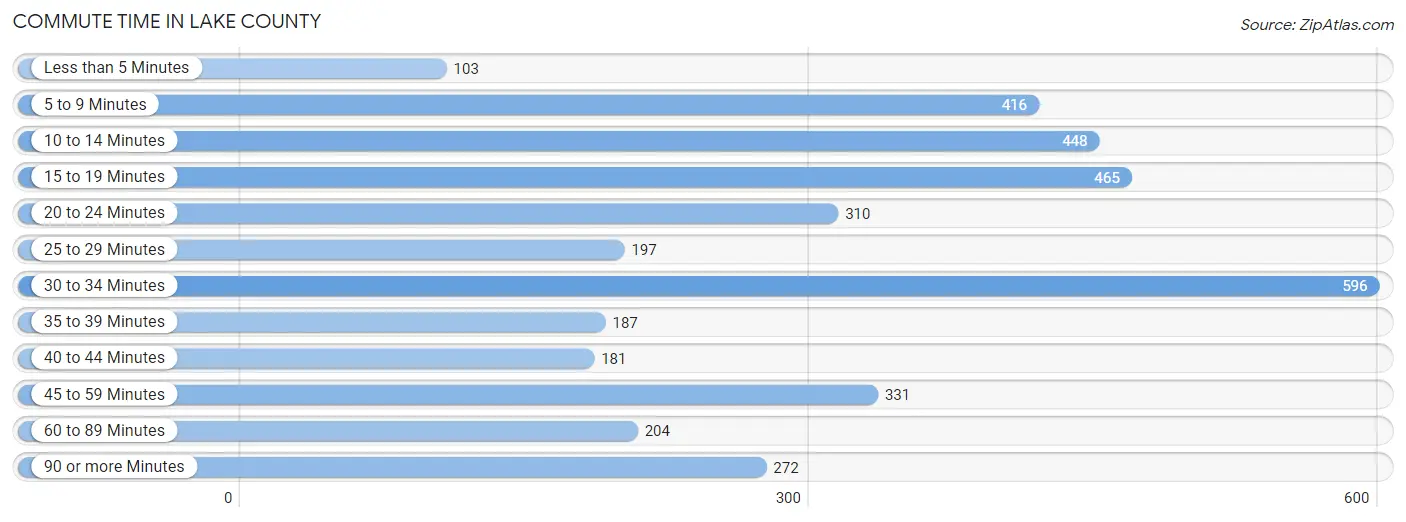
| Commute Time | # Commuters | % Commuters |
| Less than 5 Minutes | 103 | 2.8% |
| 5 to 9 Minutes | 416 | 11.2% |
| 10 to 14 Minutes | 448 | 12.1% |
| 15 to 19 Minutes | 465 | 12.5% |
| 20 to 24 Minutes | 310 | 8.4% |
| 25 to 29 Minutes | 197 | 5.3% |
| 30 to 34 Minutes | 596 | 16.1% |
| 35 to 39 Minutes | 187 | 5.0% |
| 40 to 44 Minutes | 181 | 4.9% |
| 45 to 59 Minutes | 331 | 8.9% |
| 60 to 89 Minutes | 204 | 5.5% |
| 90 or more Minutes | 272 | 7.3% |
Commute Time by Sex in Lake County
The most common commute times in Lake County are 30 to 34 minutes (415 commuters, 19.2%) for males and 5 to 9 minutes (253 commuters, 16.4%) for females.
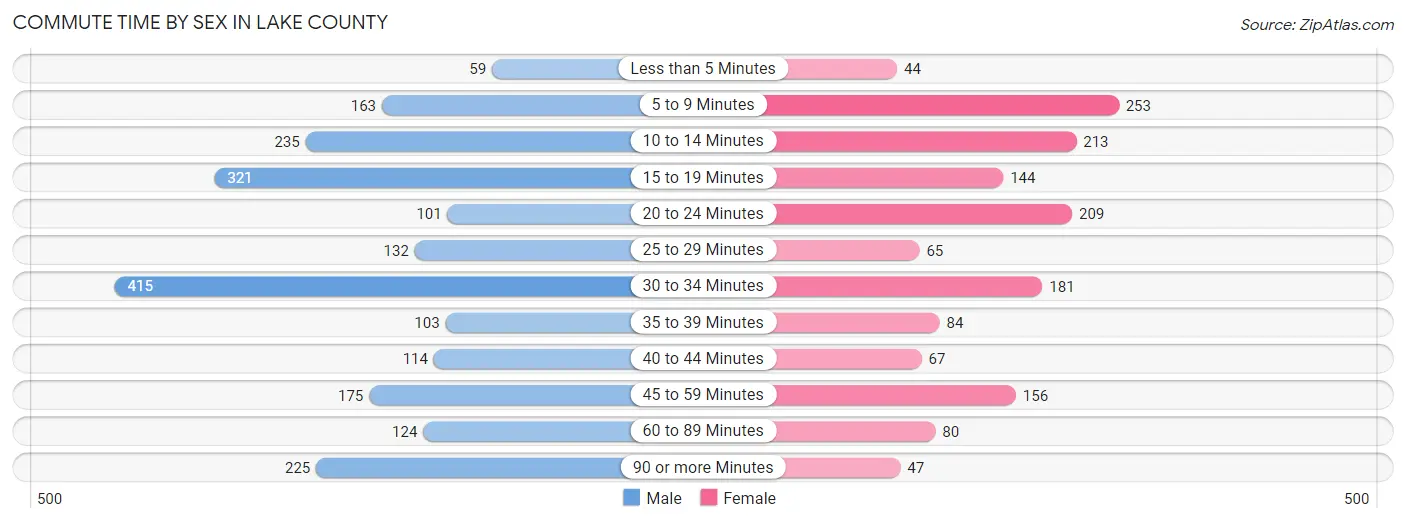
| Commute Time | Male | Female |
| Less than 5 Minutes | 59 (2.7%) | 44 (2.9%) |
| 5 to 9 Minutes | 163 (7.5%) | 253 (16.4%) |
| 10 to 14 Minutes | 235 (10.8%) | 213 (13.8%) |
| 15 to 19 Minutes | 321 (14.8%) | 144 (9.3%) |
| 20 to 24 Minutes | 101 (4.7%) | 209 (13.6%) |
| 25 to 29 Minutes | 132 (6.1%) | 65 (4.2%) |
| 30 to 34 Minutes | 415 (19.2%) | 181 (11.7%) |
| 35 to 39 Minutes | 103 (4.8%) | 84 (5.4%) |
| 40 to 44 Minutes | 114 (5.3%) | 67 (4.3%) |
| 45 to 59 Minutes | 175 (8.1%) | 156 (10.1%) |
| 60 to 89 Minutes | 124 (5.7%) | 80 (5.2%) |
| 90 or more Minutes | 225 (10.4%) | 47 (3.0%) |
Time of Departure to Work by Sex in Lake County
The most frequent times of departure to work in Lake County are 6:00 AM to 6:29 AM (296, 13.7%) for males and 7:00 AM to 7:29 AM (283, 18.3%) for females.
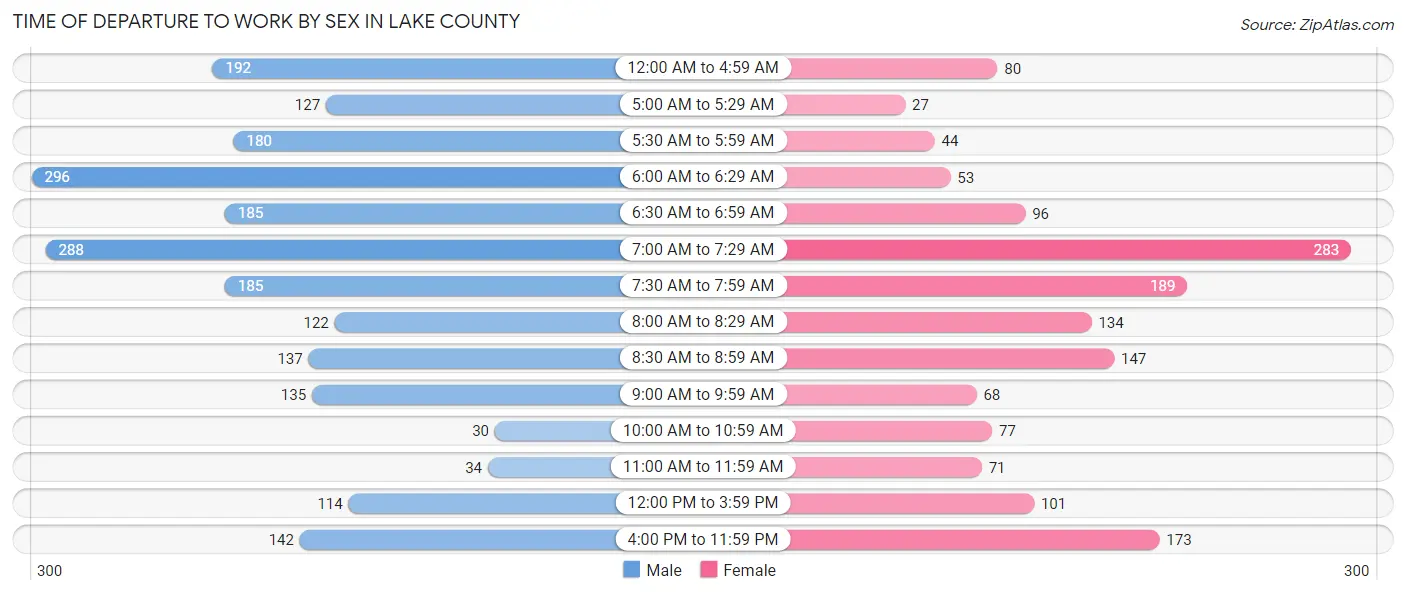
| Time of Departure | Male | Female |
| 12:00 AM to 4:59 AM | 192 (8.9%) | 80 (5.2%) |
| 5:00 AM to 5:29 AM | 127 (5.9%) | 27 (1.8%) |
| 5:30 AM to 5:59 AM | 180 (8.3%) | 44 (2.9%) |
| 6:00 AM to 6:29 AM | 296 (13.7%) | 53 (3.4%) |
| 6:30 AM to 6:59 AM | 185 (8.5%) | 96 (6.2%) |
| 7:00 AM to 7:29 AM | 288 (13.3%) | 283 (18.3%) |
| 7:30 AM to 7:59 AM | 185 (8.5%) | 189 (12.2%) |
| 8:00 AM to 8:29 AM | 122 (5.6%) | 134 (8.7%) |
| 8:30 AM to 8:59 AM | 137 (6.3%) | 147 (9.5%) |
| 9:00 AM to 9:59 AM | 135 (6.2%) | 68 (4.4%) |
| 10:00 AM to 10:59 AM | 30 (1.4%) | 77 (5.0%) |
| 11:00 AM to 11:59 AM | 34 (1.6%) | 71 (4.6%) |
| 12:00 PM to 3:59 PM | 114 (5.3%) | 101 (6.6%) |
| 4:00 PM to 11:59 PM | 142 (6.6%) | 173 (11.2%) |
| Total | 2,167 (100.0%) | 1,543 (100.0%) |
Housing Occupancy in Lake County
Occupancy by Ownership in Lake County
Of the total 4,549 dwellings in Lake County, owner-occupied units account for 3,832 (84.2%), while renter-occupied units make up 717 (15.8%).
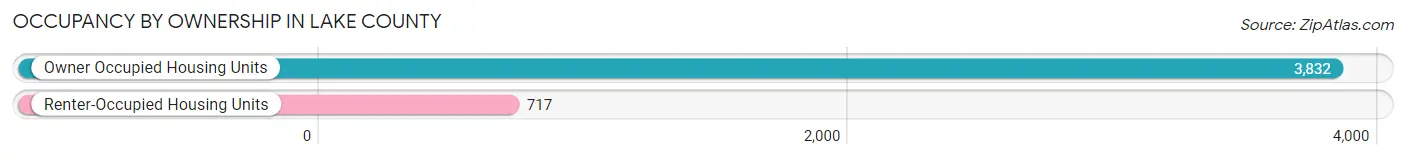
| Occupancy | # Housing Units | % Housing Units |
| Owner Occupied Housing Units | 3,832 | 84.2% |
| Renter-Occupied Housing Units | 717 | 15.8% |
| Total Occupied Housing Units | 4,549 | 100.0% |
Occupancy by Household Size in Lake County
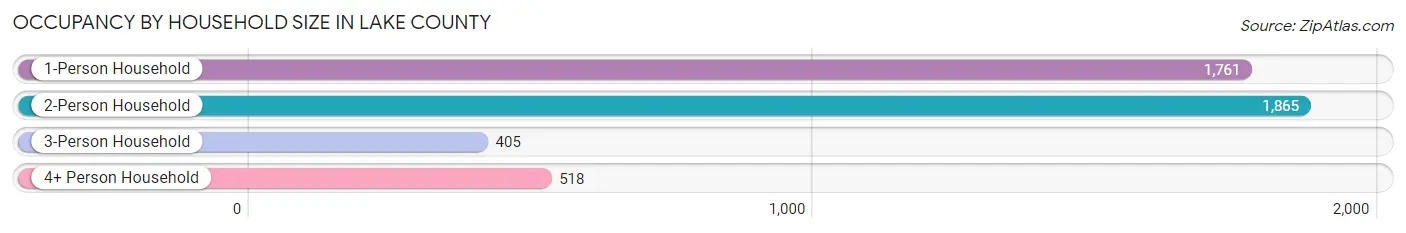
| Household Size | # Housing Units | % Housing Units |
| 1-Person Household | 1,761 | 38.7% |
| 2-Person Household | 1,865 | 41.0% |
| 3-Person Household | 405 | 8.9% |
| 4+ Person Household | 518 | 11.4% |
| Total Housing Units | 4,549 | 100.0% |
Occupancy by Ownership by Household Size in Lake County
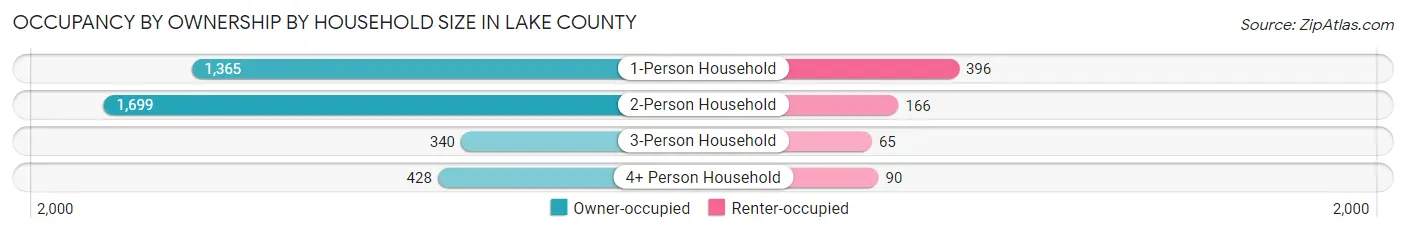
| Household Size | Owner-occupied | Renter-occupied |
| 1-Person Household | 1,365 (77.5%) | 396 (22.5%) |
| 2-Person Household | 1,699 (91.1%) | 166 (8.9%) |
| 3-Person Household | 340 (84.0%) | 65 (16.1%) |
| 4+ Person Household | 428 (82.6%) | 90 (17.4%) |
| Total Housing Units | 3,832 (84.2%) | 717 (15.8%) |
Occupancy by Educational Attainment in Lake County
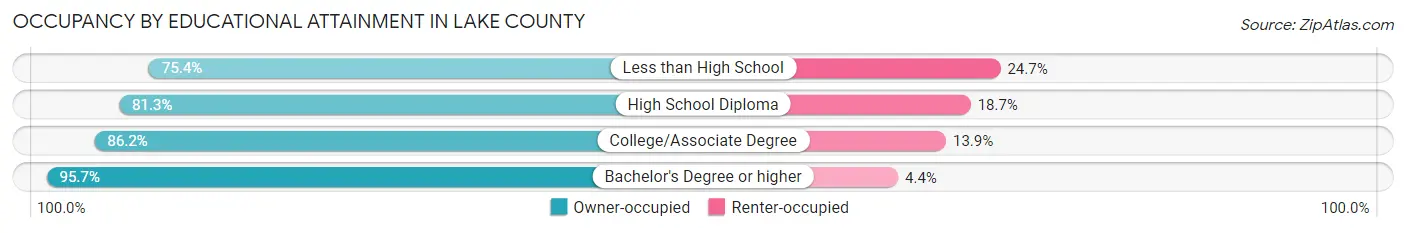
| Household Size | Owner-occupied | Renter-occupied |
| Less than High School | 480 (75.3%) | 157 (24.6%) |
| High School Diploma | 1,353 (81.3%) | 312 (18.7%) |
| College/Associate Degree | 1,362 (86.2%) | 219 (13.9%) |
| Bachelor's Degree or higher | 637 (95.7%) | 29 (4.3%) |
Occupancy by Age of Householder in Lake County
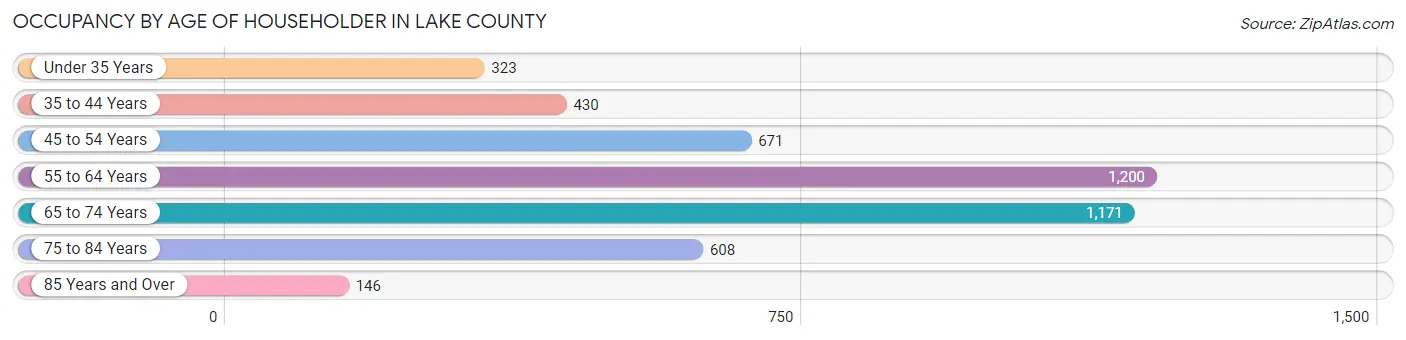
| Age Bracket | # Households | % Households |
| Under 35 Years | 323 | 7.1% |
| 35 to 44 Years | 430 | 9.5% |
| 45 to 54 Years | 671 | 14.7% |
| 55 to 64 Years | 1,200 | 26.4% |
| 65 to 74 Years | 1,171 | 25.7% |
| 75 to 84 Years | 608 | 13.4% |
| 85 Years and Over | 146 | 3.2% |
| Total | 4,549 | 100.0% |
Housing Finances in Lake County
Median Income by Occupancy in Lake County
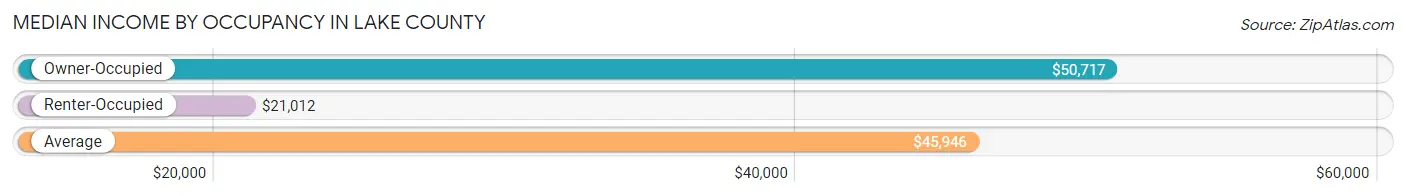
| Occupancy Type | # Households | Median Income |
| Owner-Occupied | 3,832 (84.2%) | $50,717 |
| Renter-Occupied | 717 (15.8%) | $21,012 |
| Average | 4,549 (100.0%) | $45,946 |
Occupancy by Householder Income Bracket in Lake County
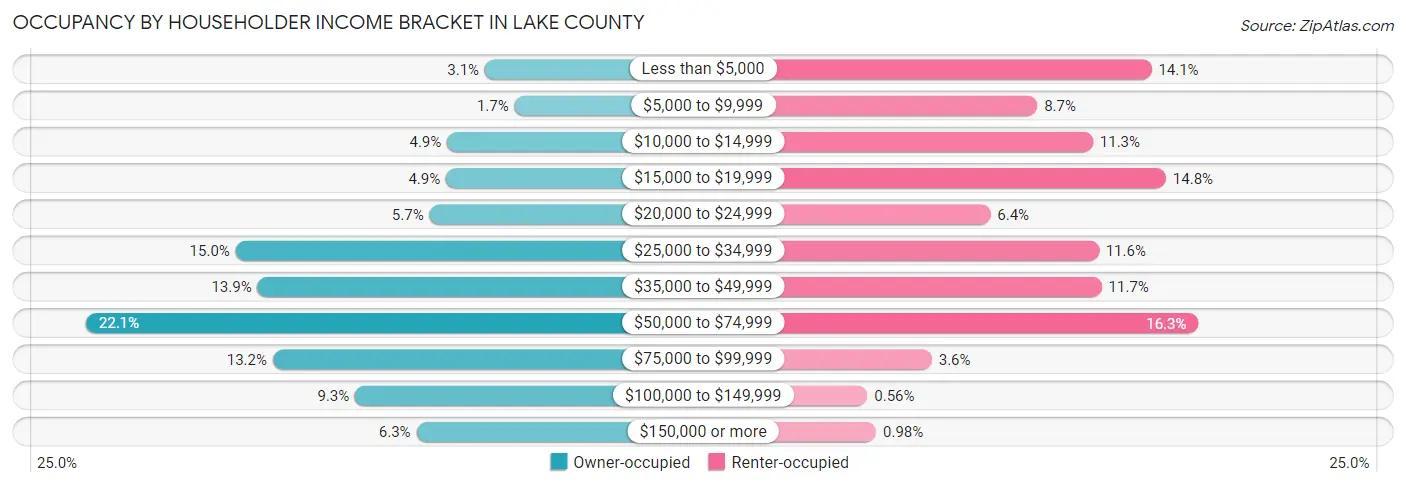
| Income Bracket | Owner-occupied | Renter-occupied |
| Less than $5,000 | 118 (3.1%) | 101 (14.1%) |
| $5,000 to $9,999 | 64 (1.7%) | 62 (8.6%) |
| $10,000 to $14,999 | 187 (4.9%) | 81 (11.3%) |
| $15,000 to $19,999 | 189 (4.9%) | 106 (14.8%) |
| $20,000 to $24,999 | 219 (5.7%) | 46 (6.4%) |
| $25,000 to $34,999 | 573 (14.9%) | 83 (11.6%) |
| $35,000 to $49,999 | 533 (13.9%) | 84 (11.7%) |
| $50,000 to $74,999 | 846 (22.1%) | 117 (16.3%) |
| $75,000 to $99,999 | 505 (13.2%) | 26 (3.6%) |
| $100,000 to $149,999 | 355 (9.3%) | 4 (0.6%) |
| $150,000 or more | 243 (6.3%) | 7 (1.0%) |
| Total | 3,832 (100.0%) | 717 (100.0%) |
Monthly Housing Cost Tiers in Lake County
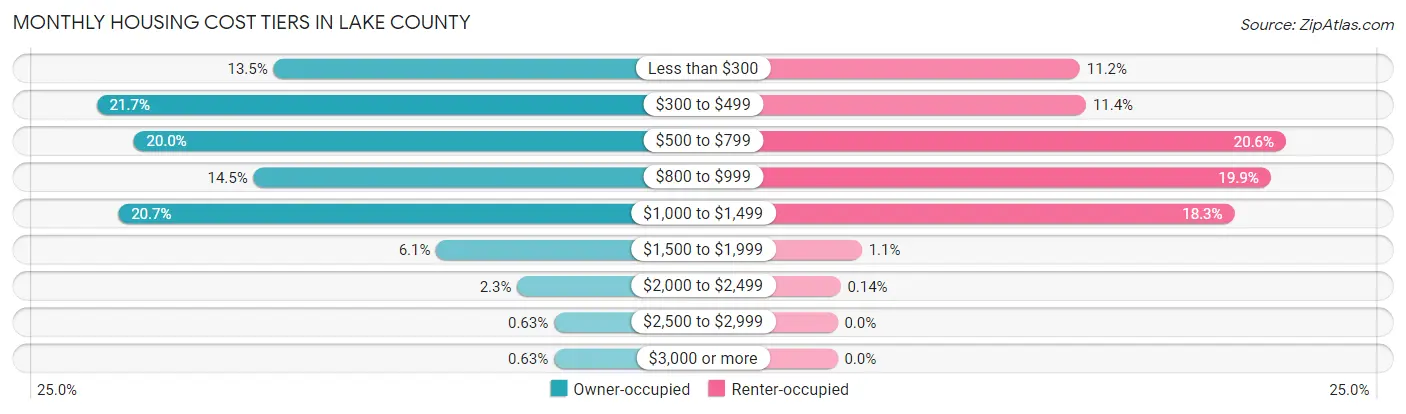
| Monthly Cost | Owner-occupied | Renter-occupied |
| Less than $300 | 519 (13.5%) | 80 (11.2%) |
| $300 to $499 | 831 (21.7%) | 82 (11.4%) |
| $500 to $799 | 766 (20.0%) | 148 (20.6%) |
| $800 to $999 | 554 (14.5%) | 143 (19.9%) |
| $1,000 to $1,499 | 793 (20.7%) | 131 (18.3%) |
| $1,500 to $1,999 | 232 (6.0%) | 8 (1.1%) |
| $2,000 to $2,499 | 89 (2.3%) | 1 (0.1%) |
| $2,500 to $2,999 | 24 (0.6%) | 0 (0.0%) |
| $3,000 or more | 24 (0.6%) | 0 (0.0%) |
| Total | 3,832 (100.0%) | 717 (100.0%) |
Physical Housing Characteristics in Lake County
Housing Structures in Lake County
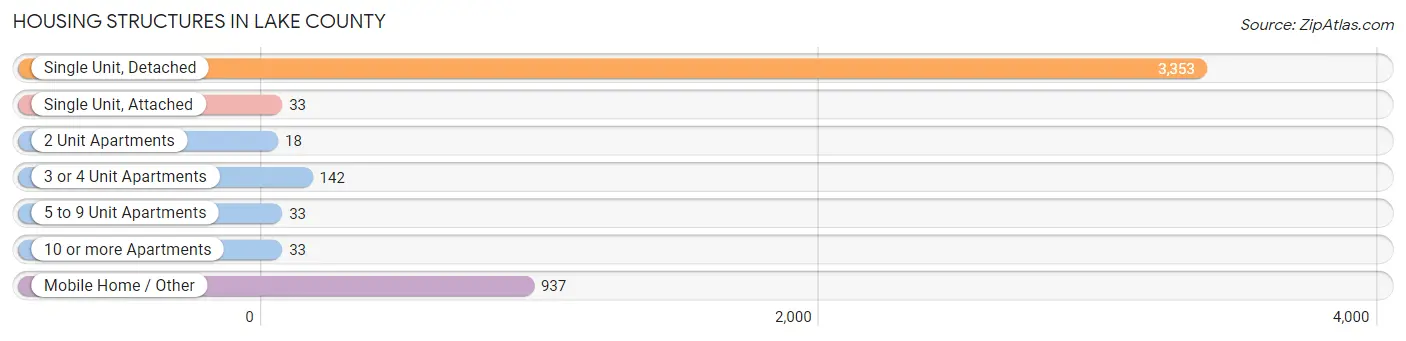
| Structure Type | # Housing Units | % Housing Units |
| Single Unit, Detached | 3,353 | 73.7% |
| Single Unit, Attached | 33 | 0.7% |
| 2 Unit Apartments | 18 | 0.4% |
| 3 or 4 Unit Apartments | 142 | 3.1% |
| 5 to 9 Unit Apartments | 33 | 0.7% |
| 10 or more Apartments | 33 | 0.7% |
| Mobile Home / Other | 937 | 20.6% |
| Total | 4,549 | 100.0% |
Housing Structures by Occupancy in Lake County
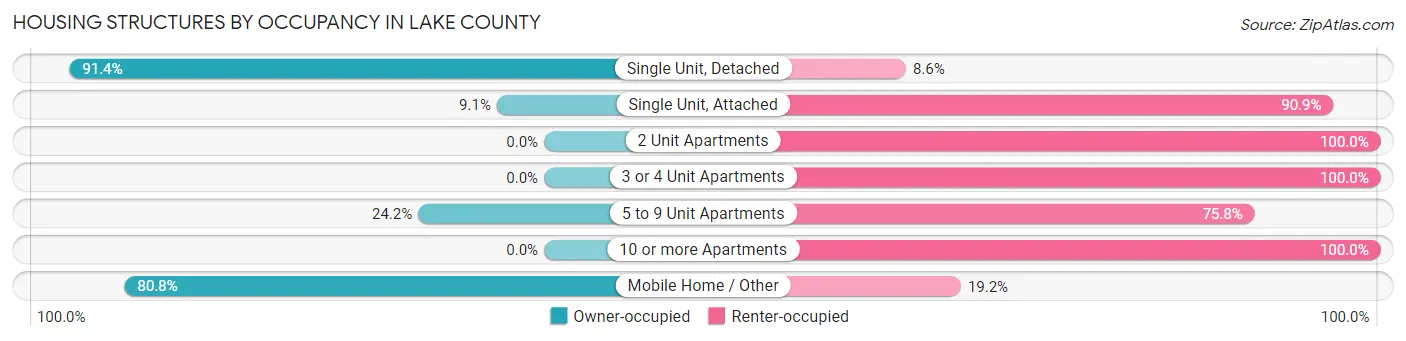
| Structure Type | Owner-occupied | Renter-occupied |
| Single Unit, Detached | 3,064 (91.4%) | 289 (8.6%) |
| Single Unit, Attached | 3 (9.1%) | 30 (90.9%) |
| 2 Unit Apartments | 0 (0.0%) | 18 (100.0%) |
| 3 or 4 Unit Apartments | 0 (0.0%) | 142 (100.0%) |
| 5 to 9 Unit Apartments | 8 (24.2%) | 25 (75.8%) |
| 10 or more Apartments | 0 (0.0%) | 33 (100.0%) |
| Mobile Home / Other | 757 (80.8%) | 180 (19.2%) |
| Total | 3,832 (84.2%) | 717 (15.8%) |
Housing Structures by Number of Rooms in Lake County
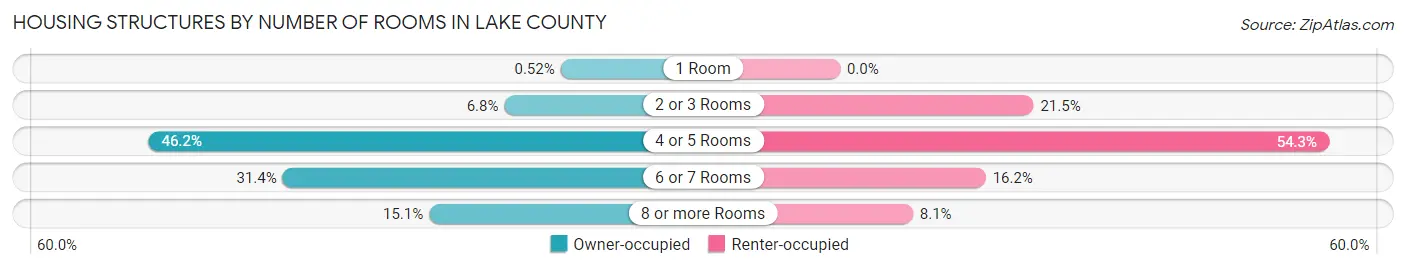
| Number of Rooms | Owner-occupied | Renter-occupied |
| 1 Room | 20 (0.5%) | 0 (0.0%) |
| 2 or 3 Rooms | 259 (6.8%) | 154 (21.5%) |
| 4 or 5 Rooms | 1,772 (46.2%) | 389 (54.2%) |
| 6 or 7 Rooms | 1,202 (31.4%) | 116 (16.2%) |
| 8 or more Rooms | 579 (15.1%) | 58 (8.1%) |
| Total | 3,832 (100.0%) | 717 (100.0%) |
Housing Structure by Heating Type in Lake County
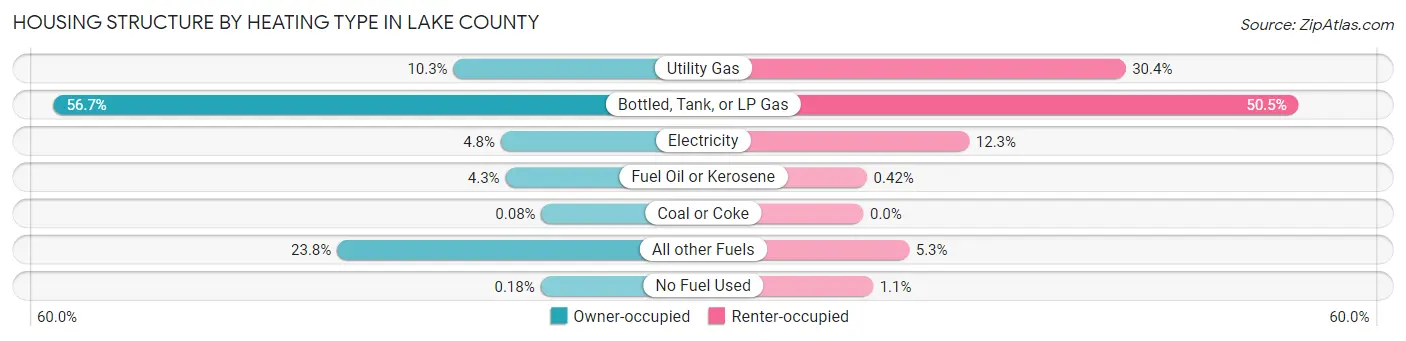
| Heating Type | Owner-occupied | Renter-occupied |
| Utility Gas | 394 (10.3%) | 218 (30.4%) |
| Bottled, Tank, or LP Gas | 2,171 (56.7%) | 362 (50.5%) |
| Electricity | 183 (4.8%) | 88 (12.3%) |
| Fuel Oil or Kerosene | 163 (4.3%) | 3 (0.4%) |
| Coal or Coke | 3 (0.1%) | 0 (0.0%) |
| All other Fuels | 911 (23.8%) | 38 (5.3%) |
| No Fuel Used | 7 (0.2%) | 8 (1.1%) |
| Total | 3,832 (100.0%) | 717 (100.0%) |
Household Vehicle Usage in Lake County

| Vehicles per Household | Owner-occupied | Renter-occupied |
| No Vehicle | 197 (5.1%) | 225 (31.4%) |
| 1 Vehicle | 1,334 (34.8%) | 312 (43.5%) |
| 2 Vehicles | 1,506 (39.3%) | 152 (21.2%) |
| 3 or more Vehicles | 795 (20.7%) | 28 (3.9%) |
| Total | 3,832 (100.0%) | 717 (100.0%) |
Real Estate & Mortgages in Lake County
Real Estate and Mortgage Overview in Lake County
| Characteristic | Without Mortgage | With Mortgage |
| Housing Units | 2,138 | 1,694 |
| Median Property Value | $97,600 | $135,500 |
| Median Household Income | $41,814 | $146 |
| Monthly Housing Costs | $427 | $23 |
| Real Estate Taxes | $1,228 | $86 |
Property Value by Mortgage Status in Lake County
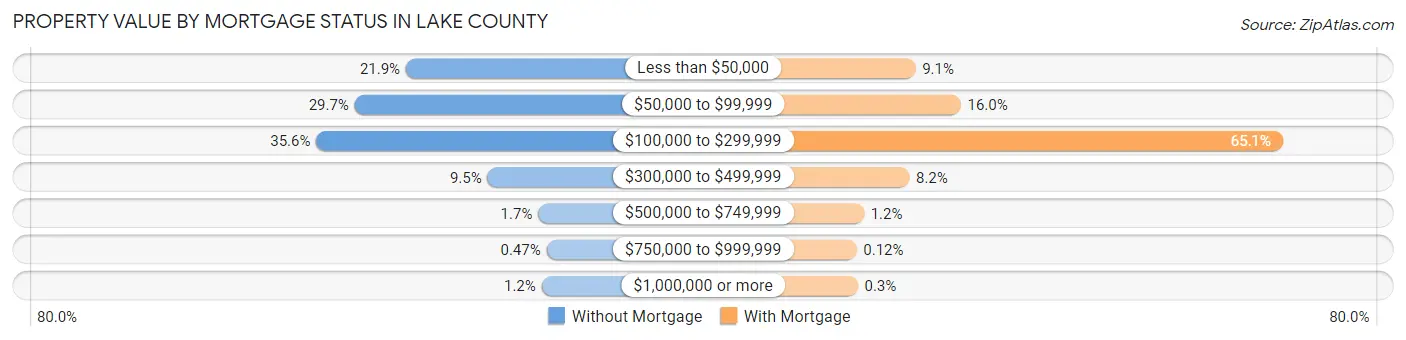
| Property Value | Without Mortgage | With Mortgage |
| Less than $50,000 | 468 (21.9%) | 154 (9.1%) |
| $50,000 to $99,999 | 635 (29.7%) | 271 (16.0%) |
| $100,000 to $299,999 | 760 (35.5%) | 1,103 (65.1%) |
| $300,000 to $499,999 | 202 (9.5%) | 138 (8.2%) |
| $500,000 to $749,999 | 37 (1.7%) | 21 (1.2%) |
| $750,000 to $999,999 | 10 (0.5%) | 2 (0.1%) |
| $1,000,000 or more | 26 (1.2%) | 5 (0.3%) |
| Total | 2,138 (100.0%) | 1,694 (100.0%) |
Household Income by Mortgage Status in Lake County
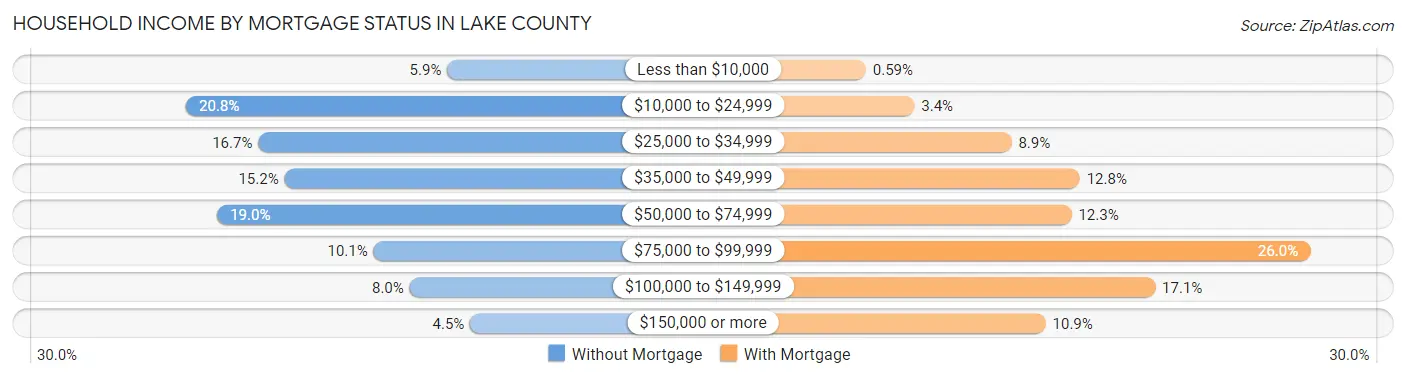
| Household Income | Without Mortgage | With Mortgage |
| Less than $10,000 | 125 (5.9%) | 10 (0.6%) |
| $10,000 to $24,999 | 444 (20.8%) | 57 (3.4%) |
| $25,000 to $34,999 | 356 (16.7%) | 151 (8.9%) |
| $35,000 to $49,999 | 324 (15.1%) | 217 (12.8%) |
| $50,000 to $74,999 | 406 (19.0%) | 209 (12.3%) |
| $75,000 to $99,999 | 215 (10.1%) | 440 (26.0%) |
| $100,000 to $149,999 | 171 (8.0%) | 290 (17.1%) |
| $150,000 or more | 97 (4.5%) | 184 (10.9%) |
| Total | 2,138 (100.0%) | 1,694 (100.0%) |
Property Value to Household Income Ratio in Lake County
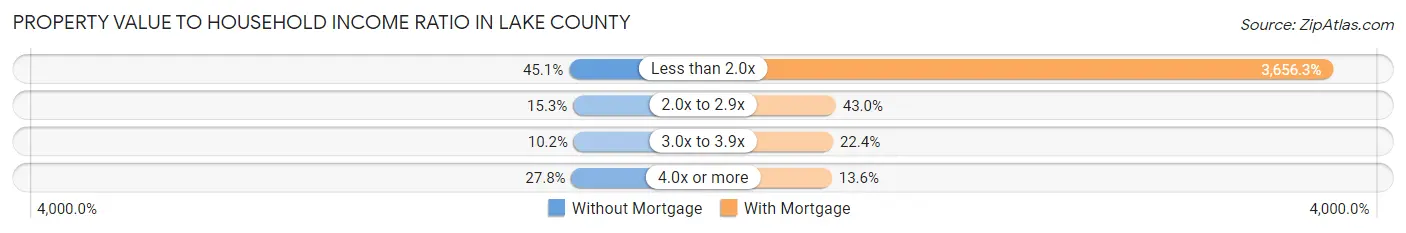
| Value-to-Income Ratio | Without Mortgage | With Mortgage |
| Less than 2.0x | 964 (45.1%) | 61,938 (3,656.3%) |
| 2.0x to 2.9x | 326 (15.2%) | 728 (43.0%) |
| 3.0x to 3.9x | 217 (10.2%) | 379 (22.4%) |
| 4.0x or more | 595 (27.8%) | 230 (13.6%) |
| Total | 2,138 (100.0%) | 1,694 (100.0%) |
Real Estate Taxes by Mortgage Status in Lake County
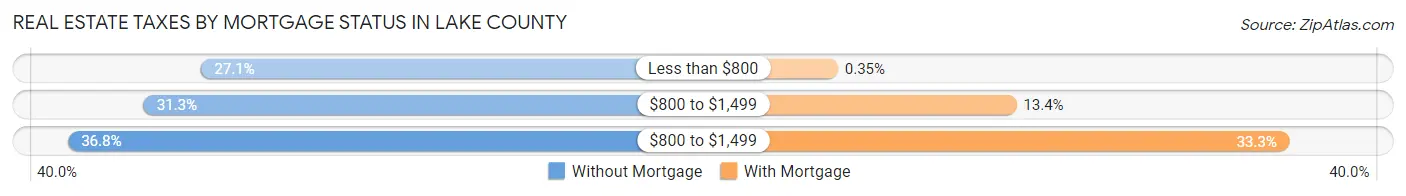
| Property Taxes | Without Mortgage | With Mortgage |
| Less than $800 | 579 (27.1%) | 6 (0.4%) |
| $800 to $1,499 | 669 (31.3%) | 227 (13.4%) |
| $800 to $1,499 | 787 (36.8%) | 564 (33.3%) |
| Total | 2,138 (100.0%) | 1,694 (100.0%) |
Health & Disability in Lake County
Health Insurance Coverage by Age in Lake County
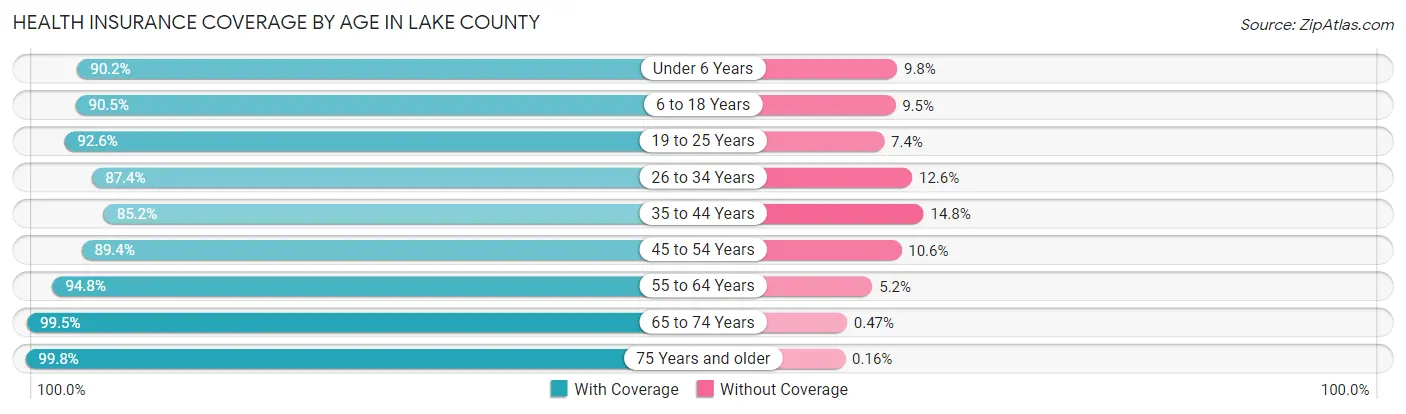
| Age Bracket | With Coverage | Without Coverage |
| Under 6 Years | 522 (90.2%) | 57 (9.8%) |
| 6 to 18 Years | 1,277 (90.5%) | 134 (9.5%) |
| 19 to 25 Years | 660 (92.6%) | 53 (7.4%) |
| 26 to 34 Years | 823 (87.4%) | 119 (12.6%) |
| 35 to 44 Years | 1,067 (85.2%) | 185 (14.8%) |
| 45 to 54 Years | 1,395 (89.4%) | 166 (10.6%) |
| 55 to 64 Years | 2,088 (94.8%) | 115 (5.2%) |
| 65 to 74 Years | 2,114 (99.5%) | 10 (0.5%) |
| 75 Years and older | 1,230 (99.8%) | 2 (0.2%) |
| Total | 11,176 (93.0%) | 841 (7.0%) |
Health Insurance Coverage by Citizenship Status in Lake County
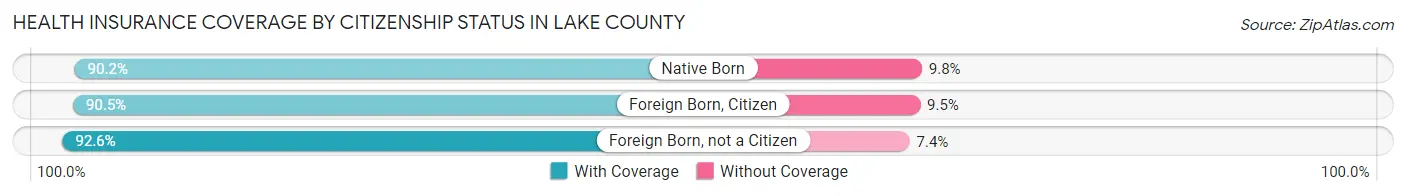
| Citizenship Status | With Coverage | Without Coverage |
| Native Born | 522 (90.2%) | 57 (9.8%) |
| Foreign Born, Citizen | 1,277 (90.5%) | 134 (9.5%) |
| Foreign Born, not a Citizen | 660 (92.6%) | 53 (7.4%) |
Health Insurance Coverage by Household Income in Lake County
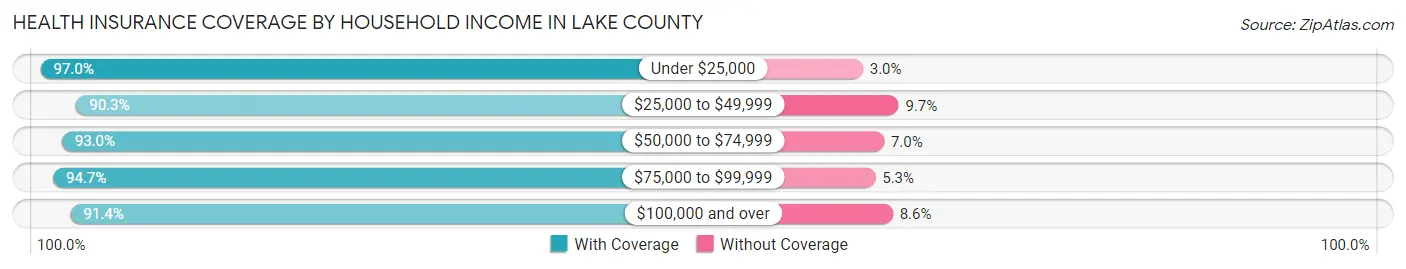
| Household Income | With Coverage | Without Coverage |
| Under $25,000 | 2,042 (97.0%) | 63 (3.0%) |
| $25,000 to $49,999 | 2,804 (90.3%) | 301 (9.7%) |
| $50,000 to $74,999 | 2,629 (93.0%) | 197 (7.0%) |
| $75,000 to $99,999 | 1,755 (94.7%) | 99 (5.3%) |
| $100,000 and over | 1,922 (91.4%) | 181 (8.6%) |
Public vs Private Health Insurance Coverage by Age in Lake County
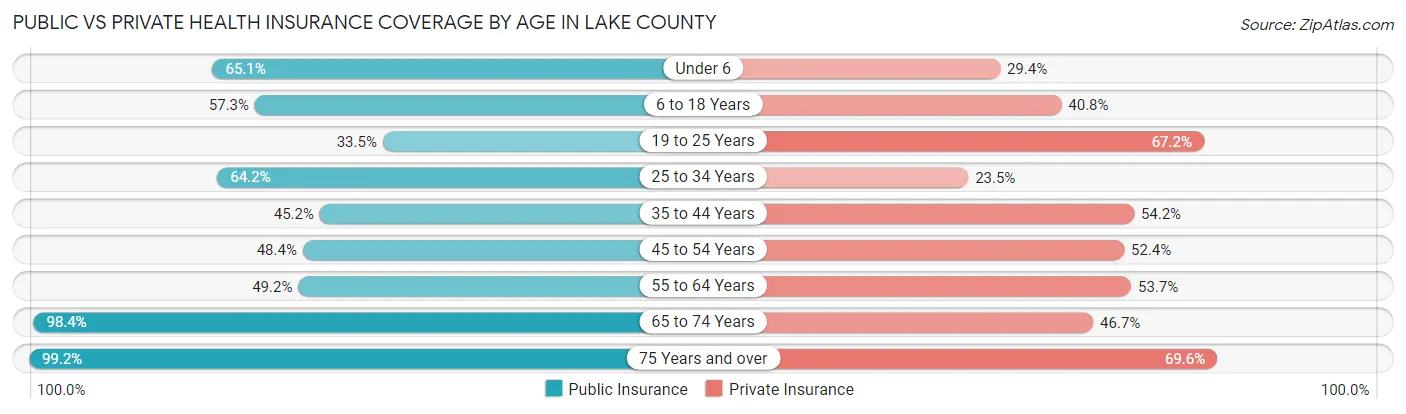
| Age Bracket | Public Insurance | Private Insurance |
| Under 6 | 377 (65.1%) | 170 (29.4%) |
| 6 to 18 Years | 808 (57.3%) | 575 (40.7%) |
| 19 to 25 Years | 239 (33.5%) | 479 (67.2%) |
| 25 to 34 Years | 605 (64.2%) | 221 (23.5%) |
| 35 to 44 Years | 566 (45.2%) | 679 (54.2%) |
| 45 to 54 Years | 755 (48.4%) | 818 (52.4%) |
| 55 to 64 Years | 1,084 (49.2%) | 1,183 (53.7%) |
| 65 to 74 Years | 2,089 (98.4%) | 991 (46.7%) |
| 75 Years and over | 1,222 (99.2%) | 858 (69.6%) |
| Total | 7,745 (64.4%) | 5,974 (49.7%) |
Disability Status by Sex by Age in Lake County
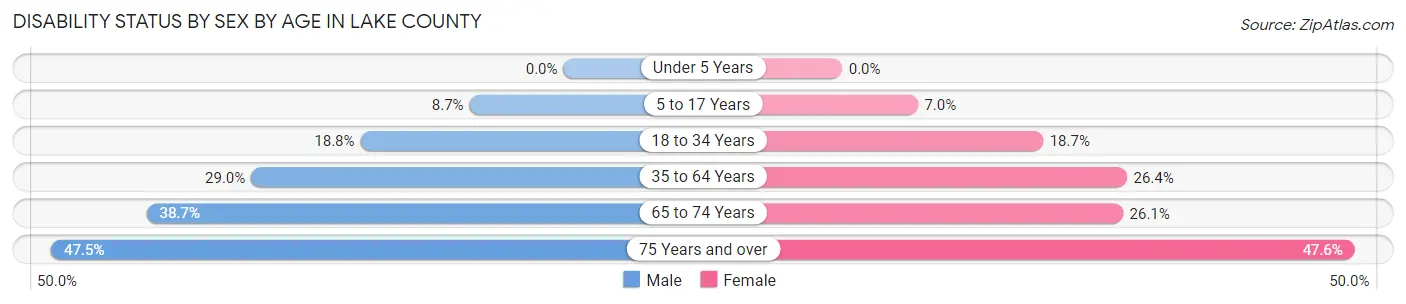
| Age Bracket | Male | Female |
| Under 5 Years | 0 (0.0%) | 0 (0.0%) |
| 5 to 17 Years | 62 (8.7%) | 46 (7.0%) |
| 18 to 34 Years | 199 (18.8%) | 141 (18.6%) |
| 35 to 64 Years | 800 (29.0%) | 596 (26.4%) |
| 65 to 74 Years | 446 (38.7%) | 253 (26.1%) |
| 75 Years and over | 299 (47.5%) | 287 (47.6%) |
Disability Class by Sex by Age in Lake County
Disability Class: Hearing Difficulty
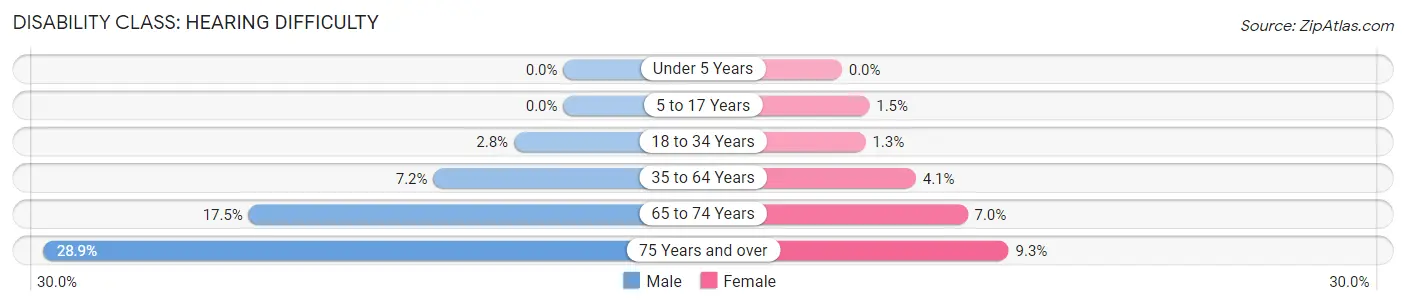
| Age Bracket | Male | Female |
| Under 5 Years | 0 (0.0%) | 0 (0.0%) |
| 5 to 17 Years | 0 (0.0%) | 10 (1.5%) |
| 18 to 34 Years | 29 (2.8%) | 10 (1.3%) |
| 35 to 64 Years | 200 (7.2%) | 93 (4.1%) |
| 65 to 74 Years | 202 (17.5%) | 68 (7.0%) |
| 75 Years and over | 182 (28.9%) | 56 (9.3%) |
Disability Class: Vision Difficulty
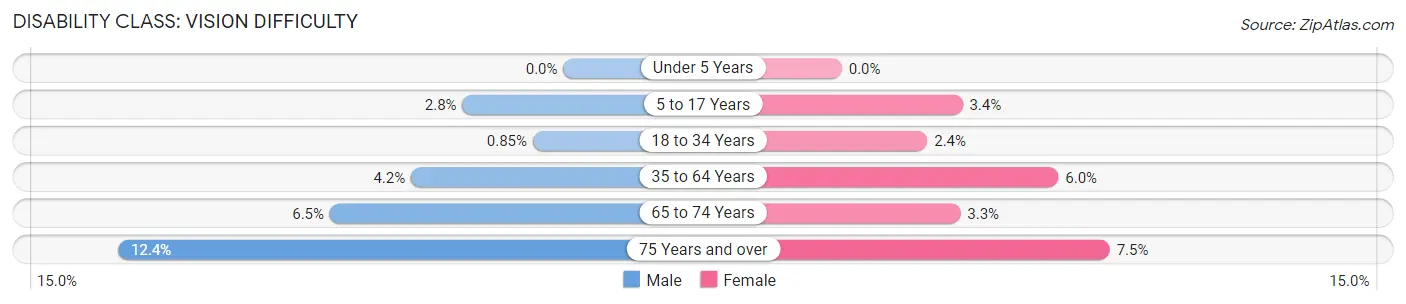
| Age Bracket | Male | Female |
| Under 5 Years | 0 (0.0%) | 0 (0.0%) |
| 5 to 17 Years | 20 (2.8%) | 22 (3.4%) |
| 18 to 34 Years | 9 (0.9%) | 18 (2.4%) |
| 35 to 64 Years | 117 (4.2%) | 136 (6.0%) |
| 65 to 74 Years | 75 (6.5%) | 32 (3.3%) |
| 75 Years and over | 78 (12.4%) | 45 (7.5%) |
Disability Class: Cognitive Difficulty
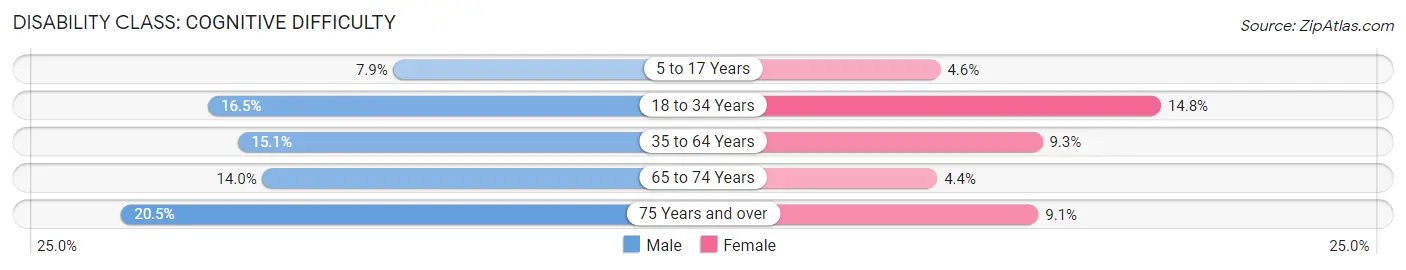
| Age Bracket | Male | Female |
| 5 to 17 Years | 56 (7.9%) | 30 (4.6%) |
| 18 to 34 Years | 174 (16.5%) | 112 (14.8%) |
| 35 to 64 Years | 416 (15.1%) | 210 (9.3%) |
| 65 to 74 Years | 161 (14.0%) | 43 (4.4%) |
| 75 Years and over | 129 (20.5%) | 55 (9.1%) |
Disability Class: Ambulatory Difficulty
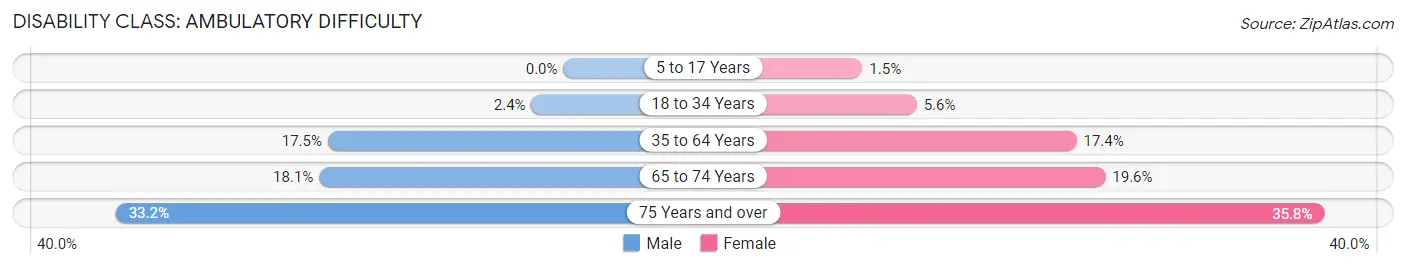
| Age Bracket | Male | Female |
| 5 to 17 Years | 0 (0.0%) | 10 (1.5%) |
| 18 to 34 Years | 25 (2.4%) | 42 (5.6%) |
| 35 to 64 Years | 483 (17.5%) | 393 (17.4%) |
| 65 to 74 Years | 209 (18.1%) | 190 (19.6%) |
| 75 Years and over | 209 (33.2%) | 216 (35.8%) |
Disability Class: Self-Care Difficulty
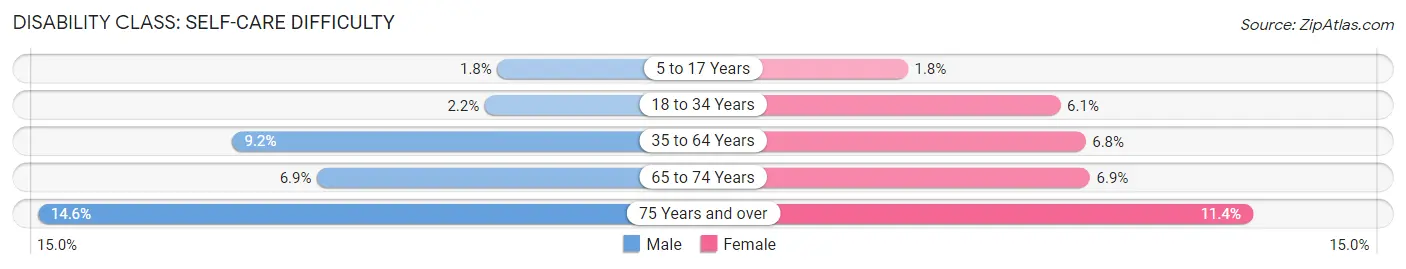
| Age Bracket | Male | Female |
| 5 to 17 Years | 13 (1.8%) | 12 (1.8%) |
| 18 to 34 Years | 23 (2.2%) | 46 (6.1%) |
| 35 to 64 Years | 255 (9.2%) | 153 (6.8%) |
| 65 to 74 Years | 79 (6.9%) | 67 (6.9%) |
| 75 Years and over | 92 (14.6%) | 69 (11.4%) |
Technology Access in Lake County
Computing Device Access in Lake County
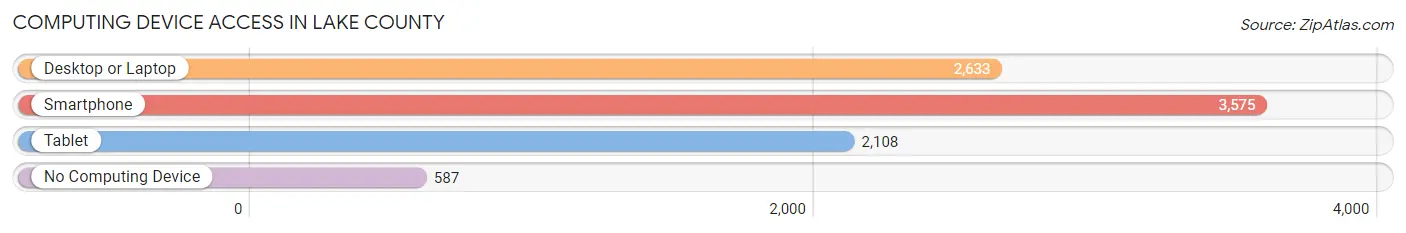
| Device Type | # Households | % Households |
| Desktop or Laptop | 2,633 | 57.9% |
| Smartphone | 3,575 | 78.6% |
| Tablet | 2,108 | 46.3% |
| No Computing Device | 587 | 12.9% |
| Total | 4,549 | 100.0% |
Internet Access in Lake County
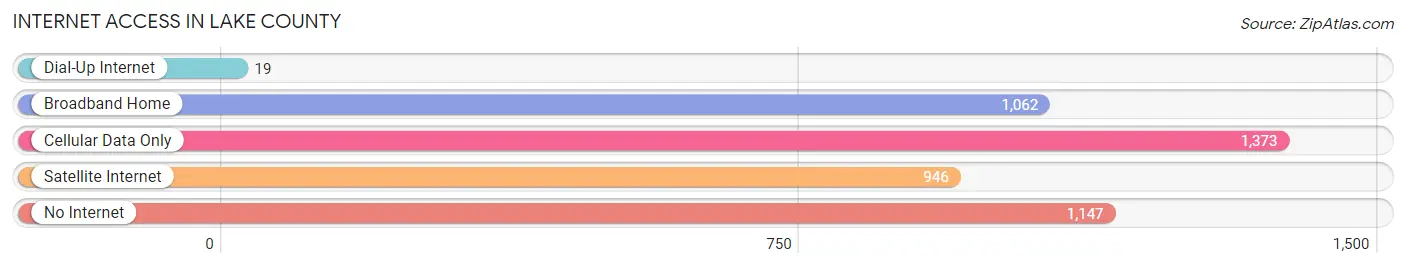
| Internet Type | # Households | % Households |
| Dial-Up Internet | 19 | 0.4% |
| Broadband Home | 1,062 | 23.4% |
| Cellular Data Only | 1,373 | 30.2% |
| Satellite Internet | 946 | 20.8% |
| No Internet | 1,147 | 25.2% |
| Total | 4,549 | 100.0% |
Lake County Summary
Lake County is located in the Upper Peninsula of Michigan, and is bordered by the counties of Baraga, Houghton, and Marquette. It is the second-smallest county in the state, with a total area of only 545 square miles. The county seat is Baldwin, and the largest city is Baldwin.
History
The area that is now Lake County was first inhabited by the Ojibwe people, who were the original inhabitants of the Upper Peninsula. The first European settlers arrived in the area in the early 1800s, and the county was officially organized in 1871. The county was named after Lake Superior, which forms its western border.
The county was largely rural until the late 19th century, when the lumber industry began to boom. The area was heavily logged, and the lumber industry was the main source of employment for many years. The county also had a thriving mining industry, with copper, iron, and silver being mined in the area.
The county experienced a population boom in the early 20th century, as many people moved to the area to work in the lumber and mining industries. The population peaked in the 1950s, but has since declined due to the decline of the lumber and mining industries.
Geography
Lake County is located in the Upper Peninsula of Michigan, and is bordered by the counties of Baraga, Houghton, and Marquette. It is the second-smallest county in the state, with a total area of only 545 square miles. The county is mostly forested, with the majority of the land being covered in coniferous and deciduous trees. The county is also home to several lakes, including Lake Superior, which forms its western border.
The county is divided into two distinct regions: the western region, which is mostly flat and heavily forested, and the eastern region, which is more hilly and has more open land. The county is also home to several rivers, including the Ontonagon River, which flows through the county from north to south.
Economy
The economy of Lake County is largely based on tourism and outdoor recreation. The county is home to several state parks, including Porcupine Mountains Wilderness State Park, which is the largest state park in the Upper Peninsula. The county is also home to several ski resorts, which attract visitors from all over the Midwest.
The county also has a thriving agricultural industry, with dairy farming being the main source of income for many farmers. The county is also home to several wineries, which produce a variety of wines from local grapes.
Demographics
As of the 2010 census, the population of Lake County was 11,539. The population is largely white (94.3%), with small percentages of Native American (2.2%), African American (1.2%), and Asian (0.7%) populations. The median household income is $41,945, and the median age is 44.7 years.
Conclusion
Lake County is a small county located in the Upper Peninsula of Michigan. It is bordered by the counties of Baraga, Houghton, and Marquette, and is home to Lake Superior, which forms its western border. The county has a long history of logging and mining, but the economy is now largely based on tourism and outdoor recreation. The population is largely white, with small percentages of Native American, African American, and Asian populations. The median household income is $41,945, and the median age is 44.7 years.
Common Questions
What is Per Capita Income in Lake County?
Per Capita income in Lake County is $25,695.
What is the Median Family Income in Lake County?
Median Family Income in Lake County is $59,741.
What is the Median Household income in Lake County?
Median Household Income in Lake County is $45,946.
What is Income or Wage Gap in Lake County?
Income or Wage Gap in Lake County is 21.4%.
Women in Lake County earn 78.6 cents for every dollar earned by a man.
What is Family Income Deficit in Lake County?
Family Income Deficit in Lake County is $9,455.
Families that are below poverty line in Lake County earn $9,455 less on average than the poverty threshold level.
What is Inequality or Gini Index in Lake County?
Inequality or Gini Index in Lake County is 0.45.
What is the Total Population of Lake County?
Total Population of Lake County is 12,285.
What is the Total Male Population of Lake County?
Total Male Population of Lake County is 6,753.
What is the Total Female Population of Lake County?
Total Female Population of Lake County is 5,532.
What is the Ratio of Males per 100 Females in Lake County?
There are 122.07 Males per 100 Females in Lake County.
What is the Ratio of Females per 100 Males in Lake County?
There are 81.92 Females per 100 Males in Lake County.
What is the Median Population Age in Lake County?
Median Population Age in Lake County is 51.8 Years.
What is the Average Family Size in Lake County
Average Family Size in Lake County is 3.6 People.
What is the Average Household Size in Lake County
Average Household Size in Lake County is 2.6 People.
How Large is the Labor Force in Lake County?
There are 4,366 People in the Labor Forcein in Lake County.
What is the Percentage of People in the Labor Force in Lake County?
41.0% of People are in the Labor Force in Lake County.
What is the Unemployment Rate in Lake County?
Unemployment Rate in Lake County is 7.5%.