Isabella County, MI Map & Demographics
Isabella County Overview
$28,809
PER CAPITA INCOME
$72,615
AVG FAMILY INCOME
$52,638
AVG HOUSEHOLD INCOME
43.3%
WAGE / INCOME GAP [ % ]
56.7¢/ $1
WAGE / INCOME GAP [ $ ]
$9,528
FAMILY INCOME DEFICIT
0.48
INEQUALITY / GINI INDEX
64,938
TOTAL POPULATION
31,554
MALE POPULATION
33,384
FEMALE POPULATION
94.52
MALES / 100 FEMALES
105.80
FEMALES / 100 MALES
28.9
MEDIAN AGE
2.9
AVG FAMILY SIZE
2.4
AVG HOUSEHOLD SIZE
34,122
LABOR FORCE [ PEOPLE ]
61.9%
PERCENT IN LABOR FORCE
7.2%
UNEMPLOYMENT RATE
Isabella County Area Codes
Income in Isabella County
Income Overview in Isabella County
Per Capita Income in Isabella County is $28,809, while median incomes of families and households are $72,615 and $52,638 respectively.
| Characteristic | Number | Measure |
| Per Capita Income | 64,938 | $28,809 |
| Median Family Income | 13,598 | $72,615 |
| Mean Family Income | 13,598 | $91,558 |
| Median Household Income | 24,875 | $52,638 |
| Mean Household Income | 24,875 | $71,460 |
| Income Deficit | 13,598 | $9,528 |
| Wage / Income Gap (%) | 64,938 | 43.28% |
| Wage / Income Gap ($) | 64,938 | 56.72¢ per $1 |
| Gini / Inequality Index | 64,938 | 0.48 |
Earnings by Sex in Isabella County
Average Earnings in Isabella County are $23,021, $30,269 for men and $17,170 for women, a difference of 43.3%.
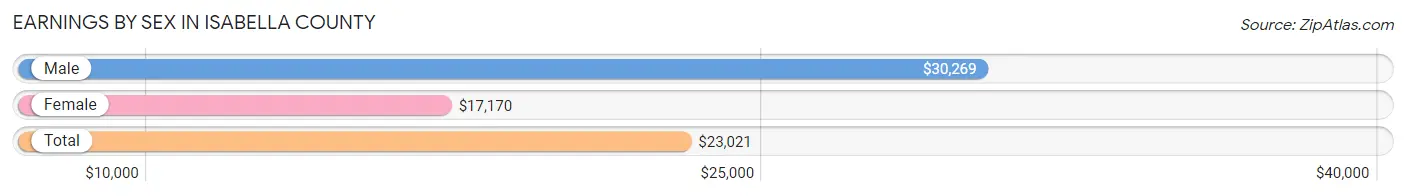
| Sex | Number | Average Earnings |
| Male | 19,227 (50.4%) | $30,269 |
| Female | 18,897 (49.6%) | $17,170 |
| Total | 38,124 (100.0%) | $23,021 |
Earnings by Sex by Income Bracket in Isabella County
The most common earnings brackets in Isabella County are $75,000 to $99,999 for men (1,638 | 8.5%) and $2,499 or less for women (2,513 | 13.3%).
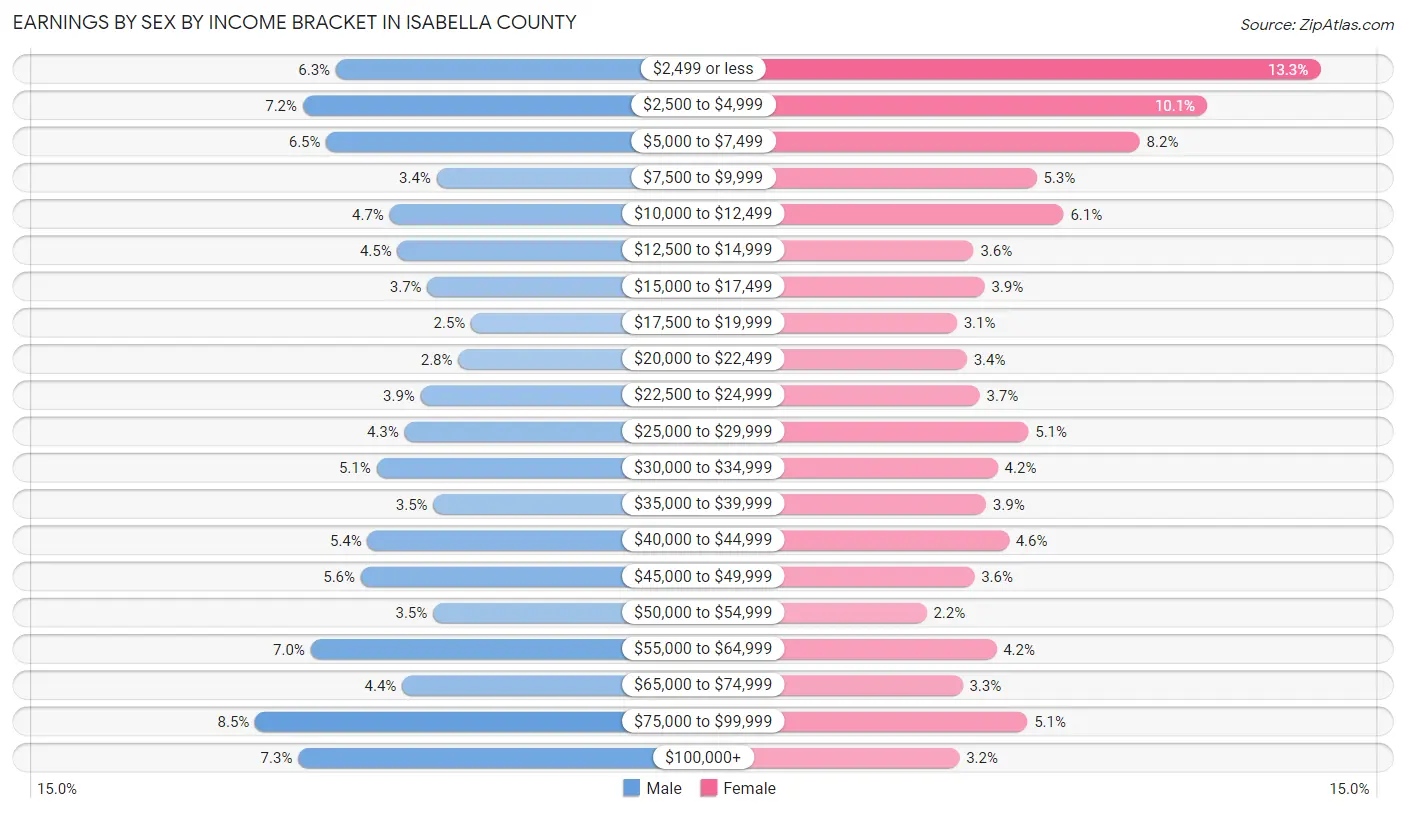
| Income | Male | Female |
| $2,499 or less | 1,202 (6.2%) | 2,513 (13.3%) |
| $2,500 to $4,999 | 1,380 (7.2%) | 1,913 (10.1%) |
| $5,000 to $7,499 | 1,253 (6.5%) | 1,556 (8.2%) |
| $7,500 to $9,999 | 657 (3.4%) | 1,007 (5.3%) |
| $10,000 to $12,499 | 912 (4.7%) | 1,151 (6.1%) |
| $12,500 to $14,999 | 869 (4.5%) | 673 (3.6%) |
| $15,000 to $17,499 | 708 (3.7%) | 732 (3.9%) |
| $17,500 to $19,999 | 472 (2.5%) | 584 (3.1%) |
| $20,000 to $22,499 | 541 (2.8%) | 637 (3.4%) |
| $22,500 to $24,999 | 745 (3.9%) | 705 (3.7%) |
| $25,000 to $29,999 | 830 (4.3%) | 964 (5.1%) |
| $30,000 to $34,999 | 983 (5.1%) | 802 (4.2%) |
| $35,000 to $39,999 | 674 (3.5%) | 739 (3.9%) |
| $40,000 to $44,999 | 1,031 (5.4%) | 859 (4.5%) |
| $45,000 to $49,999 | 1,068 (5.6%) | 676 (3.6%) |
| $50,000 to $54,999 | 676 (3.5%) | 423 (2.2%) |
| $55,000 to $64,999 | 1,339 (7.0%) | 793 (4.2%) |
| $65,000 to $74,999 | 844 (4.4%) | 614 (3.3%) |
| $75,000 to $99,999 | 1,638 (8.5%) | 959 (5.1%) |
| $100,000+ | 1,405 (7.3%) | 597 (3.2%) |
| Total | 19,227 (100.0%) | 18,897 (100.0%) |
Earnings by Sex by Educational Attainment in Isabella County
Average earnings in Isabella County are $46,477 for men and $35,693 for women, a difference of 23.2%. Men with an educational attainment of graduate degree enjoy the highest average annual earnings of $78,165, while those with less than high school education earn the least with $24,516. Women with an educational attainment of graduate degree earn the most with the average annual earnings of $64,832, while those with less than high school education have the smallest earnings of $16,607.
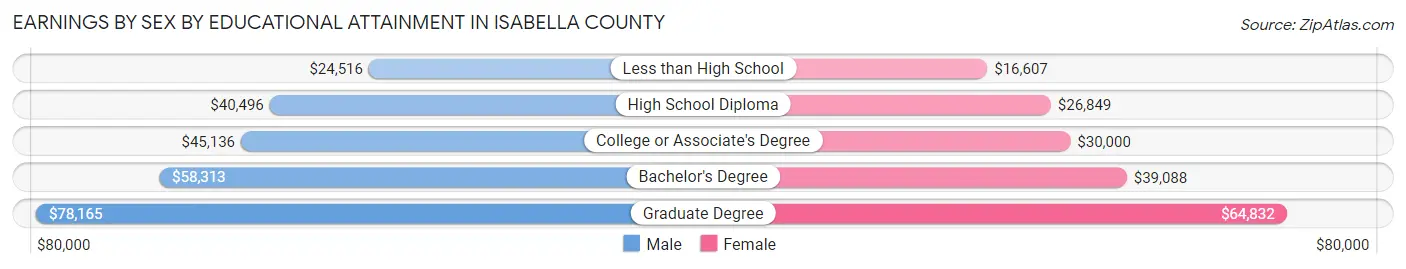
| Educational Attainment | Male Income | Female Income |
| Less than High School | $24,516 | $16,607 |
| High School Diploma | $40,496 | $26,849 |
| College or Associate's Degree | $45,136 | $30,000 |
| Bachelor's Degree | $58,313 | $39,088 |
| Graduate Degree | $78,165 | $64,832 |
| Total | $46,477 | $35,693 |
Family Income in Isabella County
Family Income Brackets in Isabella County
According to the Isabella County family income data, there are 2,516 families falling into the $100,000 to $149,999 income range, which is the most common income bracket and makes up 18.5% of all families. Conversely, the less than $10,000 income bracket is the least frequent group with only 476 families (3.5%) belonging to this category.
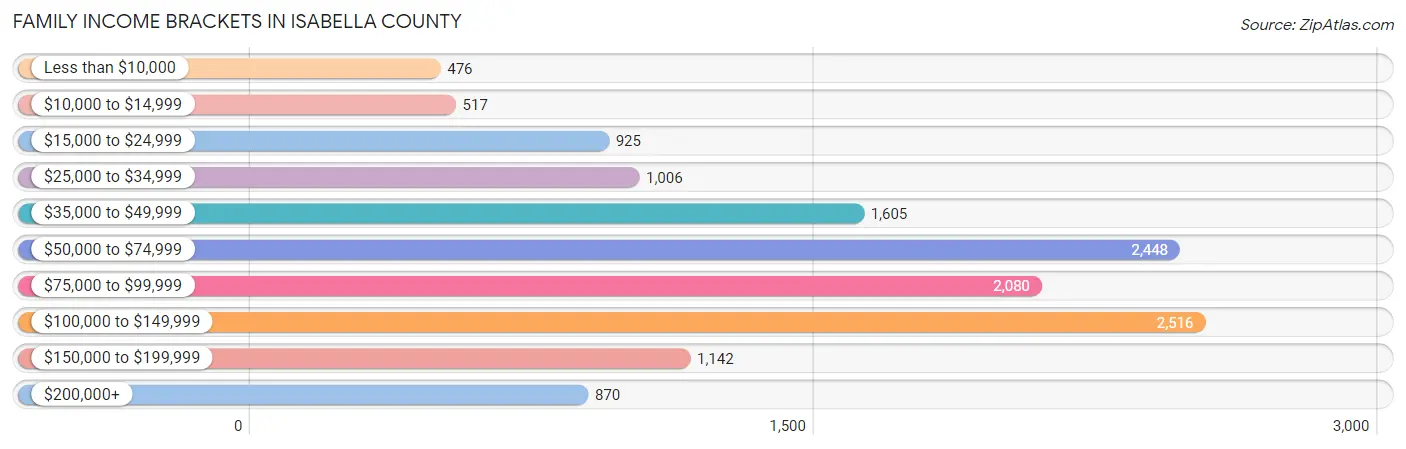
| Income Bracket | # Families | % Families |
| Less than $10,000 | 476 | 3.5% |
| $10,000 to $14,999 | 517 | 3.8% |
| $15,000 to $24,999 | 925 | 6.8% |
| $25,000 to $34,999 | 1,006 | 7.4% |
| $35,000 to $49,999 | 1,605 | 11.8% |
| $50,000 to $74,999 | 2,448 | 18.0% |
| $75,000 to $99,999 | 2,080 | 15.3% |
| $100,000 to $149,999 | 2,516 | 18.5% |
| $150,000 to $199,999 | 1,142 | 8.4% |
| $200,000+ | 870 | 6.4% |
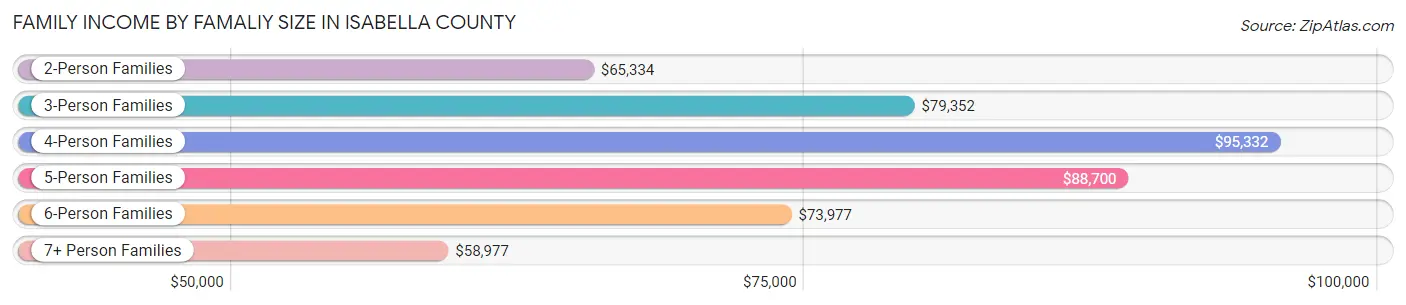
Family Income by Famaliy Size in Isabella County
4-person families (2,087 | 15.3%) account for the highest median family income in Isabella County with $95,332 per family, while 2-person families (7,365 | 54.2%) have the highest median income of $32,667 per family member.
| Income Bracket | # Families | Median Income |
| 2-Person Families | 7,365 (54.2%) | $65,334 |
| 3-Person Families | 2,978 (21.9%) | $79,352 |
| 4-Person Families | 2,087 (15.3%) | $95,332 |
| 5-Person Families | 656 (4.8%) | $88,700 |
| 6-Person Families | 313 (2.3%) | $73,977 |
| 7+ Person Families | 199 (1.5%) | $58,977 |
| Total | 13,598 (100.0%) | $72,615 |
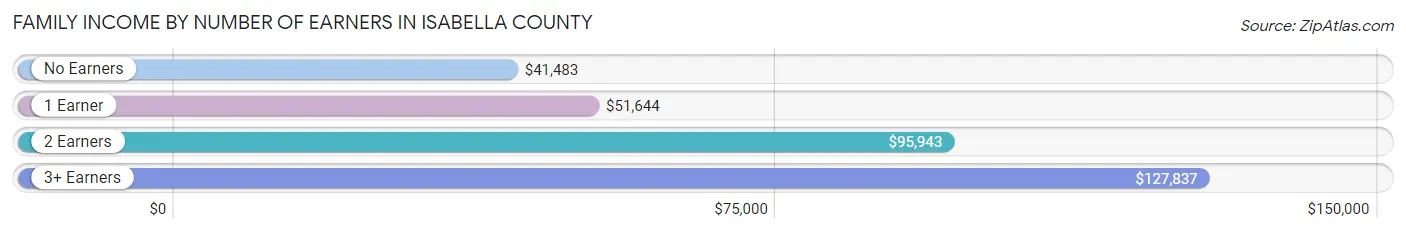
Family Income by Number of Earners in Isabella County
The median family income in Isabella County is $72,615, with families comprising 3+ earners (1,167) having the highest median family income of $127,837, while families with no earners (2,570) have the lowest median family income of $41,483, accounting for 8.6% and 18.9% of families, respectively.
| Number of Earners | # Families | Median Income |
| No Earners | 2,570 (18.9%) | $41,483 |
| 1 Earner | 4,533 (33.3%) | $51,644 |
| 2 Earners | 5,328 (39.2%) | $95,943 |
| 3+ Earners | 1,167 (8.6%) | $127,837 |
| Total | 13,598 (100.0%) | $72,615 |
Household Income in Isabella County
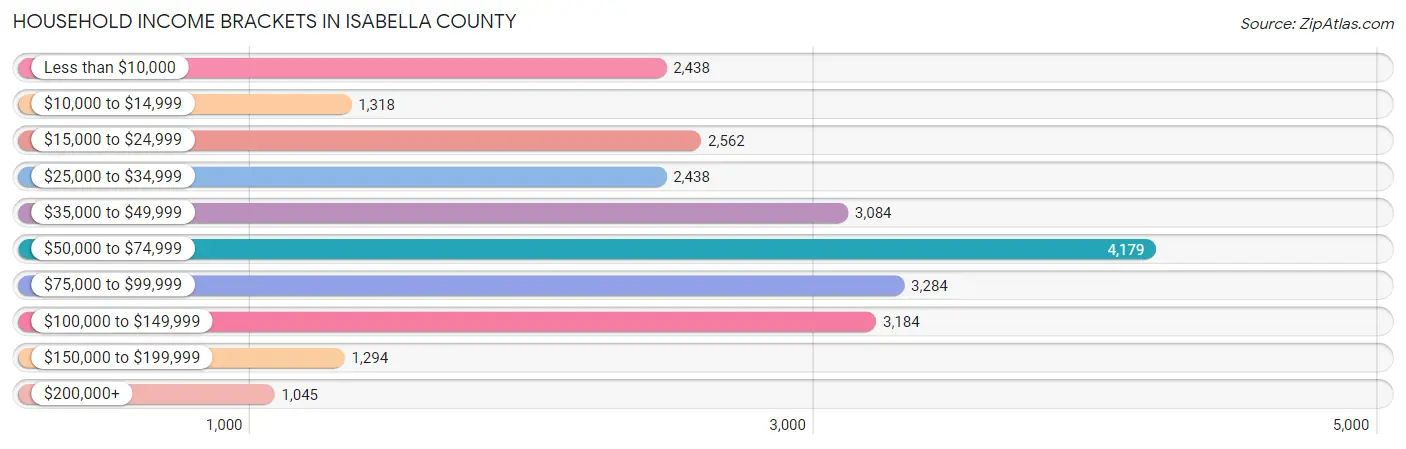
Household Income Brackets in Isabella County
With 4,179 households falling in the category, the $50,000 to $74,999 income range is the most frequent in Isabella County, accounting for 16.8% of all households. In contrast, only 1,045 households (4.2%) fall into the $200,000+ income bracket, making it the least populous group.
| Income Bracket | # Households | % Households |
| Less than $10,000 | 2,438 | 9.8% |
| $10,000 to $14,999 | 1,318 | 5.3% |
| $15,000 to $24,999 | 2,562 | 10.3% |
| $25,000 to $34,999 | 2,438 | 9.8% |
| $35,000 to $49,999 | 3,084 | 12.4% |
| $50,000 to $74,999 | 4,179 | 16.8% |
| $75,000 to $99,999 | 3,284 | 13.2% |
| $100,000 to $149,999 | 3,184 | 12.8% |
| $150,000 to $199,999 | 1,294 | 5.2% |
| $200,000+ | 1,045 | 4.2% |
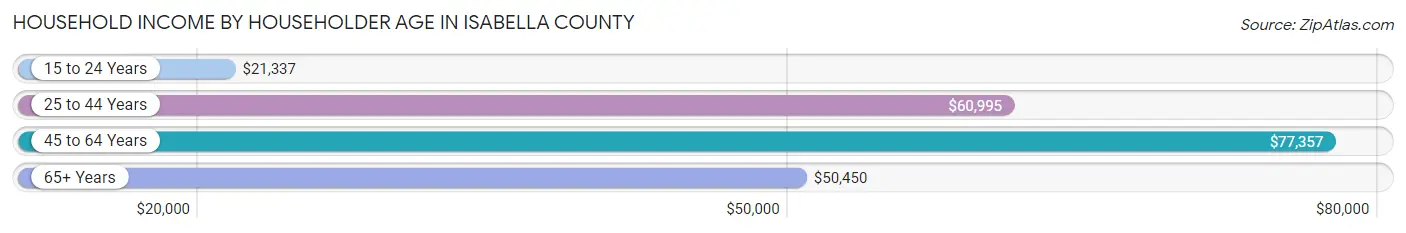
Household Income by Householder Age in Isabella County
The median household income in Isabella County is $52,638, with the highest median household income of $77,357 found in the 45 to 64 years age bracket for the primary householder. A total of 7,697 households (30.9%) fall into this category. Meanwhile, the 15 to 24 years age bracket for the primary householder has the lowest median household income of $21,337, with 4,443 households (17.9%) in this group.
| Income Bracket | # Households | Median Income |
| 15 to 24 Years | 4,443 (17.9%) | $21,337 |
| 25 to 44 Years | 7,306 (29.4%) | $60,995 |
| 45 to 64 Years | 7,697 (30.9%) | $77,357 |
| 65+ Years | 5,429 (21.8%) | $50,450 |
| Total | 24,875 (100.0%) | $52,638 |
Poverty in Isabella County
Income Below Poverty by Sex and Age in Isabella County
With 21.0% poverty level for males and 26.2% for females among the residents of Isabella County, 18 to 24 year old males and 18 to 24 year old females are the most vulnerable to poverty, with 2,830 males (46.9%) and 3,915 females (57.0%) in their respective age groups living below the poverty level.
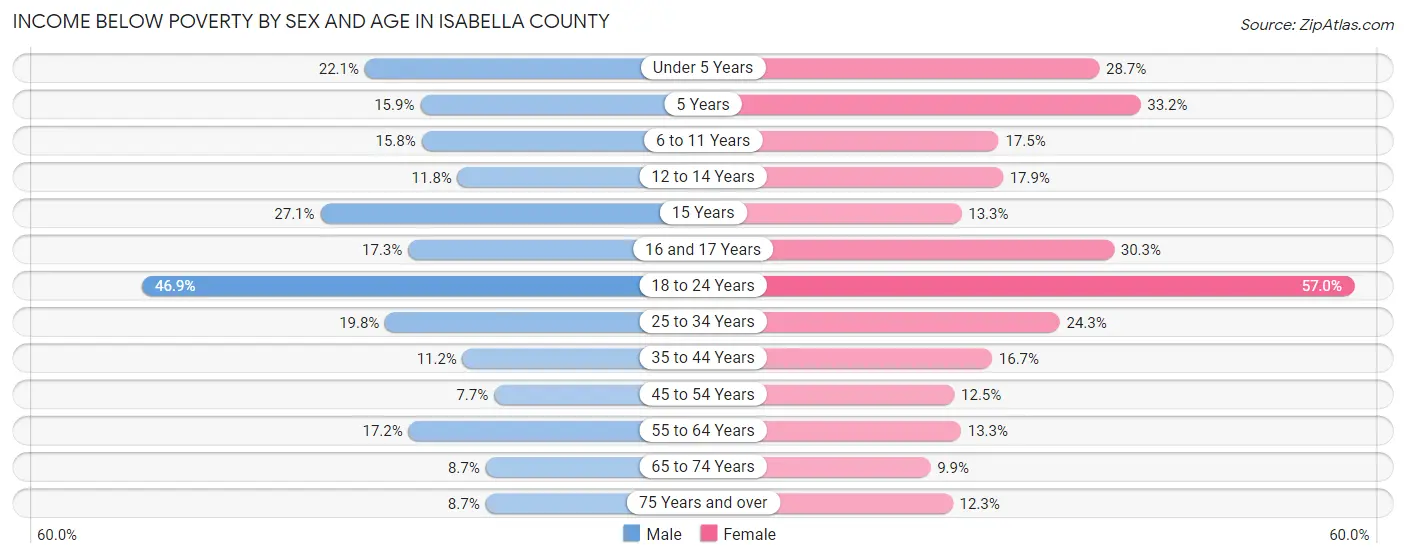
| Age Bracket | Male | Female |
| Under 5 Years | 298 (22.1%) | 442 (28.7%) |
| 5 Years | 40 (15.9%) | 124 (33.2%) |
| 6 to 11 Years | 287 (15.8%) | 310 (17.4%) |
| 12 to 14 Years | 119 (11.8%) | 153 (17.9%) |
| 15 Years | 82 (27.1%) | 41 (13.3%) |
| 16 and 17 Years | 118 (17.3%) | 186 (30.3%) |
| 18 to 24 Years | 2,830 (46.9%) | 3,915 (57.0%) |
| 25 to 34 Years | 810 (19.8%) | 838 (24.2%) |
| 35 to 44 Years | 370 (11.2%) | 539 (16.7%) |
| 45 to 54 Years | 241 (7.7%) | 384 (12.5%) |
| 55 to 64 Years | 578 (17.2%) | 461 (13.3%) |
| 65 to 74 Years | 218 (8.7%) | 270 (9.9%) |
| 75 Years and over | 113 (8.7%) | 231 (12.3%) |
| Total | 6,104 (21.0%) | 7,894 (26.2%) |
Income Above Poverty by Sex and Age in Isabella County
According to the poverty statistics in Isabella County, males aged 45 to 54 years and females aged 65 to 74 years are the age groups that are most secure financially, with 92.3% of males and 90.1% of females in these age groups living above the poverty line.
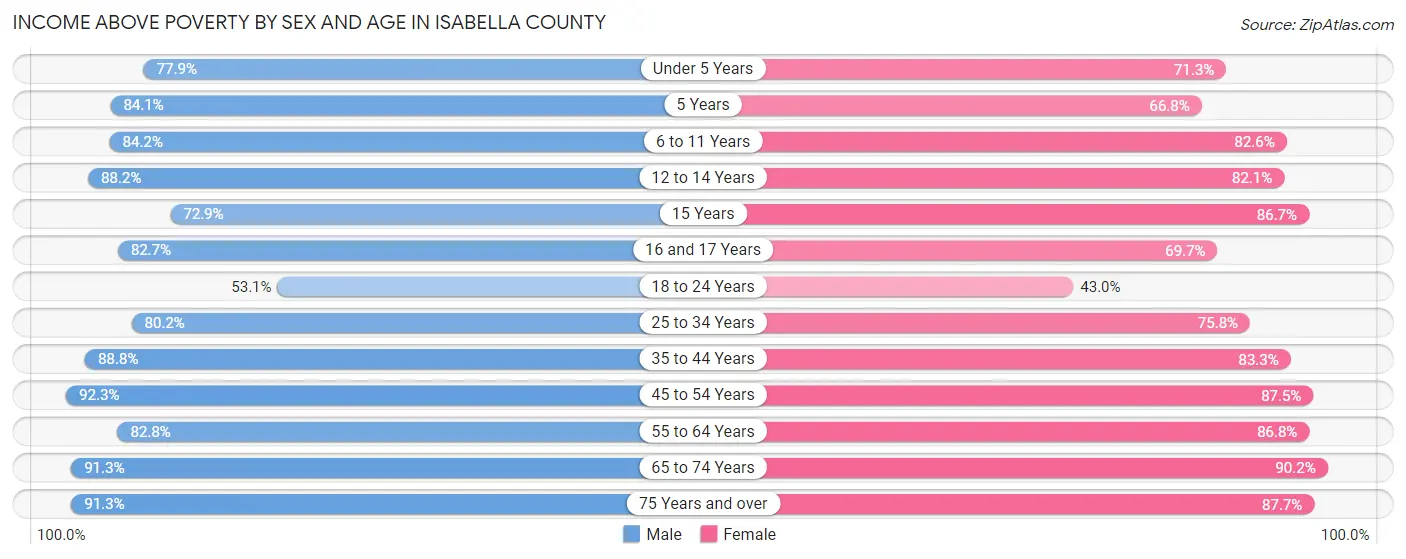
| Age Bracket | Male | Female |
| Under 5 Years | 1,050 (77.9%) | 1,100 (71.3%) |
| 5 Years | 211 (84.1%) | 249 (66.8%) |
| 6 to 11 Years | 1,531 (84.2%) | 1,467 (82.6%) |
| 12 to 14 Years | 892 (88.2%) | 701 (82.1%) |
| 15 Years | 221 (72.9%) | 267 (86.7%) |
| 16 and 17 Years | 564 (82.7%) | 428 (69.7%) |
| 18 to 24 Years | 3,201 (53.1%) | 2,951 (43.0%) |
| 25 to 34 Years | 3,272 (80.2%) | 2,617 (75.7%) |
| 35 to 44 Years | 2,930 (88.8%) | 2,686 (83.3%) |
| 45 to 54 Years | 2,881 (92.3%) | 2,686 (87.5%) |
| 55 to 64 Years | 2,774 (82.8%) | 3,017 (86.8%) |
| 65 to 74 Years | 2,300 (91.3%) | 2,471 (90.1%) |
| 75 Years and over | 1,190 (91.3%) | 1,643 (87.7%) |
| Total | 23,017 (79.0%) | 22,283 (73.8%) |
Income Below Poverty Among Married-Couple Families in Isabella County
The poverty statistics for married-couple families in Isabella County show that 6.3% or 614 of the total 9,761 families live below the poverty line. Families with 5 or more children have the highest poverty rate of 37.2%, comprising of 45 families. On the other hand, families with no children have the lowest poverty rate of 5.3%, which includes 334 families.
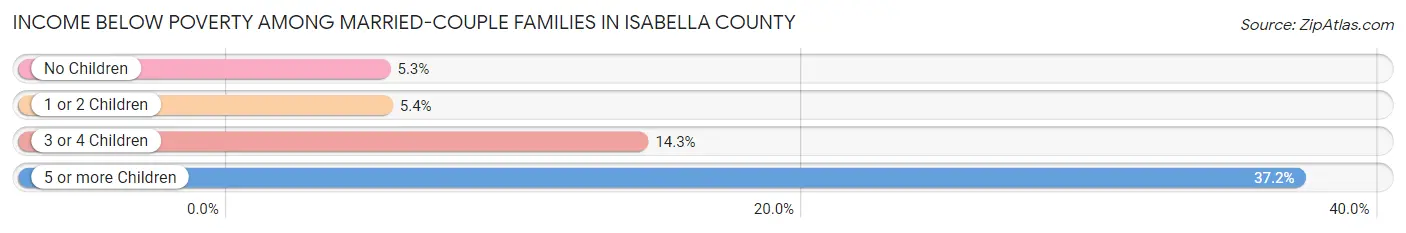
| Children | Above Poverty | Below Poverty |
| No Children | 5,953 (94.7%) | 334 (5.3%) |
| 1 or 2 Children | 2,596 (94.6%) | 148 (5.4%) |
| 3 or 4 Children | 522 (85.7%) | 87 (14.3%) |
| 5 or more Children | 76 (62.8%) | 45 (37.2%) |
| Total | 9,147 (93.7%) | 614 (6.3%) |
Income Below Poverty Among Single-Parent Households in Isabella County
According to the poverty data in Isabella County, 24.6% or 408 single-father households and 33.9% or 739 single-mother households are living below the poverty line. Among single-father households, those with 3 or 4 children have the highest poverty rate, with 99 households (55.3%) experiencing poverty. Likewise, among single-mother households, those with 5 or more children have the highest poverty rate, with 4 households (100.0%) falling below the poverty line.
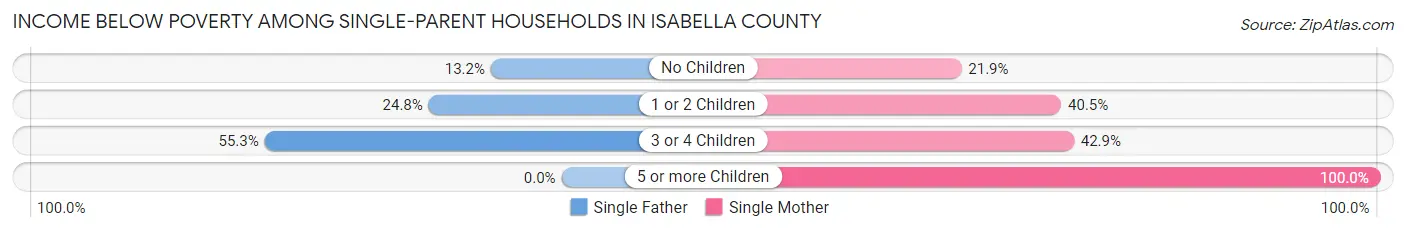
| Children | Single Father | Single Mother |
| No Children | 64 (13.2%) | 178 (21.9%) |
| 1 or 2 Children | 245 (24.7%) | 488 (40.5%) |
| 3 or 4 Children | 99 (55.3%) | 69 (42.9%) |
| 5 or more Children | 0 (0.0%) | 4 (100.0%) |
| Total | 408 (24.6%) | 739 (33.9%) |
Income Below Poverty Among Married-Couple vs Single-Parent Households in Isabella County
The poverty data for Isabella County shows that 614 of the married-couple family households (6.3%) and 1,147 of the single-parent households (29.9%) are living below the poverty level. Within the married-couple family households, those with 5 or more children have the highest poverty rate, with 45 households (37.2%) falling below the poverty line. Among the single-parent households, those with 5 or more children have the highest poverty rate, with 4 household (100.0%) living below poverty.
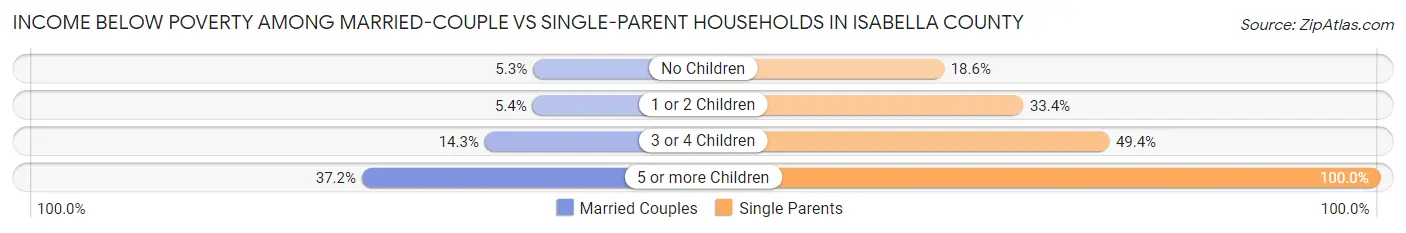
| Children | Married-Couple Families | Single-Parent Households |
| No Children | 334 (5.3%) | 242 (18.6%) |
| 1 or 2 Children | 148 (5.4%) | 733 (33.4%) |
| 3 or 4 Children | 87 (14.3%) | 168 (49.4%) |
| 5 or more Children | 45 (37.2%) | 4 (100.0%) |
| Total | 614 (6.3%) | 1,147 (29.9%) |
Race in Isabella County
The most populous races in Isabella County are White / Caucasian (55,847 | 86.0%), Two or more Races (3,474 | 5.3%), and Hispanic or Latino (2,840 | 4.4%).
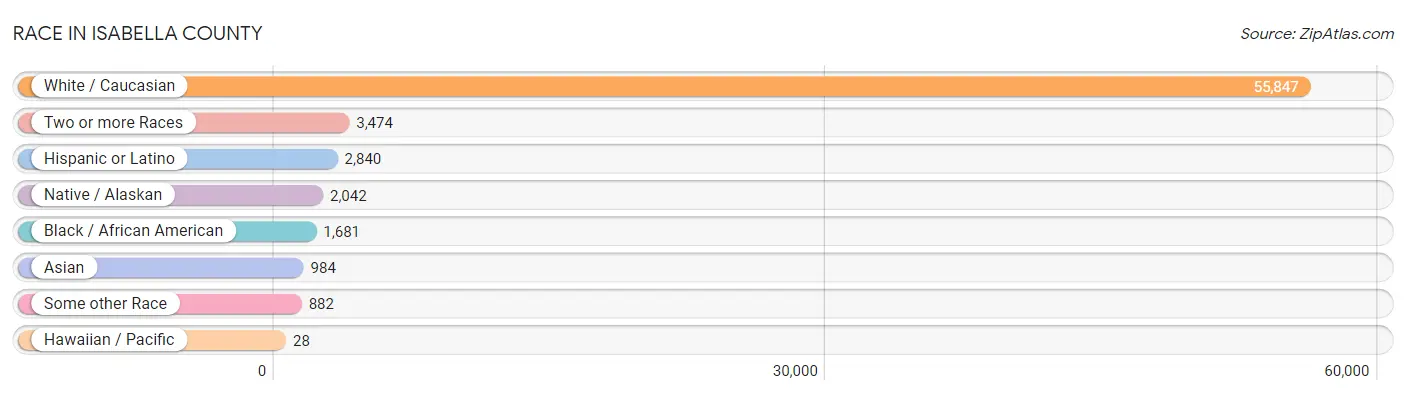
| Race | # Population | % Population |
| Asian | 984 | 1.5% |
| Black / African American | 1,681 | 2.6% |
| Hawaiian / Pacific | 28 | 0.0% |
| Hispanic or Latino | 2,840 | 4.4% |
| Native / Alaskan | 2,042 | 3.1% |
| White / Caucasian | 55,847 | 86.0% |
| Two or more Races | 3,474 | 5.3% |
| Some other Race | 882 | 1.4% |
| Total | 64,938 | 100.0% |
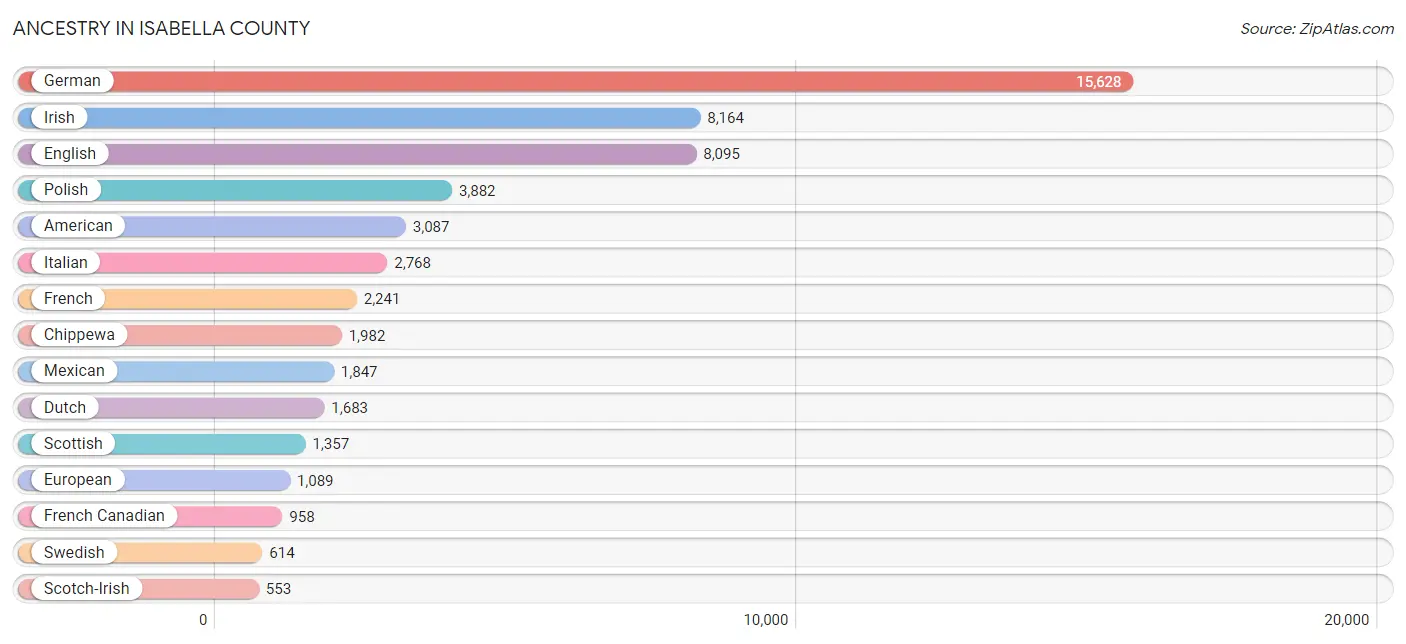
Ancestry in Isabella County
The most populous ancestries reported in Isabella County are German (15,628 | 24.1%), Irish (8,164 | 12.6%), English (8,095 | 12.5%), Polish (3,882 | 6.0%), and American (3,087 | 4.8%), together accounting for 59.8% of all Isabella County residents.
| Ancestry | # Population | % Population |
| African | 131 | 0.2% |
| Alaska Native | 5 | 0.0% |
| Albanian | 8 | 0.0% |
| American | 3,087 | 4.8% |
| Arab | 356 | 0.5% |
| Argentinean | 7 | 0.0% |
| Armenian | 38 | 0.1% |
| Assyrian / Chaldean / Syriac | 16 | 0.0% |
| Australian | 5 | 0.0% |
| Austrian | 183 | 0.3% |
| Bangladeshi | 12 | 0.0% |
| Belgian | 221 | 0.3% |
| Bhutanese | 57 | 0.1% |
| Blackfeet | 48 | 0.1% |
| British | 442 | 0.7% |
| British West Indian | 5 | 0.0% |
| Bulgarian | 10 | 0.0% |
| Burmese | 268 | 0.4% |
| Cambodian | 37 | 0.1% |
| Canadian | 268 | 0.4% |
| Cape Verdean | 21 | 0.0% |
| Celtic | 26 | 0.0% |
| Central American | 193 | 0.3% |
| Cherokee | 84 | 0.1% |
| Chilean | 7 | 0.0% |
| Chippewa | 1,982 | 3.0% |
| Choctaw | 9 | 0.0% |
| Colombian | 21 | 0.0% |
| Costa Rican | 6 | 0.0% |
| Croatian | 46 | 0.1% |
| Cuban | 70 | 0.1% |
| Czech | 358 | 0.5% |
| Czechoslovakian | 130 | 0.2% |
| Danish | 262 | 0.4% |
| Delaware | 2 | 0.0% |
| Dutch | 1,683 | 2.6% |
| Eastern European | 105 | 0.2% |
| Ecuadorian | 5 | 0.0% |
| English | 8,095 | 12.5% |
| Ethiopian | 12 | 0.0% |
| European | 1,089 | 1.7% |
| Filipino | 77 | 0.1% |
| Finnish | 281 | 0.4% |
| French | 2,241 | 3.5% |
| French American Indian | 12 | 0.0% |
| French Canadian | 958 | 1.5% |
| German | 15,628 | 24.1% |
| Ghanaian | 6 | 0.0% |
| Greek | 149 | 0.2% |
| Guamanian / Chamorro | 16 | 0.0% |
| Guatemalan | 117 | 0.2% |
| Haitian | 7 | 0.0% |
| Honduran | 9 | 0.0% |
| Hopi | 23 | 0.0% |
| Hungarian | 279 | 0.4% |
| Icelander | 8 | 0.0% |
| Indian (Asian) | 409 | 0.6% |
| Indonesian | 7 | 0.0% |
| Iranian | 30 | 0.1% |
| Irish | 8,164 | 12.6% |
| Iroquois | 10 | 0.0% |
| Italian | 2,768 | 4.3% |
| Jamaican | 19 | 0.0% |
| Japanese | 42 | 0.1% |
| Kenyan | 3 | 0.0% |
| Korean | 164 | 0.3% |
| Laotian | 9 | 0.0% |
| Latvian | 4 | 0.0% |
| Lebanese | 138 | 0.2% |
| Lithuanian | 121 | 0.2% |
| Lumbee | 22 | 0.0% |
| Luxembourger | 3 | 0.0% |
| Malaysian | 29 | 0.0% |
| Maltese | 93 | 0.1% |
| Mexican | 1,847 | 2.8% |
| Mongolian | 4 | 0.0% |
| Moroccan | 7 | 0.0% |
| Native Hawaiian | 12 | 0.0% |
| Navajo | 25 | 0.0% |
| Nigerian | 62 | 0.1% |
| Northern European | 49 | 0.1% |
| Norwegian | 497 | 0.8% |
| Ottawa | 279 | 0.4% |
| Pakistani | 15 | 0.0% |
| Palestinian | 8 | 0.0% |
| Panamanian | 50 | 0.1% |
| Paraguayan | 13 | 0.0% |
| Pennsylvania German | 261 | 0.4% |
| Peruvian | 45 | 0.1% |
| Polish | 3,882 | 6.0% |
| Portuguese | 75 | 0.1% |
| Potawatomi | 19 | 0.0% |
| Pueblo | 7 | 0.0% |
| Puerto Rican | 233 | 0.4% |
| Romanian | 114 | 0.2% |
| Russian | 329 | 0.5% |
| Salvadoran | 11 | 0.0% |
| Scandinavian | 215 | 0.3% |
| Scotch-Irish | 553 | 0.9% |
| Scottish | 1,357 | 2.1% |
| Seminole | 12 | 0.0% |
| Serbian | 59 | 0.1% |
| Sioux | 20 | 0.0% |
| Slavic | 85 | 0.1% |
| Slovak | 119 | 0.2% |
| Slovene | 50 | 0.1% |
| South African | 5 | 0.0% |
| South American | 103 | 0.2% |
| South American Indian | 29 | 0.0% |
| Spaniard | 102 | 0.2% |
| Spanish | 134 | 0.2% |
| Spanish American Indian | 5 | 0.0% |
| Sri Lankan | 47 | 0.1% |
| Subsaharan African | 248 | 0.4% |
| Swedish | 614 | 0.9% |
| Swiss | 252 | 0.4% |
| Syrian | 146 | 0.2% |
| Thai | 328 | 0.5% |
| Ukrainian | 139 | 0.2% |
| Welsh | 258 | 0.4% |
| West Indian | 9 | 0.0% |
| Yugoslavian | 34 | 0.1% | View All 122 Rows |
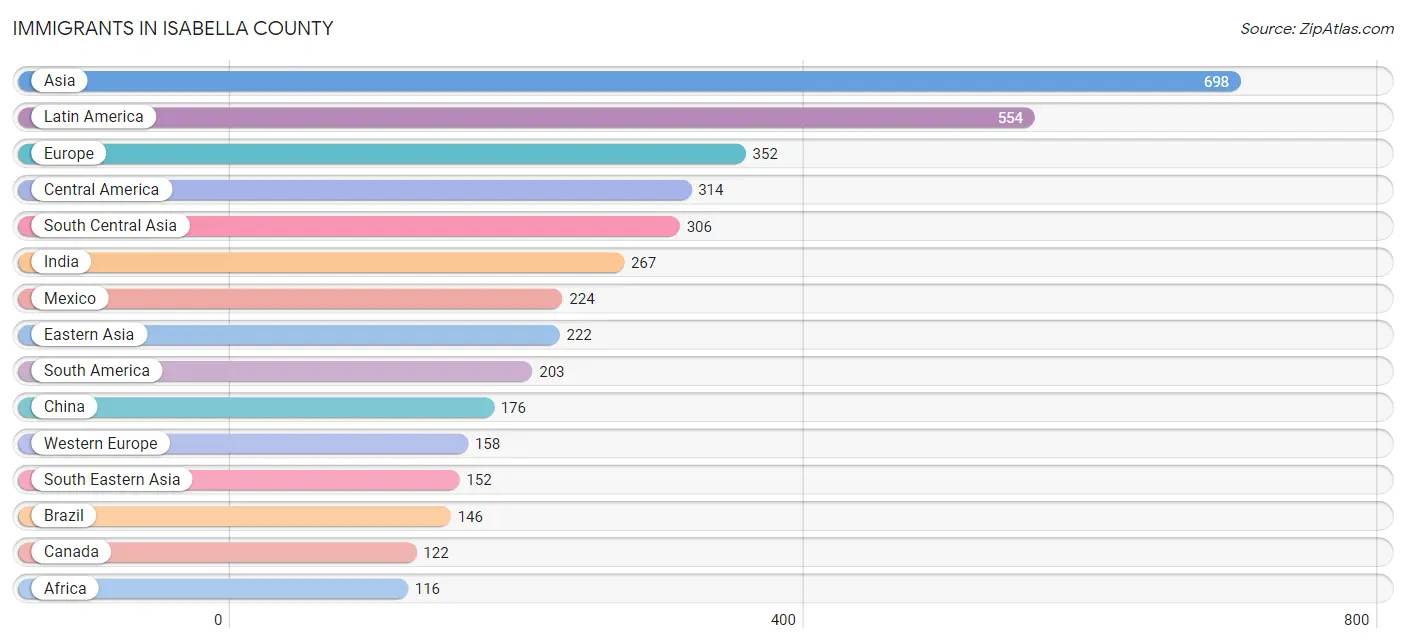
Immigrants in Isabella County
The most numerous immigrant groups reported in Isabella County came from Asia (698 | 1.1%), Latin America (554 | 0.9%), Europe (352 | 0.5%), Central America (314 | 0.5%), and South Central Asia (306 | 0.5%), together accounting for 3.4% of all Isabella County residents.
| Immigration Origin | # Population | % Population |
| Africa | 116 | 0.2% |
| Argentina | 3 | 0.0% |
| Asia | 698 | 1.1% |
| Austria | 13 | 0.0% |
| Brazil | 146 | 0.2% |
| Bulgaria | 10 | 0.0% |
| Cambodia | 20 | 0.0% |
| Canada | 122 | 0.2% |
| Caribbean | 37 | 0.1% |
| Central America | 314 | 0.5% |
| China | 176 | 0.3% |
| Colombia | 6 | 0.0% |
| Cuba | 21 | 0.0% |
| Czechoslovakia | 4 | 0.0% |
| Denmark | 2 | 0.0% |
| Dominica | 5 | 0.0% |
| Eastern Africa | 12 | 0.0% |
| Eastern Asia | 222 | 0.3% |
| Eastern Europe | 87 | 0.1% |
| Ecuador | 3 | 0.0% |
| Egypt | 13 | 0.0% |
| England | 59 | 0.1% |
| Ethiopia | 12 | 0.0% |
| Europe | 352 | 0.5% |
| Germany | 95 | 0.2% |
| Ghana | 6 | 0.0% |
| Guatemala | 81 | 0.1% |
| Haiti | 7 | 0.0% |
| Honduras | 9 | 0.0% |
| India | 267 | 0.4% |
| Indonesia | 24 | 0.0% |
| Iran | 12 | 0.0% |
| Iraq | 5 | 0.0% |
| Italy | 7 | 0.0% |
| Japan | 8 | 0.0% |
| Korea | 38 | 0.1% |
| Kuwait | 7 | 0.0% |
| Latin America | 554 | 0.9% |
| Malaysia | 11 | 0.0% |
| Mexico | 224 | 0.3% |
| Morocco | 5 | 0.0% |
| Netherlands | 50 | 0.1% |
| Nigeria | 62 | 0.1% |
| Northern Africa | 18 | 0.0% |
| Northern Europe | 79 | 0.1% |
| Norway | 5 | 0.0% |
| Pakistan | 27 | 0.0% |
| Peru | 45 | 0.1% |
| Philippines | 81 | 0.1% |
| Poland | 32 | 0.1% |
| Romania | 14 | 0.0% |
| Russia | 5 | 0.0% |
| Scotland | 8 | 0.0% |
| South Africa | 18 | 0.0% |
| South America | 203 | 0.3% |
| South Central Asia | 306 | 0.5% |
| South Eastern Asia | 152 | 0.2% |
| Southern Europe | 28 | 0.0% |
| Spain | 21 | 0.0% |
| Sweden | 5 | 0.0% |
| Syria | 6 | 0.0% |
| Taiwan | 25 | 0.0% |
| Thailand | 9 | 0.0% |
| Trinidad and Tobago | 4 | 0.0% |
| Western Africa | 68 | 0.1% |
| Western Asia | 18 | 0.0% |
| Western Europe | 158 | 0.2% | View All 67 Rows |
Sex and Age in Isabella County
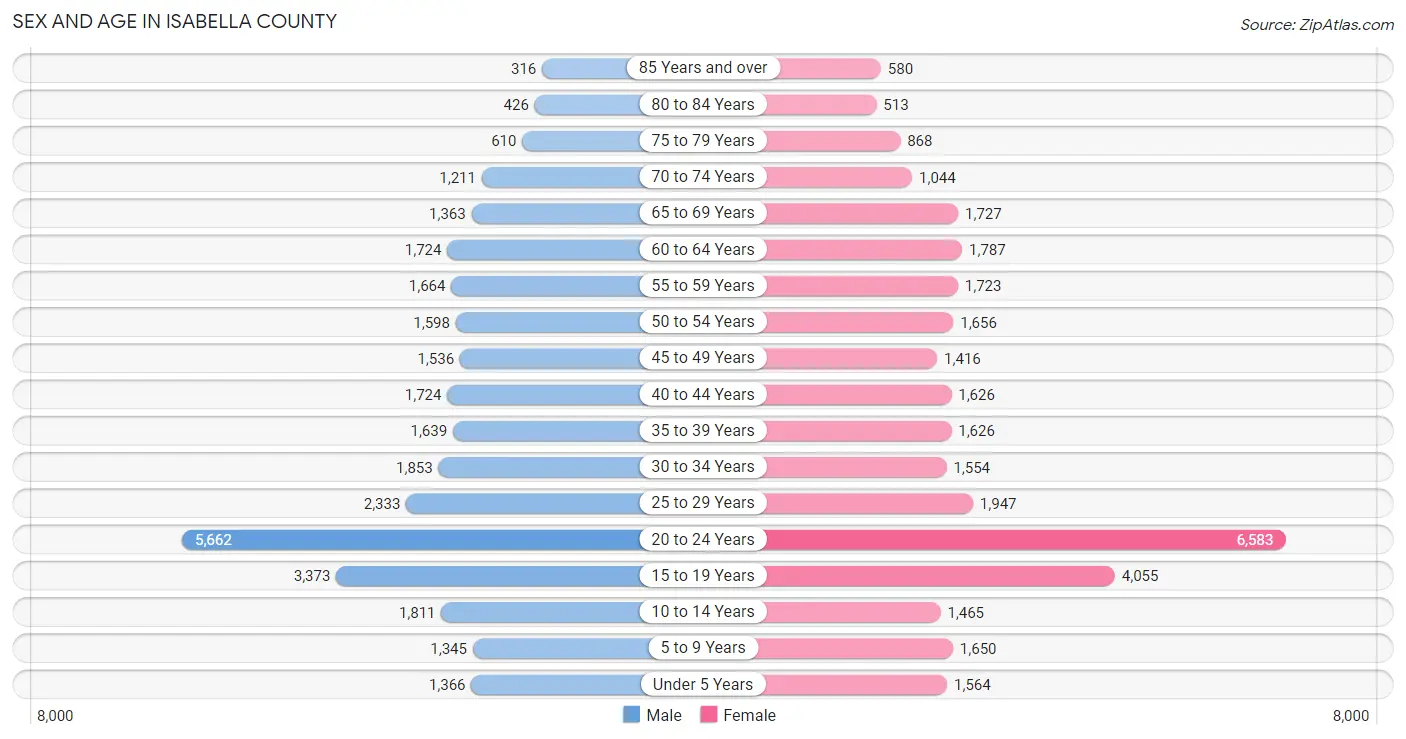
Sex and Age in Isabella County
The most populous age groups in Isabella County are 20 to 24 Years (5,662 | 17.9%) for men and 20 to 24 Years (6,583 | 19.7%) for women.
| Age Bracket | Male | Female |
| Under 5 Years | 1,366 (4.3%) | 1,564 (4.7%) |
| 5 to 9 Years | 1,345 (4.3%) | 1,650 (4.9%) |
| 10 to 14 Years | 1,811 (5.7%) | 1,465 (4.4%) |
| 15 to 19 Years | 3,373 (10.7%) | 4,055 (12.1%) |
| 20 to 24 Years | 5,662 (17.9%) | 6,583 (19.7%) |
| 25 to 29 Years | 2,333 (7.4%) | 1,947 (5.8%) |
| 30 to 34 Years | 1,853 (5.9%) | 1,554 (4.6%) |
| 35 to 39 Years | 1,639 (5.2%) | 1,626 (4.9%) |
| 40 to 44 Years | 1,724 (5.5%) | 1,626 (4.9%) |
| 45 to 49 Years | 1,536 (4.9%) | 1,416 (4.2%) |
| 50 to 54 Years | 1,598 (5.1%) | 1,656 (5.0%) |
| 55 to 59 Years | 1,664 (5.3%) | 1,723 (5.2%) |
| 60 to 64 Years | 1,724 (5.5%) | 1,787 (5.3%) |
| 65 to 69 Years | 1,363 (4.3%) | 1,727 (5.2%) |
| 70 to 74 Years | 1,211 (3.8%) | 1,044 (3.1%) |
| 75 to 79 Years | 610 (1.9%) | 868 (2.6%) |
| 80 to 84 Years | 426 (1.3%) | 513 (1.5%) |
| 85 Years and over | 316 (1.0%) | 580 (1.7%) |
| Total | 31,554 (100.0%) | 33,384 (100.0%) |
Families and Households in Isabella County
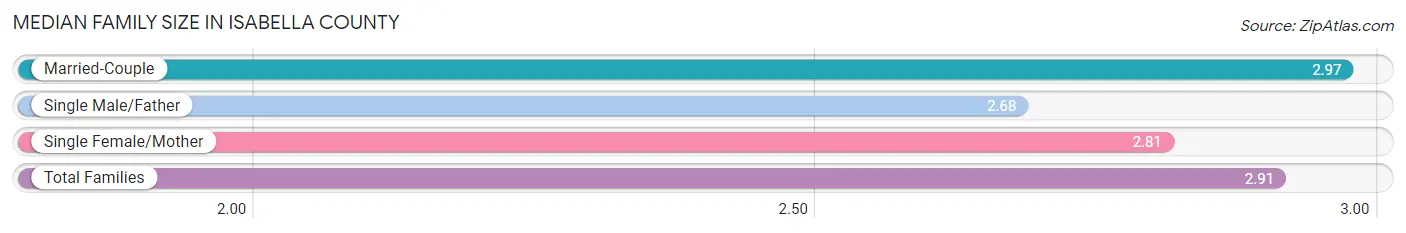
Median Family Size in Isabella County
The median family size in Isabella County is 2.91 persons per family, with married-couple families (9,761 | 71.8%) accounting for the largest median family size of 2.97 persons per family. On the other hand, single male/father families (1,655 | 12.2%) represent the smallest median family size with 2.68 persons per family.
| Family Type | # Families | Family Size |
| Married-Couple | 9,761 (71.8%) | 2.97 |
| Single Male/Father | 1,655 (12.2%) | 2.68 |
| Single Female/Mother | 2,182 (16.1%) | 2.81 |
| Total Families | 13,598 (100.0%) | 2.91 |
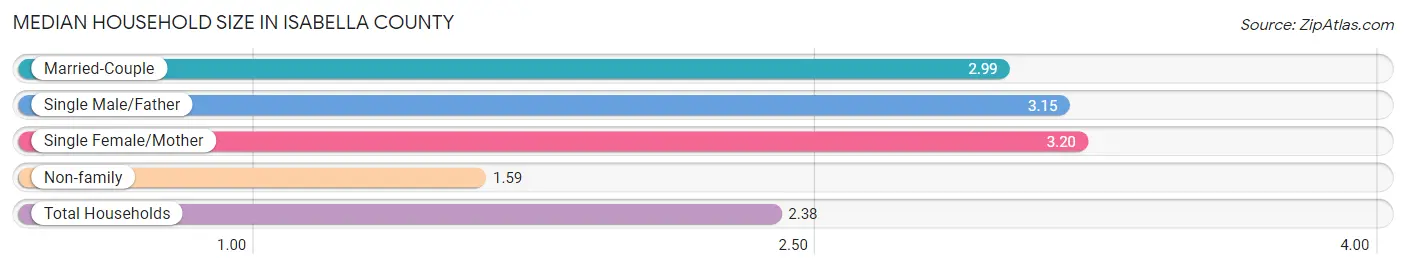
Median Household Size in Isabella County
The median household size in Isabella County is 2.38 persons per household, with single female/mother households (2,182 | 8.8%) accounting for the largest median household size of 3.2 persons per household. non-family households (11,277 | 45.3%) represent the smallest median household size with 1.59 persons per household.
| Household Type | # Households | Household Size |
| Married-Couple | 9,761 (39.2%) | 2.99 |
| Single Male/Father | 1,655 (6.7%) | 3.15 |
| Single Female/Mother | 2,182 (8.8%) | 3.20 |
| Non-family | 11,277 (45.3%) | 1.59 |
| Total Households | 24,875 (100.0%) | 2.38 |
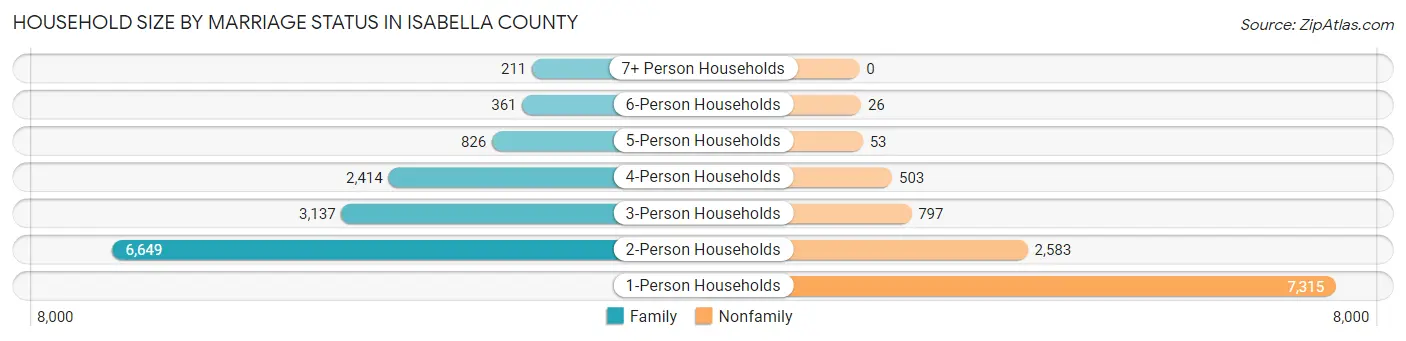
Household Size by Marriage Status in Isabella County
Out of a total of 24,875 households in Isabella County, 13,598 (54.7%) are family households, while 11,277 (45.3%) are nonfamily households. The most numerous type of family households are 2-person households, comprising 6,649, and the most common type of nonfamily households are 1-person households, comprising 7,315.
| Household Size | Family Households | Nonfamily Households |
| 1-Person Households | - | 7,315 (29.4%) |
| 2-Person Households | 6,649 (26.7%) | 2,583 (10.4%) |
| 3-Person Households | 3,137 (12.6%) | 797 (3.2%) |
| 4-Person Households | 2,414 (9.7%) | 503 (2.0%) |
| 5-Person Households | 826 (3.3%) | 53 (0.2%) |
| 6-Person Households | 361 (1.5%) | 26 (0.1%) |
| 7+ Person Households | 211 (0.9%) | 0 (0.0%) |
| Total | 13,598 (54.7%) | 11,277 (45.3%) |
Female Fertility in Isabella County
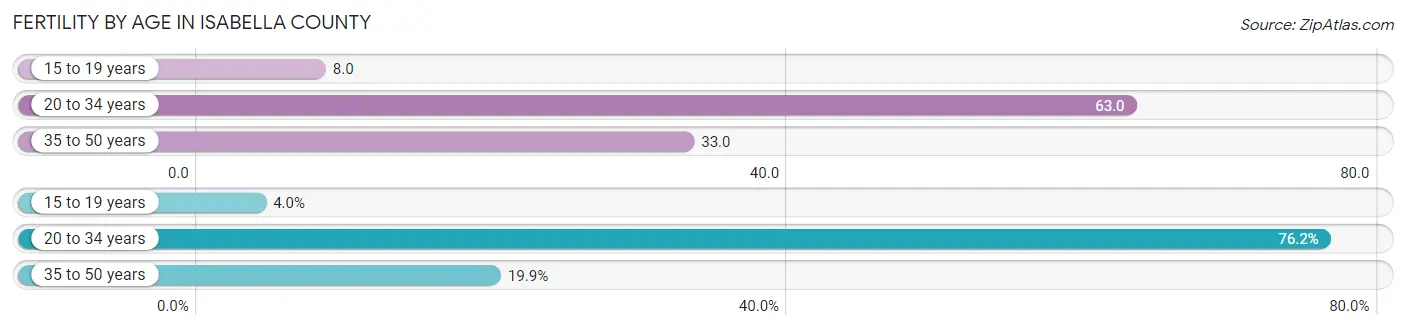
Fertility by Age in Isabella County
Average fertility rate in Isabella County is 43.0 births per 1,000 women. Women in the age bracket of 20 to 34 years have the highest fertility rate with 63.0 births per 1,000 women. Women in the age bracket of 20 to 34 years acount for 76.2% of all women with births.
| Age Bracket | Women with Births | Births / 1,000 Women |
| 15 to 19 years | 33 (4.0%) | 8.0 |
| 20 to 34 years | 636 (76.2%) | 63.0 |
| 35 to 50 years | 166 (19.9%) | 33.0 |
| Total | 835 (100.0%) | 43.0 |
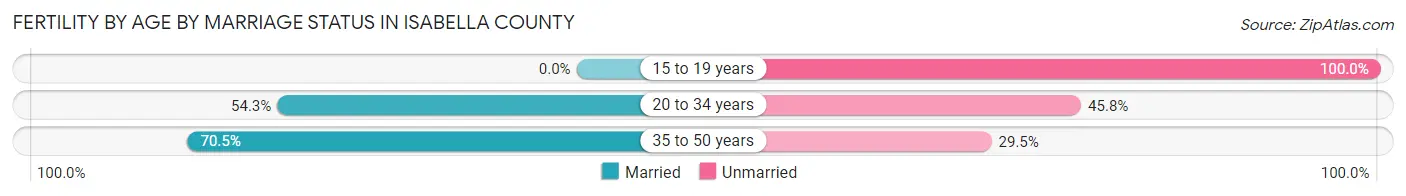
Fertility by Age by Marriage Status in Isabella County
55.3% of women with births (835) in Isabella County are married. The highest percentage of unmarried women with births falls into 15 to 19 years age bracket with 100.0% of them unmarried at the time of birth, while the lowest percentage of unmarried women with births belong to 35 to 50 years age bracket with 29.5% of them unmarried.
| Age Bracket | Married | Unmarried |
| 15 to 19 years | 0 (0.0%) | 33 (100.0%) |
| 20 to 34 years | 345 (54.2%) | 291 (45.8%) |
| 35 to 50 years | 117 (70.5%) | 49 (29.5%) |
| Total | 462 (55.3%) | 373 (44.7%) |
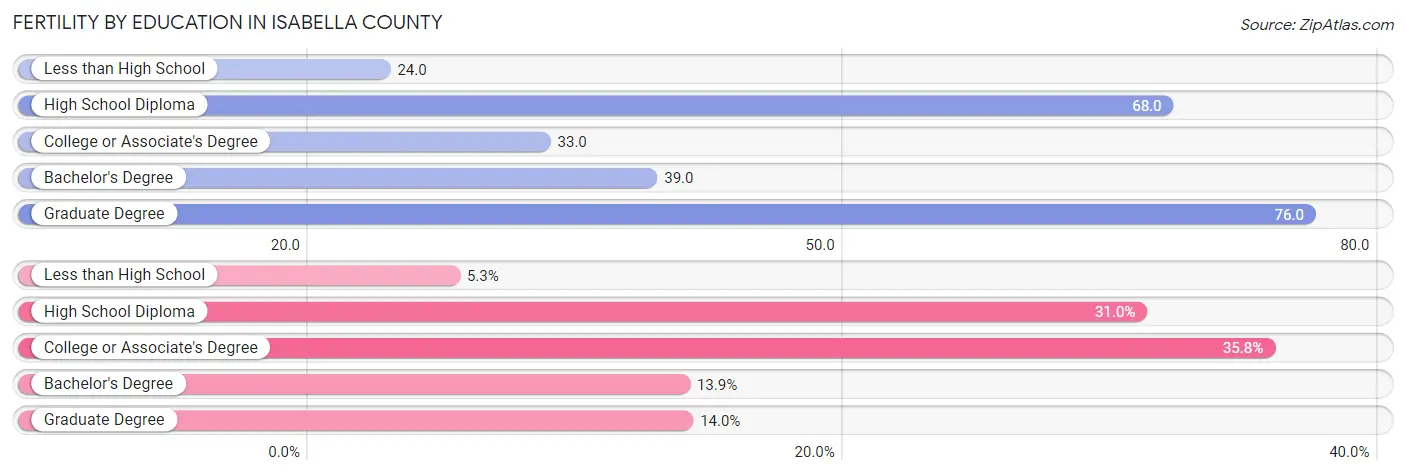
Fertility by Education in Isabella County
Average fertility rate in Isabella County is 43.0 births per 1,000 women. Women with the education attainment of graduate degree have the highest fertility rate of 76.0 births per 1,000 women, while women with the education attainment of less than high school have the lowest fertility at 24.0 births per 1,000 women. Women with the education attainment of college or associate's degree represent 35.8% of all women with births.
| Educational Attainment | Women with Births | Births / 1,000 Women |
| Less than High School | 44 (5.3%) | 24.0 |
| High School Diploma | 259 (31.0%) | 68.0 |
| College or Associate's Degree | 299 (35.8%) | 33.0 |
| Bachelor's Degree | 116 (13.9%) | 39.0 |
| Graduate Degree | 117 (14.0%) | 76.0 |
| Total | 835 (100.0%) | 43.0 |
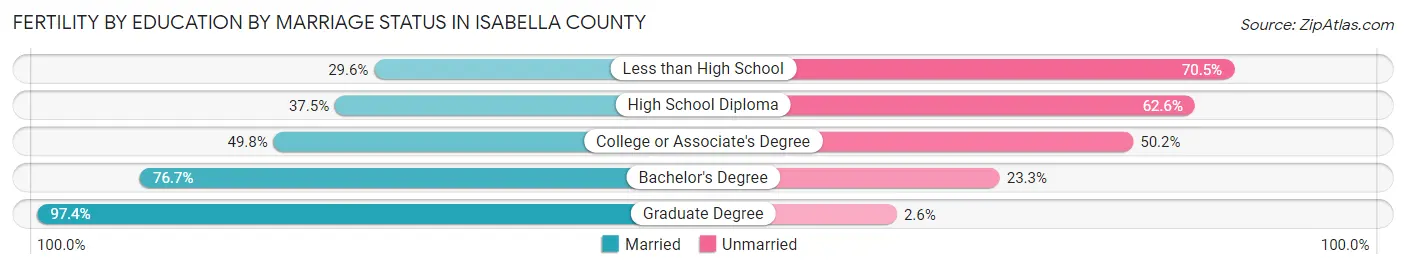
Fertility by Education by Marriage Status in Isabella County
44.7% of women with births in Isabella County are unmarried. Women with the educational attainment of graduate degree are most likely to be married with 97.4% of them married at childbirth, while women with the educational attainment of less than high school are least likely to be married with 70.5% of them unmarried at childbirth.
| Educational Attainment | Married | Unmarried |
| Less than High School | 13 (29.5%) | 31 (70.5%) |
| High School Diploma | 97 (37.4%) | 162 (62.5%) |
| College or Associate's Degree | 149 (49.8%) | 150 (50.2%) |
| Bachelor's Degree | 89 (76.7%) | 27 (23.3%) |
| Graduate Degree | 114 (97.4%) | 3 (2.6%) |
| Total | 462 (55.3%) | 373 (44.7%) |
Employment Characteristics in Isabella County
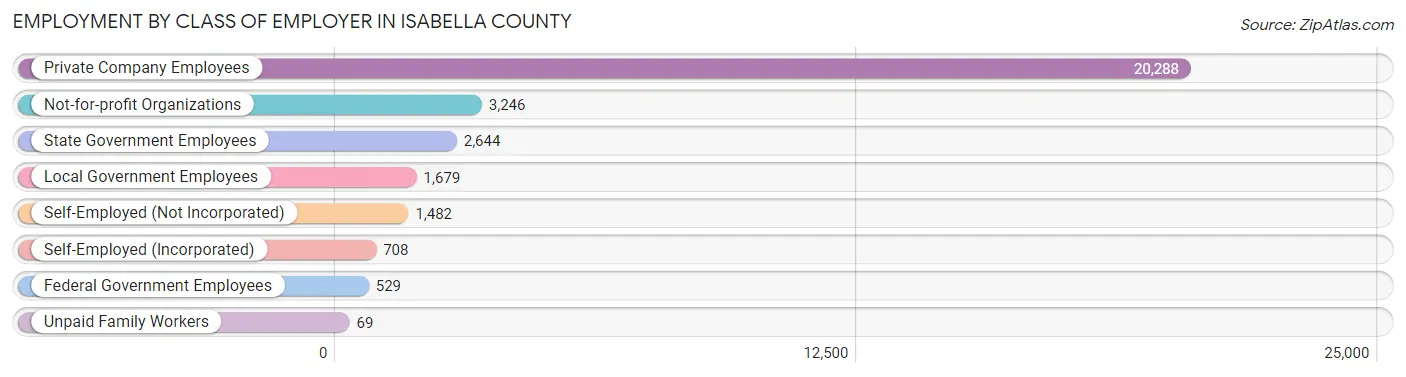
Employment by Class of Employer in Isabella County
Among the 30,645 employed individuals in Isabella County, private company employees (20,288 | 66.2%), not-for-profit organizations (3,246 | 10.6%), and state government employees (2,644 | 8.6%) make up the most common classes of employment.
| Employer Class | # Employees | % Employees |
| Private Company Employees | 20,288 | 66.2% |
| Self-Employed (Incorporated) | 708 | 2.3% |
| Self-Employed (Not Incorporated) | 1,482 | 4.8% |
| Not-for-profit Organizations | 3,246 | 10.6% |
| Local Government Employees | 1,679 | 5.5% |
| State Government Employees | 2,644 | 8.6% |
| Federal Government Employees | 529 | 1.7% |
| Unpaid Family Workers | 69 | 0.2% |
| Total | 30,645 | 100.0% |
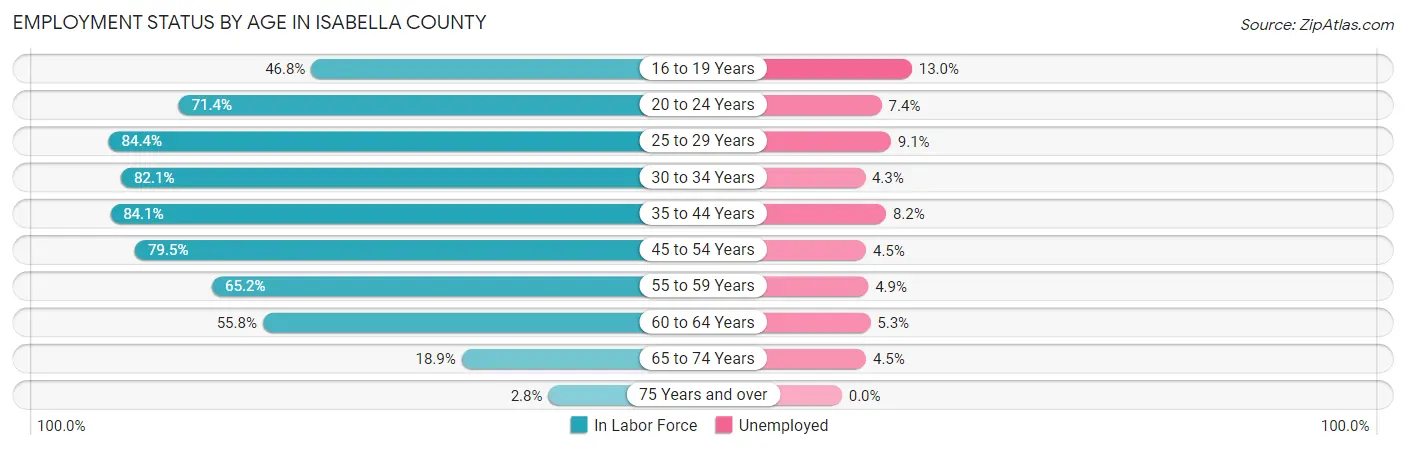
Employment Status by Age in Isabella County
According to the labor force statistics for Isabella County, out of the total population over 16 years of age (55,124), 61.9% or 34,122 individuals are in the labor force, with 7.2% or 2,457 of them unemployed. The age group with the highest labor force participation rate is 25 to 29 years, with 84.4% or 3,612 individuals in the labor force. Within the labor force, the 16 to 19 years age range has the highest percentage of unemployed individuals, with 13.0% or 415 of them being unemployed.
| Age Bracket | In Labor Force | Unemployed |
| 16 to 19 Years | 3,189 (46.8%) | 415 (13.0%) |
| 20 to 24 Years | 8,743 (71.4%) | 647 (7.4%) |
| 25 to 29 Years | 3,612 (84.4%) | 329 (9.1%) |
| 30 to 34 Years | 2,797 (82.1%) | 120 (4.3%) |
| 35 to 44 Years | 5,563 (84.1%) | 456 (8.2%) |
| 45 to 54 Years | 4,934 (79.5%) | 222 (4.5%) |
| 55 to 59 Years | 2,208 (65.2%) | 108 (4.9%) |
| 60 to 64 Years | 1,959 (55.8%) | 104 (5.3%) |
| 65 to 74 Years | 1,010 (18.9%) | 45 (4.5%) |
| 75 Years and over | 93 (2.8%) | 0 (0.0%) |
| Total | 34,122 (61.9%) | 2,457 (7.2%) |
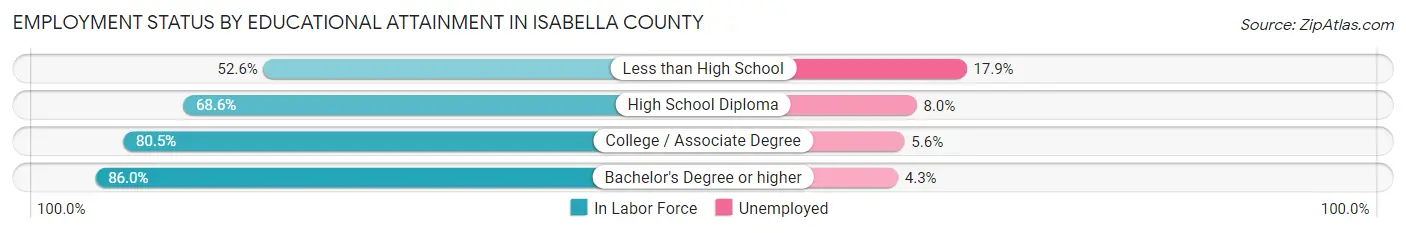
Employment Status by Educational Attainment in Isabella County
According to labor force statistics for Isabella County, 76.9% of individuals (21,075) out of the total population between 25 and 64 years of age (27,406) are in the labor force, with 6.4% or 1,349 of them being unemployed. The group with the highest labor force participation rate are those with the educational attainment of bachelor's degree or higher, with 86.0% or 7,555 individuals in the labor force. Within the labor force, individuals with less than high school education have the highest percentage of unemployment, with 17.9% or 187 of them being unemployed.
| Educational Attainment | In Labor Force | Unemployed |
| Less than High School | 1,047 (52.6%) | 356 (17.9%) |
| High School Diploma | 5,288 (68.6%) | 617 (8.0%) |
| College / Associate Degree | 7,182 (80.5%) | 500 (5.6%) |
| Bachelor's Degree or higher | 7,555 (86.0%) | 378 (4.3%) |
| Total | 21,075 (76.9%) | 1,754 (6.4%) |
Employment Occupations by Sex in Isabella County
Management, Business, Science and Arts Occupations
The most common Management, Business, Science and Arts occupations in Isabella County are Community & Social Service (3,735 | 11.8%), Management (2,993 | 9.5%), Education Instruction & Library (2,418 | 7.6%), Health Diagnosing & Treating (1,673 | 5.3%), and Health Technologists (1,210 | 3.8%).
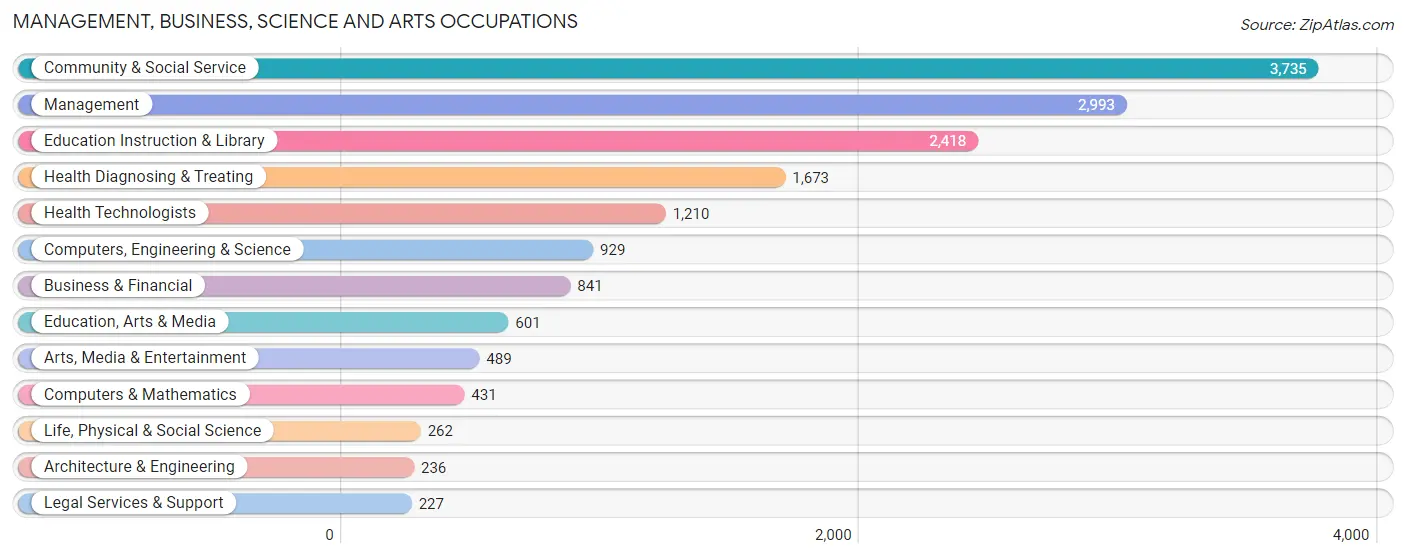
Management, Business, Science and Arts Occupations by Sex
Within the Management, Business, Science and Arts occupations in Isabella County, the most male-oriented occupations are Computers & Mathematics (70.8%), Computers, Engineering & Science (66.6%), and Architecture & Engineering (65.7%), while the most female-oriented occupations are Legal Services & Support (89.0%), Education, Arts & Media (73.9%), and Health Technologists (71.9%).
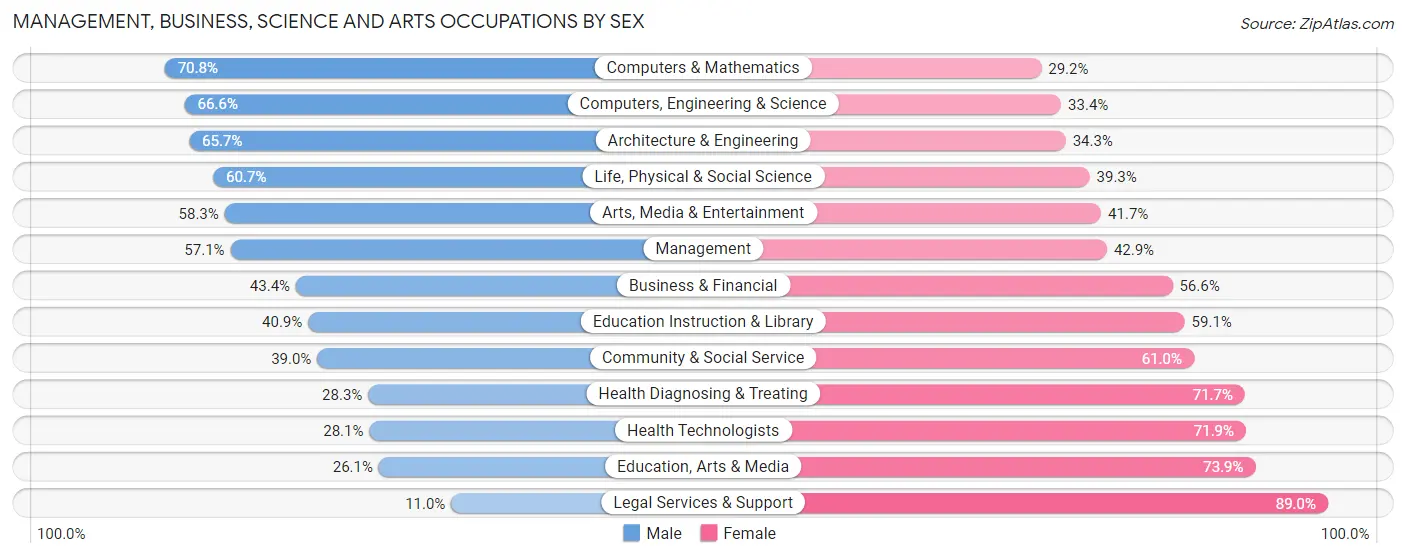
| Occupation | Male | Female |
| Management | 1,708 (57.1%) | 1,285 (42.9%) |
| Business & Financial | 365 (43.4%) | 476 (56.6%) |
| Computers, Engineering & Science | 619 (66.6%) | 310 (33.4%) |
| Computers & Mathematics | 305 (70.8%) | 126 (29.2%) |
| Architecture & Engineering | 155 (65.7%) | 81 (34.3%) |
| Life, Physical & Social Science | 159 (60.7%) | 103 (39.3%) |
| Community & Social Service | 1,455 (39.0%) | 2,280 (61.0%) |
| Education, Arts & Media | 157 (26.1%) | 444 (73.9%) |
| Legal Services & Support | 25 (11.0%) | 202 (89.0%) |
| Education Instruction & Library | 988 (40.9%) | 1,430 (59.1%) |
| Arts, Media & Entertainment | 285 (58.3%) | 204 (41.7%) |
| Health Diagnosing & Treating | 474 (28.3%) | 1,199 (71.7%) |
| Health Technologists | 340 (28.1%) | 870 (71.9%) |
| Total (Category) | 4,621 (45.4%) | 5,550 (54.6%) |
| Total (Overall) | 15,841 (50.1%) | 15,799 (49.9%) |
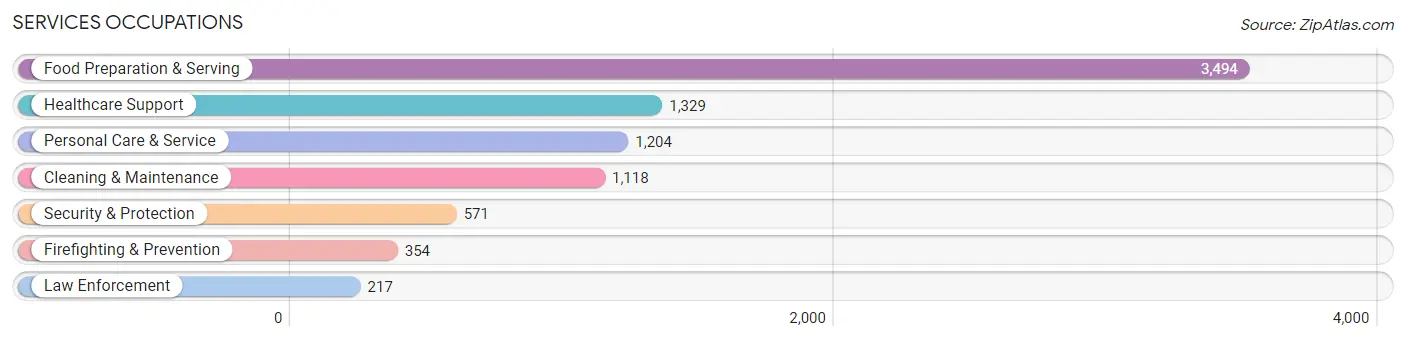
Services Occupations
The most common Services occupations in Isabella County are Food Preparation & Serving (3,494 | 11.0%), Healthcare Support (1,329 | 4.2%), Personal Care & Service (1,204 | 3.8%), Cleaning & Maintenance (1,118 | 3.5%), and Security & Protection (571 | 1.8%).
Services Occupations by Sex
Within the Services occupations in Isabella County, the most male-oriented occupations are Law Enforcement (88.5%), Security & Protection (74.1%), and Firefighting & Prevention (65.2%), while the most female-oriented occupations are Healthcare Support (82.3%), Personal Care & Service (71.1%), and Food Preparation & Serving (61.9%).
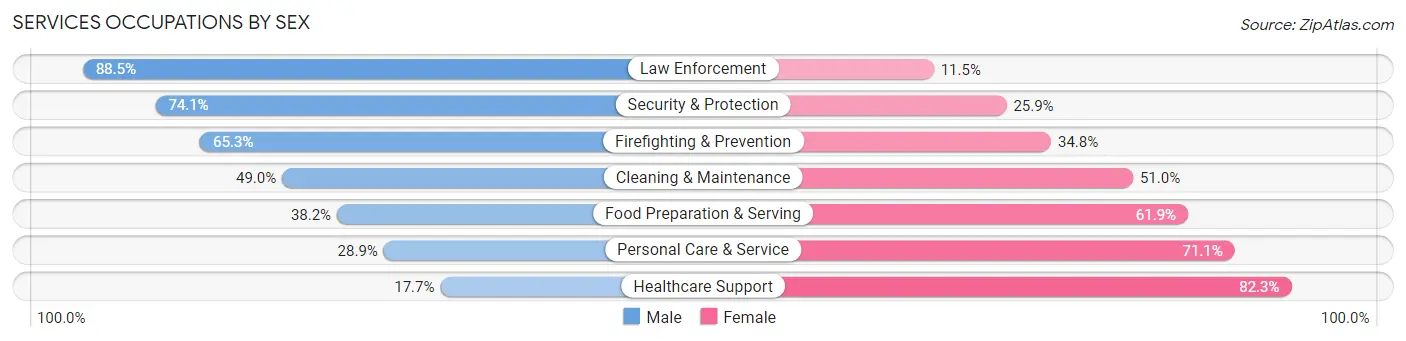
| Occupation | Male | Female |
| Healthcare Support | 235 (17.7%) | 1,094 (82.3%) |
| Security & Protection | 423 (74.1%) | 148 (25.9%) |
| Firefighting & Prevention | 231 (65.2%) | 123 (34.7%) |
| Law Enforcement | 192 (88.5%) | 25 (11.5%) |
| Food Preparation & Serving | 1,333 (38.2%) | 2,161 (61.9%) |
| Cleaning & Maintenance | 548 (49.0%) | 570 (51.0%) |
| Personal Care & Service | 348 (28.9%) | 856 (71.1%) |
| Total (Category) | 2,887 (37.4%) | 4,829 (62.6%) |
| Total (Overall) | 15,841 (50.1%) | 15,799 (49.9%) |
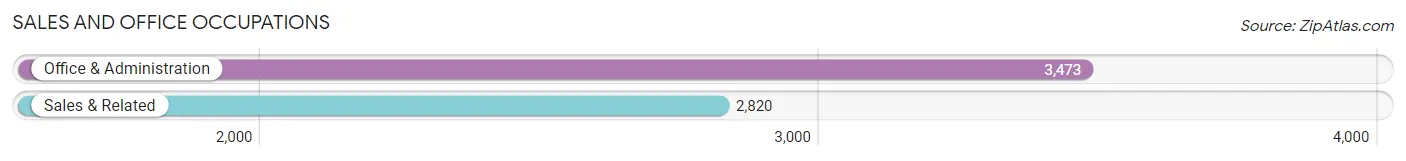
Sales and Office Occupations
The most common Sales and Office occupations in Isabella County are Office & Administration (3,473 | 11.0%), and Sales & Related (2,820 | 8.9%).
Sales and Office Occupations by Sex
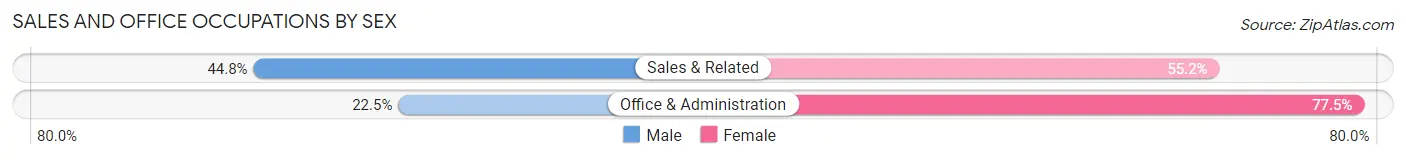
| Occupation | Male | Female |
| Sales & Related | 1,263 (44.8%) | 1,557 (55.2%) |
| Office & Administration | 782 (22.5%) | 2,691 (77.5%) |
| Total (Category) | 2,045 (32.5%) | 4,248 (67.5%) |
| Total (Overall) | 15,841 (50.1%) | 15,799 (49.9%) |
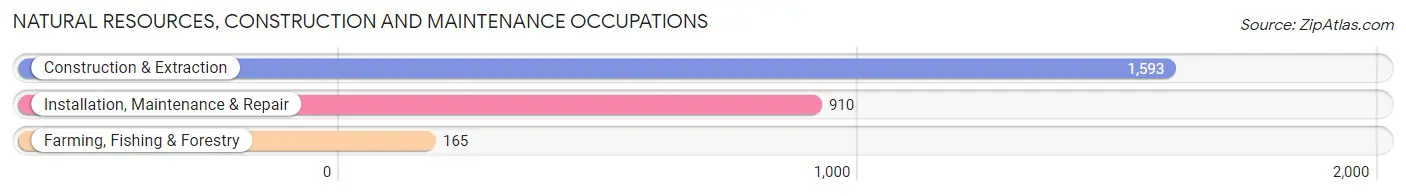
Natural Resources, Construction and Maintenance Occupations
The most common Natural Resources, Construction and Maintenance occupations in Isabella County are Construction & Extraction (1,593 | 5.0%), Installation, Maintenance & Repair (910 | 2.9%), and Farming, Fishing & Forestry (165 | 0.5%).
Natural Resources, Construction and Maintenance Occupations by Sex
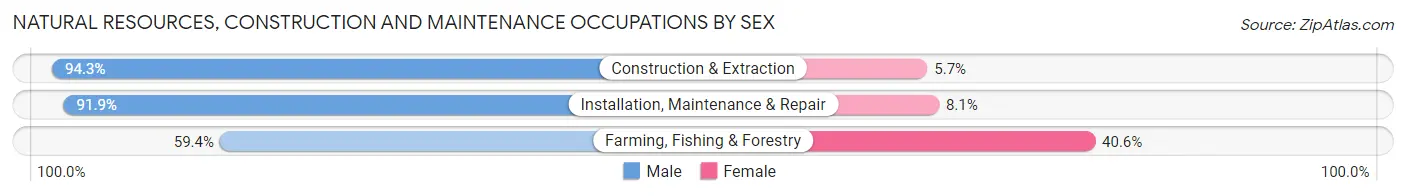
| Occupation | Male | Female |
| Farming, Fishing & Forestry | 98 (59.4%) | 67 (40.6%) |
| Construction & Extraction | 1,502 (94.3%) | 91 (5.7%) |
| Installation, Maintenance & Repair | 836 (91.9%) | 74 (8.1%) |
| Total (Category) | 2,436 (91.3%) | 232 (8.7%) |
| Total (Overall) | 15,841 (50.1%) | 15,799 (49.9%) |
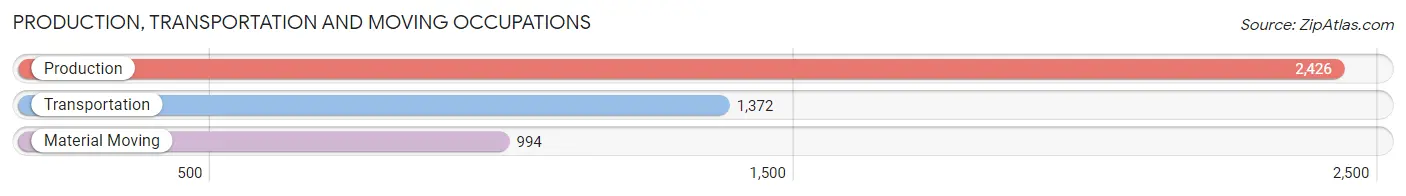
Production, Transportation and Moving Occupations
The most common Production, Transportation and Moving occupations in Isabella County are Production (2,426 | 7.7%), Transportation (1,372 | 4.3%), and Material Moving (994 | 3.1%).
Production, Transportation and Moving Occupations by Sex
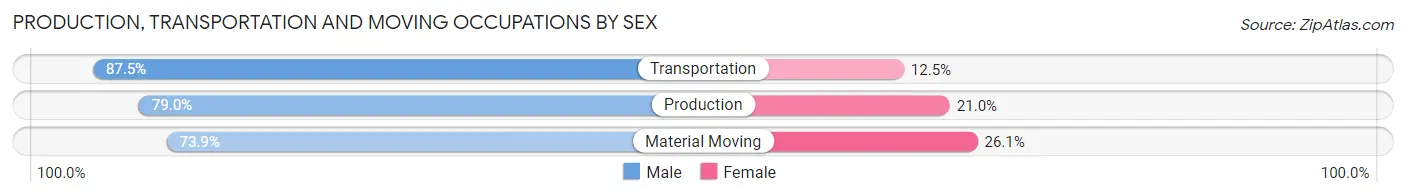
| Occupation | Male | Female |
| Production | 1,917 (79.0%) | 509 (21.0%) |
| Transportation | 1,200 (87.5%) | 172 (12.5%) |
| Material Moving | 735 (73.9%) | 259 (26.1%) |
| Total (Category) | 3,852 (80.4%) | 940 (19.6%) |
| Total (Overall) | 15,841 (50.1%) | 15,799 (49.9%) |
Employment Industries by Sex in Isabella County
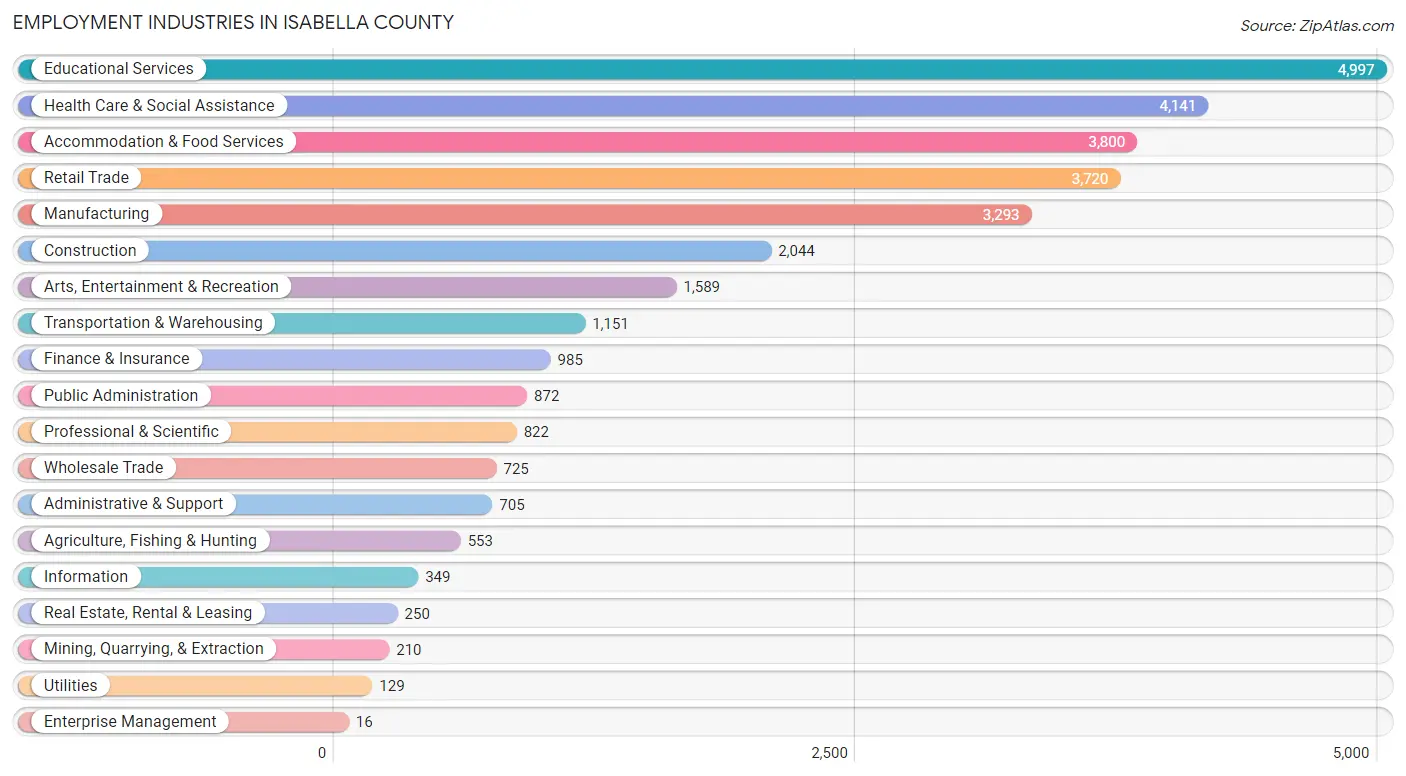
Employment Industries in Isabella County
The major employment industries in Isabella County include Educational Services (4,997 | 15.8%), Health Care & Social Assistance (4,141 | 13.1%), Accommodation & Food Services (3,800 | 12.0%), Retail Trade (3,720 | 11.8%), and Manufacturing (3,293 | 10.4%).
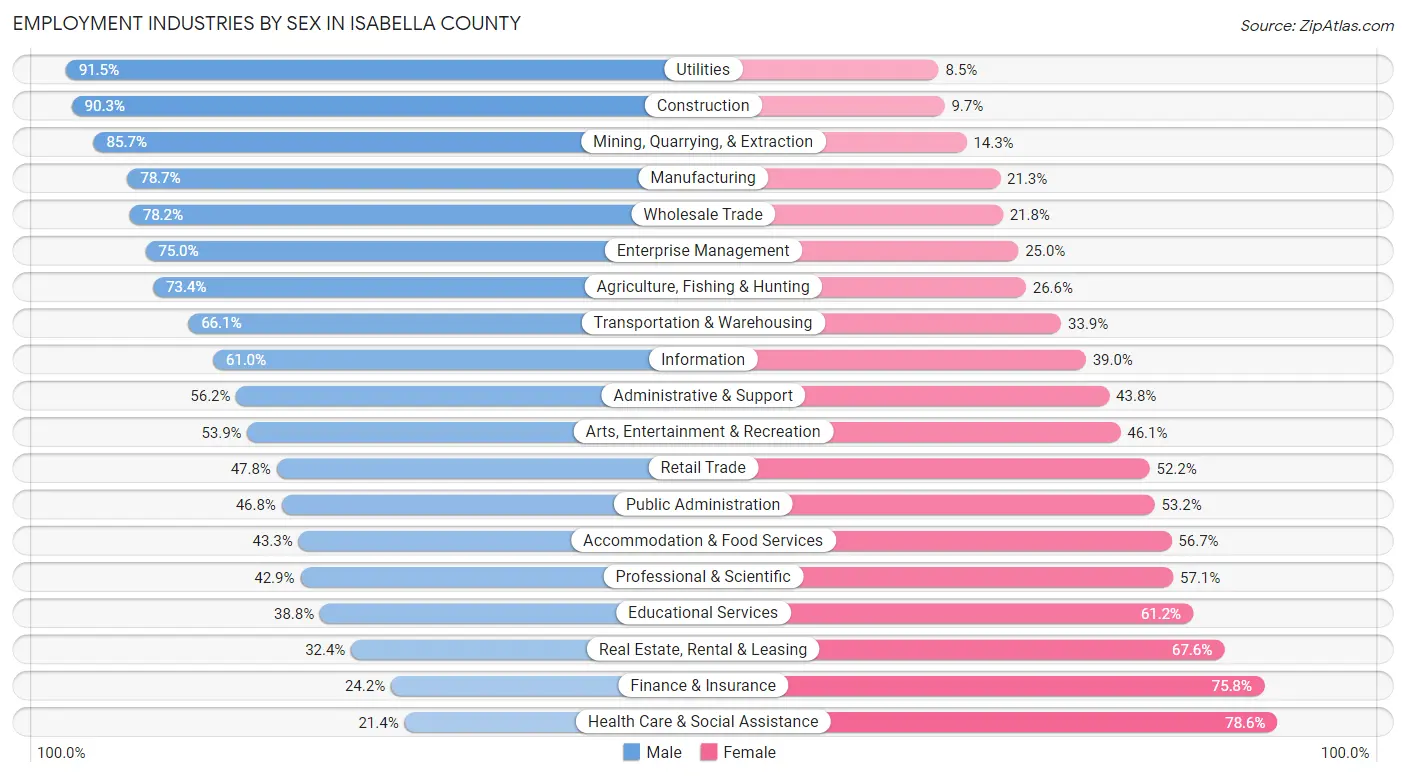
Employment Industries by Sex in Isabella County
The Isabella County industries that see more men than women are Utilities (91.5%), Construction (90.3%), and Mining, Quarrying, & Extraction (85.7%), whereas the industries that tend to have a higher number of women are Health Care & Social Assistance (78.6%), Finance & Insurance (75.8%), and Real Estate, Rental & Leasing (67.6%).
| Industry | Male | Female |
| Agriculture, Fishing & Hunting | 406 (73.4%) | 147 (26.6%) |
| Mining, Quarrying, & Extraction | 180 (85.7%) | 30 (14.3%) |
| Construction | 1,845 (90.3%) | 199 (9.7%) |
| Manufacturing | 2,593 (78.7%) | 700 (21.3%) |
| Wholesale Trade | 567 (78.2%) | 158 (21.8%) |
| Retail Trade | 1,779 (47.8%) | 1,941 (52.2%) |
| Transportation & Warehousing | 761 (66.1%) | 390 (33.9%) |
| Utilities | 118 (91.5%) | 11 (8.5%) |
| Information | 213 (61.0%) | 136 (39.0%) |
| Finance & Insurance | 238 (24.2%) | 747 (75.8%) |
| Real Estate, Rental & Leasing | 81 (32.4%) | 169 (67.6%) |
| Professional & Scientific | 353 (42.9%) | 469 (57.1%) |
| Enterprise Management | 12 (75.0%) | 4 (25.0%) |
| Administrative & Support | 396 (56.2%) | 309 (43.8%) |
| Educational Services | 1,941 (38.8%) | 3,056 (61.2%) |
| Health Care & Social Assistance | 885 (21.4%) | 3,256 (78.6%) |
| Arts, Entertainment & Recreation | 856 (53.9%) | 733 (46.1%) |
| Accommodation & Food Services | 1,645 (43.3%) | 2,155 (56.7%) |
| Public Administration | 408 (46.8%) | 464 (53.2%) |
| Total | 15,841 (50.1%) | 15,799 (49.9%) |
Education in Isabella County
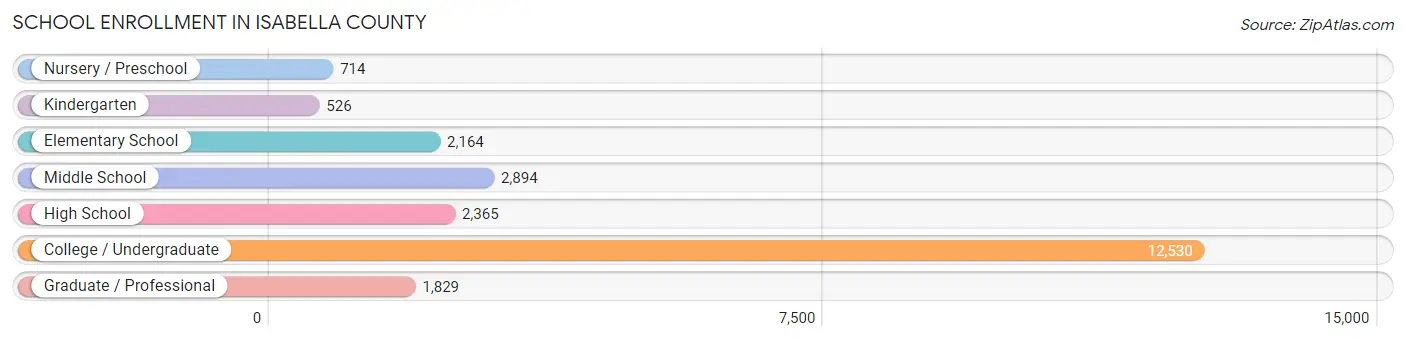
School Enrollment in Isabella County
The most common levels of schooling among the 23,022 students in Isabella County are college / undergraduate (12,530 | 54.4%), middle school (2,894 | 12.6%), and high school (2,365 | 10.3%).
| School Level | # Students | % Students |
| Nursery / Preschool | 714 | 3.1% |
| Kindergarten | 526 | 2.3% |
| Elementary School | 2,164 | 9.4% |
| Middle School | 2,894 | 12.6% |
| High School | 2,365 | 10.3% |
| College / Undergraduate | 12,530 | 54.4% |
| Graduate / Professional | 1,829 | 7.9% |
| Total | 23,022 | 100.0% |
School Enrollment by Age by Funding Source in Isabella County
Out of a total of 23,022 students who are enrolled in schools in Isabella County, 2,233 (9.7%) attend a private institution, while the remaining 20,789 (90.3%) are enrolled in public schools. The age group of 3 to 4 year olds has the highest likelihood of being enrolled in private schools, with 252 (53.6% in the age bracket) enrolled. Conversely, the age group of 15 to 17 year olds has the lowest likelihood of being enrolled in a private school, with 1,628 (94.4% in the age bracket) attending a public institution.
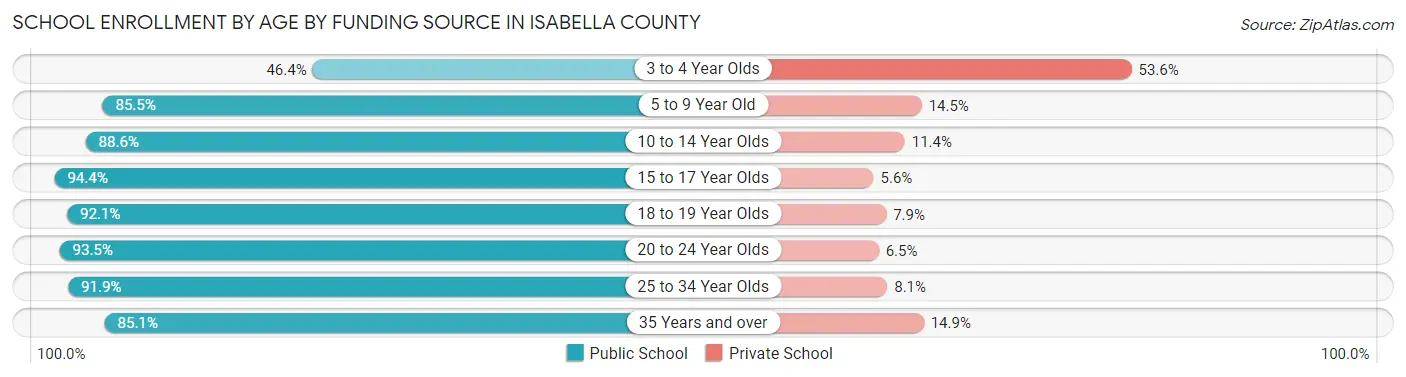
| Age Bracket | Public School | Private School |
| 3 to 4 Year Olds | 218 (46.4%) | 252 (53.6%) |
| 5 to 9 Year Old | 2,371 (85.5%) | 403 (14.5%) |
| 10 to 14 Year Olds | 2,836 (88.6%) | 364 (11.4%) |
| 15 to 17 Year Olds | 1,628 (94.4%) | 96 (5.6%) |
| 18 to 19 Year Olds | 4,439 (92.1%) | 382 (7.9%) |
| 20 to 24 Year Olds | 7,502 (93.5%) | 524 (6.5%) |
| 25 to 34 Year Olds | 1,154 (91.9%) | 102 (8.1%) |
| 35 Years and over | 639 (85.1%) | 112 (14.9%) |
| Total | 20,789 (90.3%) | 2,233 (9.7%) |
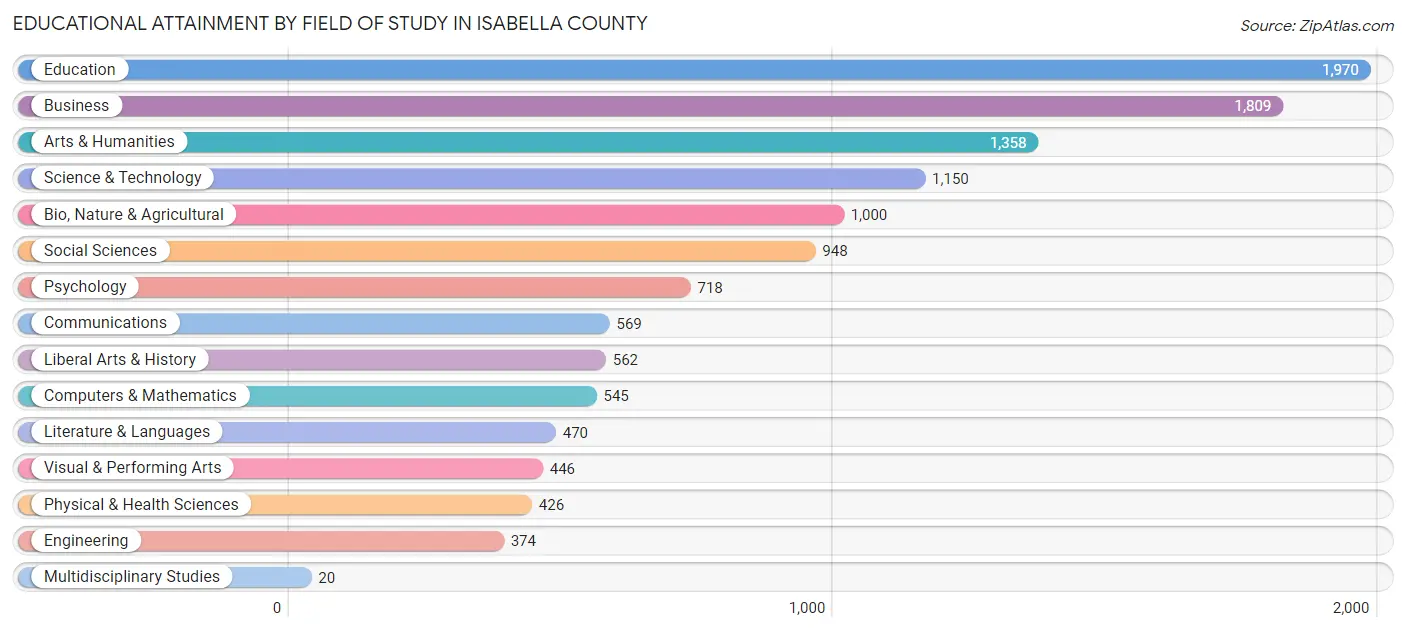
Educational Attainment by Field of Study in Isabella County
Education (1,970 | 15.9%), business (1,809 | 14.6%), arts & humanities (1,358 | 11.0%), science & technology (1,150 | 9.3%), and bio, nature & agricultural (1,000 | 8.1%) are the most common fields of study among 12,365 individuals in Isabella County who have obtained a bachelor's degree or higher.
| Field of Study | # Graduates | % Graduates |
| Computers & Mathematics | 545 | 4.4% |
| Bio, Nature & Agricultural | 1,000 | 8.1% |
| Physical & Health Sciences | 426 | 3.5% |
| Psychology | 718 | 5.8% |
| Social Sciences | 948 | 7.7% |
| Engineering | 374 | 3.0% |
| Multidisciplinary Studies | 20 | 0.2% |
| Science & Technology | 1,150 | 9.3% |
| Business | 1,809 | 14.6% |
| Education | 1,970 | 15.9% |
| Literature & Languages | 470 | 3.8% |
| Liberal Arts & History | 562 | 4.5% |
| Visual & Performing Arts | 446 | 3.6% |
| Communications | 569 | 4.6% |
| Arts & Humanities | 1,358 | 11.0% |
| Total | 12,365 | 100.0% |
Transportation & Commute in Isabella County
Vehicle Availability by Sex in Isabella County
The most prevalent vehicle ownership categories in Isabella County are males with 2 vehicles (6,363, accounting for 43.1%) and females with 2 vehicles (6,209, making up 45.4%).
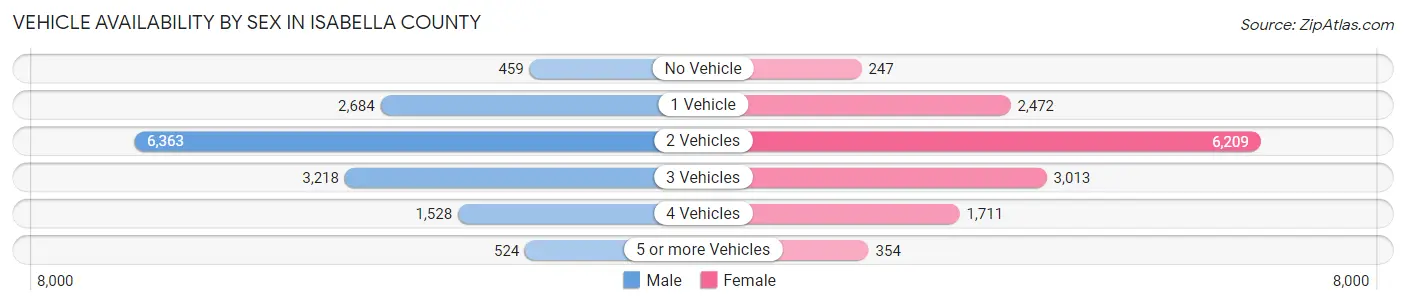
| Vehicles Available | Male | Female |
| No Vehicle | 459 (3.1%) | 247 (1.8%) |
| 1 Vehicle | 2,684 (18.2%) | 2,472 (17.6%) |
| 2 Vehicles | 6,363 (43.1%) | 6,209 (44.3%) |
| 3 Vehicles | 3,218 (21.8%) | 3,013 (21.5%) |
| 4 Vehicles | 1,528 (10.3%) | 1,711 (12.2%) |
| 5 or more Vehicles | 524 (3.5%) | 354 (2.5%) |
| Total | 14,776 (100.0%) | 14,006 (100.0%) |
Commute Time in Isabella County
The most frequently occuring commute durations in Isabella County are 5 to 9 minutes (6,742 commuters, 23.2%), 10 to 14 minutes (6,099 commuters, 21.0%), and 15 to 19 minutes (4,069 commuters, 14.0%).
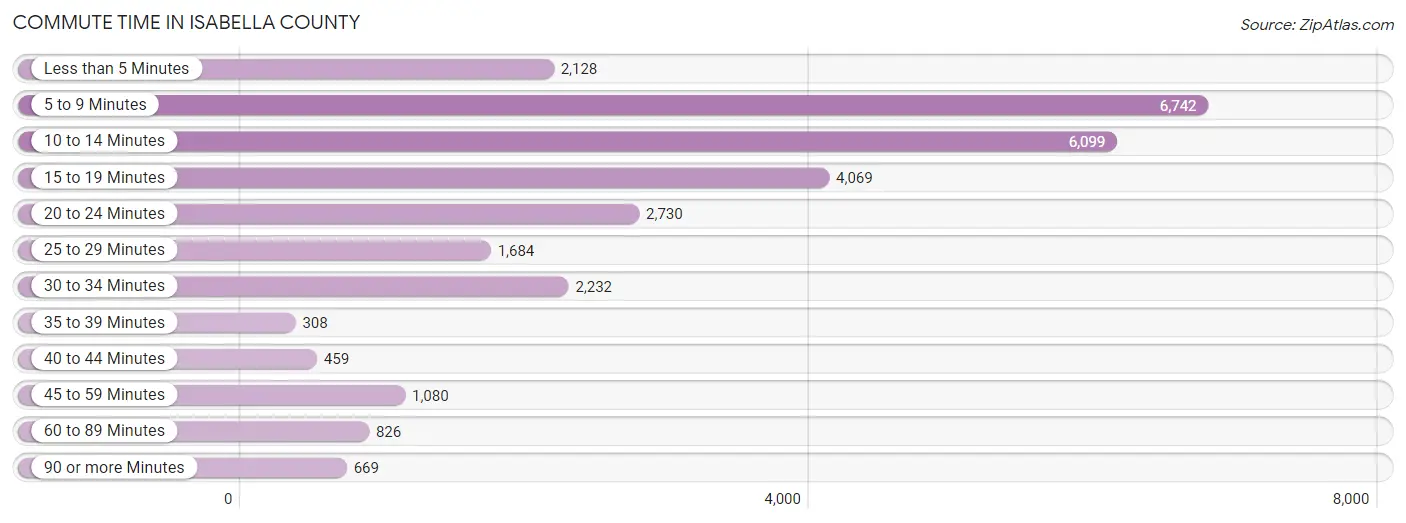
| Commute Time | # Commuters | % Commuters |
| Less than 5 Minutes | 2,128 | 7.3% |
| 5 to 9 Minutes | 6,742 | 23.2% |
| 10 to 14 Minutes | 6,099 | 21.0% |
| 15 to 19 Minutes | 4,069 | 14.0% |
| 20 to 24 Minutes | 2,730 | 9.4% |
| 25 to 29 Minutes | 1,684 | 5.8% |
| 30 to 34 Minutes | 2,232 | 7.7% |
| 35 to 39 Minutes | 308 | 1.1% |
| 40 to 44 Minutes | 459 | 1.6% |
| 45 to 59 Minutes | 1,080 | 3.7% |
| 60 to 89 Minutes | 826 | 2.9% |
| 90 or more Minutes | 669 | 2.3% |
Commute Time by Sex in Isabella County
The most common commute times in Isabella County are 5 to 9 minutes (2,889 commuters, 19.6%) for males and 5 to 9 minutes (3,853 commuters, 27.0%) for females.
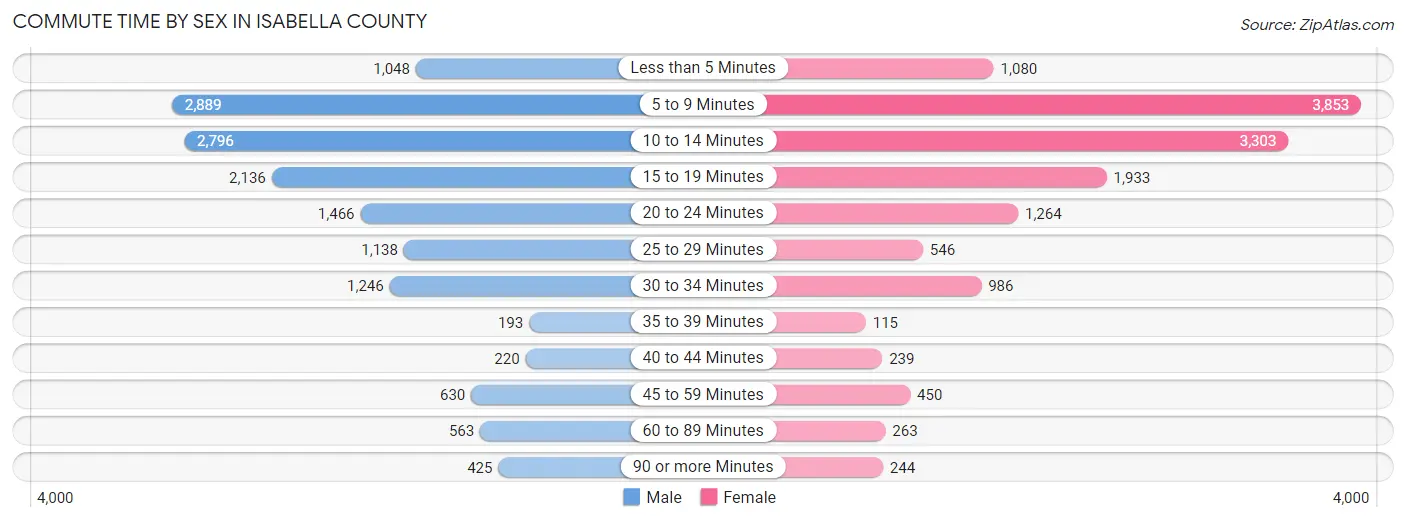
| Commute Time | Male | Female |
| Less than 5 Minutes | 1,048 (7.1%) | 1,080 (7.6%) |
| 5 to 9 Minutes | 2,889 (19.6%) | 3,853 (27.0%) |
| 10 to 14 Minutes | 2,796 (19.0%) | 3,303 (23.1%) |
| 15 to 19 Minutes | 2,136 (14.5%) | 1,933 (13.5%) |
| 20 to 24 Minutes | 1,466 (9.9%) | 1,264 (8.8%) |
| 25 to 29 Minutes | 1,138 (7.7%) | 546 (3.8%) |
| 30 to 34 Minutes | 1,246 (8.5%) | 986 (6.9%) |
| 35 to 39 Minutes | 193 (1.3%) | 115 (0.8%) |
| 40 to 44 Minutes | 220 (1.5%) | 239 (1.7%) |
| 45 to 59 Minutes | 630 (4.3%) | 450 (3.2%) |
| 60 to 89 Minutes | 563 (3.8%) | 263 (1.8%) |
| 90 or more Minutes | 425 (2.9%) | 244 (1.7%) |
Time of Departure to Work by Sex in Isabella County
The most frequent times of departure to work in Isabella County are 7:30 AM to 7:59 AM (2,192, 14.9%) for males and 7:30 AM to 7:59 AM (2,465, 17.3%) for females.
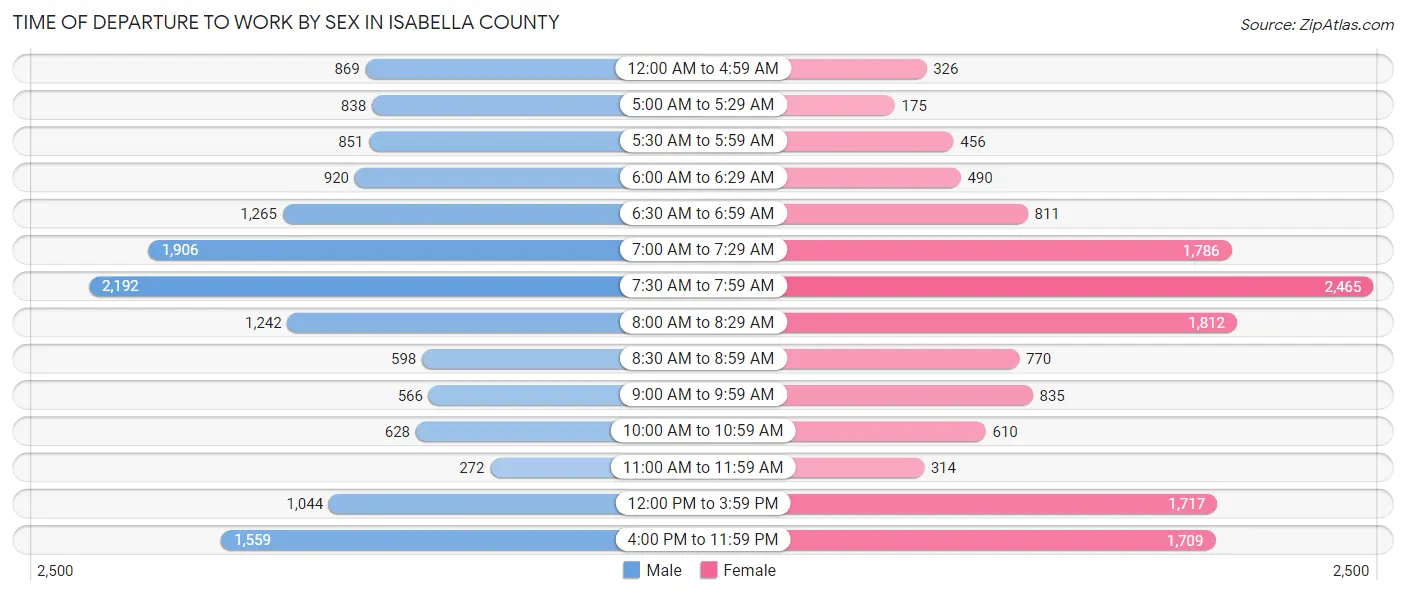
| Time of Departure | Male | Female |
| 12:00 AM to 4:59 AM | 869 (5.9%) | 326 (2.3%) |
| 5:00 AM to 5:29 AM | 838 (5.7%) | 175 (1.2%) |
| 5:30 AM to 5:59 AM | 851 (5.8%) | 456 (3.2%) |
| 6:00 AM to 6:29 AM | 920 (6.2%) | 490 (3.4%) |
| 6:30 AM to 6:59 AM | 1,265 (8.6%) | 811 (5.7%) |
| 7:00 AM to 7:29 AM | 1,906 (12.9%) | 1,786 (12.5%) |
| 7:30 AM to 7:59 AM | 2,192 (14.9%) | 2,465 (17.3%) |
| 8:00 AM to 8:29 AM | 1,242 (8.4%) | 1,812 (12.7%) |
| 8:30 AM to 8:59 AM | 598 (4.1%) | 770 (5.4%) |
| 9:00 AM to 9:59 AM | 566 (3.8%) | 835 (5.9%) |
| 10:00 AM to 10:59 AM | 628 (4.3%) | 610 (4.3%) |
| 11:00 AM to 11:59 AM | 272 (1.8%) | 314 (2.2%) |
| 12:00 PM to 3:59 PM | 1,044 (7.1%) | 1,717 (12.0%) |
| 4:00 PM to 11:59 PM | 1,559 (10.6%) | 1,709 (12.0%) |
| Total | 14,750 (100.0%) | 14,276 (100.0%) |
Housing Occupancy in Isabella County
Occupancy by Ownership in Isabella County
Of the total 24,875 dwellings in Isabella County, owner-occupied units account for 15,340 (61.7%), while renter-occupied units make up 9,535 (38.3%).
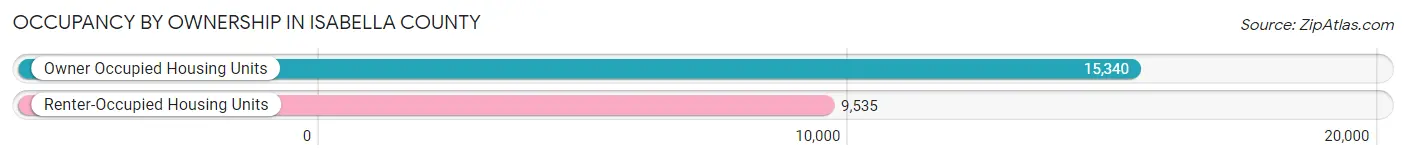
| Occupancy | # Housing Units | % Housing Units |
| Owner Occupied Housing Units | 15,340 | 61.7% |
| Renter-Occupied Housing Units | 9,535 | 38.3% |
| Total Occupied Housing Units | 24,875 | 100.0% |
Occupancy by Household Size in Isabella County
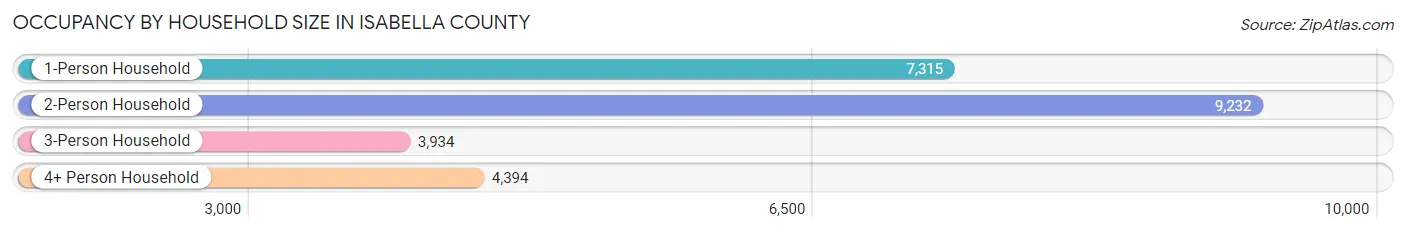
| Household Size | # Housing Units | % Housing Units |
| 1-Person Household | 7,315 | 29.4% |
| 2-Person Household | 9,232 | 37.1% |
| 3-Person Household | 3,934 | 15.8% |
| 4+ Person Household | 4,394 | 17.7% |
| Total Housing Units | 24,875 | 100.0% |
Occupancy by Ownership by Household Size in Isabella County
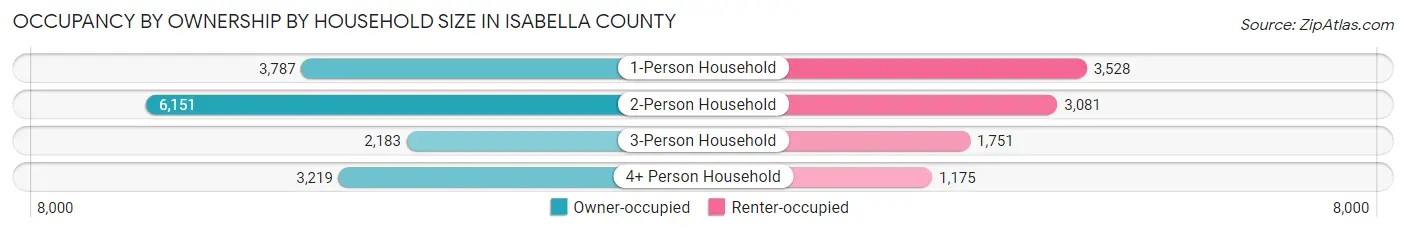
| Household Size | Owner-occupied | Renter-occupied |
| 1-Person Household | 3,787 (51.8%) | 3,528 (48.2%) |
| 2-Person Household | 6,151 (66.6%) | 3,081 (33.4%) |
| 3-Person Household | 2,183 (55.5%) | 1,751 (44.5%) |
| 4+ Person Household | 3,219 (73.3%) | 1,175 (26.7%) |
| Total Housing Units | 15,340 (61.7%) | 9,535 (38.3%) |
Occupancy by Educational Attainment in Isabella County
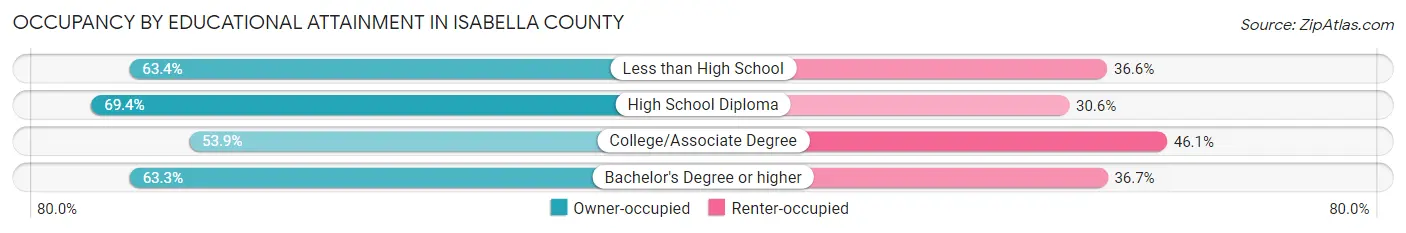
| Household Size | Owner-occupied | Renter-occupied |
| Less than High School | 926 (63.4%) | 535 (36.6%) |
| High School Diploma | 4,578 (69.4%) | 2,018 (30.6%) |
| College/Associate Degree | 4,652 (53.9%) | 3,979 (46.1%) |
| Bachelor's Degree or higher | 5,184 (63.3%) | 3,003 (36.7%) |
Occupancy by Age of Householder in Isabella County
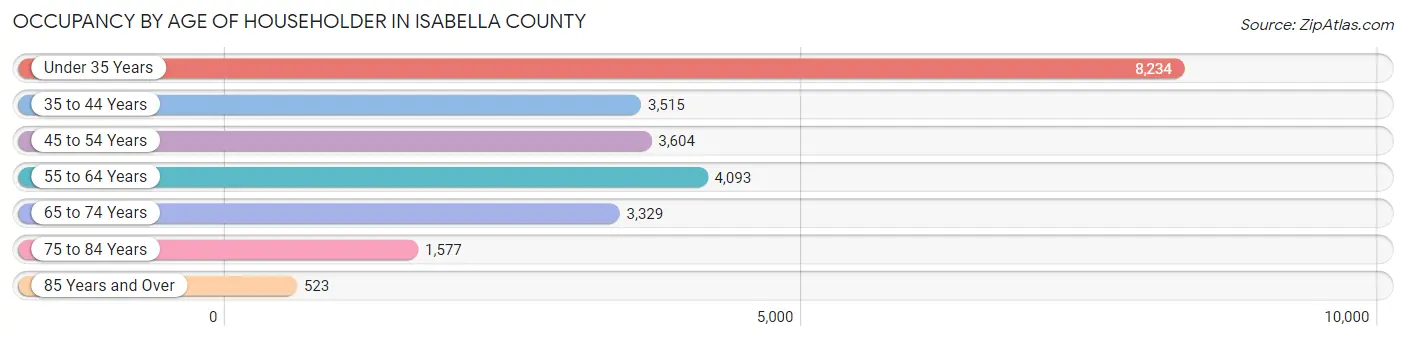
| Age Bracket | # Households | % Households |
| Under 35 Years | 8,234 | 33.1% |
| 35 to 44 Years | 3,515 | 14.1% |
| 45 to 54 Years | 3,604 | 14.5% |
| 55 to 64 Years | 4,093 | 16.5% |
| 65 to 74 Years | 3,329 | 13.4% |
| 75 to 84 Years | 1,577 | 6.3% |
| 85 Years and Over | 523 | 2.1% |
| Total | 24,875 | 100.0% |
Housing Finances in Isabella County
Median Income by Occupancy in Isabella County
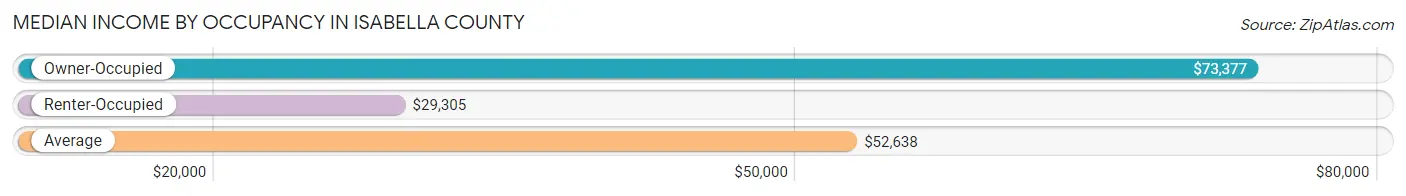
| Occupancy Type | # Households | Median Income |
| Owner-Occupied | 15,340 (61.7%) | $73,377 |
| Renter-Occupied | 9,535 (38.3%) | $29,305 |
| Average | 24,875 (100.0%) | $52,638 |
Occupancy by Householder Income Bracket in Isabella County
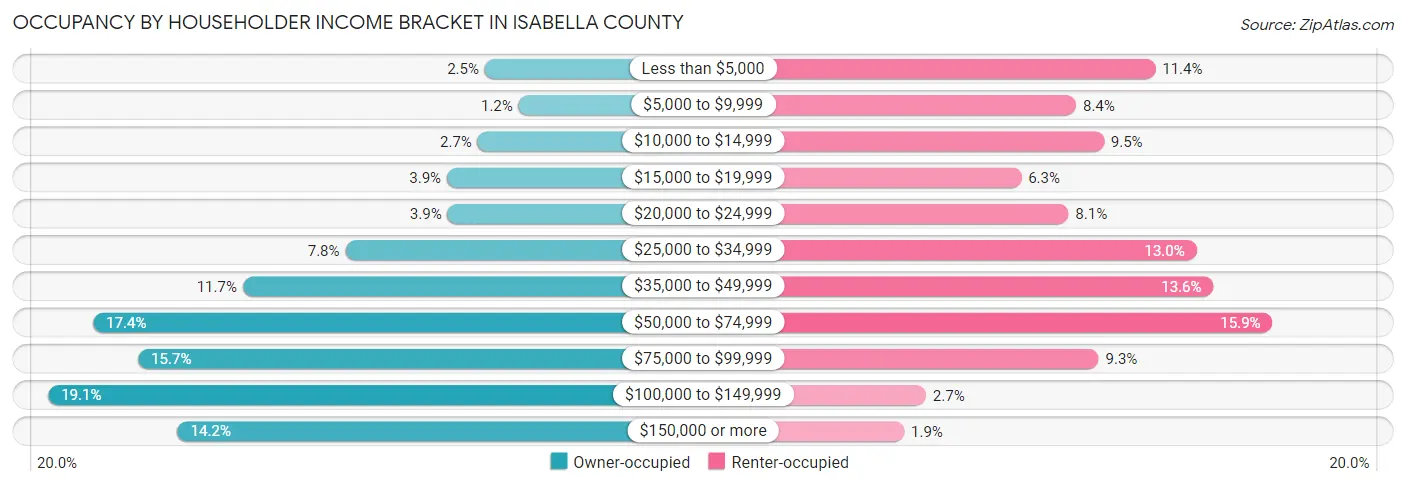
| Income Bracket | Owner-occupied | Renter-occupied |
| Less than $5,000 | 379 (2.5%) | 1,089 (11.4%) |
| $5,000 to $9,999 | 181 (1.2%) | 801 (8.4%) |
| $10,000 to $14,999 | 421 (2.7%) | 902 (9.5%) |
| $15,000 to $19,999 | 600 (3.9%) | 602 (6.3%) |
| $20,000 to $24,999 | 597 (3.9%) | 773 (8.1%) |
| $25,000 to $34,999 | 1,193 (7.8%) | 1,239 (13.0%) |
| $35,000 to $49,999 | 1,793 (11.7%) | 1,300 (13.6%) |
| $50,000 to $74,999 | 2,667 (17.4%) | 1,514 (15.9%) |
| $75,000 to $99,999 | 2,405 (15.7%) | 883 (9.3%) |
| $100,000 to $149,999 | 2,930 (19.1%) | 256 (2.7%) |
| $150,000 or more | 2,174 (14.2%) | 176 (1.8%) |
| Total | 15,340 (100.0%) | 9,535 (100.0%) |
Monthly Housing Cost Tiers in Isabella County
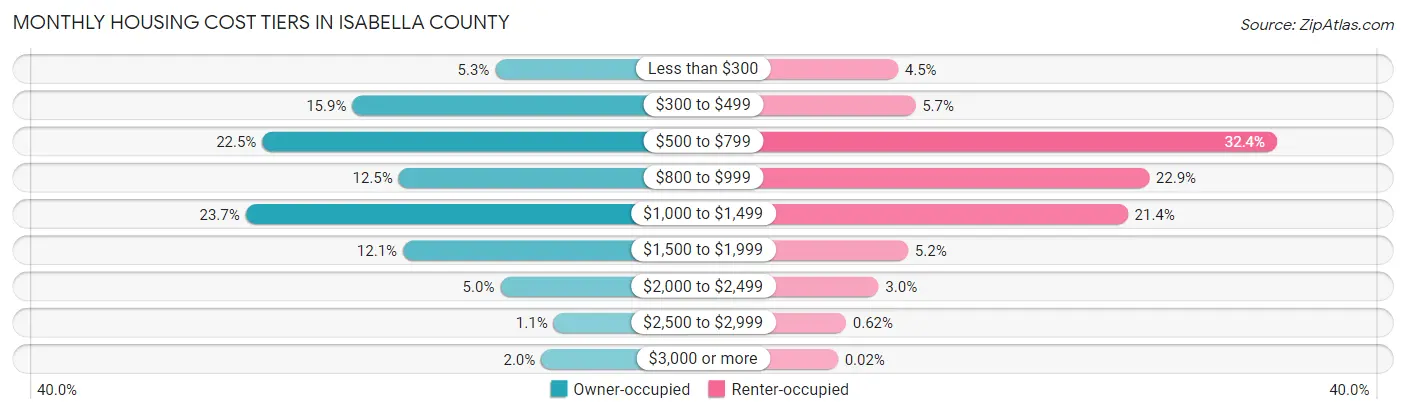
| Monthly Cost | Owner-occupied | Renter-occupied |
| Less than $300 | 819 (5.3%) | 424 (4.4%) |
| $300 to $499 | 2,434 (15.9%) | 546 (5.7%) |
| $500 to $799 | 3,451 (22.5%) | 3,086 (32.4%) |
| $800 to $999 | 1,911 (12.5%) | 2,187 (22.9%) |
| $1,000 to $1,499 | 3,640 (23.7%) | 2,038 (21.4%) |
| $1,500 to $1,999 | 1,862 (12.1%) | 495 (5.2%) |
| $2,000 to $2,499 | 762 (5.0%) | 288 (3.0%) |
| $2,500 to $2,999 | 161 (1.1%) | 59 (0.6%) |
| $3,000 or more | 300 (2.0%) | 2 (0.0%) |
| Total | 15,340 (100.0%) | 9,535 (100.0%) |
Physical Housing Characteristics in Isabella County
Housing Structures in Isabella County
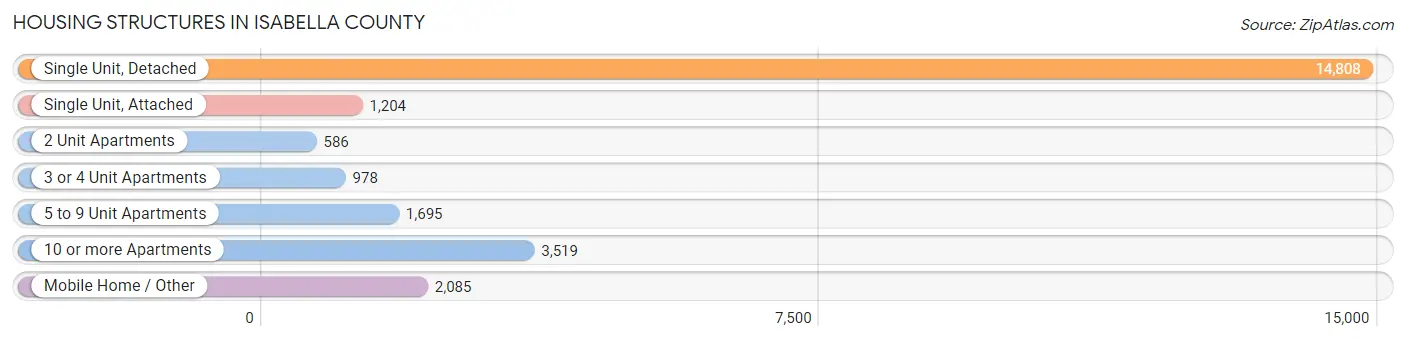
| Structure Type | # Housing Units | % Housing Units |
| Single Unit, Detached | 14,808 | 59.5% |
| Single Unit, Attached | 1,204 | 4.8% |
| 2 Unit Apartments | 586 | 2.4% |
| 3 or 4 Unit Apartments | 978 | 3.9% |
| 5 to 9 Unit Apartments | 1,695 | 6.8% |
| 10 or more Apartments | 3,519 | 14.1% |
| Mobile Home / Other | 2,085 | 8.4% |
| Total | 24,875 | 100.0% |
Housing Structures by Occupancy in Isabella County
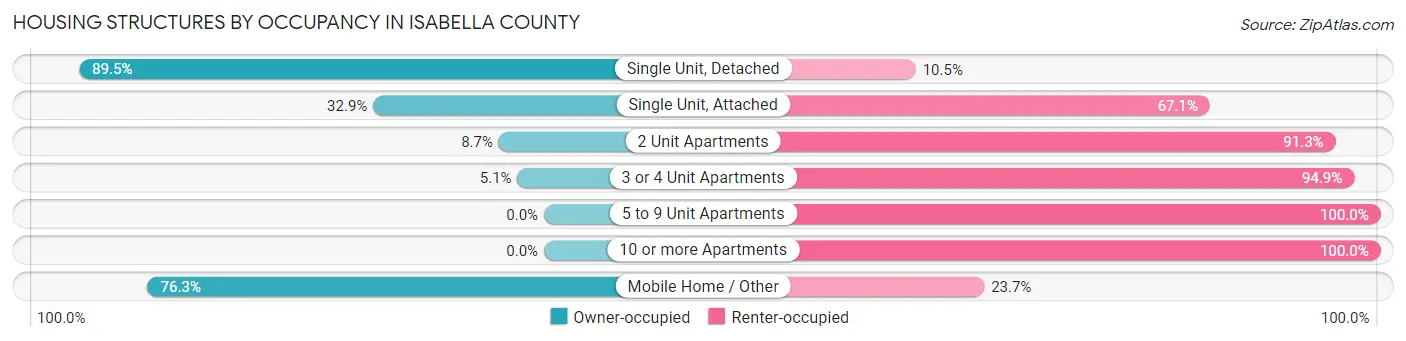
| Structure Type | Owner-occupied | Renter-occupied |
| Single Unit, Detached | 13,252 (89.5%) | 1,556 (10.5%) |
| Single Unit, Attached | 396 (32.9%) | 808 (67.1%) |
| 2 Unit Apartments | 51 (8.7%) | 535 (91.3%) |
| 3 or 4 Unit Apartments | 50 (5.1%) | 928 (94.9%) |
| 5 to 9 Unit Apartments | 0 (0.0%) | 1,695 (100.0%) |
| 10 or more Apartments | 0 (0.0%) | 3,519 (100.0%) |
| Mobile Home / Other | 1,591 (76.3%) | 494 (23.7%) |
| Total | 15,340 (61.7%) | 9,535 (38.3%) |
Housing Structures by Number of Rooms in Isabella County
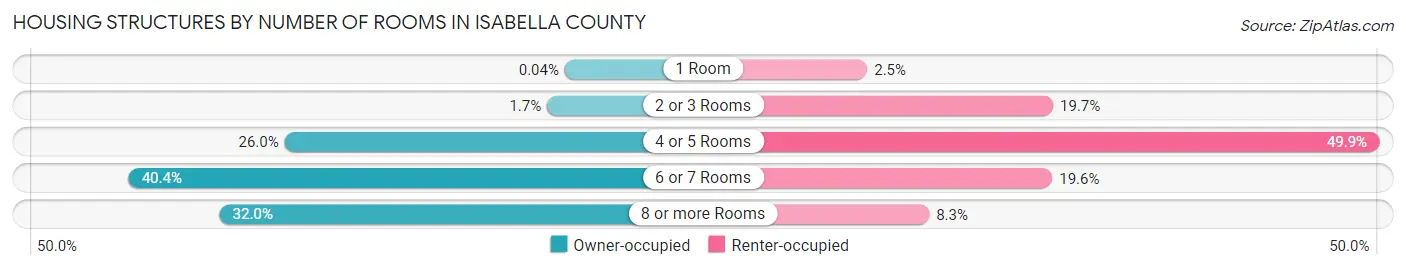
| Number of Rooms | Owner-occupied | Renter-occupied |
| 1 Room | 6 (0.0%) | 241 (2.5%) |
| 2 or 3 Rooms | 257 (1.7%) | 1,880 (19.7%) |
| 4 or 5 Rooms | 3,982 (26.0%) | 4,753 (49.8%) |
| 6 or 7 Rooms | 6,192 (40.4%) | 1,873 (19.6%) |
| 8 or more Rooms | 4,903 (32.0%) | 788 (8.3%) |
| Total | 15,340 (100.0%) | 9,535 (100.0%) |
Housing Structure by Heating Type in Isabella County
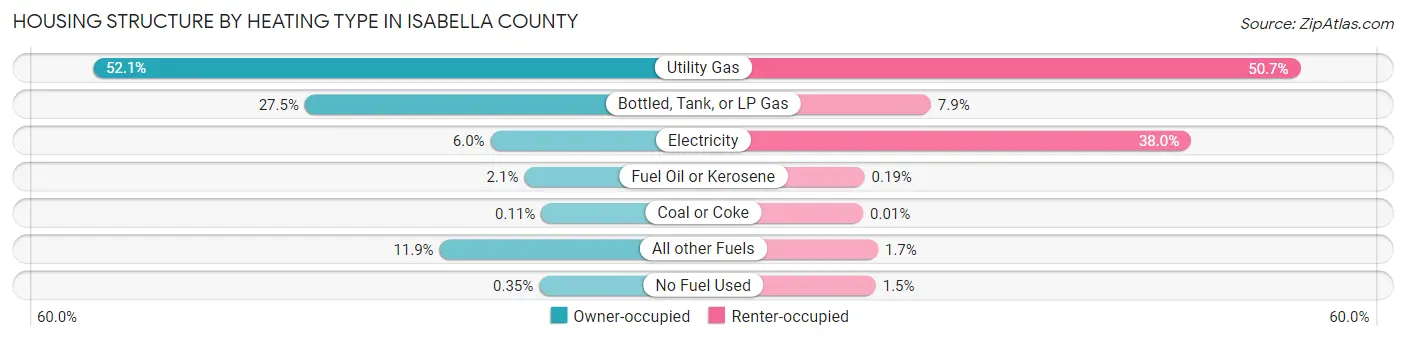
| Heating Type | Owner-occupied | Renter-occupied |
| Utility Gas | 7,987 (52.1%) | 4,834 (50.7%) |
| Bottled, Tank, or LP Gas | 4,221 (27.5%) | 750 (7.9%) |
| Electricity | 919 (6.0%) | 3,625 (38.0%) |
| Fuel Oil or Kerosene | 318 (2.1%) | 18 (0.2%) |
| Coal or Coke | 17 (0.1%) | 1 (0.0%) |
| All other Fuels | 1,825 (11.9%) | 166 (1.7%) |
| No Fuel Used | 53 (0.4%) | 141 (1.5%) |
| Total | 15,340 (100.0%) | 9,535 (100.0%) |
Household Vehicle Usage in Isabella County
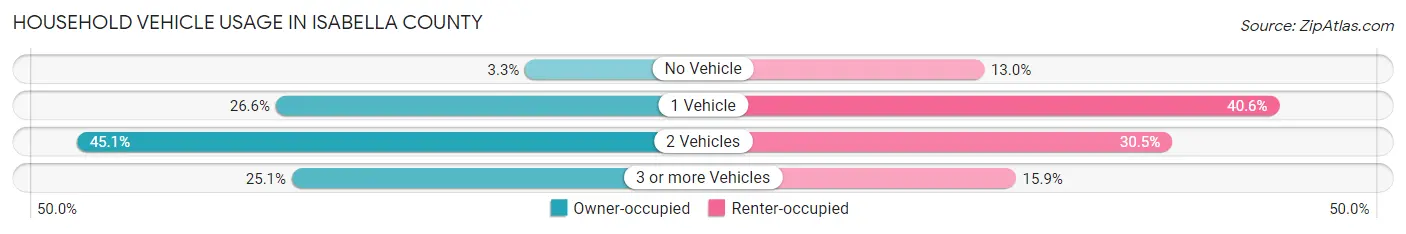
| Vehicles per Household | Owner-occupied | Renter-occupied |
| No Vehicle | 501 (3.3%) | 1,238 (13.0%) |
| 1 Vehicle | 4,073 (26.6%) | 3,866 (40.6%) |
| 2 Vehicles | 6,923 (45.1%) | 2,911 (30.5%) |
| 3 or more Vehicles | 3,843 (25.1%) | 1,520 (15.9%) |
| Total | 15,340 (100.0%) | 9,535 (100.0%) |
Real Estate & Mortgages in Isabella County
Real Estate and Mortgage Overview in Isabella County
| Characteristic | Without Mortgage | With Mortgage |
| Housing Units | 6,633 | 8,707 |
| Median Property Value | $151,800 | $164,000 |
| Median Household Income | $57,120 | $1,506 |
| Monthly Housing Costs | $514 | $291 |
| Real Estate Taxes | $2,030 | $370 |
Property Value by Mortgage Status in Isabella County
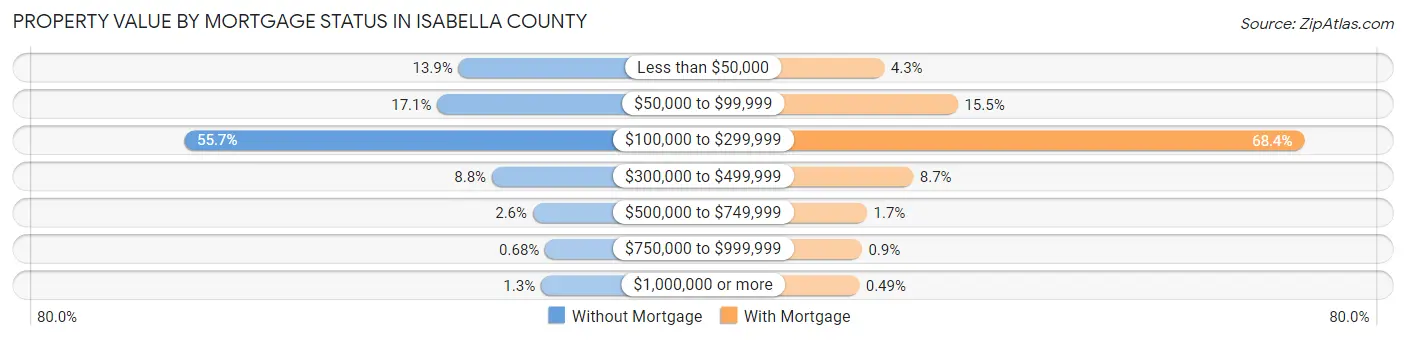
| Property Value | Without Mortgage | With Mortgage |
| Less than $50,000 | 920 (13.9%) | 375 (4.3%) |
| $50,000 to $99,999 | 1,135 (17.1%) | 1,352 (15.5%) |
| $100,000 to $299,999 | 3,694 (55.7%) | 5,953 (68.4%) |
| $300,000 to $499,999 | 583 (8.8%) | 760 (8.7%) |
| $500,000 to $749,999 | 169 (2.5%) | 146 (1.7%) |
| $750,000 to $999,999 | 45 (0.7%) | 78 (0.9%) |
| $1,000,000 or more | 87 (1.3%) | 43 (0.5%) |
| Total | 6,633 (100.0%) | 8,707 (100.0%) |
Household Income by Mortgage Status in Isabella County
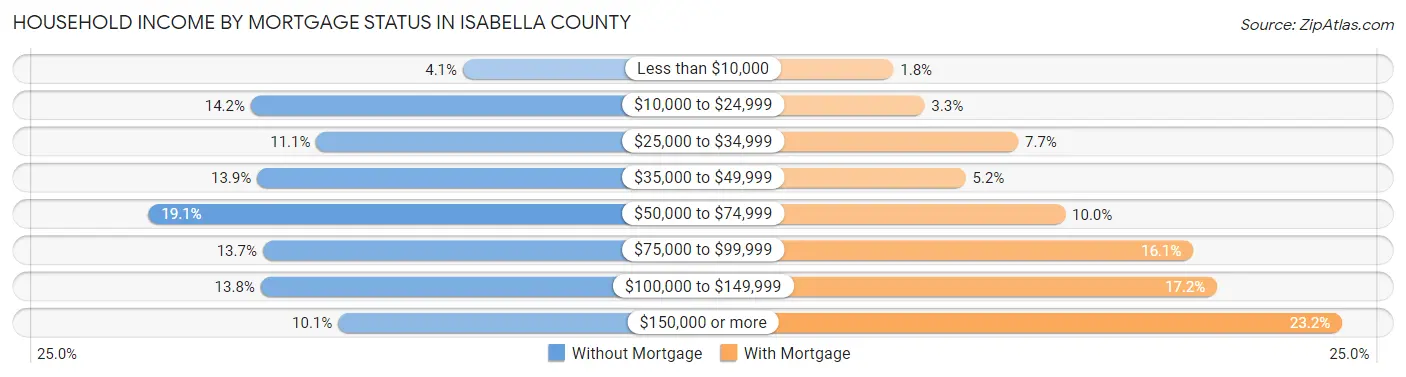
| Household Income | Without Mortgage | With Mortgage |
| Less than $10,000 | 274 (4.1%) | 157 (1.8%) |
| $10,000 to $24,999 | 944 (14.2%) | 286 (3.3%) |
| $25,000 to $34,999 | 737 (11.1%) | 674 (7.7%) |
| $35,000 to $49,999 | 924 (13.9%) | 456 (5.2%) |
| $50,000 to $74,999 | 1,267 (19.1%) | 869 (10.0%) |
| $75,000 to $99,999 | 906 (13.7%) | 1,400 (16.1%) |
| $100,000 to $149,999 | 913 (13.8%) | 1,499 (17.2%) |
| $150,000 or more | 668 (10.1%) | 2,017 (23.2%) |
| Total | 6,633 (100.0%) | 8,707 (100.0%) |
Property Value to Household Income Ratio in Isabella County
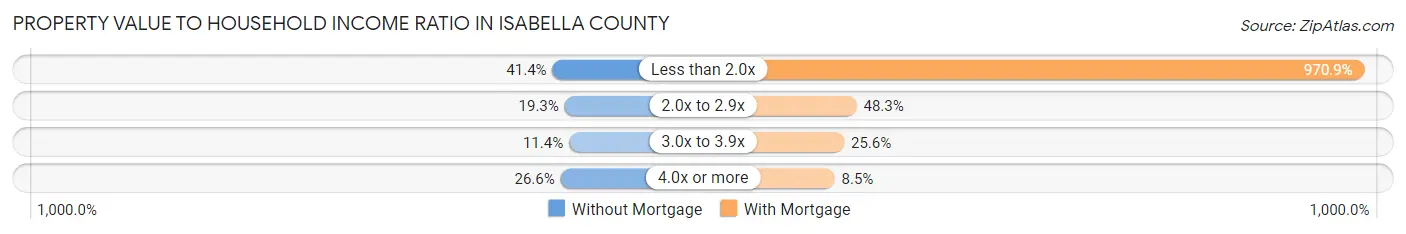
| Value-to-Income Ratio | Without Mortgage | With Mortgage |
| Less than 2.0x | 2,746 (41.4%) | 84,532 (970.9%) |
| 2.0x to 2.9x | 1,280 (19.3%) | 4,208 (48.3%) |
| 3.0x to 3.9x | 755 (11.4%) | 2,232 (25.6%) |
| 4.0x or more | 1,765 (26.6%) | 742 (8.5%) |
| Total | 6,633 (100.0%) | 8,707 (100.0%) |
Real Estate Taxes by Mortgage Status in Isabella County
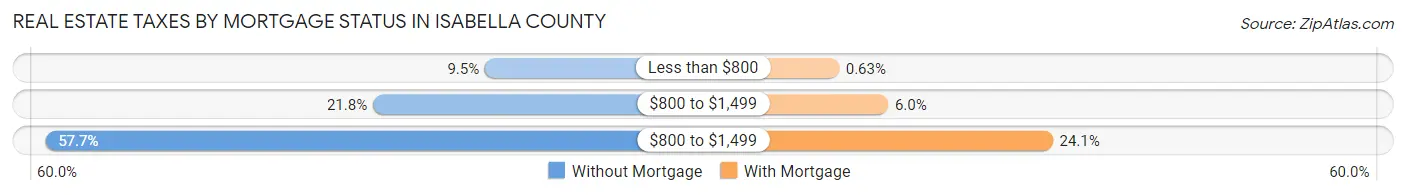
| Property Taxes | Without Mortgage | With Mortgage |
| Less than $800 | 633 (9.5%) | 55 (0.6%) |
| $800 to $1,499 | 1,447 (21.8%) | 524 (6.0%) |
| $800 to $1,499 | 3,830 (57.7%) | 2,094 (24.0%) |
| Total | 6,633 (100.0%) | 8,707 (100.0%) |
Health & Disability in Isabella County
Health Insurance Coverage by Age in Isabella County
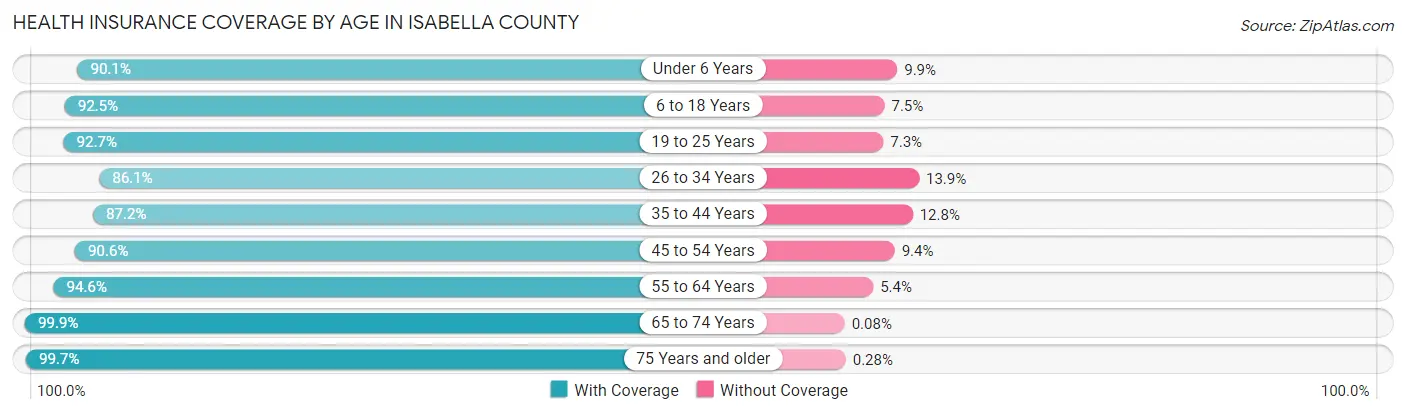
| Age Bracket | With Coverage | Without Coverage |
| Under 6 Years | 3,238 (90.1%) | 355 (9.9%) |
| 6 to 18 Years | 9,330 (92.5%) | 758 (7.5%) |
| 19 to 25 Years | 14,925 (92.7%) | 1,171 (7.3%) |
| 26 to 34 Years | 5,704 (86.1%) | 924 (13.9%) |
| 35 to 44 Years | 5,734 (87.2%) | 839 (12.8%) |
| 45 to 54 Years | 5,610 (90.6%) | 582 (9.4%) |
| 55 to 64 Years | 6,461 (94.6%) | 369 (5.4%) |
| 65 to 74 Years | 5,255 (99.9%) | 4 (0.1%) |
| 75 Years and older | 3,168 (99.7%) | 9 (0.3%) |
| Total | 59,425 (92.2%) | 5,011 (7.8%) |
Health Insurance Coverage by Citizenship Status in Isabella County
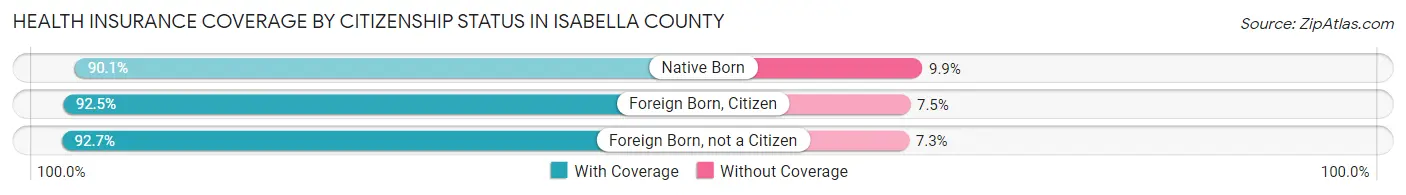
| Citizenship Status | With Coverage | Without Coverage |
| Native Born | 3,238 (90.1%) | 355 (9.9%) |
| Foreign Born, Citizen | 9,330 (92.5%) | 758 (7.5%) |
| Foreign Born, not a Citizen | 14,925 (92.7%) | 1,171 (7.3%) |
Health Insurance Coverage by Household Income in Isabella County
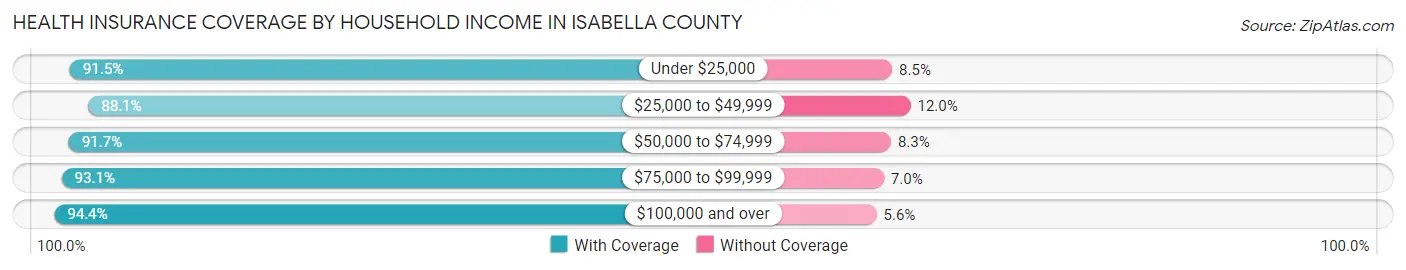
| Household Income | With Coverage | Without Coverage |
| Under $25,000 | 10,662 (91.5%) | 991 (8.5%) |
| $25,000 to $49,999 | 10,597 (88.0%) | 1,438 (11.9%) |
| $50,000 to $74,999 | 9,224 (91.7%) | 832 (8.3%) |
| $75,000 to $99,999 | 8,271 (93.0%) | 618 (7.0%) |
| $100,000 and over | 15,678 (94.4%) | 927 (5.6%) |
Public vs Private Health Insurance Coverage by Age in Isabella County
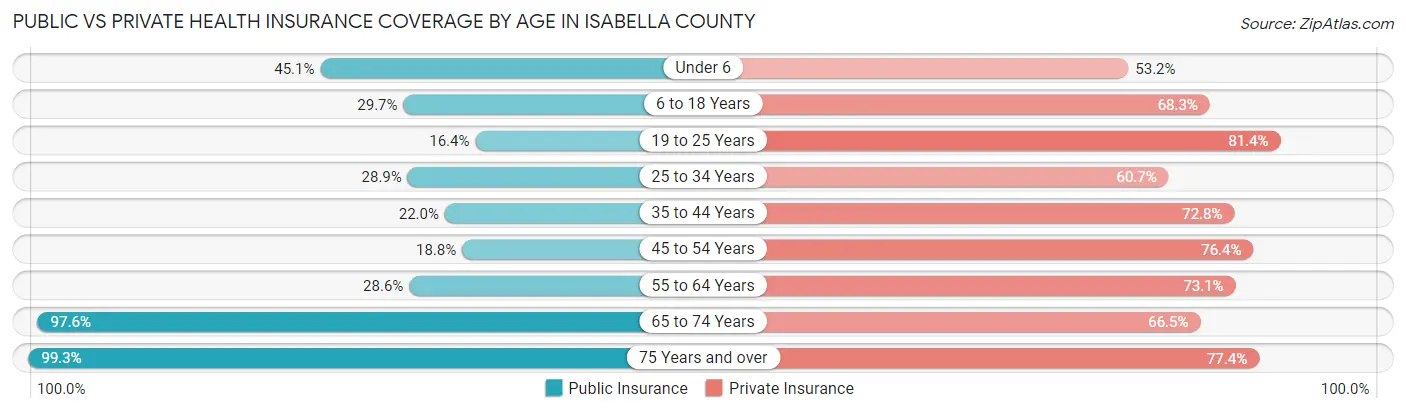
| Age Bracket | Public Insurance | Private Insurance |
| Under 6 | 1,621 (45.1%) | 1,911 (53.2%) |
| 6 to 18 Years | 2,996 (29.7%) | 6,888 (68.3%) |
| 19 to 25 Years | 2,631 (16.4%) | 13,103 (81.4%) |
| 25 to 34 Years | 1,916 (28.9%) | 4,020 (60.7%) |
| 35 to 44 Years | 1,446 (22.0%) | 4,788 (72.8%) |
| 45 to 54 Years | 1,165 (18.8%) | 4,729 (76.4%) |
| 55 to 64 Years | 1,955 (28.6%) | 4,990 (73.1%) |
| 65 to 74 Years | 5,131 (97.6%) | 3,499 (66.5%) |
| 75 Years and over | 3,155 (99.3%) | 2,460 (77.4%) |
| Total | 22,016 (34.2%) | 46,388 (72.0%) |
Disability Status by Sex by Age in Isabella County
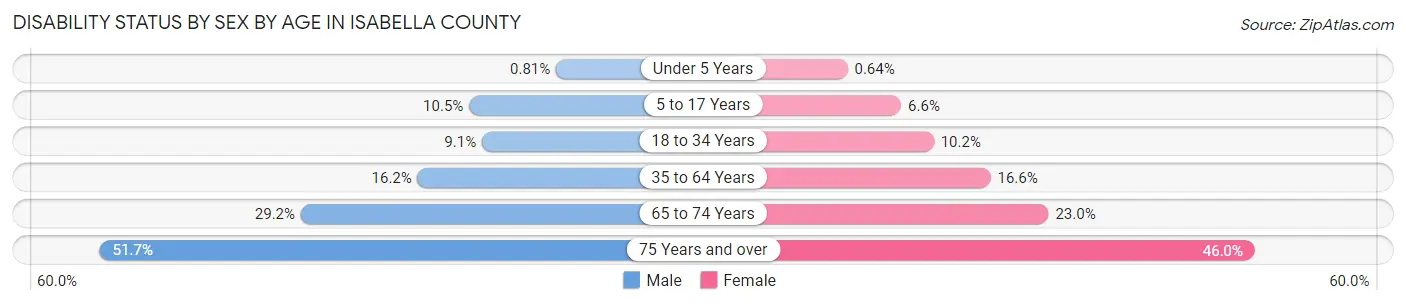
| Age Bracket | Male | Female |
| Under 5 Years | 11 (0.8%) | 10 (0.6%) |
| 5 to 17 Years | 435 (10.5%) | 272 (6.6%) |
| 18 to 34 Years | 1,098 (9.1%) | 1,341 (10.2%) |
| 35 to 64 Years | 1,591 (16.2%) | 1,623 (16.6%) |
| 65 to 74 Years | 736 (29.2%) | 631 (23.0%) |
| 75 Years and over | 673 (51.6%) | 862 (46.0%) |
Disability Class by Sex by Age in Isabella County
Disability Class: Hearing Difficulty
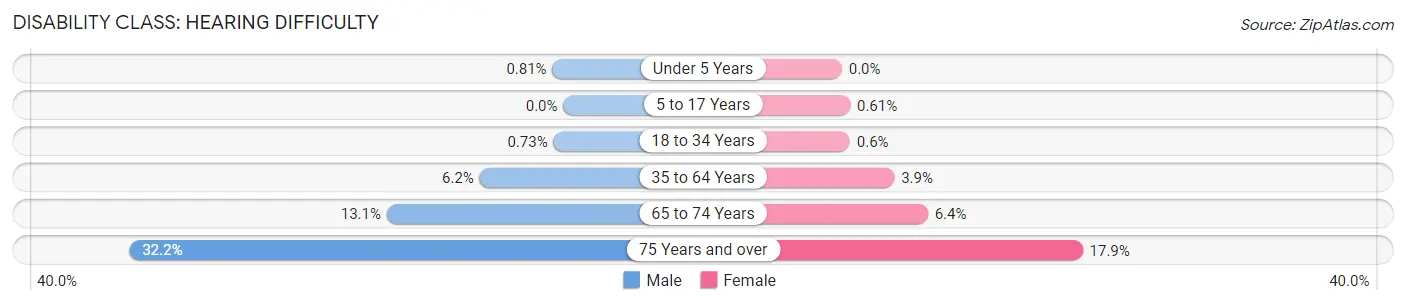
| Age Bracket | Male | Female |
| Under 5 Years | 11 (0.8%) | 0 (0.0%) |
| 5 to 17 Years | 0 (0.0%) | 25 (0.6%) |
| 18 to 34 Years | 88 (0.7%) | 78 (0.6%) |
| 35 to 64 Years | 609 (6.2%) | 381 (3.9%) |
| 65 to 74 Years | 330 (13.1%) | 175 (6.4%) |
| 75 Years and over | 420 (32.2%) | 335 (17.9%) |
Disability Class: Vision Difficulty
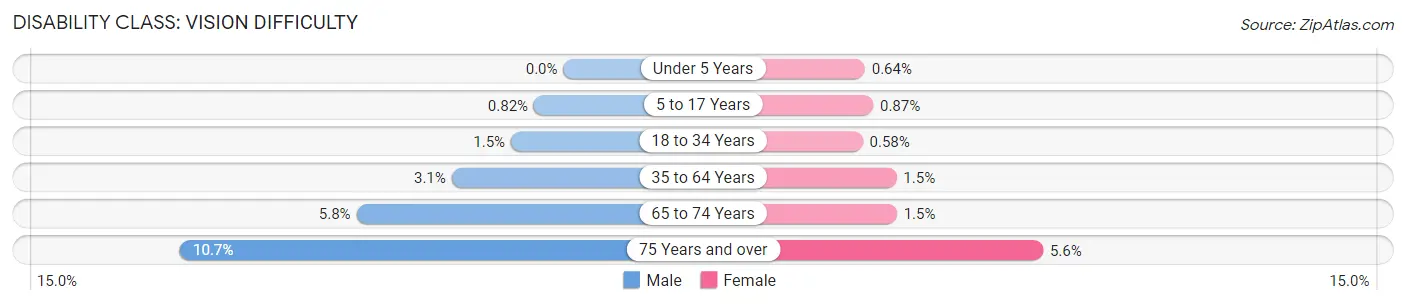
| Age Bracket | Male | Female |
| Under 5 Years | 0 (0.0%) | 10 (0.6%) |
| 5 to 17 Years | 34 (0.8%) | 36 (0.9%) |
| 18 to 34 Years | 177 (1.5%) | 76 (0.6%) |
| 35 to 64 Years | 305 (3.1%) | 149 (1.5%) |
| 65 to 74 Years | 145 (5.8%) | 42 (1.5%) |
| 75 Years and over | 139 (10.7%) | 105 (5.6%) |
Disability Class: Cognitive Difficulty
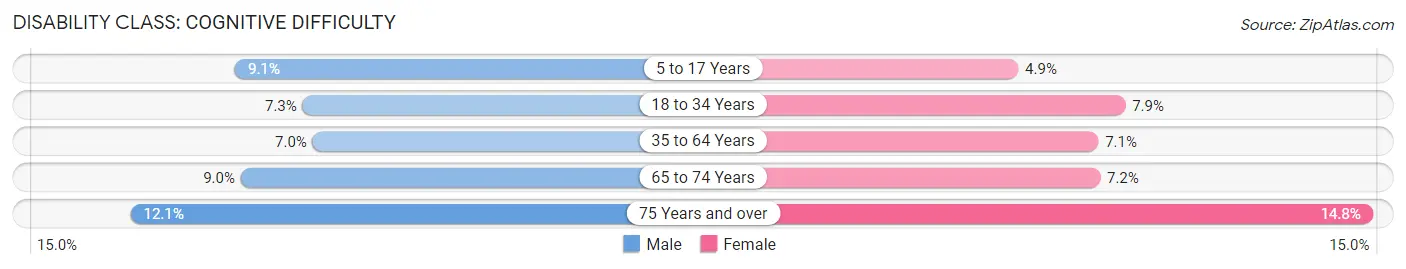
| Age Bracket | Male | Female |
| 5 to 17 Years | 379 (9.1%) | 202 (4.9%) |
| 18 to 34 Years | 880 (7.3%) | 1,034 (7.9%) |
| 35 to 64 Years | 684 (7.0%) | 699 (7.1%) |
| 65 to 74 Years | 226 (9.0%) | 197 (7.2%) |
| 75 Years and over | 157 (12.0%) | 277 (14.8%) |
Disability Class: Ambulatory Difficulty
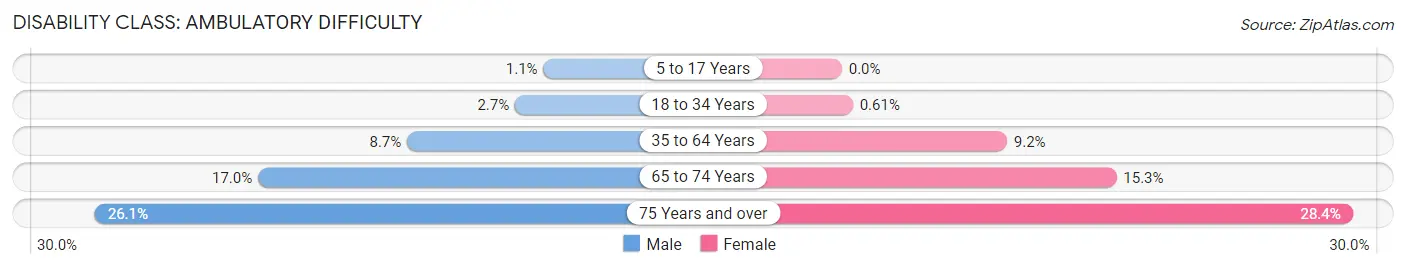
| Age Bracket | Male | Female |
| 5 to 17 Years | 46 (1.1%) | 0 (0.0%) |
| 18 to 34 Years | 326 (2.7%) | 80 (0.6%) |
| 35 to 64 Years | 853 (8.7%) | 900 (9.2%) |
| 65 to 74 Years | 428 (17.0%) | 419 (15.3%) |
| 75 Years and over | 340 (26.1%) | 533 (28.4%) |
Disability Class: Self-Care Difficulty
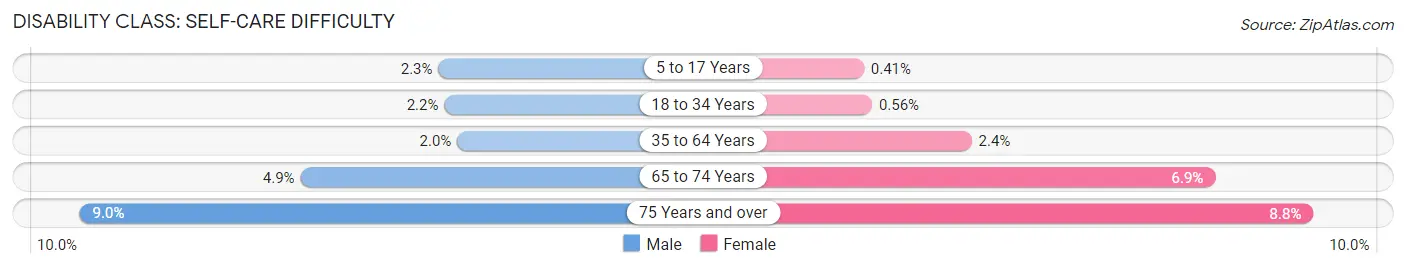
| Age Bracket | Male | Female |
| 5 to 17 Years | 96 (2.3%) | 17 (0.4%) |
| 18 to 34 Years | 268 (2.2%) | 73 (0.6%) |
| 35 to 64 Years | 193 (2.0%) | 236 (2.4%) |
| 65 to 74 Years | 123 (4.9%) | 190 (6.9%) |
| 75 Years and over | 117 (9.0%) | 164 (8.7%) |
Technology Access in Isabella County
Computing Device Access in Isabella County
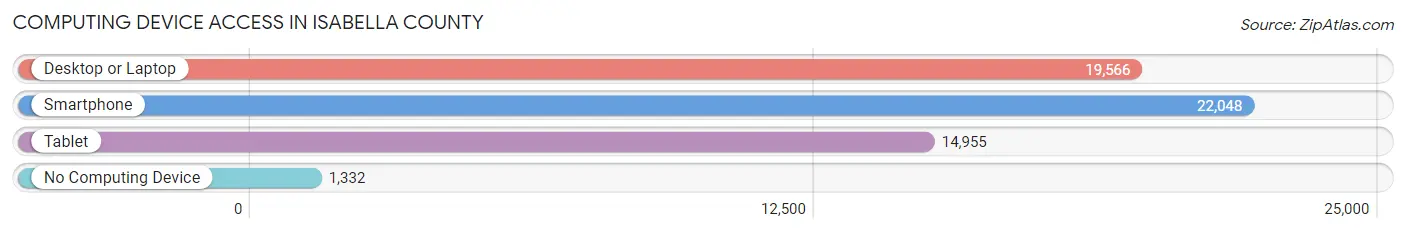
| Device Type | # Households | % Households |
| Desktop or Laptop | 19,566 | 78.7% |
| Smartphone | 22,048 | 88.6% |
| Tablet | 14,955 | 60.1% |
| No Computing Device | 1,332 | 5.3% |
| Total | 24,875 | 100.0% |
Internet Access in Isabella County
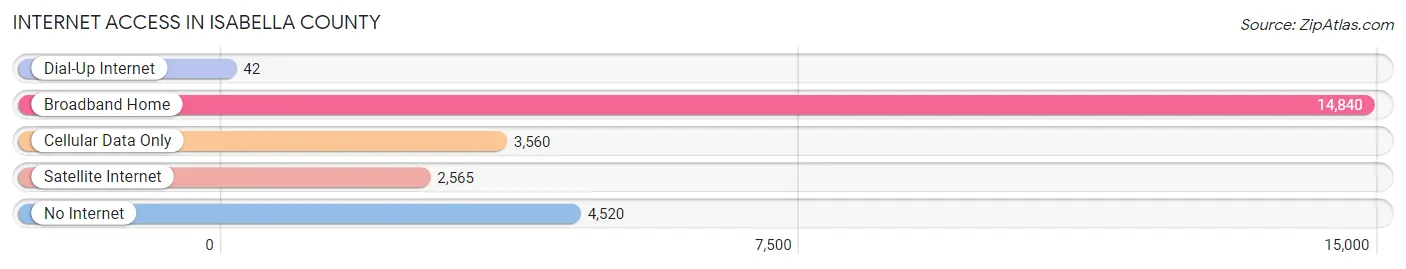
| Internet Type | # Households | % Households |
| Dial-Up Internet | 42 | 0.2% |
| Broadband Home | 14,840 | 59.7% |
| Cellular Data Only | 3,560 | 14.3% |
| Satellite Internet | 2,565 | 10.3% |
| No Internet | 4,520 | 18.2% |
| Total | 24,875 | 100.0% |
Isabella County Summary
Isabella County is located in the central region of Michigan’s Lower Peninsula. It is bordered by Gratiot County to the north, Midland County to the east, Clare County to the south, and Mecosta County to the west. The county seat is Mt. Pleasant, and the county has a total area of 576 square miles.
History
Isabella County was established in 1831 and was named after Queen Isabella of Spain. The county was originally part of the Saginaw Valley, and the first settlers arrived in the area in 1854. The first county seat was located in Isabella, but it was moved to Mt. Pleasant in 1859.
The county was largely agricultural in the 19th century, with the main crops being wheat, corn, and oats. The lumber industry was also important, and the county was home to several sawmills. In the early 20th century, the county began to diversify its economy, and the automotive industry began to take hold.
Geography
Isabella County is located in the central region of Michigan’s Lower Peninsula. It is bordered by Gratiot County to the north, Midland County to the east, Clare County to the south, and Mecosta County to the west. The county seat is Mt. Pleasant, and the county has a total area of 576 square miles.
The county is mostly flat, with some rolling hills in the northern and western parts. The Chippewa River runs through the county, and there are several small lakes and ponds scattered throughout. The county is mostly covered in deciduous forests, with some coniferous forests in the northern and western parts.
Economy
Isabella County’s economy is largely based on manufacturing and agriculture. The county is home to several automotive parts manufacturers, as well as a number of food processing plants. The county is also home to several large farms, which produce corn, wheat, oats, and other crops.
The county is also home to Central Michigan University, which is located in Mt. Pleasant. The university is a major employer in the county, and it also provides a number of educational and cultural opportunities for residents.
Demographics
As of the 2010 census, Isabella County had a population of 71,311. The population is largely white (90.2%), with small percentages of African Americans (3.2%), Native Americans (1.2%), Asians (1.1%), and other races (4.3%). The median household income is $45,845, and the median age is 38.
Isabella County is largely rural, with most of the population living in small towns and villages. The largest city is Mt. Pleasant, which has a population of 26,016. Other cities include Shepherd (2,845), Rosebush (1,845), and Weidman (1,717).
Common Questions
What is Per Capita Income in Isabella County?
Per Capita income in Isabella County is $28,809.
What is the Median Family Income in Isabella County?
Median Family Income in Isabella County is $72,615.
What is the Median Household income in Isabella County?
Median Household Income in Isabella County is $52,638.
What is Income or Wage Gap in Isabella County?
Income or Wage Gap in Isabella County is 43.3%.
Women in Isabella County earn 56.7 cents for every dollar earned by a man.
What is Family Income Deficit in Isabella County?
Family Income Deficit in Isabella County is $9,528.
Families that are below poverty line in Isabella County earn $9,528 less on average than the poverty threshold level.
What is Inequality or Gini Index in Isabella County?
Inequality or Gini Index in Isabella County is 0.48.
What is the Total Population of Isabella County?
Total Population of Isabella County is 64,938.
What is the Total Male Population of Isabella County?
Total Male Population of Isabella County is 31,554.
What is the Total Female Population of Isabella County?
Total Female Population of Isabella County is 33,384.
What is the Ratio of Males per 100 Females in Isabella County?
There are 94.52 Males per 100 Females in Isabella County.
What is the Ratio of Females per 100 Males in Isabella County?
There are 105.80 Females per 100 Males in Isabella County.
What is the Median Population Age in Isabella County?
Median Population Age in Isabella County is 28.9 Years.
What is the Average Family Size in Isabella County
Average Family Size in Isabella County is 2.9 People.
What is the Average Household Size in Isabella County
Average Household Size in Isabella County is 2.4 People.
How Large is the Labor Force in Isabella County?
There are 34,122 People in the Labor Forcein in Isabella County.
What is the Percentage of People in the Labor Force in Isabella County?
61.9% of People are in the Labor Force in Isabella County.
What is the Unemployment Rate in Isabella County?
Unemployment Rate in Isabella County is 7.2%.