Huron County, MI Map & Demographics
Huron County Map
Huron County Overview
$32,069
PER CAPITA INCOME
$71,902
AVG FAMILY INCOME
$54,475
AVG HOUSEHOLD INCOME
37.1%
WAGE / INCOME GAP [ % ]
62.9¢/ $1
WAGE / INCOME GAP [ $ ]
$8,211
FAMILY INCOME DEFICIT
0.43
INEQUALITY / GINI INDEX
31,461
TOTAL POPULATION
15,783
MALE POPULATION
15,678
FEMALE POPULATION
100.67
MALES / 100 FEMALES
99.33
FEMALES / 100 MALES
49.3
MEDIAN AGE
3.0
AVG FAMILY SIZE
2.3
AVG HOUSEHOLD SIZE
14,399
LABOR FORCE [ PEOPLE ]
55.1%
PERCENT IN LABOR FORCE
5.3%
UNEMPLOYMENT RATE
Huron County Area Codes
Income in Huron County
Income Overview in Huron County
Per Capita Income in Huron County is $32,069, while median incomes of families and households are $71,902 and $54,475 respectively.
| Characteristic | Number | Measure |
| Per Capita Income | 31,461 | $32,069 |
| Median Family Income | 8,111 | $71,902 |
| Mean Family Income | 8,111 | $88,162 |
| Median Household Income | 13,617 | $54,475 |
| Mean Household Income | 13,617 | $71,283 |
| Income Deficit | 8,111 | $8,211 |
| Wage / Income Gap (%) | 31,461 | 37.15% |
| Wage / Income Gap ($) | 31,461 | 62.85¢ per $1 |
| Gini / Inequality Index | 31,461 | 0.43 |
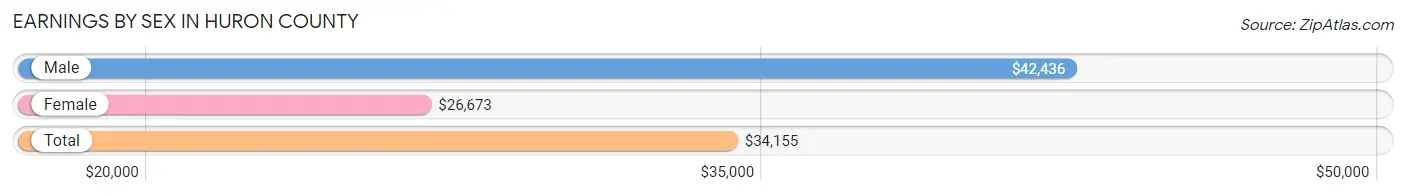
Earnings by Sex in Huron County
Average Earnings in Huron County are $34,155, $42,436 for men and $26,673 for women, a difference of 37.1%.
| Sex | Number | Average Earnings |
| Male | 8,362 (54.4%) | $42,436 |
| Female | 7,004 (45.6%) | $26,673 |
| Total | 15,366 (100.0%) | $34,155 |
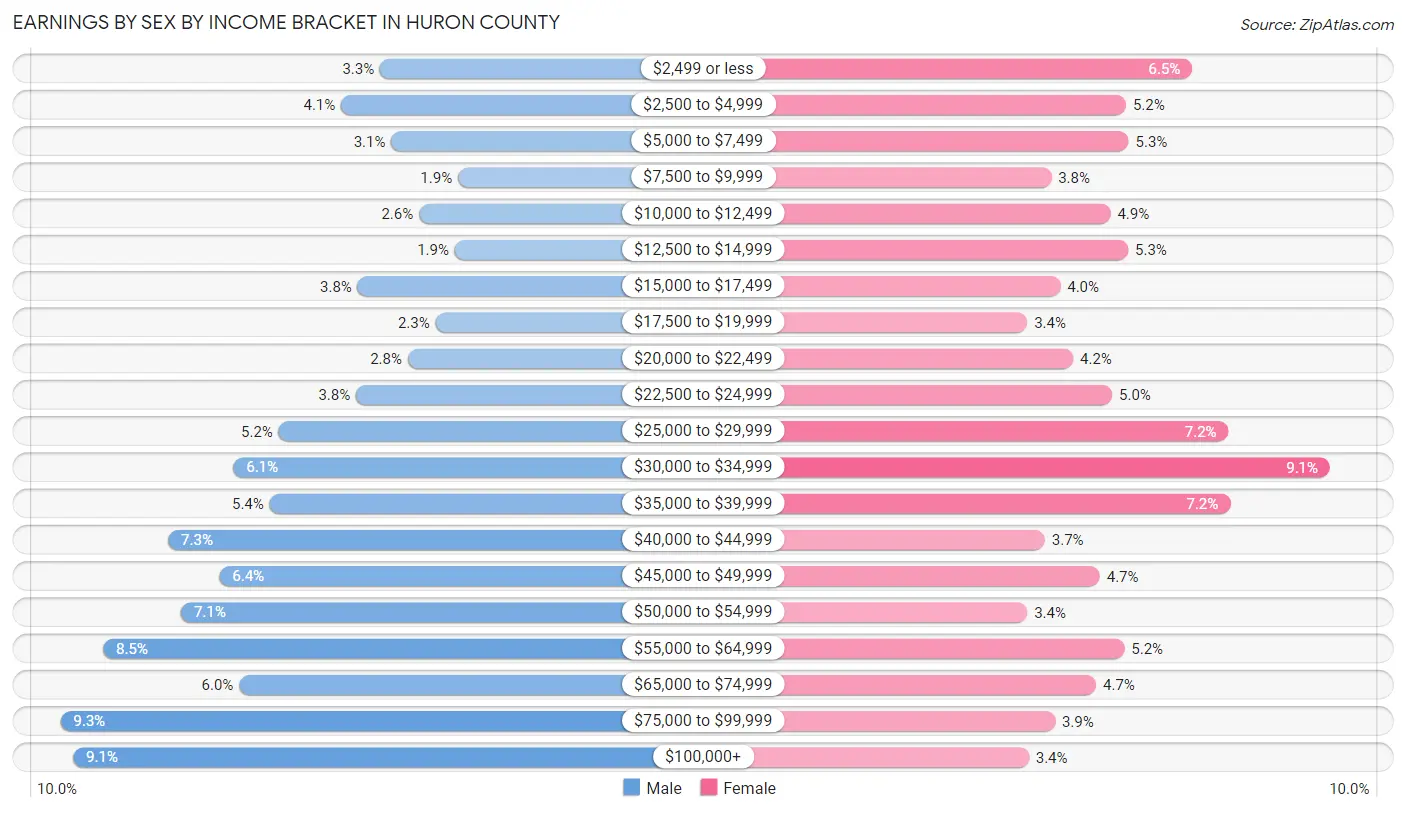
Earnings by Sex by Income Bracket in Huron County
The most common earnings brackets in Huron County are $75,000 to $99,999 for men (780 | 9.3%) and $30,000 to $34,999 for women (634 | 9.0%).
| Income | Male | Female |
| $2,499 or less | 279 (3.3%) | 453 (6.5%) |
| $2,500 to $4,999 | 340 (4.1%) | 366 (5.2%) |
| $5,000 to $7,499 | 262 (3.1%) | 370 (5.3%) |
| $7,500 to $9,999 | 157 (1.9%) | 268 (3.8%) |
| $10,000 to $12,499 | 218 (2.6%) | 346 (4.9%) |
| $12,500 to $14,999 | 162 (1.9%) | 369 (5.3%) |
| $15,000 to $17,499 | 314 (3.8%) | 280 (4.0%) |
| $17,500 to $19,999 | 192 (2.3%) | 237 (3.4%) |
| $20,000 to $22,499 | 236 (2.8%) | 297 (4.2%) |
| $22,500 to $24,999 | 317 (3.8%) | 348 (5.0%) |
| $25,000 to $29,999 | 438 (5.2%) | 501 (7.1%) |
| $30,000 to $34,999 | 509 (6.1%) | 634 (9.0%) |
| $35,000 to $39,999 | 452 (5.4%) | 503 (7.2%) |
| $40,000 to $44,999 | 611 (7.3%) | 260 (3.7%) |
| $45,000 to $49,999 | 531 (6.4%) | 332 (4.7%) |
| $50,000 to $54,999 | 591 (7.1%) | 237 (3.4%) |
| $55,000 to $64,999 | 713 (8.5%) | 364 (5.2%) |
| $65,000 to $74,999 | 500 (6.0%) | 327 (4.7%) |
| $75,000 to $99,999 | 780 (9.3%) | 273 (3.9%) |
| $100,000+ | 760 (9.1%) | 239 (3.4%) |
| Total | 8,362 (100.0%) | 7,004 (100.0%) |
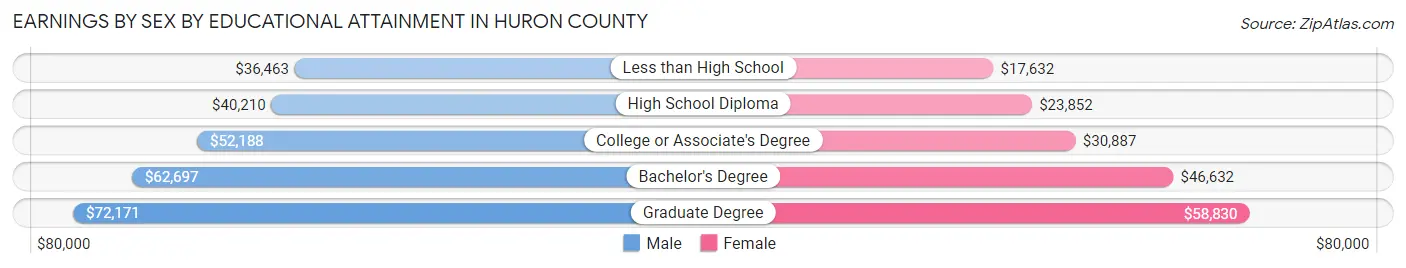
Earnings by Sex by Educational Attainment in Huron County
Average earnings in Huron County are $45,976 for men and $29,937 for women, a difference of 34.9%. Men with an educational attainment of graduate degree enjoy the highest average annual earnings of $72,171, while those with less than high school education earn the least with $36,463. Women with an educational attainment of graduate degree earn the most with the average annual earnings of $58,830, while those with less than high school education have the smallest earnings of $17,632.
| Educational Attainment | Male Income | Female Income |
| Less than High School | $36,463 | $17,632 |
| High School Diploma | $40,210 | $23,852 |
| College or Associate's Degree | $52,188 | $30,887 |
| Bachelor's Degree | $62,697 | $46,632 |
| Graduate Degree | $72,171 | $58,830 |
| Total | $45,976 | $29,937 |
Family Income in Huron County
Family Income Brackets in Huron County
According to the Huron County family income data, there are 1,841 families falling into the $50,000 to $74,999 income range, which is the most common income bracket and makes up 22.7% of all families. Conversely, the $10,000 to $14,999 income bracket is the least frequent group with only 138 families (1.7%) belonging to this category.
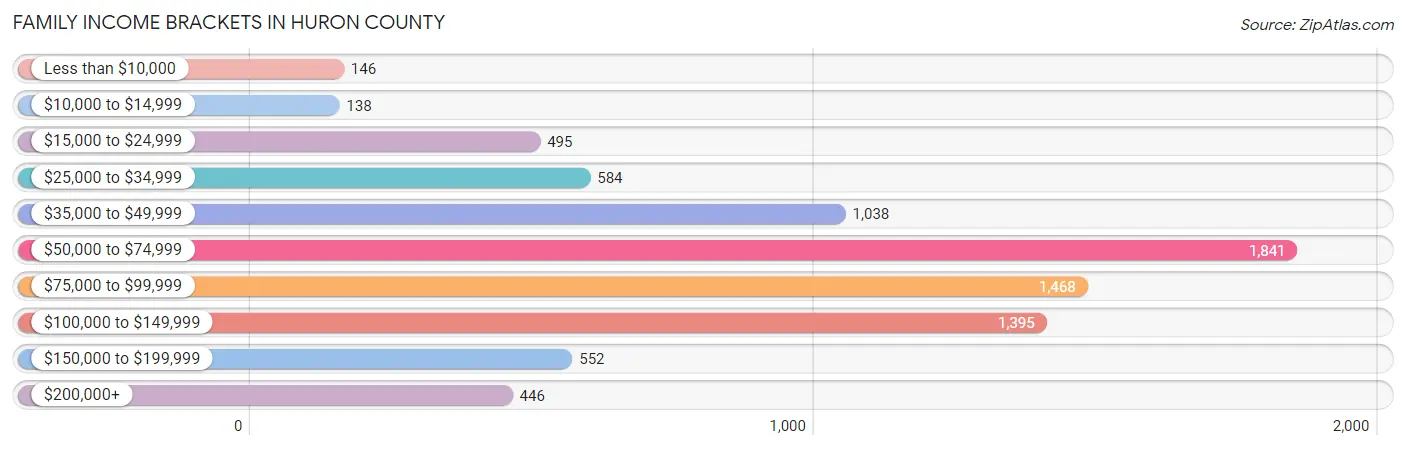
| Income Bracket | # Families | % Families |
| Less than $10,000 | 146 | 1.8% |
| $10,000 to $14,999 | 138 | 1.7% |
| $15,000 to $24,999 | 495 | 6.1% |
| $25,000 to $34,999 | 584 | 7.2% |
| $35,000 to $49,999 | 1,038 | 12.8% |
| $50,000 to $74,999 | 1,841 | 22.7% |
| $75,000 to $99,999 | 1,468 | 18.1% |
| $100,000 to $149,999 | 1,395 | 17.2% |
| $150,000 to $199,999 | 552 | 6.8% |
| $200,000+ | 446 | 5.5% |
Family Income by Famaliy Size in Huron County
4-person families (858 | 10.6%) account for the highest median family income in Huron County with $84,700 per family, while 2-person families (4,900 | 60.4%) have the highest median income of $31,956 per family member.
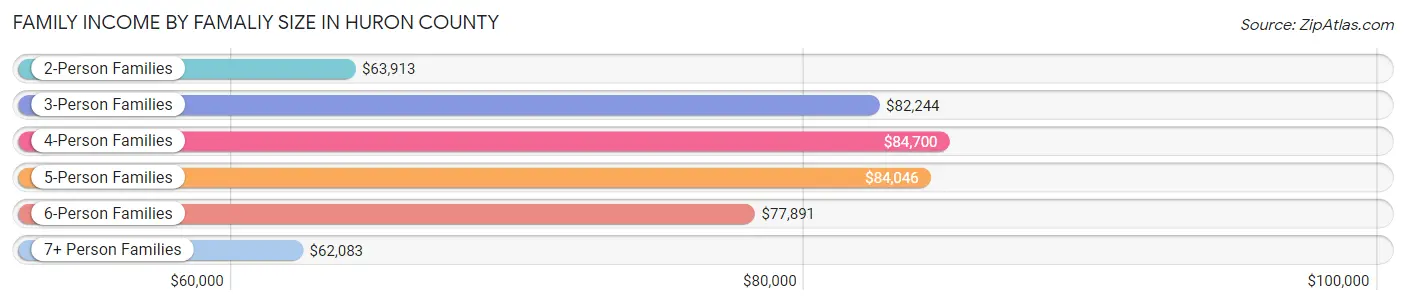
| Income Bracket | # Families | Median Income |
| 2-Person Families | 4,900 (60.4%) | $63,913 |
| 3-Person Families | 1,477 (18.2%) | $82,244 |
| 4-Person Families | 858 (10.6%) | $84,700 |
| 5-Person Families | 607 (7.5%) | $84,046 |
| 6-Person Families | 200 (2.5%) | $77,891 |
| 7+ Person Families | 69 (0.9%) | $62,083 |
| Total | 8,111 (100.0%) | $71,902 |
Family Income by Number of Earners in Huron County
The median family income in Huron County is $71,902, with families comprising 3+ earners (725) having the highest median family income of $108,698, while families with no earners (1,915) have the lowest median family income of $49,186, accounting for 8.9% and 23.6% of families, respectively.
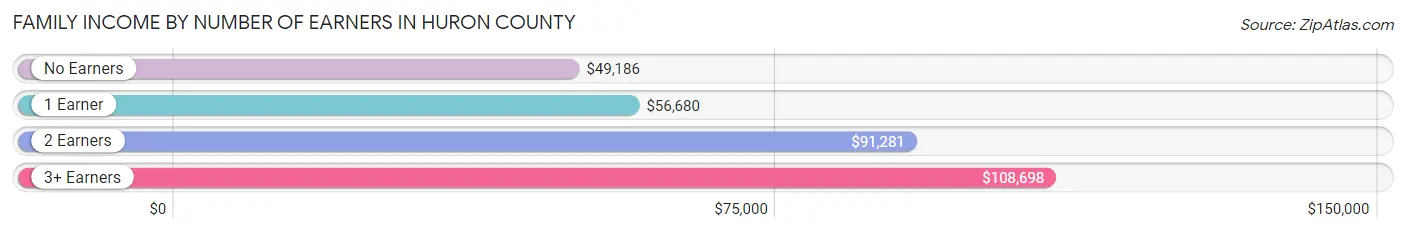
| Number of Earners | # Families | Median Income |
| No Earners | 1,915 (23.6%) | $49,186 |
| 1 Earner | 2,481 (30.6%) | $56,680 |
| 2 Earners | 2,990 (36.9%) | $91,281 |
| 3+ Earners | 725 (8.9%) | $108,698 |
| Total | 8,111 (100.0%) | $71,902 |
Household Income in Huron County
Household Income Brackets in Huron County
With 2,873 households falling in the category, the $50,000 to $74,999 income range is the most frequent in Huron County, accounting for 21.1% of all households. In contrast, only 517 households (3.8%) fall into the $200,000+ income bracket, making it the least populous group.
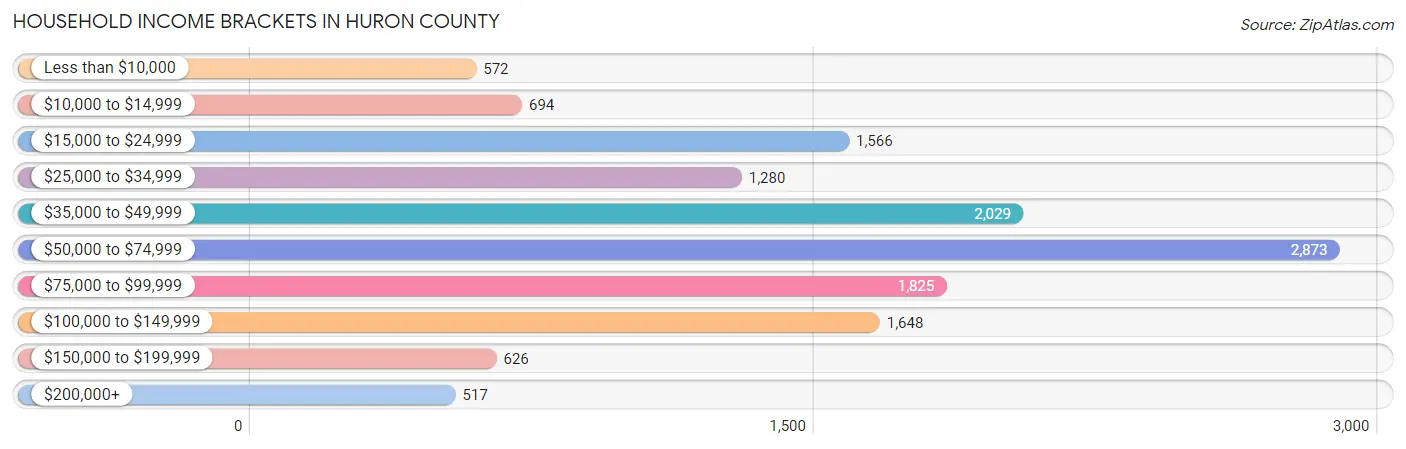
| Income Bracket | # Households | % Households |
| Less than $10,000 | 572 | 4.2% |
| $10,000 to $14,999 | 694 | 5.1% |
| $15,000 to $24,999 | 1,566 | 11.5% |
| $25,000 to $34,999 | 1,280 | 9.4% |
| $35,000 to $49,999 | 2,029 | 14.9% |
| $50,000 to $74,999 | 2,873 | 21.1% |
| $75,000 to $99,999 | 1,825 | 13.4% |
| $100,000 to $149,999 | 1,648 | 12.1% |
| $150,000 to $199,999 | 626 | 4.6% |
| $200,000+ | 517 | 3.8% |
Household Income by Householder Age in Huron County
The median household income in Huron County is $54,475, with the highest median household income of $69,219 found in the 25 to 44 years age bracket for the primary householder. A total of 3,084 households (22.7%) fall into this category. Meanwhile, the 65+ years age bracket for the primary householder has the lowest median household income of $43,176, with 5,307 households (39.0%) in this group.
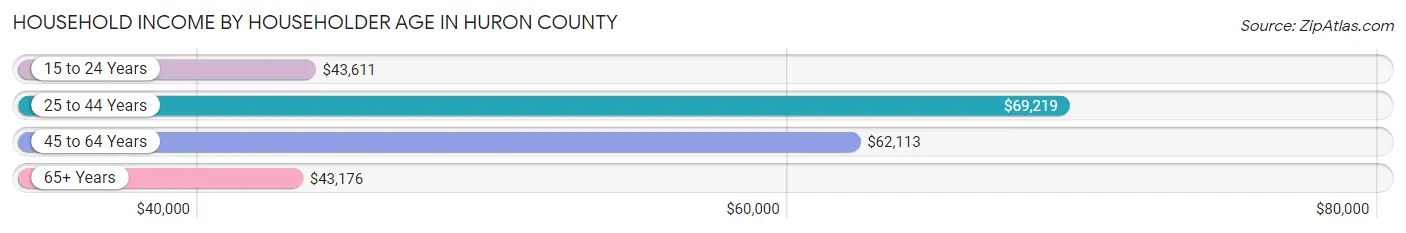
| Income Bracket | # Households | Median Income |
| 15 to 24 Years | 338 (2.5%) | $43,611 |
| 25 to 44 Years | 3,084 (22.7%) | $69,219 |
| 45 to 64 Years | 4,888 (35.9%) | $62,113 |
| 65+ Years | 5,307 (39.0%) | $43,176 |
| Total | 13,617 (100.0%) | $54,475 |
Poverty in Huron County
Income Below Poverty by Sex and Age in Huron County
With 10.2% poverty level for males and 12.3% for females among the residents of Huron County, 15 year old males and 12 to 14 year old females are the most vulnerable to poverty, with 68 males (28.6%) and 84 females (22.2%) in their respective age groups living below the poverty level.
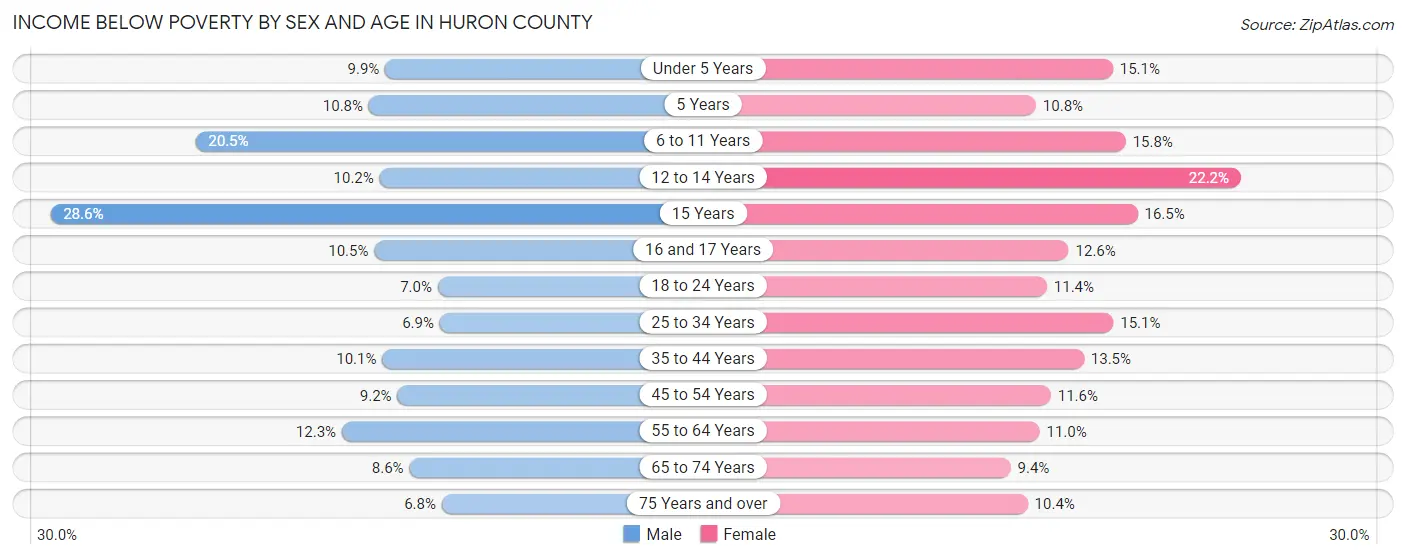
| Age Bracket | Male | Female |
| Under 5 Years | 72 (9.9%) | 112 (15.1%) |
| 5 Years | 13 (10.8%) | 24 (10.8%) |
| 6 to 11 Years | 208 (20.5%) | 166 (15.8%) |
| 12 to 14 Years | 63 (10.2%) | 84 (22.2%) |
| 15 Years | 68 (28.6%) | 28 (16.5%) |
| 16 and 17 Years | 32 (10.5%) | 48 (12.6%) |
| 18 to 24 Years | 81 (7.0%) | 121 (11.4%) |
| 25 to 34 Years | 108 (6.9%) | 216 (15.1%) |
| 35 to 44 Years | 159 (10.1%) | 196 (13.5%) |
| 45 to 54 Years | 174 (9.2%) | 209 (11.6%) |
| 55 to 64 Years | 321 (12.3%) | 290 (11.0%) |
| 65 to 74 Years | 207 (8.6%) | 223 (9.4%) |
| 75 Years and over | 96 (6.8%) | 182 (10.3%) |
| Total | 1,602 (10.2%) | 1,899 (12.3%) |
Income Above Poverty by Sex and Age in Huron County
According to the poverty statistics in Huron County, males aged 75 years and over and females aged 65 to 74 years are the age groups that are most secure financially, with 93.2% of males and 90.6% of females in these age groups living above the poverty line.
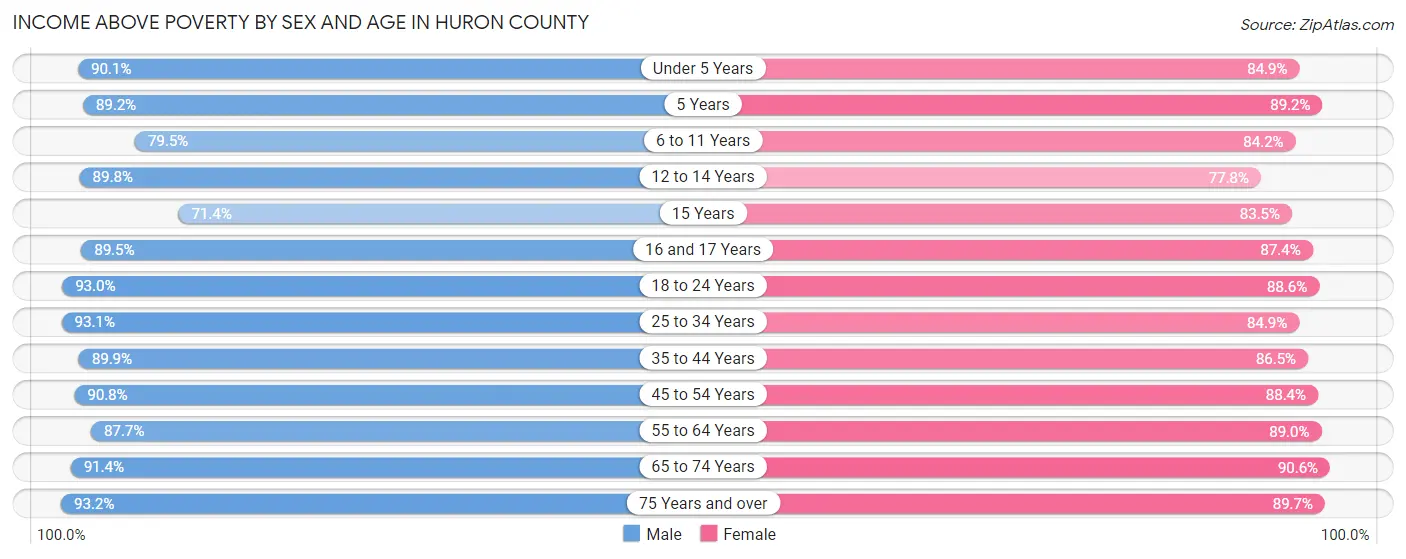
| Age Bracket | Male | Female |
| Under 5 Years | 654 (90.1%) | 630 (84.9%) |
| 5 Years | 107 (89.2%) | 198 (89.2%) |
| 6 to 11 Years | 807 (79.5%) | 884 (84.2%) |
| 12 to 14 Years | 553 (89.8%) | 294 (77.8%) |
| 15 Years | 170 (71.4%) | 142 (83.5%) |
| 16 and 17 Years | 272 (89.5%) | 332 (87.4%) |
| 18 to 24 Years | 1,078 (93.0%) | 939 (88.6%) |
| 25 to 34 Years | 1,461 (93.1%) | 1,213 (84.9%) |
| 35 to 44 Years | 1,418 (89.9%) | 1,258 (86.5%) |
| 45 to 54 Years | 1,709 (90.8%) | 1,587 (88.4%) |
| 55 to 64 Years | 2,282 (87.7%) | 2,343 (89.0%) |
| 65 to 74 Years | 2,207 (91.4%) | 2,150 (90.6%) |
| 75 Years and over | 1,323 (93.2%) | 1,577 (89.6%) |
| Total | 14,041 (89.8%) | 13,547 (87.7%) |
Income Below Poverty Among Married-Couple Families in Huron County
The poverty statistics for married-couple families in Huron County show that 4.3% or 286 of the total 6,700 families live below the poverty line. Families with 5 or more children have the highest poverty rate of 20.8%, comprising of 10 families. On the other hand, families with no children have the lowest poverty rate of 3.5%, which includes 169 families.
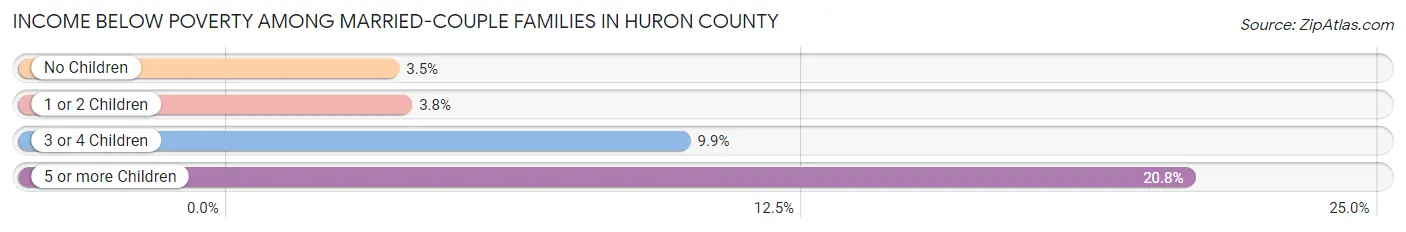
| Children | Above Poverty | Below Poverty |
| No Children | 4,649 (96.5%) | 169 (3.5%) |
| 1 or 2 Children | 1,169 (96.2%) | 46 (3.8%) |
| 3 or 4 Children | 558 (90.1%) | 61 (9.9%) |
| 5 or more Children | 38 (79.2%) | 10 (20.8%) |
| Total | 6,414 (95.7%) | 286 (4.3%) |
Income Below Poverty Among Single-Parent Households in Huron County
According to the poverty data in Huron County, 13.9% or 70 single-father households and 24.4% or 221 single-mother households are living below the poverty line. Among single-father households, those with 3 or 4 children have the highest poverty rate, with 18 households (40.0%) experiencing poverty. Likewise, among single-mother households, those with 5 or more children have the highest poverty rate, with 4 households (100.0%) falling below the poverty line.
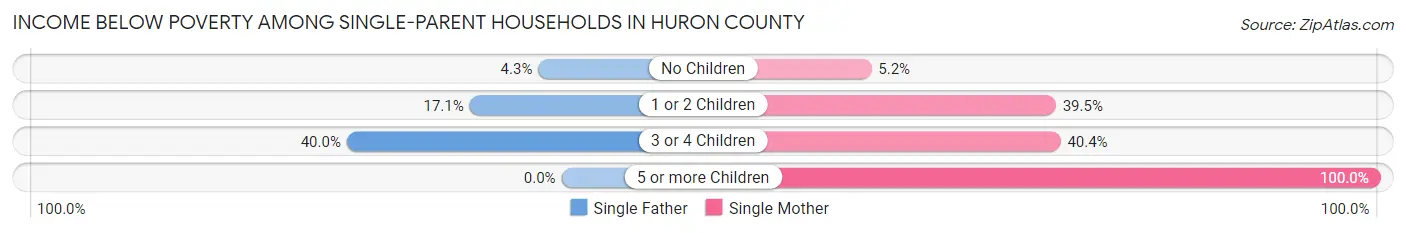
| Children | Single Father | Single Mother |
| No Children | 9 (4.3%) | 21 (5.1%) |
| 1 or 2 Children | 43 (17.1%) | 175 (39.5%) |
| 3 or 4 Children | 18 (40.0%) | 21 (40.4%) |
| 5 or more Children | 0 (0.0%) | 4 (100.0%) |
| Total | 70 (13.9%) | 221 (24.4%) |
Income Below Poverty Among Married-Couple vs Single-Parent Households in Huron County
The poverty data for Huron County shows that 286 of the married-couple family households (4.3%) and 291 of the single-parent households (20.6%) are living below the poverty level. Within the married-couple family households, those with 5 or more children have the highest poverty rate, with 10 households (20.8%) falling below the poverty line. Among the single-parent households, those with 5 or more children have the highest poverty rate, with 4 household (100.0%) living below poverty.
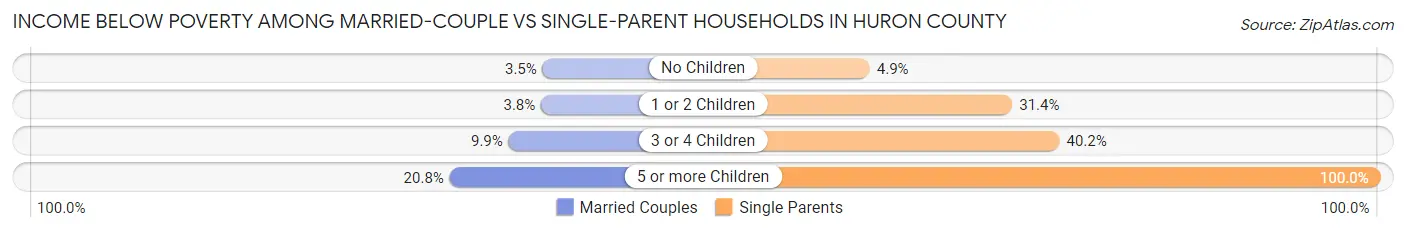
| Children | Married-Couple Families | Single-Parent Households |
| No Children | 169 (3.5%) | 30 (4.9%) |
| 1 or 2 Children | 46 (3.8%) | 218 (31.4%) |
| 3 or 4 Children | 61 (9.9%) | 39 (40.2%) |
| 5 or more Children | 10 (20.8%) | 4 (100.0%) |
| Total | 286 (4.3%) | 291 (20.6%) |
Race in Huron County
The most populous races in Huron County are White / Caucasian (29,926 | 95.1%), Two or more Races (888 | 2.8%), and Hispanic or Latino (841 | 2.7%).
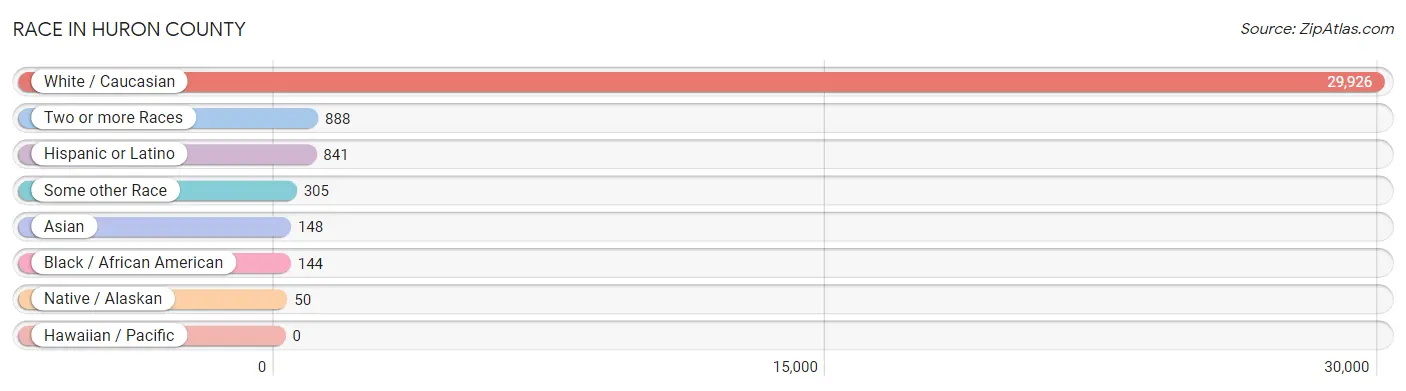
| Race | # Population | % Population |
| Asian | 148 | 0.5% |
| Black / African American | 144 | 0.5% |
| Hawaiian / Pacific | 0 | 0.0% |
| Hispanic or Latino | 841 | 2.7% |
| Native / Alaskan | 50 | 0.2% |
| White / Caucasian | 29,926 | 95.1% |
| Two or more Races | 888 | 2.8% |
| Some other Race | 305 | 1.0% |
| Total | 31,461 | 100.0% |
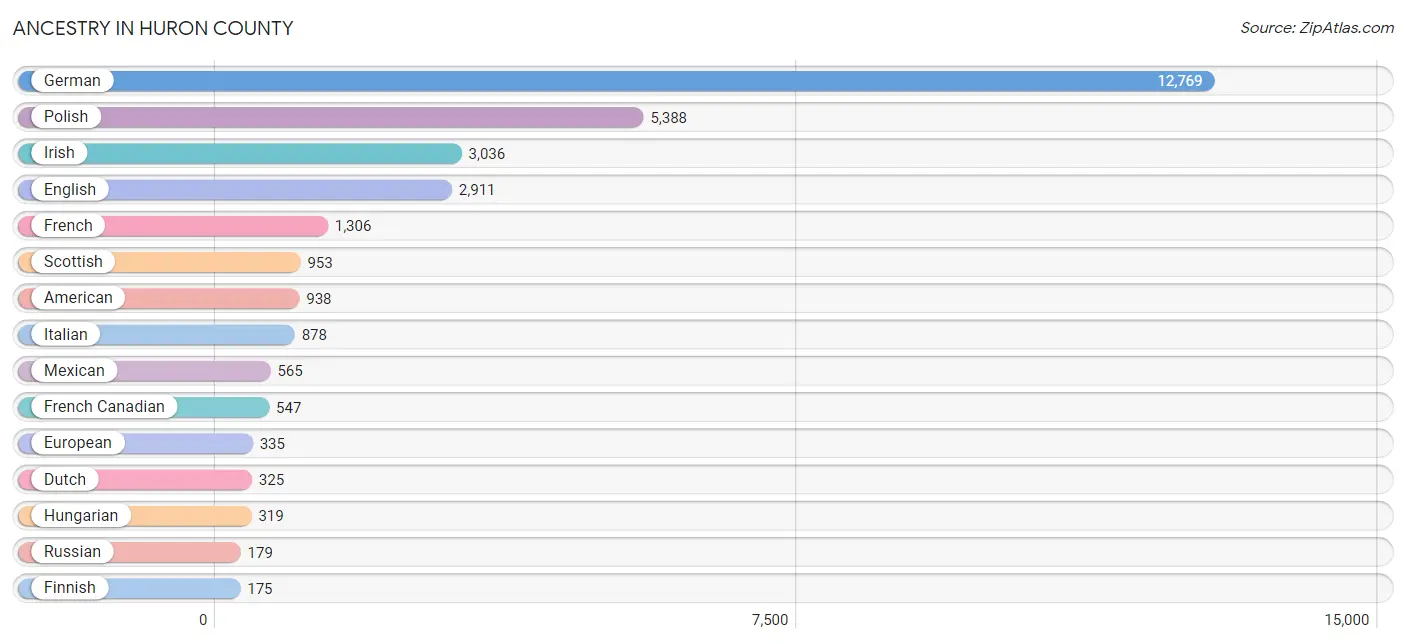
Ancestry in Huron County
The most populous ancestries reported in Huron County are German (12,769 | 40.6%), Polish (5,388 | 17.1%), Irish (3,036 | 9.7%), English (2,911 | 9.2%), and French (1,306 | 4.2%), together accounting for 80.8% of all Huron County residents.
| Ancestry | # Population | % Population |
| African | 9 | 0.0% |
| American | 938 | 3.0% |
| Apache | 11 | 0.0% |
| Arab | 32 | 0.1% |
| Armenian | 1 | 0.0% |
| Austrian | 80 | 0.3% |
| Belgian | 115 | 0.4% |
| Bhutanese | 1 | 0.0% |
| Blackfeet | 14 | 0.0% |
| Bolivian | 4 | 0.0% |
| Brazilian | 3 | 0.0% |
| British | 96 | 0.3% |
| Burmese | 59 | 0.2% |
| Canadian | 74 | 0.2% |
| Central American | 35 | 0.1% |
| Cherokee | 73 | 0.2% |
| Chippewa | 45 | 0.1% |
| Croatian | 14 | 0.0% |
| Cuban | 52 | 0.2% |
| Czech | 126 | 0.4% |
| Czechoslovakian | 17 | 0.1% |
| Danish | 44 | 0.1% |
| Dutch | 325 | 1.0% |
| Eastern European | 47 | 0.2% |
| English | 2,911 | 9.2% |
| Ethiopian | 1 | 0.0% |
| European | 335 | 1.1% |
| Filipino | 4 | 0.0% |
| Finnish | 175 | 0.6% |
| French | 1,306 | 4.2% |
| French American Indian | 7 | 0.0% |
| French Canadian | 547 | 1.7% |
| German | 12,769 | 40.6% |
| Greek | 44 | 0.1% |
| Guatemalan | 15 | 0.1% |
| Honduran | 7 | 0.0% |
| Hungarian | 319 | 1.0% |
| Indian (Asian) | 33 | 0.1% |
| Irish | 3,036 | 9.7% |
| Iroquois | 8 | 0.0% |
| Italian | 878 | 2.8% |
| Jamaican | 30 | 0.1% |
| Korean | 54 | 0.2% |
| Lebanese | 28 | 0.1% |
| Lithuanian | 42 | 0.1% |
| Lumbee | 30 | 0.1% |
| Macedonian | 9 | 0.0% |
| Mexican | 565 | 1.8% |
| Mexican American Indian | 2 | 0.0% |
| Navajo | 2 | 0.0% |
| Nicaraguan | 7 | 0.0% |
| Northern European | 19 | 0.1% |
| Norwegian | 171 | 0.5% |
| Ottawa | 5 | 0.0% |
| Pakistani | 5 | 0.0% |
| Panamanian | 6 | 0.0% |
| Pennsylvania German | 33 | 0.1% |
| Polish | 5,388 | 17.1% |
| Portuguese | 8 | 0.0% |
| Potawatomi | 3 | 0.0% |
| Puerto Rican | 146 | 0.5% |
| Romanian | 26 | 0.1% |
| Russian | 179 | 0.6% |
| Scandinavian | 12 | 0.0% |
| Scotch-Irish | 145 | 0.5% |
| Scottish | 953 | 3.0% |
| Serbian | 27 | 0.1% |
| Sioux | 10 | 0.0% |
| Slavic | 29 | 0.1% |
| Slovak | 22 | 0.1% |
| Slovene | 4 | 0.0% |
| South American | 4 | 0.0% |
| Spaniard | 18 | 0.1% |
| Spanish | 6 | 0.0% |
| Sri Lankan | 44 | 0.1% |
| Subsaharan African | 17 | 0.1% |
| Swedish | 165 | 0.5% |
| Swiss | 122 | 0.4% |
| Thai | 1 | 0.0% |
| Turkish | 2 | 0.0% |
| Ukrainian | 88 | 0.3% |
| Welsh | 150 | 0.5% |
| West Indian | 11 | 0.0% |
| Yugoslavian | 14 | 0.0% | View All 84 Rows |
Immigrants in Huron County
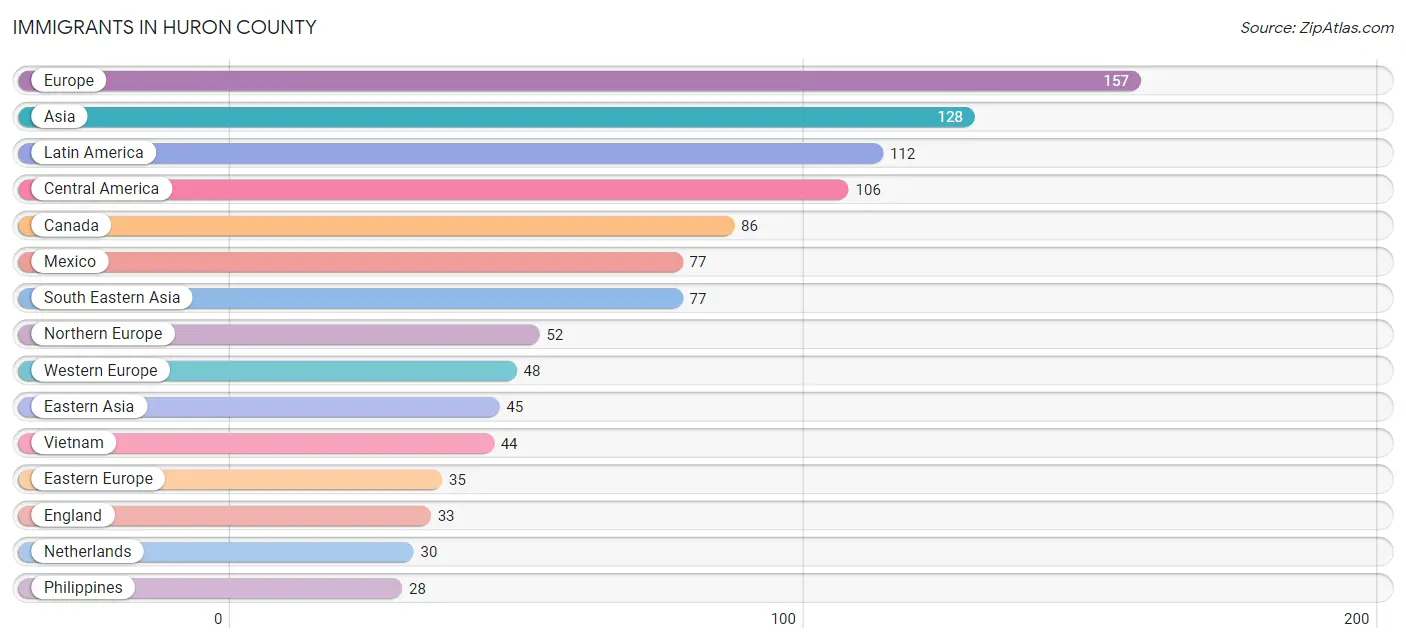
The most numerous immigrant groups reported in Huron County came from Europe (157 | 0.5%), Asia (128 | 0.4%), Latin America (112 | 0.4%), Central America (106 | 0.3%), and Canada (86 | 0.3%), together accounting for 1.9% of all Huron County residents.
| Immigration Origin | # Population | % Population |
| Africa | 1 | 0.0% |
| Asia | 128 | 0.4% |
| Brazil | 3 | 0.0% |
| Canada | 86 | 0.3% |
| Central America | 106 | 0.3% |
| China | 22 | 0.1% |
| Eastern Africa | 1 | 0.0% |
| Eastern Asia | 45 | 0.1% |
| Eastern Europe | 35 | 0.1% |
| England | 33 | 0.1% |
| Ethiopia | 1 | 0.0% |
| Europe | 157 | 0.5% |
| Germany | 18 | 0.1% |
| Guatemala | 15 | 0.1% |
| Honduras | 7 | 0.0% |
| India | 1 | 0.0% |
| Iraq | 1 | 0.0% |
| Ireland | 1 | 0.0% |
| Italy | 14 | 0.0% |
| Japan | 1 | 0.0% |
| Jordan | 2 | 0.0% |
| Korea | 22 | 0.1% |
| Latin America | 112 | 0.4% |
| Mexico | 77 | 0.2% |
| Netherlands | 30 | 0.1% |
| Nicaragua | 7 | 0.0% |
| North Macedonia | 7 | 0.0% |
| Northern Europe | 52 | 0.2% |
| Philippines | 28 | 0.1% |
| Poland | 5 | 0.0% |
| Romania | 13 | 0.0% |
| Russia | 2 | 0.0% |
| South America | 6 | 0.0% |
| South Central Asia | 1 | 0.0% |
| South Eastern Asia | 77 | 0.2% |
| Southern Europe | 22 | 0.1% |
| Spain | 8 | 0.0% |
| Taiwan | 4 | 0.0% |
| Thailand | 5 | 0.0% |
| Ukraine | 6 | 0.0% |
| Venezuela | 3 | 0.0% |
| Vietnam | 44 | 0.1% |
| Western Asia | 3 | 0.0% |
| Western Europe | 48 | 0.2% | View All 44 Rows |
Sex and Age in Huron County
Sex and Age in Huron County
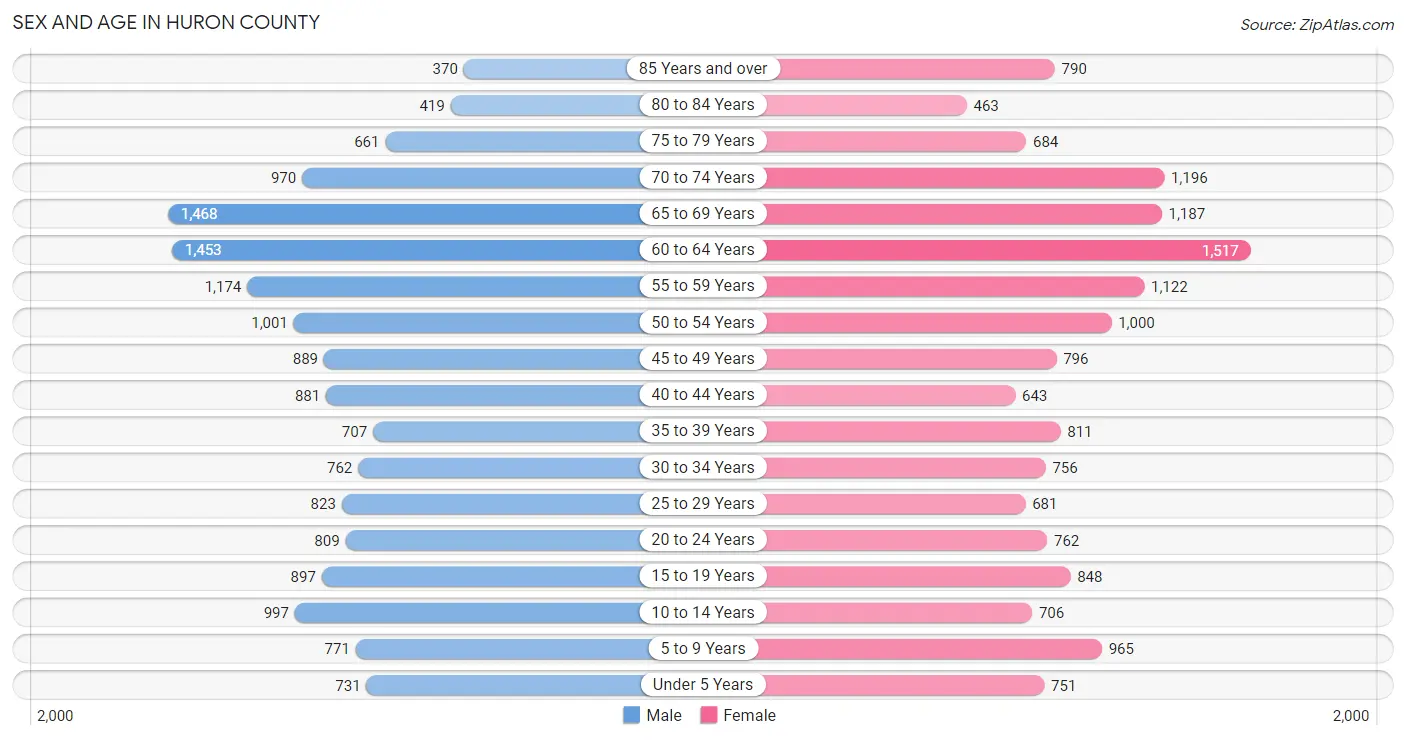
The most populous age groups in Huron County are 65 to 69 Years (1,468 | 9.3%) for men and 60 to 64 Years (1,517 | 9.7%) for women.
| Age Bracket | Male | Female |
| Under 5 Years | 731 (4.6%) | 751 (4.8%) |
| 5 to 9 Years | 771 (4.9%) | 965 (6.2%) |
| 10 to 14 Years | 997 (6.3%) | 706 (4.5%) |
| 15 to 19 Years | 897 (5.7%) | 848 (5.4%) |
| 20 to 24 Years | 809 (5.1%) | 762 (4.9%) |
| 25 to 29 Years | 823 (5.2%) | 681 (4.3%) |
| 30 to 34 Years | 762 (4.8%) | 756 (4.8%) |
| 35 to 39 Years | 707 (4.5%) | 811 (5.2%) |
| 40 to 44 Years | 881 (5.6%) | 643 (4.1%) |
| 45 to 49 Years | 889 (5.6%) | 796 (5.1%) |
| 50 to 54 Years | 1,001 (6.3%) | 1,000 (6.4%) |
| 55 to 59 Years | 1,174 (7.4%) | 1,122 (7.2%) |
| 60 to 64 Years | 1,453 (9.2%) | 1,517 (9.7%) |
| 65 to 69 Years | 1,468 (9.3%) | 1,187 (7.6%) |
| 70 to 74 Years | 970 (6.1%) | 1,196 (7.6%) |
| 75 to 79 Years | 661 (4.2%) | 684 (4.4%) |
| 80 to 84 Years | 419 (2.6%) | 463 (2.9%) |
| 85 Years and over | 370 (2.3%) | 790 (5.0%) |
| Total | 15,783 (100.0%) | 15,678 (100.0%) |
Families and Households in Huron County
Median Family Size in Huron County
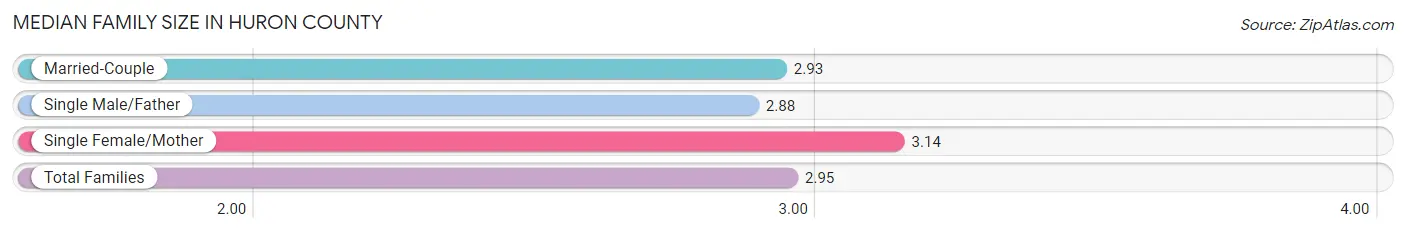
The median family size in Huron County is 2.95 persons per family, with single female/mother families (907 | 11.2%) accounting for the largest median family size of 3.14 persons per family. On the other hand, single male/father families (504 | 6.2%) represent the smallest median family size with 2.88 persons per family.
| Family Type | # Families | Family Size |
| Married-Couple | 6,700 (82.6%) | 2.93 |
| Single Male/Father | 504 (6.2%) | 2.88 |
| Single Female/Mother | 907 (11.2%) | 3.14 |
| Total Families | 8,111 (100.0%) | 2.95 |
Median Household Size in Huron County
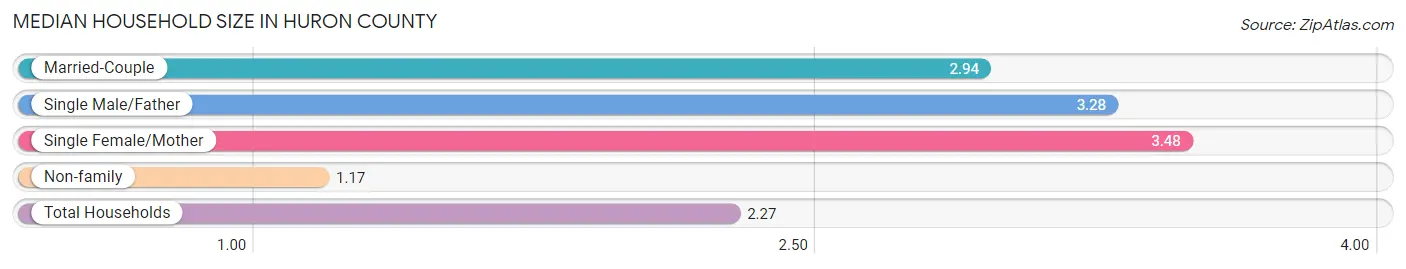
The median household size in Huron County is 2.27 persons per household, with single female/mother households (907 | 6.7%) accounting for the largest median household size of 3.48 persons per household. non-family households (5,506 | 40.4%) represent the smallest median household size with 1.17 persons per household.
| Household Type | # Households | Household Size |
| Married-Couple | 6,700 (49.2%) | 2.94 |
| Single Male/Father | 504 (3.7%) | 3.28 |
| Single Female/Mother | 907 (6.7%) | 3.48 |
| Non-family | 5,506 (40.4%) | 1.17 |
| Total Households | 13,617 (100.0%) | 2.27 |
Household Size by Marriage Status in Huron County
Out of a total of 13,617 households in Huron County, 8,111 (59.6%) are family households, while 5,506 (40.4%) are nonfamily households. The most numerous type of family households are 2-person households, comprising 4,680, and the most common type of nonfamily households are 1-person households, comprising 4,756.
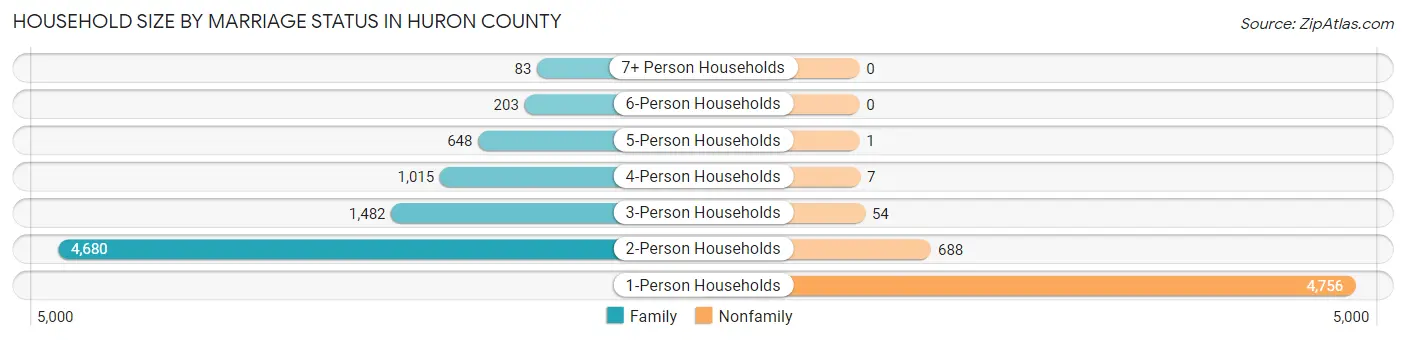
| Household Size | Family Households | Nonfamily Households |
| 1-Person Households | - | 4,756 (34.9%) |
| 2-Person Households | 4,680 (34.4%) | 688 (5.1%) |
| 3-Person Households | 1,482 (10.9%) | 54 (0.4%) |
| 4-Person Households | 1,015 (7.4%) | 7 (0.1%) |
| 5-Person Households | 648 (4.8%) | 1 (0.0%) |
| 6-Person Households | 203 (1.5%) | 0 (0.0%) |
| 7+ Person Households | 83 (0.6%) | 0 (0.0%) |
| Total | 8,111 (59.6%) | 5,506 (40.4%) |
Female Fertility in Huron County
Fertility by Age in Huron County
Average fertility rate in Huron County is 41.0 births per 1,000 women. Women in the age bracket of 20 to 34 years have the highest fertility rate with 84.0 births per 1,000 women. Women in the age bracket of 20 to 34 years acount for 80.8% of all women with births.
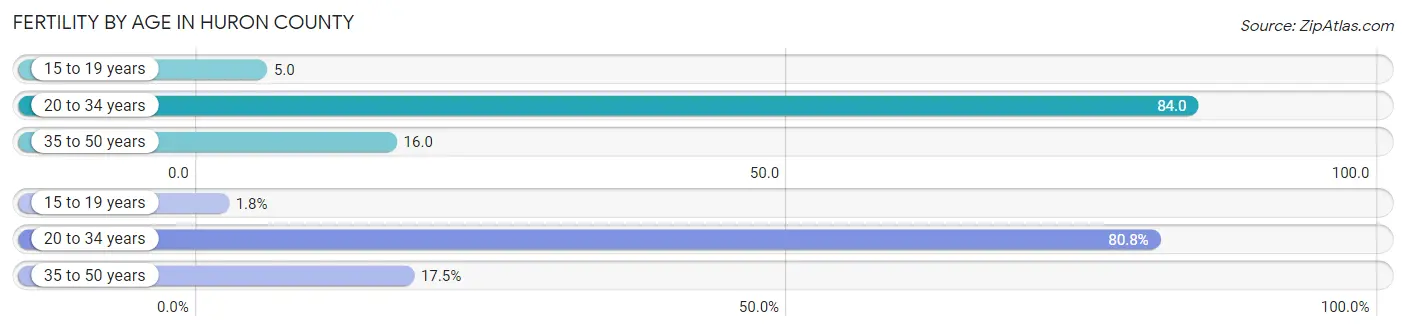
| Age Bracket | Women with Births | Births / 1,000 Women |
| 15 to 19 years | 4 (1.8%) | 5.0 |
| 20 to 34 years | 185 (80.8%) | 84.0 |
| 35 to 50 years | 40 (17.5%) | 16.0 |
| Total | 229 (100.0%) | 41.0 |
Fertility by Age by Marriage Status in Huron County
85.2% of women with births (229) in Huron County are married. The highest percentage of unmarried women with births falls into 15 to 19 years age bracket with 50.0% of them unmarried at the time of birth, while the lowest percentage of unmarried women with births belong to 35 to 50 years age bracket with 12.5% of them unmarried.
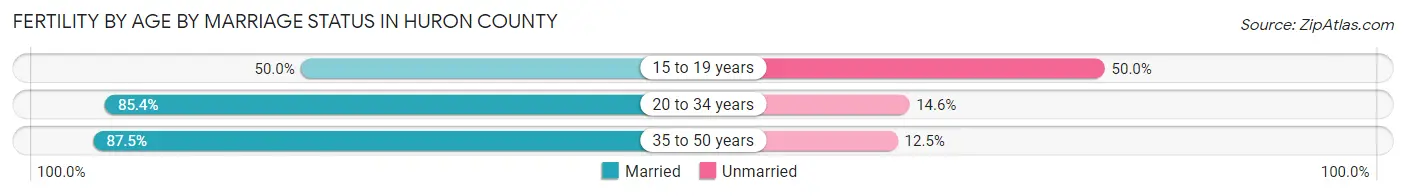
| Age Bracket | Married | Unmarried |
| 15 to 19 years | 2 (50.0%) | 2 (50.0%) |
| 20 to 34 years | 158 (85.4%) | 27 (14.6%) |
| 35 to 50 years | 35 (87.5%) | 5 (12.5%) |
| Total | 195 (85.2%) | 34 (14.8%) |
Fertility by Education in Huron County
Average fertility rate in Huron County is 41.0 births per 1,000 women. Women with the education attainment of bachelor's degree have the highest fertility rate of 129.0 births per 1,000 women, while women with the education attainment of less than high school have the lowest fertility at 21.0 births per 1,000 women. Women with the education attainment of bachelor's degree represent 42.4% of all women with births.
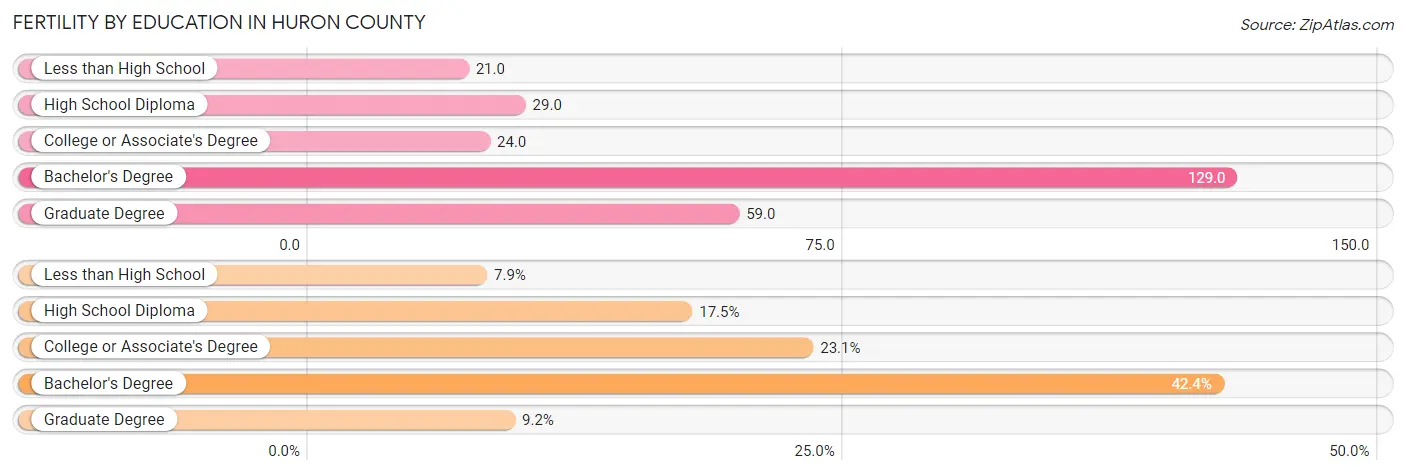
| Educational Attainment | Women with Births | Births / 1,000 Women |
| Less than High School | 18 (7.9%) | 21.0 |
| High School Diploma | 40 (17.5%) | 29.0 |
| College or Associate's Degree | 53 (23.1%) | 24.0 |
| Bachelor's Degree | 97 (42.4%) | 129.0 |
| Graduate Degree | 21 (9.2%) | 59.0 |
| Total | 229 (100.0%) | 41.0 |
Fertility by Education by Marriage Status in Huron County
14.8% of women with births in Huron County are unmarried. Women with the educational attainment of less than high school are most likely to be married with 100.0% of them married at childbirth, while women with the educational attainment of high school diploma are least likely to be married with 32.5% of them unmarried at childbirth.
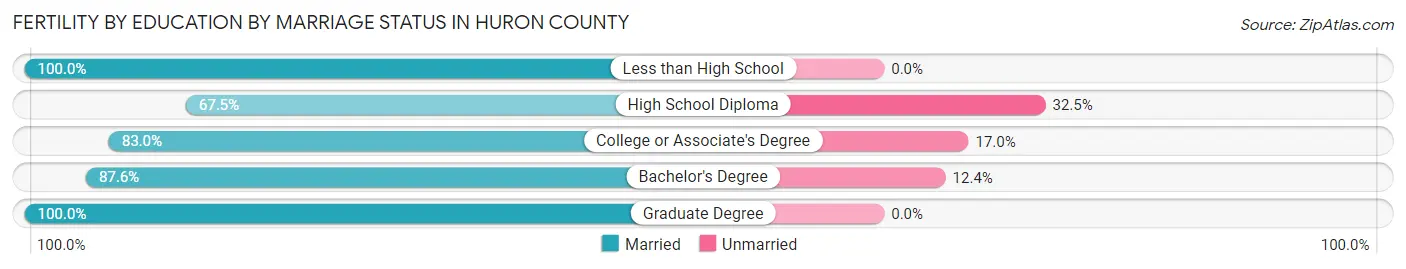
| Educational Attainment | Married | Unmarried |
| Less than High School | 18 (100.0%) | 0 (0.0%) |
| High School Diploma | 27 (67.5%) | 13 (32.5%) |
| College or Associate's Degree | 44 (83.0%) | 9 (17.0%) |
| Bachelor's Degree | 85 (87.6%) | 12 (12.4%) |
| Graduate Degree | 21 (100.0%) | 0 (0.0%) |
| Total | 195 (85.2%) | 34 (14.8%) |
Employment Characteristics in Huron County
Employment by Class of Employer in Huron County
Among the 13,374 employed individuals in Huron County, private company employees (9,387 | 70.2%), self-employed (not incorporated) (1,219 | 9.1%), and local government employees (910 | 6.8%) make up the most common classes of employment.
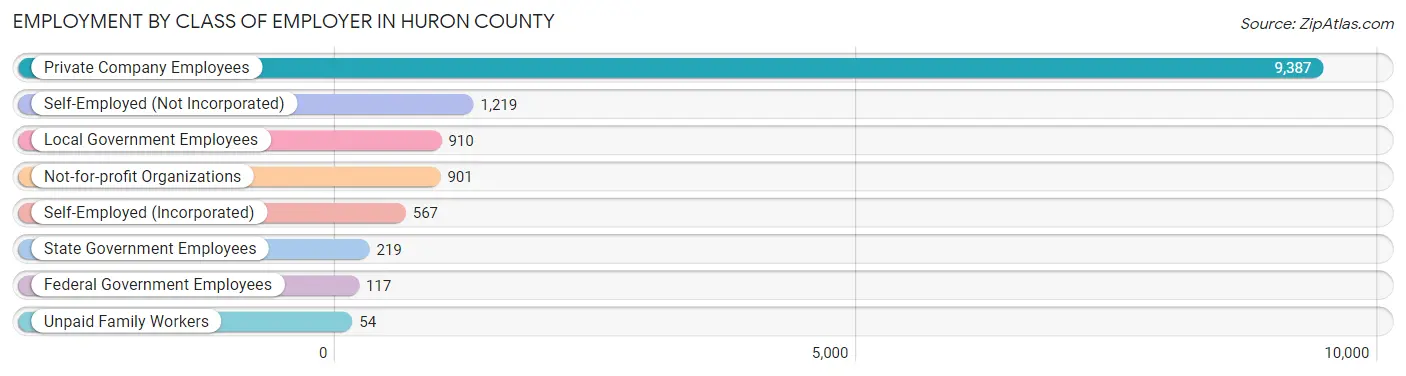
| Employer Class | # Employees | % Employees |
| Private Company Employees | 9,387 | 70.2% |
| Self-Employed (Incorporated) | 567 | 4.2% |
| Self-Employed (Not Incorporated) | 1,219 | 9.1% |
| Not-for-profit Organizations | 901 | 6.7% |
| Local Government Employees | 910 | 6.8% |
| State Government Employees | 219 | 1.6% |
| Federal Government Employees | 117 | 0.9% |
| Unpaid Family Workers | 54 | 0.4% |
| Total | 13,374 | 100.0% |
Employment Status by Age in Huron County
According to the labor force statistics for Huron County, out of the total population over 16 years of age (26,132), 55.1% or 14,399 individuals are in the labor force, with 5.3% or 763 of them unemployed. The age group with the highest labor force participation rate is 30 to 34 years, with 89.2% or 1,354 individuals in the labor force. Within the labor force, the 16 to 19 years age range has the highest percentage of unemployed individuals, with 13.4% or 96 of them being unemployed.
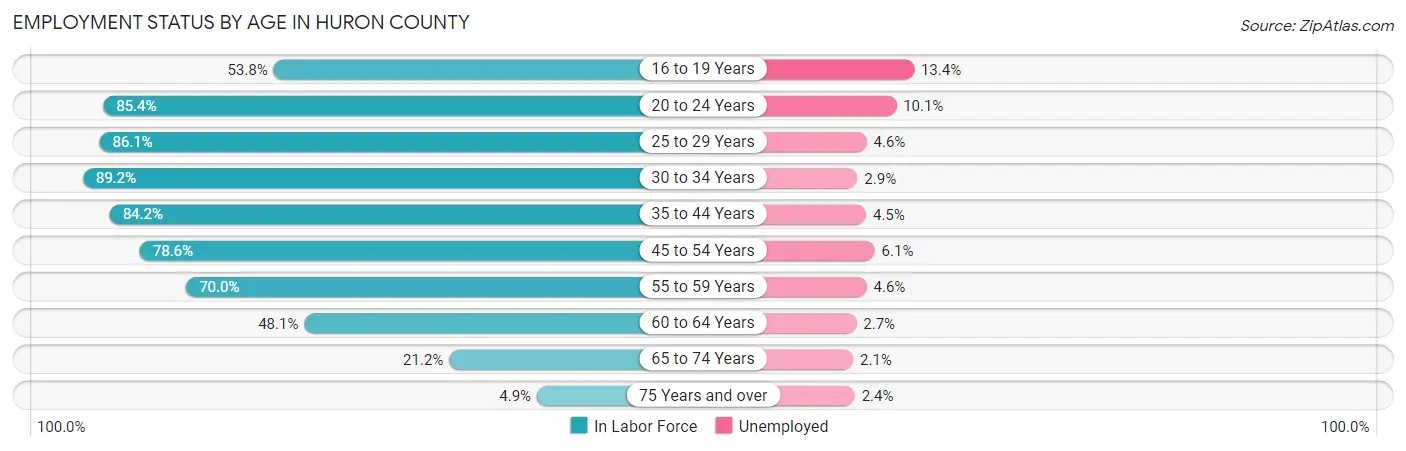
| Age Bracket | In Labor Force | Unemployed |
| 16 to 19 Years | 719 (53.8%) | 96 (13.4%) |
| 20 to 24 Years | 1,342 (85.4%) | 136 (10.1%) |
| 25 to 29 Years | 1,295 (86.1%) | 60 (4.6%) |
| 30 to 34 Years | 1,354 (89.2%) | 39 (2.9%) |
| 35 to 44 Years | 2,561 (84.2%) | 115 (4.5%) |
| 45 to 54 Years | 2,897 (78.6%) | 177 (6.1%) |
| 55 to 59 Years | 1,607 (70.0%) | 74 (4.6%) |
| 60 to 64 Years | 1,429 (48.1%) | 39 (2.7%) |
| 65 to 74 Years | 1,022 (21.2%) | 21 (2.1%) |
| 75 Years and over | 166 (4.9%) | 4 (2.4%) |
| Total | 14,399 (55.1%) | 763 (5.3%) |
Employment Status by Educational Attainment in Huron County
According to labor force statistics for Huron County, 74.2% of individuals (11,142) out of the total population between 25 and 64 years of age (15,016) are in the labor force, with 4.5% or 501 of them being unemployed. The group with the highest labor force participation rate are those with the educational attainment of bachelor's degree or higher, with 79.6% or 2,053 individuals in the labor force. Within the labor force, individuals with high school diploma education have the highest percentage of unemployment, with 6.2% or 268 of them being unemployed.
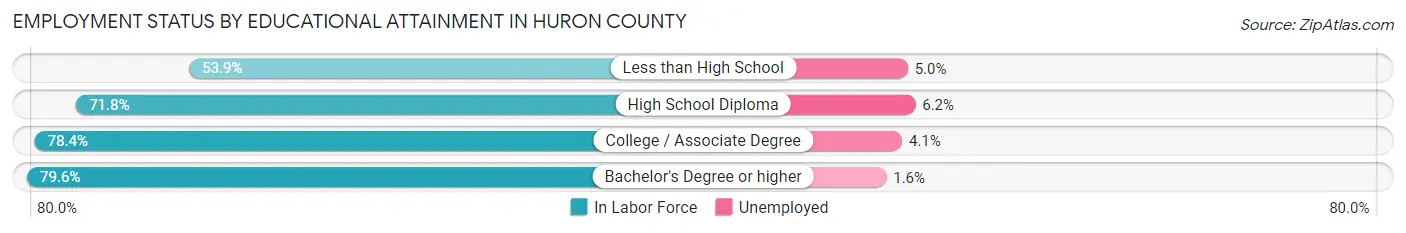
| Educational Attainment | In Labor Force | Unemployed |
| Less than High School | 575 (53.9%) | 53 (5.0%) |
| High School Diploma | 4,319 (71.8%) | 373 (6.2%) |
| College / Associate Degree | 4,198 (78.4%) | 220 (4.1%) |
| Bachelor's Degree or higher | 2,053 (79.6%) | 41 (1.6%) |
| Total | 11,142 (74.2%) | 676 (4.5%) |
Employment Occupations by Sex in Huron County
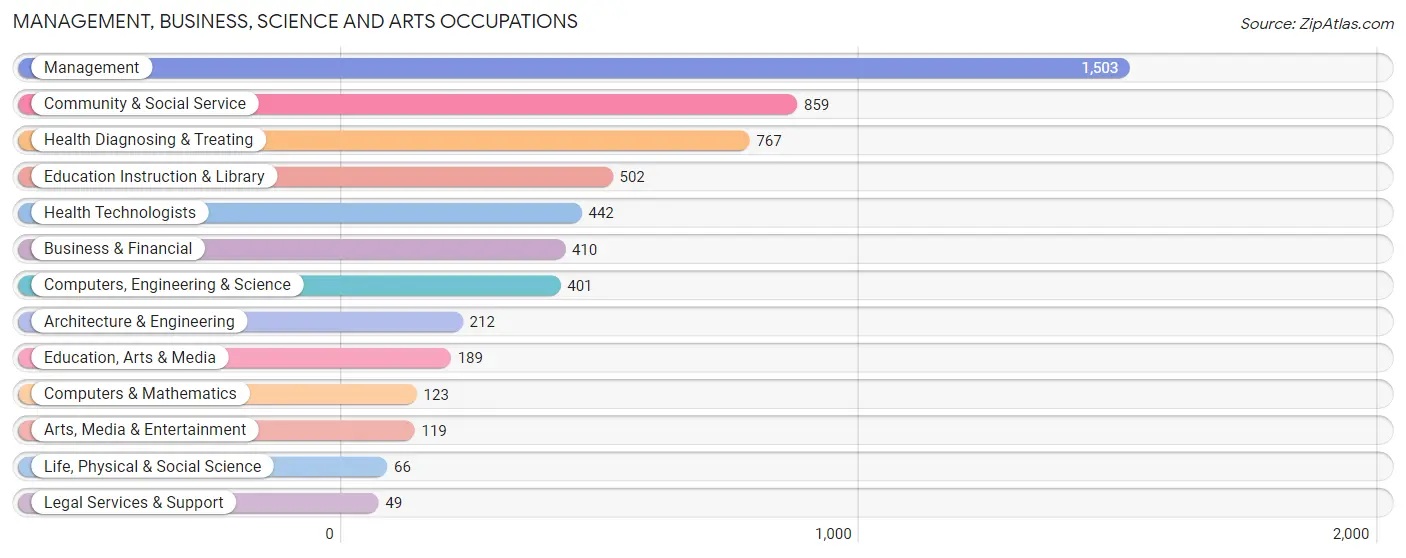
Management, Business, Science and Arts Occupations
The most common Management, Business, Science and Arts occupations in Huron County are Management (1,503 | 11.0%), Community & Social Service (859 | 6.3%), Health Diagnosing & Treating (767 | 5.6%), Education Instruction & Library (502 | 3.7%), and Health Technologists (442 | 3.2%).
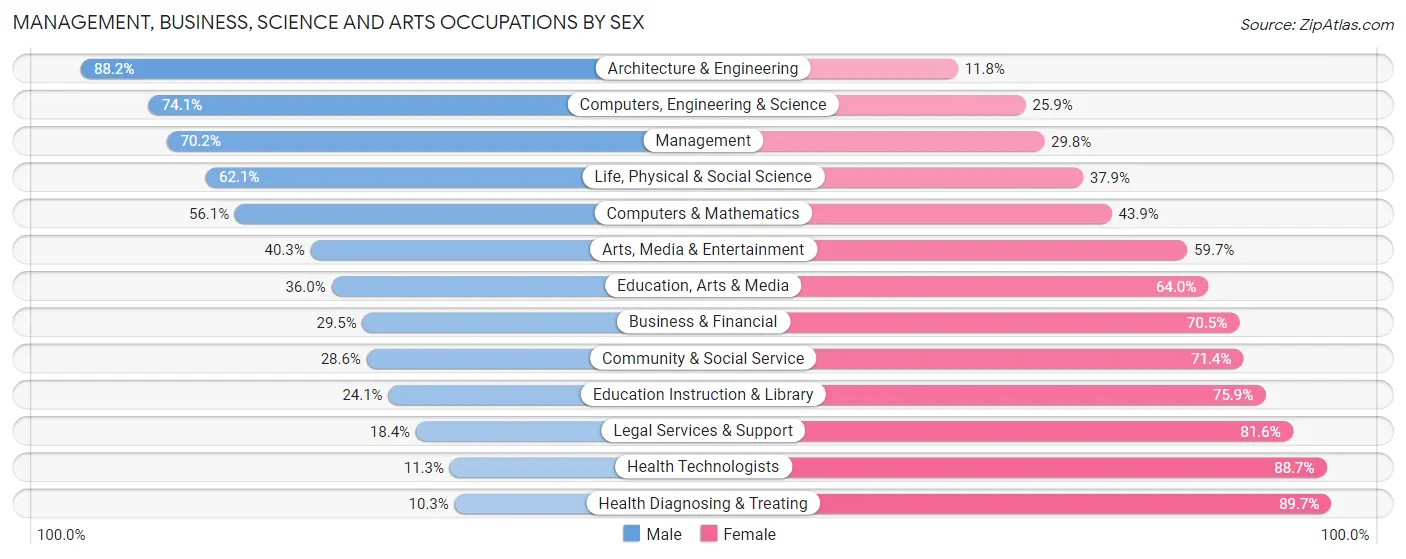
Management, Business, Science and Arts Occupations by Sex
Within the Management, Business, Science and Arts occupations in Huron County, the most male-oriented occupations are Architecture & Engineering (88.2%), Computers, Engineering & Science (74.1%), and Management (70.2%), while the most female-oriented occupations are Health Diagnosing & Treating (89.7%), Health Technologists (88.7%), and Legal Services & Support (81.6%).
| Occupation | Male | Female |
| Management | 1,055 (70.2%) | 448 (29.8%) |
| Business & Financial | 121 (29.5%) | 289 (70.5%) |
| Computers, Engineering & Science | 297 (74.1%) | 104 (25.9%) |
| Computers & Mathematics | 69 (56.1%) | 54 (43.9%) |
| Architecture & Engineering | 187 (88.2%) | 25 (11.8%) |
| Life, Physical & Social Science | 41 (62.1%) | 25 (37.9%) |
| Community & Social Service | 246 (28.6%) | 613 (71.4%) |
| Education, Arts & Media | 68 (36.0%) | 121 (64.0%) |
| Legal Services & Support | 9 (18.4%) | 40 (81.6%) |
| Education Instruction & Library | 121 (24.1%) | 381 (75.9%) |
| Arts, Media & Entertainment | 48 (40.3%) | 71 (59.7%) |
| Health Diagnosing & Treating | 79 (10.3%) | 688 (89.7%) |
| Health Technologists | 50 (11.3%) | 392 (88.7%) |
| Total (Category) | 1,798 (45.6%) | 2,142 (54.4%) |
| Total (Overall) | 7,492 (55.0%) | 6,133 (45.0%) |
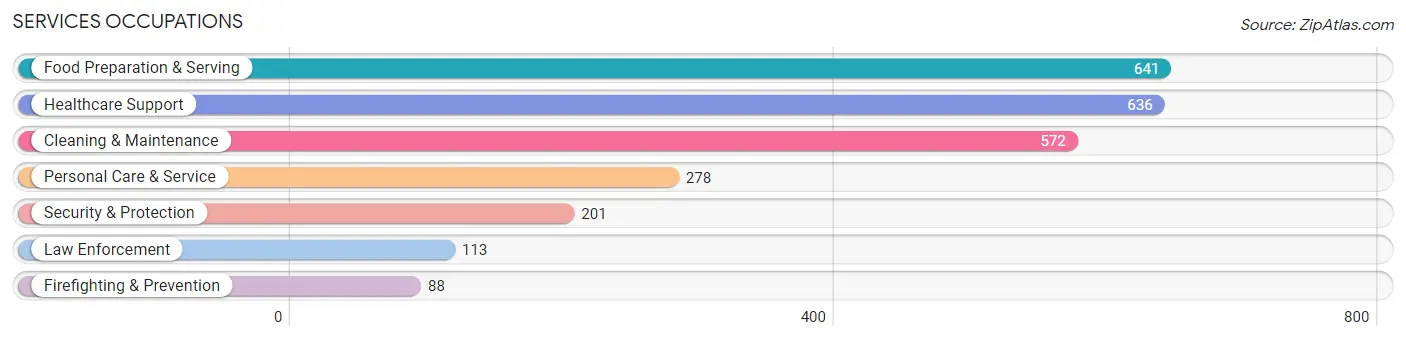
Services Occupations
The most common Services occupations in Huron County are Food Preparation & Serving (641 | 4.7%), Healthcare Support (636 | 4.7%), Cleaning & Maintenance (572 | 4.2%), Personal Care & Service (278 | 2.0%), and Security & Protection (201 | 1.5%).
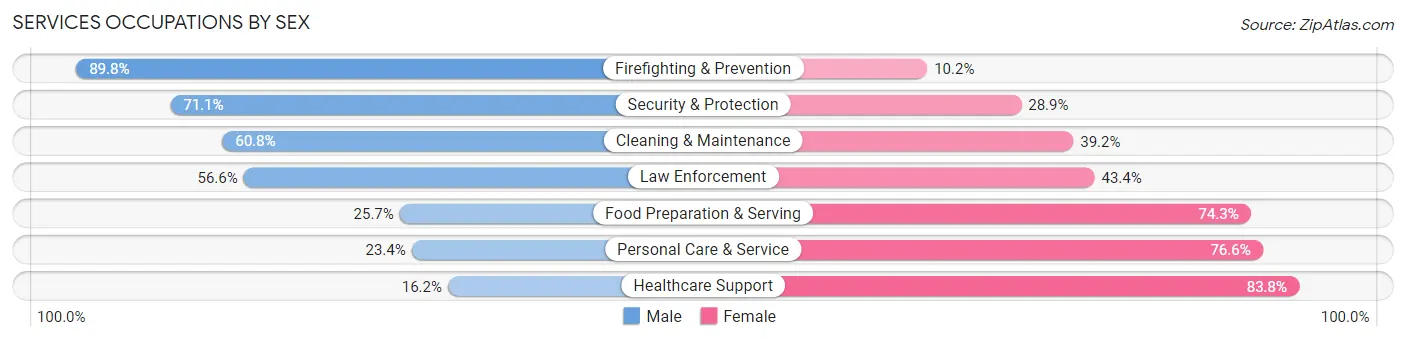
Services Occupations by Sex
Within the Services occupations in Huron County, the most male-oriented occupations are Firefighting & Prevention (89.8%), Security & Protection (71.1%), and Cleaning & Maintenance (60.8%), while the most female-oriented occupations are Healthcare Support (83.8%), Personal Care & Service (76.6%), and Food Preparation & Serving (74.3%).
| Occupation | Male | Female |
| Healthcare Support | 103 (16.2%) | 533 (83.8%) |
| Security & Protection | 143 (71.1%) | 58 (28.9%) |
| Firefighting & Prevention | 79 (89.8%) | 9 (10.2%) |
| Law Enforcement | 64 (56.6%) | 49 (43.4%) |
| Food Preparation & Serving | 165 (25.7%) | 476 (74.3%) |
| Cleaning & Maintenance | 348 (60.8%) | 224 (39.2%) |
| Personal Care & Service | 65 (23.4%) | 213 (76.6%) |
| Total (Category) | 824 (35.4%) | 1,504 (64.6%) |
| Total (Overall) | 7,492 (55.0%) | 6,133 (45.0%) |
Sales and Office Occupations
The most common Sales and Office occupations in Huron County are Office & Administration (1,561 | 11.5%), and Sales & Related (1,179 | 8.6%).

Sales and Office Occupations by Sex
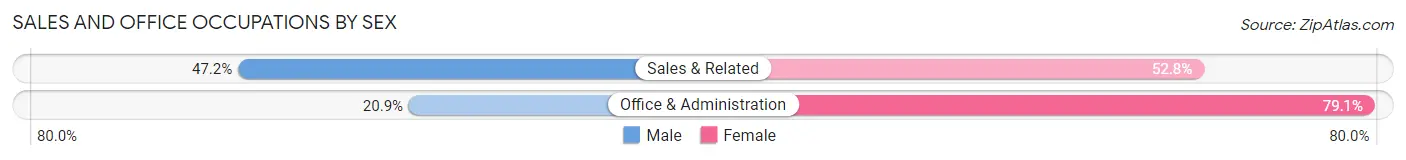
| Occupation | Male | Female |
| Sales & Related | 556 (47.2%) | 623 (52.8%) |
| Office & Administration | 326 (20.9%) | 1,235 (79.1%) |
| Total (Category) | 882 (32.2%) | 1,858 (67.8%) |
| Total (Overall) | 7,492 (55.0%) | 6,133 (45.0%) |
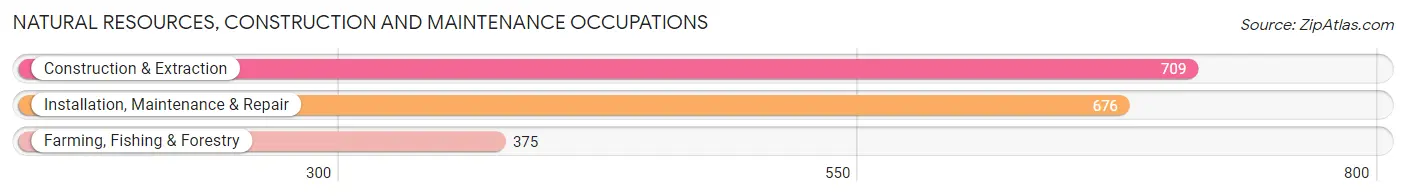
Natural Resources, Construction and Maintenance Occupations
The most common Natural Resources, Construction and Maintenance occupations in Huron County are Construction & Extraction (709 | 5.2%), Installation, Maintenance & Repair (676 | 5.0%), and Farming, Fishing & Forestry (375 | 2.8%).
Natural Resources, Construction and Maintenance Occupations by Sex
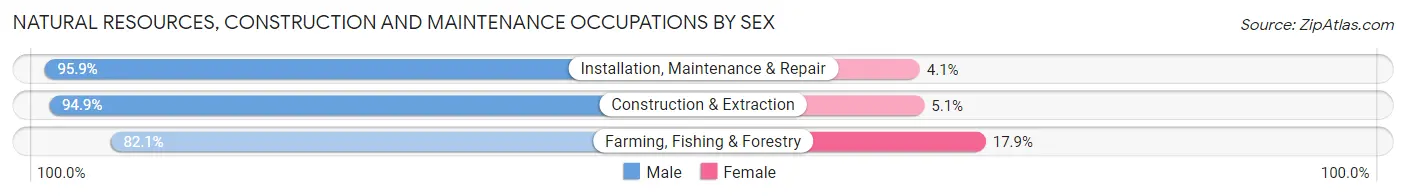
| Occupation | Male | Female |
| Farming, Fishing & Forestry | 308 (82.1%) | 67 (17.9%) |
| Construction & Extraction | 673 (94.9%) | 36 (5.1%) |
| Installation, Maintenance & Repair | 648 (95.9%) | 28 (4.1%) |
| Total (Category) | 1,629 (92.6%) | 131 (7.4%) |
| Total (Overall) | 7,492 (55.0%) | 6,133 (45.0%) |
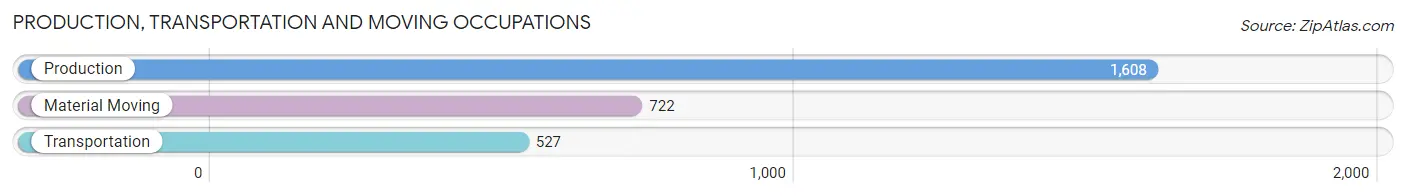
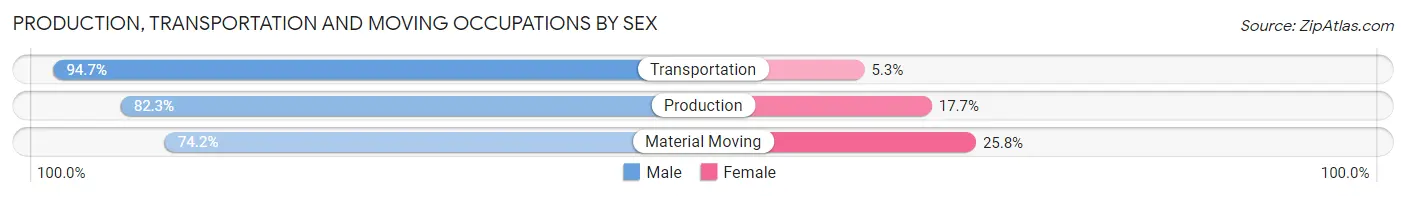
Production, Transportation and Moving Occupations
The most common Production, Transportation and Moving occupations in Huron County are Production (1,608 | 11.8%), Material Moving (722 | 5.3%), and Transportation (527 | 3.9%).
Production, Transportation and Moving Occupations by Sex
| Occupation | Male | Female |
| Production | 1,324 (82.3%) | 284 (17.7%) |
| Transportation | 499 (94.7%) | 28 (5.3%) |
| Material Moving | 536 (74.2%) | 186 (25.8%) |
| Total (Category) | 2,359 (82.6%) | 498 (17.4%) |
| Total (Overall) | 7,492 (55.0%) | 6,133 (45.0%) |
Employment Industries by Sex in Huron County
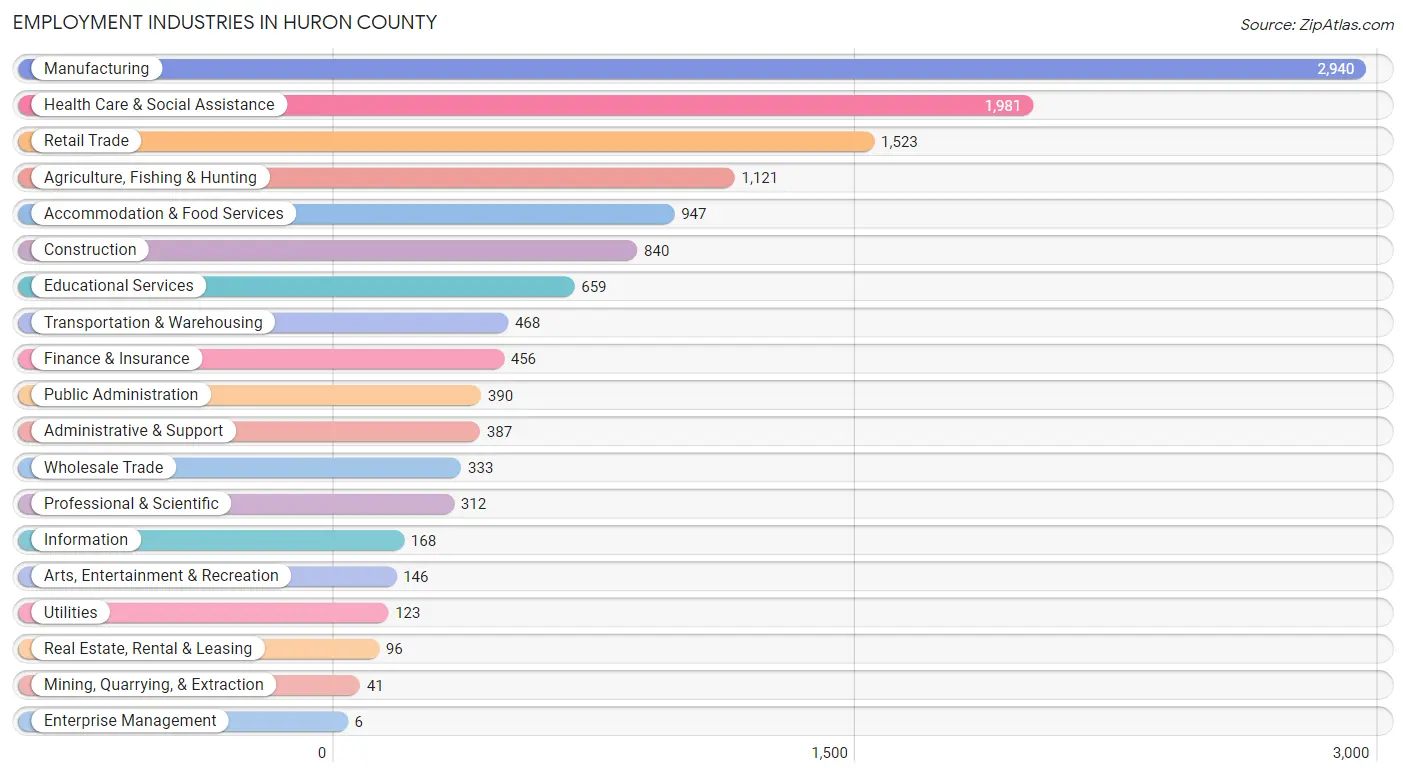
Employment Industries in Huron County
The major employment industries in Huron County include Manufacturing (2,940 | 21.6%), Health Care & Social Assistance (1,981 | 14.5%), Retail Trade (1,523 | 11.2%), Agriculture, Fishing & Hunting (1,121 | 8.2%), and Accommodation & Food Services (947 | 7.0%).
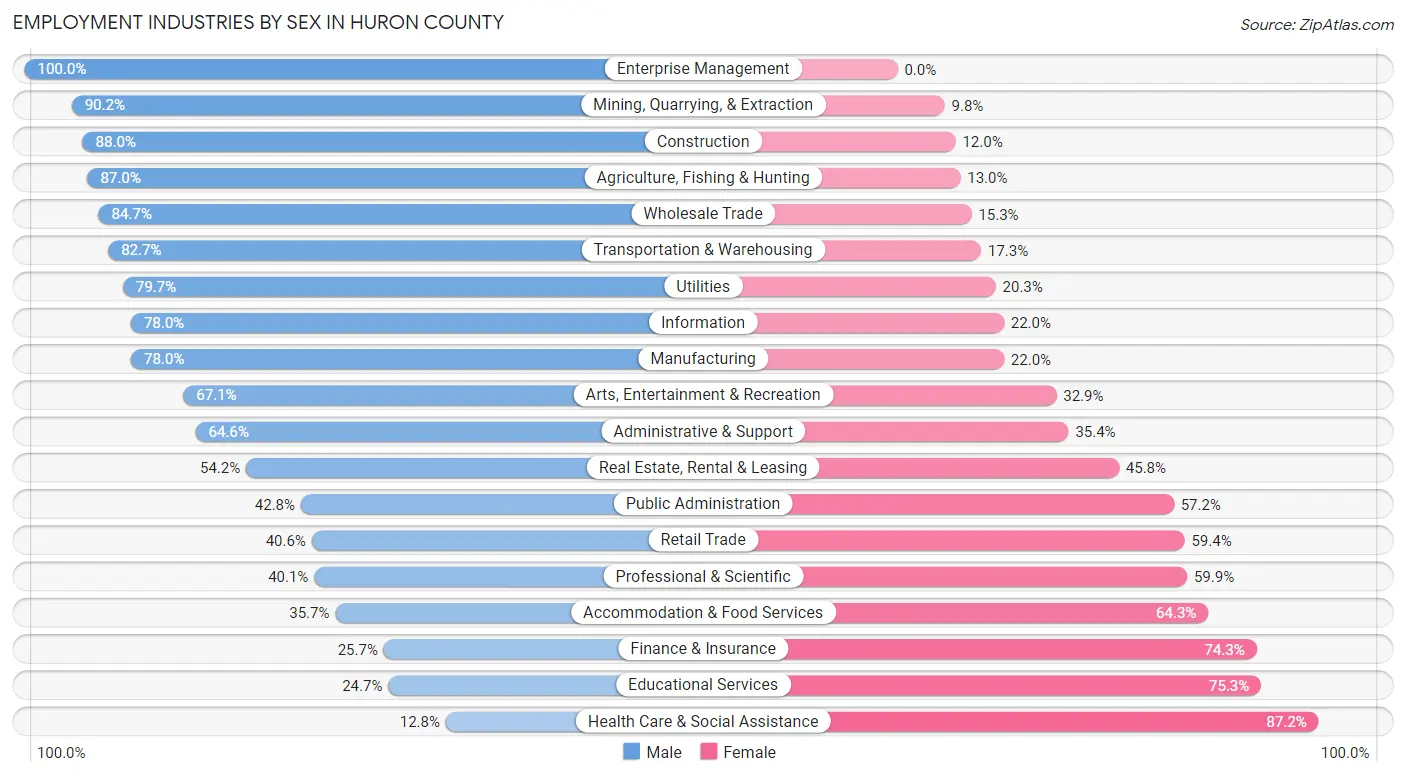
Employment Industries by Sex in Huron County
The Huron County industries that see more men than women are Enterprise Management (100.0%), Mining, Quarrying, & Extraction (90.2%), and Construction (88.0%), whereas the industries that tend to have a higher number of women are Health Care & Social Assistance (87.2%), Educational Services (75.3%), and Finance & Insurance (74.3%).
| Industry | Male | Female |
| Agriculture, Fishing & Hunting | 975 (87.0%) | 146 (13.0%) |
| Mining, Quarrying, & Extraction | 37 (90.2%) | 4 (9.8%) |
| Construction | 739 (88.0%) | 101 (12.0%) |
| Manufacturing | 2,292 (78.0%) | 648 (22.0%) |
| Wholesale Trade | 282 (84.7%) | 51 (15.3%) |
| Retail Trade | 618 (40.6%) | 905 (59.4%) |
| Transportation & Warehousing | 387 (82.7%) | 81 (17.3%) |
| Utilities | 98 (79.7%) | 25 (20.3%) |
| Information | 131 (78.0%) | 37 (22.0%) |
| Finance & Insurance | 117 (25.7%) | 339 (74.3%) |
| Real Estate, Rental & Leasing | 52 (54.2%) | 44 (45.8%) |
| Professional & Scientific | 125 (40.1%) | 187 (59.9%) |
| Enterprise Management | 6 (100.0%) | 0 (0.0%) |
| Administrative & Support | 250 (64.6%) | 137 (35.4%) |
| Educational Services | 163 (24.7%) | 496 (75.3%) |
| Health Care & Social Assistance | 254 (12.8%) | 1,727 (87.2%) |
| Arts, Entertainment & Recreation | 98 (67.1%) | 48 (32.9%) |
| Accommodation & Food Services | 338 (35.7%) | 609 (64.3%) |
| Public Administration | 167 (42.8%) | 223 (57.2%) |
| Total | 7,492 (55.0%) | 6,133 (45.0%) |
Education in Huron County
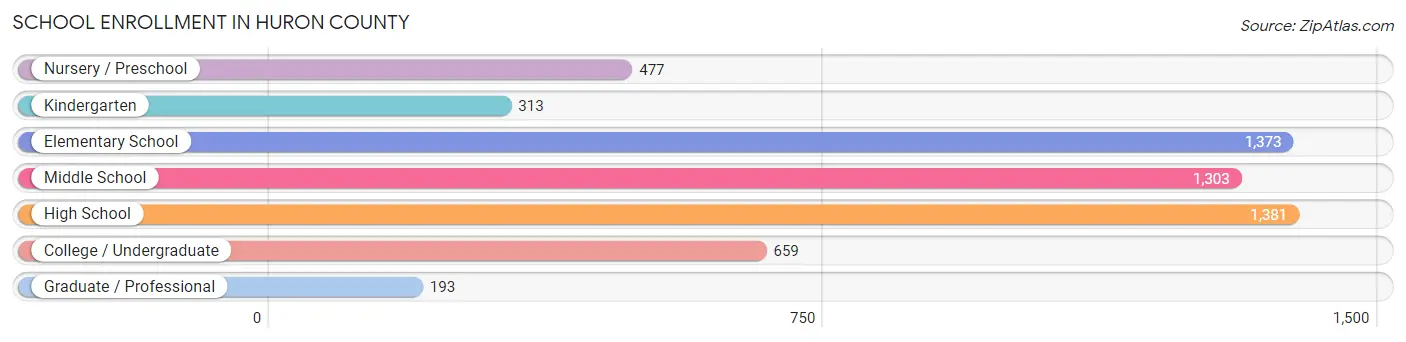
School Enrollment in Huron County
The most common levels of schooling among the 5,699 students in Huron County are high school (1,381 | 24.2%), elementary school (1,373 | 24.1%), and middle school (1,303 | 22.9%).
| School Level | # Students | % Students |
| Nursery / Preschool | 477 | 8.4% |
| Kindergarten | 313 | 5.5% |
| Elementary School | 1,373 | 24.1% |
| Middle School | 1,303 | 22.9% |
| High School | 1,381 | 24.2% |
| College / Undergraduate | 659 | 11.6% |
| Graduate / Professional | 193 | 3.4% |
| Total | 5,699 | 100.0% |
School Enrollment by Age by Funding Source in Huron County
Out of a total of 5,699 students who are enrolled in schools in Huron County, 752 (13.2%) attend a private institution, while the remaining 4,947 (86.8%) are enrolled in public schools. The age group of 35 years and over has the highest likelihood of being enrolled in private schools, with 102 (48.8% in the age bracket) enrolled. Conversely, the age group of 15 to 17 year olds has the lowest likelihood of being enrolled in a private school, with 1,025 (97.8% in the age bracket) attending a public institution.
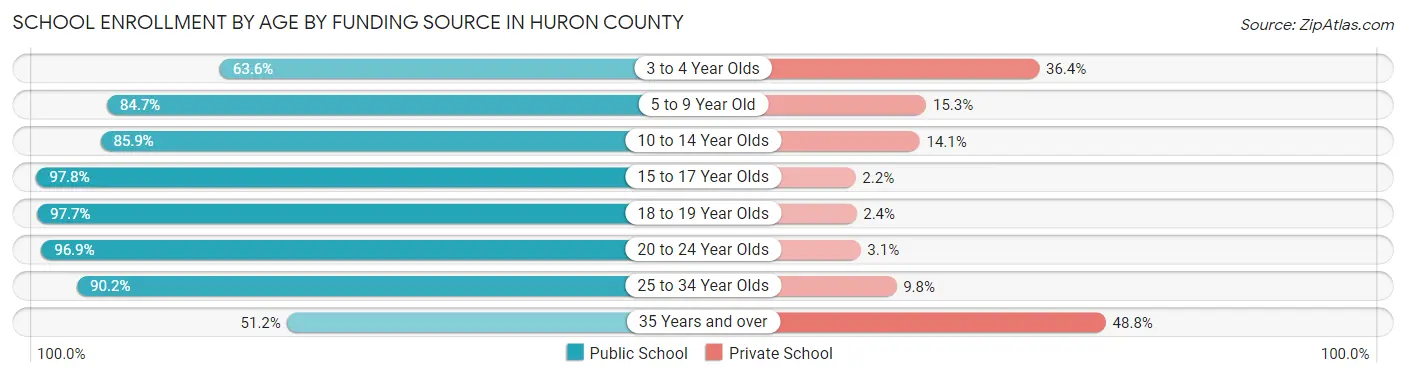
| Age Bracket | Public School | Private School |
| 3 to 4 Year Olds | 201 (63.6%) | 115 (36.4%) |
| 5 to 9 Year Old | 1,374 (84.7%) | 249 (15.3%) |
| 10 to 14 Year Olds | 1,404 (85.9%) | 231 (14.1%) |
| 15 to 17 Year Olds | 1,025 (97.8%) | 23 (2.2%) |
| 18 to 19 Year Olds | 332 (97.7%) | 8 (2.4%) |
| 20 to 24 Year Olds | 373 (96.9%) | 12 (3.1%) |
| 25 to 34 Year Olds | 129 (90.2%) | 14 (9.8%) |
| 35 Years and over | 107 (51.2%) | 102 (48.8%) |
| Total | 4,947 (86.8%) | 752 (13.2%) |
Educational Attainment by Field of Study in Huron County
Education (906 | 21.4%), business (902 | 21.3%), science & technology (525 | 12.4%), arts & humanities (352 | 8.3%), and bio, nature & agricultural (337 | 8.0%) are the most common fields of study among 4,227 individuals in Huron County who have obtained a bachelor's degree or higher.
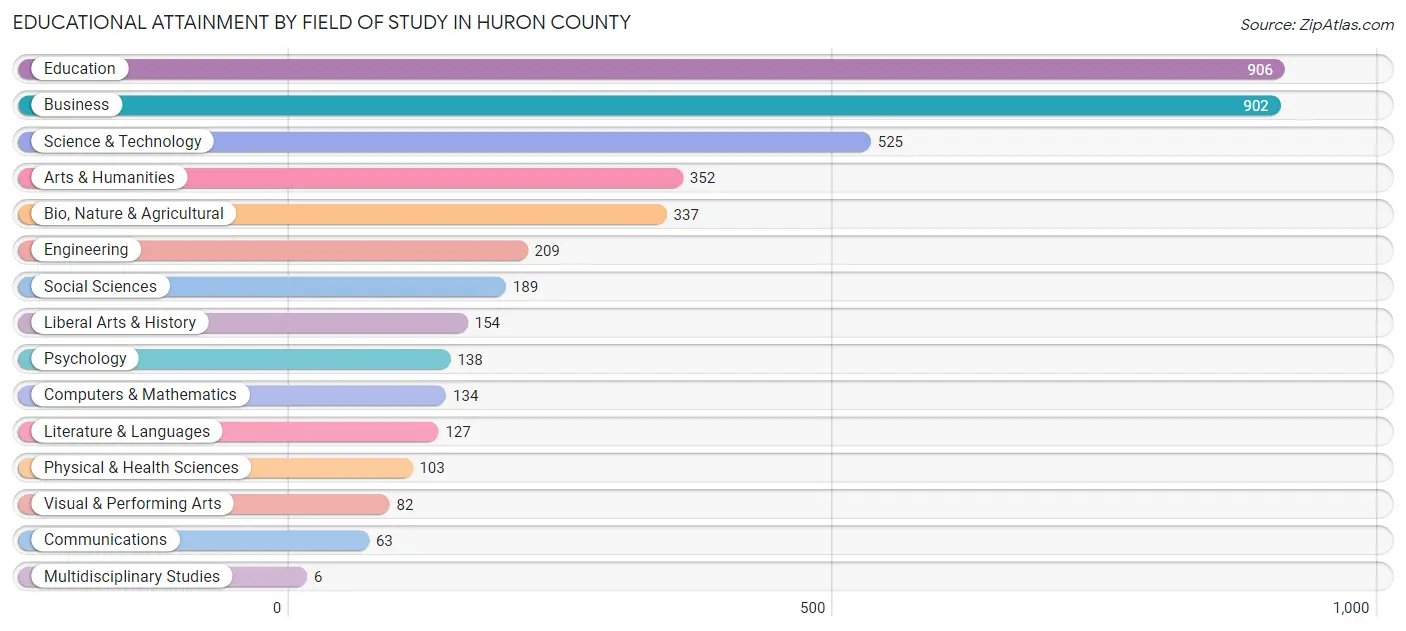
| Field of Study | # Graduates | % Graduates |
| Computers & Mathematics | 134 | 3.2% |
| Bio, Nature & Agricultural | 337 | 8.0% |
| Physical & Health Sciences | 103 | 2.4% |
| Psychology | 138 | 3.3% |
| Social Sciences | 189 | 4.5% |
| Engineering | 209 | 4.9% |
| Multidisciplinary Studies | 6 | 0.1% |
| Science & Technology | 525 | 12.4% |
| Business | 902 | 21.3% |
| Education | 906 | 21.4% |
| Literature & Languages | 127 | 3.0% |
| Liberal Arts & History | 154 | 3.6% |
| Visual & Performing Arts | 82 | 1.9% |
| Communications | 63 | 1.5% |
| Arts & Humanities | 352 | 8.3% |
| Total | 4,227 | 100.0% |
Transportation & Commute in Huron County
Vehicle Availability by Sex in Huron County
The most prevalent vehicle ownership categories in Huron County are males with 2 vehicles (3,248, accounting for 44.2%) and females with 2 vehicles (2,520, making up 54.4%).
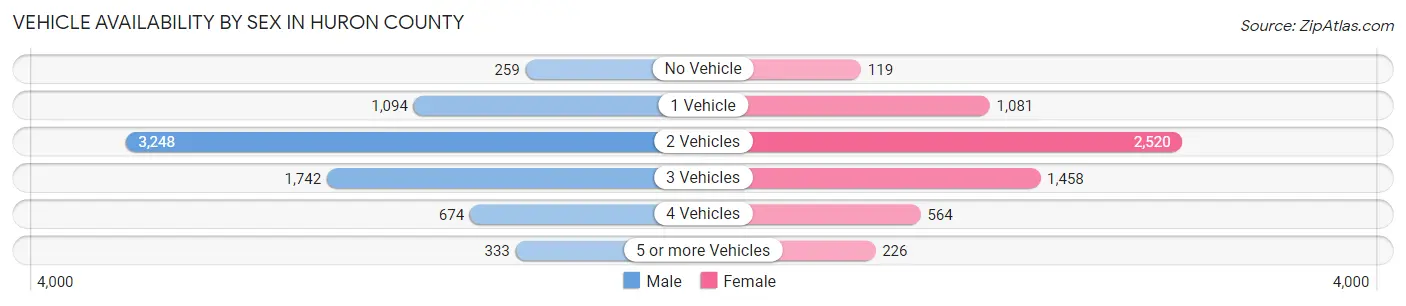
| Vehicles Available | Male | Female |
| No Vehicle | 259 (3.5%) | 119 (2.0%) |
| 1 Vehicle | 1,094 (14.9%) | 1,081 (18.1%) |
| 2 Vehicles | 3,248 (44.2%) | 2,520 (42.2%) |
| 3 Vehicles | 1,742 (23.7%) | 1,458 (24.4%) |
| 4 Vehicles | 674 (9.2%) | 564 (9.5%) |
| 5 or more Vehicles | 333 (4.5%) | 226 (3.8%) |
| Total | 7,350 (100.0%) | 5,968 (100.0%) |
Commute Time in Huron County
The most frequently occuring commute durations in Huron County are 15 to 19 minutes (2,086 commuters, 16.8%), 5 to 9 minutes (1,997 commuters, 16.0%), and 10 to 14 minutes (1,948 commuters, 15.6%).
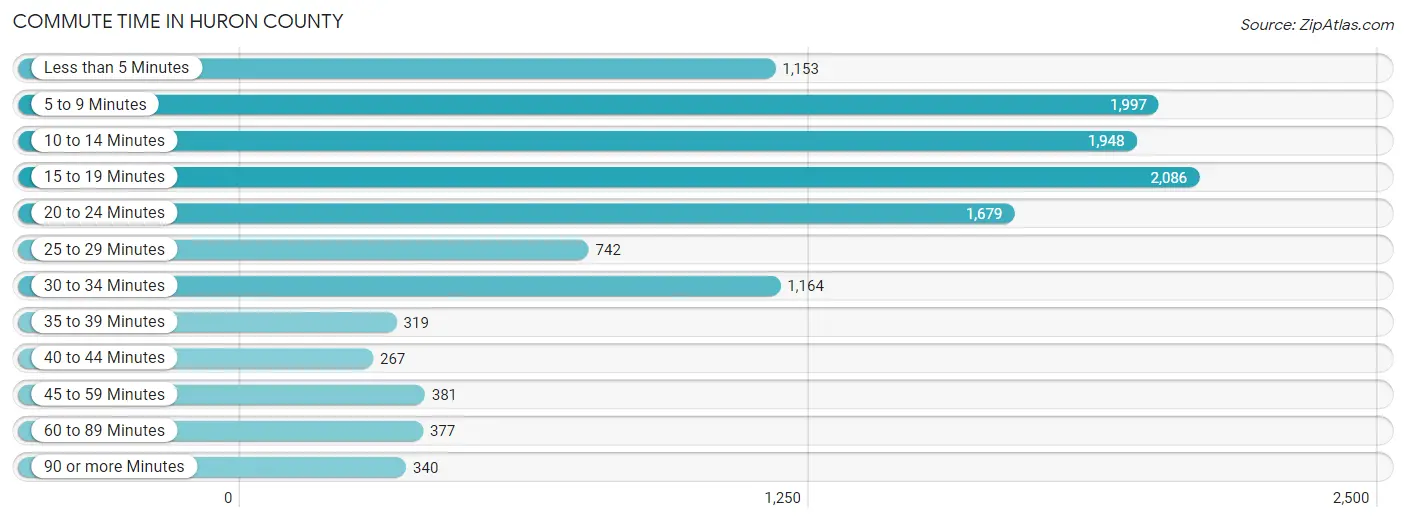
| Commute Time | # Commuters | % Commuters |
| Less than 5 Minutes | 1,153 | 9.3% |
| 5 to 9 Minutes | 1,997 | 16.0% |
| 10 to 14 Minutes | 1,948 | 15.6% |
| 15 to 19 Minutes | 2,086 | 16.8% |
| 20 to 24 Minutes | 1,679 | 13.5% |
| 25 to 29 Minutes | 742 | 6.0% |
| 30 to 34 Minutes | 1,164 | 9.3% |
| 35 to 39 Minutes | 319 | 2.6% |
| 40 to 44 Minutes | 267 | 2.1% |
| 45 to 59 Minutes | 381 | 3.1% |
| 60 to 89 Minutes | 377 | 3.0% |
| 90 or more Minutes | 340 | 2.7% |
Commute Time by Sex in Huron County
The most common commute times in Huron County are 15 to 19 minutes (1,222 commuters, 17.9%) for males and 10 to 14 minutes (978 commuters, 17.4%) for females.
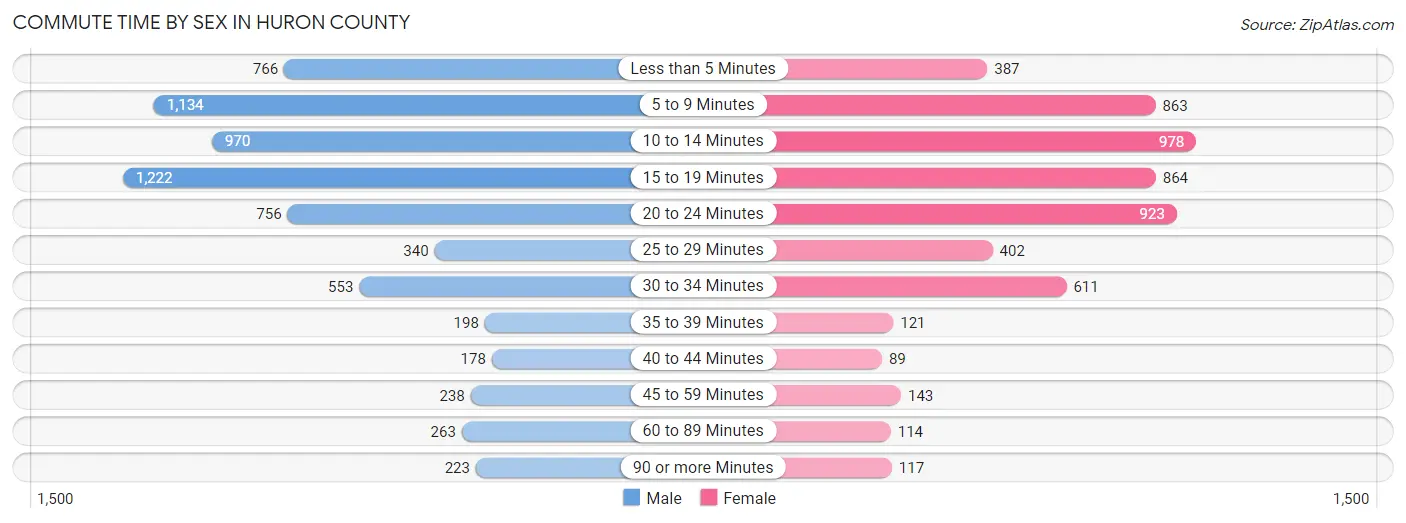
| Commute Time | Male | Female |
| Less than 5 Minutes | 766 (11.2%) | 387 (6.9%) |
| 5 to 9 Minutes | 1,134 (16.6%) | 863 (15.4%) |
| 10 to 14 Minutes | 970 (14.2%) | 978 (17.4%) |
| 15 to 19 Minutes | 1,222 (17.9%) | 864 (15.4%) |
| 20 to 24 Minutes | 756 (11.1%) | 923 (16.5%) |
| 25 to 29 Minutes | 340 (5.0%) | 402 (7.2%) |
| 30 to 34 Minutes | 553 (8.1%) | 611 (10.9%) |
| 35 to 39 Minutes | 198 (2.9%) | 121 (2.2%) |
| 40 to 44 Minutes | 178 (2.6%) | 89 (1.6%) |
| 45 to 59 Minutes | 238 (3.5%) | 143 (2.5%) |
| 60 to 89 Minutes | 263 (3.8%) | 114 (2.0%) |
| 90 or more Minutes | 223 (3.3%) | 117 (2.1%) |
Time of Departure to Work by Sex in Huron County
The most frequent times of departure to work in Huron County are 7:00 AM to 7:29 AM (809, 11.8%) for males and 7:30 AM to 7:59 AM (914, 16.3%) for females.
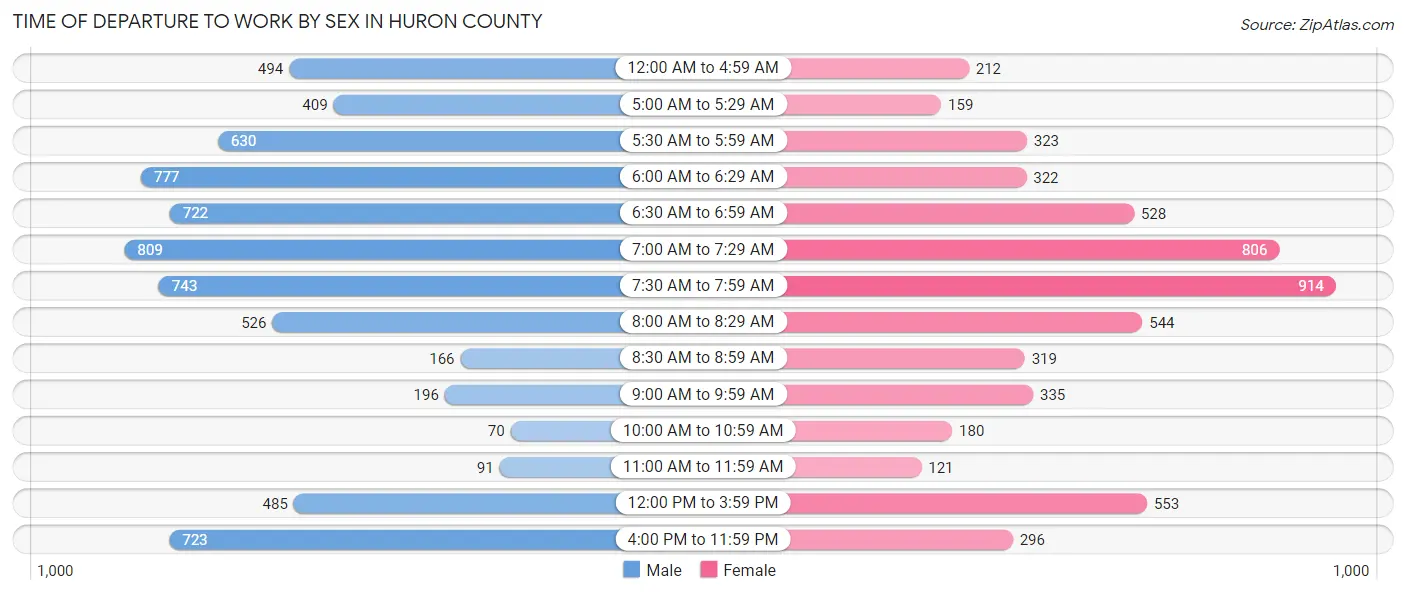
| Time of Departure | Male | Female |
| 12:00 AM to 4:59 AM | 494 (7.2%) | 212 (3.8%) |
| 5:00 AM to 5:29 AM | 409 (6.0%) | 159 (2.8%) |
| 5:30 AM to 5:59 AM | 630 (9.2%) | 323 (5.8%) |
| 6:00 AM to 6:29 AM | 777 (11.4%) | 322 (5.7%) |
| 6:30 AM to 6:59 AM | 722 (10.5%) | 528 (9.4%) |
| 7:00 AM to 7:29 AM | 809 (11.8%) | 806 (14.4%) |
| 7:30 AM to 7:59 AM | 743 (10.9%) | 914 (16.3%) |
| 8:00 AM to 8:29 AM | 526 (7.7%) | 544 (9.7%) |
| 8:30 AM to 8:59 AM | 166 (2.4%) | 319 (5.7%) |
| 9:00 AM to 9:59 AM | 196 (2.9%) | 335 (6.0%) |
| 10:00 AM to 10:59 AM | 70 (1.0%) | 180 (3.2%) |
| 11:00 AM to 11:59 AM | 91 (1.3%) | 121 (2.2%) |
| 12:00 PM to 3:59 PM | 485 (7.1%) | 553 (9.9%) |
| 4:00 PM to 11:59 PM | 723 (10.6%) | 296 (5.3%) |
| Total | 6,841 (100.0%) | 5,612 (100.0%) |
Housing Occupancy in Huron County
Occupancy by Ownership in Huron County
Of the total 13,617 dwellings in Huron County, owner-occupied units account for 11,143 (81.8%), while renter-occupied units make up 2,474 (18.2%).
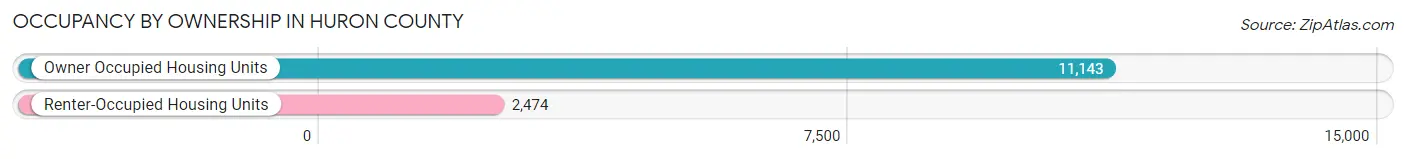
| Occupancy | # Housing Units | % Housing Units |
| Owner Occupied Housing Units | 11,143 | 81.8% |
| Renter-Occupied Housing Units | 2,474 | 18.2% |
| Total Occupied Housing Units | 13,617 | 100.0% |
Occupancy by Household Size in Huron County
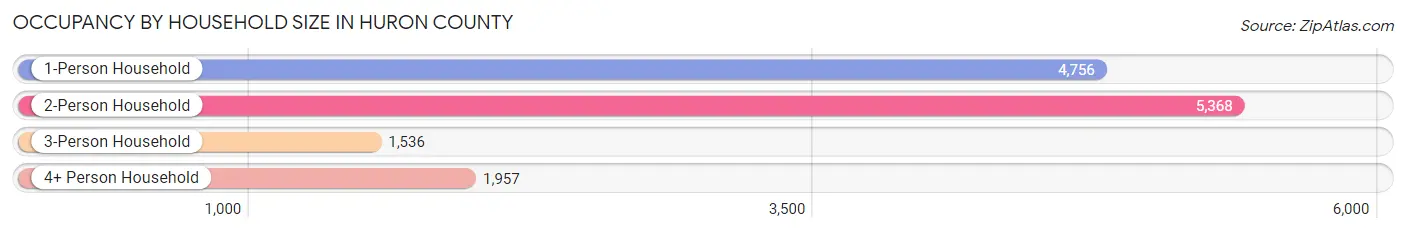
| Household Size | # Housing Units | % Housing Units |
| 1-Person Household | 4,756 | 34.9% |
| 2-Person Household | 5,368 | 39.4% |
| 3-Person Household | 1,536 | 11.3% |
| 4+ Person Household | 1,957 | 14.4% |
| Total Housing Units | 13,617 | 100.0% |
Occupancy by Ownership by Household Size in Huron County
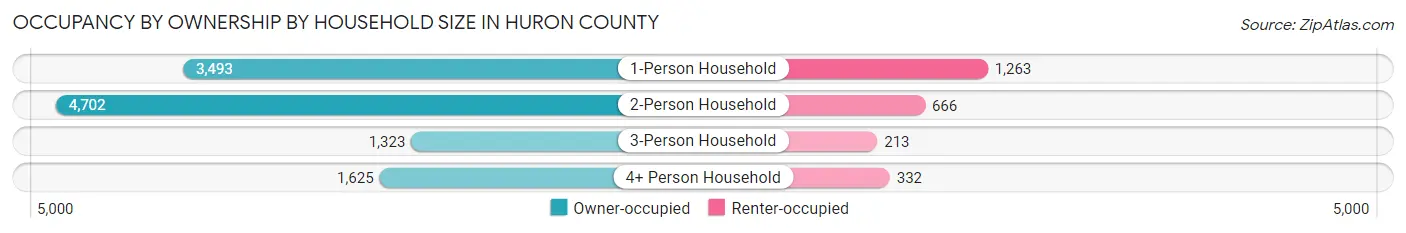
| Household Size | Owner-occupied | Renter-occupied |
| 1-Person Household | 3,493 (73.4%) | 1,263 (26.6%) |
| 2-Person Household | 4,702 (87.6%) | 666 (12.4%) |
| 3-Person Household | 1,323 (86.1%) | 213 (13.9%) |
| 4+ Person Household | 1,625 (83.0%) | 332 (17.0%) |
| Total Housing Units | 11,143 (81.8%) | 2,474 (18.2%) |
Occupancy by Educational Attainment in Huron County
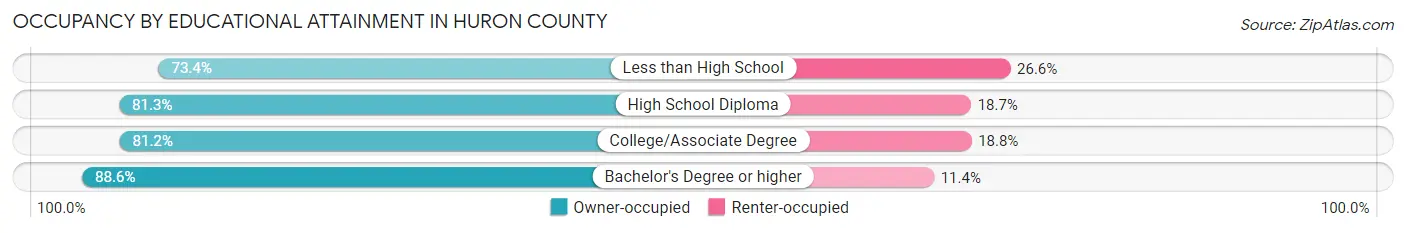
| Household Size | Owner-occupied | Renter-occupied |
| Less than High School | 835 (73.4%) | 302 (26.6%) |
| High School Diploma | 4,589 (81.3%) | 1,058 (18.7%) |
| College/Associate Degree | 3,653 (81.2%) | 848 (18.8%) |
| Bachelor's Degree or higher | 2,066 (88.6%) | 266 (11.4%) |
Occupancy by Age of Householder in Huron County
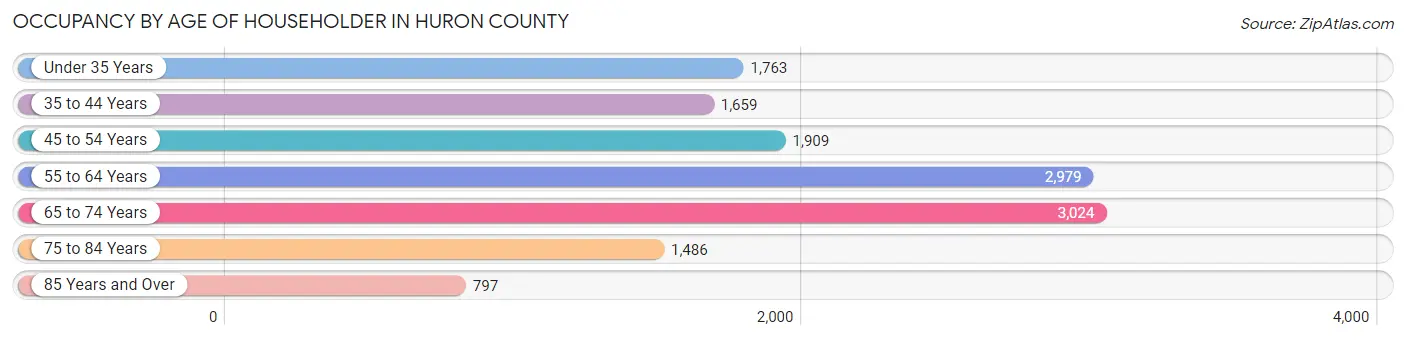
| Age Bracket | # Households | % Households |
| Under 35 Years | 1,763 | 13.0% |
| 35 to 44 Years | 1,659 | 12.2% |
| 45 to 54 Years | 1,909 | 14.0% |
| 55 to 64 Years | 2,979 | 21.9% |
| 65 to 74 Years | 3,024 | 22.2% |
| 75 to 84 Years | 1,486 | 10.9% |
| 85 Years and Over | 797 | 5.9% |
| Total | 13,617 | 100.0% |
Housing Finances in Huron County
Median Income by Occupancy in Huron County
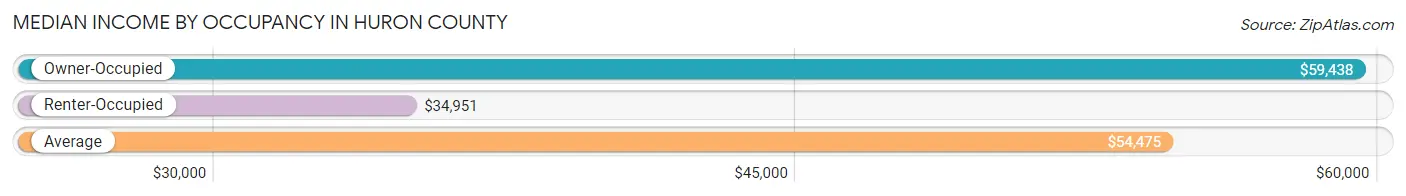
| Occupancy Type | # Households | Median Income |
| Owner-Occupied | 11,143 (81.8%) | $59,438 |
| Renter-Occupied | 2,474 (18.2%) | $34,951 |
| Average | 13,617 (100.0%) | $54,475 |
Occupancy by Householder Income Bracket in Huron County
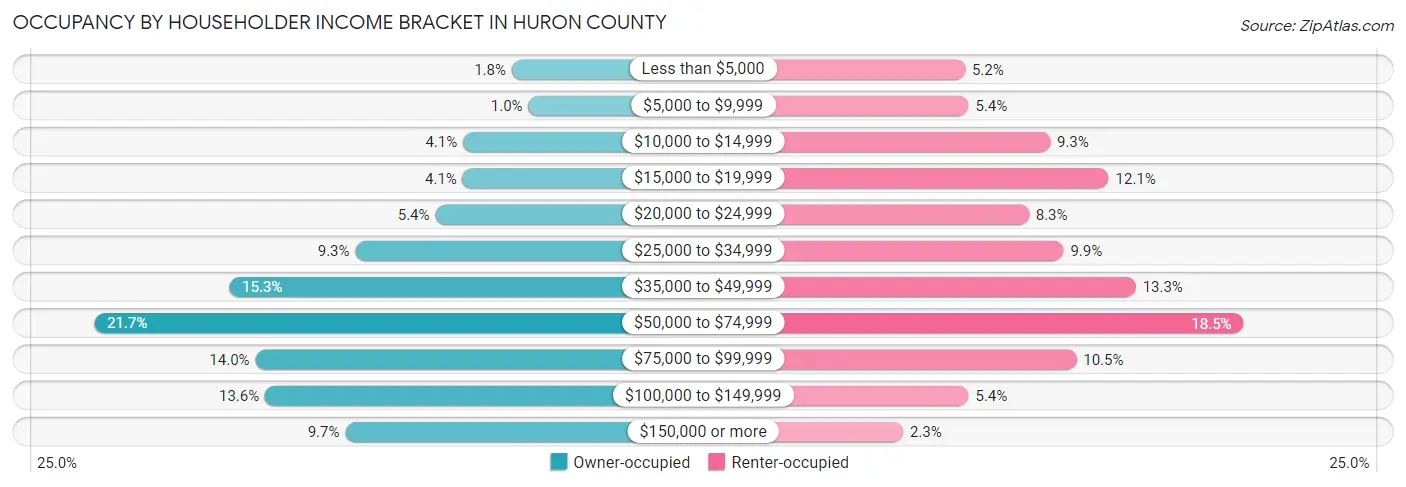
| Income Bracket | Owner-occupied | Renter-occupied |
| Less than $5,000 | 201 (1.8%) | 129 (5.2%) |
| $5,000 to $9,999 | 113 (1.0%) | 133 (5.4%) |
| $10,000 to $14,999 | 459 (4.1%) | 229 (9.3%) |
| $15,000 to $19,999 | 461 (4.1%) | 298 (12.0%) |
| $20,000 to $24,999 | 606 (5.4%) | 204 (8.3%) |
| $25,000 to $34,999 | 1,031 (9.2%) | 245 (9.9%) |
| $35,000 to $49,999 | 1,700 (15.3%) | 330 (13.3%) |
| $50,000 to $74,999 | 2,417 (21.7%) | 457 (18.5%) |
| $75,000 to $99,999 | 1,561 (14.0%) | 260 (10.5%) |
| $100,000 to $149,999 | 1,510 (13.6%) | 133 (5.4%) |
| $150,000 or more | 1,084 (9.7%) | 56 (2.3%) |
| Total | 11,143 (100.0%) | 2,474 (100.0%) |
Monthly Housing Cost Tiers in Huron County
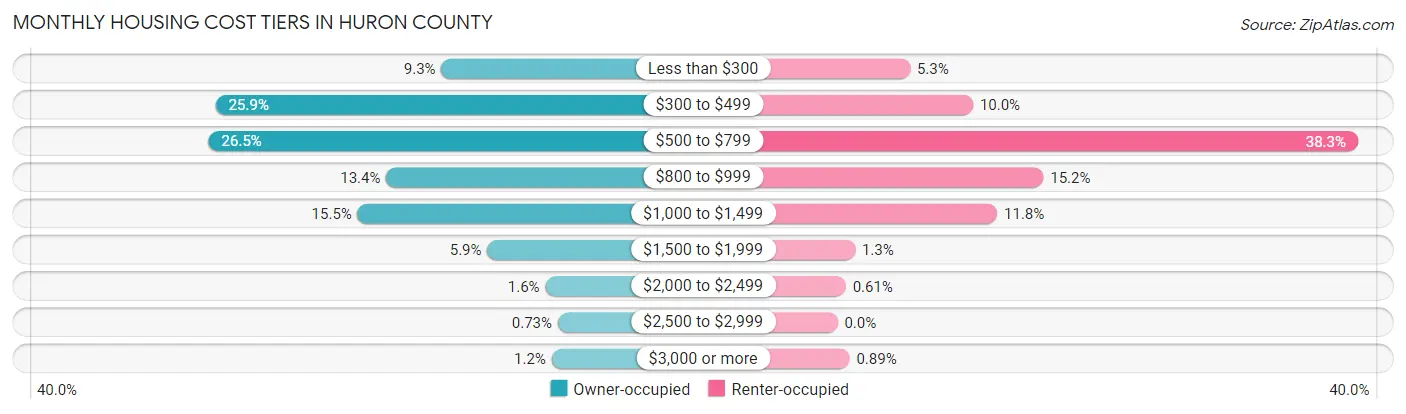
| Monthly Cost | Owner-occupied | Renter-occupied |
| Less than $300 | 1,036 (9.3%) | 132 (5.3%) |
| $300 to $499 | 2,890 (25.9%) | 247 (10.0%) |
| $500 to $799 | 2,948 (26.5%) | 948 (38.3%) |
| $800 to $999 | 1,489 (13.4%) | 375 (15.2%) |
| $1,000 to $1,499 | 1,724 (15.5%) | 291 (11.8%) |
| $1,500 to $1,999 | 660 (5.9%) | 32 (1.3%) |
| $2,000 to $2,499 | 183 (1.6%) | 15 (0.6%) |
| $2,500 to $2,999 | 81 (0.7%) | 0 (0.0%) |
| $3,000 or more | 132 (1.2%) | 22 (0.9%) |
| Total | 11,143 (100.0%) | 2,474 (100.0%) |
Physical Housing Characteristics in Huron County
Housing Structures in Huron County
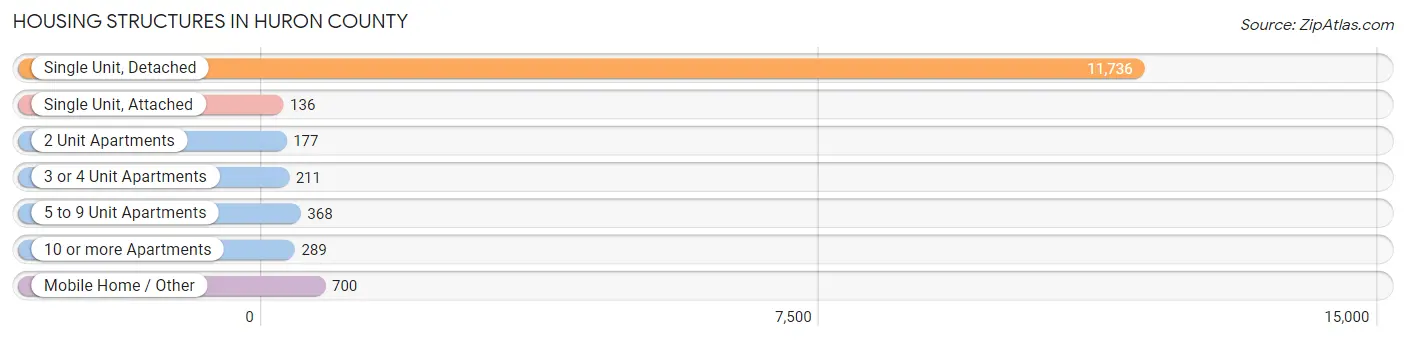
| Structure Type | # Housing Units | % Housing Units |
| Single Unit, Detached | 11,736 | 86.2% |
| Single Unit, Attached | 136 | 1.0% |
| 2 Unit Apartments | 177 | 1.3% |
| 3 or 4 Unit Apartments | 211 | 1.5% |
| 5 to 9 Unit Apartments | 368 | 2.7% |
| 10 or more Apartments | 289 | 2.1% |
| Mobile Home / Other | 700 | 5.1% |
| Total | 13,617 | 100.0% |
Housing Structures by Occupancy in Huron County
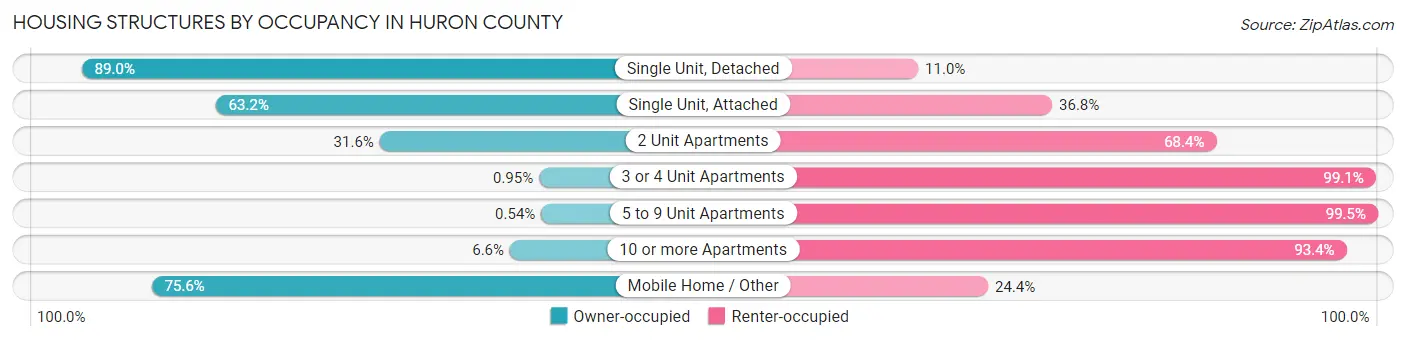
| Structure Type | Owner-occupied | Renter-occupied |
| Single Unit, Detached | 10,449 (89.0%) | 1,287 (11.0%) |
| Single Unit, Attached | 86 (63.2%) | 50 (36.8%) |
| 2 Unit Apartments | 56 (31.6%) | 121 (68.4%) |
| 3 or 4 Unit Apartments | 2 (0.9%) | 209 (99.1%) |
| 5 to 9 Unit Apartments | 2 (0.5%) | 366 (99.5%) |
| 10 or more Apartments | 19 (6.6%) | 270 (93.4%) |
| Mobile Home / Other | 529 (75.6%) | 171 (24.4%) |
| Total | 11,143 (81.8%) | 2,474 (18.2%) |
Housing Structures by Number of Rooms in Huron County
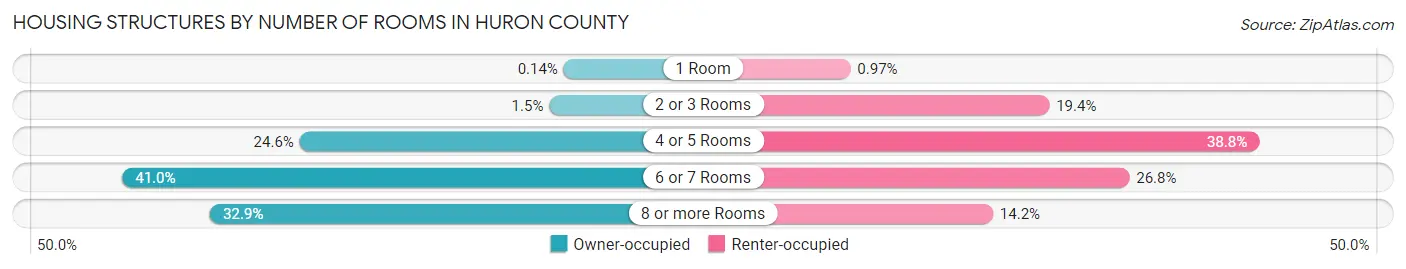
| Number of Rooms | Owner-occupied | Renter-occupied |
| 1 Room | 16 (0.1%) | 24 (1.0%) |
| 2 or 3 Rooms | 165 (1.5%) | 479 (19.4%) |
| 4 or 5 Rooms | 2,737 (24.6%) | 959 (38.8%) |
| 6 or 7 Rooms | 4,564 (41.0%) | 662 (26.8%) |
| 8 or more Rooms | 3,661 (32.9%) | 350 (14.1%) |
| Total | 11,143 (100.0%) | 2,474 (100.0%) |
Housing Structure by Heating Type in Huron County
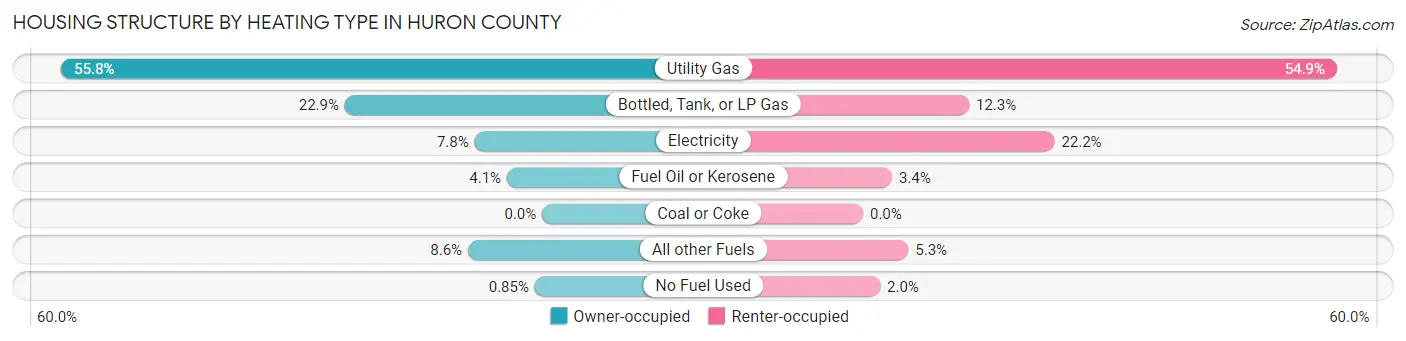
| Heating Type | Owner-occupied | Renter-occupied |
| Utility Gas | 6,213 (55.8%) | 1,359 (54.9%) |
| Bottled, Tank, or LP Gas | 2,550 (22.9%) | 304 (12.3%) |
| Electricity | 872 (7.8%) | 549 (22.2%) |
| Fuel Oil or Kerosene | 455 (4.1%) | 83 (3.4%) |
| Coal or Coke | 0 (0.0%) | 0 (0.0%) |
| All other Fuels | 958 (8.6%) | 130 (5.2%) |
| No Fuel Used | 95 (0.9%) | 49 (2.0%) |
| Total | 11,143 (100.0%) | 2,474 (100.0%) |
Household Vehicle Usage in Huron County
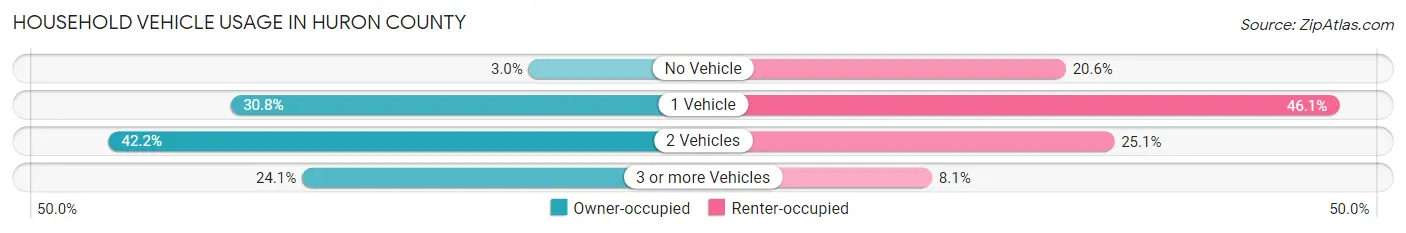
| Vehicles per Household | Owner-occupied | Renter-occupied |
| No Vehicle | 329 (2.9%) | 510 (20.6%) |
| 1 Vehicle | 3,432 (30.8%) | 1,141 (46.1%) |
| 2 Vehicles | 4,697 (42.1%) | 622 (25.1%) |
| 3 or more Vehicles | 2,685 (24.1%) | 201 (8.1%) |
| Total | 11,143 (100.0%) | 2,474 (100.0%) |
Real Estate & Mortgages in Huron County
Real Estate and Mortgage Overview in Huron County
| Characteristic | Without Mortgage | With Mortgage |
| Housing Units | 6,666 | 4,477 |
| Median Property Value | $128,600 | $130,400 |
| Median Household Income | $52,135 | $530 |
| Monthly Housing Costs | $465 | $126 |
| Real Estate Taxes | $1,614 | $229 |
Property Value by Mortgage Status in Huron County
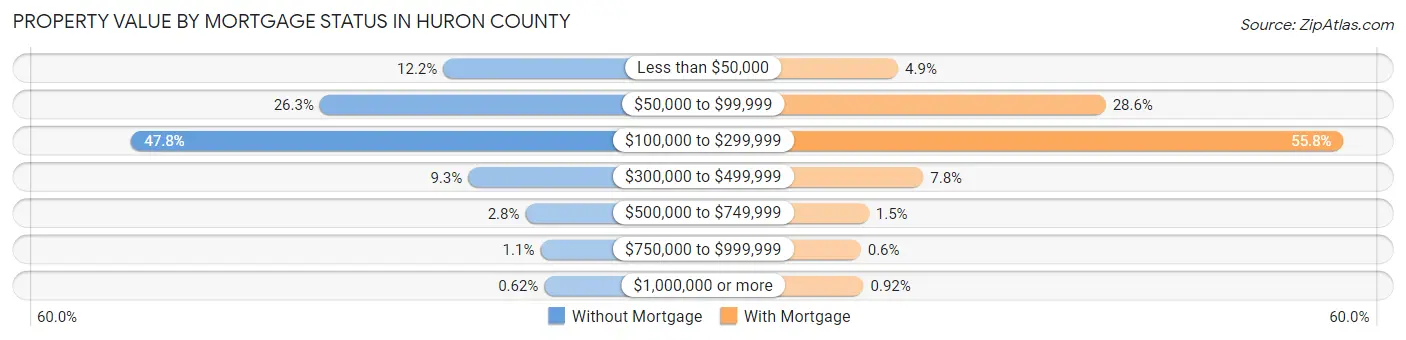
| Property Value | Without Mortgage | With Mortgage |
| Less than $50,000 | 811 (12.2%) | 218 (4.9%) |
| $50,000 to $99,999 | 1,751 (26.3%) | 1,280 (28.6%) |
| $100,000 to $299,999 | 3,186 (47.8%) | 2,496 (55.7%) |
| $300,000 to $499,999 | 621 (9.3%) | 347 (7.7%) |
| $500,000 to $749,999 | 185 (2.8%) | 68 (1.5%) |
| $750,000 to $999,999 | 71 (1.1%) | 27 (0.6%) |
| $1,000,000 or more | 41 (0.6%) | 41 (0.9%) |
| Total | 6,666 (100.0%) | 4,477 (100.0%) |
Household Income by Mortgage Status in Huron County
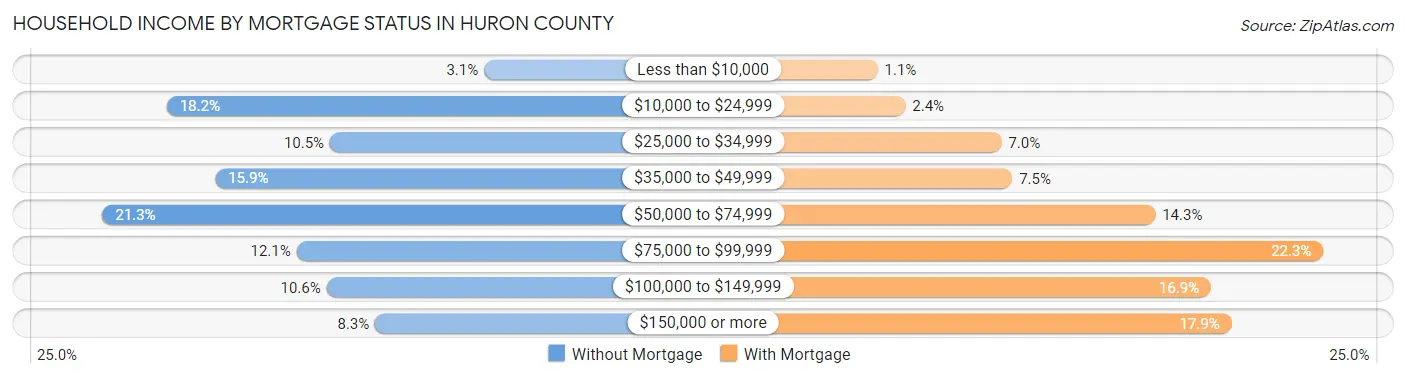
| Household Income | Without Mortgage | With Mortgage |
| Less than $10,000 | 208 (3.1%) | 47 (1.1%) |
| $10,000 to $24,999 | 1,215 (18.2%) | 106 (2.4%) |
| $25,000 to $34,999 | 697 (10.5%) | 311 (7.0%) |
| $35,000 to $49,999 | 1,061 (15.9%) | 334 (7.5%) |
| $50,000 to $74,999 | 1,420 (21.3%) | 639 (14.3%) |
| $75,000 to $99,999 | 803 (12.0%) | 997 (22.3%) |
| $100,000 to $149,999 | 708 (10.6%) | 758 (16.9%) |
| $150,000 or more | 554 (8.3%) | 802 (17.9%) |
| Total | 6,666 (100.0%) | 4,477 (100.0%) |
Property Value to Household Income Ratio in Huron County
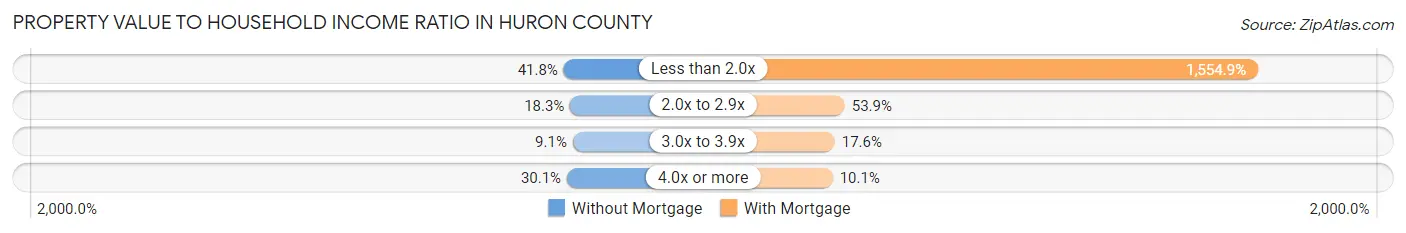
| Value-to-Income Ratio | Without Mortgage | With Mortgage |
| Less than 2.0x | 2,789 (41.8%) | 69,614 (1,554.9%) |
| 2.0x to 2.9x | 1,220 (18.3%) | 2,414 (53.9%) |
| 3.0x to 3.9x | 605 (9.1%) | 788 (17.6%) |
| 4.0x or more | 2,009 (30.1%) | 453 (10.1%) |
| Total | 6,666 (100.0%) | 4,477 (100.0%) |
Real Estate Taxes by Mortgage Status in Huron County
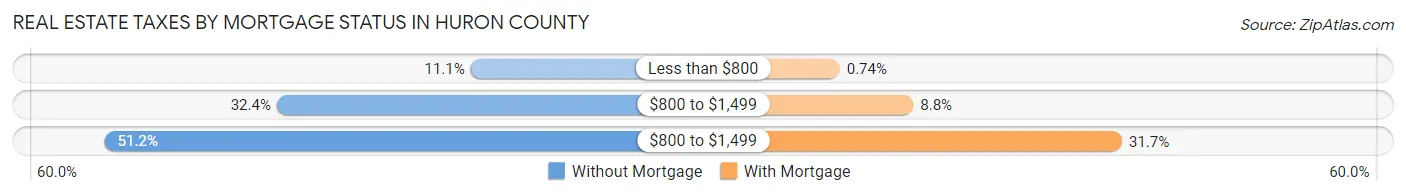
| Property Taxes | Without Mortgage | With Mortgage |
| Less than $800 | 742 (11.1%) | 33 (0.7%) |
| $800 to $1,499 | 2,158 (32.4%) | 394 (8.8%) |
| $800 to $1,499 | 3,415 (51.2%) | 1,418 (31.7%) |
| Total | 6,666 (100.0%) | 4,477 (100.0%) |
Health & Disability in Huron County
Health Insurance Coverage by Age in Huron County
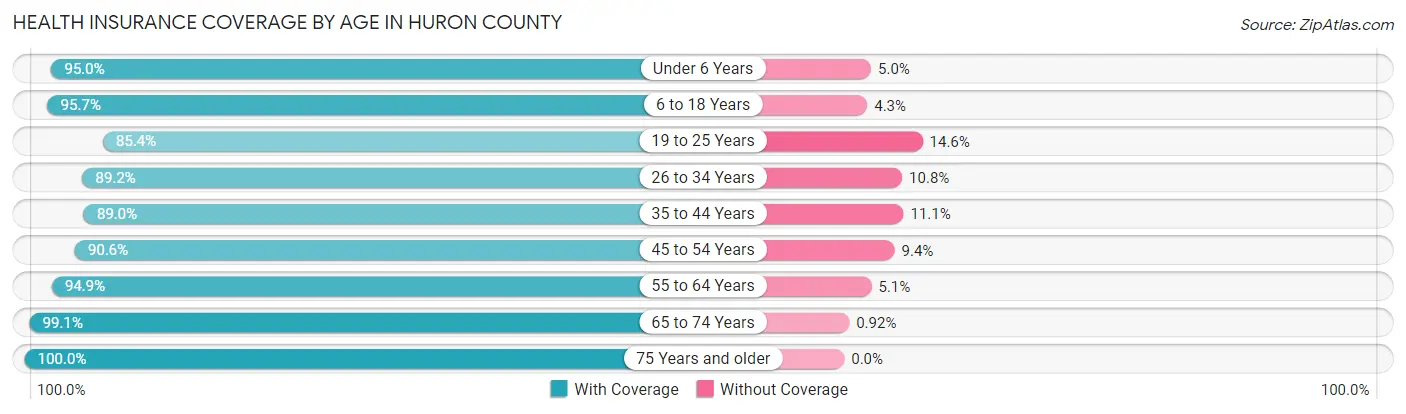
| Age Bracket | With Coverage | Without Coverage |
| Under 6 Years | 1,734 (95.0%) | 91 (5.0%) |
| 6 to 18 Years | 4,311 (95.7%) | 193 (4.3%) |
| 19 to 25 Years | 1,866 (85.4%) | 319 (14.6%) |
| 26 to 34 Years | 2,414 (89.2%) | 292 (10.8%) |
| 35 to 44 Years | 2,696 (88.9%) | 335 (11.1%) |
| 45 to 54 Years | 3,334 (90.6%) | 345 (9.4%) |
| 55 to 64 Years | 4,970 (94.9%) | 266 (5.1%) |
| 65 to 74 Years | 4,743 (99.1%) | 44 (0.9%) |
| 75 Years and older | 3,178 (100.0%) | 0 (0.0%) |
| Total | 29,246 (93.9%) | 1,885 (6.1%) |
Health Insurance Coverage by Citizenship Status in Huron County
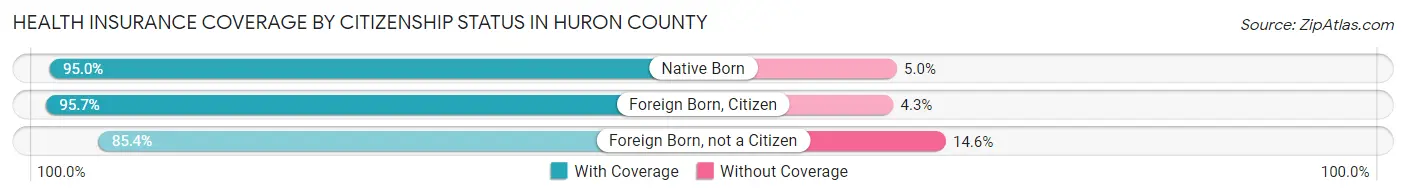
| Citizenship Status | With Coverage | Without Coverage |
| Native Born | 1,734 (95.0%) | 91 (5.0%) |
| Foreign Born, Citizen | 4,311 (95.7%) | 193 (4.3%) |
| Foreign Born, not a Citizen | 1,866 (85.4%) | 319 (14.6%) |
Health Insurance Coverage by Household Income in Huron County
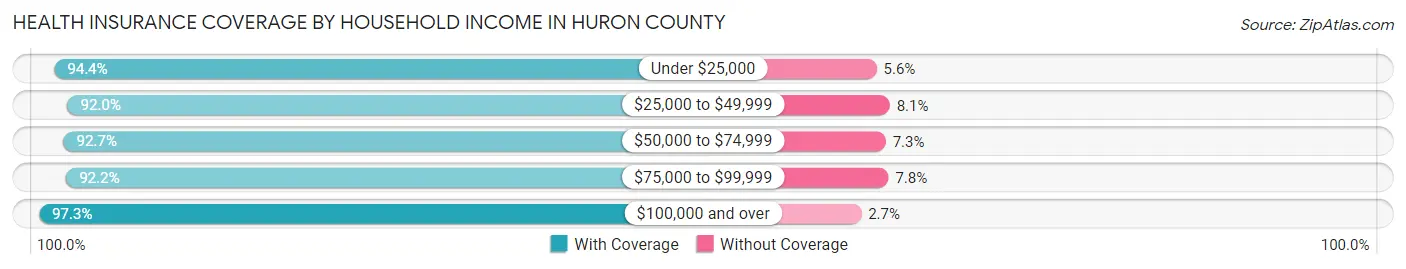
| Household Income | With Coverage | Without Coverage |
| Under $25,000 | 3,793 (94.4%) | 224 (5.6%) |
| $25,000 to $49,999 | 5,873 (91.9%) | 514 (8.1%) |
| $50,000 to $74,999 | 5,985 (92.7%) | 471 (7.3%) |
| $75,000 to $99,999 | 5,017 (92.2%) | 425 (7.8%) |
| $100,000 and over | 8,386 (97.3%) | 233 (2.7%) |
Public vs Private Health Insurance Coverage by Age in Huron County
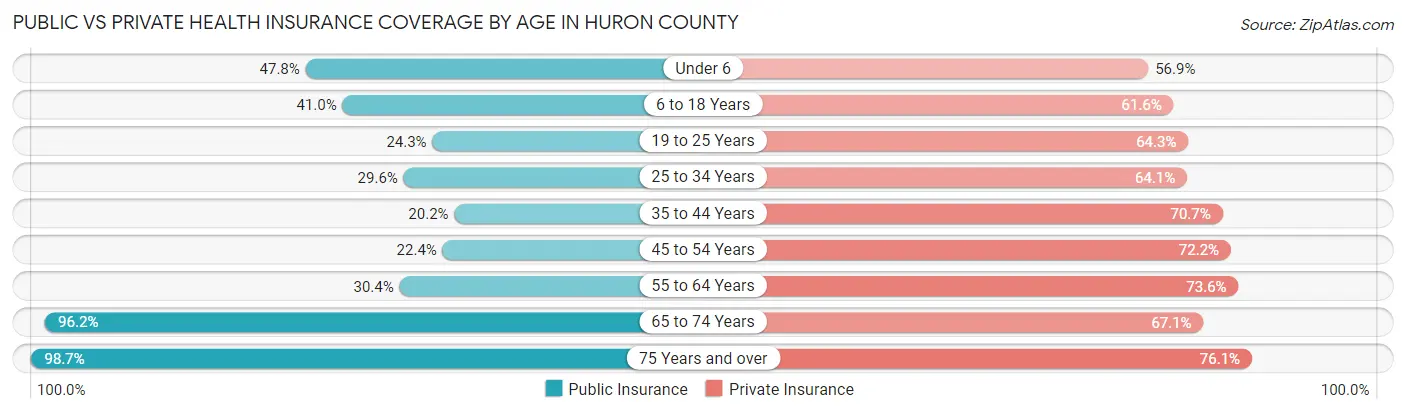
| Age Bracket | Public Insurance | Private Insurance |
| Under 6 | 873 (47.8%) | 1,038 (56.9%) |
| 6 to 18 Years | 1,846 (41.0%) | 2,774 (61.6%) |
| 19 to 25 Years | 531 (24.3%) | 1,405 (64.3%) |
| 25 to 34 Years | 802 (29.6%) | 1,734 (64.1%) |
| 35 to 44 Years | 613 (20.2%) | 2,142 (70.7%) |
| 45 to 54 Years | 824 (22.4%) | 2,657 (72.2%) |
| 55 to 64 Years | 1,592 (30.4%) | 3,854 (73.6%) |
| 65 to 74 Years | 4,604 (96.2%) | 3,213 (67.1%) |
| 75 Years and over | 3,138 (98.7%) | 2,419 (76.1%) |
| Total | 14,823 (47.6%) | 21,236 (68.2%) |
Disability Status by Sex by Age in Huron County
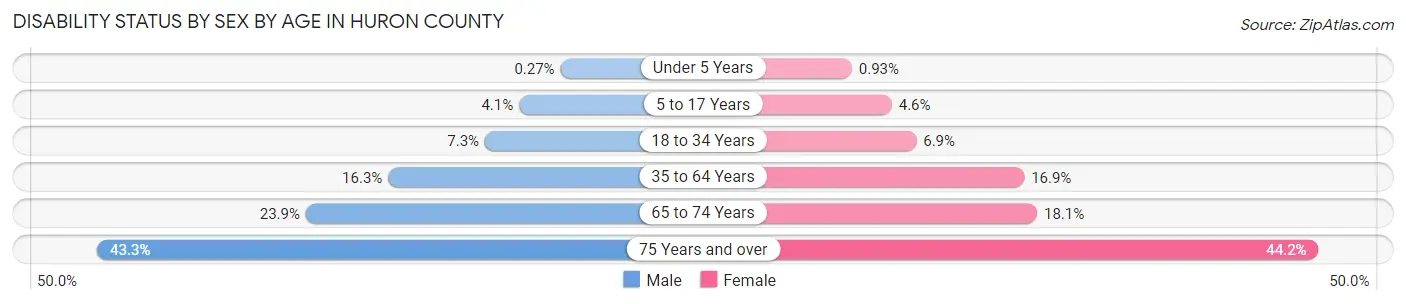
| Age Bracket | Male | Female |
| Under 5 Years | 2 (0.3%) | 7 (0.9%) |
| 5 to 17 Years | 95 (4.1%) | 103 (4.6%) |
| 18 to 34 Years | 198 (7.3%) | 172 (6.9%) |
| 35 to 64 Years | 986 (16.3%) | 996 (16.9%) |
| 65 to 74 Years | 577 (23.9%) | 430 (18.1%) |
| 75 Years and over | 614 (43.3%) | 778 (44.2%) |
Disability Class by Sex by Age in Huron County
Disability Class: Hearing Difficulty
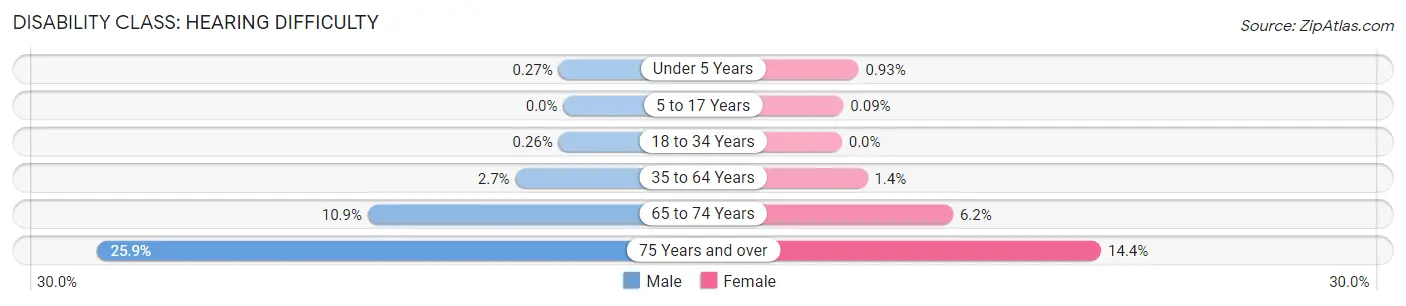
| Age Bracket | Male | Female |
| Under 5 Years | 2 (0.3%) | 7 (0.9%) |
| 5 to 17 Years | 0 (0.0%) | 2 (0.1%) |
| 18 to 34 Years | 7 (0.3%) | 0 (0.0%) |
| 35 to 64 Years | 162 (2.7%) | 84 (1.4%) |
| 65 to 74 Years | 263 (10.9%) | 147 (6.2%) |
| 75 Years and over | 368 (25.9%) | 254 (14.4%) |
Disability Class: Vision Difficulty
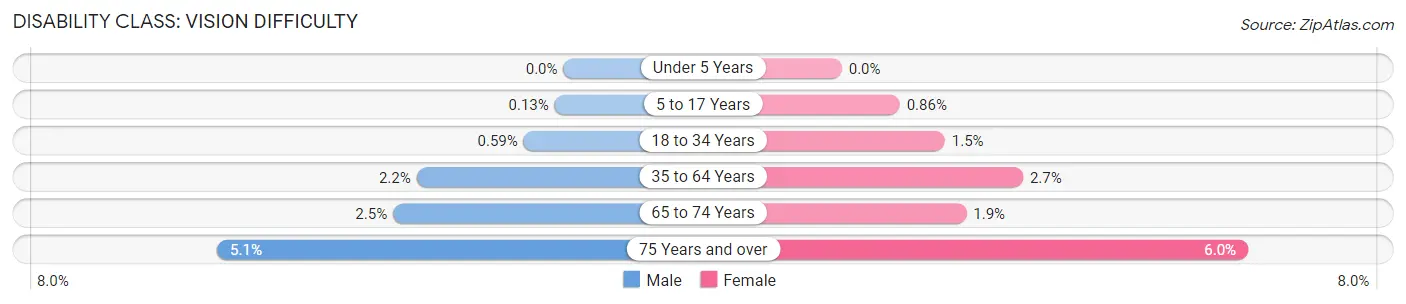
| Age Bracket | Male | Female |
| Under 5 Years | 0 (0.0%) | 0 (0.0%) |
| 5 to 17 Years | 3 (0.1%) | 19 (0.9%) |
| 18 to 34 Years | 16 (0.6%) | 38 (1.5%) |
| 35 to 64 Years | 132 (2.2%) | 158 (2.7%) |
| 65 to 74 Years | 61 (2.5%) | 44 (1.8%) |
| 75 Years and over | 73 (5.1%) | 106 (6.0%) |
Disability Class: Cognitive Difficulty
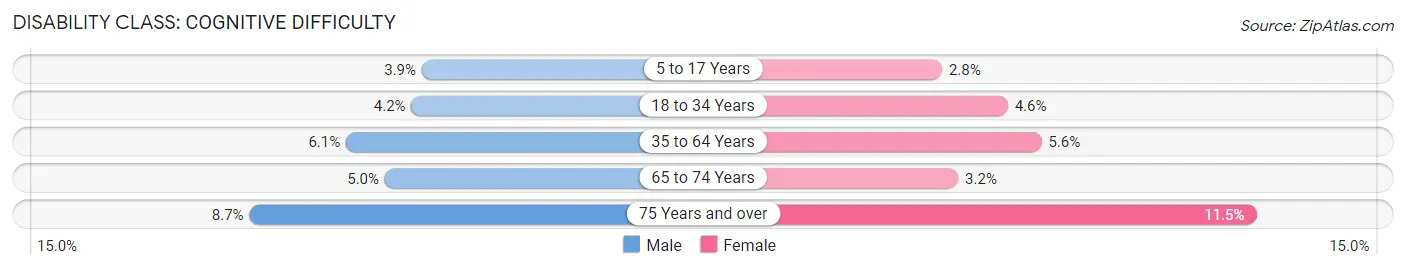
| Age Bracket | Male | Female |
| 5 to 17 Years | 91 (3.9%) | 62 (2.8%) |
| 18 to 34 Years | 115 (4.2%) | 115 (4.6%) |
| 35 to 64 Years | 367 (6.0%) | 327 (5.6%) |
| 65 to 74 Years | 120 (5.0%) | 77 (3.2%) |
| 75 Years and over | 124 (8.7%) | 203 (11.5%) |
Disability Class: Ambulatory Difficulty
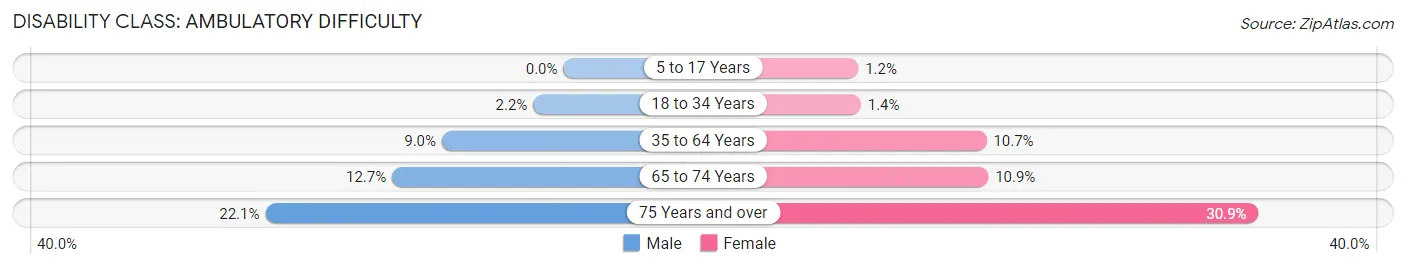
| Age Bracket | Male | Female |
| 5 to 17 Years | 0 (0.0%) | 27 (1.2%) |
| 18 to 34 Years | 61 (2.2%) | 35 (1.4%) |
| 35 to 64 Years | 547 (9.0%) | 632 (10.7%) |
| 65 to 74 Years | 307 (12.7%) | 258 (10.9%) |
| 75 Years and over | 314 (22.1%) | 544 (30.9%) |
Disability Class: Self-Care Difficulty
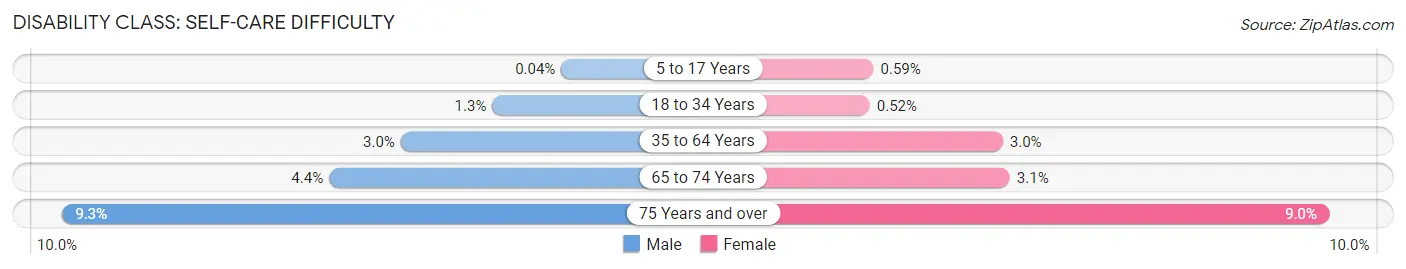
| Age Bracket | Male | Female |
| 5 to 17 Years | 1 (0.0%) | 13 (0.6%) |
| 18 to 34 Years | 36 (1.3%) | 13 (0.5%) |
| 35 to 64 Years | 183 (3.0%) | 176 (3.0%) |
| 65 to 74 Years | 105 (4.3%) | 74 (3.1%) |
| 75 Years and over | 132 (9.3%) | 159 (9.0%) |
Technology Access in Huron County
Computing Device Access in Huron County
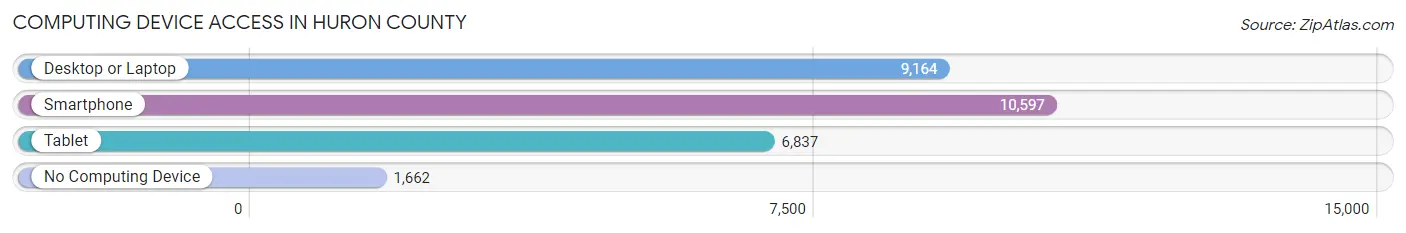
| Device Type | # Households | % Households |
| Desktop or Laptop | 9,164 | 67.3% |
| Smartphone | 10,597 | 77.8% |
| Tablet | 6,837 | 50.2% |
| No Computing Device | 1,662 | 12.2% |
| Total | 13,617 | 100.0% |
Internet Access in Huron County
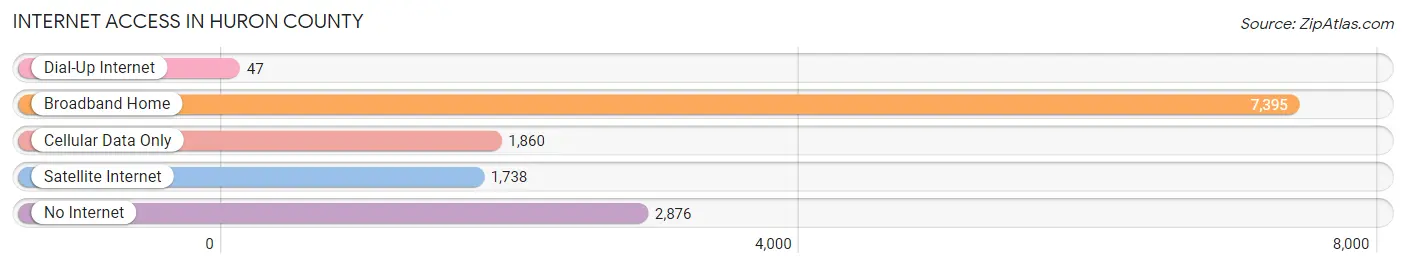
| Internet Type | # Households | % Households |
| Dial-Up Internet | 47 | 0.4% |
| Broadband Home | 7,395 | 54.3% |
| Cellular Data Only | 1,860 | 13.7% |
| Satellite Internet | 1,738 | 12.8% |
| No Internet | 2,876 | 21.1% |
| Total | 13,617 | 100.0% |
Huron County Summary
Huron County is located in the state of Michigan in the United States. It is situated in the Thumb region of the Lower Peninsula and is bordered by Sanilac County to the east, Tuscola County to the south, and Saginaw County to the west. The county seat is Bad Axe, and the largest city is Harbor Beach. The county has a total area of 1,269 square miles, of which 1,068 square miles is land and 201 square miles is water.
History
Huron County was established in 1840 and was named after the Huron Indians, who were the original inhabitants of the area. The county was originally part of Sanilac County, but was split off in 1859. The county was initially settled by farmers and lumberjacks, and the economy was largely based on agriculture and timber. In the late 19th century, the county experienced a period of rapid growth due to the development of the railroad and the discovery of oil and natural gas.
Geography
Huron County is located in the Thumb region of the Lower Peninsula of Michigan. It is bordered by Sanilac County to the east, Tuscola County to the south, and Saginaw County to the west. The county has a total area of 1,269 square miles, of which 1,068 square miles is land and 201 square miles is water. The terrain is generally flat, with some rolling hills in the northern part of the county. The county is home to several rivers, including the Cass River, the Bad Axe River, and the Sebewaing River.
Economy
The economy of Huron County is largely based on agriculture and tourism. The county is home to several large farms, which produce a variety of crops, including corn, soybeans, wheat, and hay. The county is also home to several wineries and breweries, which attract tourists from around the region. In addition, the county is home to several manufacturing companies, which produce a variety of products, including automotive parts, furniture, and medical supplies.
Demographics
As of the 2010 census, Huron County had a population of 33,118. The racial makeup of the county was 94.3% White, 0.7% African American, 0.5% Native American, 0.4% Asian, 0.1% Pacific Islander, 2.3% from other races, and 1.7% from two or more races. Hispanic or Latino of any race were 4.3% of the population. The median income for a household in the county was $41,945, and the median income for a family was $50,945. The per capita income for the county was $20,945.
Conclusion
Huron County is a rural county located in the Thumb region of the Lower Peninsula of Michigan. It is bordered by Sanilac County to the east, Tuscola County to the south, and Saginaw County to the west. The county has a total area of 1,269 square miles, of which 1,068 square miles is land and 201 square miles is water. The economy of the county is largely based on agriculture and tourism, and the population is largely white. The median income for a household in the county is $41,945, and the per capita income is $20,945.
Common Questions
What is Per Capita Income in Huron County?
Per Capita income in Huron County is $32,069.
What is the Median Family Income in Huron County?
Median Family Income in Huron County is $71,902.
What is the Median Household income in Huron County?
Median Household Income in Huron County is $54,475.
What is Income or Wage Gap in Huron County?
Income or Wage Gap in Huron County is 37.1%.
Women in Huron County earn 62.9 cents for every dollar earned by a man.
What is Family Income Deficit in Huron County?
Family Income Deficit in Huron County is $8,211.
Families that are below poverty line in Huron County earn $8,211 less on average than the poverty threshold level.
What is Inequality or Gini Index in Huron County?
Inequality or Gini Index in Huron County is 0.43.
What is the Total Population of Huron County?
Total Population of Huron County is 31,461.
What is the Total Male Population of Huron County?
Total Male Population of Huron County is 15,783.
What is the Total Female Population of Huron County?
Total Female Population of Huron County is 15,678.
What is the Ratio of Males per 100 Females in Huron County?
There are 100.67 Males per 100 Females in Huron County.
What is the Ratio of Females per 100 Males in Huron County?
There are 99.33 Females per 100 Males in Huron County.
What is the Median Population Age in Huron County?
Median Population Age in Huron County is 49.3 Years.
What is the Average Family Size in Huron County
Average Family Size in Huron County is 3.0 People.
What is the Average Household Size in Huron County
Average Household Size in Huron County is 2.3 People.
How Large is the Labor Force in Huron County?
There are 14,399 People in the Labor Forcein in Huron County.
What is the Percentage of People in the Labor Force in Huron County?
55.1% of People are in the Labor Force in Huron County.
What is the Unemployment Rate in Huron County?
Unemployment Rate in Huron County is 5.3%.