Hillsdale County, MI Map & Demographics
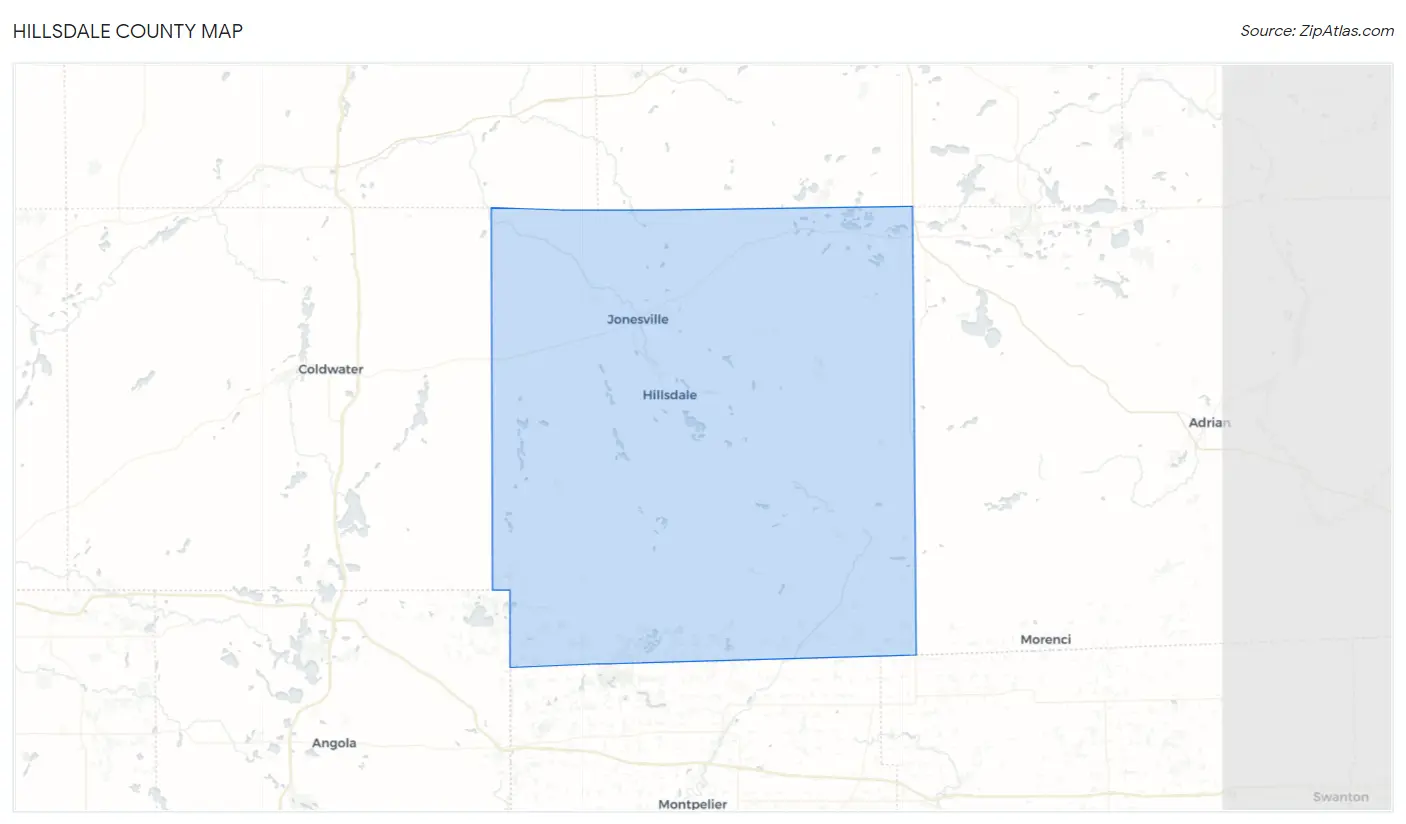
Hillsdale County Map
Hillsdale County Overview
$30,409
PER CAPITA INCOME
$71,224
AVG FAMILY INCOME
$59,425
AVG HOUSEHOLD INCOME
35.5%
WAGE / INCOME GAP [ % ]
64.5¢/ $1
WAGE / INCOME GAP [ $ ]
$11,765
FAMILY INCOME DEFICIT
0.42
INEQUALITY / GINI INDEX
45,698
TOTAL POPULATION
22,937
MALE POPULATION
22,761
FEMALE POPULATION
100.77
MALES / 100 FEMALES
99.23
FEMALES / 100 MALES
42.8
MEDIAN AGE
3.1
AVG FAMILY SIZE
2.5
AVG HOUSEHOLD SIZE
21,129
LABOR FORCE [ PEOPLE ]
56.9%
PERCENT IN LABOR FORCE
4.4%
UNEMPLOYMENT RATE
Hillsdale County Area Codes
Income in Hillsdale County
Income Overview in Hillsdale County
Per Capita Income in Hillsdale County is $30,409, while median incomes of families and households are $71,224 and $59,425 respectively.
| Characteristic | Number | Measure |
| Per Capita Income | 45,698 | $30,409 |
| Median Family Income | 11,508 | $71,224 |
| Mean Family Income | 11,508 | $89,194 |
| Median Household Income | 17,606 | $59,425 |
| Mean Household Income | 17,606 | $75,959 |
| Income Deficit | 11,508 | $11,765 |
| Wage / Income Gap (%) | 45,698 | 35.46% |
| Wage / Income Gap ($) | 45,698 | 64.54¢ per $1 |
| Gini / Inequality Index | 45,698 | 0.42 |
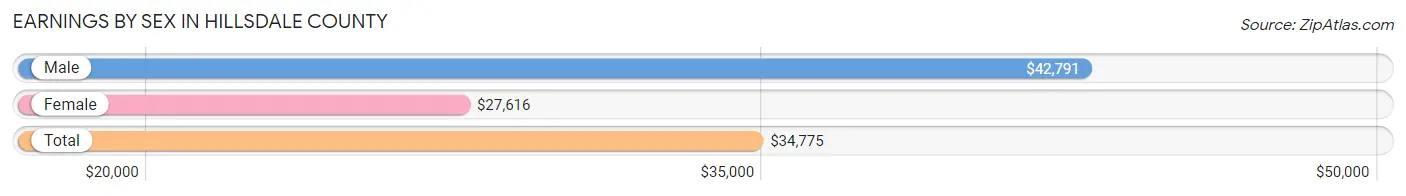
Earnings by Sex in Hillsdale County
Average Earnings in Hillsdale County are $34,775, $42,791 for men and $27,616 for women, a difference of 35.5%.
| Sex | Number | Average Earnings |
| Male | 11,752 (52.6%) | $42,791 |
| Female | 10,600 (47.4%) | $27,616 |
| Total | 22,352 (100.0%) | $34,775 |
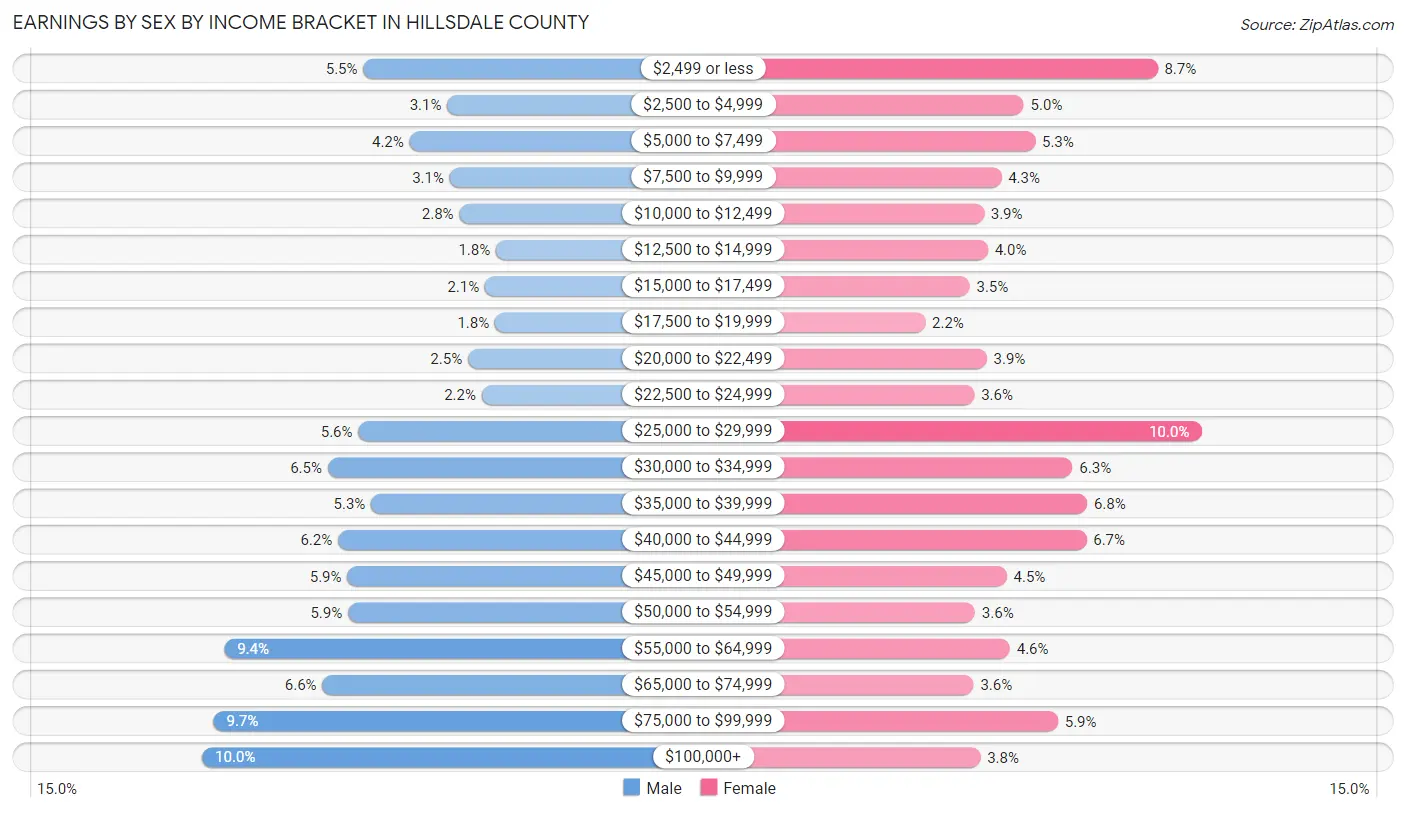
Earnings by Sex by Income Bracket in Hillsdale County
The most common earnings brackets in Hillsdale County are $100,000+ for men (1,176 | 10.0%) and $25,000 to $29,999 for women (1,056 | 10.0%).
| Income | Male | Female |
| $2,499 or less | 644 (5.5%) | 925 (8.7%) |
| $2,500 to $4,999 | 367 (3.1%) | 527 (5.0%) |
| $5,000 to $7,499 | 491 (4.2%) | 561 (5.3%) |
| $7,500 to $9,999 | 359 (3.0%) | 460 (4.3%) |
| $10,000 to $12,499 | 327 (2.8%) | 408 (3.8%) |
| $12,500 to $14,999 | 206 (1.8%) | 420 (4.0%) |
| $15,000 to $17,499 | 242 (2.1%) | 366 (3.5%) |
| $17,500 to $19,999 | 209 (1.8%) | 233 (2.2%) |
| $20,000 to $22,499 | 299 (2.5%) | 417 (3.9%) |
| $22,500 to $24,999 | 253 (2.1%) | 379 (3.6%) |
| $25,000 to $29,999 | 661 (5.6%) | 1,056 (10.0%) |
| $30,000 to $34,999 | 761 (6.5%) | 672 (6.3%) |
| $35,000 to $39,999 | 618 (5.3%) | 715 (6.8%) |
| $40,000 to $44,999 | 727 (6.2%) | 713 (6.7%) |
| $45,000 to $49,999 | 697 (5.9%) | 476 (4.5%) |
| $50,000 to $54,999 | 694 (5.9%) | 382 (3.6%) |
| $55,000 to $64,999 | 1,103 (9.4%) | 486 (4.6%) |
| $65,000 to $74,999 | 779 (6.6%) | 377 (3.6%) |
| $75,000 to $99,999 | 1,139 (9.7%) | 629 (5.9%) |
| $100,000+ | 1,176 (10.0%) | 398 (3.7%) |
| Total | 11,752 (100.0%) | 10,600 (100.0%) |
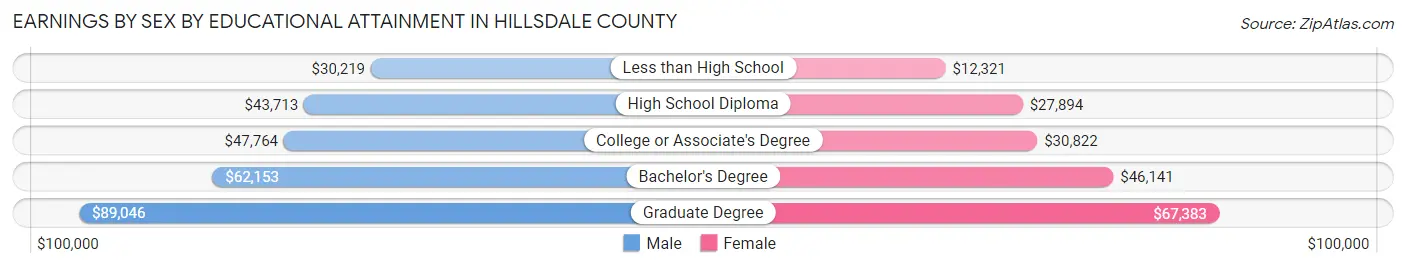
Earnings by Sex by Educational Attainment in Hillsdale County
Average earnings in Hillsdale County are $47,442 for men and $33,143 for women, a difference of 30.1%. Men with an educational attainment of graduate degree enjoy the highest average annual earnings of $89,046, while those with less than high school education earn the least with $30,219. Women with an educational attainment of graduate degree earn the most with the average annual earnings of $67,383, while those with less than high school education have the smallest earnings of $12,321.
| Educational Attainment | Male Income | Female Income |
| Less than High School | $30,219 | $12,321 |
| High School Diploma | $43,713 | $27,894 |
| College or Associate's Degree | $47,764 | $30,822 |
| Bachelor's Degree | $62,153 | $46,141 |
| Graduate Degree | $89,046 | $67,383 |
| Total | $47,442 | $33,143 |
Family Income in Hillsdale County
Family Income Brackets in Hillsdale County
According to the Hillsdale County family income data, there are 2,394 families falling into the $50,000 to $74,999 income range, which is the most common income bracket and makes up 20.8% of all families. Conversely, the $10,000 to $14,999 income bracket is the least frequent group with only 253 families (2.2%) belonging to this category.
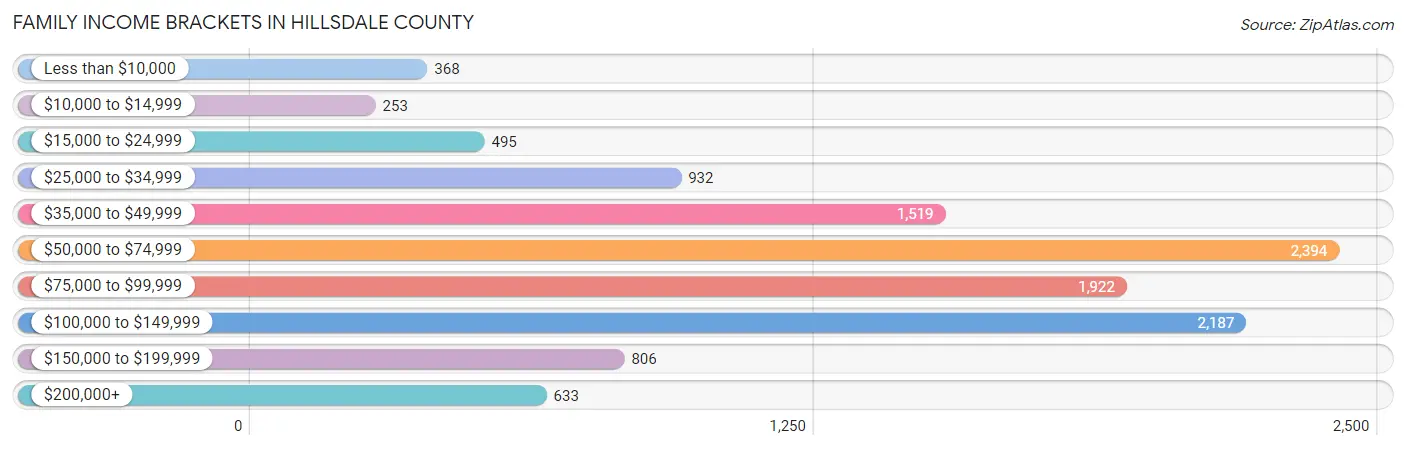
| Income Bracket | # Families | % Families |
| Less than $10,000 | 368 | 3.2% |
| $10,000 to $14,999 | 253 | 2.2% |
| $15,000 to $24,999 | 495 | 4.3% |
| $25,000 to $34,999 | 932 | 8.1% |
| $35,000 to $49,999 | 1,519 | 13.2% |
| $50,000 to $74,999 | 2,394 | 20.8% |
| $75,000 to $99,999 | 1,922 | 16.7% |
| $100,000 to $149,999 | 2,187 | 19.0% |
| $150,000 to $199,999 | 806 | 7.0% |
| $200,000+ | 633 | 5.5% |
Family Income by Famaliy Size in Hillsdale County
6-person families (373 | 3.2%) account for the highest median family income in Hillsdale County with $110,087 per family, while 2-person families (6,000 | 52.1%) have the highest median income of $33,084 per family member.
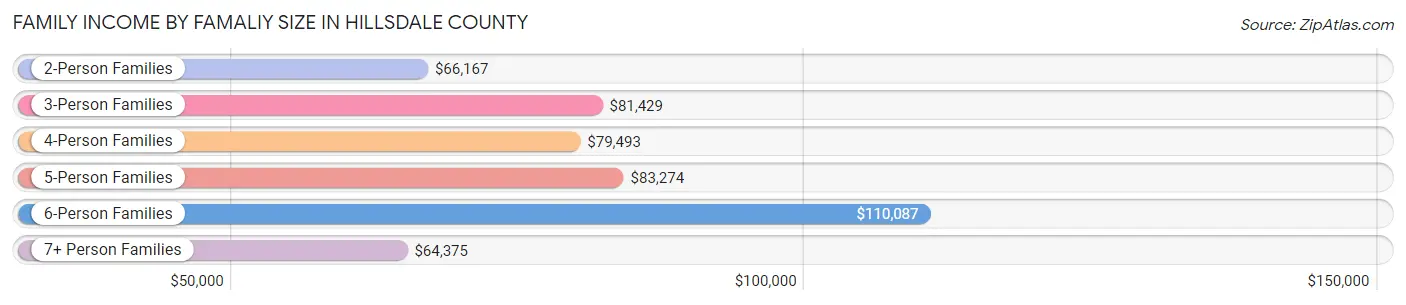
| Income Bracket | # Families | Median Income |
| 2-Person Families | 6,000 (52.1%) | $66,167 |
| 3-Person Families | 2,242 (19.5%) | $81,429 |
| 4-Person Families | 1,608 (14.0%) | $79,493 |
| 5-Person Families | 939 (8.2%) | $83,274 |
| 6-Person Families | 373 (3.2%) | $110,087 |
| 7+ Person Families | 346 (3.0%) | $64,375 |
| Total | 11,508 (100.0%) | $71,224 |
Family Income by Number of Earners in Hillsdale County
The median family income in Hillsdale County is $71,224, with families comprising 3+ earners (1,043) having the highest median family income of $121,332, while families with no earners (2,296) have the lowest median family income of $46,769, accounting for 9.1% and 20.0% of families, respectively.
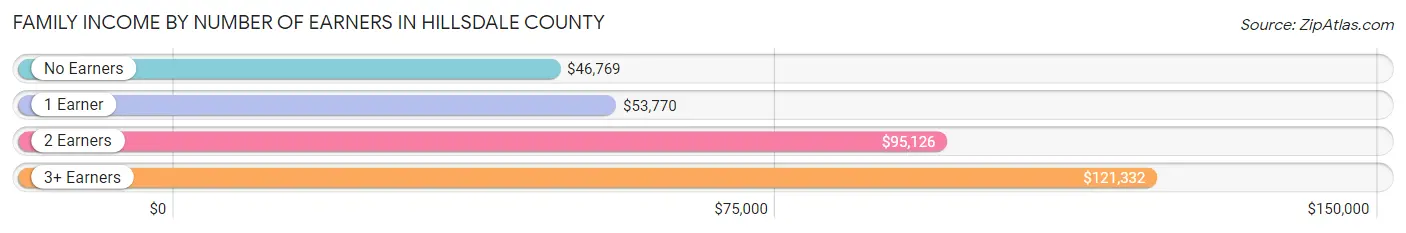
| Number of Earners | # Families | Median Income |
| No Earners | 2,296 (20.0%) | $46,769 |
| 1 Earner | 3,806 (33.1%) | $53,770 |
| 2 Earners | 4,363 (37.9%) | $95,126 |
| 3+ Earners | 1,043 (9.1%) | $121,332 |
| Total | 11,508 (100.0%) | $71,224 |
Household Income in Hillsdale County
Household Income Brackets in Hillsdale County
With 3,574 households falling in the category, the $50,000 to $74,999 income range is the most frequent in Hillsdale County, accounting for 20.3% of all households. In contrast, only 634 households (3.6%) fall into the less than $10,000 income bracket, making it the least populous group.
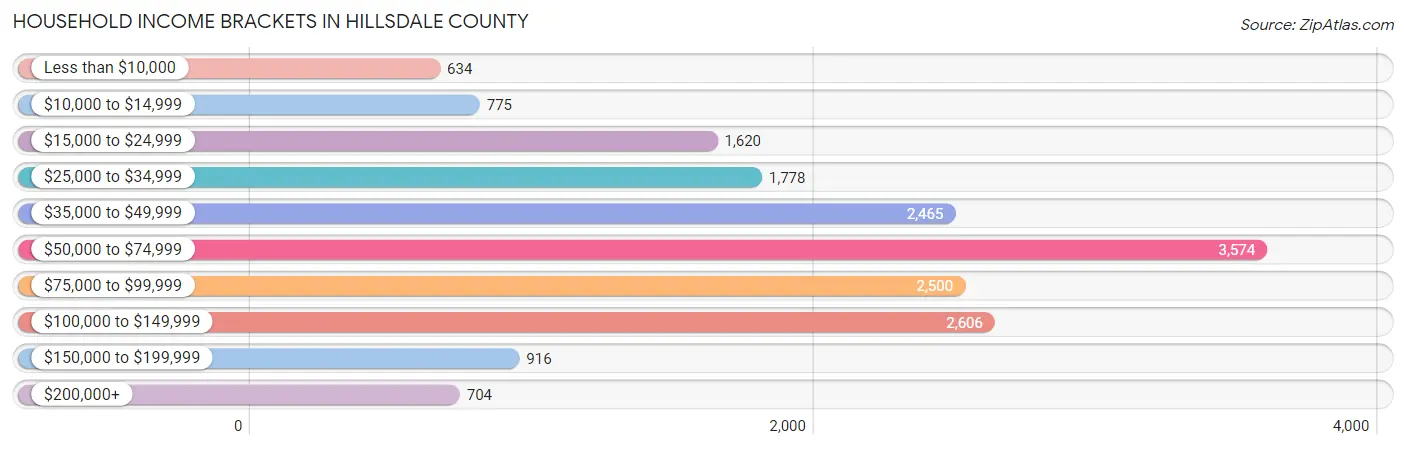
| Income Bracket | # Households | % Households |
| Less than $10,000 | 634 | 3.6% |
| $10,000 to $14,999 | 775 | 4.4% |
| $15,000 to $24,999 | 1,620 | 9.2% |
| $25,000 to $34,999 | 1,778 | 10.1% |
| $35,000 to $49,999 | 2,465 | 14.0% |
| $50,000 to $74,999 | 3,574 | 20.3% |
| $75,000 to $99,999 | 2,500 | 14.2% |
| $100,000 to $149,999 | 2,606 | 14.8% |
| $150,000 to $199,999 | 916 | 5.2% |
| $200,000+ | 704 | 4.0% |
Household Income by Householder Age in Hillsdale County
The median household income in Hillsdale County is $59,425, with the highest median household income of $68,352 found in the 45 to 64 years age bracket for the primary householder. A total of 6,850 households (38.9%) fall into this category. Meanwhile, the 65+ years age bracket for the primary householder has the lowest median household income of $48,204, with 5,751 households (32.7%) in this group.
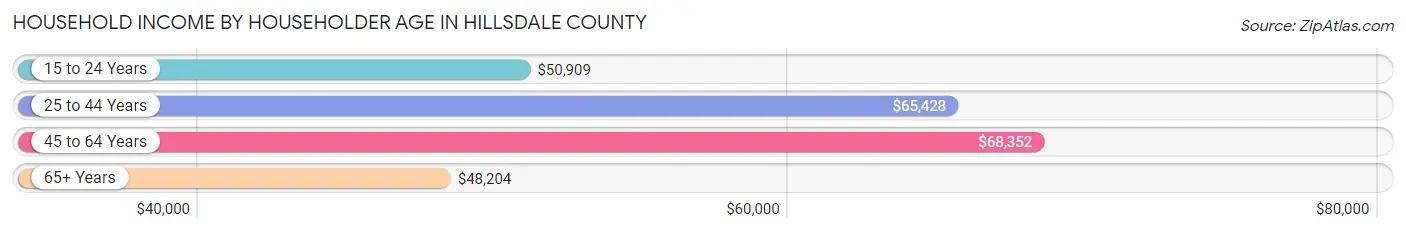
| Income Bracket | # Households | Median Income |
| 15 to 24 Years | 442 (2.5%) | $50,909 |
| 25 to 44 Years | 4,563 (25.9%) | $65,428 |
| 45 to 64 Years | 6,850 (38.9%) | $68,352 |
| 65+ Years | 5,751 (32.7%) | $48,204 |
| Total | 17,606 (100.0%) | $59,425 |
Poverty in Hillsdale County
Income Below Poverty by Sex and Age in Hillsdale County
With 14.7% poverty level for males and 15.6% for females among the residents of Hillsdale County, 15 year old males and under 5 year old females are the most vulnerable to poverty, with 104 males (42.6%) and 348 females (29.2%) in their respective age groups living below the poverty level.
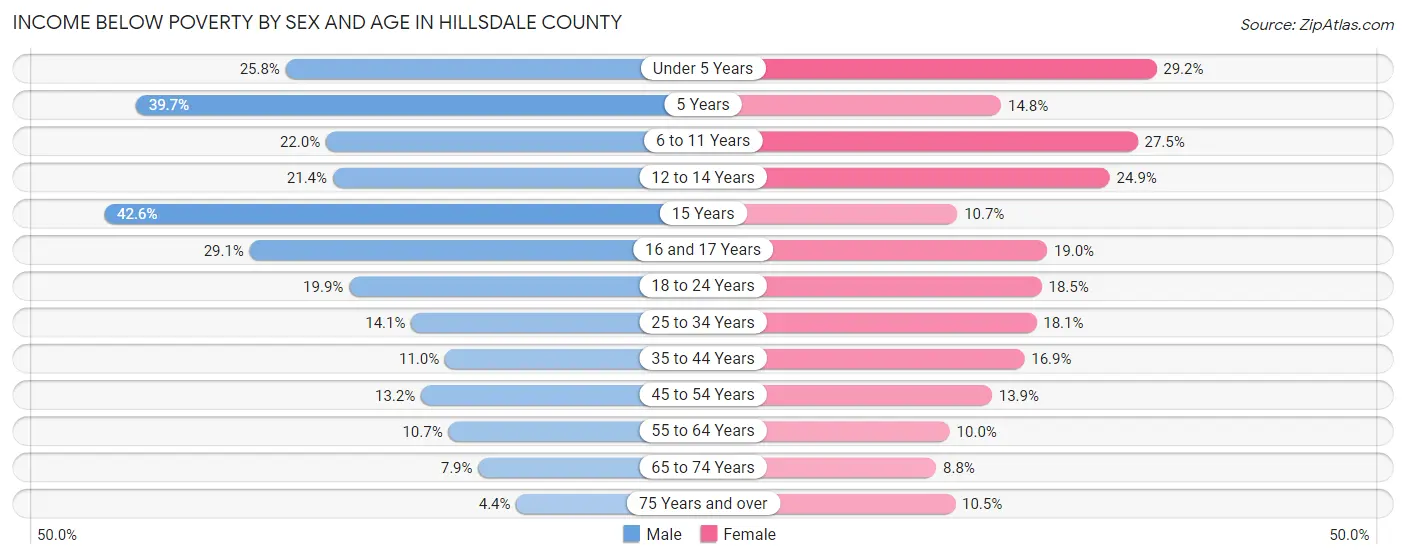
| Age Bracket | Male | Female |
| Under 5 Years | 328 (25.8%) | 348 (29.2%) |
| 5 Years | 100 (39.7%) | 51 (14.8%) |
| 6 to 11 Years | 362 (22.0%) | 414 (27.5%) |
| 12 to 14 Years | 172 (21.4%) | 183 (24.9%) |
| 15 Years | 104 (42.6%) | 36 (10.7%) |
| 16 and 17 Years | 186 (29.1%) | 107 (19.0%) |
| 18 to 24 Years | 343 (19.9%) | 295 (18.5%) |
| 25 to 34 Years | 347 (14.1%) | 419 (18.0%) |
| 35 to 44 Years | 270 (11.0%) | 408 (16.9%) |
| 45 to 54 Years | 374 (13.2%) | 375 (13.9%) |
| 55 to 64 Years | 370 (10.7%) | 347 (10.0%) |
| 65 to 74 Years | 218 (7.9%) | 251 (8.7%) |
| 75 Years and over | 67 (4.4%) | 207 (10.5%) |
| Total | 3,241 (14.7%) | 3,441 (15.6%) |
Income Above Poverty by Sex and Age in Hillsdale County
According to the poverty statistics in Hillsdale County, males aged 75 years and over and females aged 65 to 74 years are the age groups that are most secure financially, with 95.6% of males and 91.2% of females in these age groups living above the poverty line.
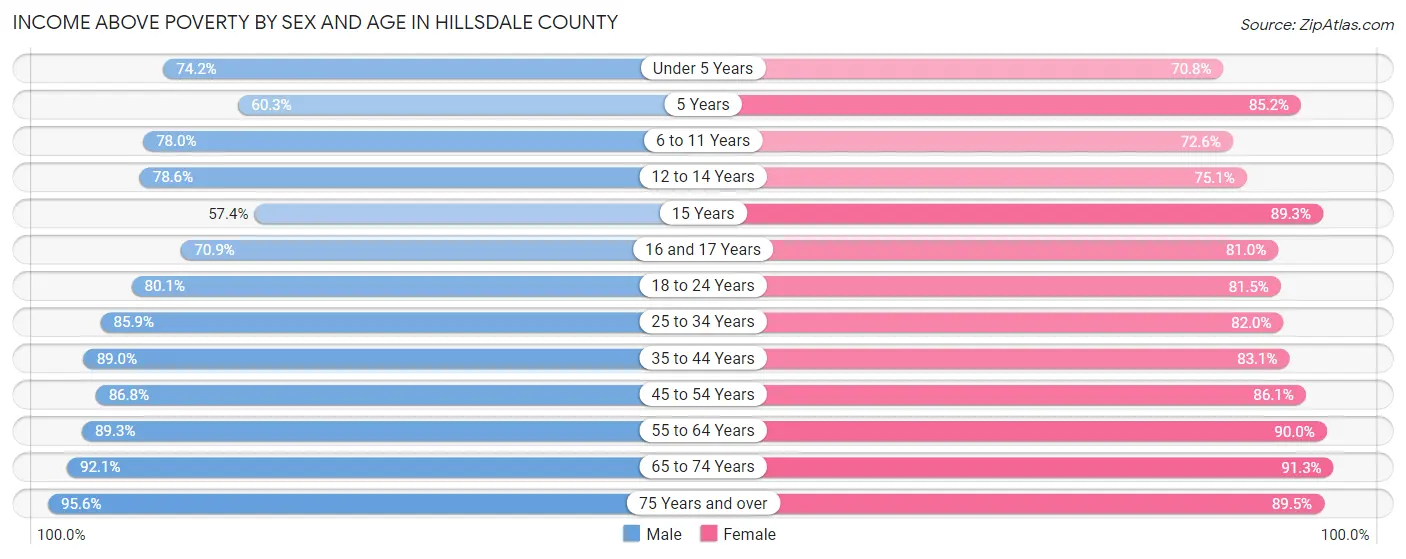
| Age Bracket | Male | Female |
| Under 5 Years | 945 (74.2%) | 844 (70.8%) |
| 5 Years | 152 (60.3%) | 294 (85.2%) |
| 6 to 11 Years | 1,281 (78.0%) | 1,094 (72.6%) |
| 12 to 14 Years | 632 (78.6%) | 553 (75.1%) |
| 15 Years | 140 (57.4%) | 300 (89.3%) |
| 16 and 17 Years | 453 (70.9%) | 455 (81.0%) |
| 18 to 24 Years | 1,382 (80.1%) | 1,296 (81.5%) |
| 25 to 34 Years | 2,113 (85.9%) | 1,902 (82.0%) |
| 35 to 44 Years | 2,188 (89.0%) | 2,001 (83.1%) |
| 45 to 54 Years | 2,458 (86.8%) | 2,318 (86.1%) |
| 55 to 64 Years | 3,100 (89.3%) | 3,119 (90.0%) |
| 65 to 74 Years | 2,544 (92.1%) | 2,617 (91.2%) |
| 75 Years and over | 1,471 (95.6%) | 1,763 (89.5%) |
| Total | 18,859 (85.3%) | 18,556 (84.4%) |
Income Below Poverty Among Married-Couple Families in Hillsdale County
The poverty statistics for married-couple families in Hillsdale County show that 6.0% or 536 of the total 8,992 families live below the poverty line. Families with 5 or more children have the highest poverty rate of 55.1%, comprising of 136 families. On the other hand, families with no children have the lowest poverty rate of 3.8%, which includes 217 families.
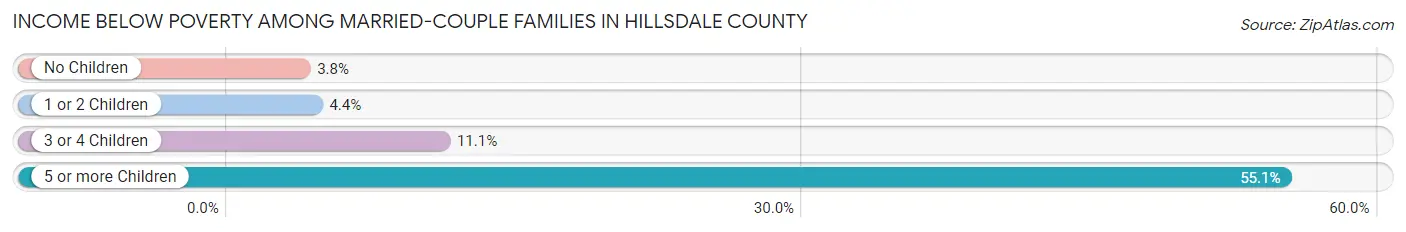
| Children | Above Poverty | Below Poverty |
| No Children | 5,538 (96.2%) | 217 (3.8%) |
| 1 or 2 Children | 2,124 (95.6%) | 98 (4.4%) |
| 3 or 4 Children | 683 (88.9%) | 85 (11.1%) |
| 5 or more Children | 111 (44.9%) | 136 (55.1%) |
| Total | 8,456 (94.0%) | 536 (6.0%) |
Income Below Poverty Among Single-Parent Households in Hillsdale County
According to the poverty data in Hillsdale County, 14.8% or 121 single-father households and 29.8% or 506 single-mother households are living below the poverty line. Among single-father households, those with 3 or 4 children have the highest poverty rate, with 18 households (26.9%) experiencing poverty. Likewise, among single-mother households, those with 5 or more children have the highest poverty rate, with 21 households (100.0%) falling below the poverty line.
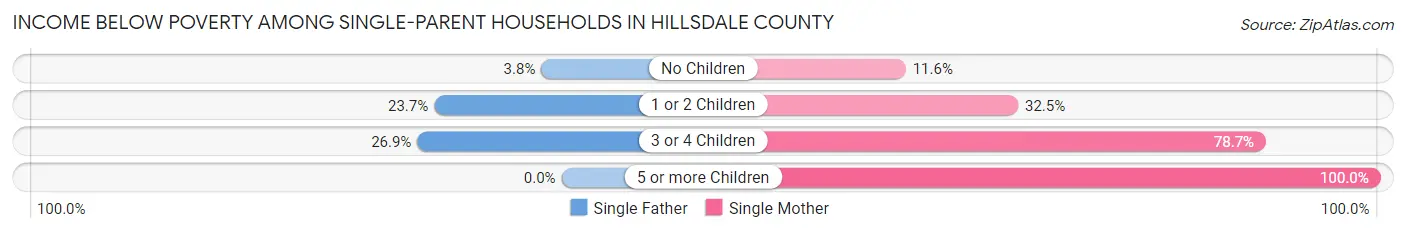
| Children | Single Father | Single Mother |
| No Children | 14 (3.8%) | 78 (11.6%) |
| 1 or 2 Children | 89 (23.7%) | 267 (32.5%) |
| 3 or 4 Children | 18 (26.9%) | 140 (78.6%) |
| 5 or more Children | 0 (0.0%) | 21 (100.0%) |
| Total | 121 (14.8%) | 506 (29.8%) |
Income Below Poverty Among Married-Couple vs Single-Parent Households in Hillsdale County
The poverty data for Hillsdale County shows that 536 of the married-couple family households (6.0%) and 627 of the single-parent households (24.9%) are living below the poverty level. Within the married-couple family households, those with 5 or more children have the highest poverty rate, with 136 households (55.1%) falling below the poverty line. Among the single-parent households, those with 5 or more children have the highest poverty rate, with 21 household (75.0%) living below poverty.
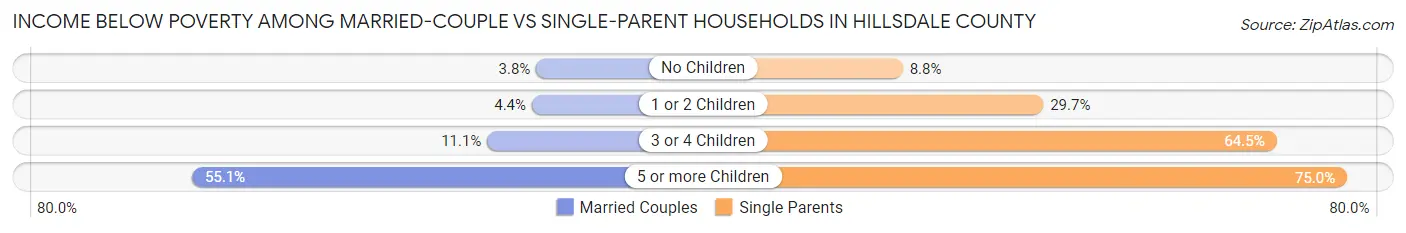
| Children | Married-Couple Families | Single-Parent Households |
| No Children | 217 (3.8%) | 92 (8.8%) |
| 1 or 2 Children | 98 (4.4%) | 356 (29.7%) |
| 3 or 4 Children | 85 (11.1%) | 158 (64.5%) |
| 5 or more Children | 136 (55.1%) | 21 (75.0%) |
| Total | 536 (6.0%) | 627 (24.9%) |
Race in Hillsdale County
The most populous races in Hillsdale County are White / Caucasian (43,428 | 95.0%), Two or more Races (1,360 | 3.0%), and Hispanic or Latino (1,204 | 2.6%).
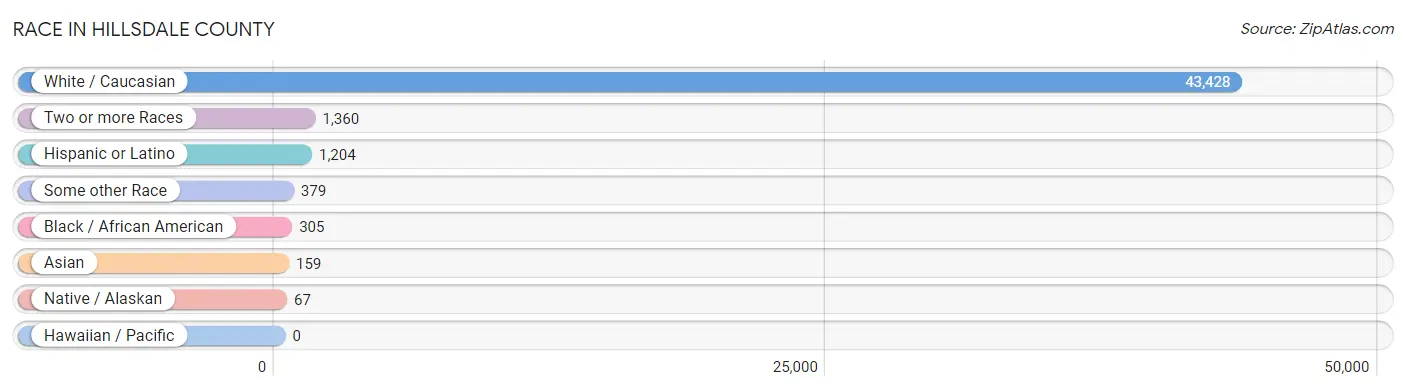
| Race | # Population | % Population |
| Asian | 159 | 0.4% |
| Black / African American | 305 | 0.7% |
| Hawaiian / Pacific | 0 | 0.0% |
| Hispanic or Latino | 1,204 | 2.6% |
| Native / Alaskan | 67 | 0.2% |
| White / Caucasian | 43,428 | 95.0% |
| Two or more Races | 1,360 | 3.0% |
| Some other Race | 379 | 0.8% |
| Total | 45,698 | 100.0% |
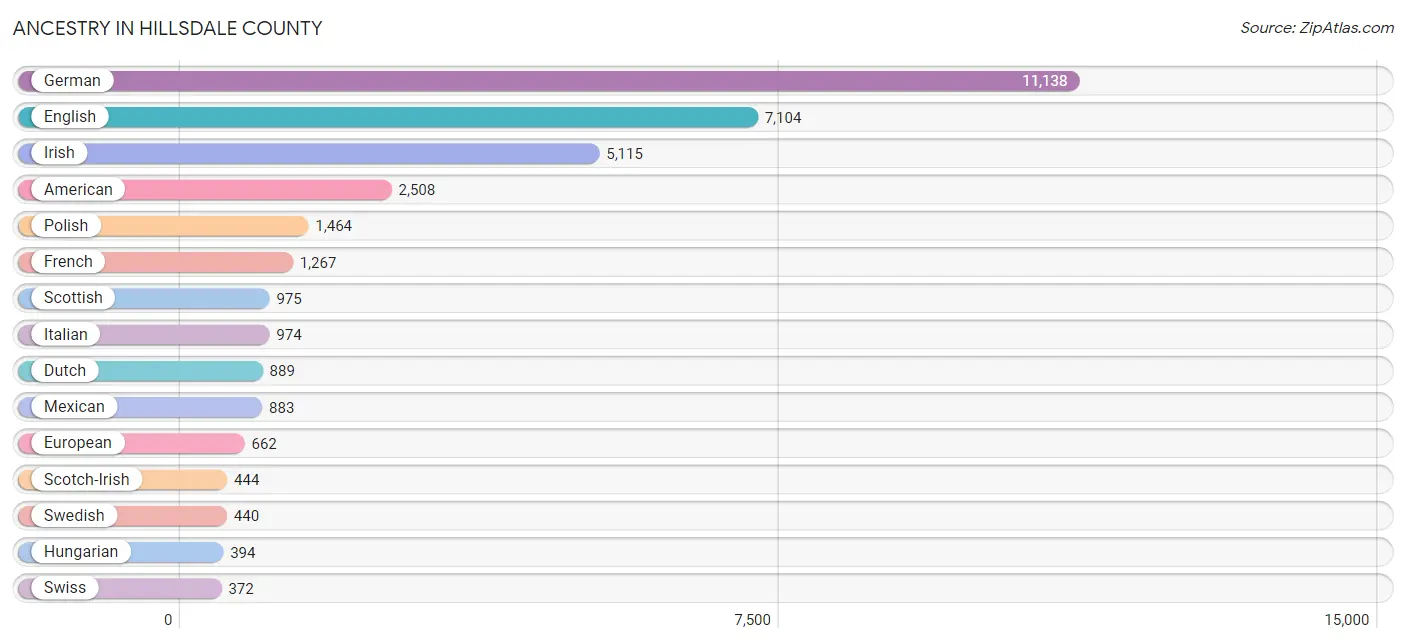
Ancestry in Hillsdale County
The most populous ancestries reported in Hillsdale County are German (11,138 | 24.4%), English (7,104 | 15.5%), Irish (5,115 | 11.2%), American (2,508 | 5.5%), and Polish (1,464 | 3.2%), together accounting for 59.8% of all Hillsdale County residents.
| Ancestry | # Population | % Population |
| African | 20 | 0.0% |
| Albanian | 10 | 0.0% |
| Aleut | 2 | 0.0% |
| Alsatian | 12 | 0.0% |
| American | 2,508 | 5.5% |
| Apache | 3 | 0.0% |
| Arab | 135 | 0.3% |
| Austrian | 52 | 0.1% |
| Belgian | 35 | 0.1% |
| Bhutanese | 19 | 0.0% |
| Blackfeet | 39 | 0.1% |
| Bolivian | 13 | 0.0% |
| British | 147 | 0.3% |
| Burmese | 10 | 0.0% |
| Canadian | 176 | 0.4% |
| Central American | 22 | 0.1% |
| Central American Indian | 1 | 0.0% |
| Cherokee | 140 | 0.3% |
| Chilean | 12 | 0.0% |
| Chippewa | 80 | 0.2% |
| Choctaw | 9 | 0.0% |
| Costa Rican | 15 | 0.0% |
| Croatian | 16 | 0.0% |
| Cuban | 71 | 0.2% |
| Czech | 56 | 0.1% |
| Czechoslovakian | 8 | 0.0% |
| Danish | 143 | 0.3% |
| Dominican | 3 | 0.0% |
| Dutch | 889 | 1.9% |
| Eastern European | 68 | 0.2% |
| Ecuadorian | 10 | 0.0% |
| English | 7,104 | 15.5% |
| European | 662 | 1.5% |
| Finnish | 68 | 0.2% |
| French | 1,267 | 2.8% |
| French Canadian | 316 | 0.7% |
| German | 11,138 | 24.4% |
| German Russian | 9 | 0.0% |
| Greek | 154 | 0.3% |
| Guatemalan | 3 | 0.0% |
| Hungarian | 394 | 0.9% |
| Indian (Asian) | 139 | 0.3% |
| Iranian | 30 | 0.1% |
| Irish | 5,115 | 11.2% |
| Iroquois | 31 | 0.1% |
| Israeli | 22 | 0.1% |
| Italian | 974 | 2.1% |
| Jamaican | 5 | 0.0% |
| Korean | 151 | 0.3% |
| Lebanese | 118 | 0.3% |
| Lithuanian | 127 | 0.3% |
| Macedonian | 7 | 0.0% |
| Maltese | 20 | 0.0% |
| Mexican | 883 | 1.9% |
| Mexican American Indian | 19 | 0.0% |
| Navajo | 15 | 0.0% |
| Northern European | 95 | 0.2% |
| Norwegian | 345 | 0.7% |
| Ottawa | 5 | 0.0% |
| Pakistani | 13 | 0.0% |
| Panamanian | 4 | 0.0% |
| Pennsylvania German | 98 | 0.2% |
| Polish | 1,464 | 3.2% |
| Portuguese | 21 | 0.1% |
| Potawatomi | 107 | 0.2% |
| Puerto Rican | 141 | 0.3% |
| Romanian | 4 | 0.0% |
| Russian | 123 | 0.3% |
| Scandinavian | 86 | 0.2% |
| Scotch-Irish | 444 | 1.0% |
| Scottish | 975 | 2.1% |
| Shoshone | 2 | 0.0% |
| Sioux | 11 | 0.0% |
| Slavic | 49 | 0.1% |
| Slovak | 39 | 0.1% |
| Slovene | 3 | 0.0% |
| South American | 35 | 0.1% |
| Spaniard | 5 | 0.0% |
| Spanish | 33 | 0.1% |
| Sri Lankan | 26 | 0.1% |
| Subsaharan African | 20 | 0.0% |
| Swedish | 440 | 1.0% |
| Swiss | 372 | 0.8% |
| Thai | 17 | 0.0% |
| Ukrainian | 69 | 0.2% |
| Welsh | 254 | 0.6% |
| West Indian | 4 | 0.0% |
| Yup'ik | 3 | 0.0% | View All 88 Rows |
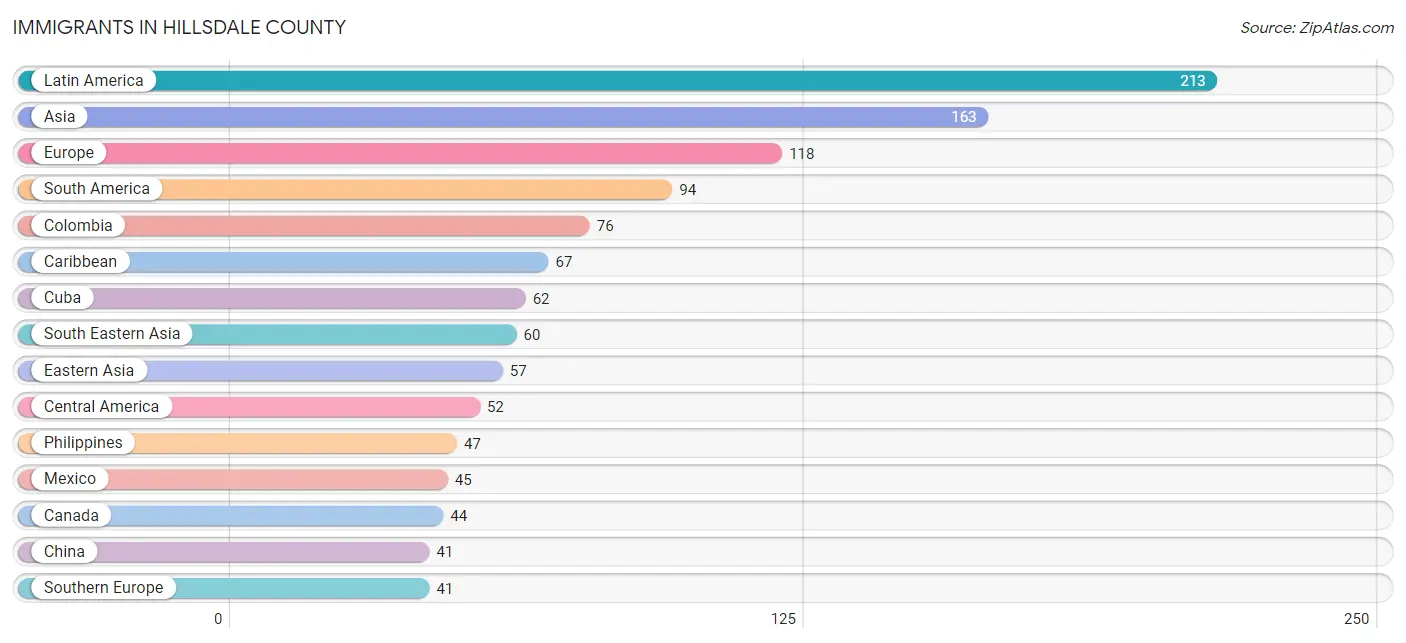
Immigrants in Hillsdale County
The most numerous immigrant groups reported in Hillsdale County came from Latin America (213 | 0.5%), Asia (163 | 0.4%), Europe (118 | 0.3%), South America (94 | 0.2%), and Colombia (76 | 0.2%), together accounting for 1.5% of all Hillsdale County residents.
| Immigration Origin | # Population | % Population |
| Africa | 25 | 0.1% |
| Albania | 1 | 0.0% |
| Asia | 163 | 0.4% |
| Azores | 11 | 0.0% |
| Brazil | 4 | 0.0% |
| Canada | 44 | 0.1% |
| Caribbean | 67 | 0.2% |
| Central America | 52 | 0.1% |
| China | 41 | 0.1% |
| Colombia | 76 | 0.2% |
| Costa Rica | 7 | 0.0% |
| Cuba | 62 | 0.1% |
| Czechoslovakia | 4 | 0.0% |
| Eastern Africa | 25 | 0.1% |
| Eastern Asia | 57 | 0.1% |
| Eastern Europe | 16 | 0.0% |
| England | 27 | 0.1% |
| Ethiopia | 10 | 0.0% |
| Europe | 118 | 0.3% |
| Germany | 29 | 0.1% |
| Greece | 7 | 0.0% |
| India | 6 | 0.0% |
| Iran | 16 | 0.0% |
| Ireland | 3 | 0.0% |
| Israel | 22 | 0.1% |
| Jamaica | 5 | 0.0% |
| Japan | 7 | 0.0% |
| Kenya | 15 | 0.0% |
| Korea | 9 | 0.0% |
| Latin America | 213 | 0.5% |
| Lithuania | 1 | 0.0% |
| Mexico | 45 | 0.1% |
| Moldova | 6 | 0.0% |
| Northern Europe | 32 | 0.1% |
| Philippines | 47 | 0.1% |
| Portugal | 29 | 0.1% |
| Russia | 4 | 0.0% |
| South America | 94 | 0.2% |
| South Central Asia | 22 | 0.1% |
| South Eastern Asia | 60 | 0.1% |
| Southern Europe | 41 | 0.1% |
| Spain | 5 | 0.0% |
| Thailand | 12 | 0.0% |
| Venezuela | 14 | 0.0% |
| Vietnam | 1 | 0.0% |
| Western Asia | 24 | 0.1% |
| Western Europe | 29 | 0.1% |
| Yemen | 2 | 0.0% | View All 48 Rows |
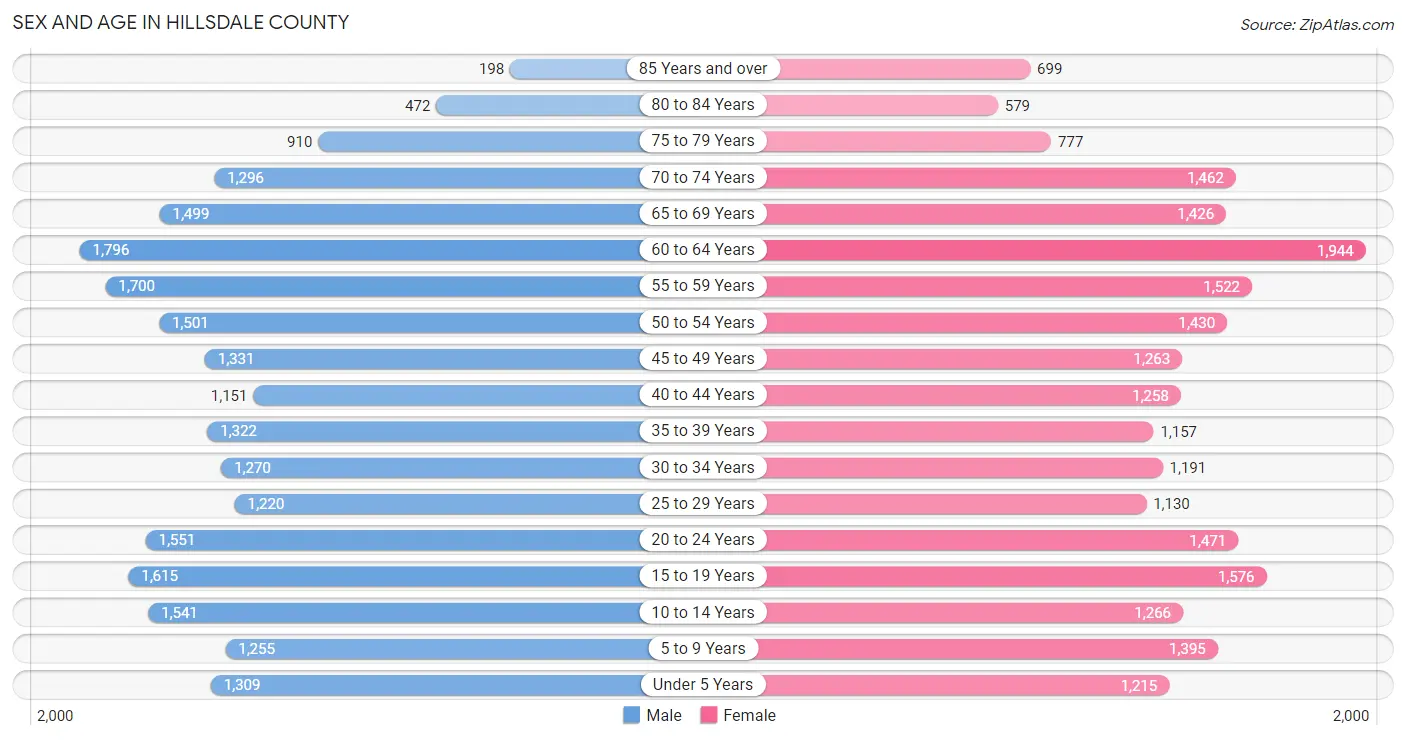
Sex and Age in Hillsdale County
Sex and Age in Hillsdale County
The most populous age groups in Hillsdale County are 60 to 64 Years (1,796 | 7.8%) for men and 60 to 64 Years (1,944 | 8.5%) for women.
| Age Bracket | Male | Female |
| Under 5 Years | 1,309 (5.7%) | 1,215 (5.3%) |
| 5 to 9 Years | 1,255 (5.5%) | 1,395 (6.1%) |
| 10 to 14 Years | 1,541 (6.7%) | 1,266 (5.6%) |
| 15 to 19 Years | 1,615 (7.0%) | 1,576 (6.9%) |
| 20 to 24 Years | 1,551 (6.8%) | 1,471 (6.5%) |
| 25 to 29 Years | 1,220 (5.3%) | 1,130 (5.0%) |
| 30 to 34 Years | 1,270 (5.5%) | 1,191 (5.2%) |
| 35 to 39 Years | 1,322 (5.8%) | 1,157 (5.1%) |
| 40 to 44 Years | 1,151 (5.0%) | 1,258 (5.5%) |
| 45 to 49 Years | 1,331 (5.8%) | 1,263 (5.6%) |
| 50 to 54 Years | 1,501 (6.5%) | 1,430 (6.3%) |
| 55 to 59 Years | 1,700 (7.4%) | 1,522 (6.7%) |
| 60 to 64 Years | 1,796 (7.8%) | 1,944 (8.5%) |
| 65 to 69 Years | 1,499 (6.5%) | 1,426 (6.3%) |
| 70 to 74 Years | 1,296 (5.7%) | 1,462 (6.4%) |
| 75 to 79 Years | 910 (4.0%) | 777 (3.4%) |
| 80 to 84 Years | 472 (2.1%) | 579 (2.5%) |
| 85 Years and over | 198 (0.9%) | 699 (3.1%) |
| Total | 22,937 (100.0%) | 22,761 (100.0%) |
Families and Households in Hillsdale County
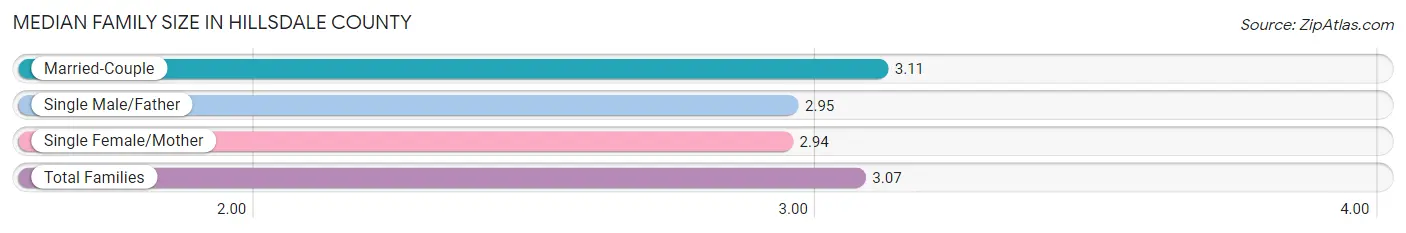
Median Family Size in Hillsdale County
The median family size in Hillsdale County is 3.07 persons per family, with married-couple families (8,992 | 78.1%) accounting for the largest median family size of 3.11 persons per family. On the other hand, single female/mother families (1,696 | 14.7%) represent the smallest median family size with 2.94 persons per family.
| Family Type | # Families | Family Size |
| Married-Couple | 8,992 (78.1%) | 3.11 |
| Single Male/Father | 820 (7.1%) | 2.95 |
| Single Female/Mother | 1,696 (14.7%) | 2.94 |
| Total Families | 11,508 (100.0%) | 3.07 |
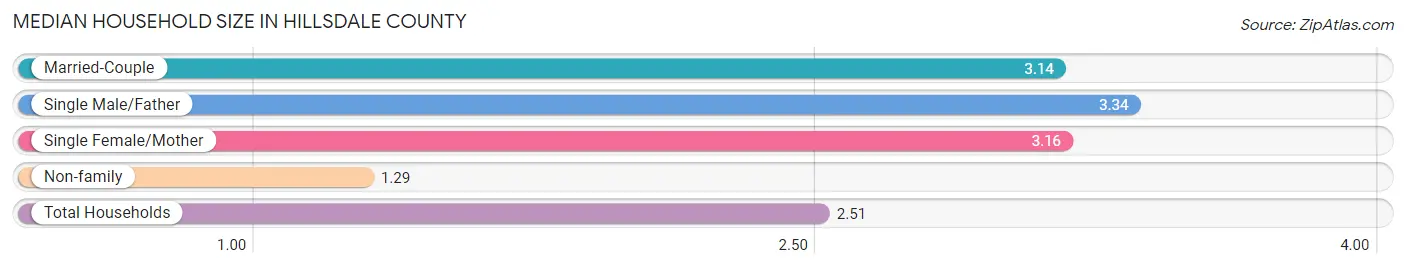
Median Household Size in Hillsdale County
The median household size in Hillsdale County is 2.51 persons per household, with single male/father households (820 | 4.7%) accounting for the largest median household size of 3.34 persons per household. non-family households (6,098 | 34.6%) represent the smallest median household size with 1.29 persons per household.
| Household Type | # Households | Household Size |
| Married-Couple | 8,992 (51.1%) | 3.14 |
| Single Male/Father | 820 (4.7%) | 3.34 |
| Single Female/Mother | 1,696 (9.6%) | 3.16 |
| Non-family | 6,098 (34.6%) | 1.29 |
| Total Households | 17,606 (100.0%) | 2.51 |
Household Size by Marriage Status in Hillsdale County
Out of a total of 17,606 households in Hillsdale County, 11,508 (65.4%) are family households, while 6,098 (34.6%) are nonfamily households. The most numerous type of family households are 2-person households, comprising 5,685, and the most common type of nonfamily households are 1-person households, comprising 4,899.
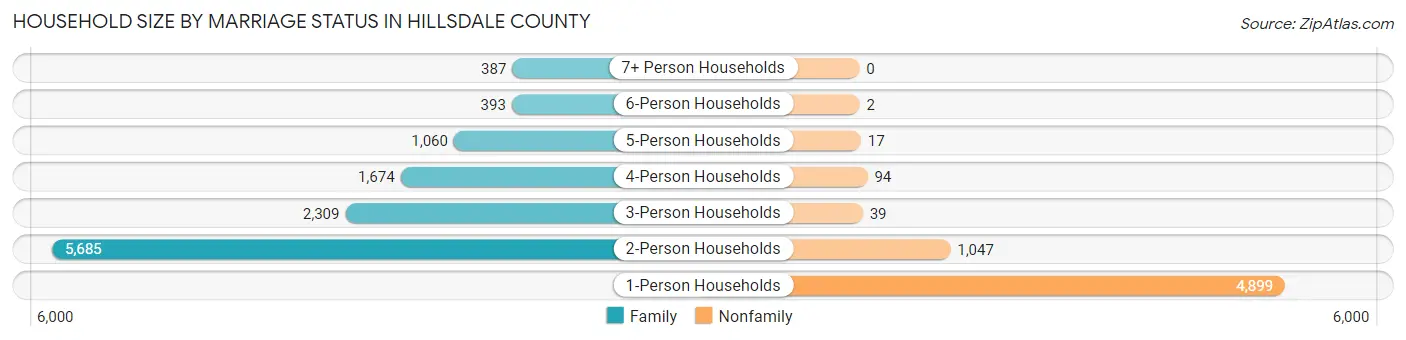
| Household Size | Family Households | Nonfamily Households |
| 1-Person Households | - | 4,899 (27.8%) |
| 2-Person Households | 5,685 (32.3%) | 1,047 (5.9%) |
| 3-Person Households | 2,309 (13.1%) | 39 (0.2%) |
| 4-Person Households | 1,674 (9.5%) | 94 (0.5%) |
| 5-Person Households | 1,060 (6.0%) | 17 (0.1%) |
| 6-Person Households | 393 (2.2%) | 2 (0.0%) |
| 7+ Person Households | 387 (2.2%) | 0 (0.0%) |
| Total | 11,508 (65.4%) | 6,098 (34.6%) |
Female Fertility in Hillsdale County
Fertility by Age in Hillsdale County
Average fertility rate in Hillsdale County is 60.0 births per 1,000 women. Women in the age bracket of 20 to 34 years have the highest fertility rate with 95.0 births per 1,000 women. Women in the age bracket of 20 to 34 years acount for 64.3% of all women with births.
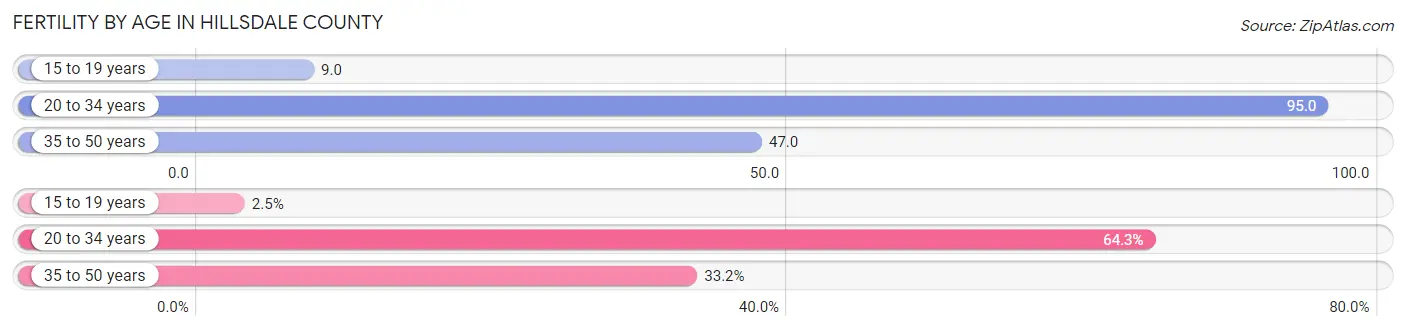
| Age Bracket | Women with Births | Births / 1,000 Women |
| 15 to 19 years | 14 (2.5%) | 9.0 |
| 20 to 34 years | 360 (64.3%) | 95.0 |
| 35 to 50 years | 186 (33.2%) | 47.0 |
| Total | 560 (100.0%) | 60.0 |
Fertility by Age by Marriage Status in Hillsdale County
65.9% of women with births (560) in Hillsdale County are married. The highest percentage of unmarried women with births falls into 15 to 19 years age bracket with 100.0% of them unmarried at the time of birth, while the lowest percentage of unmarried women with births belong to 35 to 50 years age bracket with 26.3% of them unmarried.
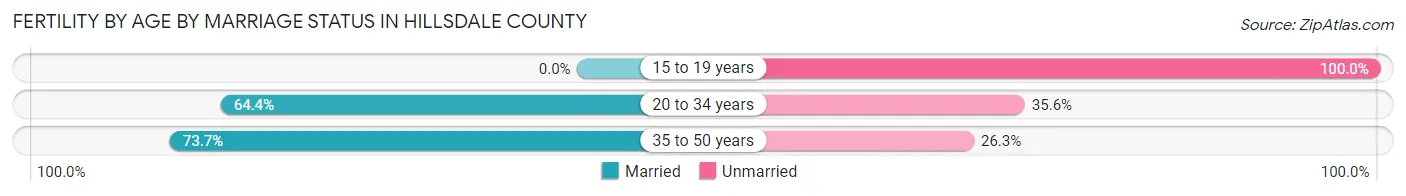
| Age Bracket | Married | Unmarried |
| 15 to 19 years | 0 (0.0%) | 14 (100.0%) |
| 20 to 34 years | 232 (64.4%) | 128 (35.6%) |
| 35 to 50 years | 137 (73.7%) | 49 (26.3%) |
| Total | 369 (65.9%) | 191 (34.1%) |
Fertility by Education in Hillsdale County
Average fertility rate in Hillsdale County is 60.0 births per 1,000 women. Women with the education attainment of high school diploma have the highest fertility rate of 65.0 births per 1,000 women, while women with the education attainment of graduate degree have the lowest fertility at 17.0 births per 1,000 women. Women with the education attainment of college or associate's degree represent 36.8% of all women with births.
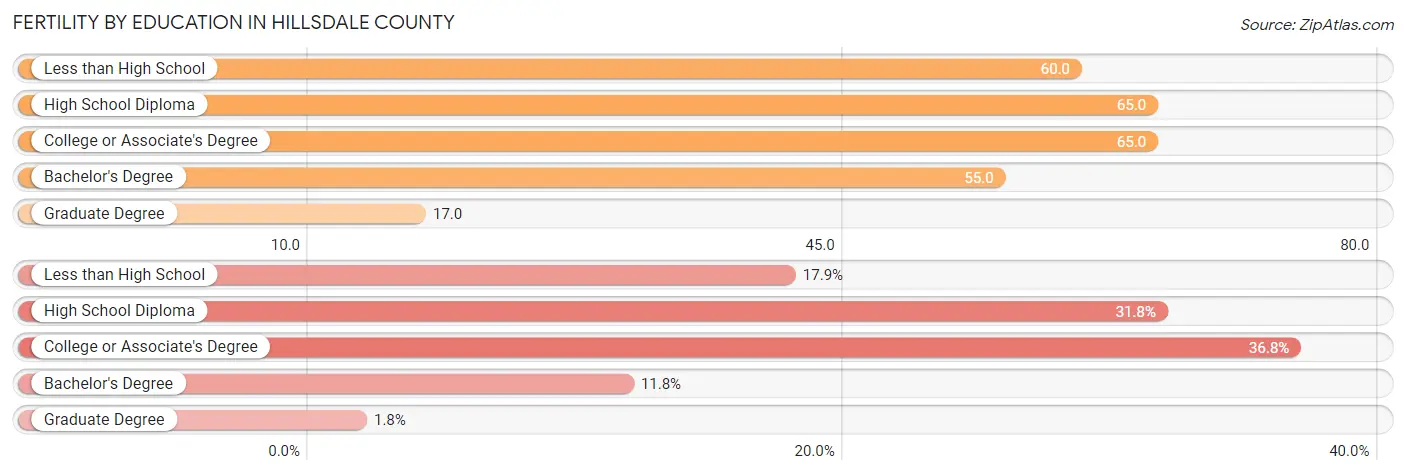
| Educational Attainment | Women with Births | Births / 1,000 Women |
| Less than High School | 100 (17.9%) | 60.0 |
| High School Diploma | 178 (31.8%) | 65.0 |
| College or Associate's Degree | 206 (36.8%) | 65.0 |
| Bachelor's Degree | 66 (11.8%) | 55.0 |
| Graduate Degree | 10 (1.8%) | 17.0 |
| Total | 560 (100.0%) | 60.0 |
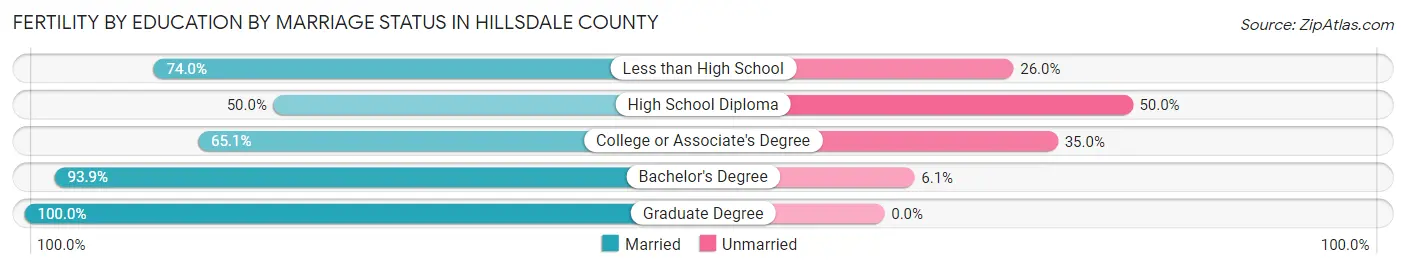
Fertility by Education by Marriage Status in Hillsdale County
34.1% of women with births in Hillsdale County are unmarried. Women with the educational attainment of graduate degree are most likely to be married with 100.0% of them married at childbirth, while women with the educational attainment of high school diploma are least likely to be married with 50.0% of them unmarried at childbirth.
| Educational Attainment | Married | Unmarried |
| Less than High School | 74 (74.0%) | 26 (26.0%) |
| High School Diploma | 89 (50.0%) | 89 (50.0%) |
| College or Associate's Degree | 134 (65.0%) | 72 (34.9%) |
| Bachelor's Degree | 62 (93.9%) | 4 (6.1%) |
| Graduate Degree | 10 (100.0%) | 0 (0.0%) |
| Total | 369 (65.9%) | 191 (34.1%) |
Employment Characteristics in Hillsdale County
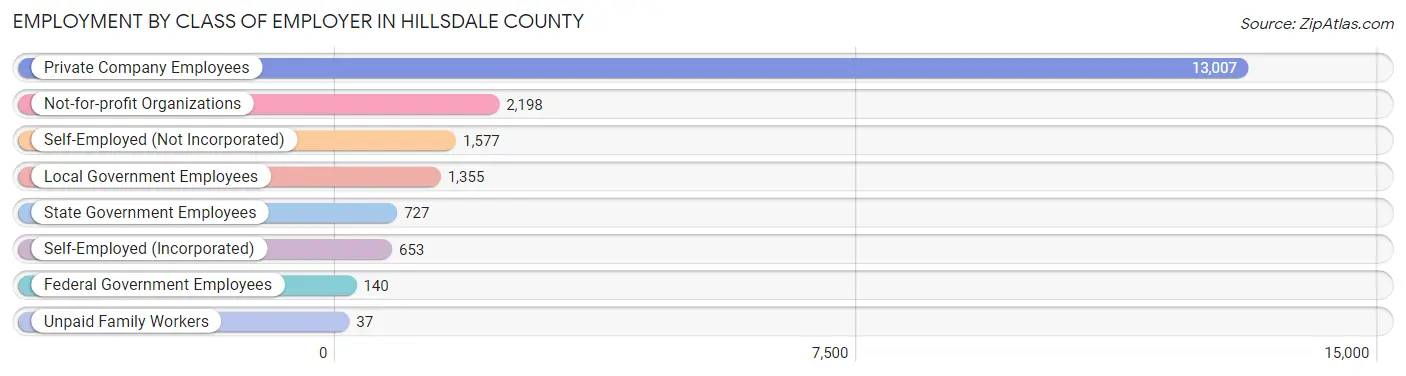
Employment by Class of Employer in Hillsdale County
Among the 19,694 employed individuals in Hillsdale County, private company employees (13,007 | 66.0%), not-for-profit organizations (2,198 | 11.2%), and self-employed (not incorporated) (1,577 | 8.0%) make up the most common classes of employment.
| Employer Class | # Employees | % Employees |
| Private Company Employees | 13,007 | 66.0% |
| Self-Employed (Incorporated) | 653 | 3.3% |
| Self-Employed (Not Incorporated) | 1,577 | 8.0% |
| Not-for-profit Organizations | 2,198 | 11.2% |
| Local Government Employees | 1,355 | 6.9% |
| State Government Employees | 727 | 3.7% |
| Federal Government Employees | 140 | 0.7% |
| Unpaid Family Workers | 37 | 0.2% |
| Total | 19,694 | 100.0% |
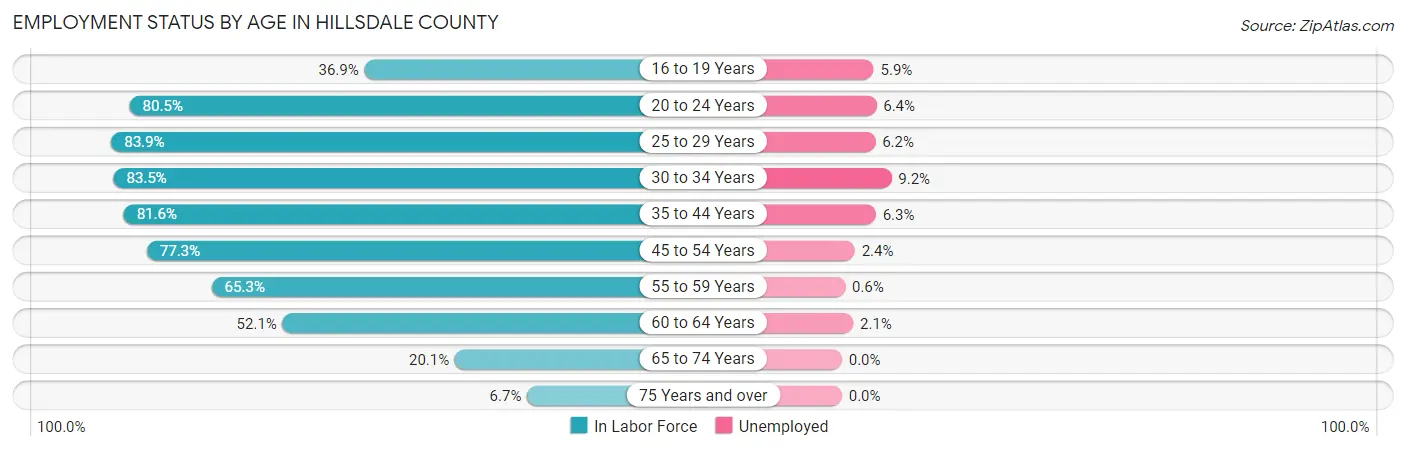
Employment Status by Age in Hillsdale County
According to the labor force statistics for Hillsdale County, out of the total population over 16 years of age (37,133), 56.9% or 21,129 individuals are in the labor force, with 4.4% or 930 of them unemployed. The age group with the highest labor force participation rate is 25 to 29 years, with 83.9% or 1,972 individuals in the labor force. Within the labor force, the 30 to 34 years age range has the highest percentage of unemployed individuals, with 9.2% or 189 of them being unemployed.
| Age Bracket | In Labor Force | Unemployed |
| 16 to 19 Years | 962 (36.9%) | 57 (5.9%) |
| 20 to 24 Years | 2,433 (80.5%) | 156 (6.4%) |
| 25 to 29 Years | 1,972 (83.9%) | 122 (6.2%) |
| 30 to 34 Years | 2,055 (83.5%) | 189 (9.2%) |
| 35 to 44 Years | 3,989 (81.6%) | 251 (6.3%) |
| 45 to 54 Years | 4,271 (77.3%) | 103 (2.4%) |
| 55 to 59 Years | 2,104 (65.3%) | 13 (0.6%) |
| 60 to 64 Years | 1,949 (52.1%) | 41 (2.1%) |
| 65 to 74 Years | 1,142 (20.1%) | 0 (0.0%) |
| 75 Years and over | 244 (6.7%) | 0 (0.0%) |
| Total | 21,129 (56.9%) | 930 (4.4%) |
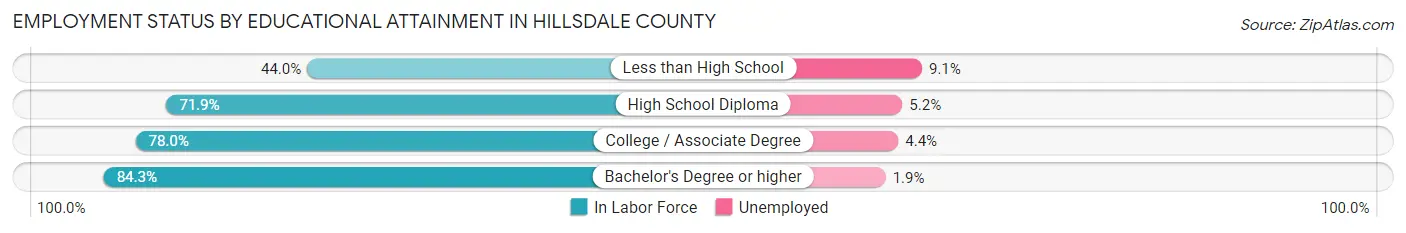
Employment Status by Educational Attainment in Hillsdale County
According to labor force statistics for Hillsdale County, 73.6% of individuals (16,329) out of the total population between 25 and 64 years of age (22,186) are in the labor force, with 4.4% or 718 of them being unemployed. The group with the highest labor force participation rate are those with the educational attainment of bachelor's degree or higher, with 84.3% or 3,779 individuals in the labor force. Within the labor force, individuals with less than high school education have the highest percentage of unemployment, with 9.1% or 85 of them being unemployed.
| Educational Attainment | In Labor Force | Unemployed |
| Less than High School | 935 (44.0%) | 193 (9.1%) |
| High School Diploma | 6,163 (71.9%) | 446 (5.2%) |
| College / Associate Degree | 5,464 (78.0%) | 308 (4.4%) |
| Bachelor's Degree or higher | 3,779 (84.3%) | 85 (1.9%) |
| Total | 16,329 (73.6%) | 976 (4.4%) |
Employment Occupations by Sex in Hillsdale County
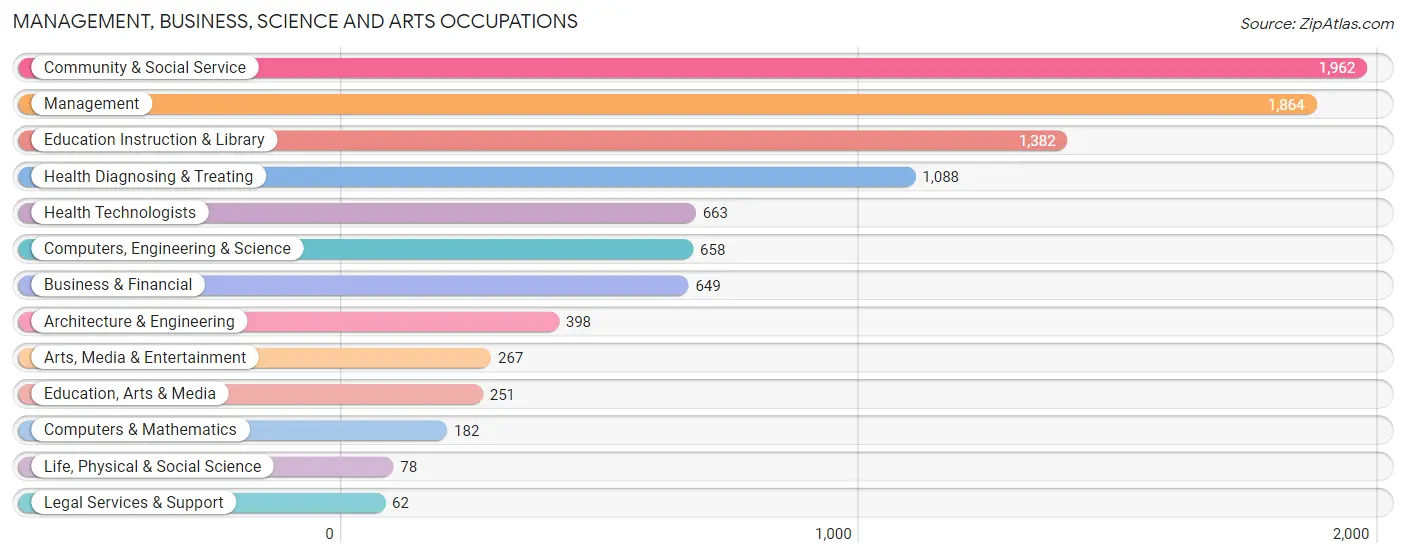
Management, Business, Science and Arts Occupations
The most common Management, Business, Science and Arts occupations in Hillsdale County are Community & Social Service (1,962 | 9.7%), Management (1,864 | 9.2%), Education Instruction & Library (1,382 | 6.9%), Health Diagnosing & Treating (1,088 | 5.4%), and Health Technologists (663 | 3.3%).
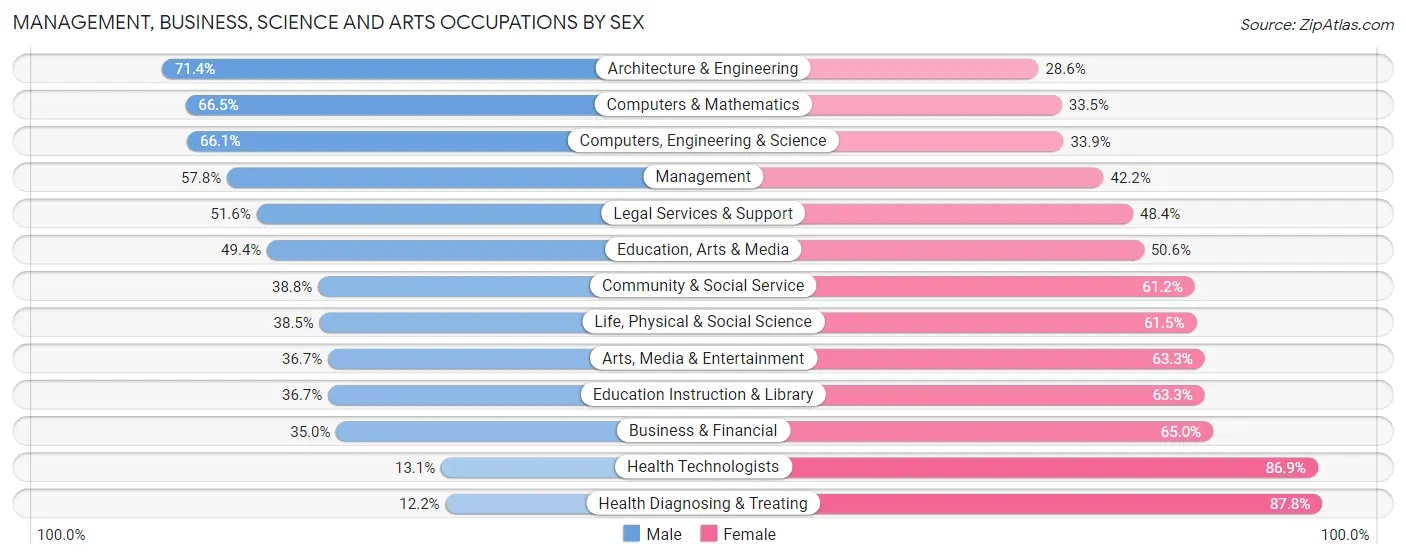
Management, Business, Science and Arts Occupations by Sex
Within the Management, Business, Science and Arts occupations in Hillsdale County, the most male-oriented occupations are Architecture & Engineering (71.4%), Computers & Mathematics (66.5%), and Computers, Engineering & Science (66.1%), while the most female-oriented occupations are Health Diagnosing & Treating (87.8%), Health Technologists (86.9%), and Business & Financial (65.0%).
| Occupation | Male | Female |
| Management | 1,077 (57.8%) | 787 (42.2%) |
| Business & Financial | 227 (35.0%) | 422 (65.0%) |
| Computers, Engineering & Science | 435 (66.1%) | 223 (33.9%) |
| Computers & Mathematics | 121 (66.5%) | 61 (33.5%) |
| Architecture & Engineering | 284 (71.4%) | 114 (28.6%) |
| Life, Physical & Social Science | 30 (38.5%) | 48 (61.5%) |
| Community & Social Service | 761 (38.8%) | 1,201 (61.2%) |
| Education, Arts & Media | 124 (49.4%) | 127 (50.6%) |
| Legal Services & Support | 32 (51.6%) | 30 (48.4%) |
| Education Instruction & Library | 507 (36.7%) | 875 (63.3%) |
| Arts, Media & Entertainment | 98 (36.7%) | 169 (63.3%) |
| Health Diagnosing & Treating | 133 (12.2%) | 955 (87.8%) |
| Health Technologists | 87 (13.1%) | 576 (86.9%) |
| Total (Category) | 2,633 (42.3%) | 3,588 (57.7%) |
| Total (Overall) | 10,637 (52.7%) | 9,538 (47.3%) |
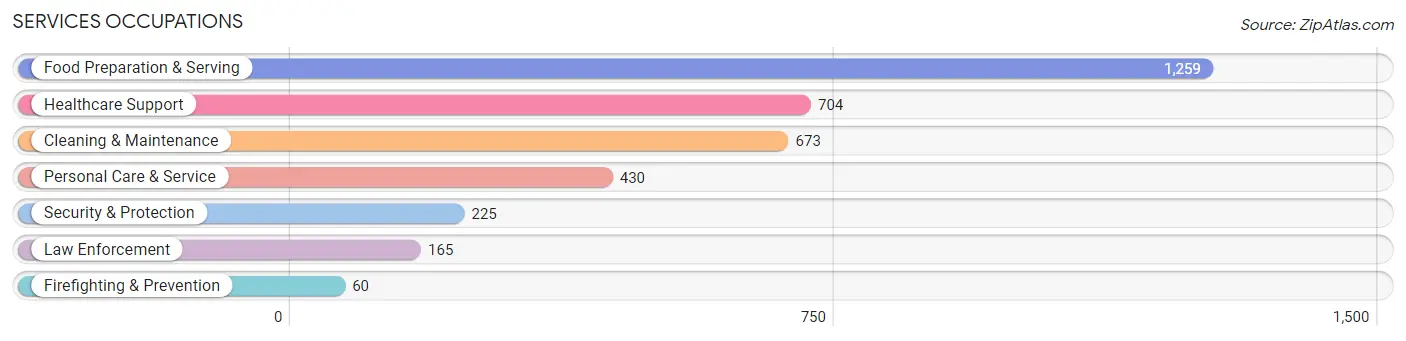
Services Occupations
The most common Services occupations in Hillsdale County are Food Preparation & Serving (1,259 | 6.2%), Healthcare Support (704 | 3.5%), Cleaning & Maintenance (673 | 3.3%), Personal Care & Service (430 | 2.1%), and Security & Protection (225 | 1.1%).
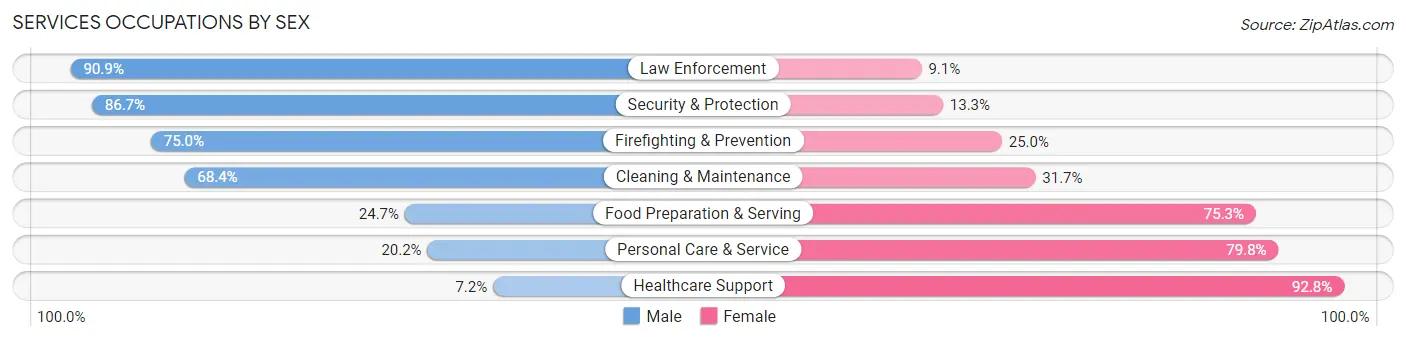
Services Occupations by Sex
Within the Services occupations in Hillsdale County, the most male-oriented occupations are Law Enforcement (90.9%), Security & Protection (86.7%), and Firefighting & Prevention (75.0%), while the most female-oriented occupations are Healthcare Support (92.8%), Personal Care & Service (79.8%), and Food Preparation & Serving (75.3%).
| Occupation | Male | Female |
| Healthcare Support | 51 (7.2%) | 653 (92.8%) |
| Security & Protection | 195 (86.7%) | 30 (13.3%) |
| Firefighting & Prevention | 45 (75.0%) | 15 (25.0%) |
| Law Enforcement | 150 (90.9%) | 15 (9.1%) |
| Food Preparation & Serving | 311 (24.7%) | 948 (75.3%) |
| Cleaning & Maintenance | 460 (68.3%) | 213 (31.7%) |
| Personal Care & Service | 87 (20.2%) | 343 (79.8%) |
| Total (Category) | 1,104 (33.6%) | 2,187 (66.4%) |
| Total (Overall) | 10,637 (52.7%) | 9,538 (47.3%) |
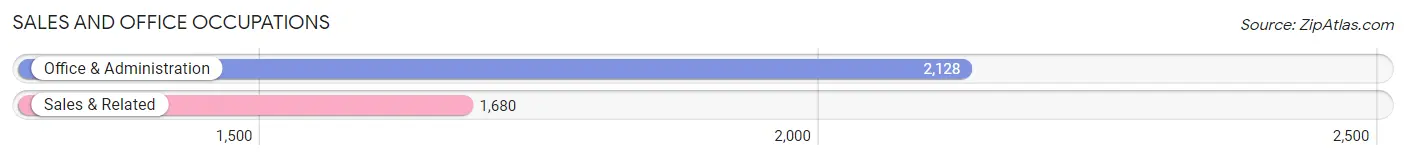
Sales and Office Occupations
The most common Sales and Office occupations in Hillsdale County are Office & Administration (2,128 | 10.5%), and Sales & Related (1,680 | 8.3%).
Sales and Office Occupations by Sex
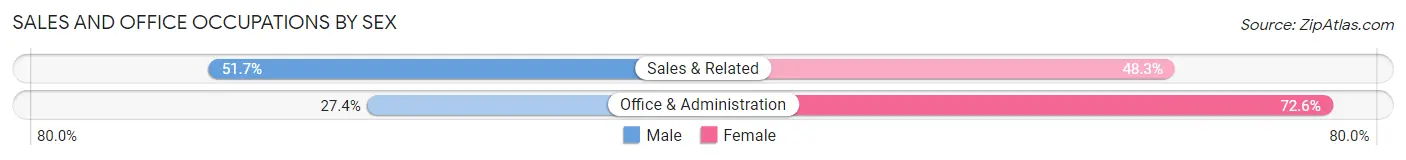
| Occupation | Male | Female |
| Sales & Related | 868 (51.7%) | 812 (48.3%) |
| Office & Administration | 583 (27.4%) | 1,545 (72.6%) |
| Total (Category) | 1,451 (38.1%) | 2,357 (61.9%) |
| Total (Overall) | 10,637 (52.7%) | 9,538 (47.3%) |
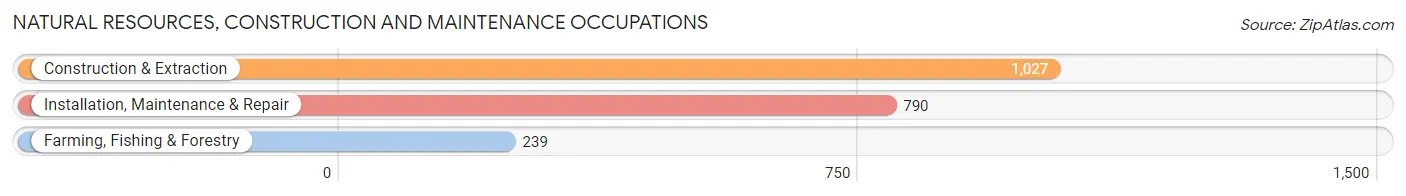
Natural Resources, Construction and Maintenance Occupations
The most common Natural Resources, Construction and Maintenance occupations in Hillsdale County are Construction & Extraction (1,027 | 5.1%), Installation, Maintenance & Repair (790 | 3.9%), and Farming, Fishing & Forestry (239 | 1.2%).
Natural Resources, Construction and Maintenance Occupations by Sex
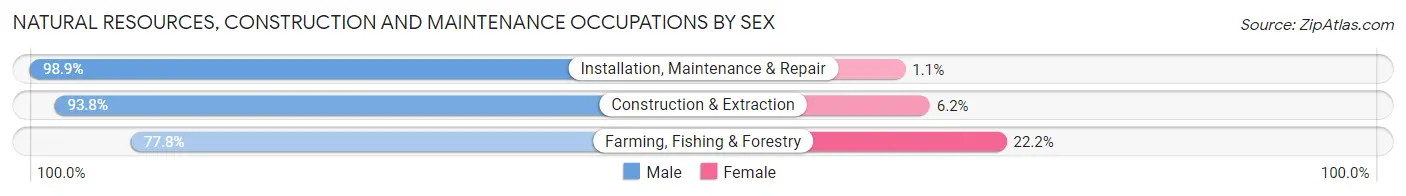
| Occupation | Male | Female |
| Farming, Fishing & Forestry | 186 (77.8%) | 53 (22.2%) |
| Construction & Extraction | 963 (93.8%) | 64 (6.2%) |
| Installation, Maintenance & Repair | 781 (98.9%) | 9 (1.1%) |
| Total (Category) | 1,930 (93.9%) | 126 (6.1%) |
| Total (Overall) | 10,637 (52.7%) | 9,538 (47.3%) |
Production, Transportation and Moving Occupations
The most common Production, Transportation and Moving occupations in Hillsdale County are Production (2,813 | 13.9%), Material Moving (1,105 | 5.5%), and Transportation (881 | 4.4%).
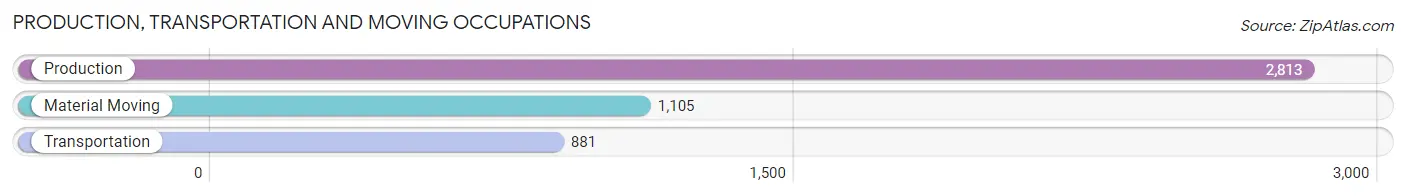
Production, Transportation and Moving Occupations by Sex
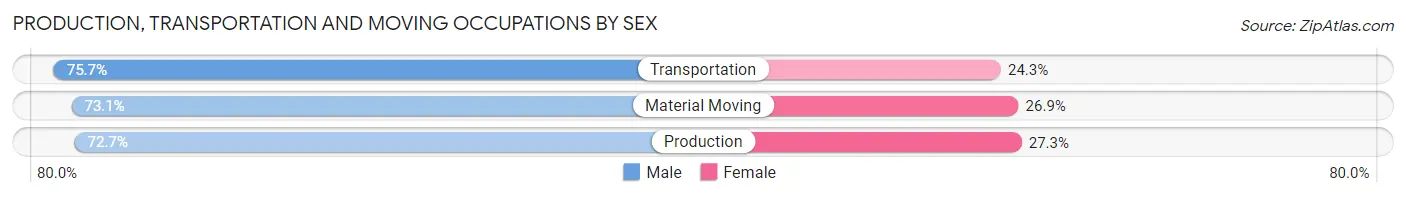
| Occupation | Male | Female |
| Production | 2,044 (72.7%) | 769 (27.3%) |
| Transportation | 667 (75.7%) | 214 (24.3%) |
| Material Moving | 808 (73.1%) | 297 (26.9%) |
| Total (Category) | 3,519 (73.3%) | 1,280 (26.7%) |
| Total (Overall) | 10,637 (52.7%) | 9,538 (47.3%) |
Employment Industries by Sex in Hillsdale County
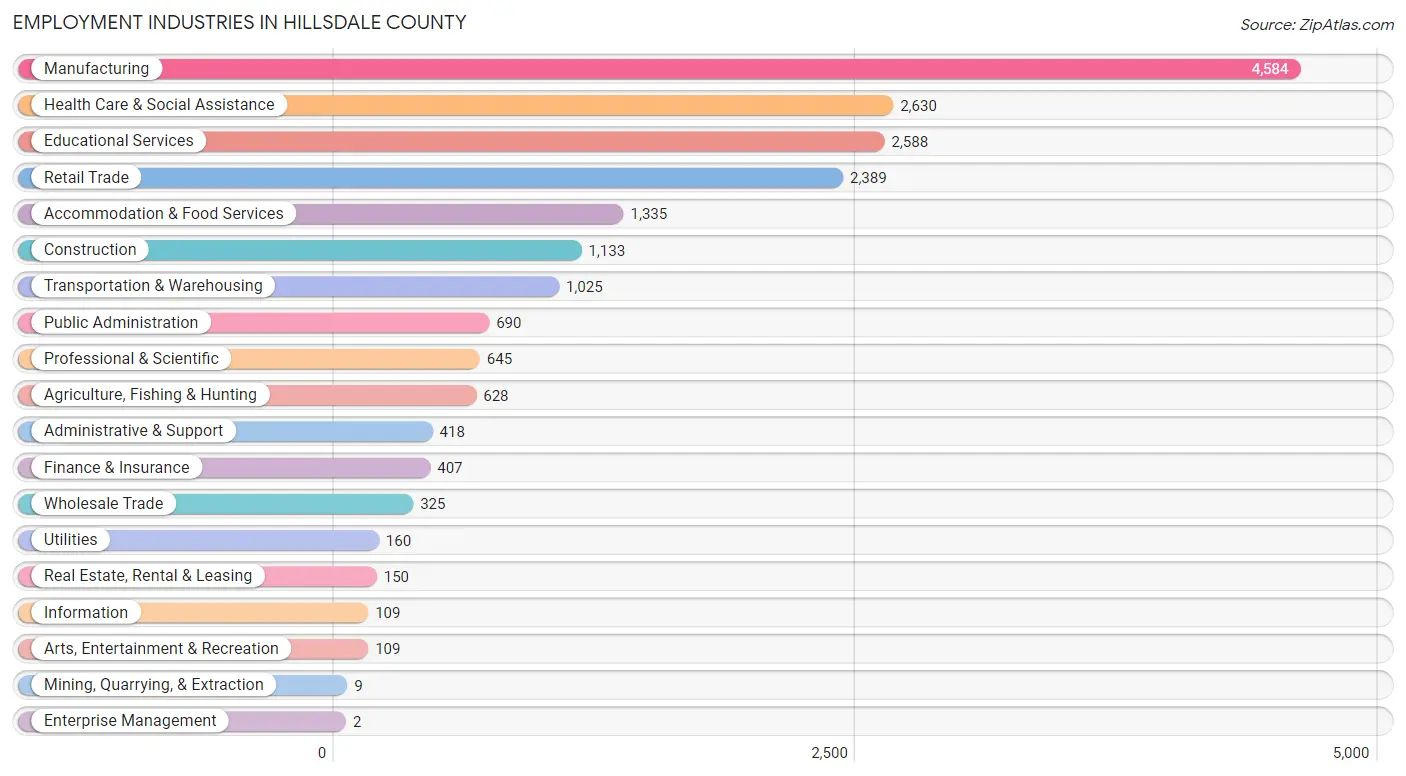
Employment Industries in Hillsdale County
The major employment industries in Hillsdale County include Manufacturing (4,584 | 22.7%), Health Care & Social Assistance (2,630 | 13.0%), Educational Services (2,588 | 12.8%), Retail Trade (2,389 | 11.8%), and Accommodation & Food Services (1,335 | 6.6%).
Employment Industries by Sex in Hillsdale County
The Hillsdale County industries that see more men than women are Enterprise Management (100.0%), Construction (91.8%), and Transportation & Warehousing (81.7%), whereas the industries that tend to have a higher number of women are Health Care & Social Assistance (87.1%), Finance & Insurance (84.5%), and Accommodation & Food Services (71.1%).
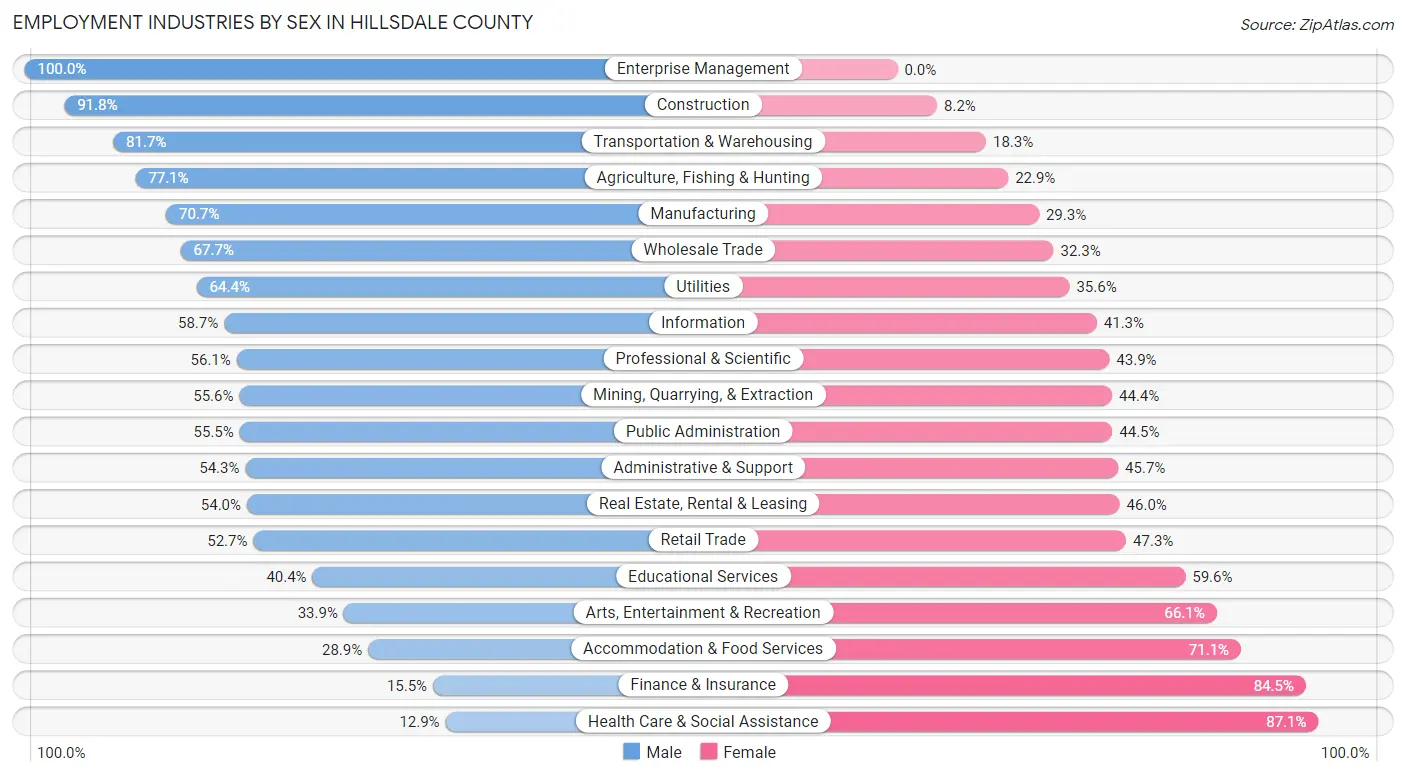
| Industry | Male | Female |
| Agriculture, Fishing & Hunting | 484 (77.1%) | 144 (22.9%) |
| Mining, Quarrying, & Extraction | 5 (55.6%) | 4 (44.4%) |
| Construction | 1,040 (91.8%) | 93 (8.2%) |
| Manufacturing | 3,241 (70.7%) | 1,343 (29.3%) |
| Wholesale Trade | 220 (67.7%) | 105 (32.3%) |
| Retail Trade | 1,258 (52.7%) | 1,131 (47.3%) |
| Transportation & Warehousing | 837 (81.7%) | 188 (18.3%) |
| Utilities | 103 (64.4%) | 57 (35.6%) |
| Information | 64 (58.7%) | 45 (41.3%) |
| Finance & Insurance | 63 (15.5%) | 344 (84.5%) |
| Real Estate, Rental & Leasing | 81 (54.0%) | 69 (46.0%) |
| Professional & Scientific | 362 (56.1%) | 283 (43.9%) |
| Enterprise Management | 2 (100.0%) | 0 (0.0%) |
| Administrative & Support | 227 (54.3%) | 191 (45.7%) |
| Educational Services | 1,046 (40.4%) | 1,542 (59.6%) |
| Health Care & Social Assistance | 339 (12.9%) | 2,291 (87.1%) |
| Arts, Entertainment & Recreation | 37 (33.9%) | 72 (66.1%) |
| Accommodation & Food Services | 386 (28.9%) | 949 (71.1%) |
| Public Administration | 383 (55.5%) | 307 (44.5%) |
| Total | 10,637 (52.7%) | 9,538 (47.3%) |
Education in Hillsdale County
School Enrollment in Hillsdale County
The most common levels of schooling among the 9,836 students in Hillsdale County are college / undergraduate (2,239 | 22.8%), high school (2,238 | 22.8%), and middle school (2,155 | 21.9%).
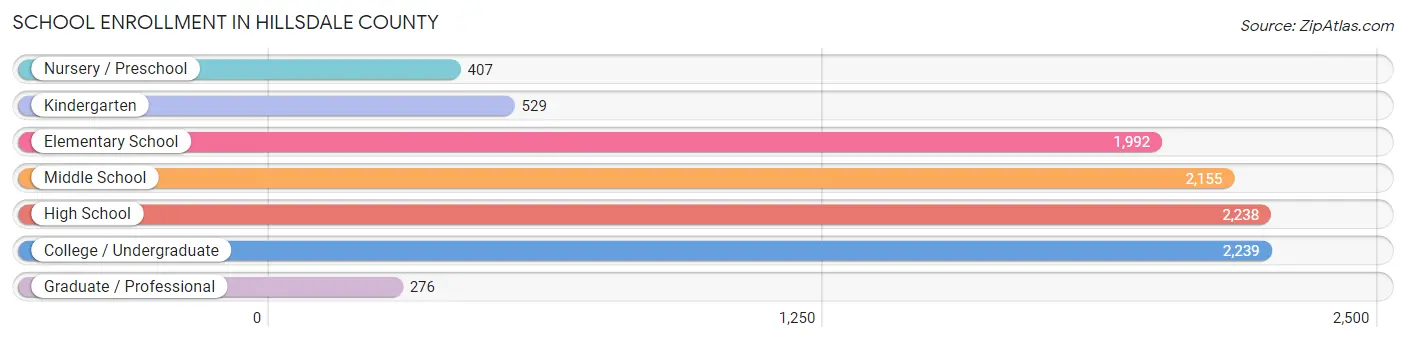
| School Level | # Students | % Students |
| Nursery / Preschool | 407 | 4.1% |
| Kindergarten | 529 | 5.4% |
| Elementary School | 1,992 | 20.3% |
| Middle School | 2,155 | 21.9% |
| High School | 2,238 | 22.8% |
| College / Undergraduate | 2,239 | 22.8% |
| Graduate / Professional | 276 | 2.8% |
| Total | 9,836 | 100.0% |
School Enrollment by Age by Funding Source in Hillsdale County
Out of a total of 9,836 students who are enrolled in schools in Hillsdale County, 2,784 (28.3%) attend a private institution, while the remaining 7,052 (71.7%) are enrolled in public schools. The age group of 20 to 24 year olds has the highest likelihood of being enrolled in private schools, with 988 (75.2% in the age bracket) enrolled. Conversely, the age group of 3 to 4 year olds has the lowest likelihood of being enrolled in a private school, with 251 (90.0% in the age bracket) attending a public institution.
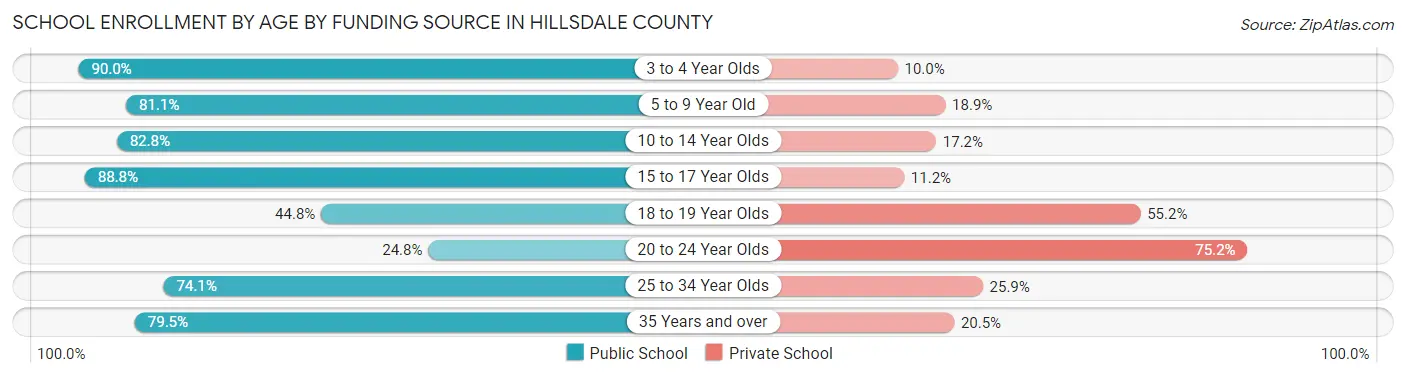
| Age Bracket | Public School | Private School |
| 3 to 4 Year Olds | 251 (90.0%) | 28 (10.0%) |
| 5 to 9 Year Old | 1,927 (81.1%) | 449 (18.9%) |
| 10 to 14 Year Olds | 2,224 (82.8%) | 461 (17.2%) |
| 15 to 17 Year Olds | 1,440 (88.8%) | 182 (11.2%) |
| 18 to 19 Year Olds | 448 (44.8%) | 553 (55.2%) |
| 20 to 24 Year Olds | 326 (24.8%) | 988 (75.2%) |
| 25 to 34 Year Olds | 169 (74.1%) | 59 (25.9%) |
| 35 Years and over | 263 (79.5%) | 68 (20.5%) |
| Total | 7,052 (71.7%) | 2,784 (28.3%) |
Educational Attainment by Field of Study in Hillsdale County
Education (1,535 | 22.6%), business (1,003 | 14.8%), science & technology (779 | 11.5%), engineering (480 | 7.1%), and arts & humanities (480 | 7.1%) are the most common fields of study among 6,789 individuals in Hillsdale County who have obtained a bachelor's degree or higher.
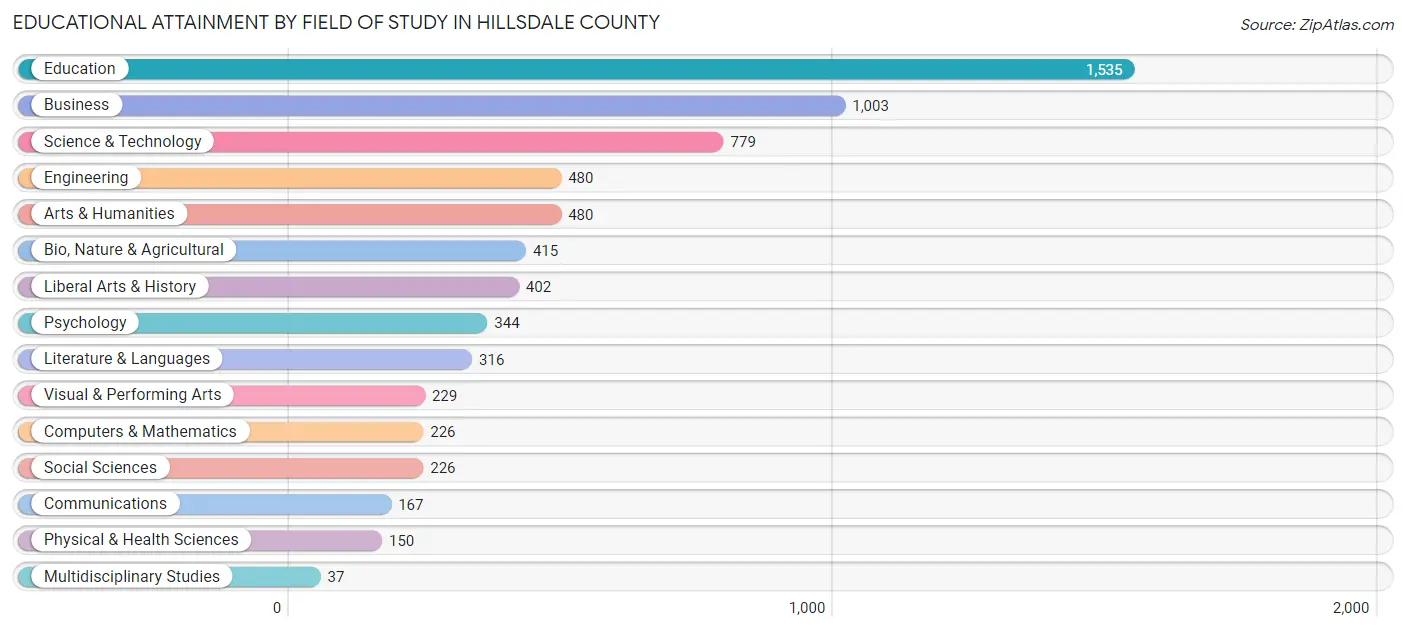
| Field of Study | # Graduates | % Graduates |
| Computers & Mathematics | 226 | 3.3% |
| Bio, Nature & Agricultural | 415 | 6.1% |
| Physical & Health Sciences | 150 | 2.2% |
| Psychology | 344 | 5.1% |
| Social Sciences | 226 | 3.3% |
| Engineering | 480 | 7.1% |
| Multidisciplinary Studies | 37 | 0.5% |
| Science & Technology | 779 | 11.5% |
| Business | 1,003 | 14.8% |
| Education | 1,535 | 22.6% |
| Literature & Languages | 316 | 4.6% |
| Liberal Arts & History | 402 | 5.9% |
| Visual & Performing Arts | 229 | 3.4% |
| Communications | 167 | 2.5% |
| Arts & Humanities | 480 | 7.1% |
| Total | 6,789 | 100.0% |
Transportation & Commute in Hillsdale County
Vehicle Availability by Sex in Hillsdale County
The most prevalent vehicle ownership categories in Hillsdale County are males with 2 vehicles (4,362, accounting for 43.0%) and females with 2 vehicles (4,101, making up 48.4%).
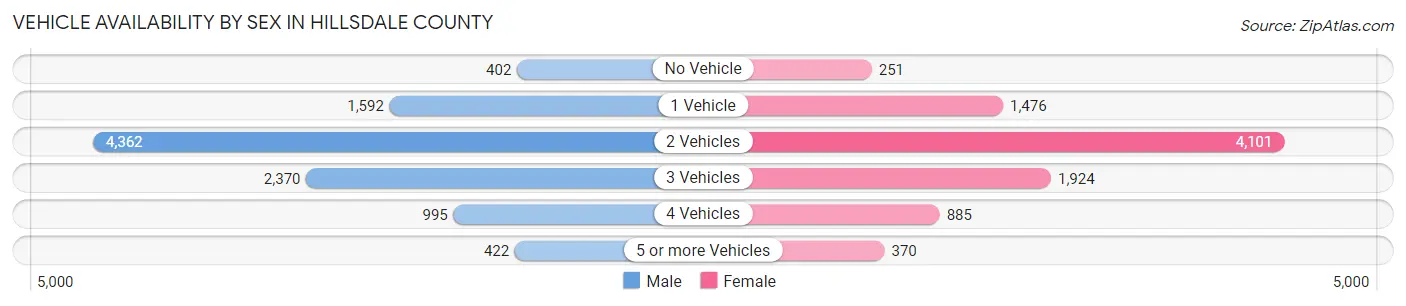
| Vehicles Available | Male | Female |
| No Vehicle | 402 (4.0%) | 251 (2.8%) |
| 1 Vehicle | 1,592 (15.7%) | 1,476 (16.4%) |
| 2 Vehicles | 4,362 (43.0%) | 4,101 (45.5%) |
| 3 Vehicles | 2,370 (23.4%) | 1,924 (21.4%) |
| 4 Vehicles | 995 (9.8%) | 885 (9.8%) |
| 5 or more Vehicles | 422 (4.2%) | 370 (4.1%) |
| Total | 10,143 (100.0%) | 9,007 (100.0%) |
Commute Time in Hillsdale County
The most frequently occuring commute durations in Hillsdale County are 10 to 14 minutes (2,693 commuters, 14.9%), 15 to 19 minutes (2,518 commuters, 14.0%), and 5 to 9 minutes (2,343 commuters, 13.0%).
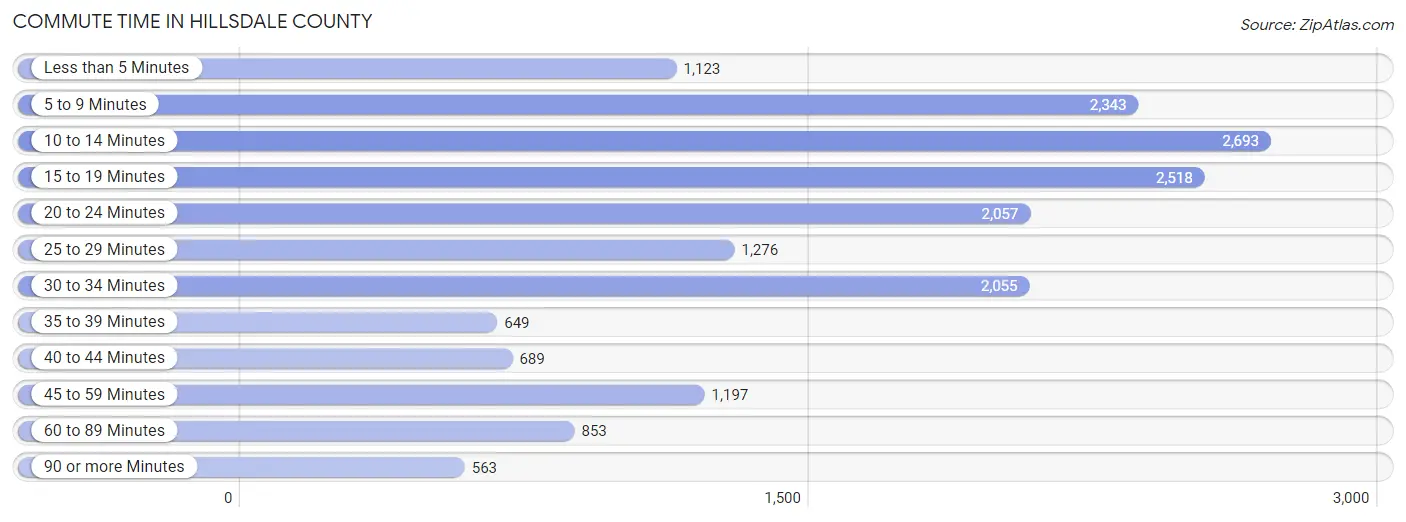
| Commute Time | # Commuters | % Commuters |
| Less than 5 Minutes | 1,123 | 6.2% |
| 5 to 9 Minutes | 2,343 | 13.0% |
| 10 to 14 Minutes | 2,693 | 14.9% |
| 15 to 19 Minutes | 2,518 | 14.0% |
| 20 to 24 Minutes | 2,057 | 11.4% |
| 25 to 29 Minutes | 1,276 | 7.1% |
| 30 to 34 Minutes | 2,055 | 11.4% |
| 35 to 39 Minutes | 649 | 3.6% |
| 40 to 44 Minutes | 689 | 3.8% |
| 45 to 59 Minutes | 1,197 | 6.6% |
| 60 to 89 Minutes | 853 | 4.7% |
| 90 or more Minutes | 563 | 3.1% |
Commute Time by Sex in Hillsdale County
The most common commute times in Hillsdale County are 5 to 9 minutes (1,277 commuters, 13.3%) for males and 10 to 14 minutes (1,481 commuters, 17.6%) for females.
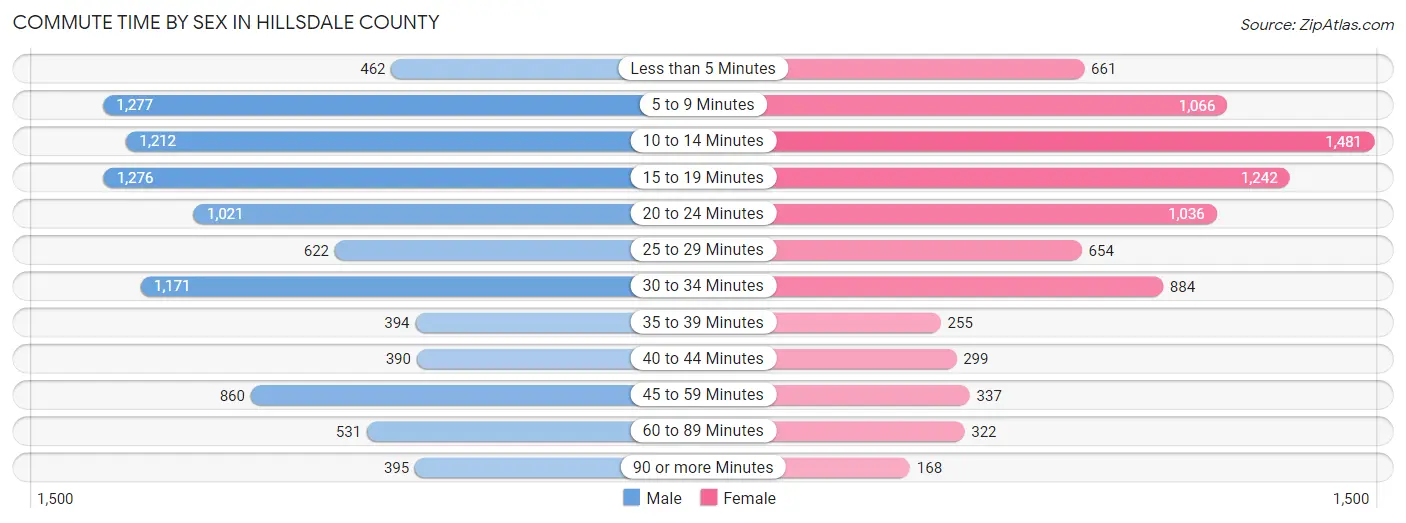
| Commute Time | Male | Female |
| Less than 5 Minutes | 462 (4.8%) | 661 (7.9%) |
| 5 to 9 Minutes | 1,277 (13.3%) | 1,066 (12.7%) |
| 10 to 14 Minutes | 1,212 (12.6%) | 1,481 (17.6%) |
| 15 to 19 Minutes | 1,276 (13.3%) | 1,242 (14.8%) |
| 20 to 24 Minutes | 1,021 (10.6%) | 1,036 (12.3%) |
| 25 to 29 Minutes | 622 (6.5%) | 654 (7.8%) |
| 30 to 34 Minutes | 1,171 (12.2%) | 884 (10.5%) |
| 35 to 39 Minutes | 394 (4.1%) | 255 (3.0%) |
| 40 to 44 Minutes | 390 (4.1%) | 299 (3.6%) |
| 45 to 59 Minutes | 860 (8.9%) | 337 (4.0%) |
| 60 to 89 Minutes | 531 (5.5%) | 322 (3.8%) |
| 90 or more Minutes | 395 (4.1%) | 168 (2.0%) |
Time of Departure to Work by Sex in Hillsdale County
The most frequent times of departure to work in Hillsdale County are 12:00 PM to 3:59 PM (1,159, 12.1%) for males and 7:00 AM to 7:29 AM (1,317, 15.7%) for females.
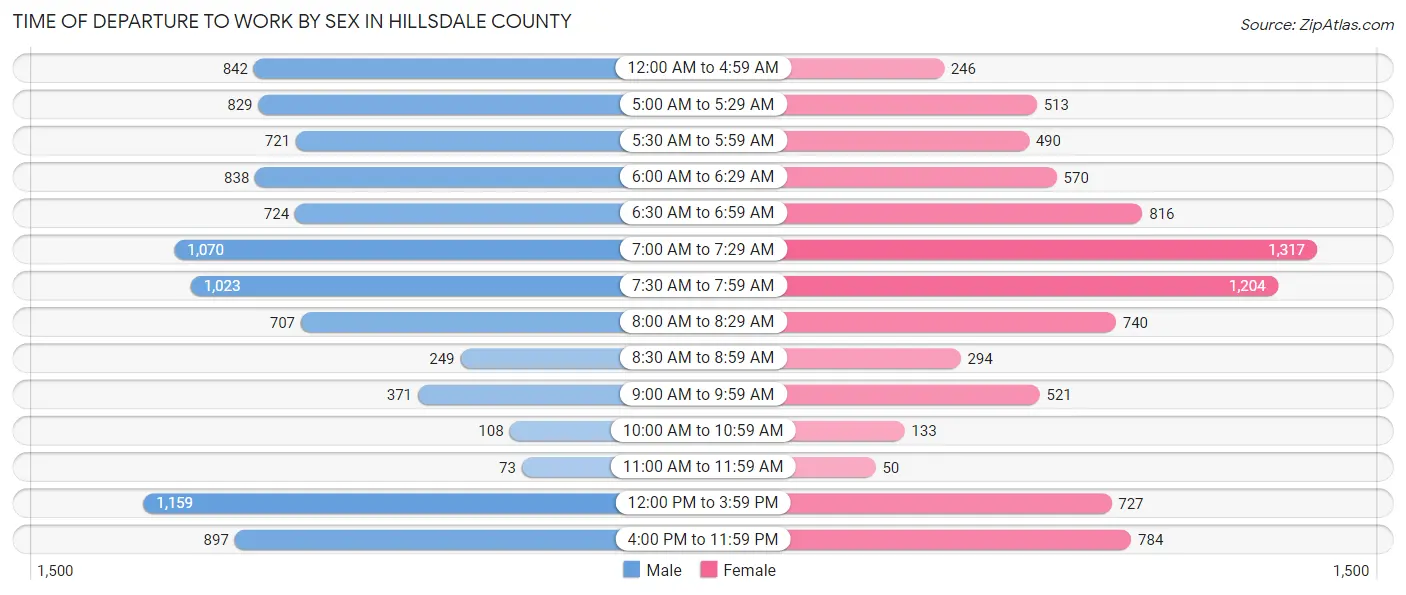
| Time of Departure | Male | Female |
| 12:00 AM to 4:59 AM | 842 (8.8%) | 246 (2.9%) |
| 5:00 AM to 5:29 AM | 829 (8.6%) | 513 (6.1%) |
| 5:30 AM to 5:59 AM | 721 (7.5%) | 490 (5.8%) |
| 6:00 AM to 6:29 AM | 838 (8.7%) | 570 (6.8%) |
| 6:30 AM to 6:59 AM | 724 (7.5%) | 816 (9.7%) |
| 7:00 AM to 7:29 AM | 1,070 (11.1%) | 1,317 (15.7%) |
| 7:30 AM to 7:59 AM | 1,023 (10.6%) | 1,204 (14.3%) |
| 8:00 AM to 8:29 AM | 707 (7.4%) | 740 (8.8%) |
| 8:30 AM to 8:59 AM | 249 (2.6%) | 294 (3.5%) |
| 9:00 AM to 9:59 AM | 371 (3.9%) | 521 (6.2%) |
| 10:00 AM to 10:59 AM | 108 (1.1%) | 133 (1.6%) |
| 11:00 AM to 11:59 AM | 73 (0.8%) | 50 (0.6%) |
| 12:00 PM to 3:59 PM | 1,159 (12.1%) | 727 (8.6%) |
| 4:00 PM to 11:59 PM | 897 (9.3%) | 784 (9.3%) |
| Total | 9,611 (100.0%) | 8,405 (100.0%) |
Housing Occupancy in Hillsdale County
Occupancy by Ownership in Hillsdale County
Of the total 17,606 dwellings in Hillsdale County, owner-occupied units account for 14,063 (79.9%), while renter-occupied units make up 3,543 (20.1%).
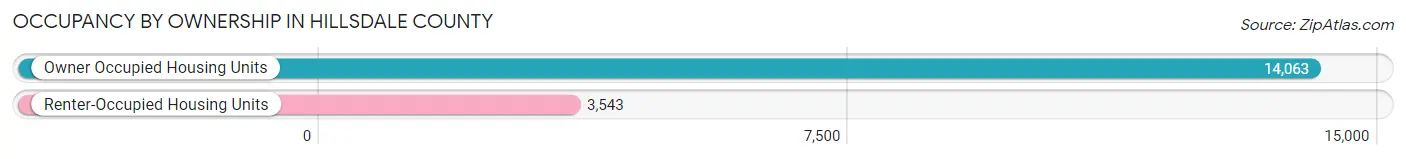
| Occupancy | # Housing Units | % Housing Units |
| Owner Occupied Housing Units | 14,063 | 79.9% |
| Renter-Occupied Housing Units | 3,543 | 20.1% |
| Total Occupied Housing Units | 17,606 | 100.0% |
Occupancy by Household Size in Hillsdale County
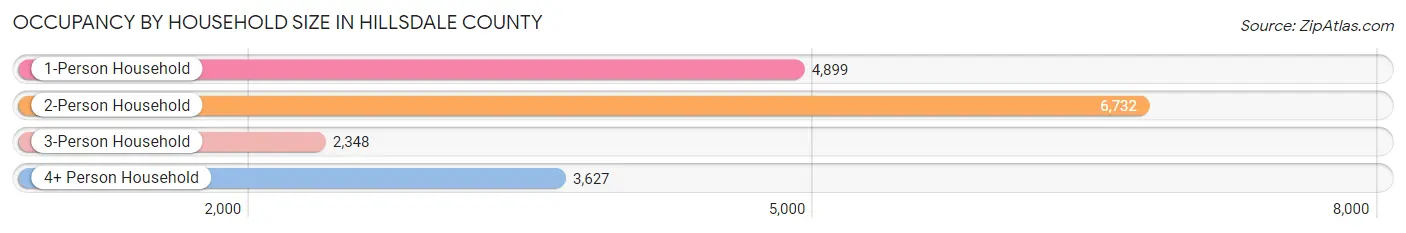
| Household Size | # Housing Units | % Housing Units |
| 1-Person Household | 4,899 | 27.8% |
| 2-Person Household | 6,732 | 38.2% |
| 3-Person Household | 2,348 | 13.3% |
| 4+ Person Household | 3,627 | 20.6% |
| Total Housing Units | 17,606 | 100.0% |
Occupancy by Ownership by Household Size in Hillsdale County
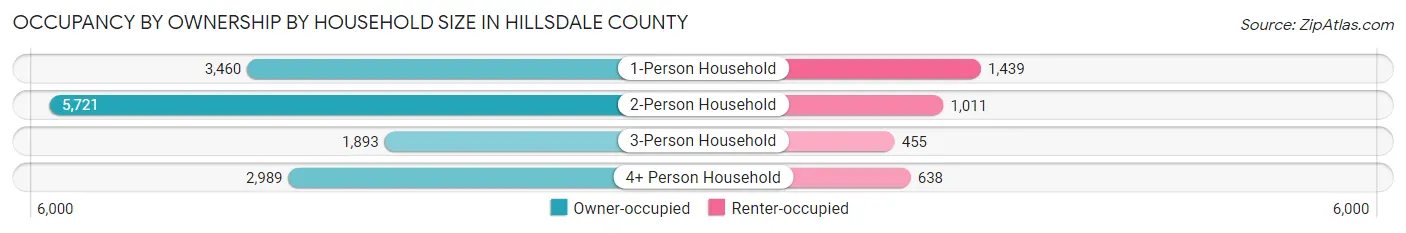
| Household Size | Owner-occupied | Renter-occupied |
| 1-Person Household | 3,460 (70.6%) | 1,439 (29.4%) |
| 2-Person Household | 5,721 (85.0%) | 1,011 (15.0%) |
| 3-Person Household | 1,893 (80.6%) | 455 (19.4%) |
| 4+ Person Household | 2,989 (82.4%) | 638 (17.6%) |
| Total Housing Units | 14,063 (79.9%) | 3,543 (20.1%) |
Occupancy by Educational Attainment in Hillsdale County
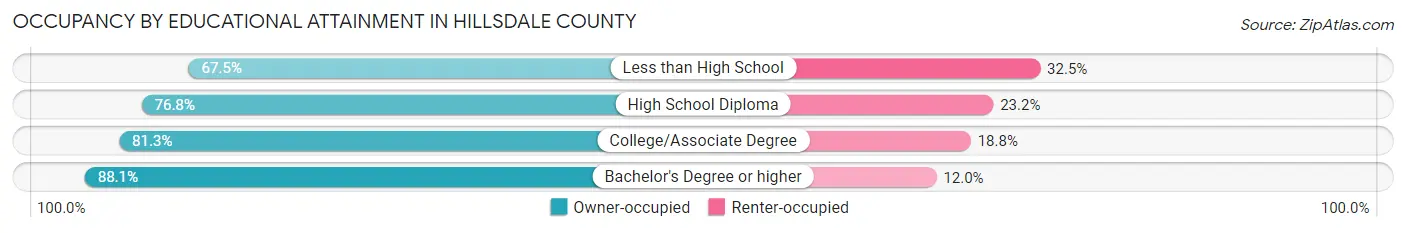
| Household Size | Owner-occupied | Renter-occupied |
| Less than High School | 984 (67.5%) | 474 (32.5%) |
| High School Diploma | 5,139 (76.8%) | 1,553 (23.2%) |
| College/Associate Degree | 4,610 (81.2%) | 1,064 (18.8%) |
| Bachelor's Degree or higher | 3,330 (88.0%) | 452 (11.9%) |
Occupancy by Age of Householder in Hillsdale County
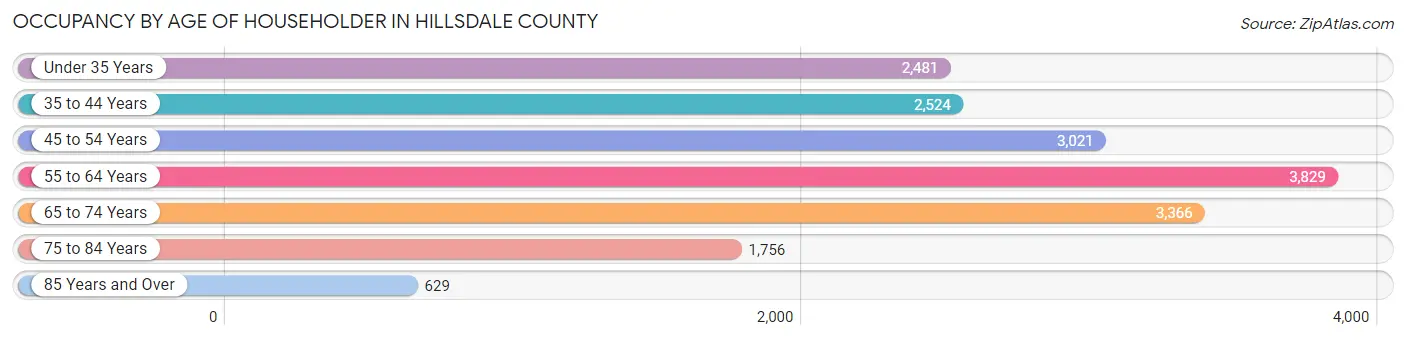
| Age Bracket | # Households | % Households |
| Under 35 Years | 2,481 | 14.1% |
| 35 to 44 Years | 2,524 | 14.3% |
| 45 to 54 Years | 3,021 | 17.2% |
| 55 to 64 Years | 3,829 | 21.7% |
| 65 to 74 Years | 3,366 | 19.1% |
| 75 to 84 Years | 1,756 | 10.0% |
| 85 Years and Over | 629 | 3.6% |
| Total | 17,606 | 100.0% |
Housing Finances in Hillsdale County
Median Income by Occupancy in Hillsdale County
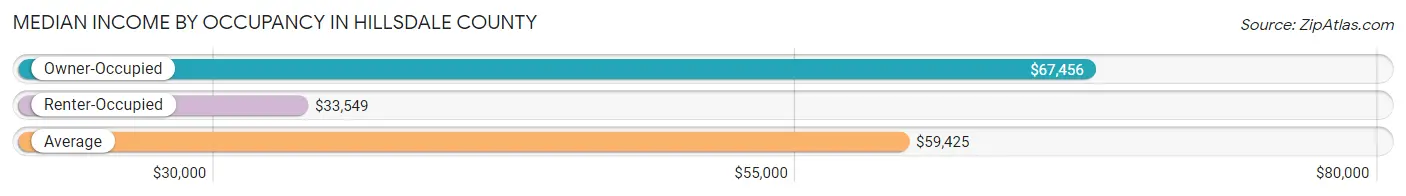
| Occupancy Type | # Households | Median Income |
| Owner-Occupied | 14,063 (79.9%) | $67,456 |
| Renter-Occupied | 3,543 (20.1%) | $33,549 |
| Average | 17,606 (100.0%) | $59,425 |
Occupancy by Householder Income Bracket in Hillsdale County
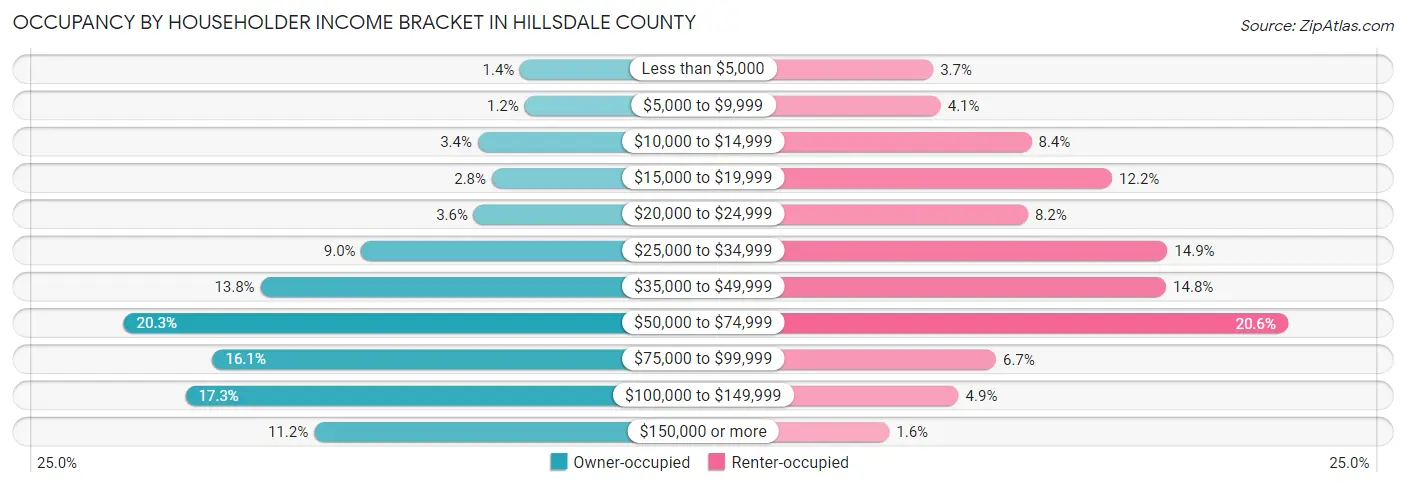
| Income Bracket | Owner-occupied | Renter-occupied |
| Less than $5,000 | 197 (1.4%) | 131 (3.7%) |
| $5,000 to $9,999 | 168 (1.2%) | 144 (4.1%) |
| $10,000 to $14,999 | 481 (3.4%) | 297 (8.4%) |
| $15,000 to $19,999 | 387 (2.8%) | 433 (12.2%) |
| $20,000 to $24,999 | 508 (3.6%) | 291 (8.2%) |
| $25,000 to $34,999 | 1,260 (9.0%) | 526 (14.8%) |
| $35,000 to $49,999 | 1,937 (13.8%) | 524 (14.8%) |
| $50,000 to $74,999 | 2,852 (20.3%) | 729 (20.6%) |
| $75,000 to $99,999 | 2,257 (16.1%) | 237 (6.7%) |
| $100,000 to $149,999 | 2,438 (17.3%) | 174 (4.9%) |
| $150,000 or more | 1,578 (11.2%) | 57 (1.6%) |
| Total | 14,063 (100.0%) | 3,543 (100.0%) |
Monthly Housing Cost Tiers in Hillsdale County
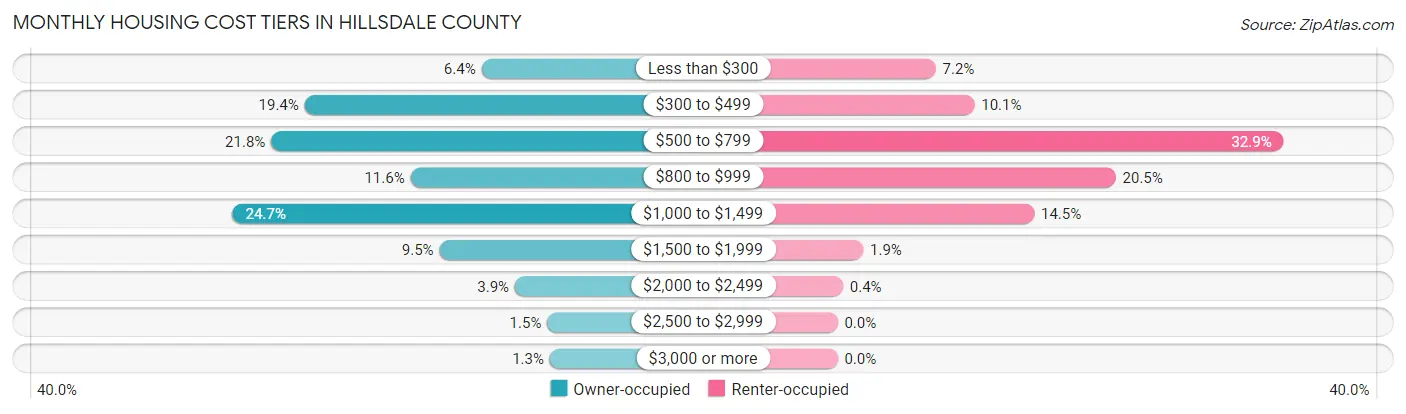
| Monthly Cost | Owner-occupied | Renter-occupied |
| Less than $300 | 893 (6.4%) | 256 (7.2%) |
| $300 to $499 | 2,726 (19.4%) | 357 (10.1%) |
| $500 to $799 | 3,071 (21.8%) | 1,164 (32.9%) |
| $800 to $999 | 1,628 (11.6%) | 726 (20.5%) |
| $1,000 to $1,499 | 3,471 (24.7%) | 513 (14.5%) |
| $1,500 to $1,999 | 1,329 (9.5%) | 67 (1.9%) |
| $2,000 to $2,499 | 547 (3.9%) | 14 (0.4%) |
| $2,500 to $2,999 | 212 (1.5%) | 0 (0.0%) |
| $3,000 or more | 186 (1.3%) | 0 (0.0%) |
| Total | 14,063 (100.0%) | 3,543 (100.0%) |
Physical Housing Characteristics in Hillsdale County
Housing Structures in Hillsdale County
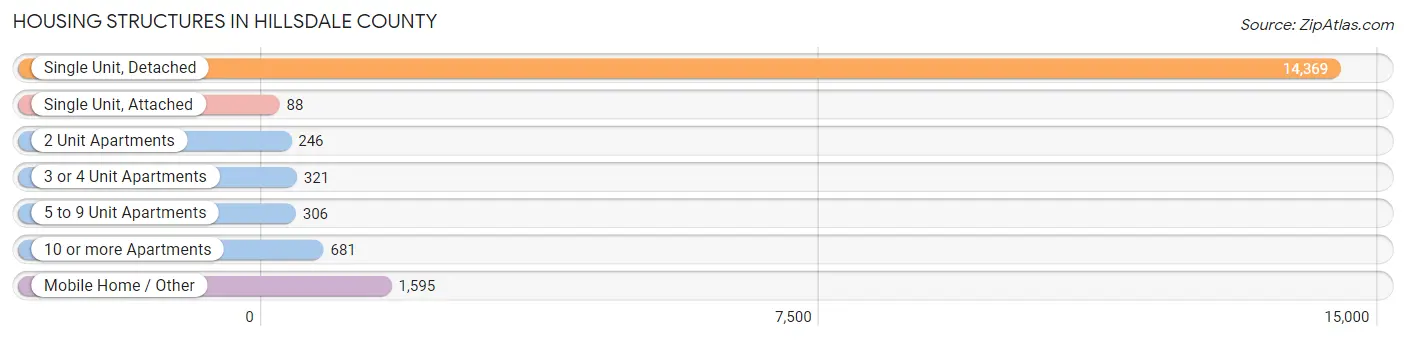
| Structure Type | # Housing Units | % Housing Units |
| Single Unit, Detached | 14,369 | 81.6% |
| Single Unit, Attached | 88 | 0.5% |
| 2 Unit Apartments | 246 | 1.4% |
| 3 or 4 Unit Apartments | 321 | 1.8% |
| 5 to 9 Unit Apartments | 306 | 1.7% |
| 10 or more Apartments | 681 | 3.9% |
| Mobile Home / Other | 1,595 | 9.1% |
| Total | 17,606 | 100.0% |
Housing Structures by Occupancy in Hillsdale County
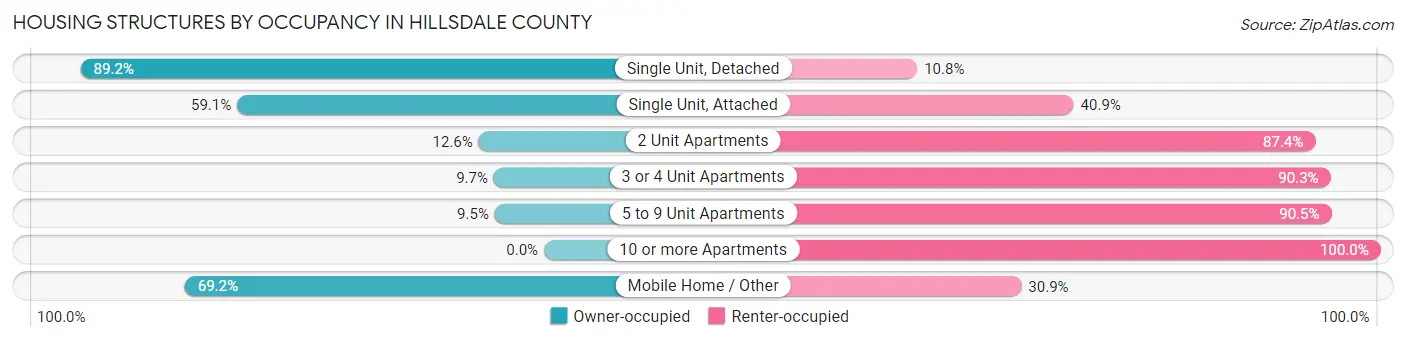
| Structure Type | Owner-occupied | Renter-occupied |
| Single Unit, Detached | 12,817 (89.2%) | 1,552 (10.8%) |
| Single Unit, Attached | 52 (59.1%) | 36 (40.9%) |
| 2 Unit Apartments | 31 (12.6%) | 215 (87.4%) |
| 3 or 4 Unit Apartments | 31 (9.7%) | 290 (90.3%) |
| 5 to 9 Unit Apartments | 29 (9.5%) | 277 (90.5%) |
| 10 or more Apartments | 0 (0.0%) | 681 (100.0%) |
| Mobile Home / Other | 1,103 (69.2%) | 492 (30.8%) |
| Total | 14,063 (79.9%) | 3,543 (20.1%) |
Housing Structures by Number of Rooms in Hillsdale County
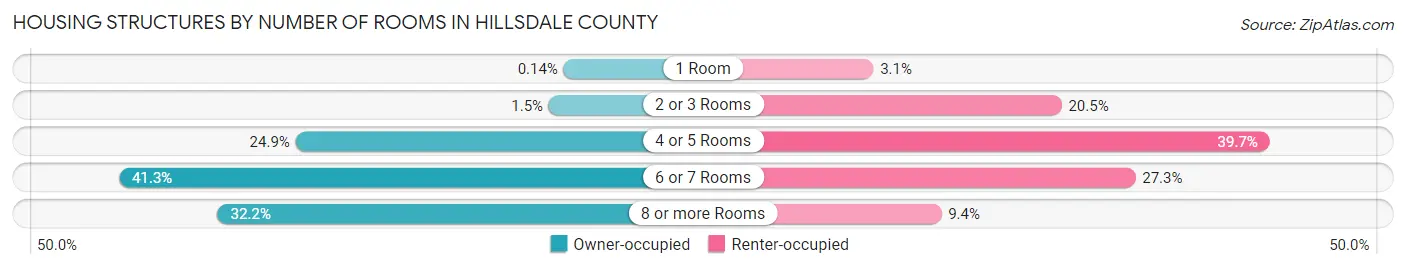
| Number of Rooms | Owner-occupied | Renter-occupied |
| 1 Room | 19 (0.1%) | 109 (3.1%) |
| 2 or 3 Rooms | 213 (1.5%) | 726 (20.5%) |
| 4 or 5 Rooms | 3,506 (24.9%) | 1,408 (39.7%) |
| 6 or 7 Rooms | 5,804 (41.3%) | 968 (27.3%) |
| 8 or more Rooms | 4,521 (32.2%) | 332 (9.4%) |
| Total | 14,063 (100.0%) | 3,543 (100.0%) |
Housing Structure by Heating Type in Hillsdale County
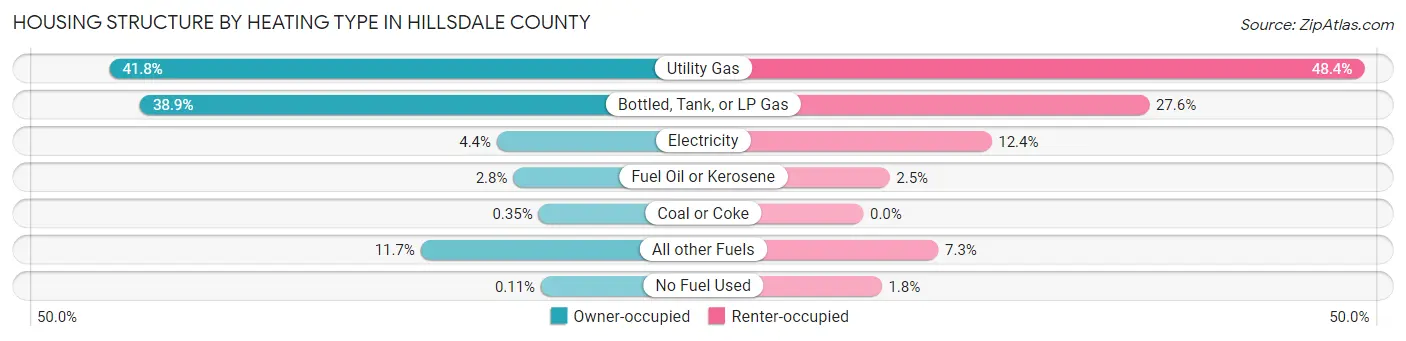
| Heating Type | Owner-occupied | Renter-occupied |
| Utility Gas | 5,879 (41.8%) | 1,715 (48.4%) |
| Bottled, Tank, or LP Gas | 5,464 (38.9%) | 979 (27.6%) |
| Electricity | 615 (4.4%) | 439 (12.4%) |
| Fuel Oil or Kerosene | 391 (2.8%) | 90 (2.5%) |
| Coal or Coke | 49 (0.4%) | 0 (0.0%) |
| All other Fuels | 1,649 (11.7%) | 257 (7.2%) |
| No Fuel Used | 16 (0.1%) | 63 (1.8%) |
| Total | 14,063 (100.0%) | 3,543 (100.0%) |
Household Vehicle Usage in Hillsdale County
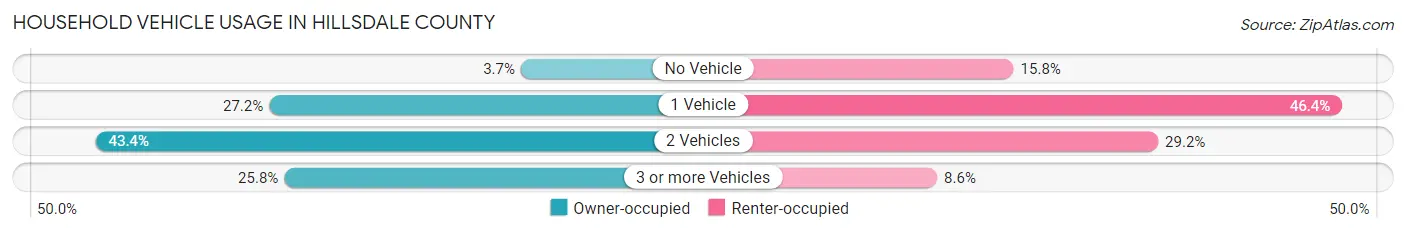
| Vehicles per Household | Owner-occupied | Renter-occupied |
| No Vehicle | 517 (3.7%) | 558 (15.8%) |
| 1 Vehicle | 3,823 (27.2%) | 1,644 (46.4%) |
| 2 Vehicles | 6,099 (43.4%) | 1,036 (29.2%) |
| 3 or more Vehicles | 3,624 (25.8%) | 305 (8.6%) |
| Total | 14,063 (100.0%) | 3,543 (100.0%) |
Real Estate & Mortgages in Hillsdale County
Real Estate and Mortgage Overview in Hillsdale County
| Characteristic | Without Mortgage | With Mortgage |
| Housing Units | 5,901 | 8,162 |
| Median Property Value | $156,000 | $160,800 |
| Median Household Income | $52,204 | $1,082 |
| Monthly Housing Costs | $472 | $186 |
| Real Estate Taxes | $1,560 | $323 |
Property Value by Mortgage Status in Hillsdale County
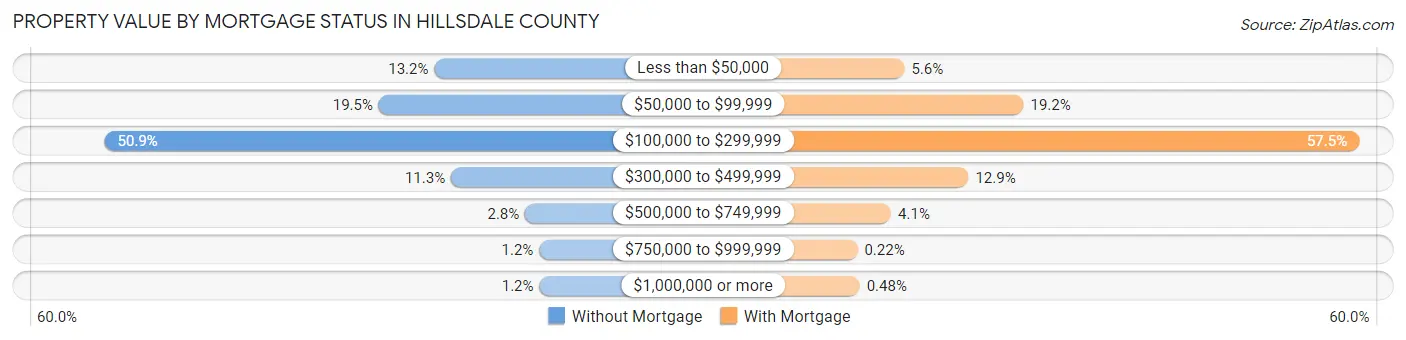
| Property Value | Without Mortgage | With Mortgage |
| Less than $50,000 | 778 (13.2%) | 456 (5.6%) |
| $50,000 to $99,999 | 1,152 (19.5%) | 1,567 (19.2%) |
| $100,000 to $299,999 | 3,002 (50.9%) | 4,696 (57.5%) |
| $300,000 to $499,999 | 665 (11.3%) | 1,054 (12.9%) |
| $500,000 to $749,999 | 165 (2.8%) | 332 (4.1%) |
| $750,000 to $999,999 | 70 (1.2%) | 18 (0.2%) |
| $1,000,000 or more | 69 (1.2%) | 39 (0.5%) |
| Total | 5,901 (100.0%) | 8,162 (100.0%) |
Household Income by Mortgage Status in Hillsdale County
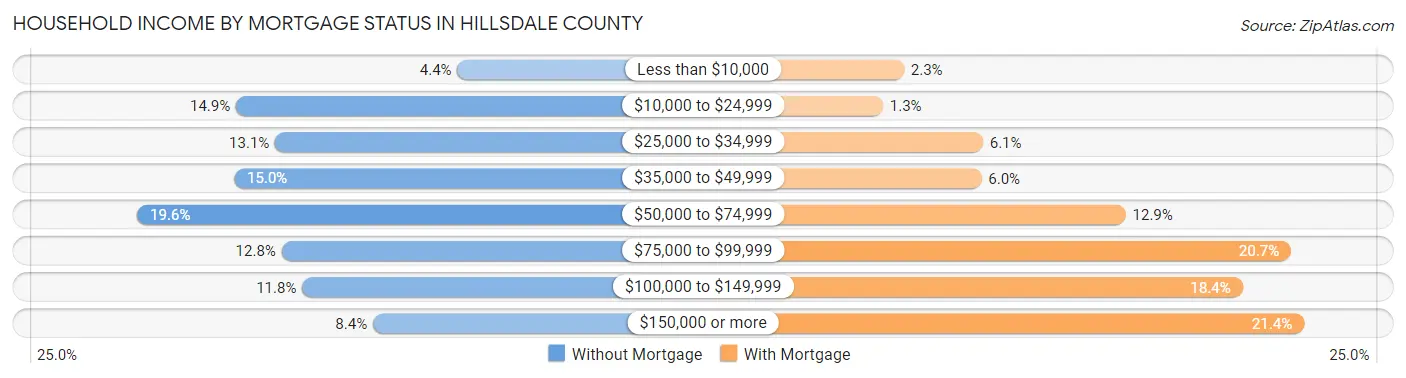
| Household Income | Without Mortgage | With Mortgage |
| Less than $10,000 | 259 (4.4%) | 188 (2.3%) |
| $10,000 to $24,999 | 881 (14.9%) | 106 (1.3%) |
| $25,000 to $34,999 | 771 (13.1%) | 495 (6.1%) |
| $35,000 to $49,999 | 887 (15.0%) | 489 (6.0%) |
| $50,000 to $74,999 | 1,159 (19.6%) | 1,050 (12.9%) |
| $75,000 to $99,999 | 753 (12.8%) | 1,693 (20.7%) |
| $100,000 to $149,999 | 695 (11.8%) | 1,504 (18.4%) |
| $150,000 or more | 496 (8.4%) | 1,743 (21.4%) |
| Total | 5,901 (100.0%) | 8,162 (100.0%) |
Property Value to Household Income Ratio in Hillsdale County
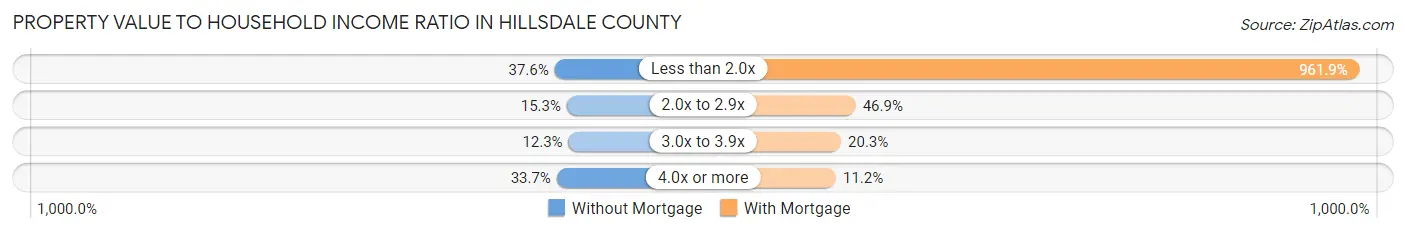
| Value-to-Income Ratio | Without Mortgage | With Mortgage |
| Less than 2.0x | 2,219 (37.6%) | 78,511 (961.9%) |
| 2.0x to 2.9x | 904 (15.3%) | 3,825 (46.9%) |
| 3.0x to 3.9x | 727 (12.3%) | 1,656 (20.3%) |
| 4.0x or more | 1,988 (33.7%) | 912 (11.2%) |
| Total | 5,901 (100.0%) | 8,162 (100.0%) |
Real Estate Taxes by Mortgage Status in Hillsdale County
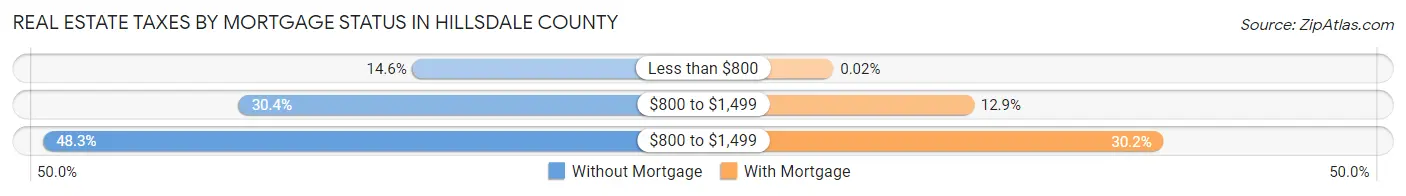
| Property Taxes | Without Mortgage | With Mortgage |
| Less than $800 | 860 (14.6%) | 2 (0.0%) |
| $800 to $1,499 | 1,796 (30.4%) | 1,049 (12.9%) |
| $800 to $1,499 | 2,850 (48.3%) | 2,463 (30.2%) |
| Total | 5,901 (100.0%) | 8,162 (100.0%) |
Health & Disability in Hillsdale County
Health Insurance Coverage by Age in Hillsdale County
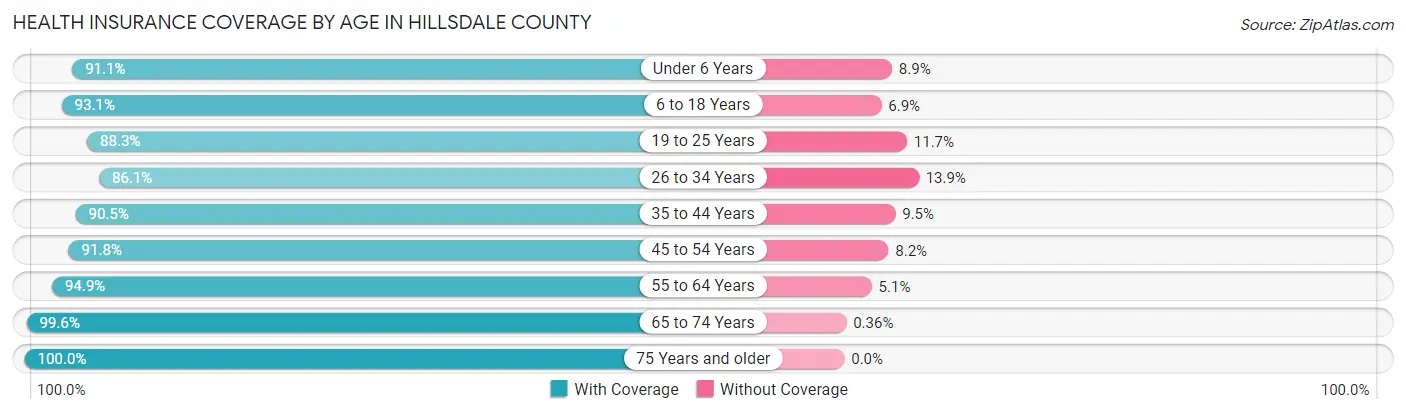
| Age Bracket | With Coverage | Without Coverage |
| Under 6 Years | 2,851 (91.1%) | 278 (8.9%) |
| 6 to 18 Years | 6,912 (93.1%) | 513 (6.9%) |
| 19 to 25 Years | 3,543 (88.3%) | 468 (11.7%) |
| 26 to 34 Years | 3,763 (86.1%) | 606 (13.9%) |
| 35 to 44 Years | 4,398 (90.5%) | 462 (9.5%) |
| 45 to 54 Years | 5,071 (91.8%) | 454 (8.2%) |
| 55 to 64 Years | 6,582 (94.9%) | 354 (5.1%) |
| 65 to 74 Years | 5,610 (99.6%) | 20 (0.4%) |
| 75 Years and older | 3,508 (100.0%) | 0 (0.0%) |
| Total | 42,238 (93.0%) | 3,155 (7.0%) |
Health Insurance Coverage by Citizenship Status in Hillsdale County
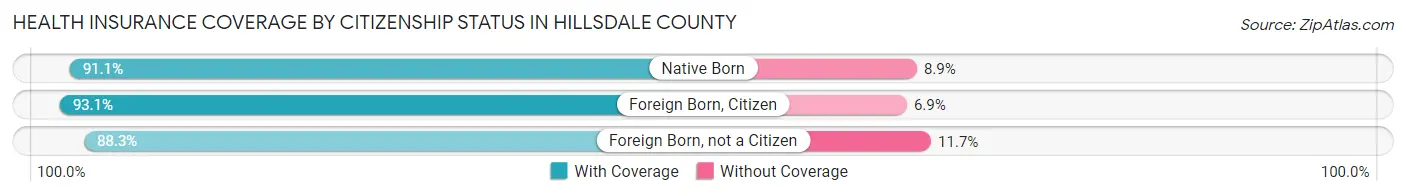
| Citizenship Status | With Coverage | Without Coverage |
| Native Born | 2,851 (91.1%) | 278 (8.9%) |
| Foreign Born, Citizen | 6,912 (93.1%) | 513 (6.9%) |
| Foreign Born, not a Citizen | 3,543 (88.3%) | 468 (11.7%) |
Health Insurance Coverage by Household Income in Hillsdale County
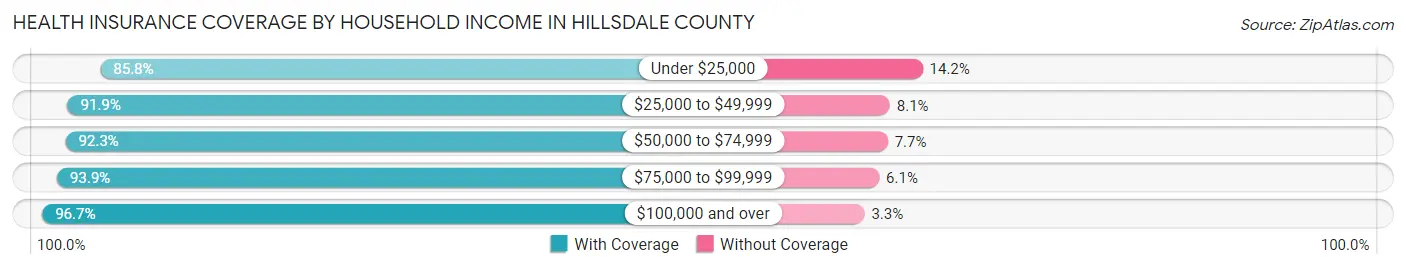
| Household Income | With Coverage | Without Coverage |
| Under $25,000 | 4,757 (85.8%) | 787 (14.2%) |
| $25,000 to $49,999 | 8,912 (91.9%) | 781 (8.1%) |
| $50,000 to $74,999 | 8,339 (92.3%) | 692 (7.7%) |
| $75,000 to $99,999 | 6,467 (93.9%) | 417 (6.1%) |
| $100,000 and over | 12,580 (96.7%) | 430 (3.3%) |
Public vs Private Health Insurance Coverage by Age in Hillsdale County
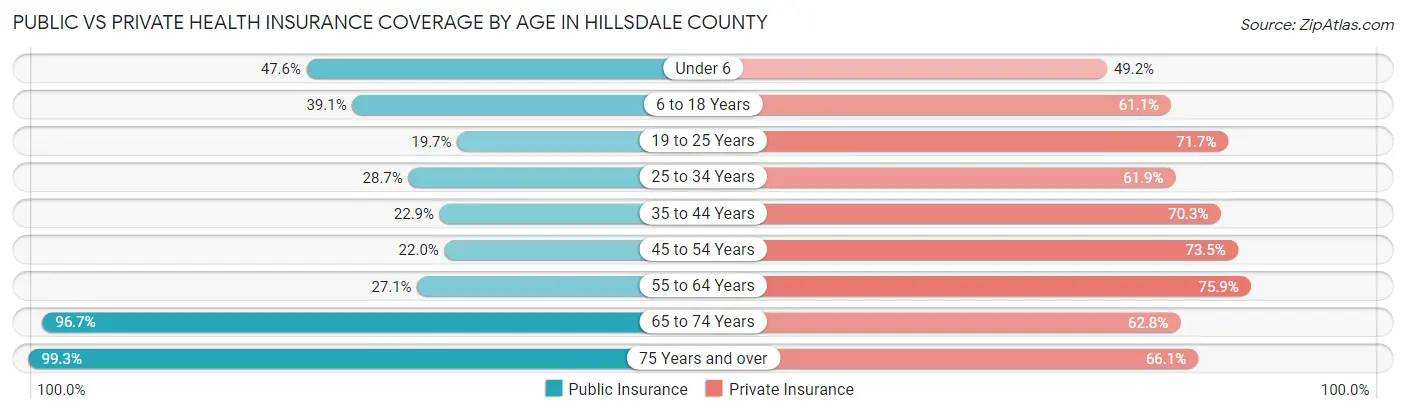
| Age Bracket | Public Insurance | Private Insurance |
| Under 6 | 1,490 (47.6%) | 1,540 (49.2%) |
| 6 to 18 Years | 2,906 (39.1%) | 4,535 (61.1%) |
| 19 to 25 Years | 789 (19.7%) | 2,877 (71.7%) |
| 25 to 34 Years | 1,255 (28.7%) | 2,705 (61.9%) |
| 35 to 44 Years | 1,114 (22.9%) | 3,414 (70.3%) |
| 45 to 54 Years | 1,217 (22.0%) | 4,058 (73.5%) |
| 55 to 64 Years | 1,878 (27.1%) | 5,263 (75.9%) |
| 65 to 74 Years | 5,445 (96.7%) | 3,535 (62.8%) |
| 75 Years and over | 3,482 (99.3%) | 2,319 (66.1%) |
| Total | 19,576 (43.1%) | 30,246 (66.6%) |
Disability Status by Sex by Age in Hillsdale County
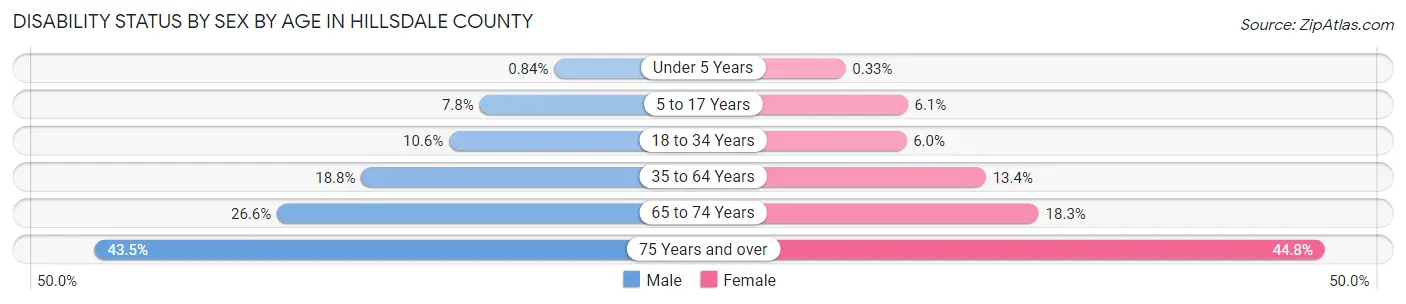
| Age Bracket | Male | Female |
| Under 5 Years | 11 (0.8%) | 4 (0.3%) |
| 5 to 17 Years | 286 (7.8%) | 217 (6.1%) |
| 18 to 34 Years | 500 (10.6%) | 267 (6.0%) |
| 35 to 64 Years | 1,641 (18.8%) | 1,145 (13.4%) |
| 65 to 74 Years | 734 (26.6%) | 524 (18.3%) |
| 75 Years and over | 669 (43.5%) | 883 (44.8%) |
Disability Class by Sex by Age in Hillsdale County
Disability Class: Hearing Difficulty
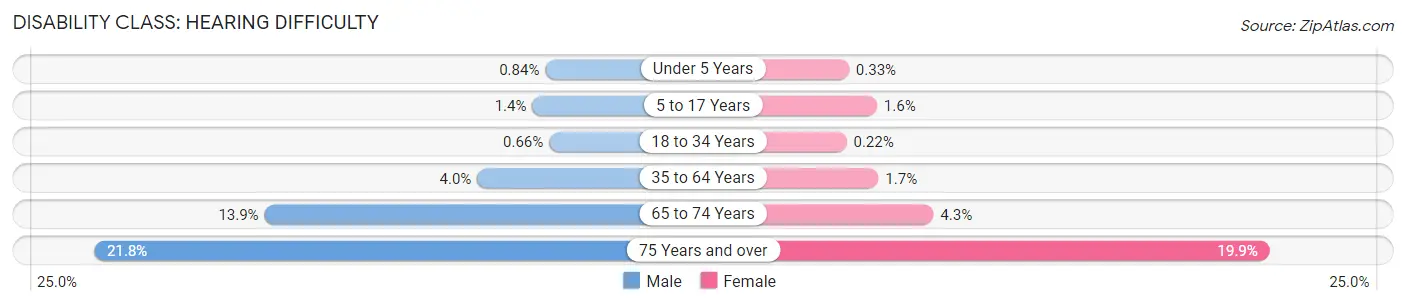
| Age Bracket | Male | Female |
| Under 5 Years | 11 (0.8%) | 4 (0.3%) |
| 5 to 17 Years | 53 (1.4%) | 58 (1.6%) |
| 18 to 34 Years | 31 (0.7%) | 10 (0.2%) |
| 35 to 64 Years | 350 (4.0%) | 146 (1.7%) |
| 65 to 74 Years | 383 (13.9%) | 122 (4.3%) |
| 75 Years and over | 335 (21.8%) | 391 (19.9%) |
Disability Class: Vision Difficulty
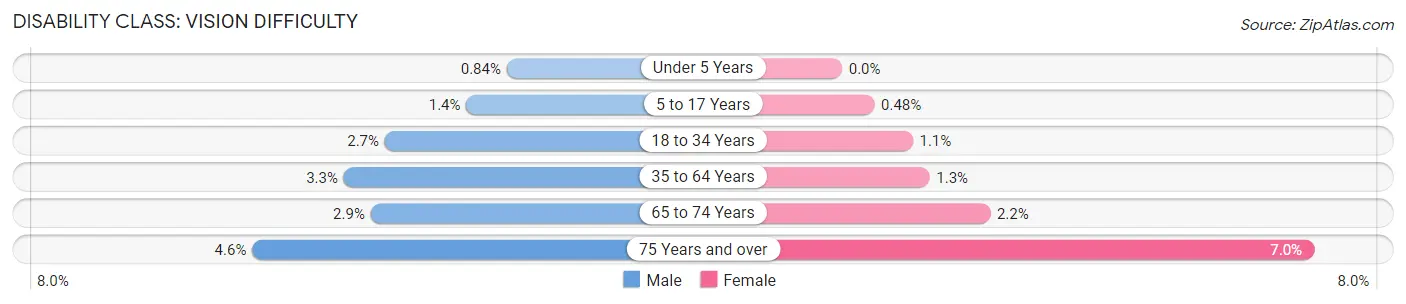
| Age Bracket | Male | Female |
| Under 5 Years | 11 (0.8%) | 0 (0.0%) |
| 5 to 17 Years | 53 (1.4%) | 17 (0.5%) |
| 18 to 34 Years | 125 (2.6%) | 47 (1.1%) |
| 35 to 64 Years | 285 (3.3%) | 111 (1.3%) |
| 65 to 74 Years | 79 (2.9%) | 63 (2.2%) |
| 75 Years and over | 71 (4.6%) | 138 (7.0%) |
Disability Class: Cognitive Difficulty
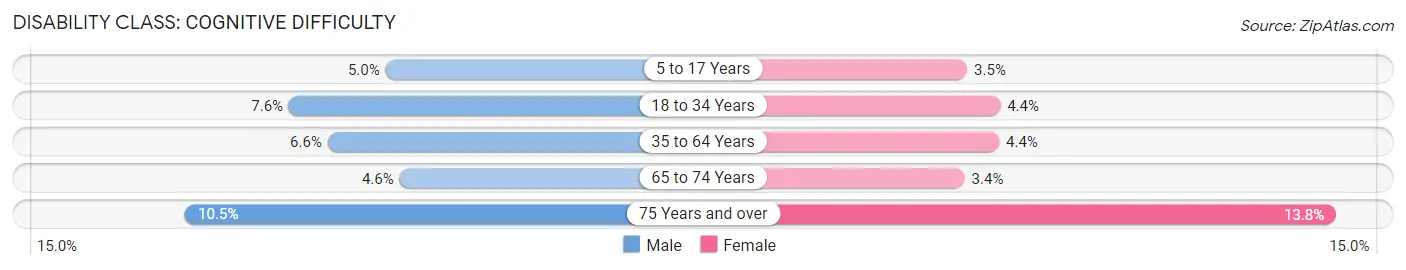
| Age Bracket | Male | Female |
| 5 to 17 Years | 182 (5.0%) | 124 (3.5%) |
| 18 to 34 Years | 360 (7.6%) | 197 (4.4%) |
| 35 to 64 Years | 574 (6.6%) | 375 (4.4%) |
| 65 to 74 Years | 126 (4.6%) | 98 (3.4%) |
| 75 Years and over | 162 (10.5%) | 271 (13.8%) |
Disability Class: Ambulatory Difficulty
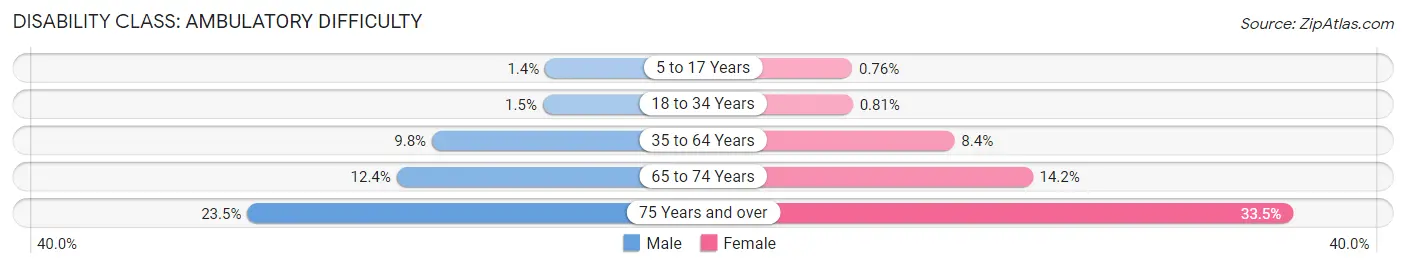
| Age Bracket | Male | Female |
| 5 to 17 Years | 50 (1.4%) | 27 (0.8%) |
| 18 to 34 Years | 72 (1.5%) | 36 (0.8%) |
| 35 to 64 Years | 854 (9.8%) | 716 (8.4%) |
| 65 to 74 Years | 342 (12.4%) | 406 (14.2%) |
| 75 Years and over | 361 (23.5%) | 660 (33.5%) |
Disability Class: Self-Care Difficulty
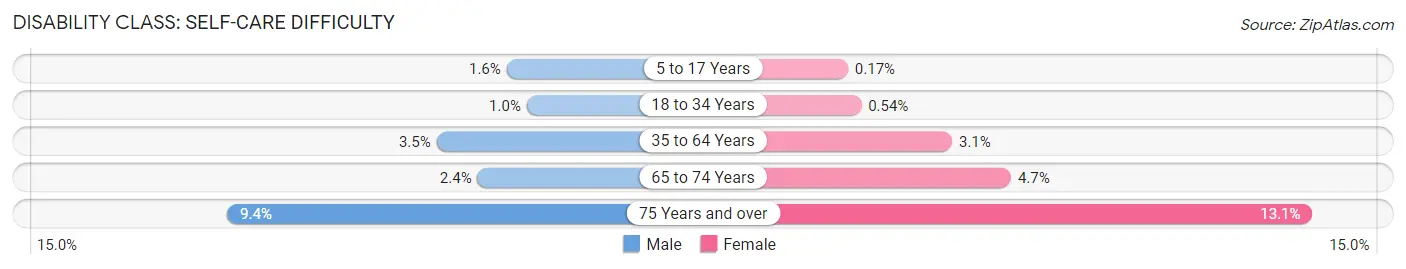
| Age Bracket | Male | Female |
| 5 to 17 Years | 58 (1.6%) | 6 (0.2%) |
| 18 to 34 Years | 48 (1.0%) | 24 (0.5%) |
| 35 to 64 Years | 309 (3.5%) | 263 (3.1%) |
| 65 to 74 Years | 66 (2.4%) | 135 (4.7%) |
| 75 Years and over | 144 (9.4%) | 258 (13.1%) |
Technology Access in Hillsdale County
Computing Device Access in Hillsdale County
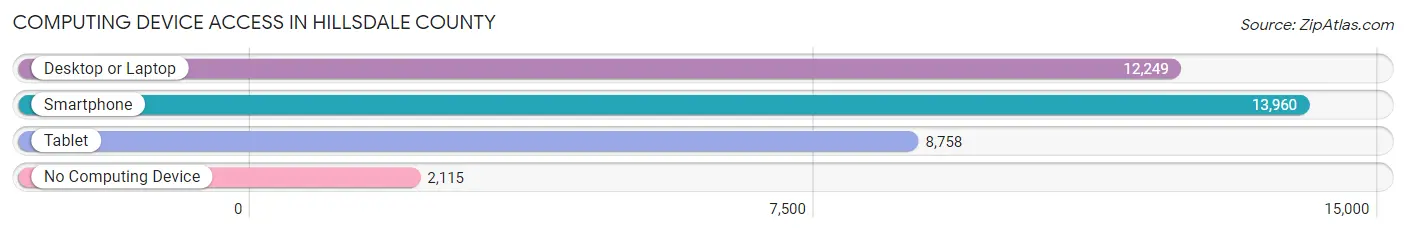
| Device Type | # Households | % Households |
| Desktop or Laptop | 12,249 | 69.6% |
| Smartphone | 13,960 | 79.3% |
| Tablet | 8,758 | 49.7% |
| No Computing Device | 2,115 | 12.0% |
| Total | 17,606 | 100.0% |
Internet Access in Hillsdale County
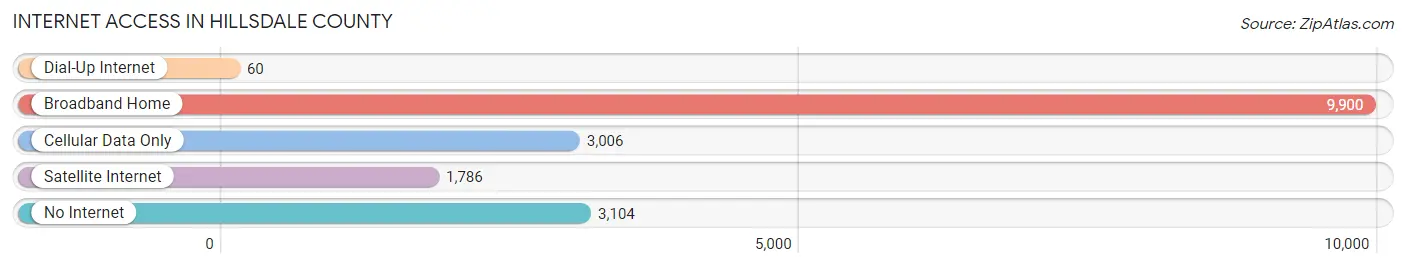
| Internet Type | # Households | % Households |
| Dial-Up Internet | 60 | 0.3% |
| Broadband Home | 9,900 | 56.2% |
| Cellular Data Only | 3,006 | 17.1% |
| Satellite Internet | 1,786 | 10.1% |
| No Internet | 3,104 | 17.6% |
| Total | 17,606 | 100.0% |
Hillsdale County Summary
Hillsdale County is located in the south-central region of Michigan, and is part of the Great Lakes region. It is bordered by Jackson County to the north, Lenawee County to the east, Branch County to the south, and Calhoun County to the west. The county seat is Hillsdale, and the county has a total area of 576 square miles.
History
Hillsdale County was established in 1829, and was named after the city of Hillsdale, which was named after the hills in the area. The county was originally part of the Michigan Territory, and was part of the Northwest Territory before that. The first settlers in the area were mostly of English and German descent, and the county was largely agricultural.
In the mid-1800s, the county experienced a population boom due to the construction of the Michigan Central Railroad, which connected Hillsdale to Detroit. This allowed for the transportation of goods and people, and helped to spur economic growth in the area.
In the late 1800s, the county experienced a period of industrialization, with the establishment of several factories and mills. This period of growth was short-lived, however, as the Great Depression hit the area hard. The county experienced a population decline during this time, and many of the factories and mills closed.
Geography
Hillsdale County is located in the south-central region of Michigan, and is part of the Great Lakes region. It is bordered by Jackson County to the north, Lenawee County to the east, Branch County to the south, and Calhoun County to the west. The county seat is Hillsdale, and the county has a total area of 576 square miles.
The terrain of the county is mostly flat, with some rolling hills in the northern and western parts of the county. The county is home to several rivers, including the St. Joseph River, the Kalamazoo River, and the Grand River. The county is also home to several lakes, including Baw Beese Lake, Wamplers Lake, and Lake LeAnn.
Economy
Hillsdale County has a diverse economy, with a mix of manufacturing, agriculture, and services. The county is home to several manufacturing companies, including Hillsdale Furniture, Hillsdale Plastics, and Hillsdale Tool & Die. The county is also home to several agricultural operations, including dairy farms, beef farms, and vegetable farms.
The county is also home to several service-based businesses, including healthcare, retail, and hospitality. The county is home to several hospitals, including Hillsdale Hospital and Hillsdale Community Health Center. The county is also home to several retail stores, including Walmart, Meijer, and Target.
Demographics
As of the 2010 census, the population of Hillsdale County was 46,688. The population is mostly white (94.2%), with small percentages of African American (2.2%), Hispanic (1.3%), and Asian (0.7%) populations. The median household income in the county is $45,845, and the median age is 40.
The county is home to several colleges and universities, including Hillsdale College, Spring Arbor University, and Jackson College. The county is also home to several museums, including the Hillsdale County Historical Museum and the Hillsdale County Agricultural Museum.
Conclusion
Hillsdale County is located in the south-central region of Michigan, and is part of the Great Lakes region. It is bordered by Jackson County to the north, Lenawee County to the east, Branch County to the south, and Calhoun County to the west. The county has a diverse economy, with a mix of manufacturing, agriculture, and services. The population of the county is mostly white, with small percentages of African American, Hispanic, and Asian populations. The county is home to several colleges and universities, as well as several museums.
Common Questions
What is Per Capita Income in Hillsdale County?
Per Capita income in Hillsdale County is $30,409.
What is the Median Family Income in Hillsdale County?
Median Family Income in Hillsdale County is $71,224.
What is the Median Household income in Hillsdale County?
Median Household Income in Hillsdale County is $59,425.
What is Income or Wage Gap in Hillsdale County?
Income or Wage Gap in Hillsdale County is 35.5%.
Women in Hillsdale County earn 64.5 cents for every dollar earned by a man.
What is Family Income Deficit in Hillsdale County?
Family Income Deficit in Hillsdale County is $11,765.
Families that are below poverty line in Hillsdale County earn $11,765 less on average than the poverty threshold level.
What is Inequality or Gini Index in Hillsdale County?
Inequality or Gini Index in Hillsdale County is 0.42.
What is the Total Population of Hillsdale County?
Total Population of Hillsdale County is 45,698.
What is the Total Male Population of Hillsdale County?
Total Male Population of Hillsdale County is 22,937.
What is the Total Female Population of Hillsdale County?
Total Female Population of Hillsdale County is 22,761.
What is the Ratio of Males per 100 Females in Hillsdale County?
There are 100.77 Males per 100 Females in Hillsdale County.
What is the Ratio of Females per 100 Males in Hillsdale County?
There are 99.23 Females per 100 Males in Hillsdale County.
What is the Median Population Age in Hillsdale County?
Median Population Age in Hillsdale County is 42.8 Years.
What is the Average Family Size in Hillsdale County
Average Family Size in Hillsdale County is 3.1 People.
What is the Average Household Size in Hillsdale County
Average Household Size in Hillsdale County is 2.5 People.
How Large is the Labor Force in Hillsdale County?
There are 21,129 People in the Labor Forcein in Hillsdale County.
What is the Percentage of People in the Labor Force in Hillsdale County?
56.9% of People are in the Labor Force in Hillsdale County.
What is the Unemployment Rate in Hillsdale County?
Unemployment Rate in Hillsdale County is 4.4%.