Gratiot County, MI Map & Demographics
Gratiot County Map
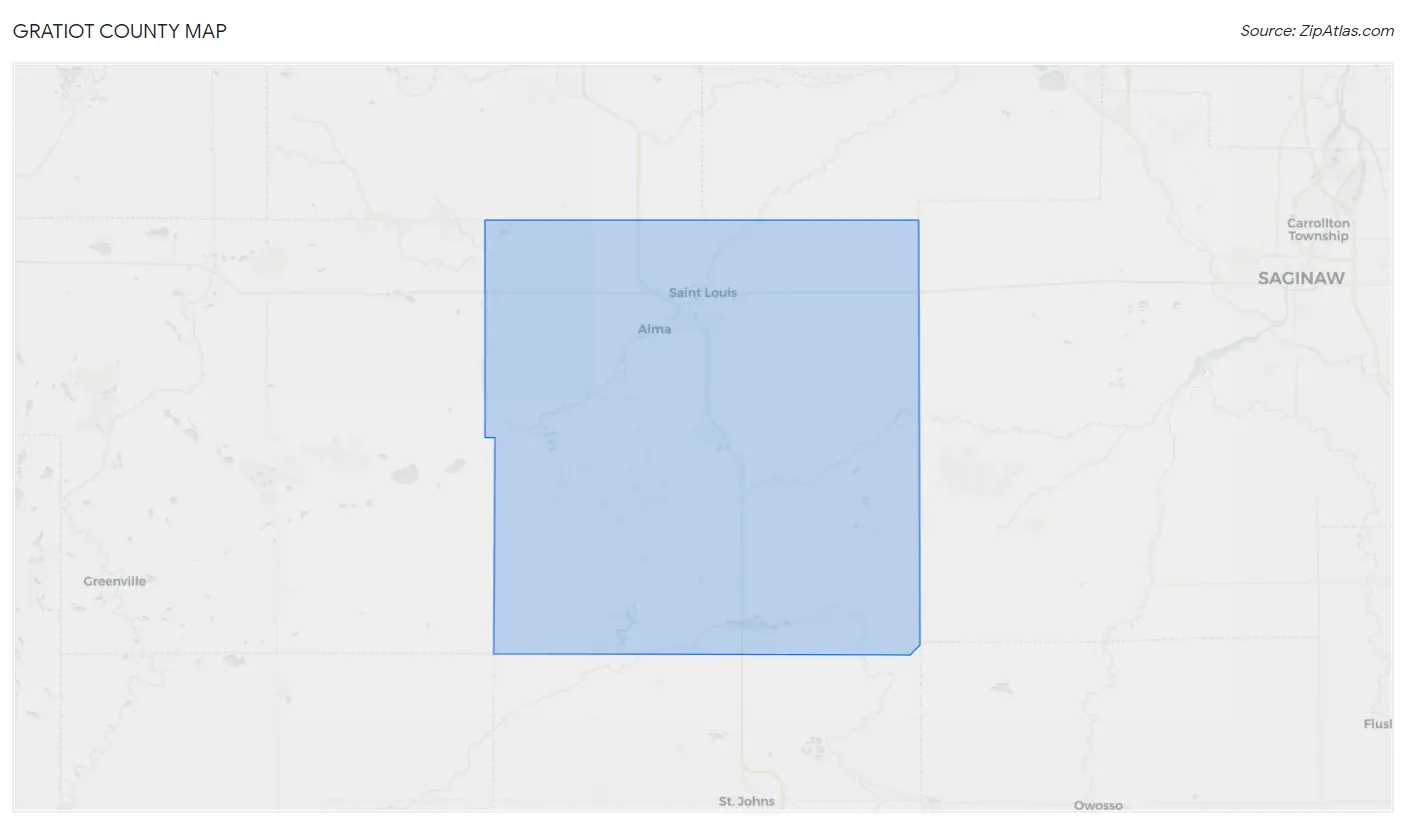
Gratiot County Overview
$28,123
PER CAPITA INCOME
$69,294
AVG FAMILY INCOME
$57,934
AVG HOUSEHOLD INCOME
29.8%
WAGE / INCOME GAP [ % ]
70.2¢/ $1
WAGE / INCOME GAP [ $ ]
$11,555
FAMILY INCOME DEFICIT
0.44
INEQUALITY / GINI INDEX
41,534
TOTAL POPULATION
22,438
MALE POPULATION
19,096
FEMALE POPULATION
117.50
MALES / 100 FEMALES
85.11
FEMALES / 100 MALES
39.6
MEDIAN AGE
2.9
AVG FAMILY SIZE
2.4
AVG HOUSEHOLD SIZE
18,034
LABOR FORCE [ PEOPLE ]
52.1%
PERCENT IN LABOR FORCE
4.9%
UNEMPLOYMENT RATE
Gratiot County Area Codes
Income in Gratiot County
Income Overview in Gratiot County
Per Capita Income in Gratiot County is $28,123, while median incomes of families and households are $69,294 and $57,934 respectively.
| Characteristic | Number | Measure |
| Per Capita Income | 41,534 | $28,123 |
| Median Family Income | 9,911 | $69,294 |
| Mean Family Income | 9,911 | $90,959 |
| Median Household Income | 14,705 | $57,934 |
| Mean Household Income | 14,705 | $77,560 |
| Income Deficit | 9,911 | $11,555 |
| Wage / Income Gap (%) | 41,534 | 29.75% |
| Wage / Income Gap ($) | 41,534 | 70.25¢ per $1 |
| Gini / Inequality Index | 41,534 | 0.44 |
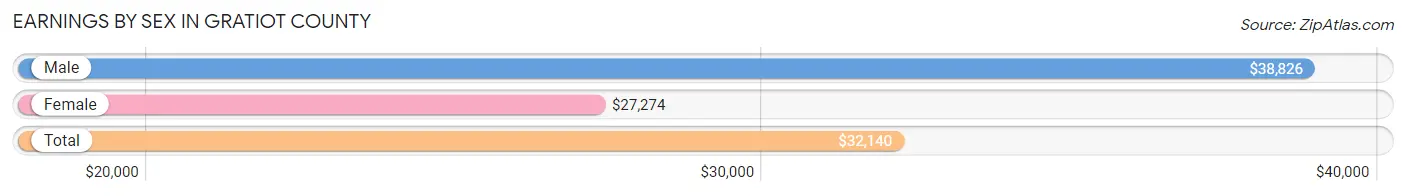
Earnings by Sex in Gratiot County
Average Earnings in Gratiot County are $32,140, $38,826 for men and $27,274 for women, a difference of 29.7%.
| Sex | Number | Average Earnings |
| Male | 10,401 (52.9%) | $38,826 |
| Female | 9,242 (47.0%) | $27,274 |
| Total | 19,643 (100.0%) | $32,140 |
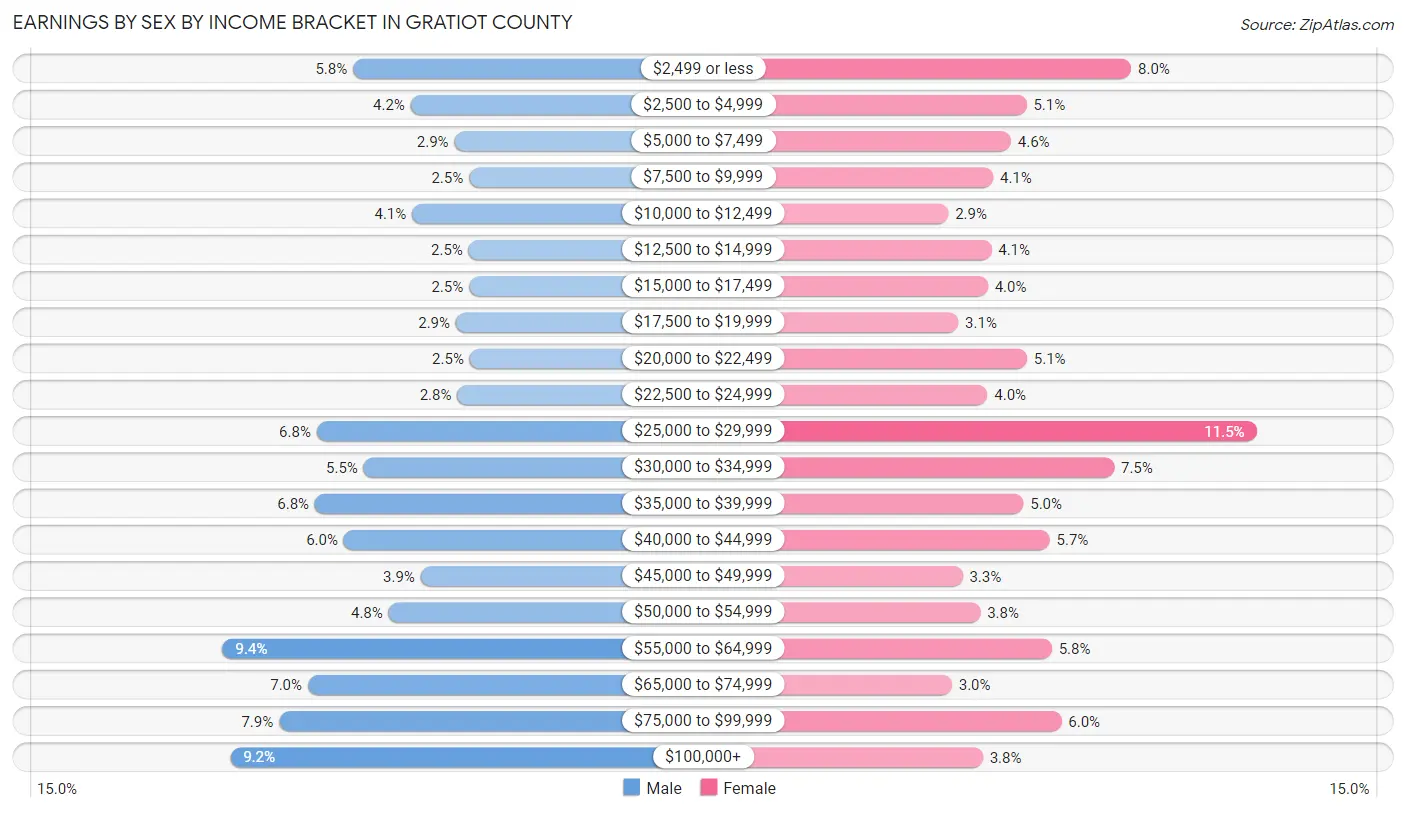
Earnings by Sex by Income Bracket in Gratiot County
The most common earnings brackets in Gratiot County are $55,000 to $64,999 for men (982 | 9.4%) and $25,000 to $29,999 for women (1,064 | 11.5%).
| Income | Male | Female |
| $2,499 or less | 600 (5.8%) | 738 (8.0%) |
| $2,500 to $4,999 | 432 (4.2%) | 467 (5.1%) |
| $5,000 to $7,499 | 304 (2.9%) | 426 (4.6%) |
| $7,500 to $9,999 | 261 (2.5%) | 380 (4.1%) |
| $10,000 to $12,499 | 427 (4.1%) | 263 (2.9%) |
| $12,500 to $14,999 | 262 (2.5%) | 375 (4.1%) |
| $15,000 to $17,499 | 261 (2.5%) | 366 (4.0%) |
| $17,500 to $19,999 | 300 (2.9%) | 289 (3.1%) |
| $20,000 to $22,499 | 259 (2.5%) | 468 (5.1%) |
| $22,500 to $24,999 | 295 (2.8%) | 365 (4.0%) |
| $25,000 to $29,999 | 706 (6.8%) | 1,064 (11.5%) |
| $30,000 to $34,999 | 569 (5.5%) | 694 (7.5%) |
| $35,000 to $39,999 | 711 (6.8%) | 458 (5.0%) |
| $40,000 to $44,999 | 627 (6.0%) | 527 (5.7%) |
| $45,000 to $49,999 | 402 (3.9%) | 300 (3.3%) |
| $50,000 to $54,999 | 496 (4.8%) | 347 (3.7%) |
| $55,000 to $64,999 | 982 (9.4%) | 532 (5.8%) |
| $65,000 to $74,999 | 732 (7.0%) | 273 (2.9%) |
| $75,000 to $99,999 | 816 (7.9%) | 557 (6.0%) |
| $100,000+ | 959 (9.2%) | 353 (3.8%) |
| Total | 10,401 (100.0%) | 9,242 (100.0%) |
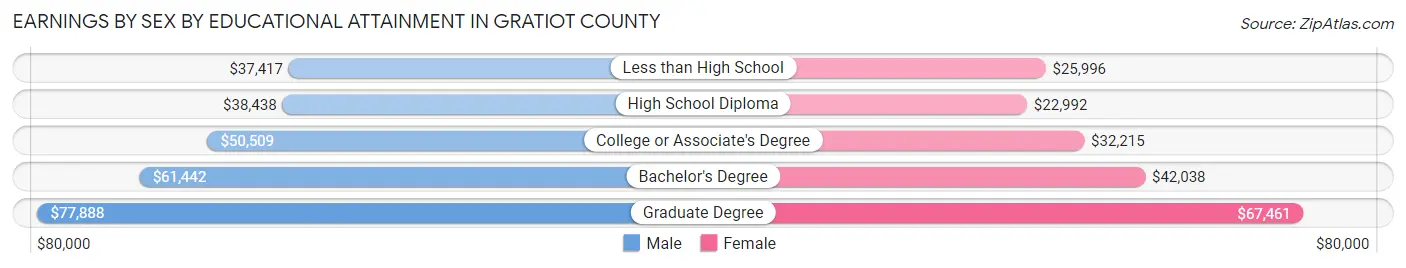
Earnings by Sex by Educational Attainment in Gratiot County
Average earnings in Gratiot County are $45,831 for men and $31,633 for women, a difference of 31.0%. Men with an educational attainment of graduate degree enjoy the highest average annual earnings of $77,888, while those with less than high school education earn the least with $37,417. Women with an educational attainment of graduate degree earn the most with the average annual earnings of $67,461, while those with high school diploma education have the smallest earnings of $22,992.
| Educational Attainment | Male Income | Female Income |
| Less than High School | $37,417 | $25,996 |
| High School Diploma | $38,438 | $22,992 |
| College or Associate's Degree | $50,509 | $32,215 |
| Bachelor's Degree | $61,442 | $42,038 |
| Graduate Degree | $77,888 | $67,461 |
| Total | $45,831 | $31,633 |
Family Income in Gratiot County
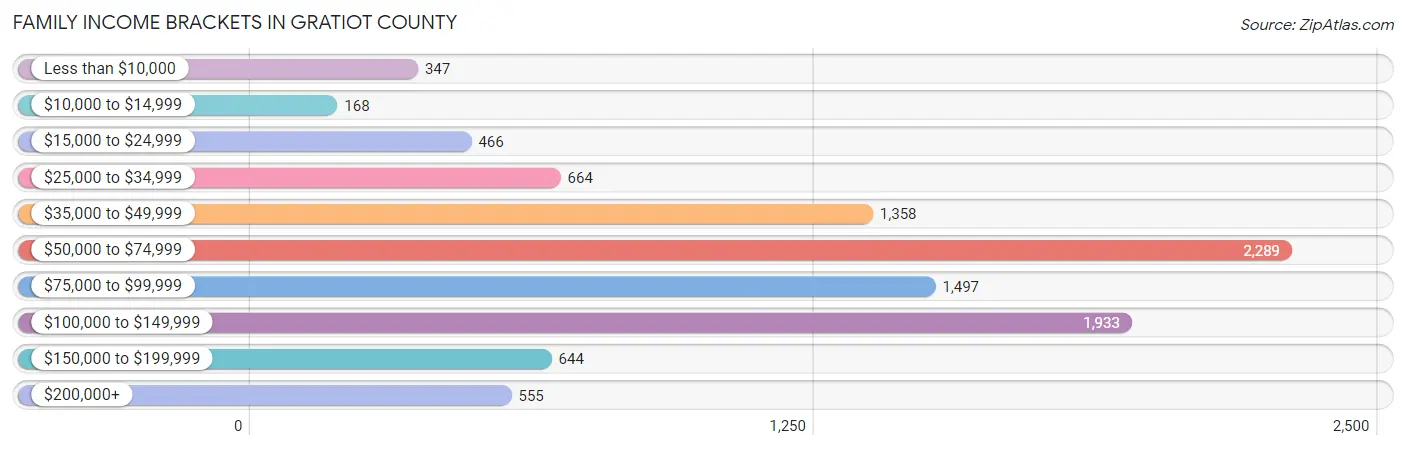
Family Income Brackets in Gratiot County
According to the Gratiot County family income data, there are 2,289 families falling into the $50,000 to $74,999 income range, which is the most common income bracket and makes up 23.1% of all families. Conversely, the $10,000 to $14,999 income bracket is the least frequent group with only 168 families (1.7%) belonging to this category.
| Income Bracket | # Families | % Families |
| Less than $10,000 | 347 | 3.5% |
| $10,000 to $14,999 | 168 | 1.7% |
| $15,000 to $24,999 | 466 | 4.7% |
| $25,000 to $34,999 | 664 | 6.7% |
| $35,000 to $49,999 | 1,358 | 13.7% |
| $50,000 to $74,999 | 2,289 | 23.1% |
| $75,000 to $99,999 | 1,497 | 15.1% |
| $100,000 to $149,999 | 1,933 | 19.5% |
| $150,000 to $199,999 | 644 | 6.5% |
| $200,000+ | 555 | 5.6% |
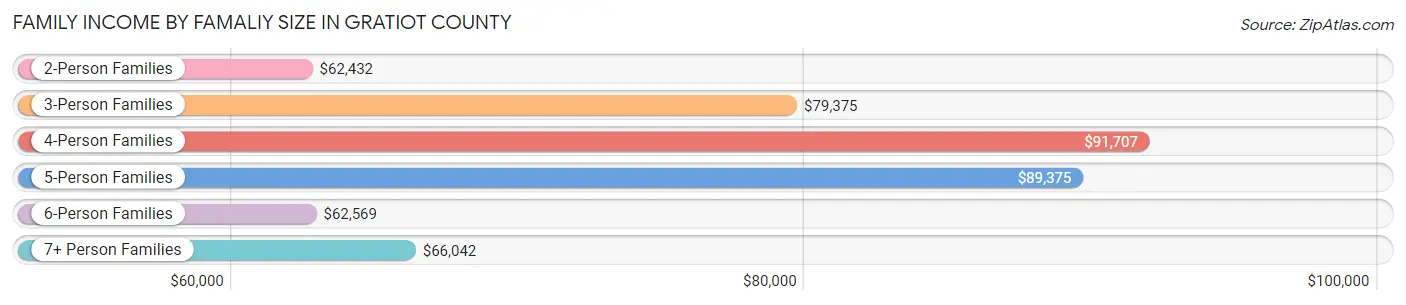
Family Income by Famaliy Size in Gratiot County
4-person families (1,469 | 14.8%) account for the highest median family income in Gratiot County with $91,707 per family, while 2-person families (5,265 | 53.1%) have the highest median income of $31,216 per family member.
| Income Bracket | # Families | Median Income |
| 2-Person Families | 5,265 (53.1%) | $62,432 |
| 3-Person Families | 1,968 (19.9%) | $79,375 |
| 4-Person Families | 1,469 (14.8%) | $91,707 |
| 5-Person Families | 847 (8.6%) | $89,375 |
| 6-Person Families | 257 (2.6%) | $62,569 |
| 7+ Person Families | 105 (1.1%) | $66,042 |
| Total | 9,911 (100.0%) | $69,294 |
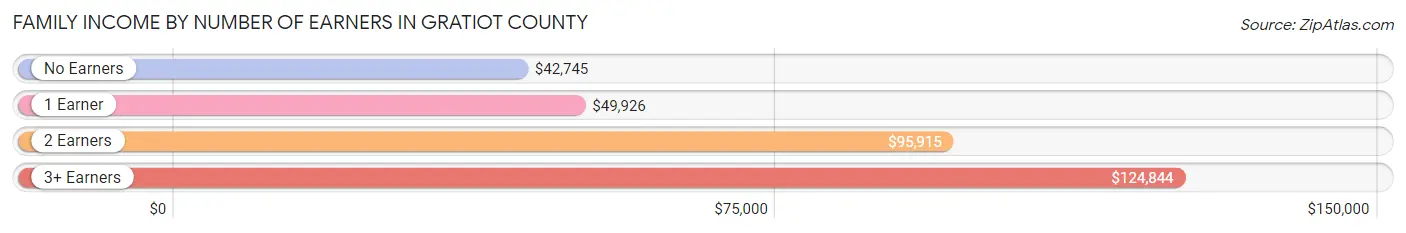
Family Income by Number of Earners in Gratiot County
The median family income in Gratiot County is $69,294, with families comprising 3+ earners (1,051) having the highest median family income of $124,844, while families with no earners (1,762) have the lowest median family income of $42,745, accounting for 10.6% and 17.8% of families, respectively.
| Number of Earners | # Families | Median Income |
| No Earners | 1,762 (17.8%) | $42,745 |
| 1 Earner | 3,338 (33.7%) | $49,926 |
| 2 Earners | 3,760 (37.9%) | $95,915 |
| 3+ Earners | 1,051 (10.6%) | $124,844 |
| Total | 9,911 (100.0%) | $69,294 |
Household Income in Gratiot County
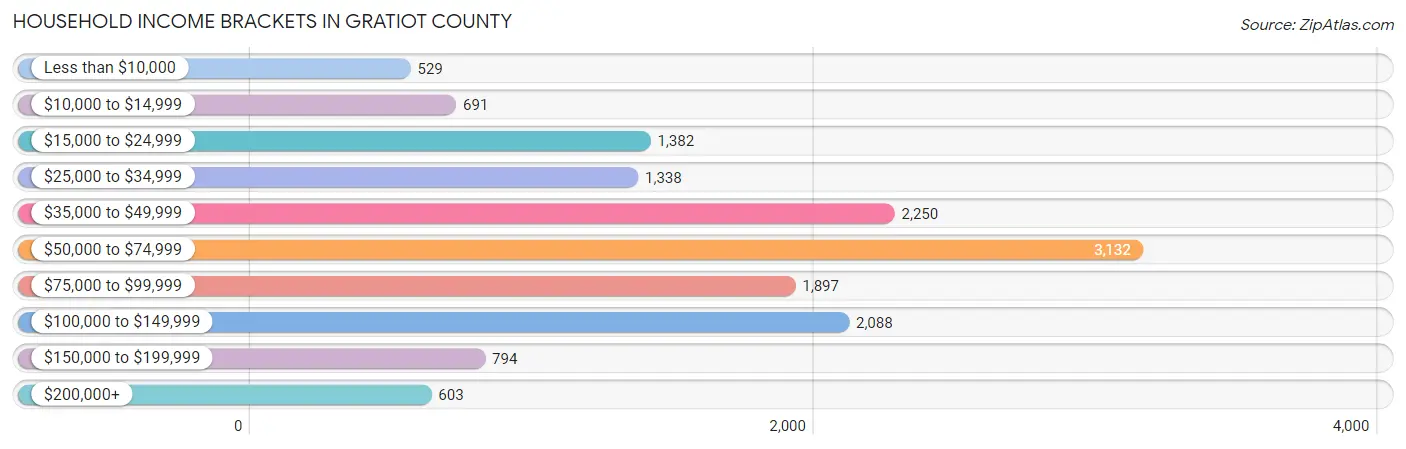
Household Income Brackets in Gratiot County
With 3,132 households falling in the category, the $50,000 to $74,999 income range is the most frequent in Gratiot County, accounting for 21.3% of all households. In contrast, only 529 households (3.6%) fall into the less than $10,000 income bracket, making it the least populous group.
| Income Bracket | # Households | % Households |
| Less than $10,000 | 529 | 3.6% |
| $10,000 to $14,999 | 691 | 4.7% |
| $15,000 to $24,999 | 1,382 | 9.4% |
| $25,000 to $34,999 | 1,338 | 9.1% |
| $35,000 to $49,999 | 2,250 | 15.3% |
| $50,000 to $74,999 | 3,132 | 21.3% |
| $75,000 to $99,999 | 1,897 | 12.9% |
| $100,000 to $149,999 | 2,088 | 14.2% |
| $150,000 to $199,999 | 794 | 5.4% |
| $200,000+ | 603 | 4.1% |
Household Income by Householder Age in Gratiot County
The median household income in Gratiot County is $57,934, with the highest median household income of $69,449 found in the 45 to 64 years age bracket for the primary householder. A total of 5,470 households (37.2%) fall into this category. Meanwhile, the 65+ years age bracket for the primary householder has the lowest median household income of $40,155, with 4,338 households (29.5%) in this group.
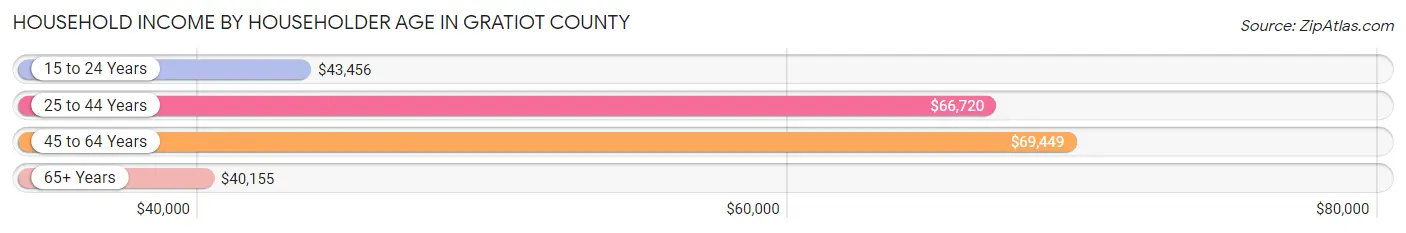
| Income Bracket | # Households | Median Income |
| 15 to 24 Years | 625 (4.3%) | $43,456 |
| 25 to 44 Years | 4,272 (29.0%) | $66,720 |
| 45 to 64 Years | 5,470 (37.2%) | $69,449 |
| 65+ Years | 4,338 (29.5%) | $40,155 |
| Total | 14,705 (100.0%) | $57,934 |
Poverty in Gratiot County
Income Below Poverty by Sex and Age in Gratiot County
With 12.3% poverty level for males and 15.8% for females among the residents of Gratiot County, under 5 year old males and 5 year old females are the most vulnerable to poverty, with 252 males (26.9%) and 83 females (34.9%) in their respective age groups living below the poverty level.
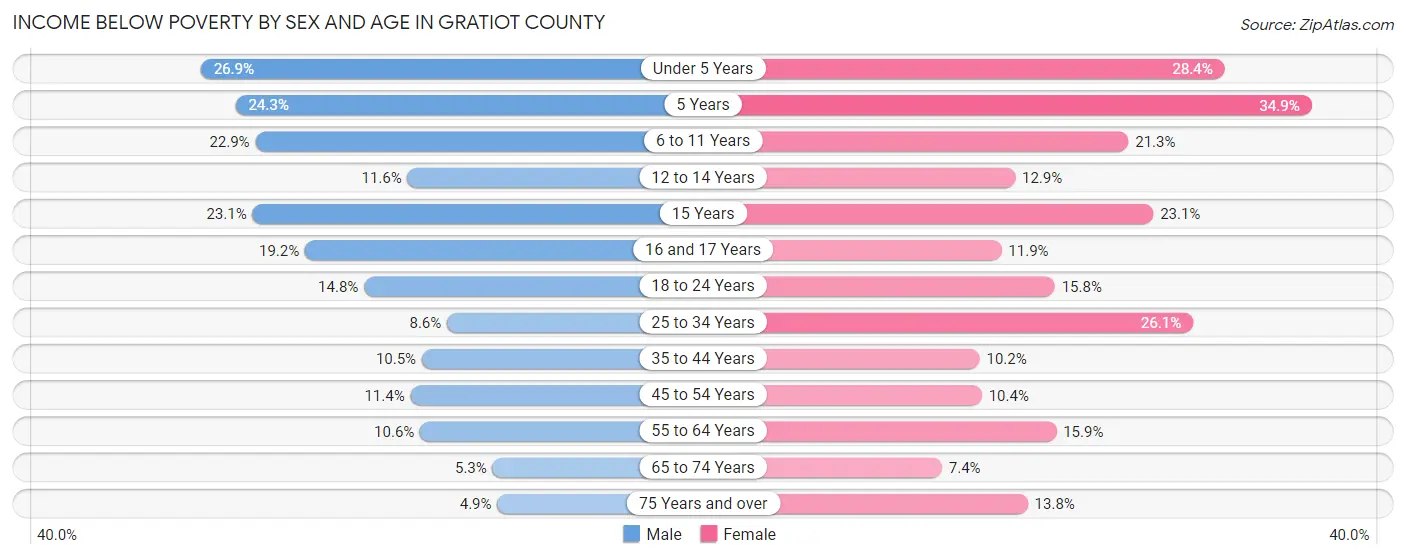
| Age Bracket | Male | Female |
| Under 5 Years | 252 (26.9%) | 272 (28.4%) |
| 5 Years | 37 (24.3%) | 83 (34.9%) |
| 6 to 11 Years | 313 (22.9%) | 312 (21.3%) |
| 12 to 14 Years | 76 (11.6%) | 58 (12.9%) |
| 15 Years | 54 (23.1%) | 43 (23.1%) |
| 16 and 17 Years | 112 (19.2%) | 55 (11.8%) |
| 18 to 24 Years | 245 (14.8%) | 241 (15.8%) |
| 25 to 34 Years | 174 (8.6%) | 554 (26.1%) |
| 35 to 44 Years | 232 (10.5%) | 226 (10.2%) |
| 45 to 54 Years | 246 (11.4%) | 227 (10.4%) |
| 55 to 64 Years | 261 (10.6%) | 407 (15.9%) |
| 65 to 74 Years | 97 (5.2%) | 151 (7.4%) |
| 75 Years and over | 58 (4.9%) | 221 (13.8%) |
| Total | 2,157 (12.3%) | 2,850 (15.8%) |
Income Above Poverty by Sex and Age in Gratiot County
According to the poverty statistics in Gratiot County, males aged 75 years and over and females aged 65 to 74 years are the age groups that are most secure financially, with 95.1% of males and 92.6% of females in these age groups living above the poverty line.
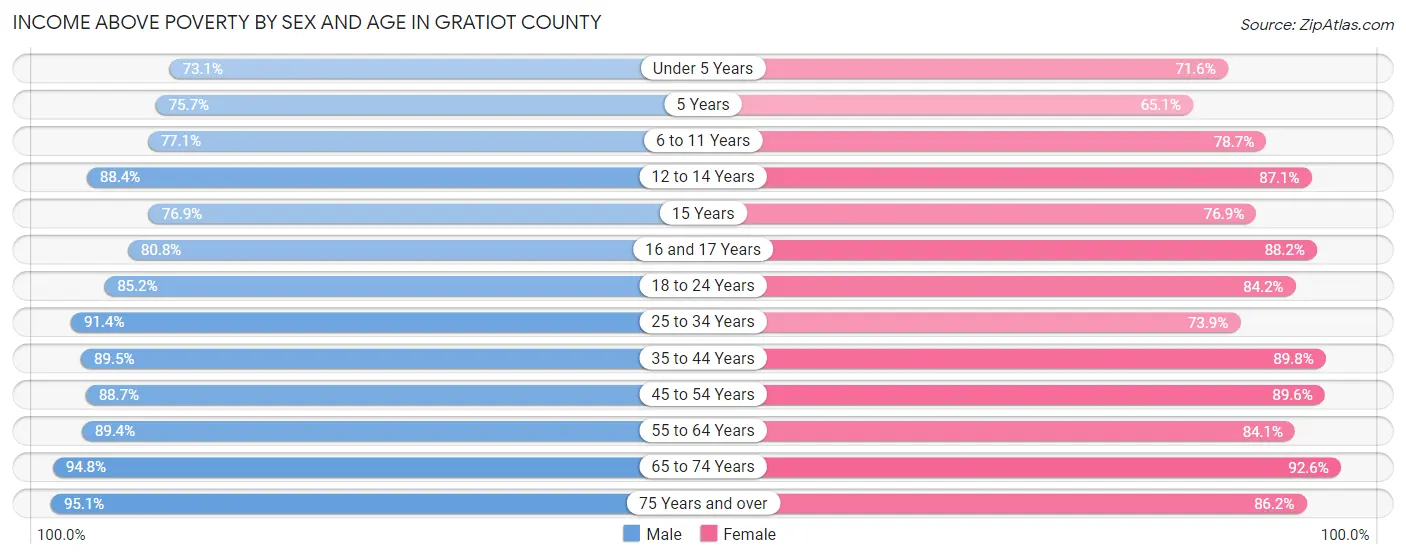
| Age Bracket | Male | Female |
| Under 5 Years | 684 (73.1%) | 685 (71.6%) |
| 5 Years | 115 (75.7%) | 155 (65.1%) |
| 6 to 11 Years | 1,056 (77.1%) | 1,155 (78.7%) |
| 12 to 14 Years | 581 (88.4%) | 393 (87.1%) |
| 15 Years | 180 (76.9%) | 143 (76.9%) |
| 16 and 17 Years | 472 (80.8%) | 409 (88.1%) |
| 18 to 24 Years | 1,412 (85.2%) | 1,283 (84.2%) |
| 25 to 34 Years | 1,843 (91.4%) | 1,570 (73.9%) |
| 35 to 44 Years | 1,977 (89.5%) | 1,983 (89.8%) |
| 45 to 54 Years | 1,922 (88.6%) | 1,957 (89.6%) |
| 55 to 64 Years | 2,195 (89.4%) | 2,149 (84.1%) |
| 65 to 74 Years | 1,752 (94.8%) | 1,881 (92.6%) |
| 75 Years and over | 1,126 (95.1%) | 1,381 (86.2%) |
| Total | 15,315 (87.6%) | 15,144 (84.2%) |
Income Below Poverty Among Married-Couple Families in Gratiot County
The poverty statistics for married-couple families in Gratiot County show that 4.4% or 336 of the total 7,601 families live below the poverty line. Families with 5 or more children have the highest poverty rate of 11.5%, comprising of 3 families. On the other hand, families with no children have the lowest poverty rate of 3.8%, which includes 192 families.
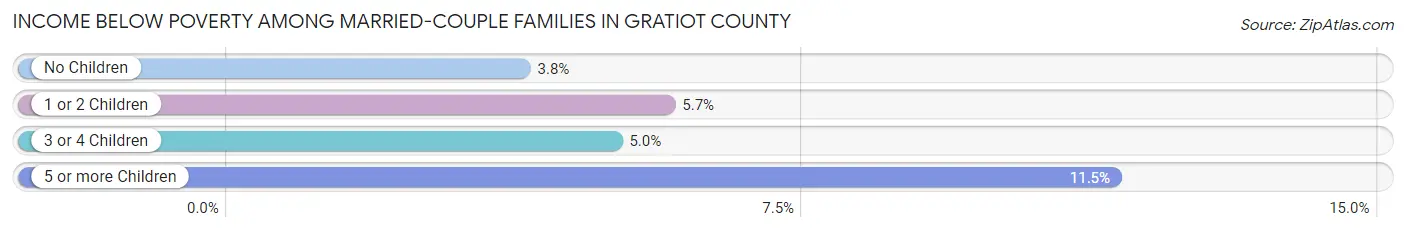
| Children | Above Poverty | Below Poverty |
| No Children | 4,833 (96.2%) | 192 (3.8%) |
| 1 or 2 Children | 1,784 (94.3%) | 108 (5.7%) |
| 3 or 4 Children | 625 (95.0%) | 33 (5.0%) |
| 5 or more Children | 23 (88.5%) | 3 (11.5%) |
| Total | 7,265 (95.6%) | 336 (4.4%) |
Income Below Poverty Among Single-Parent Households in Gratiot County
According to the poverty data in Gratiot County, 7.1% or 53 single-father households and 34.3% or 536 single-mother households are living below the poverty line. Among single-father households, those with 3 or 4 children have the highest poverty rate, with 20 households (30.3%) experiencing poverty. Likewise, among single-mother households, those with 5 or more children have the highest poverty rate, with 41 households (100.0%) falling below the poverty line.
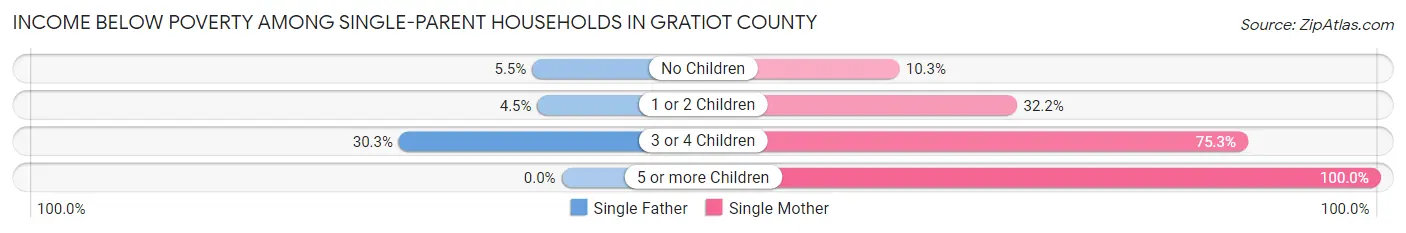
| Children | Single Father | Single Mother |
| No Children | 14 (5.5%) | 55 (10.3%) |
| 1 or 2 Children | 19 (4.5%) | 227 (32.2%) |
| 3 or 4 Children | 20 (30.3%) | 213 (75.3%) |
| 5 or more Children | 0 (0.0%) | 41 (100.0%) |
| Total | 53 (7.1%) | 536 (34.3%) |
Income Below Poverty Among Married-Couple vs Single-Parent Households in Gratiot County
The poverty data for Gratiot County shows that 336 of the married-couple family households (4.4%) and 589 of the single-parent households (25.5%) are living below the poverty level. Within the married-couple family households, those with 5 or more children have the highest poverty rate, with 3 households (11.5%) falling below the poverty line. Among the single-parent households, those with 5 or more children have the highest poverty rate, with 41 household (100.0%) living below poverty.
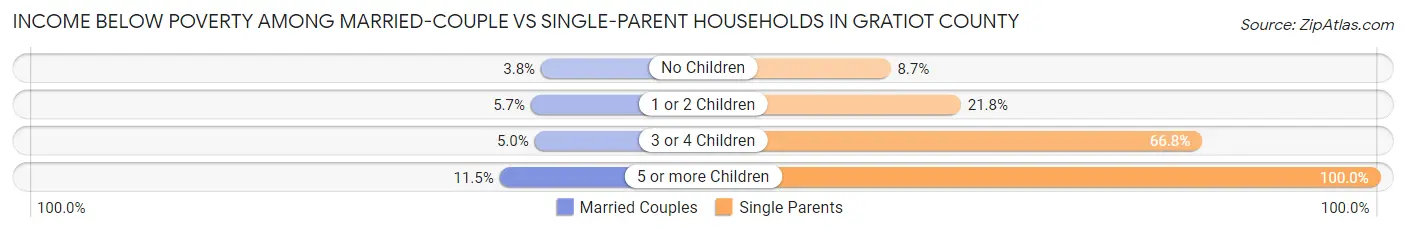
| Children | Married-Couple Families | Single-Parent Households |
| No Children | 192 (3.8%) | 69 (8.7%) |
| 1 or 2 Children | 108 (5.7%) | 246 (21.8%) |
| 3 or 4 Children | 33 (5.0%) | 233 (66.8%) |
| 5 or more Children | 3 (11.5%) | 41 (100.0%) |
| Total | 336 (4.4%) | 589 (25.5%) |
Race in Gratiot County
The most populous races in Gratiot County are White / Caucasian (36,783 | 88.6%), Hispanic or Latino (2,747 | 6.6%), and Black / African American (2,353 | 5.7%).
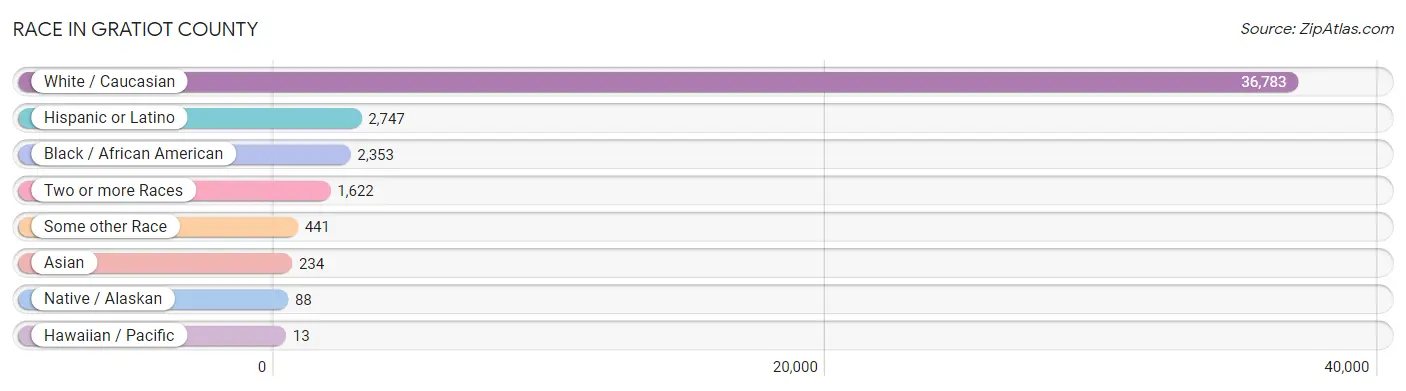
| Race | # Population | % Population |
| Asian | 234 | 0.6% |
| Black / African American | 2,353 | 5.7% |
| Hawaiian / Pacific | 13 | 0.0% |
| Hispanic or Latino | 2,747 | 6.6% |
| Native / Alaskan | 88 | 0.2% |
| White / Caucasian | 36,783 | 88.6% |
| Two or more Races | 1,622 | 3.9% |
| Some other Race | 441 | 1.1% |
| Total | 41,534 | 100.0% |
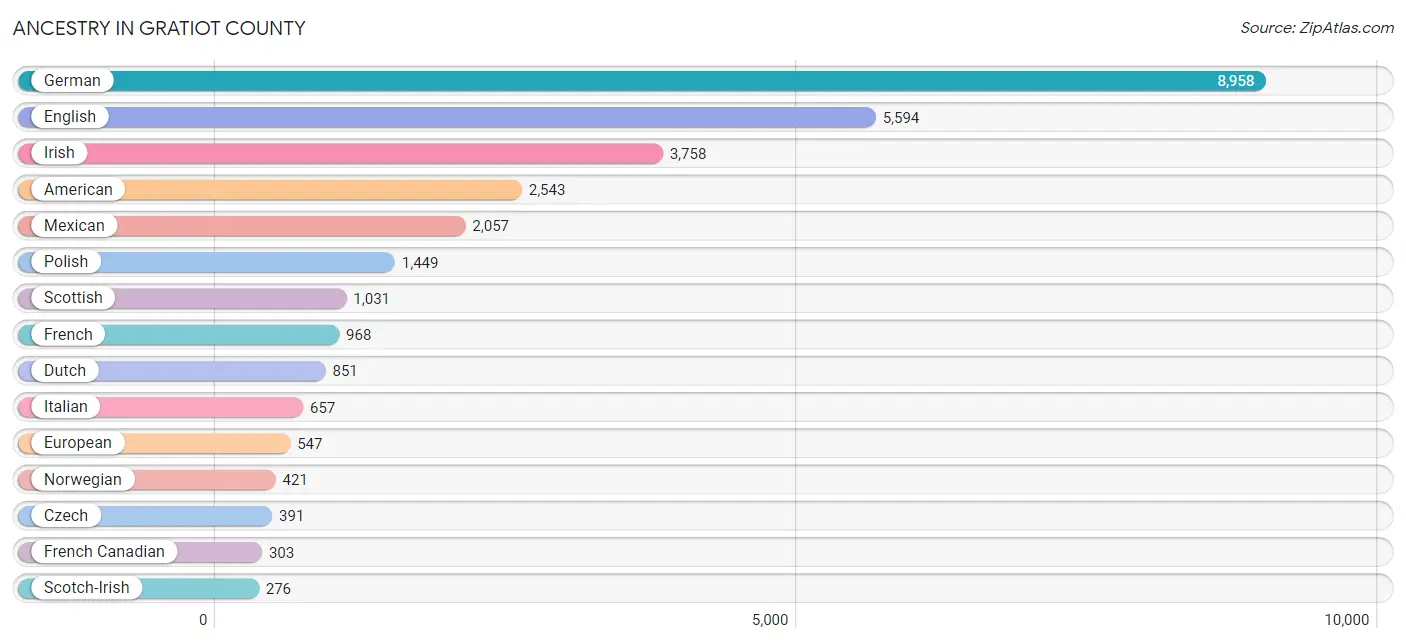
Ancestry in Gratiot County
The most populous ancestries reported in Gratiot County are German (8,958 | 21.6%), English (5,594 | 13.5%), Irish (3,758 | 9.0%), American (2,543 | 6.1%), and Mexican (2,057 | 5.0%), together accounting for 55.2% of all Gratiot County residents.
| Ancestry | # Population | % Population |
| African | 185 | 0.4% |
| Alsatian | 4 | 0.0% |
| American | 2,543 | 6.1% |
| Arab | 108 | 0.3% |
| Argentinean | 4 | 0.0% |
| Armenian | 8 | 0.0% |
| Australian | 7 | 0.0% |
| Austrian | 44 | 0.1% |
| Bangladeshi | 4 | 0.0% |
| Belgian | 140 | 0.3% |
| Bhutanese | 114 | 0.3% |
| Blackfeet | 35 | 0.1% |
| Brazilian | 14 | 0.0% |
| British | 122 | 0.3% |
| Burmese | 38 | 0.1% |
| Canadian | 144 | 0.4% |
| Celtic | 3 | 0.0% |
| Central American | 35 | 0.1% |
| Cherokee | 45 | 0.1% |
| Chippewa | 84 | 0.2% |
| Colombian | 28 | 0.1% |
| Croatian | 41 | 0.1% |
| Cuban | 80 | 0.2% |
| Czech | 391 | 0.9% |
| Czechoslovakian | 126 | 0.3% |
| Danish | 223 | 0.5% |
| Dutch | 851 | 2.1% |
| Eastern European | 58 | 0.1% |
| Egyptian | 13 | 0.0% |
| English | 5,594 | 13.5% |
| European | 547 | 1.3% |
| Finnish | 139 | 0.3% |
| French | 968 | 2.3% |
| French American Indian | 11 | 0.0% |
| French Canadian | 303 | 0.7% |
| German | 8,958 | 21.6% |
| Greek | 62 | 0.2% |
| Guamanian / Chamorro | 17 | 0.0% |
| Guatemalan | 13 | 0.0% |
| Haitian | 115 | 0.3% |
| Honduran | 4 | 0.0% |
| Hungarian | 178 | 0.4% |
| Icelander | 37 | 0.1% |
| Indian (Asian) | 40 | 0.1% |
| Iranian | 9 | 0.0% |
| Irish | 3,758 | 9.0% |
| Italian | 657 | 1.6% |
| Jamaican | 29 | 0.1% |
| Jordanian | 5 | 0.0% |
| Korean | 26 | 0.1% |
| Latvian | 10 | 0.0% |
| Lebanese | 12 | 0.0% |
| Liberian | 3 | 0.0% |
| Lithuanian | 31 | 0.1% |
| Luxembourger | 7 | 0.0% |
| Macedonian | 2 | 0.0% |
| Malaysian | 11 | 0.0% |
| Mexican | 2,057 | 5.0% |
| Moroccan | 60 | 0.1% |
| Native Hawaiian | 23 | 0.1% |
| Nigerian | 15 | 0.0% |
| Northern European | 33 | 0.1% |
| Norwegian | 421 | 1.0% |
| Ottawa | 25 | 0.1% |
| Panamanian | 9 | 0.0% |
| Paraguayan | 16 | 0.0% |
| Pennsylvania German | 10 | 0.0% |
| Polish | 1,449 | 3.5% |
| Portuguese | 51 | 0.1% |
| Potawatomi | 1 | 0.0% |
| Puerto Rican | 174 | 0.4% |
| Romanian | 15 | 0.0% |
| Russian | 58 | 0.1% |
| Salvadoran | 9 | 0.0% |
| Samoan | 4 | 0.0% |
| Scandinavian | 91 | 0.2% |
| Scotch-Irish | 276 | 0.7% |
| Scottish | 1,031 | 2.5% |
| Serbian | 9 | 0.0% |
| Sioux | 4 | 0.0% |
| Slavic | 17 | 0.0% |
| Slovak | 248 | 0.6% |
| Slovene | 9 | 0.0% |
| South American | 48 | 0.1% |
| South American Indian | 16 | 0.0% |
| Spaniard | 143 | 0.3% |
| Spanish | 7 | 0.0% |
| Sri Lankan | 11 | 0.0% |
| Subsaharan African | 267 | 0.6% |
| Sudanese | 6 | 0.0% |
| Swedish | 269 | 0.6% |
| Swiss | 127 | 0.3% |
| Syrian | 18 | 0.0% |
| Thai | 50 | 0.1% |
| U.S. Virgin Islander | 5 | 0.0% |
| Ukrainian | 31 | 0.1% |
| Welsh | 80 | 0.2% |
| West Indian | 5 | 0.0% |
| Yugoslavian | 16 | 0.0% | View All 99 Rows |
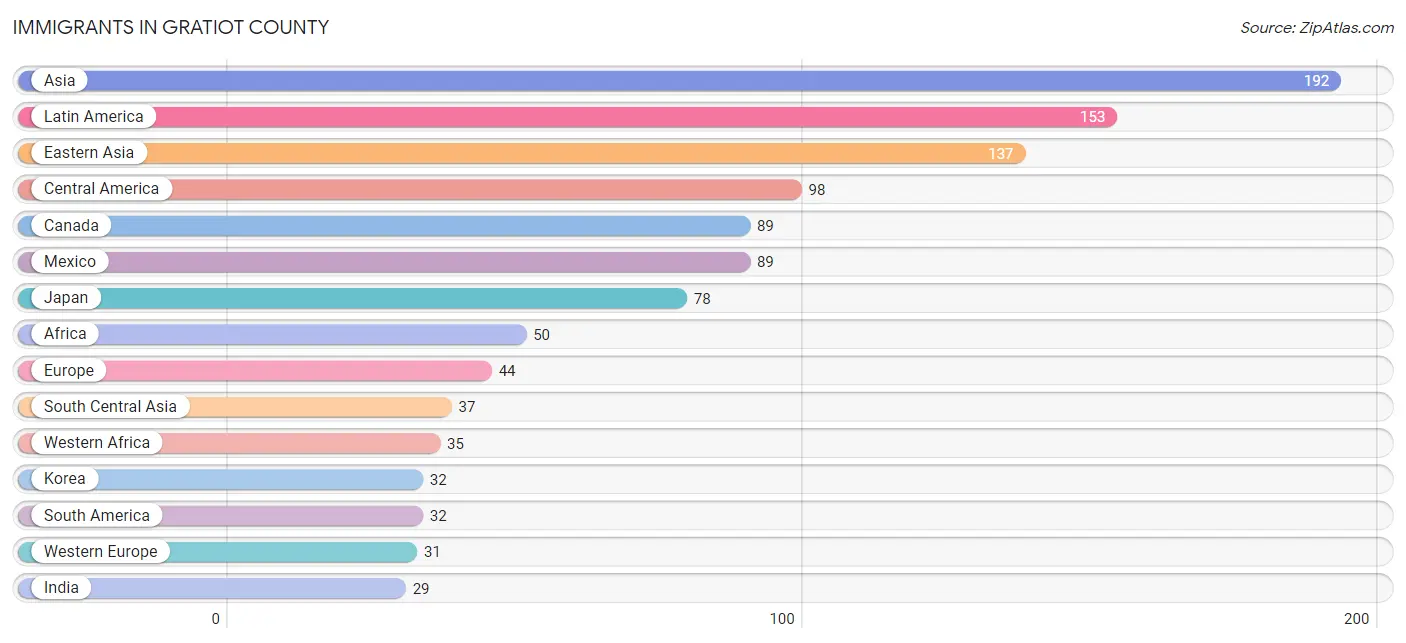
Immigrants in Gratiot County
The most numerous immigrant groups reported in Gratiot County came from Asia (192 | 0.5%), Latin America (153 | 0.4%), Eastern Asia (137 | 0.3%), Central America (98 | 0.2%), and Canada (89 | 0.2%), together accounting for 1.6% of all Gratiot County residents.
| Immigration Origin | # Population | % Population |
| Africa | 50 | 0.1% |
| Argentina | 4 | 0.0% |
| Asia | 192 | 0.5% |
| Australia | 14 | 0.0% |
| Belgium | 8 | 0.0% |
| Brazil | 12 | 0.0% |
| Cabo Verde | 4 | 0.0% |
| Canada | 89 | 0.2% |
| Caribbean | 23 | 0.1% |
| Central America | 98 | 0.2% |
| China | 27 | 0.1% |
| Cuba | 22 | 0.1% |
| Eastern Asia | 137 | 0.3% |
| Eastern Europe | 8 | 0.0% |
| El Salvador | 9 | 0.0% |
| Europe | 44 | 0.1% |
| Germany | 11 | 0.0% |
| Hong Kong | 5 | 0.0% |
| India | 29 | 0.1% |
| Iran | 1 | 0.0% |
| Ireland | 1 | 0.0% |
| Jamaica | 1 | 0.0% |
| Japan | 78 | 0.2% |
| Korea | 32 | 0.1% |
| Latin America | 153 | 0.4% |
| Mexico | 89 | 0.2% |
| Morocco | 15 | 0.0% |
| Netherlands | 8 | 0.0% |
| Northern Africa | 15 | 0.0% |
| Northern Europe | 5 | 0.0% |
| Oceania | 29 | 0.1% |
| Philippines | 18 | 0.0% |
| Romania | 4 | 0.0% |
| Russia | 4 | 0.0% |
| Sierra Leone | 11 | 0.0% |
| South America | 32 | 0.1% |
| South Central Asia | 37 | 0.1% |
| South Eastern Asia | 18 | 0.0% |
| Sri Lanka | 7 | 0.0% |
| Switzerland | 4 | 0.0% |
| Western Africa | 35 | 0.1% |
| Western Europe | 31 | 0.1% | View All 42 Rows |
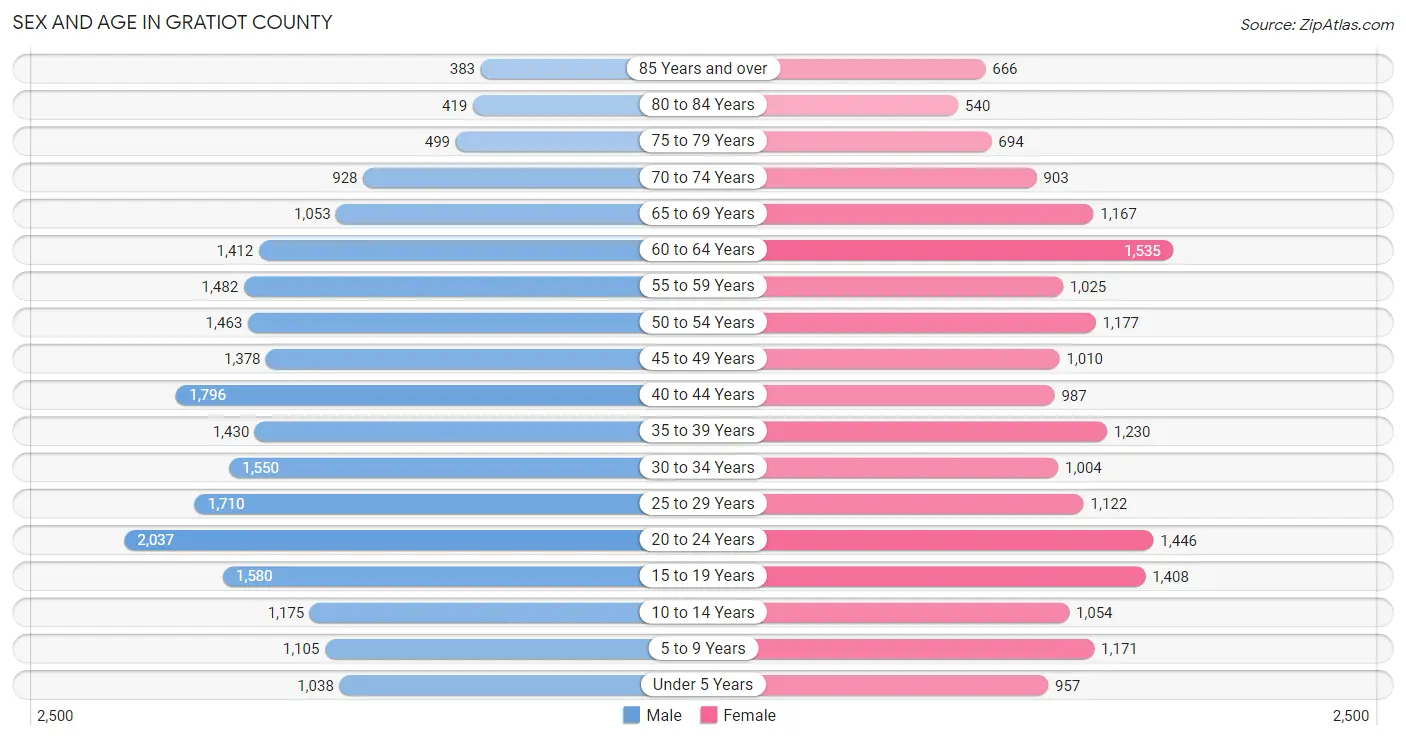
Sex and Age in Gratiot County
Sex and Age in Gratiot County
The most populous age groups in Gratiot County are 20 to 24 Years (2,037 | 9.1%) for men and 60 to 64 Years (1,535 | 8.0%) for women.
| Age Bracket | Male | Female |
| Under 5 Years | 1,038 (4.6%) | 957 (5.0%) |
| 5 to 9 Years | 1,105 (4.9%) | 1,171 (6.1%) |
| 10 to 14 Years | 1,175 (5.2%) | 1,054 (5.5%) |
| 15 to 19 Years | 1,580 (7.0%) | 1,408 (7.4%) |
| 20 to 24 Years | 2,037 (9.1%) | 1,446 (7.6%) |
| 25 to 29 Years | 1,710 (7.6%) | 1,122 (5.9%) |
| 30 to 34 Years | 1,550 (6.9%) | 1,004 (5.3%) |
| 35 to 39 Years | 1,430 (6.4%) | 1,230 (6.4%) |
| 40 to 44 Years | 1,796 (8.0%) | 987 (5.2%) |
| 45 to 49 Years | 1,378 (6.1%) | 1,010 (5.3%) |
| 50 to 54 Years | 1,463 (6.5%) | 1,177 (6.2%) |
| 55 to 59 Years | 1,482 (6.6%) | 1,025 (5.4%) |
| 60 to 64 Years | 1,412 (6.3%) | 1,535 (8.0%) |
| 65 to 69 Years | 1,053 (4.7%) | 1,167 (6.1%) |
| 70 to 74 Years | 928 (4.1%) | 903 (4.7%) |
| 75 to 79 Years | 499 (2.2%) | 694 (3.6%) |
| 80 to 84 Years | 419 (1.9%) | 540 (2.8%) |
| 85 Years and over | 383 (1.7%) | 666 (3.5%) |
| Total | 22,438 (100.0%) | 19,096 (100.0%) |
Families and Households in Gratiot County
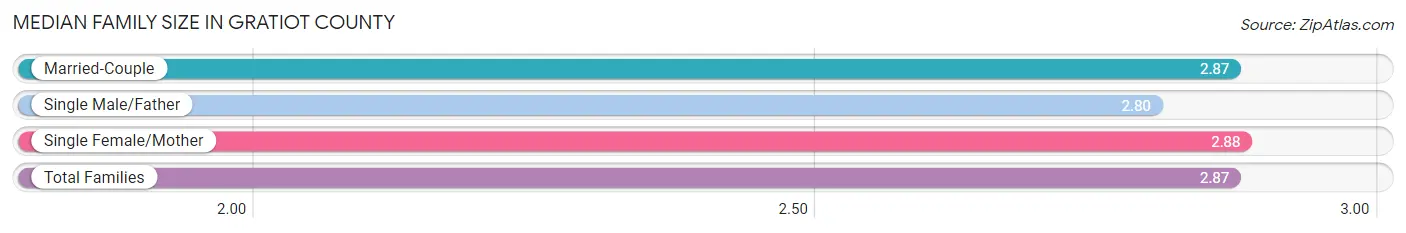
Median Family Size in Gratiot County
The median family size in Gratiot County is 2.87 persons per family, with single female/mother families (1,565 | 15.8%) accounting for the largest median family size of 2.88 persons per family. On the other hand, single male/father families (745 | 7.5%) represent the smallest median family size with 2.80 persons per family.
| Family Type | # Families | Family Size |
| Married-Couple | 7,601 (76.7%) | 2.87 |
| Single Male/Father | 745 (7.5%) | 2.80 |
| Single Female/Mother | 1,565 (15.8%) | 2.88 |
| Total Families | 9,911 (100.0%) | 2.87 |
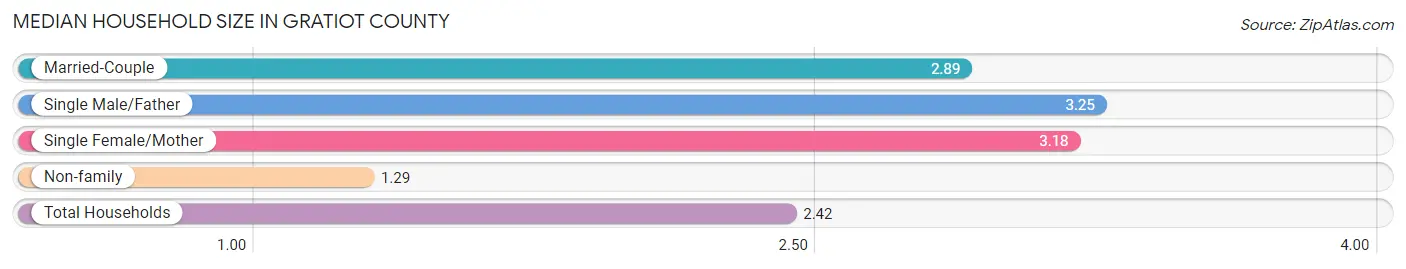
Median Household Size in Gratiot County
The median household size in Gratiot County is 2.42 persons per household, with single male/father households (745 | 5.1%) accounting for the largest median household size of 3.25 persons per household. non-family households (4,794 | 32.6%) represent the smallest median household size with 1.29 persons per household.
| Household Type | # Households | Household Size |
| Married-Couple | 7,601 (51.7%) | 2.89 |
| Single Male/Father | 745 (5.1%) | 3.25 |
| Single Female/Mother | 1,565 (10.6%) | 3.18 |
| Non-family | 4,794 (32.6%) | 1.29 |
| Total Households | 14,705 (100.0%) | 2.42 |
Household Size by Marriage Status in Gratiot County
Out of a total of 14,705 households in Gratiot County, 9,911 (67.4%) are family households, while 4,794 (32.6%) are nonfamily households. The most numerous type of family households are 2-person households, comprising 4,959, and the most common type of nonfamily households are 1-person households, comprising 3,875.
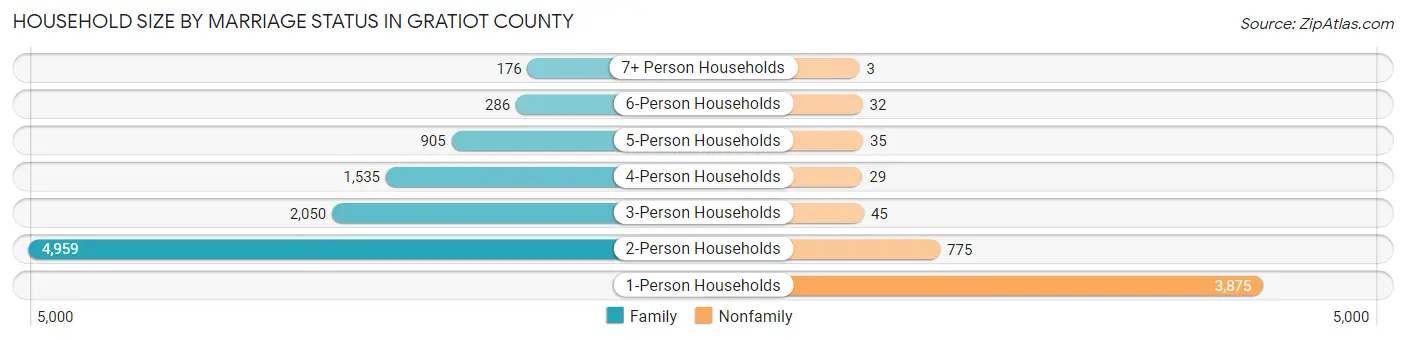
| Household Size | Family Households | Nonfamily Households |
| 1-Person Households | - | 3,875 (26.4%) |
| 2-Person Households | 4,959 (33.7%) | 775 (5.3%) |
| 3-Person Households | 2,050 (13.9%) | 45 (0.3%) |
| 4-Person Households | 1,535 (10.4%) | 29 (0.2%) |
| 5-Person Households | 905 (6.1%) | 35 (0.2%) |
| 6-Person Households | 286 (1.9%) | 32 (0.2%) |
| 7+ Person Households | 176 (1.2%) | 3 (0.0%) |
| Total | 9,911 (67.4%) | 4,794 (32.6%) |
Female Fertility in Gratiot County
Fertility by Age in Gratiot County
Average fertility rate in Gratiot County is 69.0 births per 1,000 women. Women in the age bracket of 20 to 34 years have the highest fertility rate with 155.0 births per 1,000 women. Women in the age bracket of 20 to 34 years acount for 94.7% of all women with births.
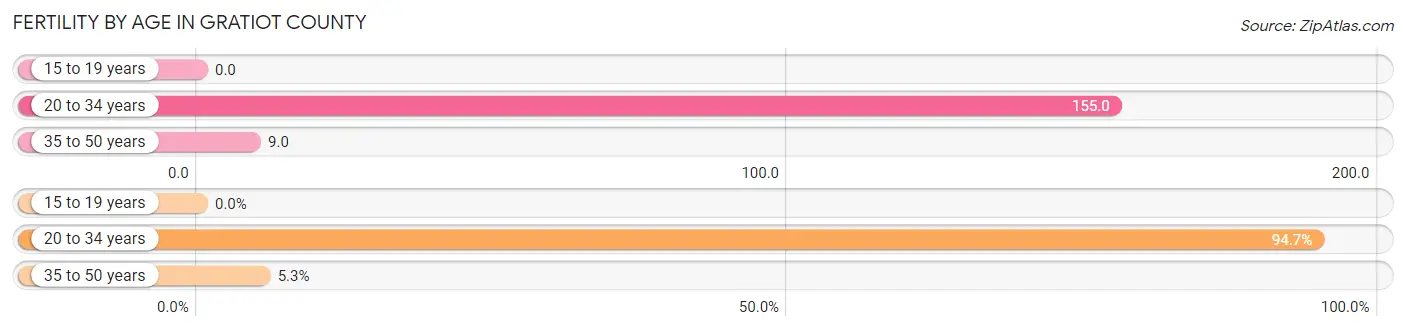
| Age Bracket | Women with Births | Births / 1,000 Women |
| 15 to 19 years | 0 (0.0%) | 0.0 |
| 20 to 34 years | 552 (94.7%) | 155.0 |
| 35 to 50 years | 31 (5.3%) | 9.0 |
| Total | 583 (100.0%) | 69.0 |
Fertility by Age by Marriage Status in Gratiot County
80.4% of women with births (583) in Gratiot County are married. The highest percentage of unmarried women with births falls into 35 to 50 years age bracket with 35.5% of them unmarried at the time of birth, while the lowest percentage of unmarried women with births belong to 20 to 34 years age bracket with 18.7% of them unmarried.
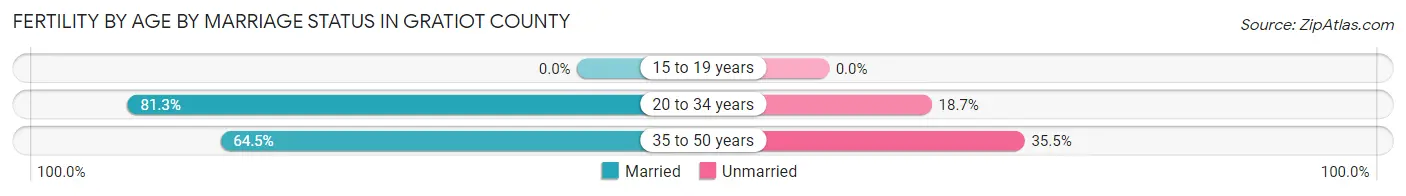
| Age Bracket | Married | Unmarried |
| 15 to 19 years | 0 (0.0%) | 0 (0.0%) |
| 20 to 34 years | 449 (81.3%) | 103 (18.7%) |
| 35 to 50 years | 20 (64.5%) | 11 (35.5%) |
| Total | 469 (80.4%) | 114 (19.6%) |
Fertility by Education in Gratiot County
Average fertility rate in Gratiot County is 69.0 births per 1,000 women. Women with the education attainment of bachelor's degree have the highest fertility rate of 93.0 births per 1,000 women, while women with the education attainment of less than high school have the lowest fertility at 4.0 births per 1,000 women. Women with the education attainment of college or associate's degree represent 51.5% of all women with births.
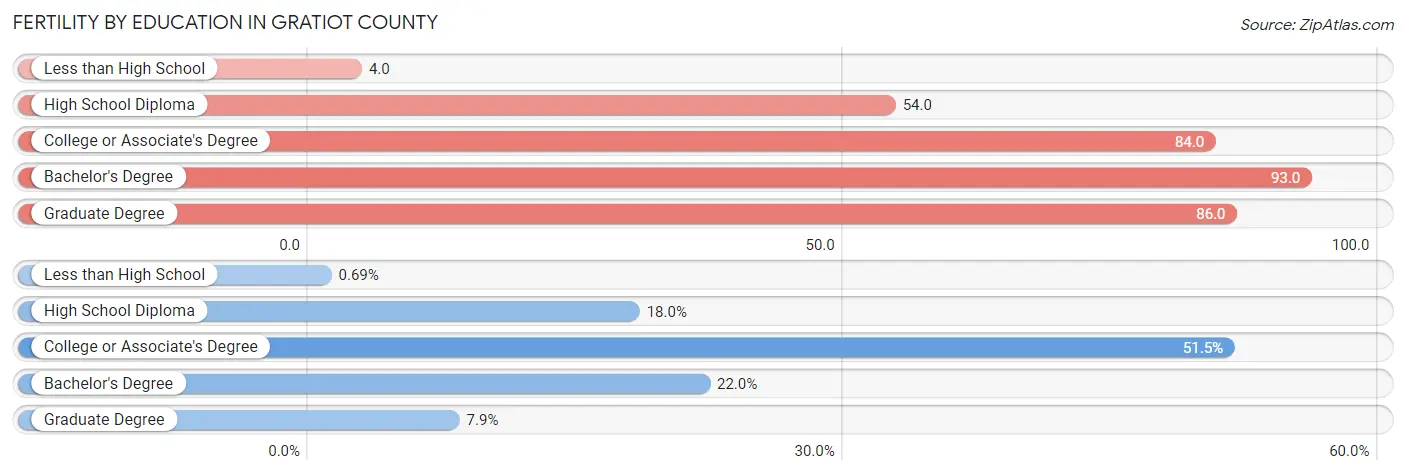
| Educational Attainment | Women with Births | Births / 1,000 Women |
| Less than High School | 4 (0.7%) | 4.0 |
| High School Diploma | 105 (18.0%) | 54.0 |
| College or Associate's Degree | 300 (51.5%) | 84.0 |
| Bachelor's Degree | 128 (22.0%) | 93.0 |
| Graduate Degree | 46 (7.9%) | 86.0 |
| Total | 583 (100.0%) | 69.0 |
Fertility by Education by Marriage Status in Gratiot County
19.6% of women with births in Gratiot County are unmarried. Women with the educational attainment of graduate degree are most likely to be married with 100.0% of them married at childbirth, while women with the educational attainment of college or associate's degree are least likely to be married with 28.3% of them unmarried at childbirth.
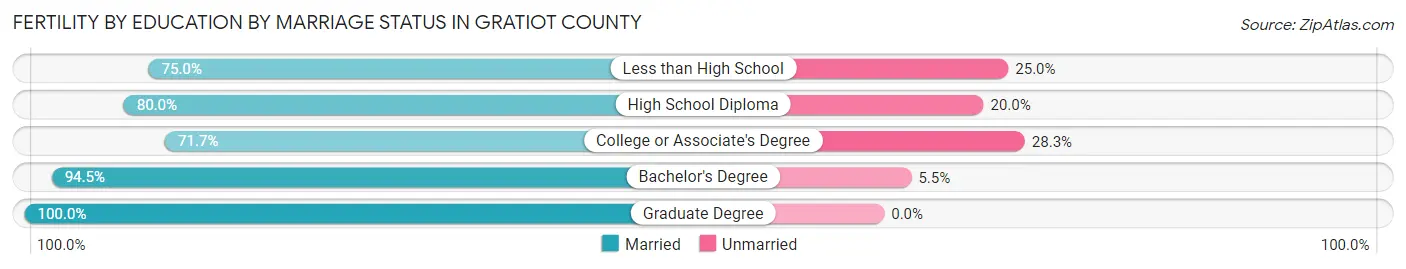
| Educational Attainment | Married | Unmarried |
| Less than High School | 3 (75.0%) | 1 (25.0%) |
| High School Diploma | 84 (80.0%) | 21 (20.0%) |
| College or Associate's Degree | 215 (71.7%) | 85 (28.3%) |
| Bachelor's Degree | 121 (94.5%) | 7 (5.5%) |
| Graduate Degree | 46 (100.0%) | 0 (0.0%) |
| Total | 469 (80.4%) | 114 (19.6%) |
Employment Characteristics in Gratiot County
Employment by Class of Employer in Gratiot County
Among the 16,782 employed individuals in Gratiot County, private company employees (10,787 | 64.3%), not-for-profit organizations (2,063 | 12.3%), and local government employees (1,190 | 7.1%) make up the most common classes of employment.
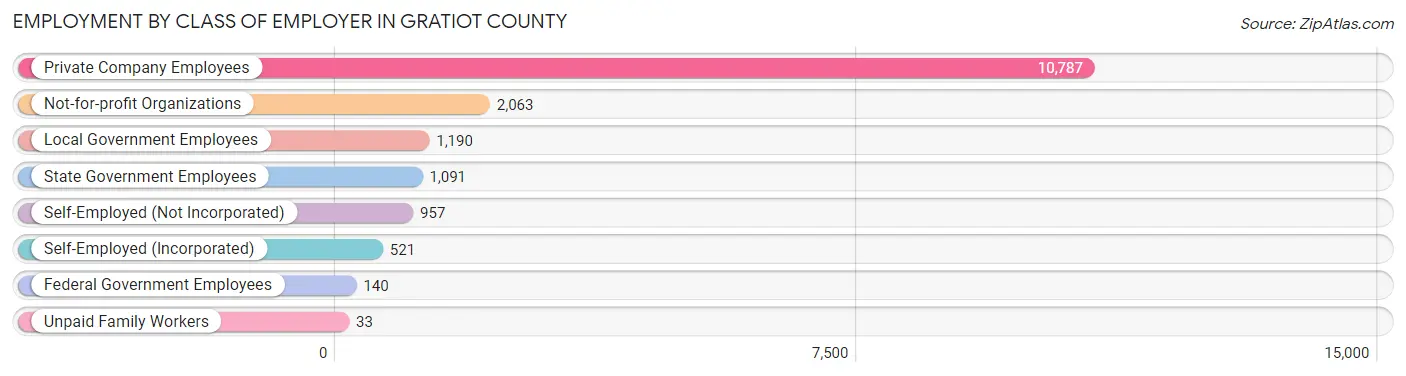
| Employer Class | # Employees | % Employees |
| Private Company Employees | 10,787 | 64.3% |
| Self-Employed (Incorporated) | 521 | 3.1% |
| Self-Employed (Not Incorporated) | 957 | 5.7% |
| Not-for-profit Organizations | 2,063 | 12.3% |
| Local Government Employees | 1,190 | 7.1% |
| State Government Employees | 1,091 | 6.5% |
| Federal Government Employees | 140 | 0.8% |
| Unpaid Family Workers | 33 | 0.2% |
| Total | 16,782 | 100.0% |
Employment Status by Age in Gratiot County
According to the labor force statistics for Gratiot County, out of the total population over 16 years of age (34,614), 52.1% or 18,034 individuals are in the labor force, with 4.9% or 884 of them unemployed. The age group with the highest labor force participation rate is 45 to 54 years, with 71.4% or 3,590 individuals in the labor force. Within the labor force, the 65 to 74 years age range has the highest percentage of unemployed individuals, with 11.9% or 83 of them being unemployed.
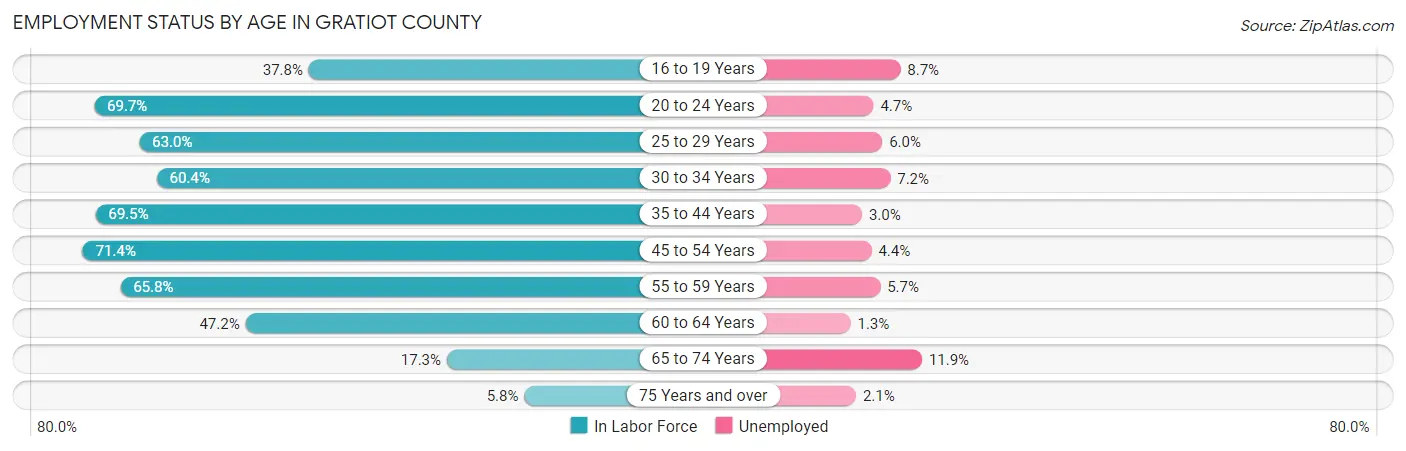
| Age Bracket | In Labor Force | Unemployed |
| 16 to 19 Years | 971 (37.8%) | 84 (8.7%) |
| 20 to 24 Years | 2,428 (69.7%) | 114 (4.7%) |
| 25 to 29 Years | 1,784 (63.0%) | 107 (6.0%) |
| 30 to 34 Years | 1,543 (60.4%) | 111 (7.2%) |
| 35 to 44 Years | 3,783 (69.5%) | 113 (3.0%) |
| 45 to 54 Years | 3,590 (71.4%) | 158 (4.4%) |
| 55 to 59 Years | 1,650 (65.8%) | 94 (5.7%) |
| 60 to 64 Years | 1,391 (47.2%) | 18 (1.3%) |
| 65 to 74 Years | 701 (17.3%) | 83 (11.9%) |
| 75 Years and over | 186 (5.8%) | 4 (2.1%) |
| Total | 18,034 (52.1%) | 884 (4.9%) |
Employment Status by Educational Attainment in Gratiot County
According to labor force statistics for Gratiot County, 64.5% of individuals (13,746) out of the total population between 25 and 64 years of age (21,311) are in the labor force, with 4.4% or 605 of them being unemployed. The group with the highest labor force participation rate are those with the educational attainment of bachelor's degree or higher, with 83.6% or 3,374 individuals in the labor force. Within the labor force, individuals with less than high school education have the highest percentage of unemployment, with 10.1% or 76 of them being unemployed.
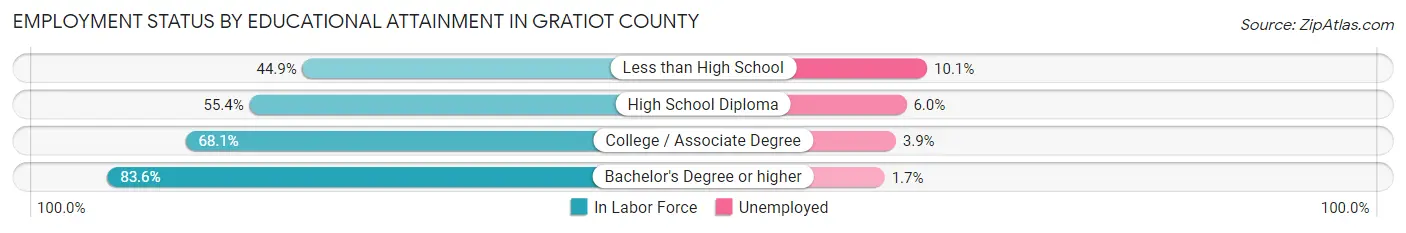
| Educational Attainment | In Labor Force | Unemployed |
| Less than High School | 755 (44.9%) | 170 (10.1%) |
| High School Diploma | 4,416 (55.4%) | 478 (6.0%) |
| College / Associate Degree | 5,191 (68.1%) | 297 (3.9%) |
| Bachelor's Degree or higher | 3,374 (83.6%) | 69 (1.7%) |
| Total | 13,746 (64.5%) | 938 (4.4%) |
Employment Occupations by Sex in Gratiot County
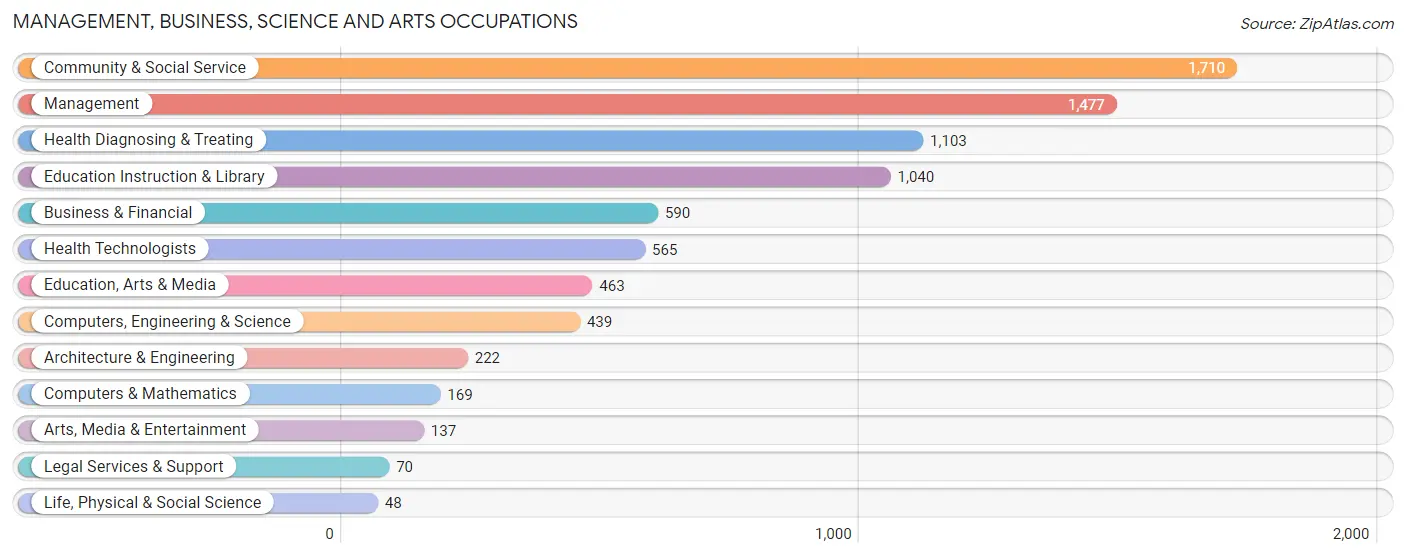
Management, Business, Science and Arts Occupations
The most common Management, Business, Science and Arts occupations in Gratiot County are Community & Social Service (1,710 | 10.0%), Management (1,477 | 8.6%), Health Diagnosing & Treating (1,103 | 6.4%), Education Instruction & Library (1,040 | 6.1%), and Business & Financial (590 | 3.4%).
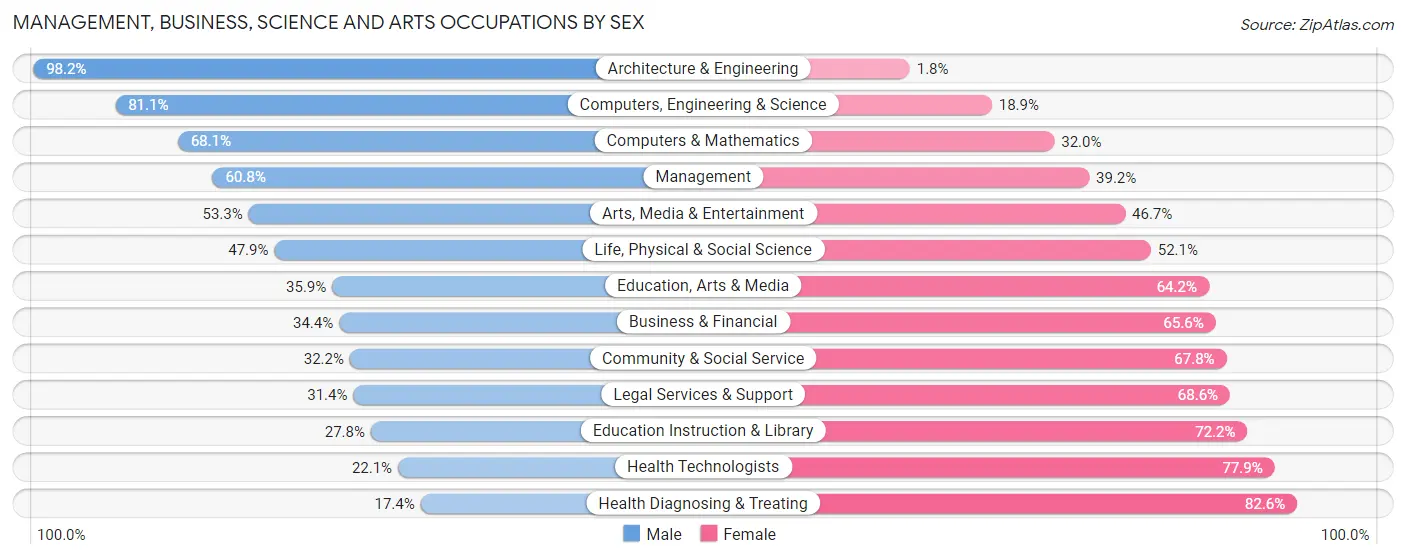
Management, Business, Science and Arts Occupations by Sex
Within the Management, Business, Science and Arts occupations in Gratiot County, the most male-oriented occupations are Architecture & Engineering (98.2%), Computers, Engineering & Science (81.1%), and Computers & Mathematics (68.0%), while the most female-oriented occupations are Health Diagnosing & Treating (82.6%), Health Technologists (77.9%), and Education Instruction & Library (72.2%).
| Occupation | Male | Female |
| Management | 898 (60.8%) | 579 (39.2%) |
| Business & Financial | 203 (34.4%) | 387 (65.6%) |
| Computers, Engineering & Science | 356 (81.1%) | 83 (18.9%) |
| Computers & Mathematics | 115 (68.0%) | 54 (32.0%) |
| Architecture & Engineering | 218 (98.2%) | 4 (1.8%) |
| Life, Physical & Social Science | 23 (47.9%) | 25 (52.1%) |
| Community & Social Service | 550 (32.2%) | 1,160 (67.8%) |
| Education, Arts & Media | 166 (35.8%) | 297 (64.1%) |
| Legal Services & Support | 22 (31.4%) | 48 (68.6%) |
| Education Instruction & Library | 289 (27.8%) | 751 (72.2%) |
| Arts, Media & Entertainment | 73 (53.3%) | 64 (46.7%) |
| Health Diagnosing & Treating | 192 (17.4%) | 911 (82.6%) |
| Health Technologists | 125 (22.1%) | 440 (77.9%) |
| Total (Category) | 2,199 (41.3%) | 3,120 (58.7%) |
| Total (Overall) | 8,981 (52.4%) | 8,150 (47.6%) |
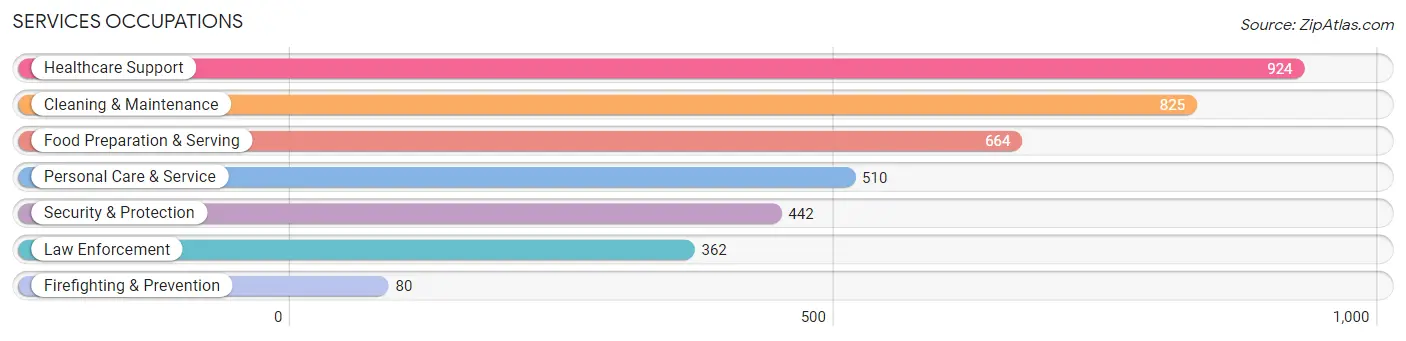
Services Occupations
The most common Services occupations in Gratiot County are Healthcare Support (924 | 5.4%), Cleaning & Maintenance (825 | 4.8%), Food Preparation & Serving (664 | 3.9%), Personal Care & Service (510 | 3.0%), and Security & Protection (442 | 2.6%).
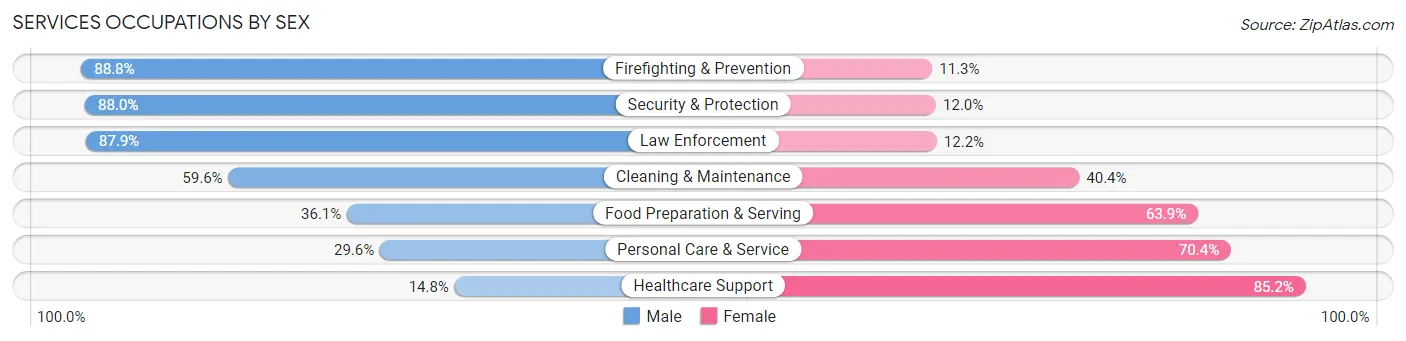
Services Occupations by Sex
Within the Services occupations in Gratiot County, the most male-oriented occupations are Firefighting & Prevention (88.7%), Security & Protection (88.0%), and Law Enforcement (87.8%), while the most female-oriented occupations are Healthcare Support (85.2%), Personal Care & Service (70.4%), and Food Preparation & Serving (63.9%).
| Occupation | Male | Female |
| Healthcare Support | 137 (14.8%) | 787 (85.2%) |
| Security & Protection | 389 (88.0%) | 53 (12.0%) |
| Firefighting & Prevention | 71 (88.7%) | 9 (11.3%) |
| Law Enforcement | 318 (87.8%) | 44 (12.1%) |
| Food Preparation & Serving | 240 (36.1%) | 424 (63.9%) |
| Cleaning & Maintenance | 492 (59.6%) | 333 (40.4%) |
| Personal Care & Service | 151 (29.6%) | 359 (70.4%) |
| Total (Category) | 1,409 (41.9%) | 1,956 (58.1%) |
| Total (Overall) | 8,981 (52.4%) | 8,150 (47.6%) |
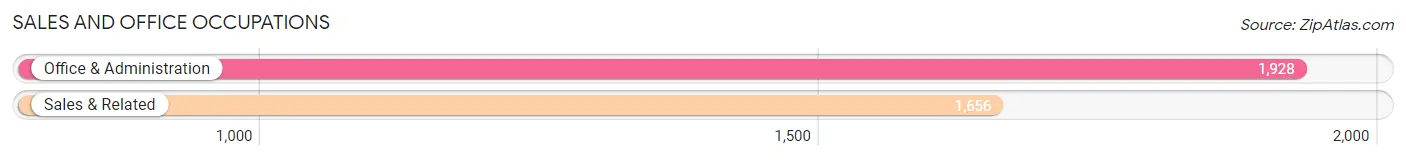
Sales and Office Occupations
The most common Sales and Office occupations in Gratiot County are Office & Administration (1,928 | 11.3%), and Sales & Related (1,656 | 9.7%).
Sales and Office Occupations by Sex
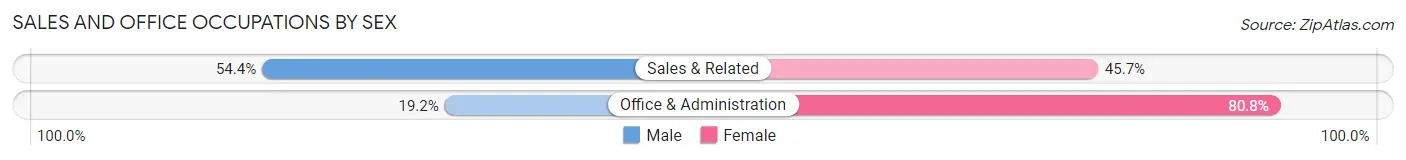
| Occupation | Male | Female |
| Sales & Related | 900 (54.3%) | 756 (45.7%) |
| Office & Administration | 371 (19.2%) | 1,557 (80.8%) |
| Total (Category) | 1,271 (35.5%) | 2,313 (64.5%) |
| Total (Overall) | 8,981 (52.4%) | 8,150 (47.6%) |
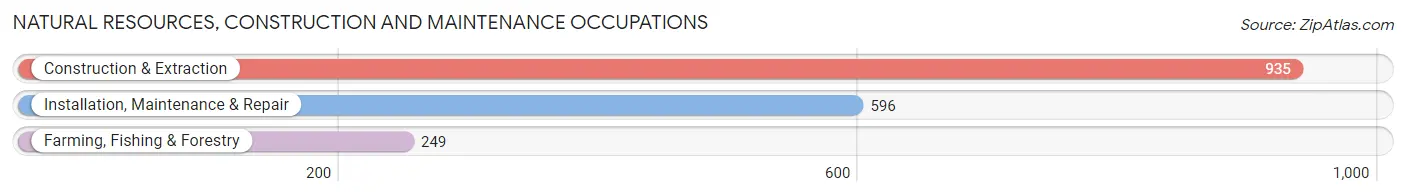
Natural Resources, Construction and Maintenance Occupations
The most common Natural Resources, Construction and Maintenance occupations in Gratiot County are Construction & Extraction (935 | 5.5%), Installation, Maintenance & Repair (596 | 3.5%), and Farming, Fishing & Forestry (249 | 1.5%).
Natural Resources, Construction and Maintenance Occupations by Sex
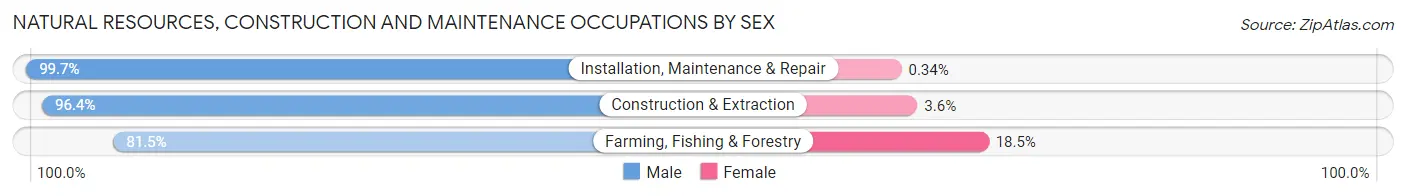
| Occupation | Male | Female |
| Farming, Fishing & Forestry | 203 (81.5%) | 46 (18.5%) |
| Construction & Extraction | 901 (96.4%) | 34 (3.6%) |
| Installation, Maintenance & Repair | 594 (99.7%) | 2 (0.3%) |
| Total (Category) | 1,698 (95.4%) | 82 (4.6%) |
| Total (Overall) | 8,981 (52.4%) | 8,150 (47.6%) |
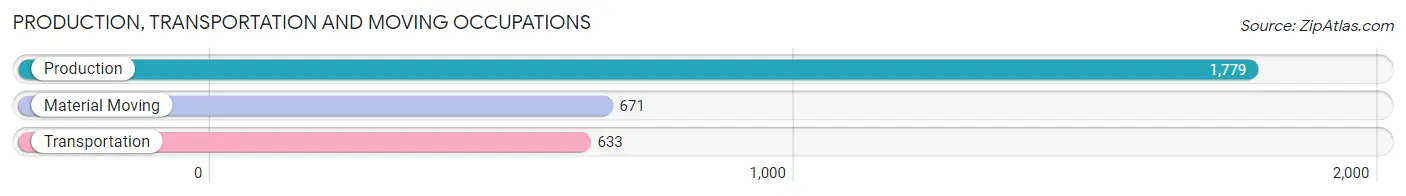
Production, Transportation and Moving Occupations
The most common Production, Transportation and Moving occupations in Gratiot County are Production (1,779 | 10.4%), Material Moving (671 | 3.9%), and Transportation (633 | 3.7%).
Production, Transportation and Moving Occupations by Sex
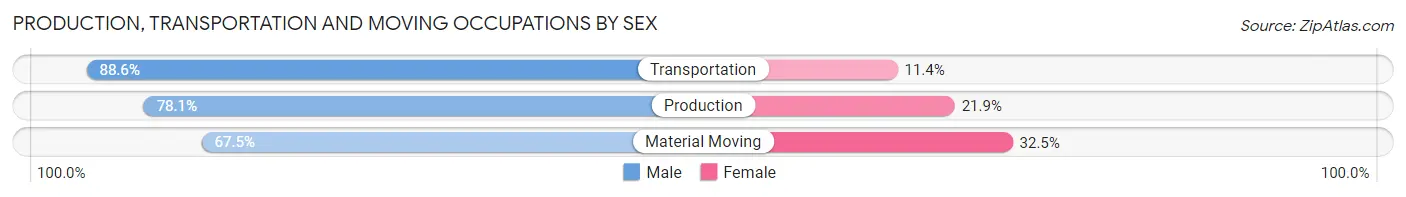
| Occupation | Male | Female |
| Production | 1,390 (78.1%) | 389 (21.9%) |
| Transportation | 561 (88.6%) | 72 (11.4%) |
| Material Moving | 453 (67.5%) | 218 (32.5%) |
| Total (Category) | 2,404 (78.0%) | 679 (22.0%) |
| Total (Overall) | 8,981 (52.4%) | 8,150 (47.6%) |
Employment Industries by Sex in Gratiot County
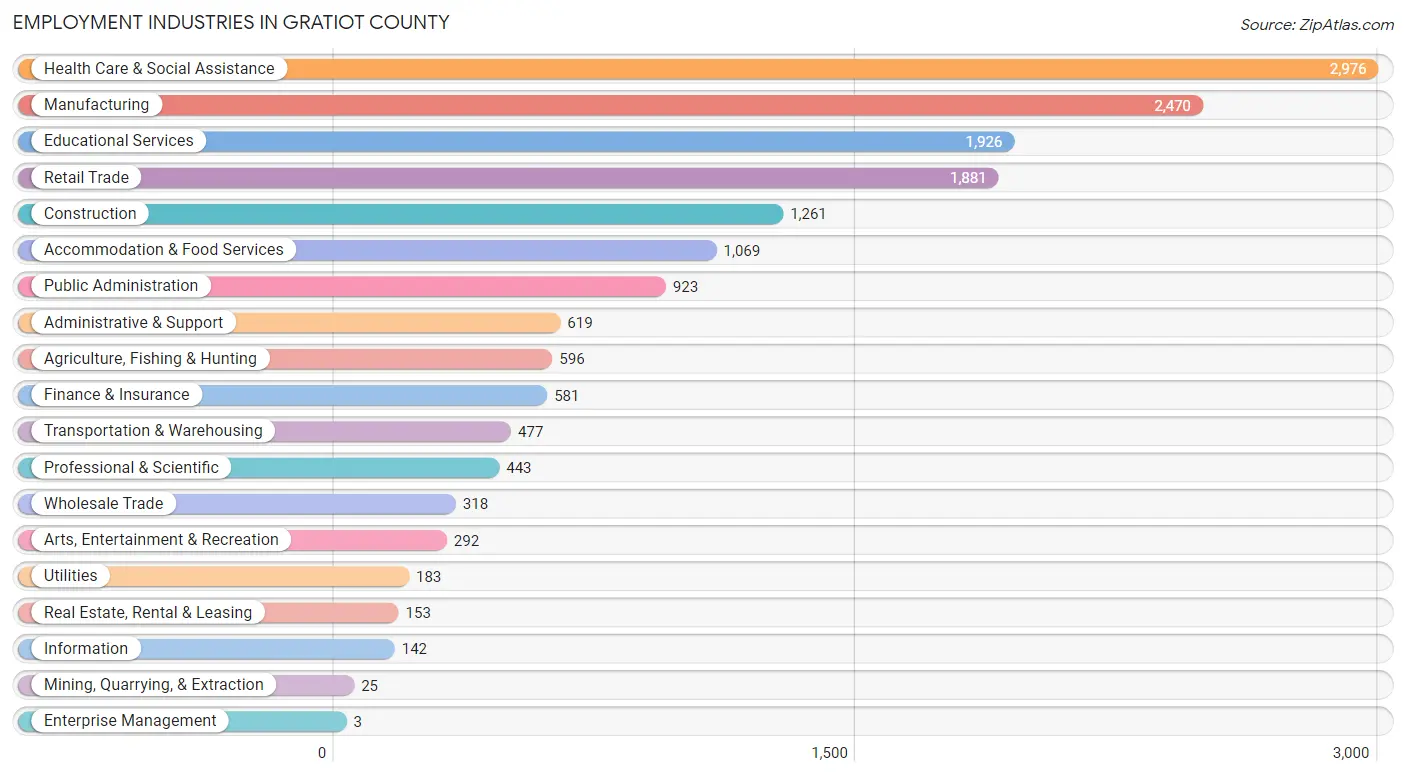
Employment Industries in Gratiot County
The major employment industries in Gratiot County include Health Care & Social Assistance (2,976 | 17.4%), Manufacturing (2,470 | 14.4%), Educational Services (1,926 | 11.2%), Retail Trade (1,881 | 11.0%), and Construction (1,261 | 7.4%).
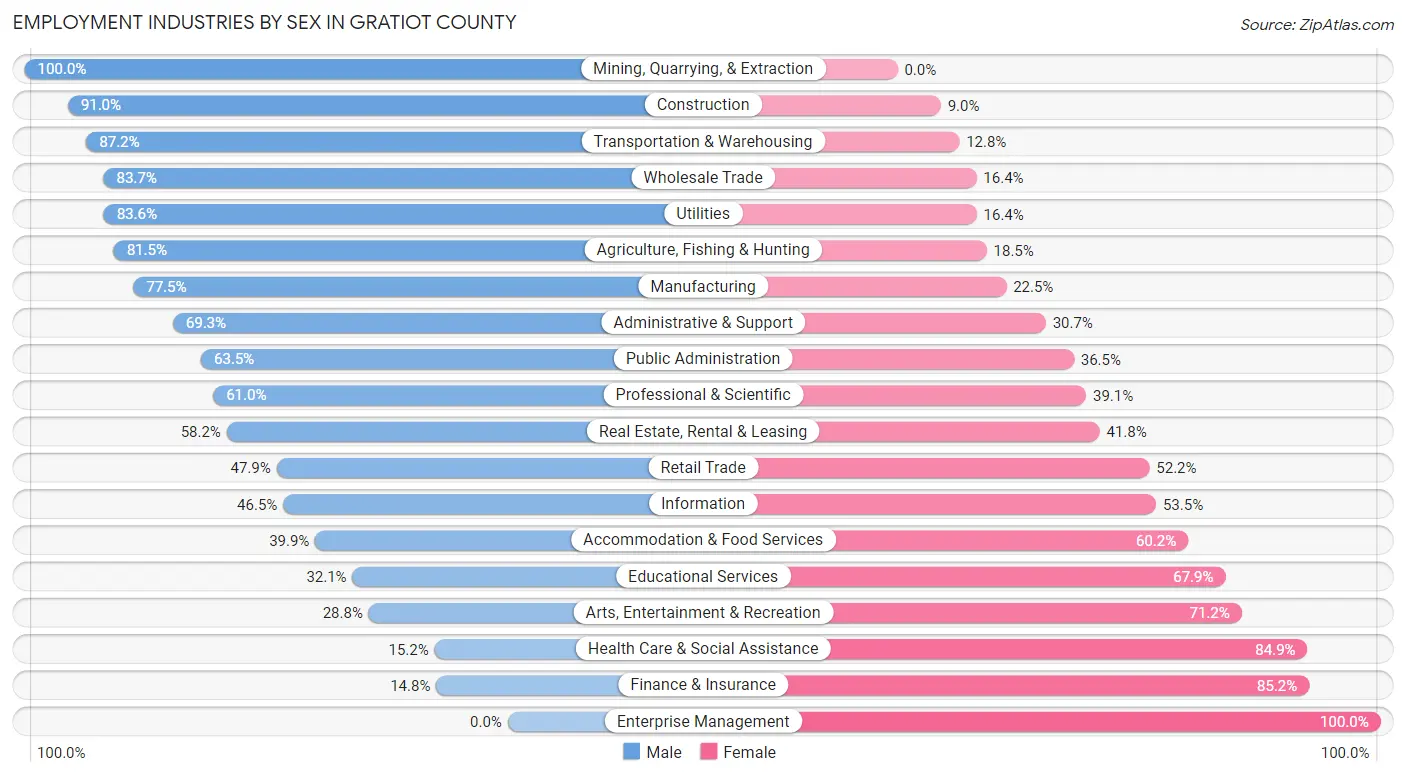
Employment Industries by Sex in Gratiot County
The Gratiot County industries that see more men than women are Mining, Quarrying, & Extraction (100.0%), Construction (91.0%), and Transportation & Warehousing (87.2%), whereas the industries that tend to have a higher number of women are Enterprise Management (100.0%), Finance & Insurance (85.2%), and Health Care & Social Assistance (84.9%).
| Industry | Male | Female |
| Agriculture, Fishing & Hunting | 486 (81.5%) | 110 (18.5%) |
| Mining, Quarrying, & Extraction | 25 (100.0%) | 0 (0.0%) |
| Construction | 1,148 (91.0%) | 113 (9.0%) |
| Manufacturing | 1,914 (77.5%) | 556 (22.5%) |
| Wholesale Trade | 266 (83.7%) | 52 (16.4%) |
| Retail Trade | 900 (47.8%) | 981 (52.1%) |
| Transportation & Warehousing | 416 (87.2%) | 61 (12.8%) |
| Utilities | 153 (83.6%) | 30 (16.4%) |
| Information | 66 (46.5%) | 76 (53.5%) |
| Finance & Insurance | 86 (14.8%) | 495 (85.2%) |
| Real Estate, Rental & Leasing | 89 (58.2%) | 64 (41.8%) |
| Professional & Scientific | 270 (61.0%) | 173 (39.1%) |
| Enterprise Management | 0 (0.0%) | 3 (100.0%) |
| Administrative & Support | 429 (69.3%) | 190 (30.7%) |
| Educational Services | 619 (32.1%) | 1,307 (67.9%) |
| Health Care & Social Assistance | 451 (15.1%) | 2,525 (84.9%) |
| Arts, Entertainment & Recreation | 84 (28.8%) | 208 (71.2%) |
| Accommodation & Food Services | 426 (39.9%) | 643 (60.2%) |
| Public Administration | 586 (63.5%) | 337 (36.5%) |
| Total | 8,981 (52.4%) | 8,150 (47.6%) |
Education in Gratiot County
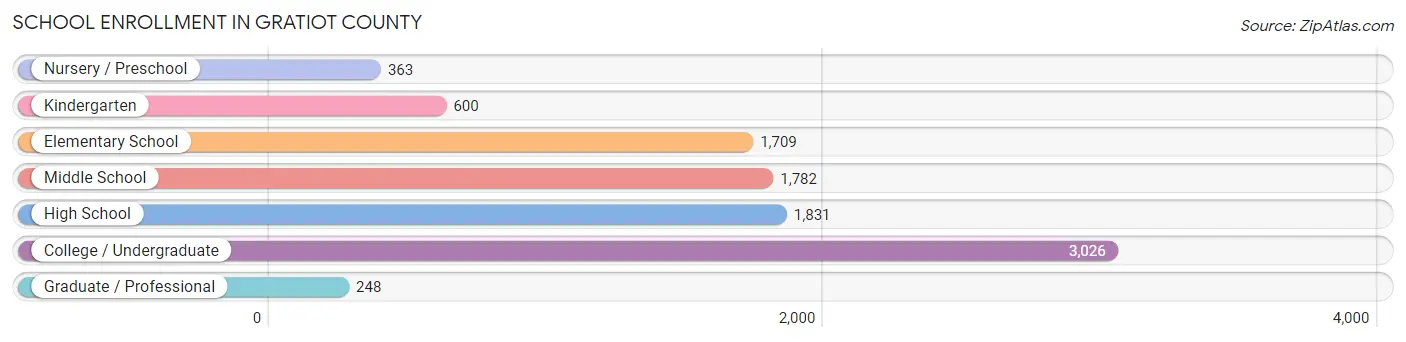
School Enrollment in Gratiot County
The most common levels of schooling among the 9,559 students in Gratiot County are college / undergraduate (3,026 | 31.7%), high school (1,831 | 19.2%), and middle school (1,782 | 18.6%).
| School Level | # Students | % Students |
| Nursery / Preschool | 363 | 3.8% |
| Kindergarten | 600 | 6.3% |
| Elementary School | 1,709 | 17.9% |
| Middle School | 1,782 | 18.6% |
| High School | 1,831 | 19.2% |
| College / Undergraduate | 3,026 | 31.7% |
| Graduate / Professional | 248 | 2.6% |
| Total | 9,559 | 100.0% |
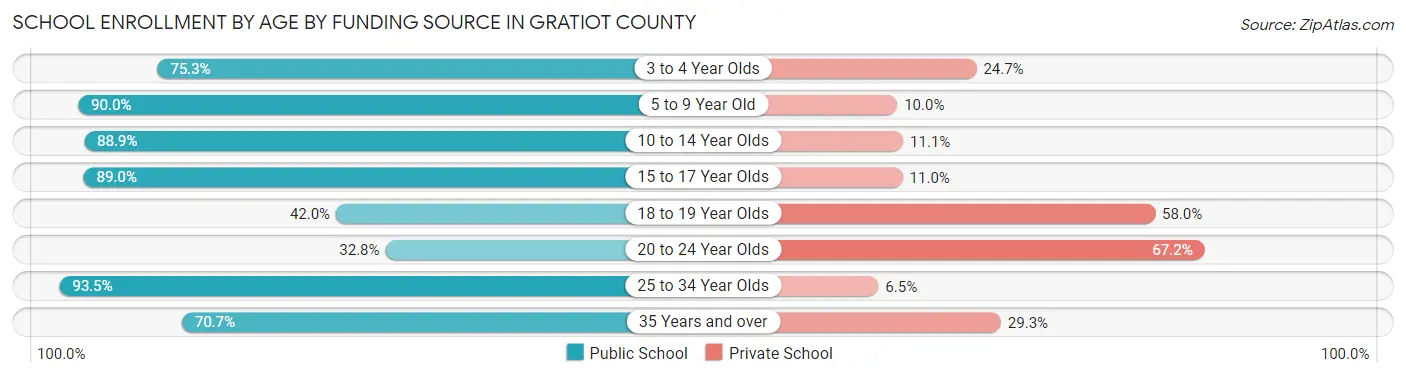
School Enrollment by Age by Funding Source in Gratiot County
Out of a total of 9,559 students who are enrolled in schools in Gratiot County, 2,438 (25.5%) attend a private institution, while the remaining 7,121 (74.5%) are enrolled in public schools. The age group of 20 to 24 year olds has the highest likelihood of being enrolled in private schools, with 879 (67.2% in the age bracket) enrolled. Conversely, the age group of 25 to 34 year olds has the lowest likelihood of being enrolled in a private school, with 448 (93.5% in the age bracket) attending a public institution.
| Age Bracket | Public School | Private School |
| 3 to 4 Year Olds | 210 (75.3%) | 69 (24.7%) |
| 5 to 9 Year Old | 1,975 (90.0%) | 219 (10.0%) |
| 10 to 14 Year Olds | 1,877 (88.9%) | 234 (11.1%) |
| 15 to 17 Year Olds | 1,288 (89.0%) | 159 (11.0%) |
| 18 to 19 Year Olds | 489 (42.0%) | 675 (58.0%) |
| 20 to 24 Year Olds | 429 (32.8%) | 879 (67.2%) |
| 25 to 34 Year Olds | 448 (93.5%) | 31 (6.5%) |
| 35 Years and over | 408 (70.7%) | 169 (29.3%) |
| Total | 7,121 (74.5%) | 2,438 (25.5%) |
Educational Attainment by Field of Study in Gratiot County
Education (1,255 | 22.5%), business (1,072 | 19.2%), science & technology (799 | 14.3%), arts & humanities (491 | 8.8%), and bio, nature & agricultural (412 | 7.4%) are the most common fields of study among 5,590 individuals in Gratiot County who have obtained a bachelor's degree or higher.
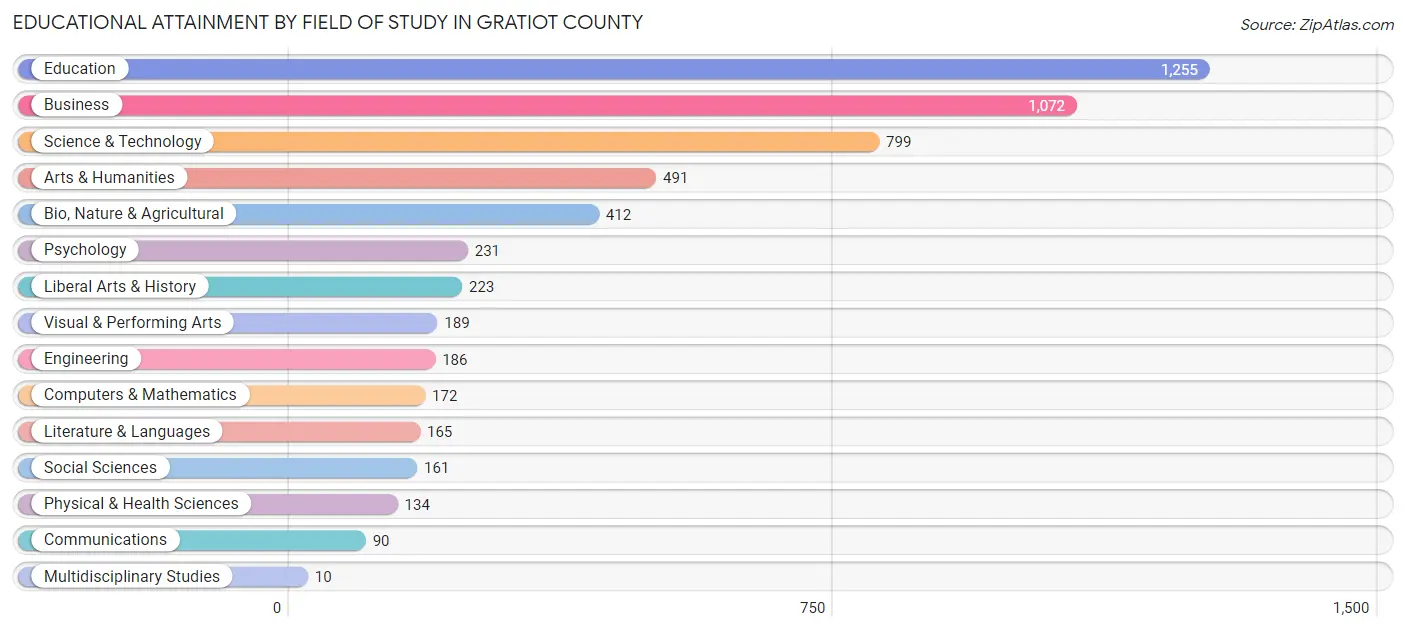
| Field of Study | # Graduates | % Graduates |
| Computers & Mathematics | 172 | 3.1% |
| Bio, Nature & Agricultural | 412 | 7.4% |
| Physical & Health Sciences | 134 | 2.4% |
| Psychology | 231 | 4.1% |
| Social Sciences | 161 | 2.9% |
| Engineering | 186 | 3.3% |
| Multidisciplinary Studies | 10 | 0.2% |
| Science & Technology | 799 | 14.3% |
| Business | 1,072 | 19.2% |
| Education | 1,255 | 22.5% |
| Literature & Languages | 165 | 2.9% |
| Liberal Arts & History | 223 | 4.0% |
| Visual & Performing Arts | 189 | 3.4% |
| Communications | 90 | 1.6% |
| Arts & Humanities | 491 | 8.8% |
| Total | 5,590 | 100.0% |
Transportation & Commute in Gratiot County
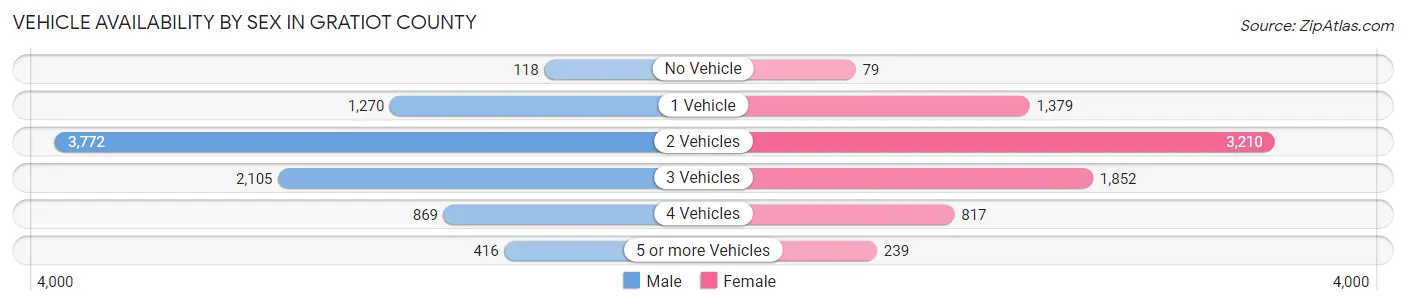
Vehicle Availability by Sex in Gratiot County
The most prevalent vehicle ownership categories in Gratiot County are males with 2 vehicles (3,772, accounting for 44.1%) and females with 2 vehicles (3,210, making up 49.8%).
| Vehicles Available | Male | Female |
| No Vehicle | 118 (1.4%) | 79 (1.0%) |
| 1 Vehicle | 1,270 (14.8%) | 1,379 (18.2%) |
| 2 Vehicles | 3,772 (44.1%) | 3,210 (42.4%) |
| 3 Vehicles | 2,105 (24.6%) | 1,852 (24.4%) |
| 4 Vehicles | 869 (10.2%) | 817 (10.8%) |
| 5 or more Vehicles | 416 (4.9%) | 239 (3.2%) |
| Total | 8,550 (100.0%) | 7,576 (100.0%) |
Commute Time in Gratiot County
The most frequently occuring commute durations in Gratiot County are 10 to 14 minutes (2,638 commuters, 16.9%), 5 to 9 minutes (2,564 commuters, 16.4%), and 20 to 24 minutes (1,941 commuters, 12.4%).
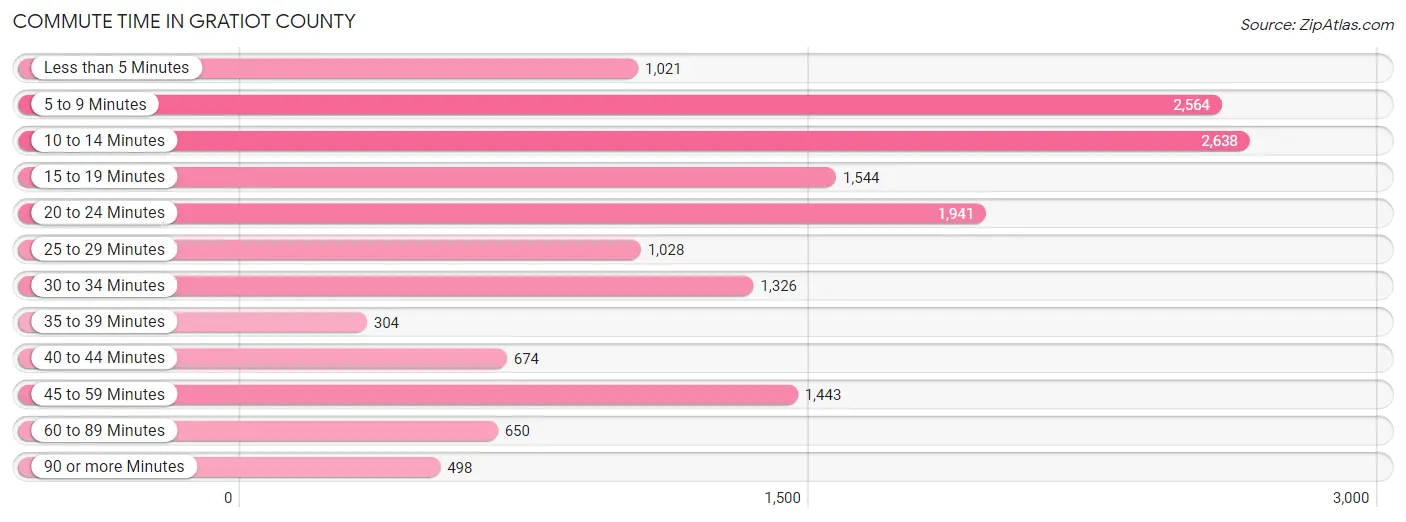
| Commute Time | # Commuters | % Commuters |
| Less than 5 Minutes | 1,021 | 6.5% |
| 5 to 9 Minutes | 2,564 | 16.4% |
| 10 to 14 Minutes | 2,638 | 16.9% |
| 15 to 19 Minutes | 1,544 | 9.9% |
| 20 to 24 Minutes | 1,941 | 12.4% |
| 25 to 29 Minutes | 1,028 | 6.6% |
| 30 to 34 Minutes | 1,326 | 8.5% |
| 35 to 39 Minutes | 304 | 1.9% |
| 40 to 44 Minutes | 674 | 4.3% |
| 45 to 59 Minutes | 1,443 | 9.2% |
| 60 to 89 Minutes | 650 | 4.2% |
| 90 or more Minutes | 498 | 3.2% |
Commute Time by Sex in Gratiot County
The most common commute times in Gratiot County are 5 to 9 minutes (1,460 commuters, 17.4%) for males and 10 to 14 minutes (1,404 commuters, 19.3%) for females.
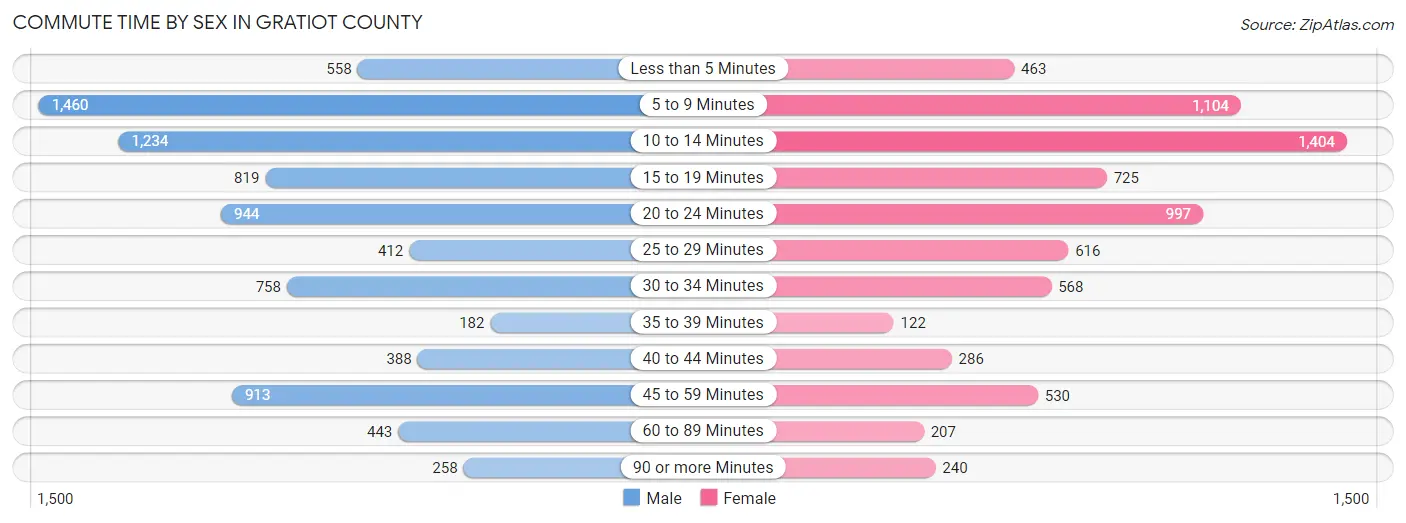
| Commute Time | Male | Female |
| Less than 5 Minutes | 558 (6.7%) | 463 (6.4%) |
| 5 to 9 Minutes | 1,460 (17.4%) | 1,104 (15.2%) |
| 10 to 14 Minutes | 1,234 (14.7%) | 1,404 (19.3%) |
| 15 to 19 Minutes | 819 (9.8%) | 725 (10.0%) |
| 20 to 24 Minutes | 944 (11.3%) | 997 (13.7%) |
| 25 to 29 Minutes | 412 (4.9%) | 616 (8.5%) |
| 30 to 34 Minutes | 758 (9.1%) | 568 (7.8%) |
| 35 to 39 Minutes | 182 (2.2%) | 122 (1.7%) |
| 40 to 44 Minutes | 388 (4.6%) | 286 (3.9%) |
| 45 to 59 Minutes | 913 (10.9%) | 530 (7.3%) |
| 60 to 89 Minutes | 443 (5.3%) | 207 (2.9%) |
| 90 or more Minutes | 258 (3.1%) | 240 (3.3%) |
Time of Departure to Work by Sex in Gratiot County
The most frequent times of departure to work in Gratiot County are 7:30 AM to 7:59 AM (1,196, 14.3%) for males and 7:30 AM to 7:59 AM (1,582, 21.8%) for females.
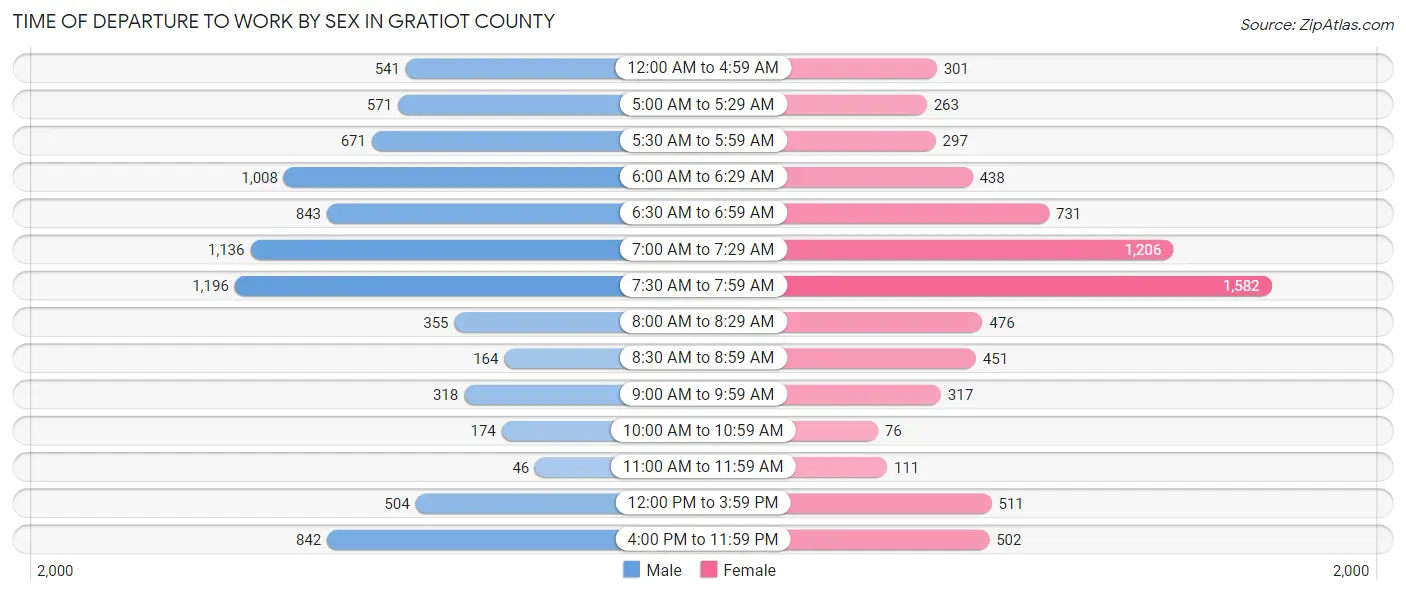
| Time of Departure | Male | Female |
| 12:00 AM to 4:59 AM | 541 (6.5%) | 301 (4.1%) |
| 5:00 AM to 5:29 AM | 571 (6.8%) | 263 (3.6%) |
| 5:30 AM to 5:59 AM | 671 (8.0%) | 297 (4.1%) |
| 6:00 AM to 6:29 AM | 1,008 (12.0%) | 438 (6.0%) |
| 6:30 AM to 6:59 AM | 843 (10.1%) | 731 (10.1%) |
| 7:00 AM to 7:29 AM | 1,136 (13.6%) | 1,206 (16.6%) |
| 7:30 AM to 7:59 AM | 1,196 (14.3%) | 1,582 (21.8%) |
| 8:00 AM to 8:29 AM | 355 (4.2%) | 476 (6.6%) |
| 8:30 AM to 8:59 AM | 164 (2.0%) | 451 (6.2%) |
| 9:00 AM to 9:59 AM | 318 (3.8%) | 317 (4.4%) |
| 10:00 AM to 10:59 AM | 174 (2.1%) | 76 (1.1%) |
| 11:00 AM to 11:59 AM | 46 (0.5%) | 111 (1.5%) |
| 12:00 PM to 3:59 PM | 504 (6.0%) | 511 (7.0%) |
| 4:00 PM to 11:59 PM | 842 (10.1%) | 502 (6.9%) |
| Total | 8,369 (100.0%) | 7,262 (100.0%) |
Housing Occupancy in Gratiot County
Occupancy by Ownership in Gratiot County
Of the total 14,705 dwellings in Gratiot County, owner-occupied units account for 11,497 (78.2%), while renter-occupied units make up 3,208 (21.8%).
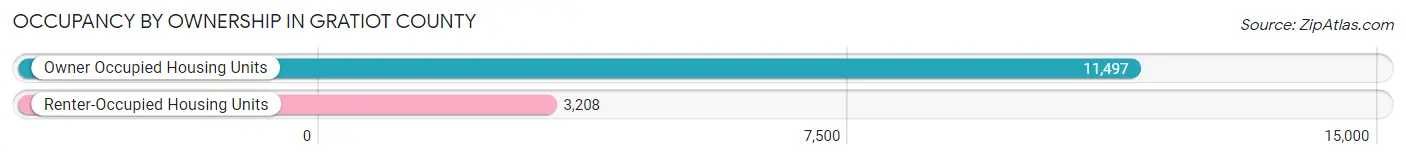
| Occupancy | # Housing Units | % Housing Units |
| Owner Occupied Housing Units | 11,497 | 78.2% |
| Renter-Occupied Housing Units | 3,208 | 21.8% |
| Total Occupied Housing Units | 14,705 | 100.0% |
Occupancy by Household Size in Gratiot County
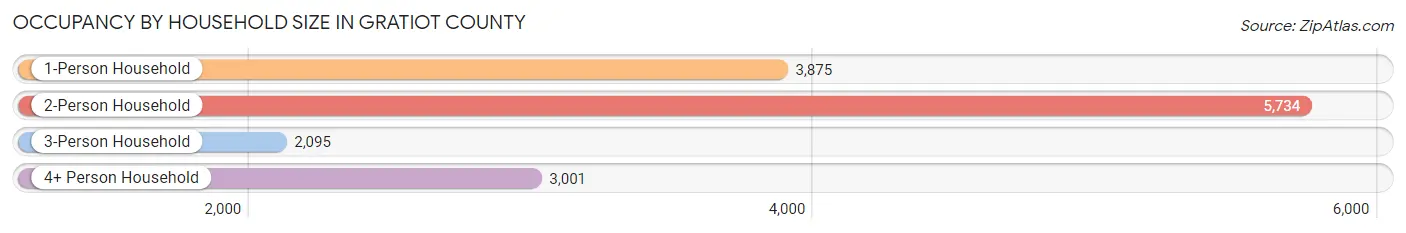
| Household Size | # Housing Units | % Housing Units |
| 1-Person Household | 3,875 | 26.4% |
| 2-Person Household | 5,734 | 39.0% |
| 3-Person Household | 2,095 | 14.2% |
| 4+ Person Household | 3,001 | 20.4% |
| Total Housing Units | 14,705 | 100.0% |
Occupancy by Ownership by Household Size in Gratiot County
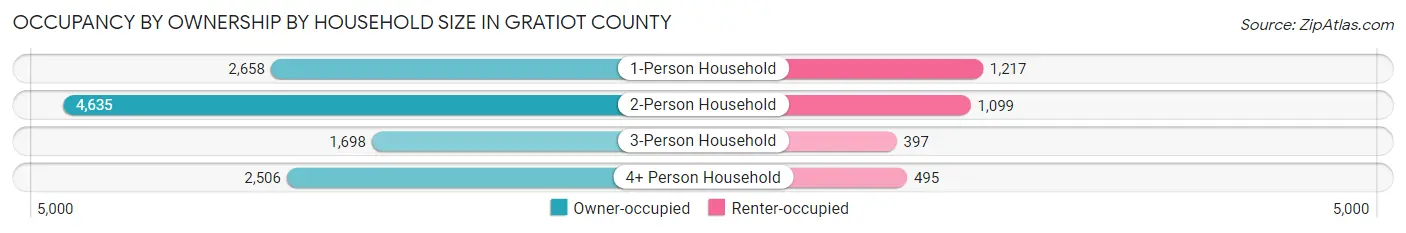
| Household Size | Owner-occupied | Renter-occupied |
| 1-Person Household | 2,658 (68.6%) | 1,217 (31.4%) |
| 2-Person Household | 4,635 (80.8%) | 1,099 (19.2%) |
| 3-Person Household | 1,698 (81.0%) | 397 (19.0%) |
| 4+ Person Household | 2,506 (83.5%) | 495 (16.5%) |
| Total Housing Units | 11,497 (78.2%) | 3,208 (21.8%) |
Occupancy by Educational Attainment in Gratiot County
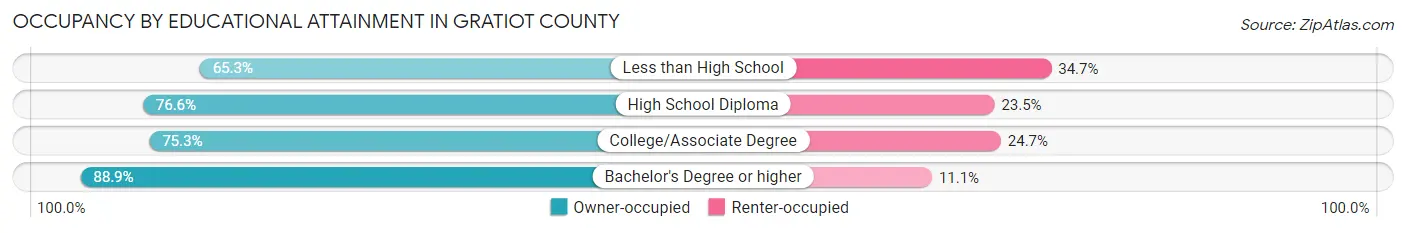
| Household Size | Owner-occupied | Renter-occupied |
| Less than High School | 581 (65.3%) | 309 (34.7%) |
| High School Diploma | 4,140 (76.5%) | 1,268 (23.4%) |
| College/Associate Degree | 3,865 (75.3%) | 1,269 (24.7%) |
| Bachelor's Degree or higher | 2,911 (88.9%) | 362 (11.1%) |
Occupancy by Age of Householder in Gratiot County
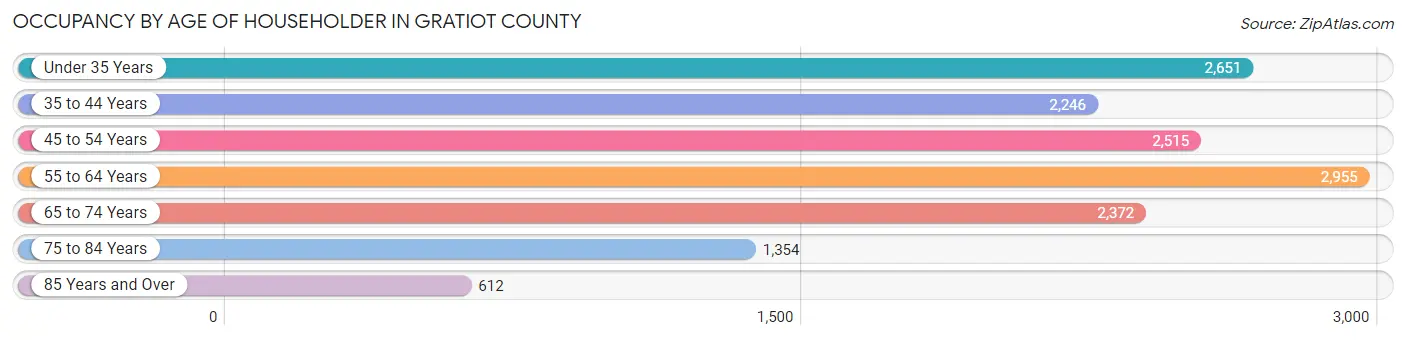
| Age Bracket | # Households | % Households |
| Under 35 Years | 2,651 | 18.0% |
| 35 to 44 Years | 2,246 | 15.3% |
| 45 to 54 Years | 2,515 | 17.1% |
| 55 to 64 Years | 2,955 | 20.1% |
| 65 to 74 Years | 2,372 | 16.1% |
| 75 to 84 Years | 1,354 | 9.2% |
| 85 Years and Over | 612 | 4.2% |
| Total | 14,705 | 100.0% |
Housing Finances in Gratiot County
Median Income by Occupancy in Gratiot County
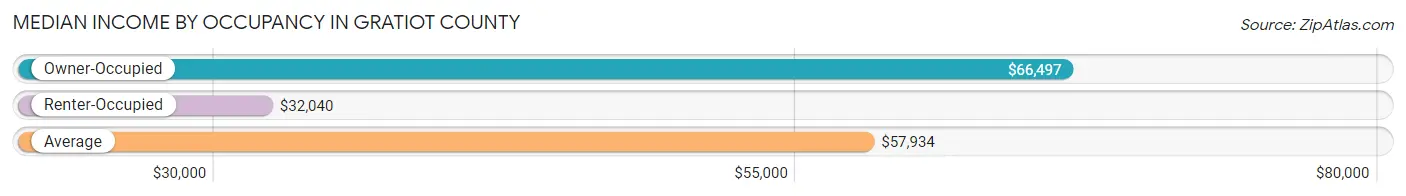
| Occupancy Type | # Households | Median Income |
| Owner-Occupied | 11,497 (78.2%) | $66,497 |
| Renter-Occupied | 3,208 (21.8%) | $32,040 |
| Average | 14,705 (100.0%) | $57,934 |
Occupancy by Householder Income Bracket in Gratiot County
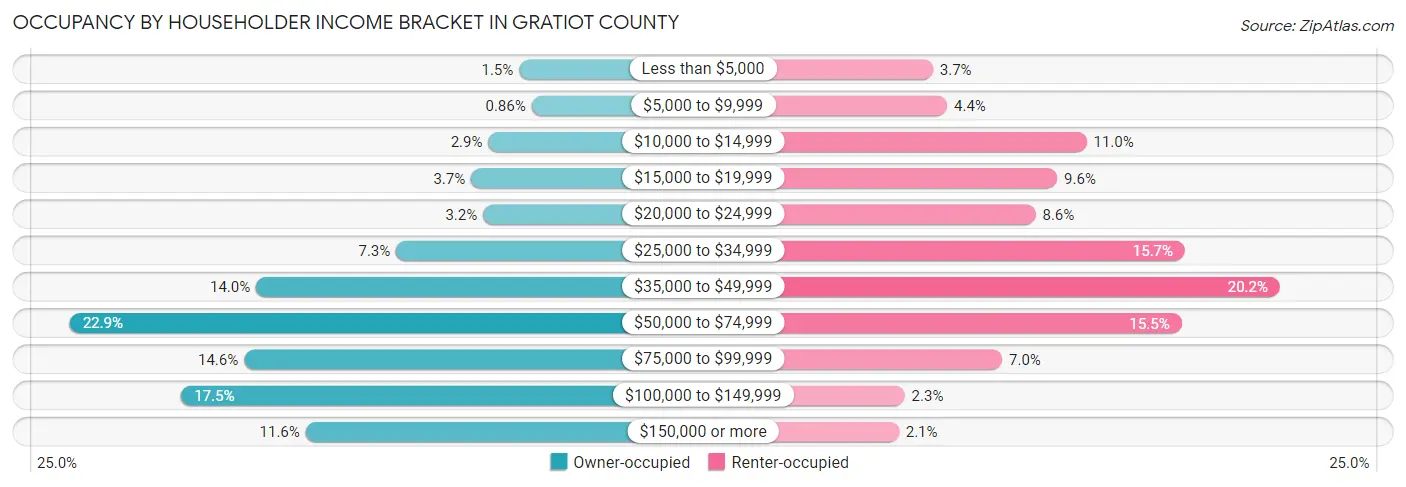
| Income Bracket | Owner-occupied | Renter-occupied |
| Less than $5,000 | 167 (1.5%) | 118 (3.7%) |
| $5,000 to $9,999 | 99 (0.9%) | 140 (4.4%) |
| $10,000 to $14,999 | 336 (2.9%) | 353 (11.0%) |
| $15,000 to $19,999 | 430 (3.7%) | 308 (9.6%) |
| $20,000 to $24,999 | 365 (3.2%) | 275 (8.6%) |
| $25,000 to $34,999 | 841 (7.3%) | 503 (15.7%) |
| $35,000 to $49,999 | 1,607 (14.0%) | 648 (20.2%) |
| $50,000 to $74,999 | 2,627 (22.9%) | 498 (15.5%) |
| $75,000 to $99,999 | 1,673 (14.5%) | 224 (7.0%) |
| $100,000 to $149,999 | 2,016 (17.5%) | 75 (2.3%) |
| $150,000 or more | 1,336 (11.6%) | 66 (2.1%) |
| Total | 11,497 (100.0%) | 3,208 (100.0%) |
Monthly Housing Cost Tiers in Gratiot County
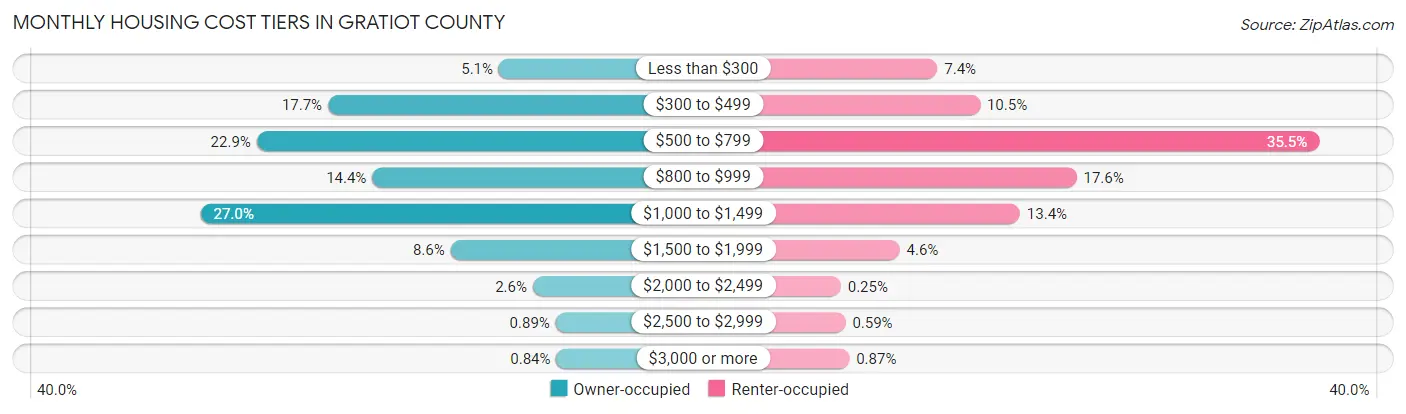
| Monthly Cost | Owner-occupied | Renter-occupied |
| Less than $300 | 583 (5.1%) | 236 (7.4%) |
| $300 to $499 | 2,030 (17.7%) | 337 (10.5%) |
| $500 to $799 | 2,634 (22.9%) | 1,138 (35.5%) |
| $800 to $999 | 1,656 (14.4%) | 565 (17.6%) |
| $1,000 to $1,499 | 3,109 (27.0%) | 431 (13.4%) |
| $1,500 to $1,999 | 992 (8.6%) | 147 (4.6%) |
| $2,000 to $2,499 | 295 (2.6%) | 8 (0.3%) |
| $2,500 to $2,999 | 102 (0.9%) | 19 (0.6%) |
| $3,000 or more | 96 (0.8%) | 28 (0.9%) |
| Total | 11,497 (100.0%) | 3,208 (100.0%) |
Physical Housing Characteristics in Gratiot County
Housing Structures in Gratiot County
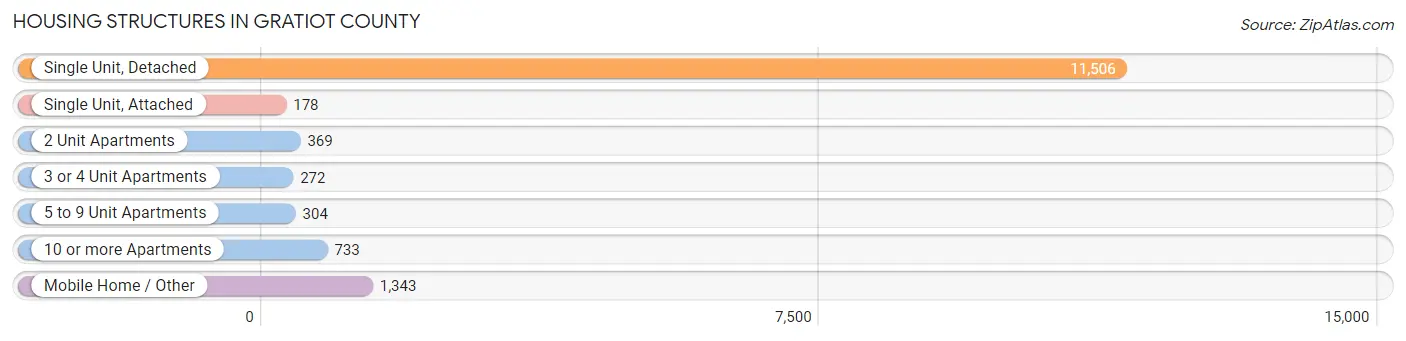
| Structure Type | # Housing Units | % Housing Units |
| Single Unit, Detached | 11,506 | 78.2% |
| Single Unit, Attached | 178 | 1.2% |
| 2 Unit Apartments | 369 | 2.5% |
| 3 or 4 Unit Apartments | 272 | 1.8% |
| 5 to 9 Unit Apartments | 304 | 2.1% |
| 10 or more Apartments | 733 | 5.0% |
| Mobile Home / Other | 1,343 | 9.1% |
| Total | 14,705 | 100.0% |
Housing Structures by Occupancy in Gratiot County
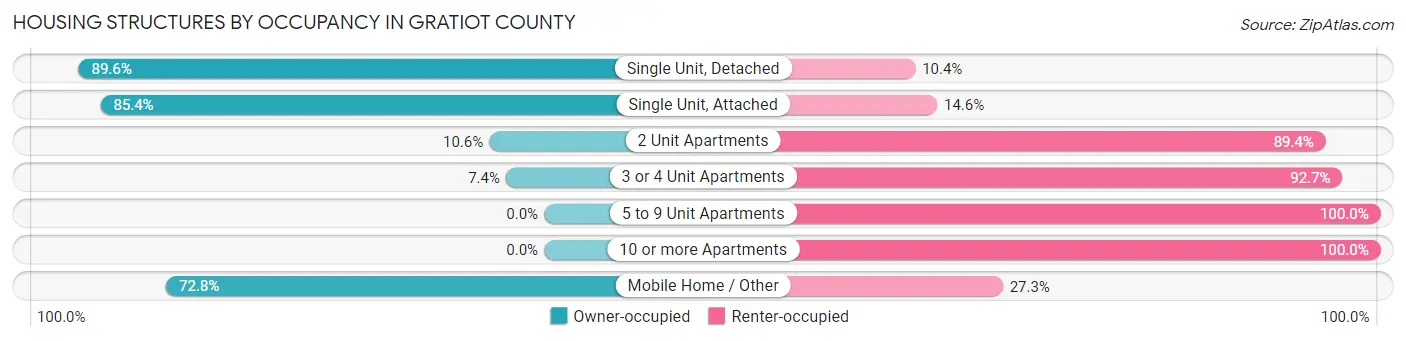
| Structure Type | Owner-occupied | Renter-occupied |
| Single Unit, Detached | 10,309 (89.6%) | 1,197 (10.4%) |
| Single Unit, Attached | 152 (85.4%) | 26 (14.6%) |
| 2 Unit Apartments | 39 (10.6%) | 330 (89.4%) |
| 3 or 4 Unit Apartments | 20 (7.3%) | 252 (92.6%) |
| 5 to 9 Unit Apartments | 0 (0.0%) | 304 (100.0%) |
| 10 or more Apartments | 0 (0.0%) | 733 (100.0%) |
| Mobile Home / Other | 977 (72.8%) | 366 (27.3%) |
| Total | 11,497 (78.2%) | 3,208 (21.8%) |
Housing Structures by Number of Rooms in Gratiot County
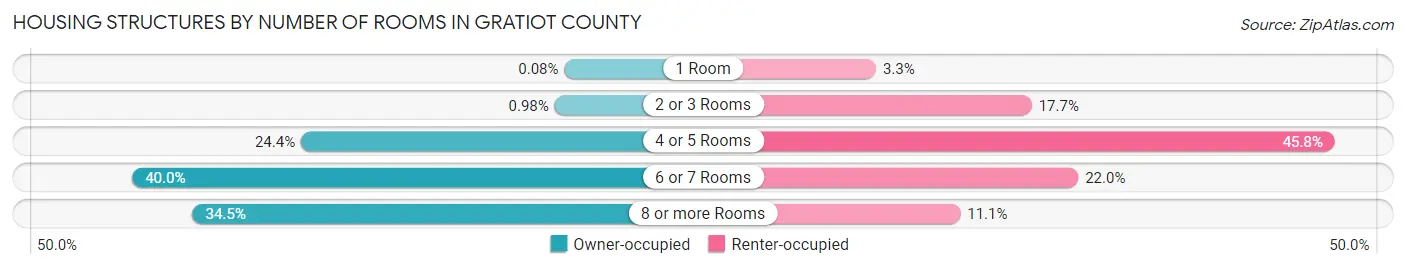
| Number of Rooms | Owner-occupied | Renter-occupied |
| 1 Room | 9 (0.1%) | 107 (3.3%) |
| 2 or 3 Rooms | 113 (1.0%) | 569 (17.7%) |
| 4 or 5 Rooms | 2,810 (24.4%) | 1,468 (45.8%) |
| 6 or 7 Rooms | 4,603 (40.0%) | 707 (22.0%) |
| 8 or more Rooms | 3,962 (34.5%) | 357 (11.1%) |
| Total | 11,497 (100.0%) | 3,208 (100.0%) |
Housing Structure by Heating Type in Gratiot County
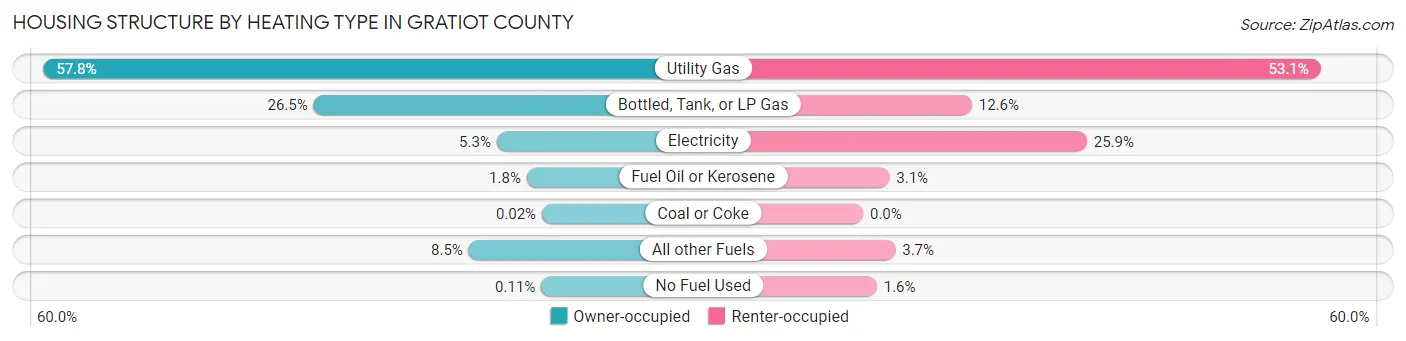
| Heating Type | Owner-occupied | Renter-occupied |
| Utility Gas | 6,649 (57.8%) | 1,702 (53.0%) |
| Bottled, Tank, or LP Gas | 3,045 (26.5%) | 405 (12.6%) |
| Electricity | 605 (5.3%) | 832 (25.9%) |
| Fuel Oil or Kerosene | 205 (1.8%) | 98 (3.0%) |
| Coal or Coke | 2 (0.0%) | 0 (0.0%) |
| All other Fuels | 978 (8.5%) | 120 (3.7%) |
| No Fuel Used | 13 (0.1%) | 51 (1.6%) |
| Total | 11,497 (100.0%) | 3,208 (100.0%) |
Household Vehicle Usage in Gratiot County
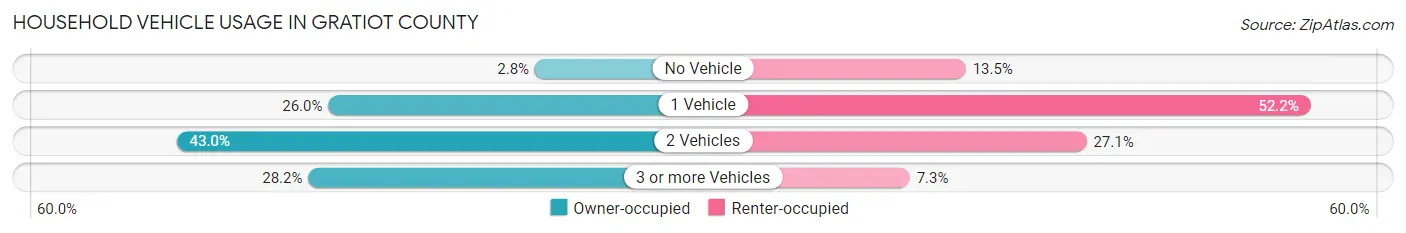
| Vehicles per Household | Owner-occupied | Renter-occupied |
| No Vehicle | 325 (2.8%) | 434 (13.5%) |
| 1 Vehicle | 2,987 (26.0%) | 1,673 (52.1%) |
| 2 Vehicles | 4,940 (43.0%) | 868 (27.1%) |
| 3 or more Vehicles | 3,245 (28.2%) | 233 (7.3%) |
| Total | 11,497 (100.0%) | 3,208 (100.0%) |
Real Estate & Mortgages in Gratiot County
Real Estate and Mortgage Overview in Gratiot County
| Characteristic | Without Mortgage | With Mortgage |
| Housing Units | 5,097 | 6,400 |
| Median Property Value | $119,800 | $131,900 |
| Median Household Income | $53,320 | $884 |
| Monthly Housing Costs | $501 | $86 |
| Real Estate Taxes | $1,585 | $297 |
Property Value by Mortgage Status in Gratiot County
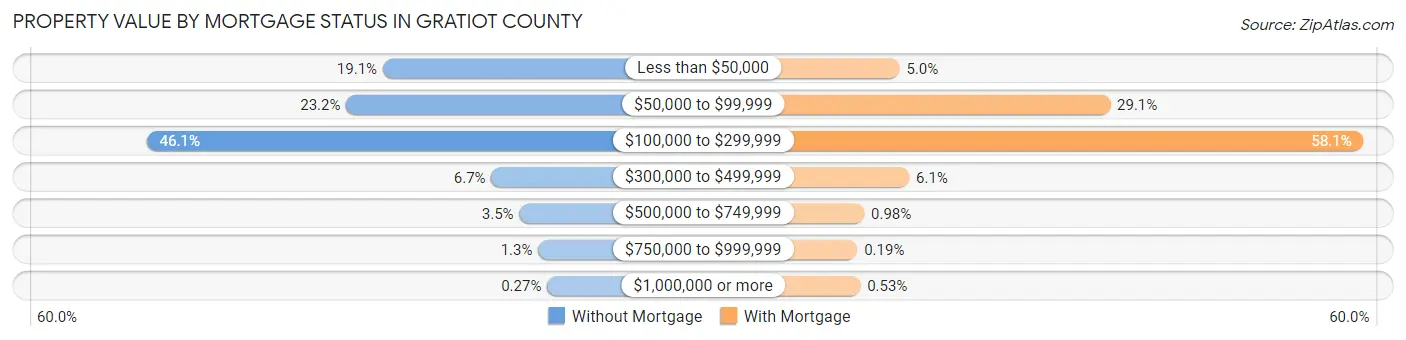
| Property Value | Without Mortgage | With Mortgage |
| Less than $50,000 | 971 (19.1%) | 322 (5.0%) |
| $50,000 to $99,999 | 1,184 (23.2%) | 1,862 (29.1%) |
| $100,000 to $299,999 | 2,347 (46.1%) | 3,715 (58.1%) |
| $300,000 to $499,999 | 339 (6.7%) | 392 (6.1%) |
| $500,000 to $749,999 | 176 (3.5%) | 63 (1.0%) |
| $750,000 to $999,999 | 66 (1.3%) | 12 (0.2%) |
| $1,000,000 or more | 14 (0.3%) | 34 (0.5%) |
| Total | 5,097 (100.0%) | 6,400 (100.0%) |
Household Income by Mortgage Status in Gratiot County
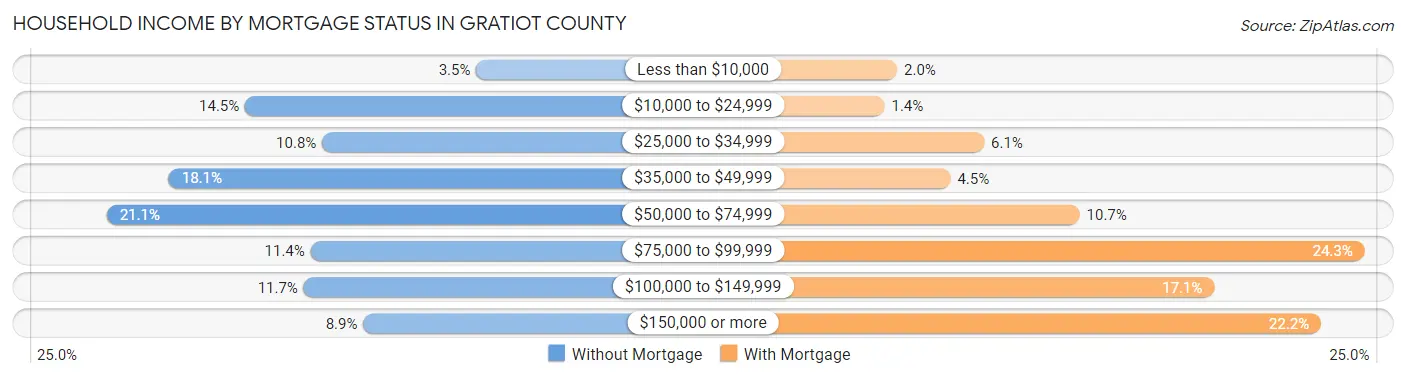
| Household Income | Without Mortgage | With Mortgage |
| Less than $10,000 | 178 (3.5%) | 127 (2.0%) |
| $10,000 to $24,999 | 739 (14.5%) | 88 (1.4%) |
| $25,000 to $34,999 | 552 (10.8%) | 392 (6.1%) |
| $35,000 to $49,999 | 924 (18.1%) | 289 (4.5%) |
| $50,000 to $74,999 | 1,075 (21.1%) | 683 (10.7%) |
| $75,000 to $99,999 | 580 (11.4%) | 1,552 (24.2%) |
| $100,000 to $149,999 | 597 (11.7%) | 1,093 (17.1%) |
| $150,000 or more | 452 (8.9%) | 1,419 (22.2%) |
| Total | 5,097 (100.0%) | 6,400 (100.0%) |
Property Value to Household Income Ratio in Gratiot County
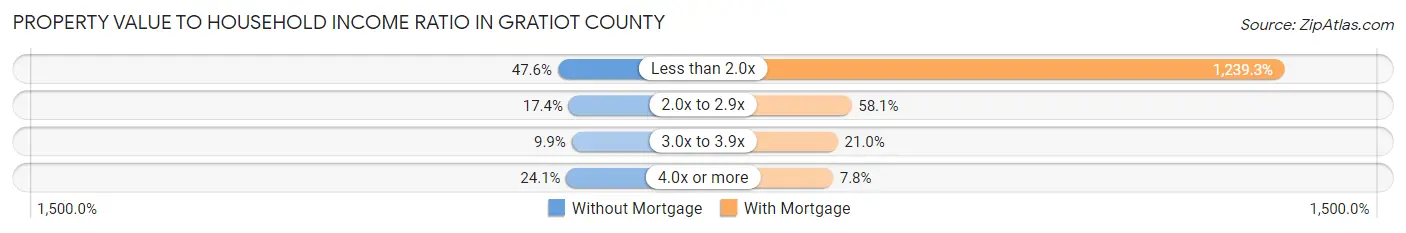
| Value-to-Income Ratio | Without Mortgage | With Mortgage |
| Less than 2.0x | 2,424 (47.6%) | 79,315 (1,239.3%) |
| 2.0x to 2.9x | 887 (17.4%) | 3,721 (58.1%) |
| 3.0x to 3.9x | 504 (9.9%) | 1,343 (21.0%) |
| 4.0x or more | 1,226 (24.0%) | 496 (7.7%) |
| Total | 5,097 (100.0%) | 6,400 (100.0%) |
Real Estate Taxes by Mortgage Status in Gratiot County
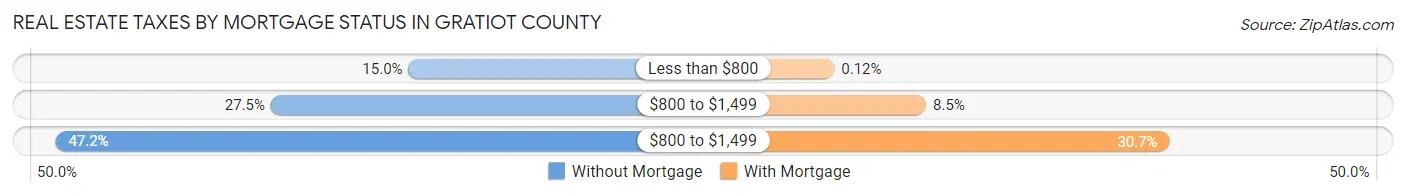
| Property Taxes | Without Mortgage | With Mortgage |
| Less than $800 | 762 (14.9%) | 8 (0.1%) |
| $800 to $1,499 | 1,402 (27.5%) | 544 (8.5%) |
| $800 to $1,499 | 2,405 (47.2%) | 1,966 (30.7%) |
| Total | 5,097 (100.0%) | 6,400 (100.0%) |
Health & Disability in Gratiot County
Health Insurance Coverage by Age in Gratiot County
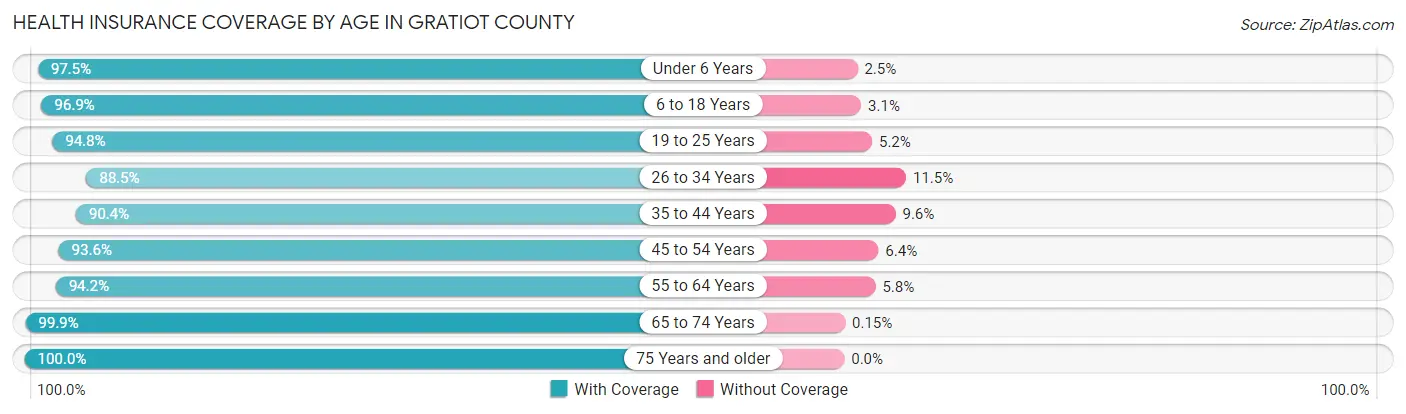
| Age Bracket | With Coverage | Without Coverage |
| Under 6 Years | 2,341 (97.5%) | 59 (2.5%) |
| 6 to 18 Years | 6,228 (96.9%) | 202 (3.1%) |
| 19 to 25 Years | 3,837 (94.8%) | 209 (5.2%) |
| 26 to 34 Years | 3,335 (88.5%) | 434 (11.5%) |
| 35 to 44 Years | 4,000 (90.4%) | 423 (9.6%) |
| 45 to 54 Years | 4,075 (93.6%) | 277 (6.4%) |
| 55 to 64 Years | 4,721 (94.2%) | 291 (5.8%) |
| 65 to 74 Years | 3,875 (99.9%) | 6 (0.2%) |
| 75 Years and older | 2,786 (100.0%) | 0 (0.0%) |
| Total | 35,198 (94.9%) | 1,901 (5.1%) |
Health Insurance Coverage by Citizenship Status in Gratiot County
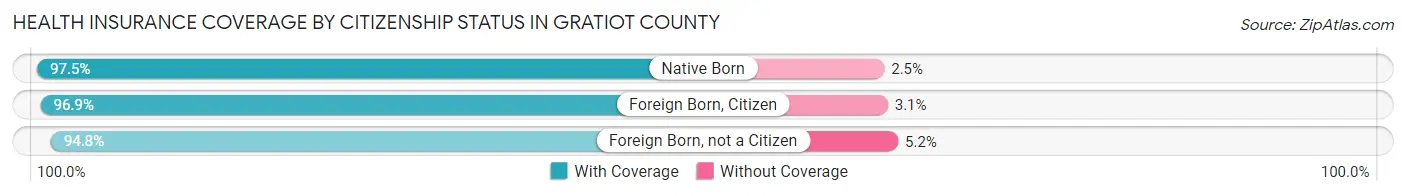
| Citizenship Status | With Coverage | Without Coverage |
| Native Born | 2,341 (97.5%) | 59 (2.5%) |
| Foreign Born, Citizen | 6,228 (96.9%) | 202 (3.1%) |
| Foreign Born, not a Citizen | 3,837 (94.8%) | 209 (5.2%) |
Health Insurance Coverage by Household Income in Gratiot County
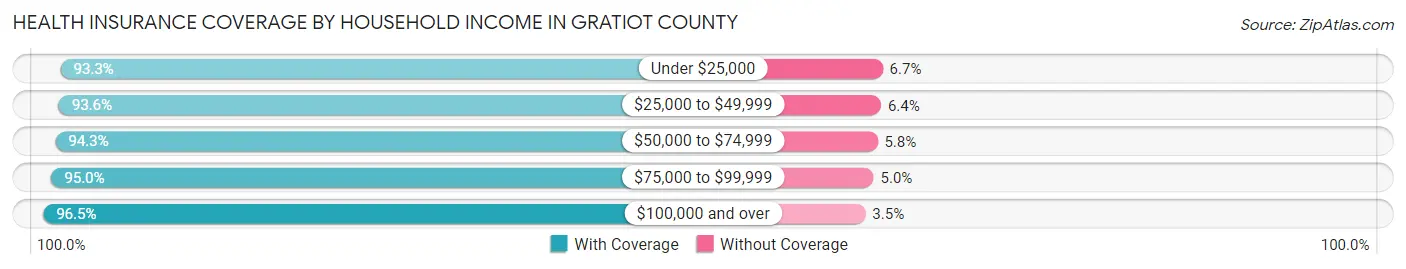
| Household Income | With Coverage | Without Coverage |
| Under $25,000 | 4,064 (93.3%) | 293 (6.7%) |
| $25,000 to $49,999 | 6,486 (93.6%) | 444 (6.4%) |
| $50,000 to $74,999 | 7,710 (94.3%) | 470 (5.8%) |
| $75,000 to $99,999 | 5,091 (95.0%) | 269 (5.0%) |
| $100,000 and over | 10,356 (96.5%) | 374 (3.5%) |
Public vs Private Health Insurance Coverage by Age in Gratiot County
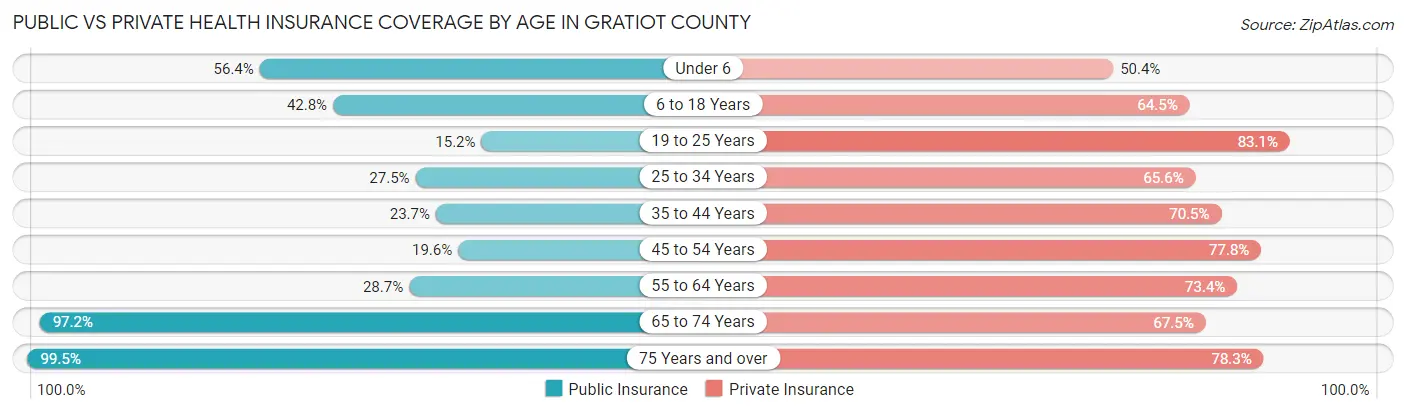
| Age Bracket | Public Insurance | Private Insurance |
| Under 6 | 1,353 (56.4%) | 1,209 (50.4%) |
| 6 to 18 Years | 2,750 (42.8%) | 4,150 (64.5%) |
| 19 to 25 Years | 616 (15.2%) | 3,364 (83.1%) |
| 25 to 34 Years | 1,035 (27.5%) | 2,474 (65.6%) |
| 35 to 44 Years | 1,047 (23.7%) | 3,116 (70.5%) |
| 45 to 54 Years | 851 (19.6%) | 3,387 (77.8%) |
| 55 to 64 Years | 1,436 (28.6%) | 3,678 (73.4%) |
| 65 to 74 Years | 3,772 (97.2%) | 2,620 (67.5%) |
| 75 Years and over | 2,771 (99.5%) | 2,181 (78.3%) |
| Total | 15,631 (42.1%) | 26,179 (70.6%) |
Disability Status by Sex by Age in Gratiot County
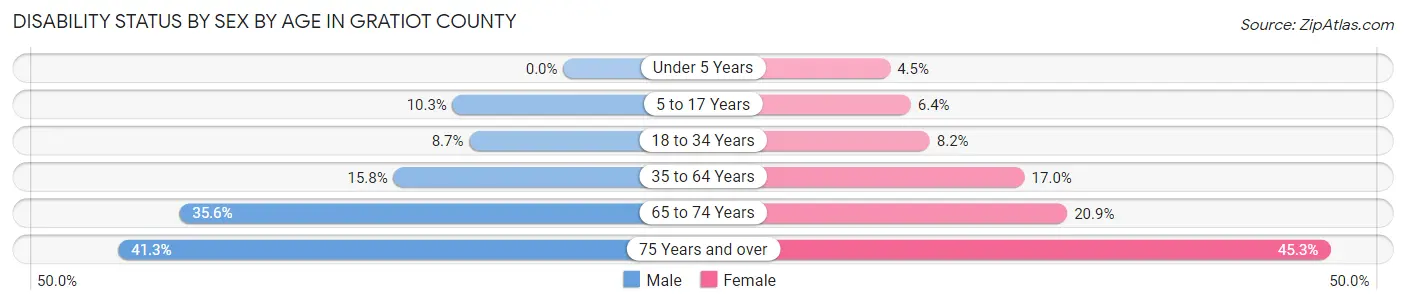
| Age Bracket | Male | Female |
| Under 5 Years | 0 (0.0%) | 43 (4.5%) |
| 5 to 17 Years | 320 (10.3%) | 185 (6.4%) |
| 18 to 34 Years | 379 (8.7%) | 352 (8.2%) |
| 35 to 64 Years | 1,077 (15.8%) | 1,180 (17.0%) |
| 65 to 74 Years | 659 (35.6%) | 425 (20.9%) |
| 75 Years and over | 489 (41.3%) | 726 (45.3%) |
Disability Class by Sex by Age in Gratiot County
Disability Class: Hearing Difficulty
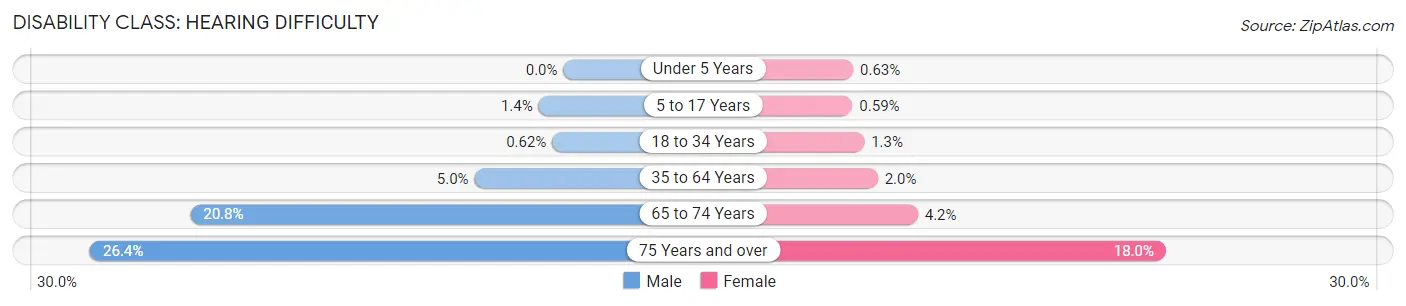
| Age Bracket | Male | Female |
| Under 5 Years | 0 (0.0%) | 6 (0.6%) |
| 5 to 17 Years | 43 (1.4%) | 17 (0.6%) |
| 18 to 34 Years | 27 (0.6%) | 54 (1.3%) |
| 35 to 64 Years | 338 (5.0%) | 139 (2.0%) |
| 65 to 74 Years | 384 (20.8%) | 86 (4.2%) |
| 75 Years and over | 312 (26.4%) | 289 (18.0%) |
Disability Class: Vision Difficulty
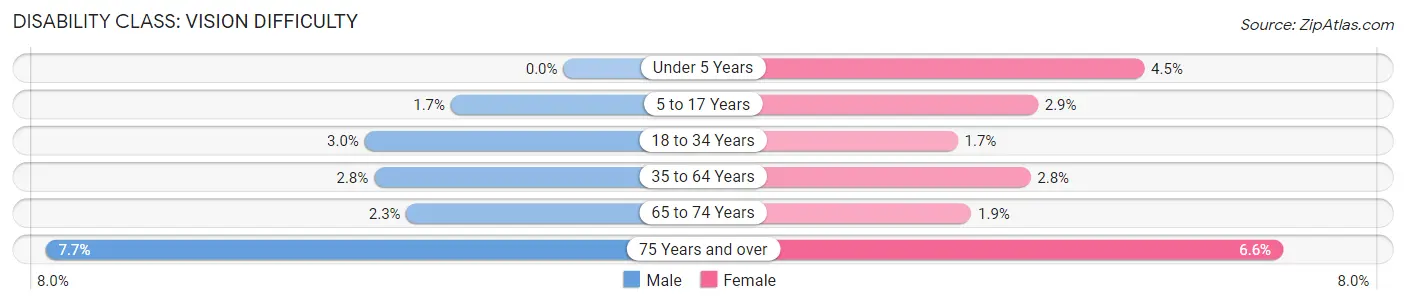
| Age Bracket | Male | Female |
| Under 5 Years | 0 (0.0%) | 43 (4.5%) |
| 5 to 17 Years | 52 (1.7%) | 84 (2.9%) |
| 18 to 34 Years | 128 (2.9%) | 74 (1.7%) |
| 35 to 64 Years | 192 (2.8%) | 195 (2.8%) |
| 65 to 74 Years | 43 (2.3%) | 39 (1.9%) |
| 75 Years and over | 91 (7.7%) | 105 (6.6%) |
Disability Class: Cognitive Difficulty
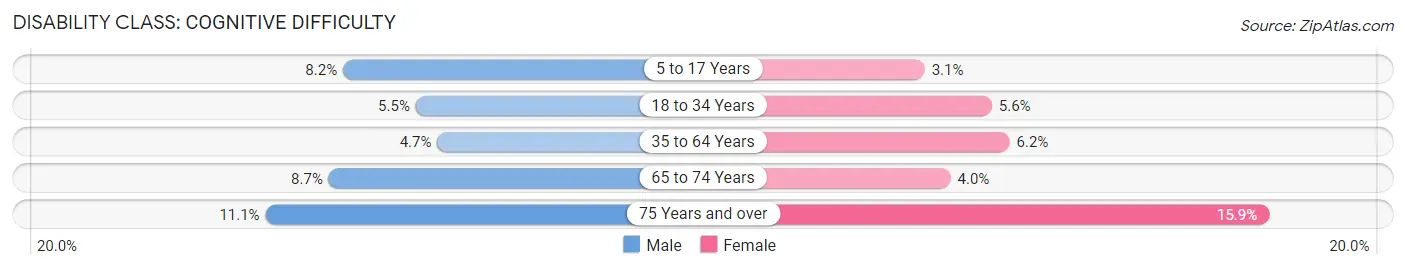
| Age Bracket | Male | Female |
| 5 to 17 Years | 255 (8.2%) | 89 (3.1%) |
| 18 to 34 Years | 238 (5.5%) | 240 (5.6%) |
| 35 to 64 Years | 320 (4.7%) | 433 (6.2%) |
| 65 to 74 Years | 161 (8.7%) | 82 (4.0%) |
| 75 Years and over | 131 (11.1%) | 254 (15.9%) |
Disability Class: Ambulatory Difficulty
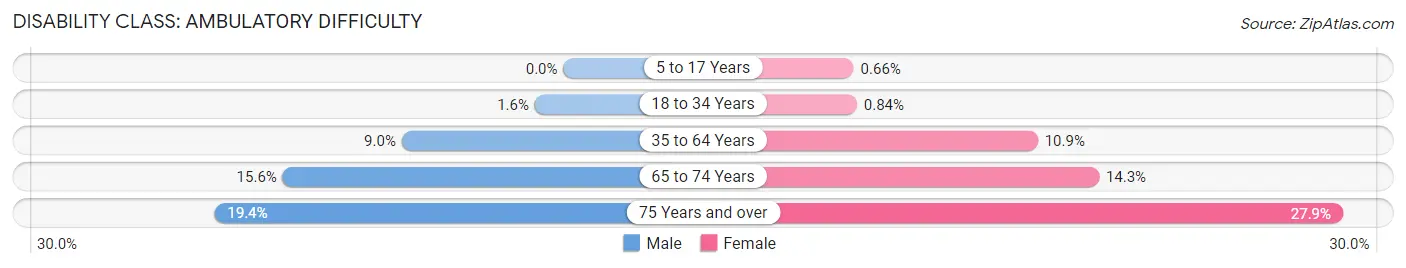
| Age Bracket | Male | Female |
| 5 to 17 Years | 0 (0.0%) | 19 (0.7%) |
| 18 to 34 Years | 69 (1.6%) | 36 (0.8%) |
| 35 to 64 Years | 615 (9.0%) | 759 (10.9%) |
| 65 to 74 Years | 289 (15.6%) | 291 (14.3%) |
| 75 Years and over | 230 (19.4%) | 447 (27.9%) |
Disability Class: Self-Care Difficulty
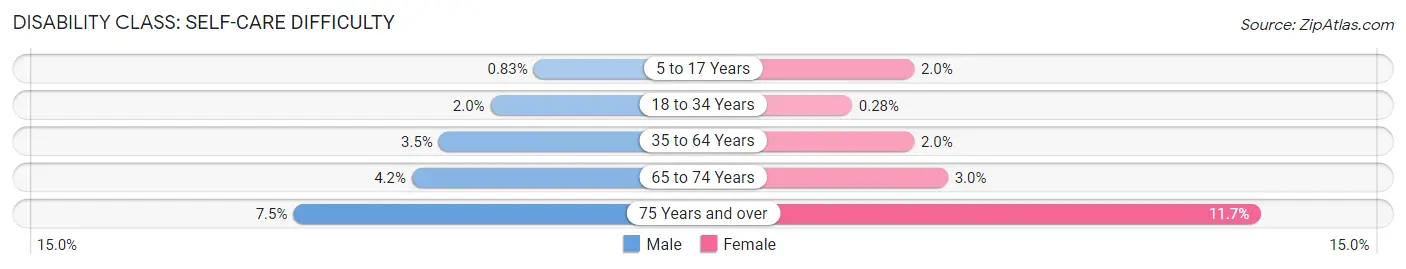
| Age Bracket | Male | Female |
| 5 to 17 Years | 26 (0.8%) | 58 (2.0%) |
| 18 to 34 Years | 88 (2.0%) | 12 (0.3%) |
| 35 to 64 Years | 237 (3.5%) | 140 (2.0%) |
| 65 to 74 Years | 78 (4.2%) | 60 (2.9%) |
| 75 Years and over | 89 (7.5%) | 187 (11.7%) |
Technology Access in Gratiot County
Computing Device Access in Gratiot County
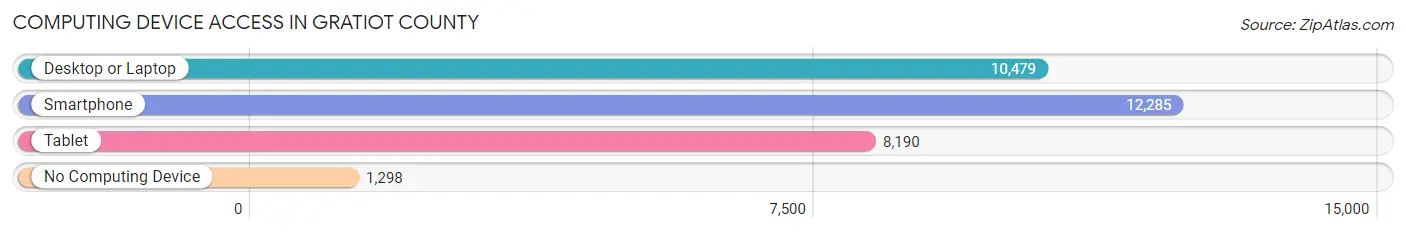
| Device Type | # Households | % Households |
| Desktop or Laptop | 10,479 | 71.3% |
| Smartphone | 12,285 | 83.5% |
| Tablet | 8,190 | 55.7% |
| No Computing Device | 1,298 | 8.8% |
| Total | 14,705 | 100.0% |
Internet Access in Gratiot County
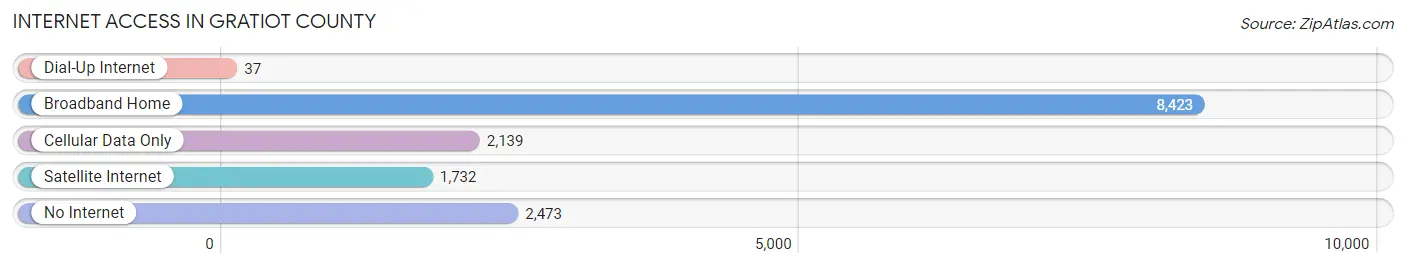
| Internet Type | # Households | % Households |
| Dial-Up Internet | 37 | 0.3% |
| Broadband Home | 8,423 | 57.3% |
| Cellular Data Only | 2,139 | 14.5% |
| Satellite Internet | 1,732 | 11.8% |
| No Internet | 2,473 | 16.8% |
| Total | 14,705 | 100.0% |
Gratiot County Summary
Gratiot County is located in the central region of Michigan’s Lower Peninsula. It is bordered by Isabella County to the north, Saginaw County to the east, Midland County to the south, and Clinton County to the west. The county seat is Ithaca, and the largest city is Alma. The county was established in 1855 and named after Charles Gratiot, a French-Canadian military officer who served in the War of 1812.
History
The area that is now Gratiot County was originally inhabited by the Ojibwe people. The first European settlers arrived in the area in the early 19th century, and the county was officially established in 1855. The county was largely agricultural, with the main crops being wheat, corn, and oats. In the late 19th century, the county began to industrialize, with the establishment of several factories and mills.
The county was also home to several military installations during the 20th century. The most notable of these was the Gratiot County Air Force Base, which was established in 1942 and served as a training base for the United States Army Air Forces during World War II. The base was closed in 1945, but the county still has a strong military presence, with the Gratiot County National Guard Armory located in Alma.
Geography
Gratiot County covers an area of 576 square miles and is located in the central region of Michigan’s Lower Peninsula. The county is mostly flat, with the highest point being the summit of Pine Hill, which has an elevation of 1,068 feet. The county is drained by the Pine River, which flows through the center of the county.
The county is home to several state parks, including the Gratiot County State Game Area, the Gratiot County State Forest, and the Gratiot County State Park. The county also has several lakes, including Lake Isabella, Lake St. Clair, and Lake Huron.
Economy
Gratiot County’s economy is largely based on agriculture and manufacturing. The county’s main crops are corn, wheat, and oats, and the county is also home to several factories and mills. The county is also home to several military installations, including the Gratiot County National Guard Armory.
The county’s largest employers are the Gratiot County Medical Center, the Gratiot County Community College, and the Gratiot County Public Schools. The county also has a strong tourism industry, with several popular attractions, including the Gratiot County Historical Museum and the Gratiot County Fairgrounds.
Demographics
As of the 2010 census, Gratiot County had a population of 42,476. The racial makeup of the county was 94.2% White, 2.3% African American, 0.7% Native American, 0.5% Asian, 0.1% Pacific Islander, 0.7% from other races, and 1.5% from two or more races. Hispanic or Latino of any race were 2.7% of the population.
The median income for a household in the county was $41,945, and the median income for a family was $50,945. The per capita income for the county was $20,845. About 11.2% of families and 14.3% of the population were below the poverty line, including 19.2% of those under age 18 and 8.2% of those age 65 or over.
Common Questions
What is Per Capita Income in Gratiot County?
Per Capita income in Gratiot County is $28,123.
What is the Median Family Income in Gratiot County?
Median Family Income in Gratiot County is $69,294.
What is the Median Household income in Gratiot County?
Median Household Income in Gratiot County is $57,934.
What is Income or Wage Gap in Gratiot County?
Income or Wage Gap in Gratiot County is 29.8%.
Women in Gratiot County earn 70.2 cents for every dollar earned by a man.
What is Family Income Deficit in Gratiot County?
Family Income Deficit in Gratiot County is $11,555.
Families that are below poverty line in Gratiot County earn $11,555 less on average than the poverty threshold level.
What is Inequality or Gini Index in Gratiot County?
Inequality or Gini Index in Gratiot County is 0.44.
What is the Total Population of Gratiot County?
Total Population of Gratiot County is 41,534.
What is the Total Male Population of Gratiot County?
Total Male Population of Gratiot County is 22,438.
What is the Total Female Population of Gratiot County?
Total Female Population of Gratiot County is 19,096.
What is the Ratio of Males per 100 Females in Gratiot County?
There are 117.50 Males per 100 Females in Gratiot County.
What is the Ratio of Females per 100 Males in Gratiot County?
There are 85.11 Females per 100 Males in Gratiot County.
What is the Median Population Age in Gratiot County?
Median Population Age in Gratiot County is 39.6 Years.
What is the Average Family Size in Gratiot County
Average Family Size in Gratiot County is 2.9 People.
What is the Average Household Size in Gratiot County
Average Household Size in Gratiot County is 2.4 People.
How Large is the Labor Force in Gratiot County?
There are 18,034 People in the Labor Forcein in Gratiot County.
What is the Percentage of People in the Labor Force in Gratiot County?
52.1% of People are in the Labor Force in Gratiot County.
What is the Unemployment Rate in Gratiot County?
Unemployment Rate in Gratiot County is 4.9%.