Gladwin County, MI Map & Demographics
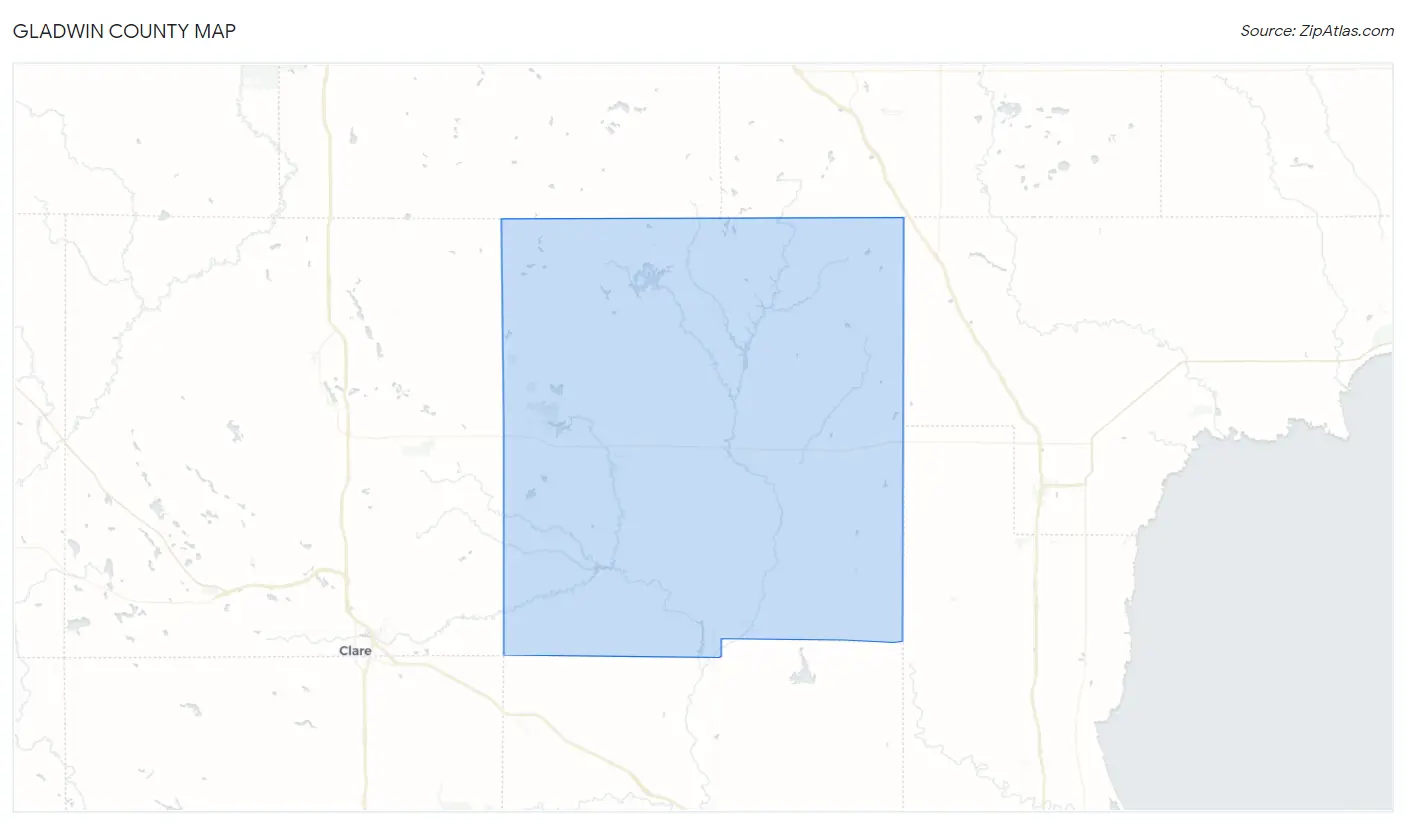
Gladwin County Map
Gladwin County Overview
$30,893
PER CAPITA INCOME
$67,953
AVG FAMILY INCOME
$53,717
AVG HOUSEHOLD INCOME
40.3%
WAGE / INCOME GAP [ % ]
59.7¢/ $1
WAGE / INCOME GAP [ $ ]
$9,853
FAMILY INCOME DEFICIT
0.45
INEQUALITY / GINI INDEX
25,461
TOTAL POPULATION
12,823
MALE POPULATION
12,638
FEMALE POPULATION
101.46
MALES / 100 FEMALES
98.56
FEMALES / 100 MALES
50.7
MEDIAN AGE
2.9
AVG FAMILY SIZE
2.3
AVG HOUSEHOLD SIZE
9,960
LABOR FORCE [ PEOPLE ]
46.7%
PERCENT IN LABOR FORCE
6.9%
UNEMPLOYMENT RATE
Gladwin County Area Codes
Income in Gladwin County
Income Overview in Gladwin County
Per Capita Income in Gladwin County is $30,893, while median incomes of families and households are $67,953 and $53,717 respectively.
| Characteristic | Number | Measure |
| Per Capita Income | 25,461 | $30,893 |
| Median Family Income | 6,998 | $67,953 |
| Mean Family Income | 6,998 | $83,817 |
| Median Household Income | 10,859 | $53,717 |
| Mean Household Income | 10,859 | $71,643 |
| Income Deficit | 6,998 | $9,853 |
| Wage / Income Gap (%) | 25,461 | 40.26% |
| Wage / Income Gap ($) | 25,461 | 59.74¢ per $1 |
| Gini / Inequality Index | 25,461 | 0.45 |
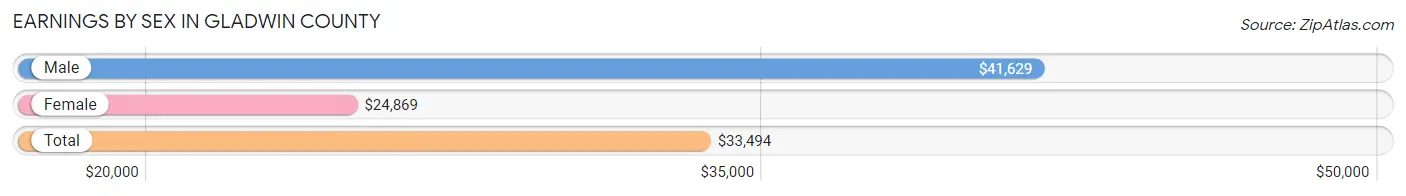
Earnings by Sex in Gladwin County
Average Earnings in Gladwin County are $33,494, $41,629 for men and $24,869 for women, a difference of 40.3%.
| Sex | Number | Average Earnings |
| Male | 5,477 (52.6%) | $41,629 |
| Female | 4,937 (47.4%) | $24,869 |
| Total | 10,414 (100.0%) | $33,494 |
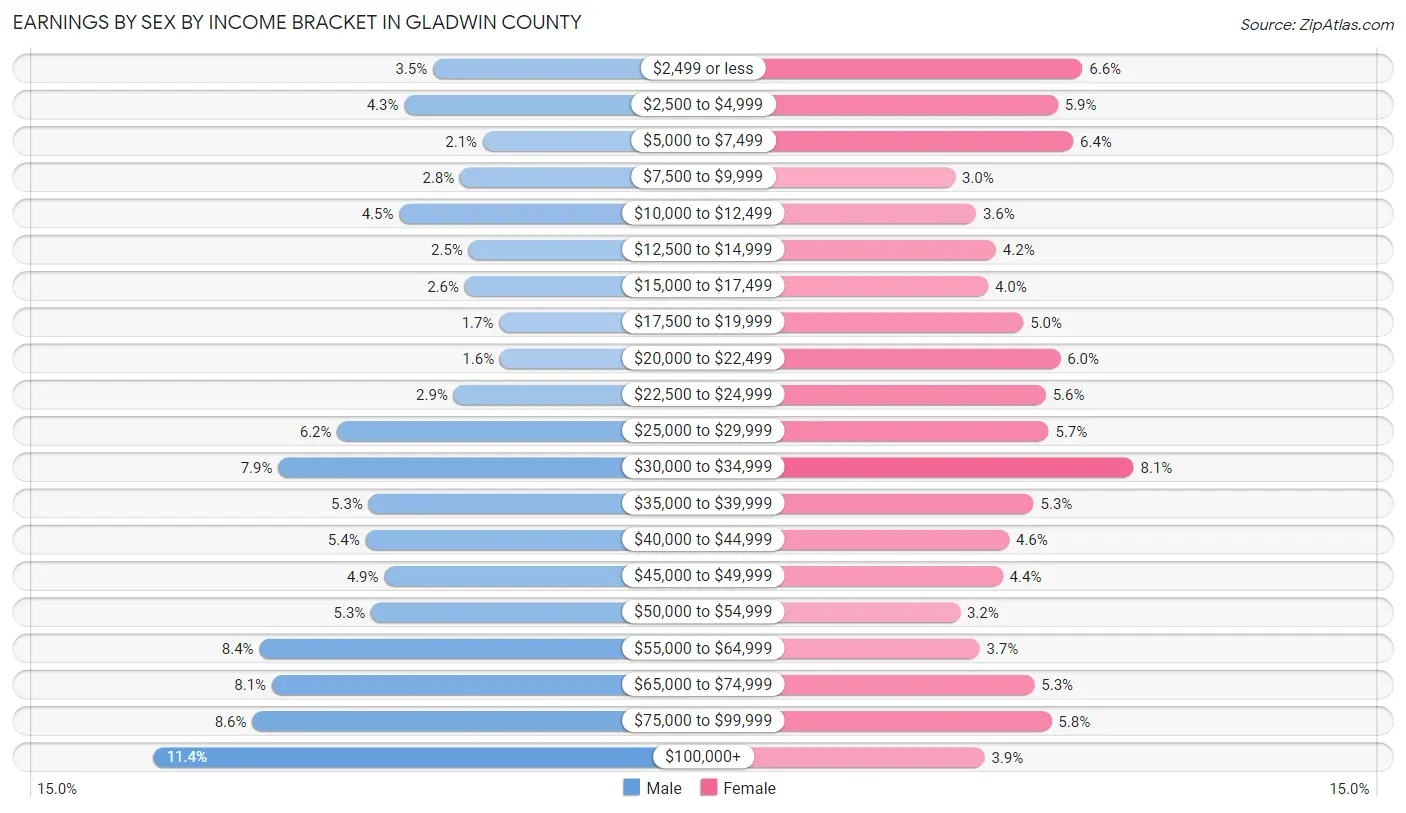
Earnings by Sex by Income Bracket in Gladwin County
The most common earnings brackets in Gladwin County are $100,000+ for men (623 | 11.4%) and $30,000 to $34,999 for women (398 | 8.1%).
| Income | Male | Female |
| $2,499 or less | 193 (3.5%) | 327 (6.6%) |
| $2,500 to $4,999 | 237 (4.3%) | 293 (5.9%) |
| $5,000 to $7,499 | 116 (2.1%) | 314 (6.4%) |
| $7,500 to $9,999 | 151 (2.8%) | 150 (3.0%) |
| $10,000 to $12,499 | 245 (4.5%) | 179 (3.6%) |
| $12,500 to $14,999 | 138 (2.5%) | 207 (4.2%) |
| $15,000 to $17,499 | 144 (2.6%) | 196 (4.0%) |
| $17,500 to $19,999 | 91 (1.7%) | 245 (5.0%) |
| $20,000 to $22,499 | 90 (1.6%) | 296 (6.0%) |
| $22,500 to $24,999 | 161 (2.9%) | 276 (5.6%) |
| $25,000 to $29,999 | 340 (6.2%) | 280 (5.7%) |
| $30,000 to $34,999 | 431 (7.9%) | 398 (8.1%) |
| $35,000 to $39,999 | 292 (5.3%) | 259 (5.2%) |
| $40,000 to $44,999 | 297 (5.4%) | 225 (4.6%) |
| $45,000 to $49,999 | 268 (4.9%) | 216 (4.4%) |
| $50,000 to $54,999 | 288 (5.3%) | 157 (3.2%) |
| $55,000 to $64,999 | 460 (8.4%) | 184 (3.7%) |
| $65,000 to $74,999 | 441 (8.1%) | 260 (5.3%) |
| $75,000 to $99,999 | 471 (8.6%) | 284 (5.8%) |
| $100,000+ | 623 (11.4%) | 191 (3.9%) |
| Total | 5,477 (100.0%) | 4,937 (100.0%) |
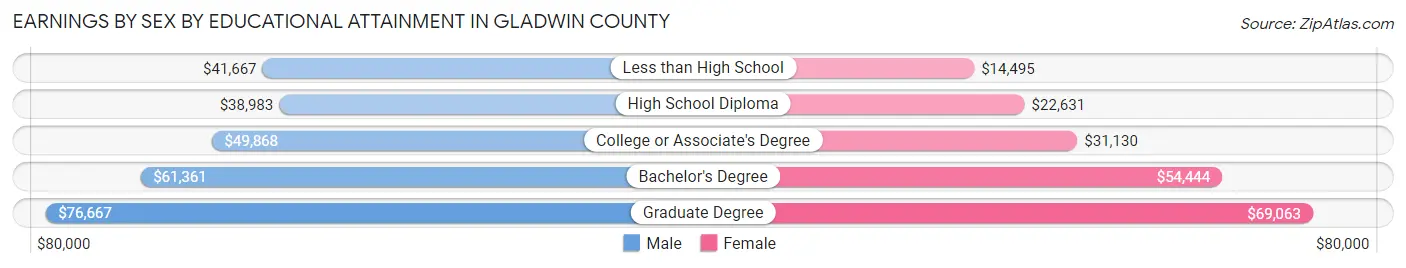
Earnings by Sex by Educational Attainment in Gladwin County
Average earnings in Gladwin County are $45,993 for men and $29,696 for women, a difference of 35.4%. Men with an educational attainment of graduate degree enjoy the highest average annual earnings of $76,667, while those with high school diploma education earn the least with $38,983. Women with an educational attainment of graduate degree earn the most with the average annual earnings of $69,063, while those with less than high school education have the smallest earnings of $14,495.
| Educational Attainment | Male Income | Female Income |
| Less than High School | $41,667 | $14,495 |
| High School Diploma | $38,983 | $22,631 |
| College or Associate's Degree | $49,868 | $31,130 |
| Bachelor's Degree | $61,361 | $54,444 |
| Graduate Degree | $76,667 | $69,063 |
| Total | $45,993 | $29,696 |
Family Income in Gladwin County
Family Income Brackets in Gladwin County
According to the Gladwin County family income data, there are 1,386 families falling into the $50,000 to $74,999 income range, which is the most common income bracket and makes up 19.8% of all families. Conversely, the less than $10,000 income bracket is the least frequent group with only 133 families (1.9%) belonging to this category.
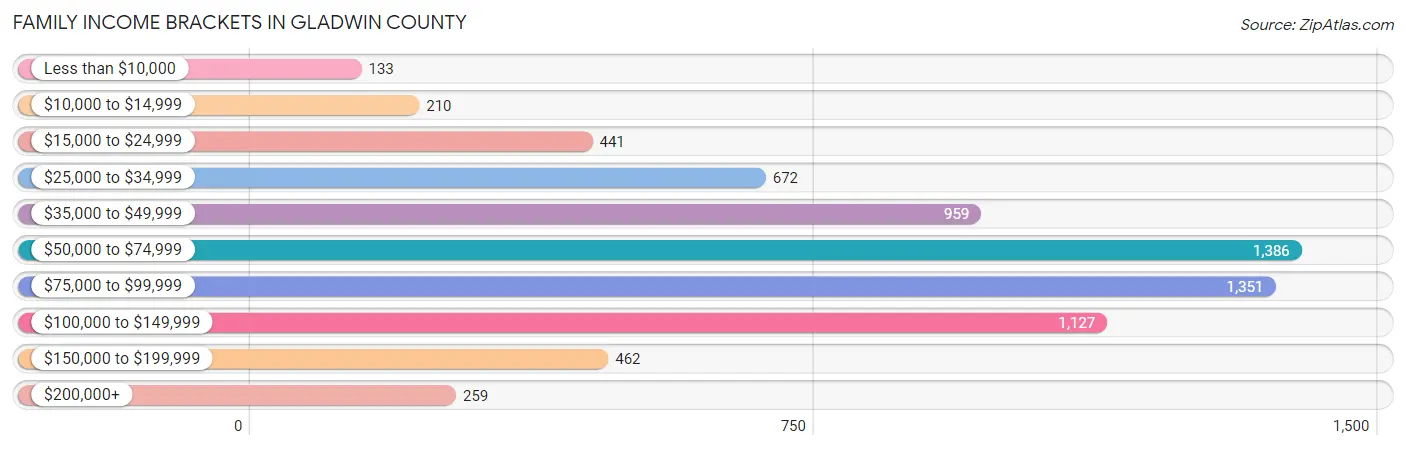
| Income Bracket | # Families | % Families |
| Less than $10,000 | 133 | 1.9% |
| $10,000 to $14,999 | 210 | 3.0% |
| $15,000 to $24,999 | 441 | 6.3% |
| $25,000 to $34,999 | 672 | 9.6% |
| $35,000 to $49,999 | 959 | 13.7% |
| $50,000 to $74,999 | 1,386 | 19.8% |
| $75,000 to $99,999 | 1,351 | 19.3% |
| $100,000 to $149,999 | 1,127 | 16.1% |
| $150,000 to $199,999 | 462 | 6.6% |
| $200,000+ | 259 | 3.7% |
Family Income by Famaliy Size in Gladwin County
7+ person families (173 | 2.5%) account for the highest median family income in Gladwin County with $87,585 per family, while 2-person families (4,250 | 60.7%) have the highest median income of $30,927 per family member.
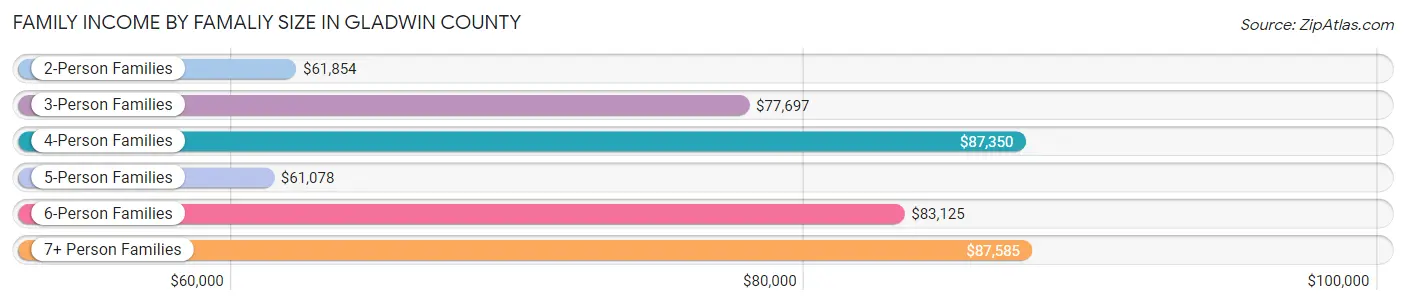
| Income Bracket | # Families | Median Income |
| 2-Person Families | 4,250 (60.7%) | $61,854 |
| 3-Person Families | 1,146 (16.4%) | $77,697 |
| 4-Person Families | 761 (10.9%) | $87,350 |
| 5-Person Families | 375 (5.4%) | $61,078 |
| 6-Person Families | 293 (4.2%) | $83,125 |
| 7+ Person Families | 173 (2.5%) | $87,585 |
| Total | 6,998 (100.0%) | $67,953 |
Family Income by Number of Earners in Gladwin County
The median family income in Gladwin County is $67,953, with families comprising 3+ earners (525) having the highest median family income of $106,319, while families with no earners (2,176) have the lowest median family income of $48,087, accounting for 7.5% and 31.1% of families, respectively.
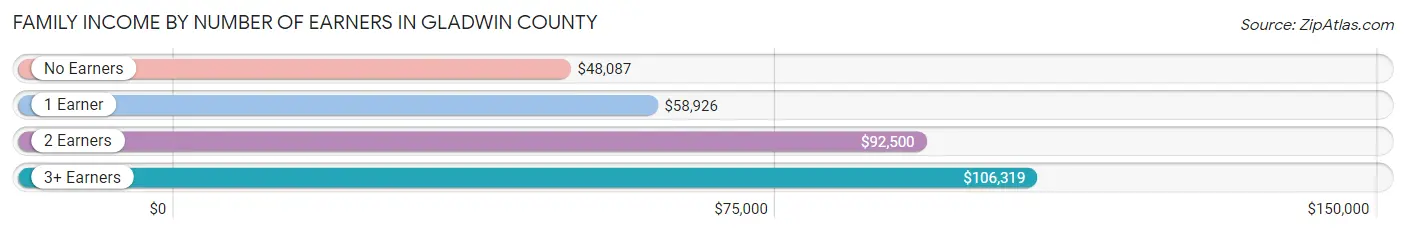
| Number of Earners | # Families | Median Income |
| No Earners | 2,176 (31.1%) | $48,087 |
| 1 Earner | 2,167 (31.0%) | $58,926 |
| 2 Earners | 2,130 (30.4%) | $92,500 |
| 3+ Earners | 525 (7.5%) | $106,319 |
| Total | 6,998 (100.0%) | $67,953 |
Household Income in Gladwin County
Household Income Brackets in Gladwin County
With 1,955 households falling in the category, the $50,000 to $74,999 income range is the most frequent in Gladwin County, accounting for 18.0% of all households. In contrast, only 337 households (3.1%) fall into the $200,000+ income bracket, making it the least populous group.
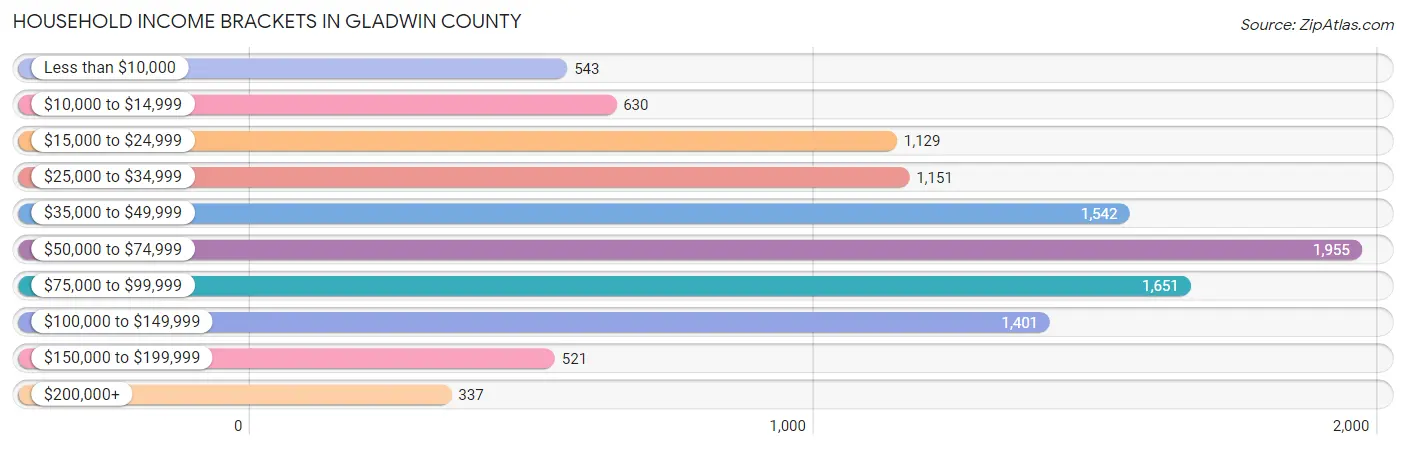
| Income Bracket | # Households | % Households |
| Less than $10,000 | 543 | 5.0% |
| $10,000 to $14,999 | 630 | 5.8% |
| $15,000 to $24,999 | 1,129 | 10.4% |
| $25,000 to $34,999 | 1,151 | 10.6% |
| $35,000 to $49,999 | 1,542 | 14.2% |
| $50,000 to $74,999 | 1,955 | 18.0% |
| $75,000 to $99,999 | 1,651 | 15.2% |
| $100,000 to $149,999 | 1,401 | 12.9% |
| $150,000 to $199,999 | 521 | 4.8% |
| $200,000+ | 337 | 3.1% |
Household Income by Householder Age in Gladwin County
The median household income in Gladwin County is $53,717, with the highest median household income of $67,723 found in the 25 to 44 years age bracket for the primary householder. A total of 2,107 households (19.4%) fall into this category. Meanwhile, the 65+ years age bracket for the primary householder has the lowest median household income of $47,622, with 4,288 households (39.5%) in this group.
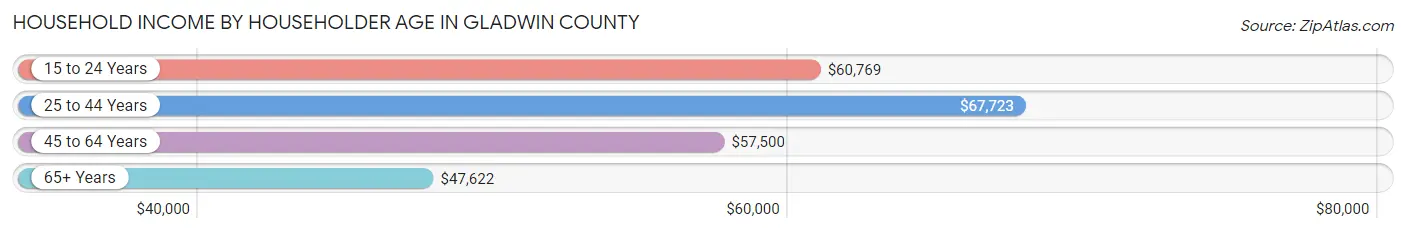
| Income Bracket | # Households | Median Income |
| 15 to 24 Years | 264 (2.4%) | $60,769 |
| 25 to 44 Years | 2,107 (19.4%) | $67,723 |
| 45 to 64 Years | 4,200 (38.7%) | $57,500 |
| 65+ Years | 4,288 (39.5%) | $47,622 |
| Total | 10,859 (100.0%) | $53,717 |
Poverty in Gladwin County
Income Below Poverty by Sex and Age in Gladwin County
With 13.9% poverty level for males and 14.5% for females among the residents of Gladwin County, under 5 year old males and 16 and 17 year old females are the most vulnerable to poverty, with 127 males (19.0%) and 103 females (31.7%) in their respective age groups living below the poverty level.
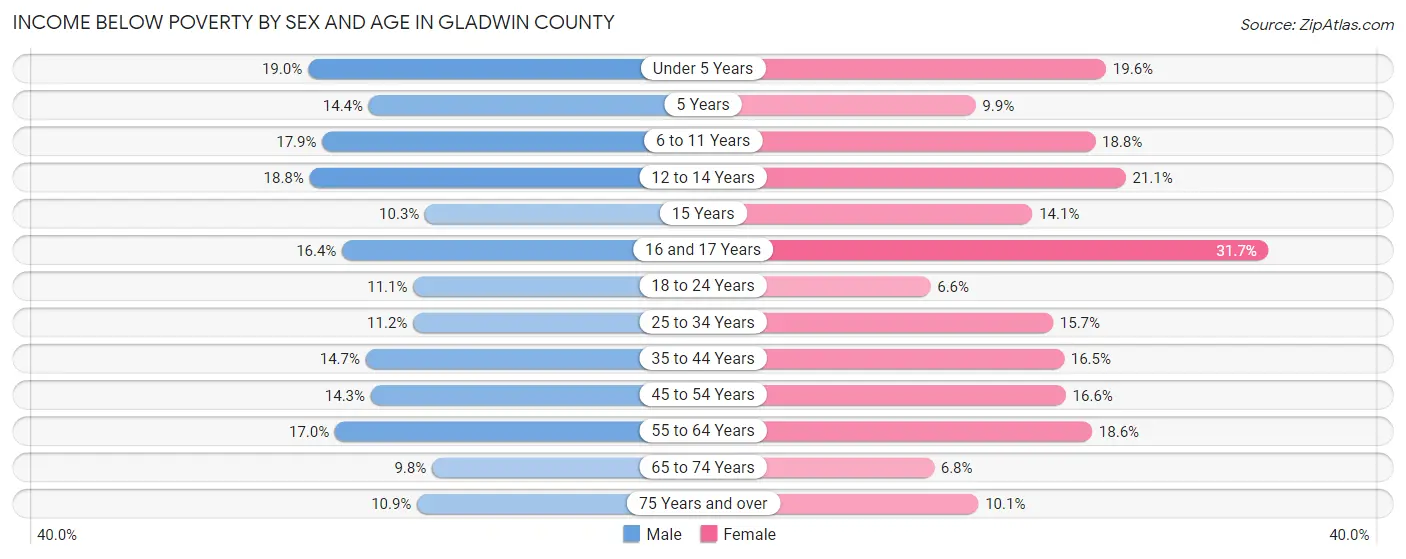
| Age Bracket | Male | Female |
| Under 5 Years | 127 (19.0%) | 121 (19.6%) |
| 5 Years | 27 (14.4%) | 12 (9.9%) |
| 6 to 11 Years | 131 (17.9%) | 138 (18.8%) |
| 12 to 14 Years | 81 (18.8%) | 63 (21.1%) |
| 15 Years | 12 (10.3%) | 14 (14.1%) |
| 16 and 17 Years | 55 (16.4%) | 103 (31.7%) |
| 18 to 24 Years | 95 (11.1%) | 55 (6.6%) |
| 25 to 34 Years | 126 (11.2%) | 176 (15.7%) |
| 35 to 44 Years | 180 (14.7%) | 191 (16.5%) |
| 45 to 54 Years | 218 (14.3%) | 250 (16.6%) |
| 55 to 64 Years | 372 (17.0%) | 409 (18.6%) |
| 65 to 74 Years | 196 (9.8%) | 139 (6.8%) |
| 75 Years and over | 136 (10.8%) | 147 (10.1%) |
| Total | 1,756 (13.9%) | 1,818 (14.5%) |
Income Above Poverty by Sex and Age in Gladwin County
According to the poverty statistics in Gladwin County, males aged 65 to 74 years and females aged 18 to 24 years are the age groups that are most secure financially, with 90.2% of males and 93.4% of females in these age groups living above the poverty line.
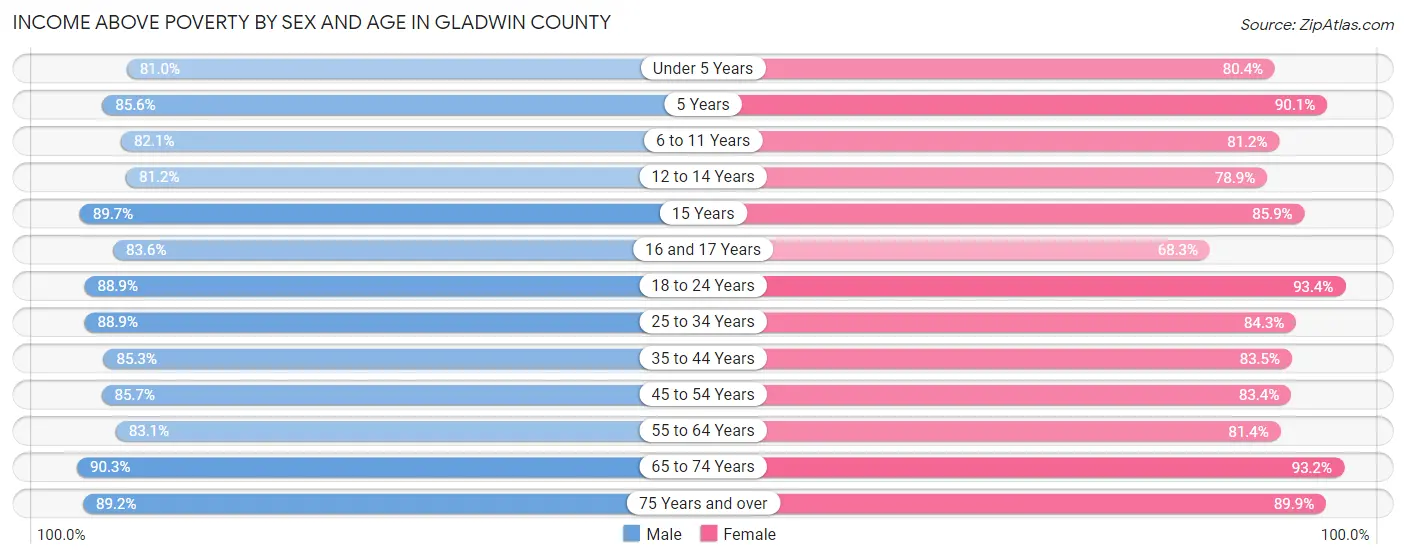
| Age Bracket | Male | Female |
| Under 5 Years | 543 (81.0%) | 496 (80.4%) |
| 5 Years | 160 (85.6%) | 109 (90.1%) |
| 6 to 11 Years | 601 (82.1%) | 596 (81.2%) |
| 12 to 14 Years | 349 (81.2%) | 236 (78.9%) |
| 15 Years | 105 (89.7%) | 85 (85.9%) |
| 16 and 17 Years | 280 (83.6%) | 222 (68.3%) |
| 18 to 24 Years | 758 (88.9%) | 782 (93.4%) |
| 25 to 34 Years | 1,004 (88.8%) | 947 (84.3%) |
| 35 to 44 Years | 1,047 (85.3%) | 968 (83.5%) |
| 45 to 54 Years | 1,308 (85.7%) | 1,254 (83.4%) |
| 55 to 64 Years | 1,823 (83.1%) | 1,793 (81.4%) |
| 65 to 74 Years | 1,814 (90.2%) | 1,897 (93.2%) |
| 75 Years and over | 1,118 (89.1%) | 1,304 (89.9%) |
| Total | 10,910 (86.1%) | 10,689 (85.5%) |
Income Below Poverty Among Married-Couple Families in Gladwin County
The poverty statistics for married-couple families in Gladwin County show that 6.1% or 353 of the total 5,816 families live below the poverty line. Families with 5 or more children have the highest poverty rate of 19.8%, comprising of 20 families. On the other hand, families with no children have the lowest poverty rate of 5.1%, which includes 211 families.
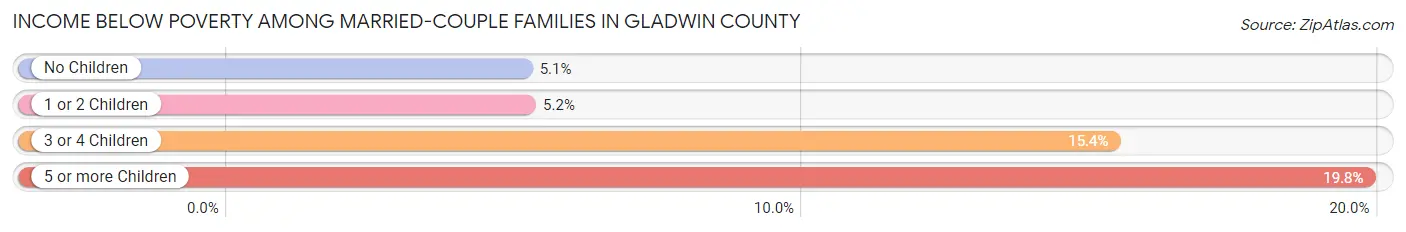
| Children | Above Poverty | Below Poverty |
| No Children | 3,905 (94.9%) | 211 (5.1%) |
| 1 or 2 Children | 1,152 (94.8%) | 63 (5.2%) |
| 3 or 4 Children | 325 (84.6%) | 59 (15.4%) |
| 5 or more Children | 81 (80.2%) | 20 (19.8%) |
| Total | 5,463 (93.9%) | 353 (6.1%) |
Income Below Poverty Among Single-Parent Households in Gladwin County
According to the poverty data in Gladwin County, 14.9% or 68 single-father households and 27.8% or 202 single-mother households are living below the poverty line. Among single-father households, those with 5 or more children have the highest poverty rate, with 5 households (33.3%) experiencing poverty. Likewise, among single-mother households, those with 5 or more children have the highest poverty rate, with 23 households (88.5%) falling below the poverty line.
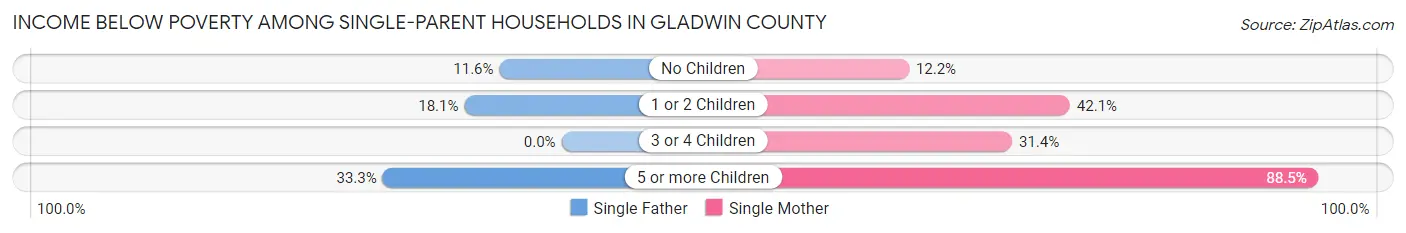
| Children | Single Father | Single Mother |
| No Children | 25 (11.6%) | 45 (12.2%) |
| 1 or 2 Children | 38 (18.1%) | 118 (42.1%) |
| 3 or 4 Children | 0 (0.0%) | 16 (31.4%) |
| 5 or more Children | 5 (33.3%) | 23 (88.5%) |
| Total | 68 (14.9%) | 202 (27.8%) |
Income Below Poverty Among Married-Couple vs Single-Parent Households in Gladwin County
The poverty data for Gladwin County shows that 353 of the married-couple family households (6.1%) and 270 of the single-parent households (22.8%) are living below the poverty level. Within the married-couple family households, those with 5 or more children have the highest poverty rate, with 20 households (19.8%) falling below the poverty line. Among the single-parent households, those with 5 or more children have the highest poverty rate, with 28 household (68.3%) living below poverty.
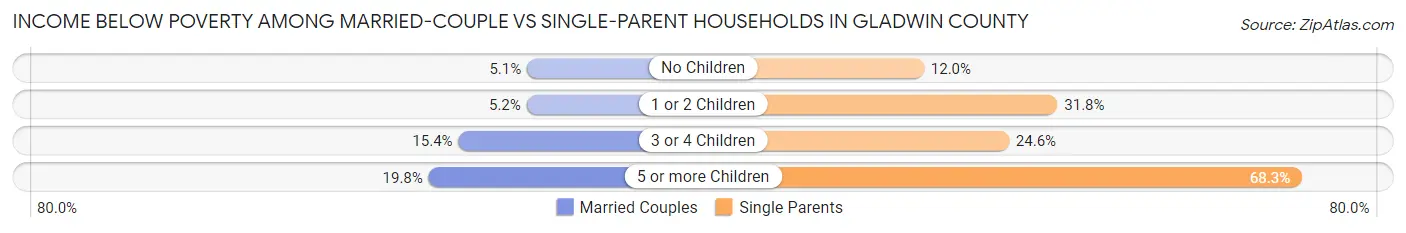
| Children | Married-Couple Families | Single-Parent Households |
| No Children | 211 (5.1%) | 70 (11.9%) |
| 1 or 2 Children | 63 (5.2%) | 156 (31.8%) |
| 3 or 4 Children | 59 (15.4%) | 16 (24.6%) |
| 5 or more Children | 20 (19.8%) | 28 (68.3%) |
| Total | 353 (6.1%) | 270 (22.8%) |
Race in Gladwin County
The most populous races in Gladwin County are White / Caucasian (24,297 | 95.4%), Two or more Races (758 | 3.0%), and Hispanic or Latino (518 | 2.0%).
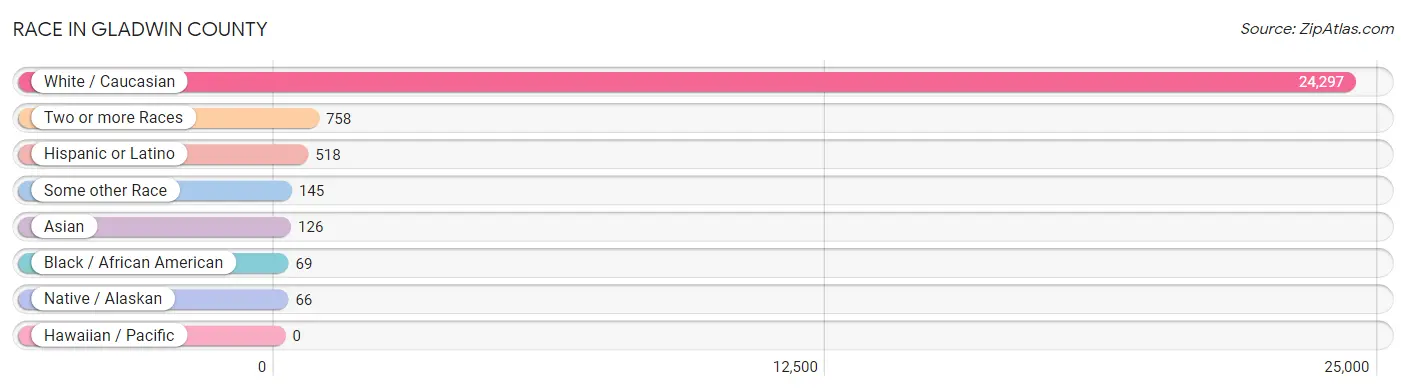
| Race | # Population | % Population |
| Asian | 126 | 0.5% |
| Black / African American | 69 | 0.3% |
| Hawaiian / Pacific | 0 | 0.0% |
| Hispanic or Latino | 518 | 2.0% |
| Native / Alaskan | 66 | 0.3% |
| White / Caucasian | 24,297 | 95.4% |
| Two or more Races | 758 | 3.0% |
| Some other Race | 145 | 0.6% |
| Total | 25,461 | 100.0% |
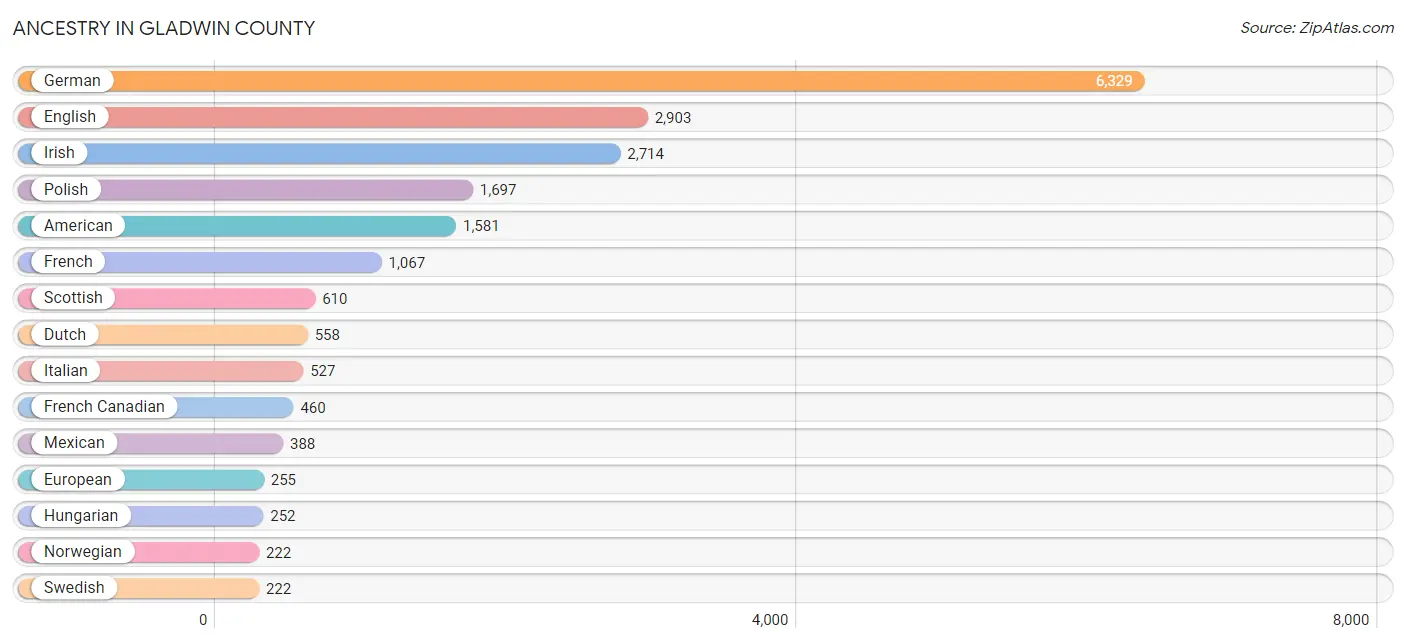
Ancestry in Gladwin County
The most populous ancestries reported in Gladwin County are German (6,329 | 24.9%), English (2,903 | 11.4%), Irish (2,714 | 10.7%), Polish (1,697 | 6.7%), and American (1,581 | 6.2%), together accounting for 59.8% of all Gladwin County residents.
| Ancestry | # Population | % Population |
| African | 9 | 0.0% |
| Albanian | 15 | 0.1% |
| American | 1,581 | 6.2% |
| Apache | 6 | 0.0% |
| Arab | 28 | 0.1% |
| Armenian | 19 | 0.1% |
| Australian | 6 | 0.0% |
| Austrian | 27 | 0.1% |
| Belgian | 69 | 0.3% |
| Bhutanese | 7 | 0.0% |
| Blackfeet | 39 | 0.2% |
| British | 80 | 0.3% |
| Burmese | 8 | 0.0% |
| Canadian | 95 | 0.4% |
| Central American | 39 | 0.2% |
| Cherokee | 39 | 0.2% |
| Cheyenne | 18 | 0.1% |
| Chickasaw | 16 | 0.1% |
| Chippewa | 104 | 0.4% |
| Croatian | 35 | 0.1% |
| Cuban | 1 | 0.0% |
| Czech | 93 | 0.4% |
| Czechoslovakian | 50 | 0.2% |
| Danish | 39 | 0.2% |
| Dutch | 558 | 2.2% |
| Eastern European | 120 | 0.5% |
| English | 2,903 | 11.4% |
| European | 255 | 1.0% |
| Finnish | 180 | 0.7% |
| French | 1,067 | 4.2% |
| French Canadian | 460 | 1.8% |
| German | 6,329 | 24.9% |
| Greek | 12 | 0.1% |
| Guamanian / Chamorro | 8 | 0.0% |
| Guatemalan | 3 | 0.0% |
| Honduran | 36 | 0.1% |
| Hungarian | 252 | 1.0% |
| Indian (Asian) | 24 | 0.1% |
| Irish | 2,714 | 10.7% |
| Iroquois | 1 | 0.0% |
| Italian | 527 | 2.1% |
| Korean | 60 | 0.2% |
| Lebanese | 28 | 0.1% |
| Lithuanian | 55 | 0.2% |
| Maltese | 6 | 0.0% |
| Mexican | 388 | 1.5% |
| Navajo | 5 | 0.0% |
| Northern European | 15 | 0.1% |
| Norwegian | 222 | 0.9% |
| Ottawa | 3 | 0.0% |
| Pakistani | 3 | 0.0% |
| Pennsylvania German | 13 | 0.1% |
| Polish | 1,697 | 6.7% |
| Romanian | 32 | 0.1% |
| Russian | 96 | 0.4% |
| Scandinavian | 37 | 0.2% |
| Scotch-Irish | 164 | 0.6% |
| Scottish | 610 | 2.4% |
| Serbian | 7 | 0.0% |
| Sioux | 2 | 0.0% |
| Slavic | 2 | 0.0% |
| Slovak | 29 | 0.1% |
| Slovene | 7 | 0.0% |
| Spanish | 4 | 0.0% |
| Subsaharan African | 9 | 0.0% |
| Swedish | 222 | 0.9% |
| Swiss | 55 | 0.2% |
| Thai | 69 | 0.3% |
| Ukrainian | 60 | 0.2% |
| Welsh | 108 | 0.4% |
| Yugoslavian | 3 | 0.0% | View All 71 Rows |
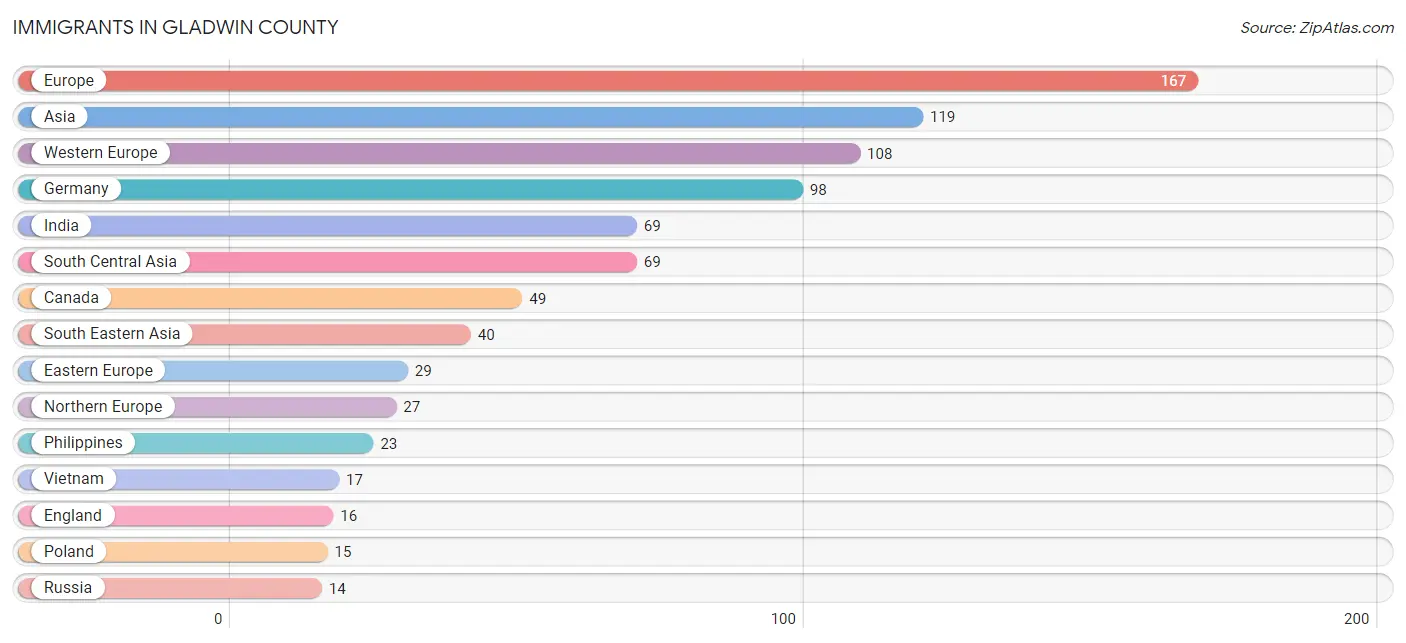
Immigrants in Gladwin County
The most numerous immigrant groups reported in Gladwin County came from Europe (167 | 0.7%), Asia (119 | 0.5%), Western Europe (108 | 0.4%), Germany (98 | 0.4%), and India (69 | 0.3%), together accounting for 2.2% of all Gladwin County residents.
| Immigration Origin | # Population | % Population |
| Asia | 119 | 0.5% |
| Australia | 3 | 0.0% |
| Canada | 49 | 0.2% |
| Central America | 6 | 0.0% |
| China | 3 | 0.0% |
| Eastern Asia | 10 | 0.0% |
| Eastern Europe | 29 | 0.1% |
| England | 16 | 0.1% |
| Europe | 167 | 0.7% |
| Germany | 98 | 0.4% |
| Honduras | 1 | 0.0% |
| India | 69 | 0.3% |
| Ireland | 6 | 0.0% |
| Italy | 3 | 0.0% |
| Korea | 7 | 0.0% |
| Latin America | 6 | 0.0% |
| Mexico | 5 | 0.0% |
| Netherlands | 10 | 0.0% |
| Northern Europe | 27 | 0.1% |
| Oceania | 3 | 0.0% |
| Philippines | 23 | 0.1% |
| Poland | 15 | 0.1% |
| Russia | 14 | 0.1% |
| South Central Asia | 69 | 0.3% |
| South Eastern Asia | 40 | 0.2% |
| Southern Europe | 3 | 0.0% |
| Vietnam | 17 | 0.1% |
| Western Europe | 108 | 0.4% | View All 28 Rows |
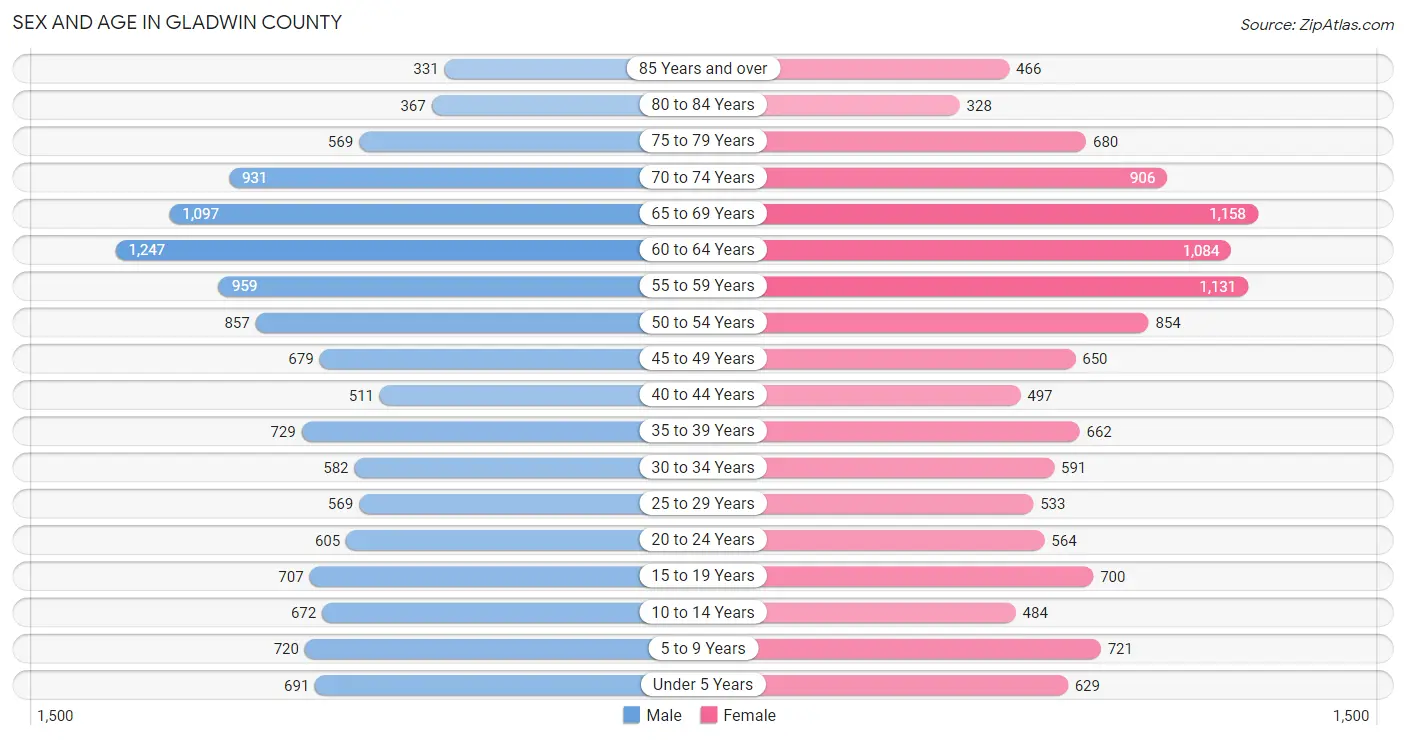
Sex and Age in Gladwin County
Sex and Age in Gladwin County
The most populous age groups in Gladwin County are 60 to 64 Years (1,247 | 9.7%) for men and 65 to 69 Years (1,158 | 9.2%) for women.
| Age Bracket | Male | Female |
| Under 5 Years | 691 (5.4%) | 629 (5.0%) |
| 5 to 9 Years | 720 (5.6%) | 721 (5.7%) |
| 10 to 14 Years | 672 (5.2%) | 484 (3.8%) |
| 15 to 19 Years | 707 (5.5%) | 700 (5.5%) |
| 20 to 24 Years | 605 (4.7%) | 564 (4.5%) |
| 25 to 29 Years | 569 (4.4%) | 533 (4.2%) |
| 30 to 34 Years | 582 (4.5%) | 591 (4.7%) |
| 35 to 39 Years | 729 (5.7%) | 662 (5.2%) |
| 40 to 44 Years | 511 (4.0%) | 497 (3.9%) |
| 45 to 49 Years | 679 (5.3%) | 650 (5.1%) |
| 50 to 54 Years | 857 (6.7%) | 854 (6.8%) |
| 55 to 59 Years | 959 (7.5%) | 1,131 (8.9%) |
| 60 to 64 Years | 1,247 (9.7%) | 1,084 (8.6%) |
| 65 to 69 Years | 1,097 (8.6%) | 1,158 (9.2%) |
| 70 to 74 Years | 931 (7.3%) | 906 (7.2%) |
| 75 to 79 Years | 569 (4.4%) | 680 (5.4%) |
| 80 to 84 Years | 367 (2.9%) | 328 (2.6%) |
| 85 Years and over | 331 (2.6%) | 466 (3.7%) |
| Total | 12,823 (100.0%) | 12,638 (100.0%) |
Families and Households in Gladwin County
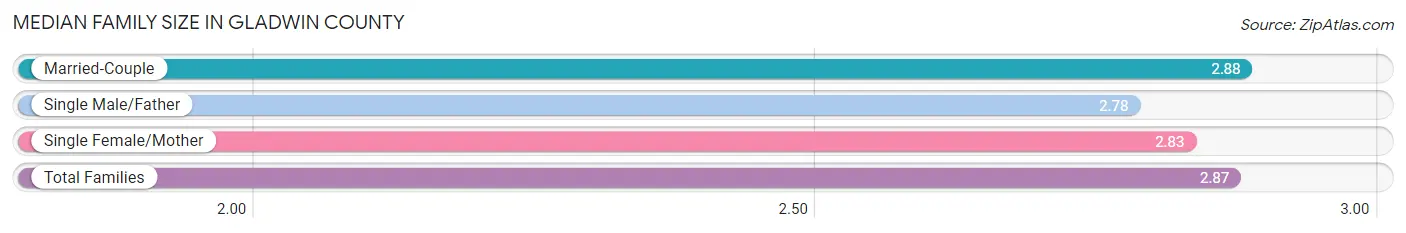
Median Family Size in Gladwin County
The median family size in Gladwin County is 2.87 persons per family, with married-couple families (5,816 | 83.1%) accounting for the largest median family size of 2.88 persons per family. On the other hand, single male/father families (455 | 6.5%) represent the smallest median family size with 2.78 persons per family.
| Family Type | # Families | Family Size |
| Married-Couple | 5,816 (83.1%) | 2.88 |
| Single Male/Father | 455 (6.5%) | 2.78 |
| Single Female/Mother | 727 (10.4%) | 2.83 |
| Total Families | 6,998 (100.0%) | 2.87 |
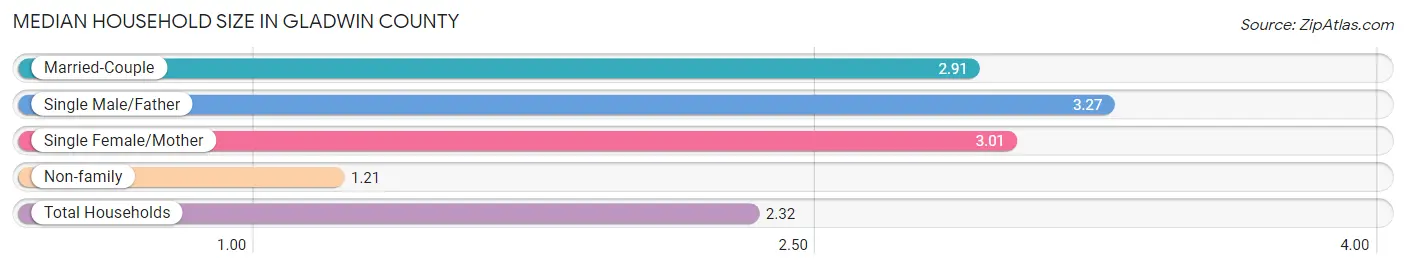
Median Household Size in Gladwin County
The median household size in Gladwin County is 2.32 persons per household, with single male/father households (455 | 4.2%) accounting for the largest median household size of 3.27 persons per household. non-family households (3,861 | 35.6%) represent the smallest median household size with 1.21 persons per household.
| Household Type | # Households | Household Size |
| Married-Couple | 5,816 (53.6%) | 2.91 |
| Single Male/Father | 455 (4.2%) | 3.27 |
| Single Female/Mother | 727 (6.7%) | 3.01 |
| Non-family | 3,861 (35.6%) | 1.21 |
| Total Households | 10,859 (100.0%) | 2.32 |
Household Size by Marriage Status in Gladwin County
Out of a total of 10,859 households in Gladwin County, 6,998 (64.4%) are family households, while 3,861 (35.6%) are nonfamily households. The most numerous type of family households are 2-person households, comprising 4,062, and the most common type of nonfamily households are 1-person households, comprising 3,189.
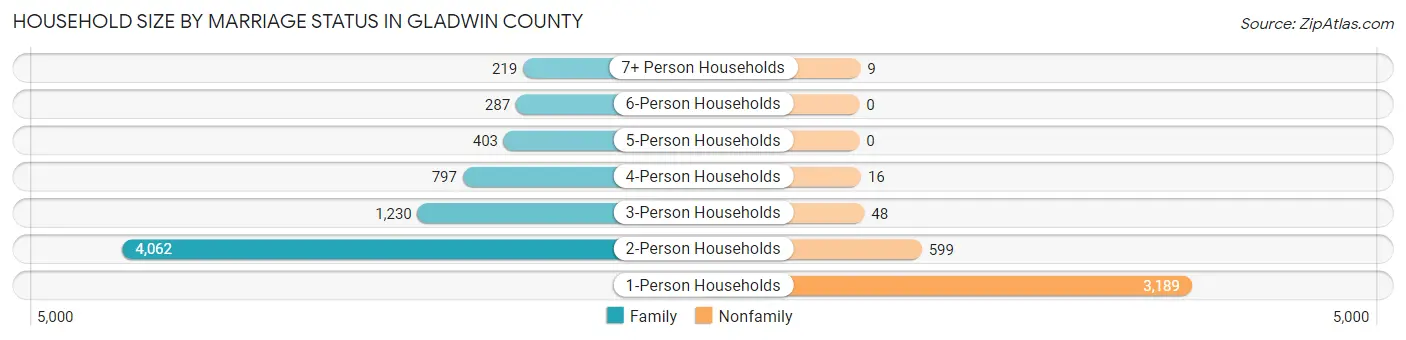
| Household Size | Family Households | Nonfamily Households |
| 1-Person Households | - | 3,189 (29.4%) |
| 2-Person Households | 4,062 (37.4%) | 599 (5.5%) |
| 3-Person Households | 1,230 (11.3%) | 48 (0.4%) |
| 4-Person Households | 797 (7.3%) | 16 (0.2%) |
| 5-Person Households | 403 (3.7%) | 0 (0.0%) |
| 6-Person Households | 287 (2.6%) | 0 (0.0%) |
| 7+ Person Households | 219 (2.0%) | 9 (0.1%) |
| Total | 6,998 (64.4%) | 3,861 (35.6%) |
Female Fertility in Gladwin County
Fertility by Age in Gladwin County
Average fertility rate in Gladwin County is 55.0 births per 1,000 women. Women in the age bracket of 20 to 34 years have the highest fertility rate with 100.0 births per 1,000 women. Women in the age bracket of 20 to 34 years acount for 70.3% of all women with births.
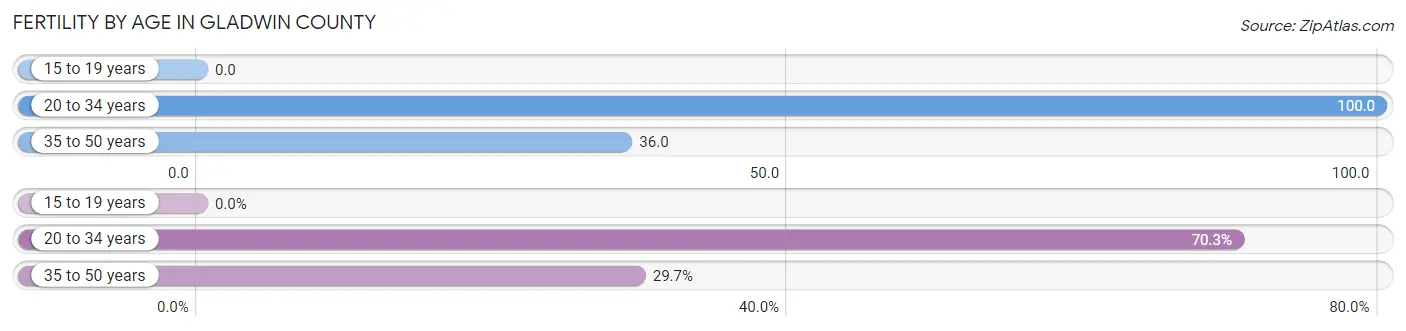
| Age Bracket | Women with Births | Births / 1,000 Women |
| 15 to 19 years | 0 (0.0%) | 0.0 |
| 20 to 34 years | 168 (70.3%) | 100.0 |
| 35 to 50 years | 71 (29.7%) | 36.0 |
| Total | 239 (100.0%) | 55.0 |
Fertility by Age by Marriage Status in Gladwin County
64.4% of women with births (239) in Gladwin County are married. The highest percentage of unmarried women with births falls into 35 to 50 years age bracket with 62.0% of them unmarried at the time of birth, while the lowest percentage of unmarried women with births belong to 20 to 34 years age bracket with 24.4% of them unmarried.
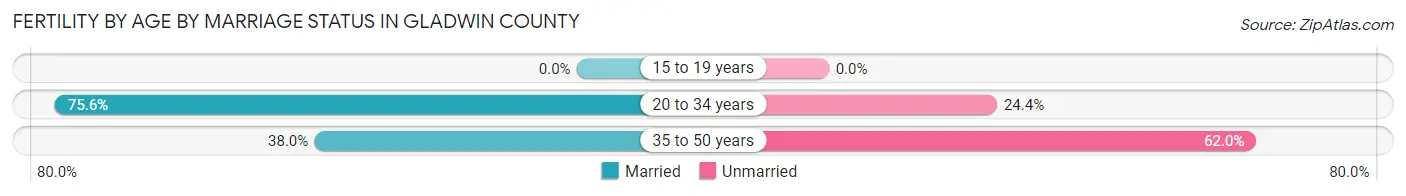
| Age Bracket | Married | Unmarried |
| 15 to 19 years | 0 (0.0%) | 0 (0.0%) |
| 20 to 34 years | 127 (75.6%) | 41 (24.4%) |
| 35 to 50 years | 27 (38.0%) | 44 (62.0%) |
| Total | 154 (64.4%) | 85 (35.6%) |
Fertility by Education in Gladwin County
Average fertility rate in Gladwin County is 55.0 births per 1,000 women. Women with the education attainment of college or associate's degree have the highest fertility rate of 76.0 births per 1,000 women, while women with the education attainment of graduate degree have the lowest fertility at 11.0 births per 1,000 women. Women with the education attainment of college or associate's degree represent 52.3% of all women with births.
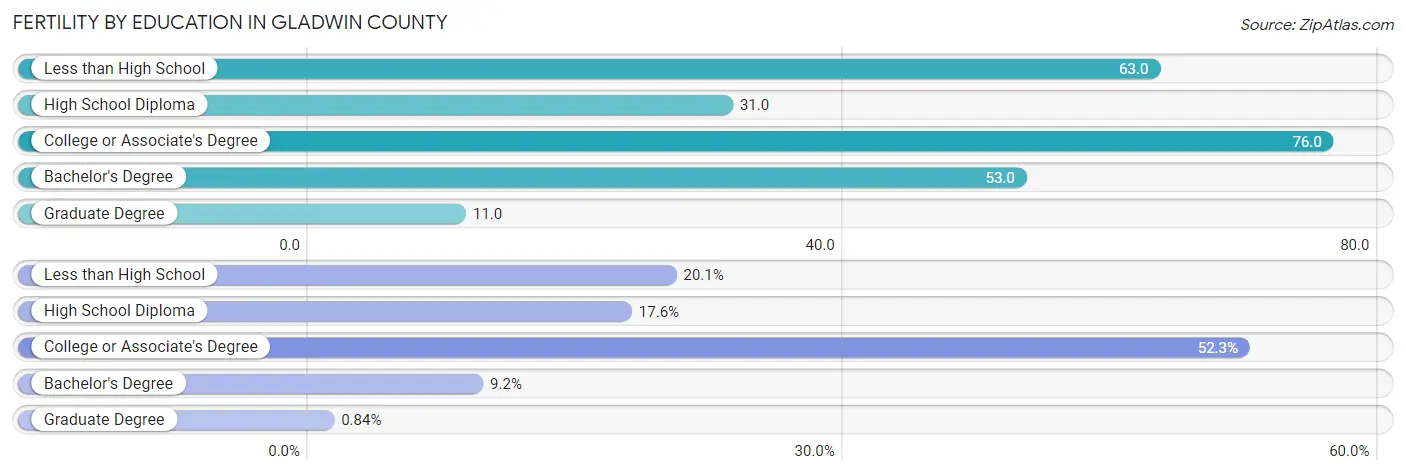
| Educational Attainment | Women with Births | Births / 1,000 Women |
| Less than High School | 48 (20.1%) | 63.0 |
| High School Diploma | 42 (17.6%) | 31.0 |
| College or Associate's Degree | 125 (52.3%) | 76.0 |
| Bachelor's Degree | 22 (9.2%) | 53.0 |
| Graduate Degree | 2 (0.8%) | 11.0 |
| Total | 239 (100.0%) | 55.0 |
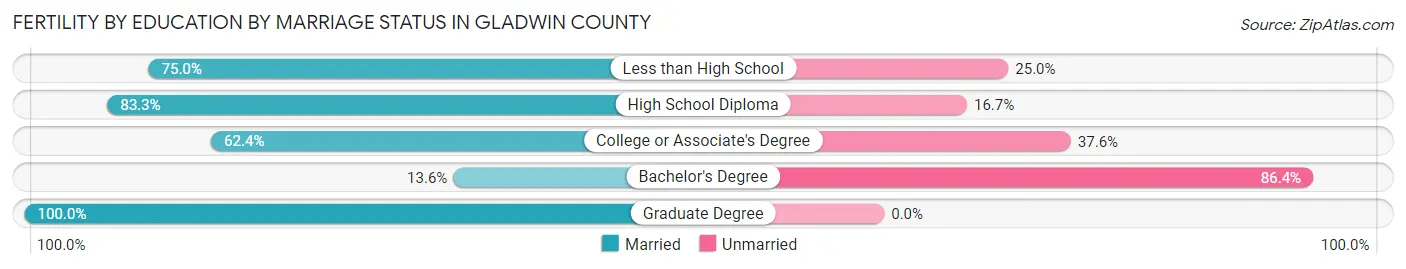
Fertility by Education by Marriage Status in Gladwin County
35.6% of women with births in Gladwin County are unmarried. Women with the educational attainment of graduate degree are most likely to be married with 100.0% of them married at childbirth, while women with the educational attainment of bachelor's degree are least likely to be married with 86.4% of them unmarried at childbirth.
| Educational Attainment | Married | Unmarried |
| Less than High School | 36 (75.0%) | 12 (25.0%) |
| High School Diploma | 35 (83.3%) | 7 (16.7%) |
| College or Associate's Degree | 78 (62.4%) | 47 (37.6%) |
| Bachelor's Degree | 3 (13.6%) | 19 (86.4%) |
| Graduate Degree | 2 (100.0%) | 0 (0.0%) |
| Total | 154 (64.4%) | 85 (35.6%) |
Employment Characteristics in Gladwin County
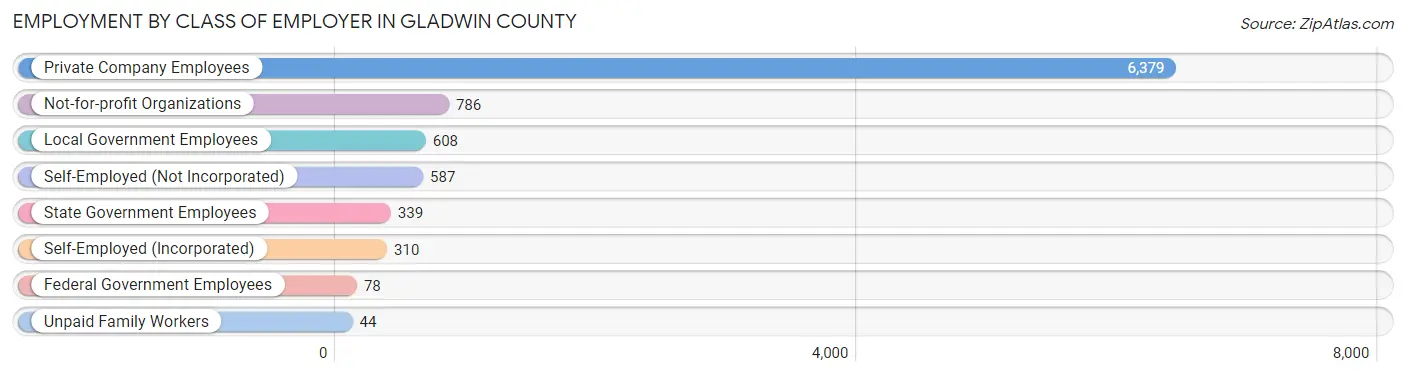
Employment by Class of Employer in Gladwin County
Among the 9,131 employed individuals in Gladwin County, private company employees (6,379 | 69.9%), not-for-profit organizations (786 | 8.6%), and local government employees (608 | 6.7%) make up the most common classes of employment.
| Employer Class | # Employees | % Employees |
| Private Company Employees | 6,379 | 69.9% |
| Self-Employed (Incorporated) | 310 | 3.4% |
| Self-Employed (Not Incorporated) | 587 | 6.4% |
| Not-for-profit Organizations | 786 | 8.6% |
| Local Government Employees | 608 | 6.7% |
| State Government Employees | 339 | 3.7% |
| Federal Government Employees | 78 | 0.9% |
| Unpaid Family Workers | 44 | 0.5% |
| Total | 9,131 | 100.0% |
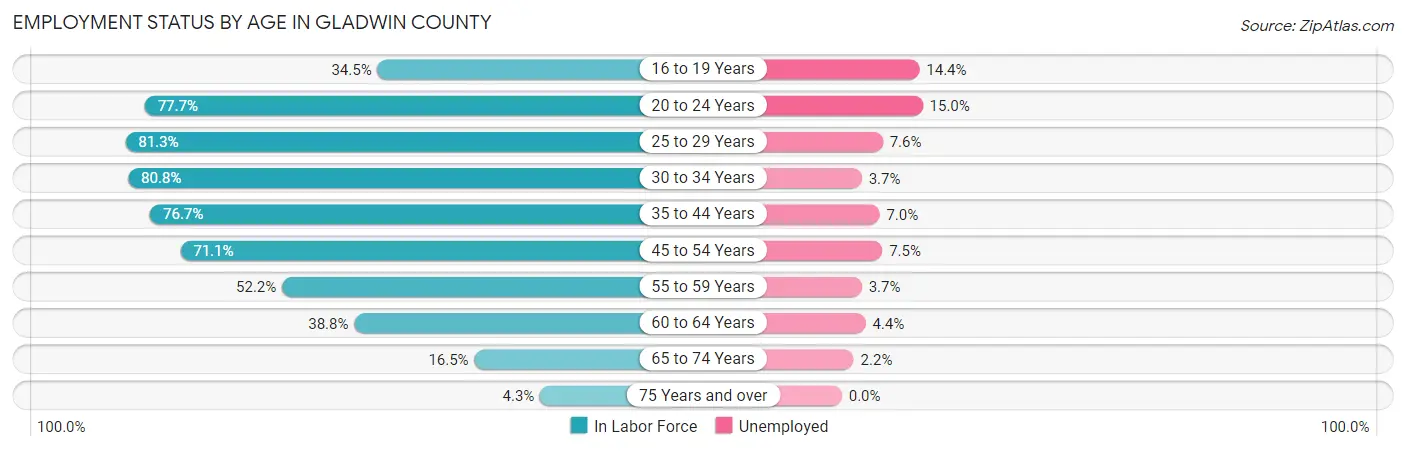
Employment Status by Age in Gladwin County
According to the labor force statistics for Gladwin County, out of the total population over 16 years of age (21,328), 46.7% or 9,960 individuals are in the labor force, with 6.9% or 687 of them unemployed. The age group with the highest labor force participation rate is 25 to 29 years, with 81.3% or 896 individuals in the labor force. Within the labor force, the 20 to 24 years age range has the highest percentage of unemployed individuals, with 15.0% or 136 of them being unemployed.
| Age Bracket | In Labor Force | Unemployed |
| 16 to 19 Years | 411 (34.5%) | 59 (14.4%) |
| 20 to 24 Years | 908 (77.7%) | 136 (15.0%) |
| 25 to 29 Years | 896 (81.3%) | 68 (7.6%) |
| 30 to 34 Years | 948 (80.8%) | 35 (3.7%) |
| 35 to 44 Years | 1,840 (76.7%) | 129 (7.0%) |
| 45 to 54 Years | 2,161 (71.1%) | 162 (7.5%) |
| 55 to 59 Years | 1,091 (52.2%) | 40 (3.7%) |
| 60 to 64 Years | 904 (38.8%) | 40 (4.4%) |
| 65 to 74 Years | 675 (16.5%) | 15 (2.2%) |
| 75 Years and over | 118 (4.3%) | 0 (0.0%) |
| Total | 9,960 (46.7%) | 687 (6.9%) |
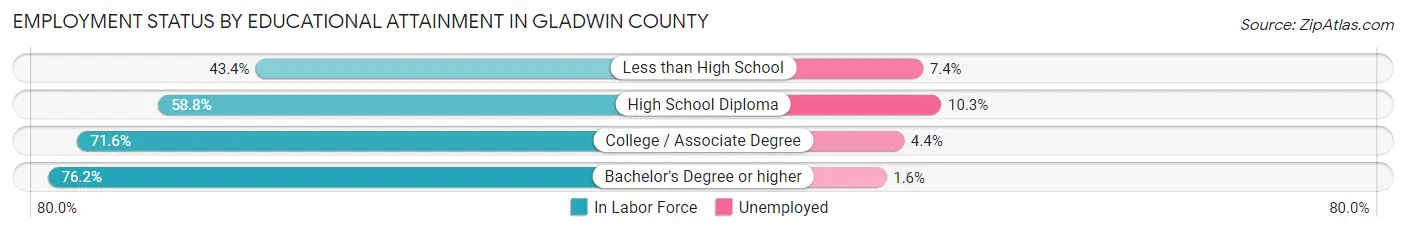
Employment Status by Educational Attainment in Gladwin County
According to labor force statistics for Gladwin County, 64.6% of individuals (7,839) out of the total population between 25 and 64 years of age (12,135) are in the labor force, with 6.1% or 478 of them being unemployed. The group with the highest labor force participation rate are those with the educational attainment of bachelor's degree or higher, with 76.2% or 1,378 individuals in the labor force. Within the labor force, individuals with high school diploma education have the highest percentage of unemployment, with 10.3% or 266 of them being unemployed.
| Educational Attainment | In Labor Force | Unemployed |
| Less than High School | 566 (43.4%) | 96 (7.4%) |
| High School Diploma | 2,581 (58.8%) | 452 (10.3%) |
| College / Associate Degree | 3,317 (71.6%) | 204 (4.4%) |
| Bachelor's Degree or higher | 1,378 (76.2%) | 29 (1.6%) |
| Total | 7,839 (64.6%) | 740 (6.1%) |
Employment Occupations by Sex in Gladwin County
Management, Business, Science and Arts Occupations
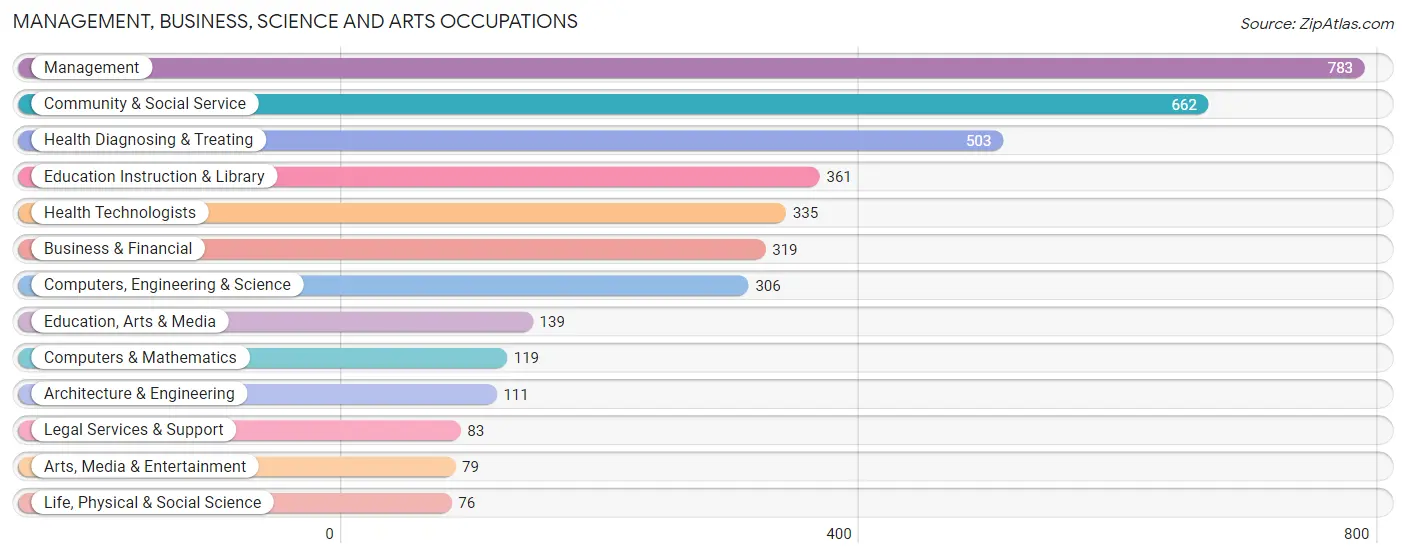
The most common Management, Business, Science and Arts occupations in Gladwin County are Management (783 | 8.5%), Community & Social Service (662 | 7.1%), Health Diagnosing & Treating (503 | 5.4%), Education Instruction & Library (361 | 3.9%), and Health Technologists (335 | 3.6%).
Management, Business, Science and Arts Occupations by Sex
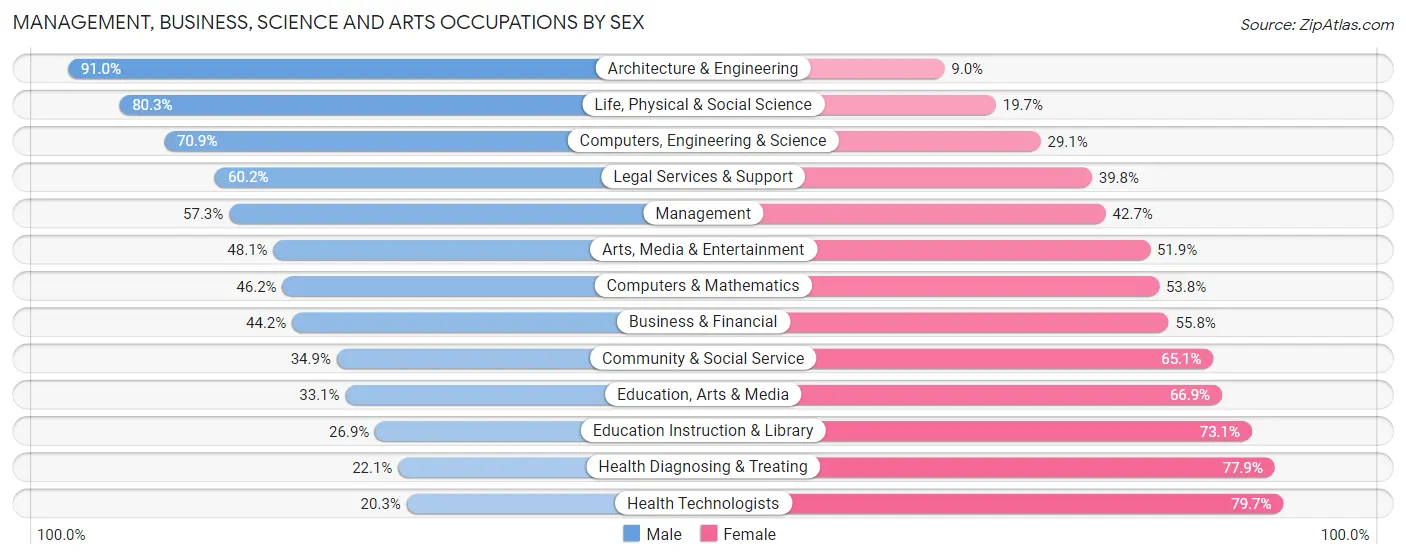
Within the Management, Business, Science and Arts occupations in Gladwin County, the most male-oriented occupations are Architecture & Engineering (91.0%), Life, Physical & Social Science (80.3%), and Computers, Engineering & Science (70.9%), while the most female-oriented occupations are Health Technologists (79.7%), Health Diagnosing & Treating (77.9%), and Education Instruction & Library (73.1%).
| Occupation | Male | Female |
| Management | 449 (57.3%) | 334 (42.7%) |
| Business & Financial | 141 (44.2%) | 178 (55.8%) |
| Computers, Engineering & Science | 217 (70.9%) | 89 (29.1%) |
| Computers & Mathematics | 55 (46.2%) | 64 (53.8%) |
| Architecture & Engineering | 101 (91.0%) | 10 (9.0%) |
| Life, Physical & Social Science | 61 (80.3%) | 15 (19.7%) |
| Community & Social Service | 231 (34.9%) | 431 (65.1%) |
| Education, Arts & Media | 46 (33.1%) | 93 (66.9%) |
| Legal Services & Support | 50 (60.2%) | 33 (39.8%) |
| Education Instruction & Library | 97 (26.9%) | 264 (73.1%) |
| Arts, Media & Entertainment | 38 (48.1%) | 41 (51.9%) |
| Health Diagnosing & Treating | 111 (22.1%) | 392 (77.9%) |
| Health Technologists | 68 (20.3%) | 267 (79.7%) |
| Total (Category) | 1,149 (44.7%) | 1,424 (55.3%) |
| Total (Overall) | 4,890 (52.8%) | 4,368 (47.2%) |
Services Occupations
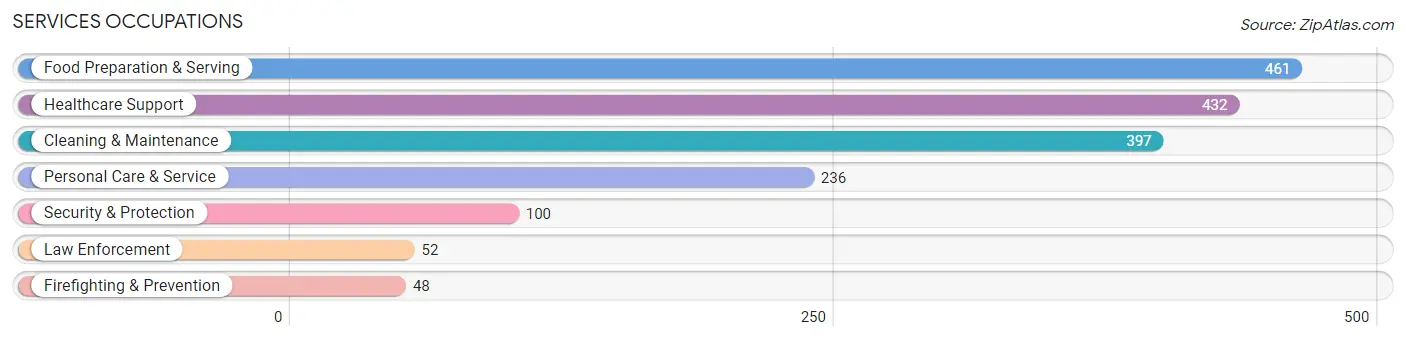
The most common Services occupations in Gladwin County are Food Preparation & Serving (461 | 5.0%), Healthcare Support (432 | 4.7%), Cleaning & Maintenance (397 | 4.3%), Personal Care & Service (236 | 2.5%), and Security & Protection (100 | 1.1%).
Services Occupations by Sex
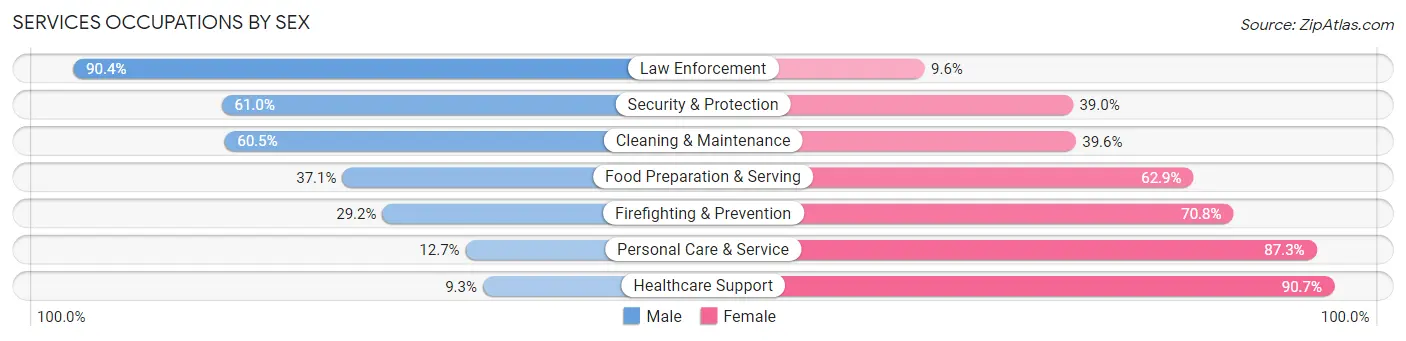
Within the Services occupations in Gladwin County, the most male-oriented occupations are Law Enforcement (90.4%), Security & Protection (61.0%), and Cleaning & Maintenance (60.5%), while the most female-oriented occupations are Healthcare Support (90.7%), Personal Care & Service (87.3%), and Firefighting & Prevention (70.8%).
| Occupation | Male | Female |
| Healthcare Support | 40 (9.3%) | 392 (90.7%) |
| Security & Protection | 61 (61.0%) | 39 (39.0%) |
| Firefighting & Prevention | 14 (29.2%) | 34 (70.8%) |
| Law Enforcement | 47 (90.4%) | 5 (9.6%) |
| Food Preparation & Serving | 171 (37.1%) | 290 (62.9%) |
| Cleaning & Maintenance | 240 (60.5%) | 157 (39.6%) |
| Personal Care & Service | 30 (12.7%) | 206 (87.3%) |
| Total (Category) | 542 (33.3%) | 1,084 (66.7%) |
| Total (Overall) | 4,890 (52.8%) | 4,368 (47.2%) |
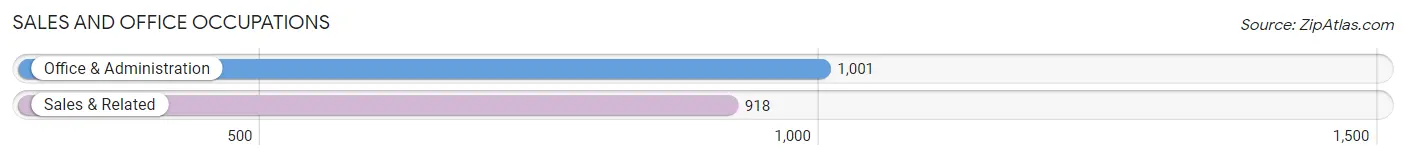
Sales and Office Occupations
The most common Sales and Office occupations in Gladwin County are Office & Administration (1,001 | 10.8%), and Sales & Related (918 | 9.9%).
Sales and Office Occupations by Sex
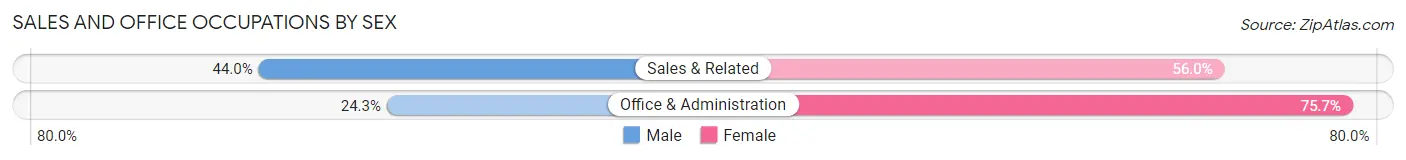
| Occupation | Male | Female |
| Sales & Related | 404 (44.0%) | 514 (56.0%) |
| Office & Administration | 243 (24.3%) | 758 (75.7%) |
| Total (Category) | 647 (33.7%) | 1,272 (66.3%) |
| Total (Overall) | 4,890 (52.8%) | 4,368 (47.2%) |
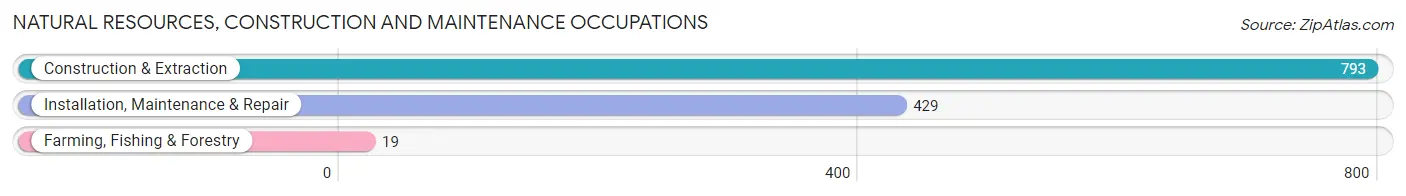
Natural Resources, Construction and Maintenance Occupations
The most common Natural Resources, Construction and Maintenance occupations in Gladwin County are Construction & Extraction (793 | 8.6%), Installation, Maintenance & Repair (429 | 4.6%), and Farming, Fishing & Forestry (19 | 0.2%).
Natural Resources, Construction and Maintenance Occupations by Sex
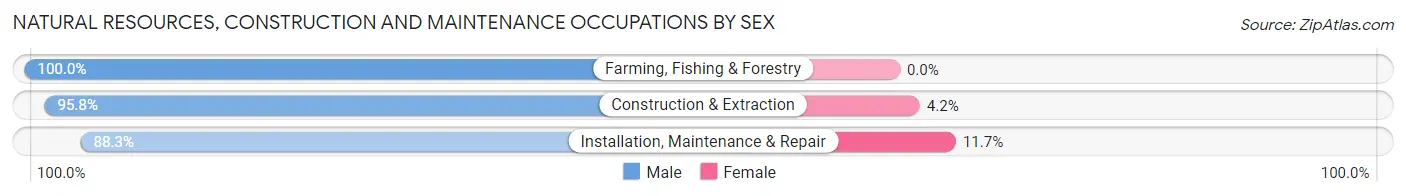
| Occupation | Male | Female |
| Farming, Fishing & Forestry | 19 (100.0%) | 0 (0.0%) |
| Construction & Extraction | 760 (95.8%) | 33 (4.2%) |
| Installation, Maintenance & Repair | 379 (88.3%) | 50 (11.7%) |
| Total (Category) | 1,158 (93.3%) | 83 (6.7%) |
| Total (Overall) | 4,890 (52.8%) | 4,368 (47.2%) |
Production, Transportation and Moving Occupations
The most common Production, Transportation and Moving occupations in Gladwin County are Production (1,040 | 11.2%), Transportation (440 | 4.8%), and Material Moving (419 | 4.5%).
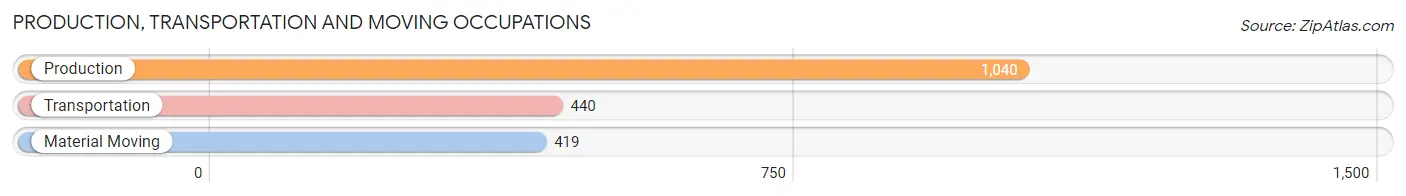
Production, Transportation and Moving Occupations by Sex
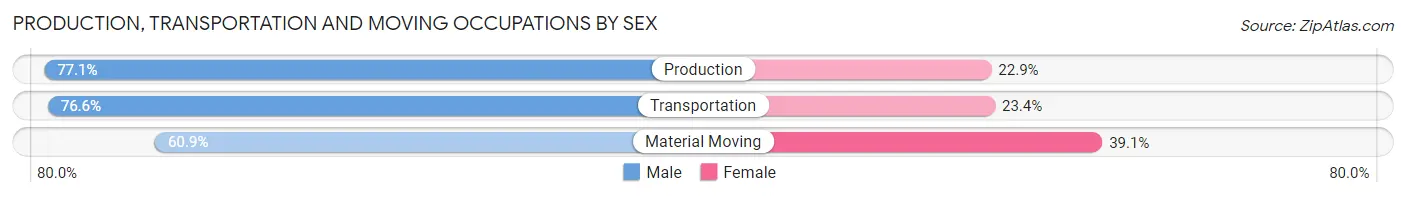
| Occupation | Male | Female |
| Production | 802 (77.1%) | 238 (22.9%) |
| Transportation | 337 (76.6%) | 103 (23.4%) |
| Material Moving | 255 (60.9%) | 164 (39.1%) |
| Total (Category) | 1,394 (73.4%) | 505 (26.6%) |
| Total (Overall) | 4,890 (52.8%) | 4,368 (47.2%) |
Employment Industries by Sex in Gladwin County
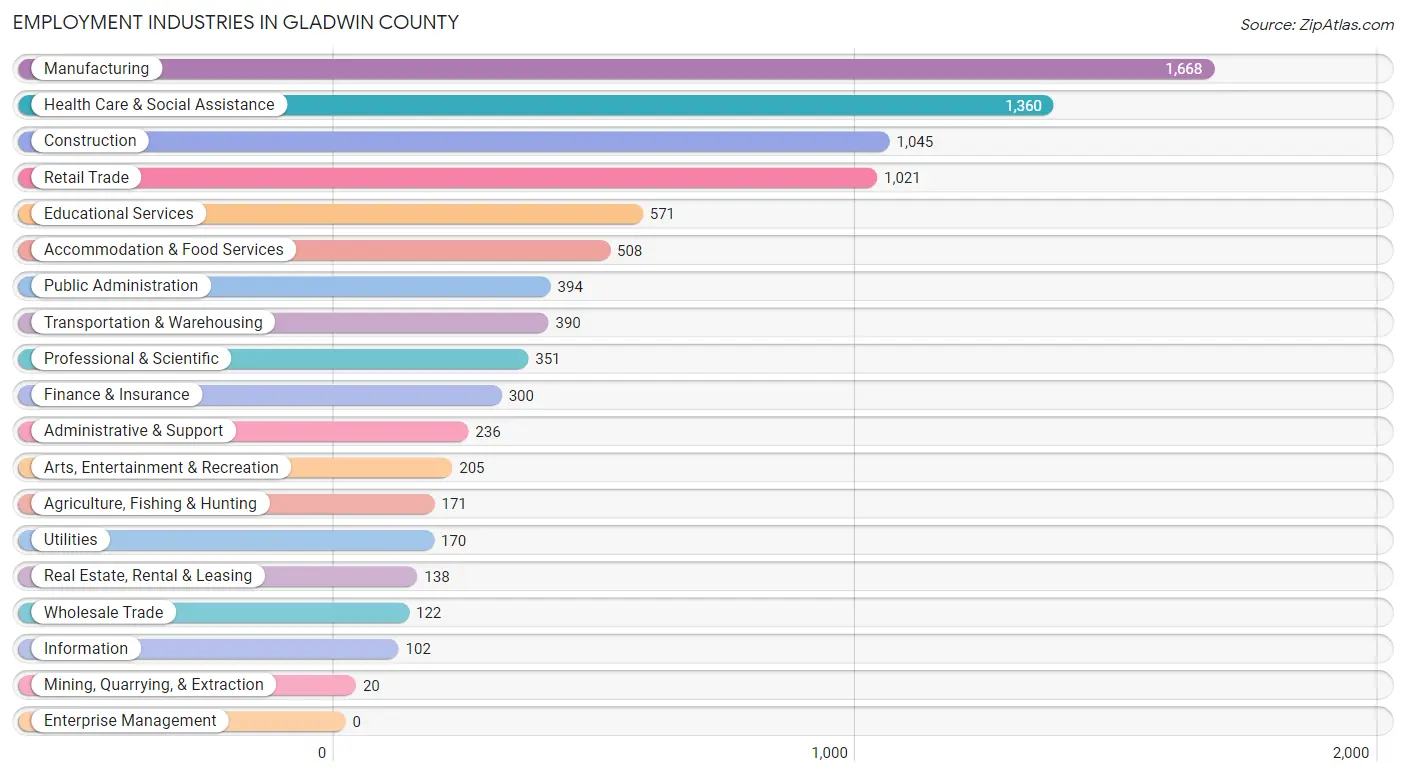
Employment Industries in Gladwin County
The major employment industries in Gladwin County include Manufacturing (1,668 | 18.0%), Health Care & Social Assistance (1,360 | 14.7%), Construction (1,045 | 11.3%), Retail Trade (1,021 | 11.0%), and Educational Services (571 | 6.2%).
Employment Industries by Sex in Gladwin County
The Gladwin County industries that see more men than women are Mining, Quarrying, & Extraction (100.0%), Utilities (96.5%), and Construction (92.1%), whereas the industries that tend to have a higher number of women are Health Care & Social Assistance (80.6%), Finance & Insurance (74.3%), and Accommodation & Food Services (64.0%).
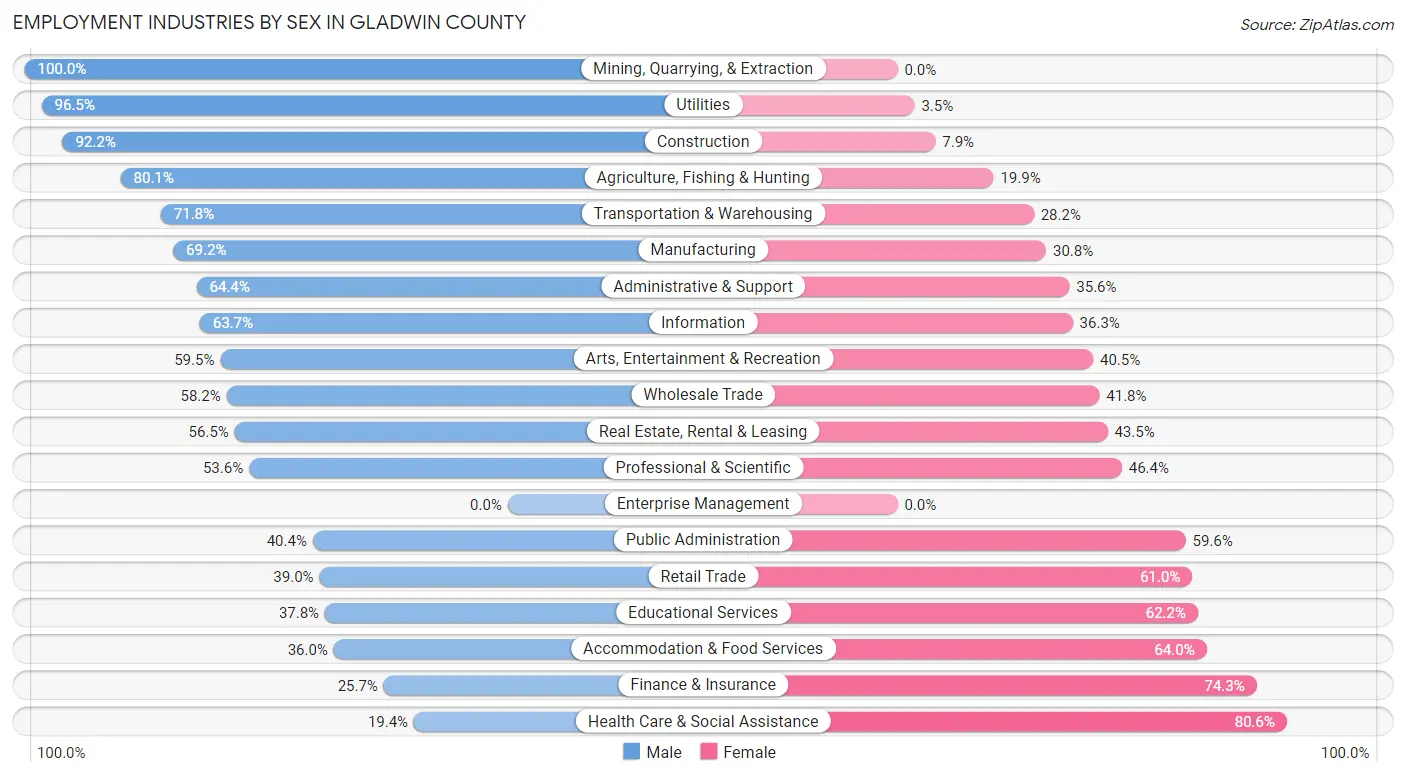
| Industry | Male | Female |
| Agriculture, Fishing & Hunting | 137 (80.1%) | 34 (19.9%) |
| Mining, Quarrying, & Extraction | 20 (100.0%) | 0 (0.0%) |
| Construction | 963 (92.1%) | 82 (7.9%) |
| Manufacturing | 1,155 (69.2%) | 513 (30.8%) |
| Wholesale Trade | 71 (58.2%) | 51 (41.8%) |
| Retail Trade | 398 (39.0%) | 623 (61.0%) |
| Transportation & Warehousing | 280 (71.8%) | 110 (28.2%) |
| Utilities | 164 (96.5%) | 6 (3.5%) |
| Information | 65 (63.7%) | 37 (36.3%) |
| Finance & Insurance | 77 (25.7%) | 223 (74.3%) |
| Real Estate, Rental & Leasing | 78 (56.5%) | 60 (43.5%) |
| Professional & Scientific | 188 (53.6%) | 163 (46.4%) |
| Enterprise Management | 0 (0.0%) | 0 (0.0%) |
| Administrative & Support | 152 (64.4%) | 84 (35.6%) |
| Educational Services | 216 (37.8%) | 355 (62.2%) |
| Health Care & Social Assistance | 264 (19.4%) | 1,096 (80.6%) |
| Arts, Entertainment & Recreation | 122 (59.5%) | 83 (40.5%) |
| Accommodation & Food Services | 183 (36.0%) | 325 (64.0%) |
| Public Administration | 159 (40.4%) | 235 (59.6%) |
| Total | 4,890 (52.8%) | 4,368 (47.2%) |
Education in Gladwin County
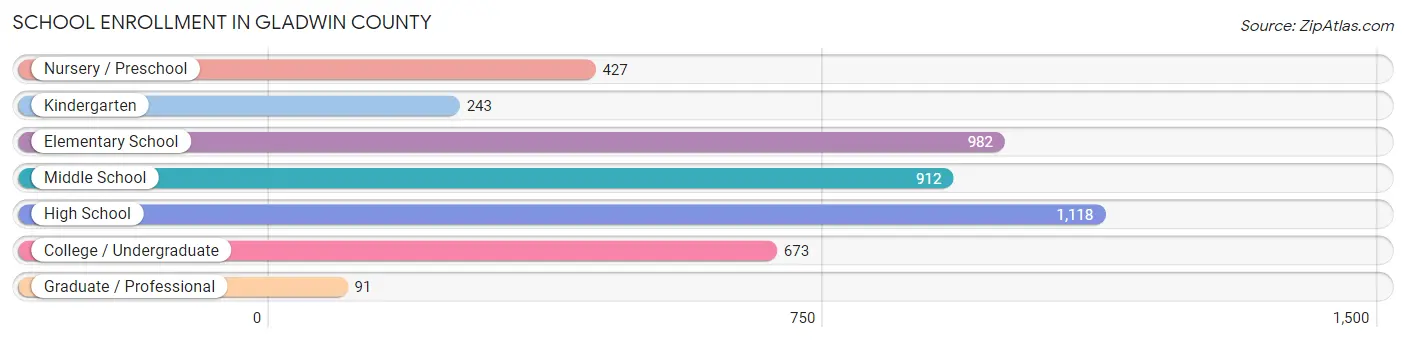
School Enrollment in Gladwin County
The most common levels of schooling among the 4,446 students in Gladwin County are high school (1,118 | 25.2%), elementary school (982 | 22.1%), and middle school (912 | 20.5%).
| School Level | # Students | % Students |
| Nursery / Preschool | 427 | 9.6% |
| Kindergarten | 243 | 5.5% |
| Elementary School | 982 | 22.1% |
| Middle School | 912 | 20.5% |
| High School | 1,118 | 25.2% |
| College / Undergraduate | 673 | 15.1% |
| Graduate / Professional | 91 | 2.1% |
| Total | 4,446 | 100.0% |
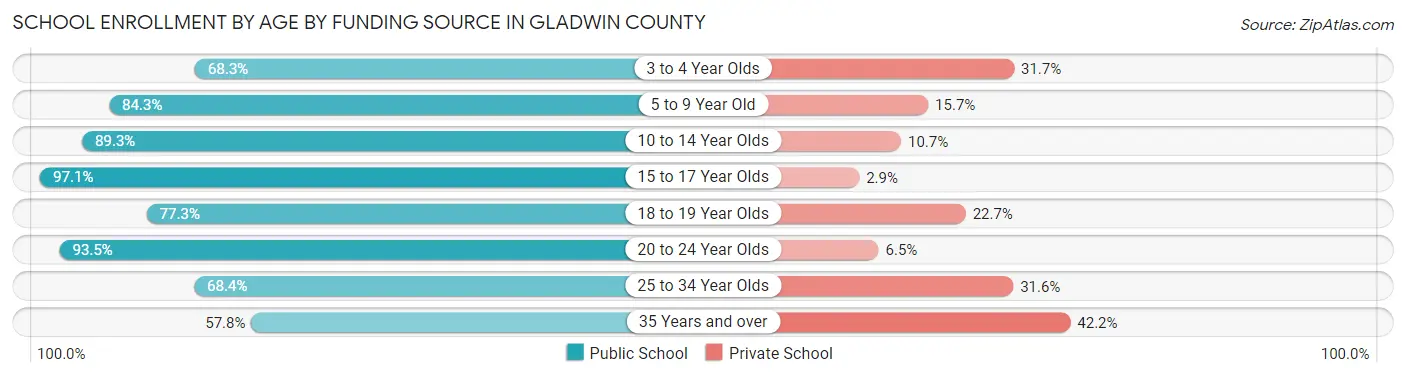
School Enrollment by Age by Funding Source in Gladwin County
Out of a total of 4,446 students who are enrolled in schools in Gladwin County, 631 (14.2%) attend a private institution, while the remaining 3,815 (85.8%) are enrolled in public schools. The age group of 35 years and over has the highest likelihood of being enrolled in private schools, with 76 (42.2% in the age bracket) enrolled. Conversely, the age group of 15 to 17 year olds has the lowest likelihood of being enrolled in a private school, with 803 (97.1% in the age bracket) attending a public institution.
| Age Bracket | Public School | Private School |
| 3 to 4 Year Olds | 185 (68.3%) | 86 (31.7%) |
| 5 to 9 Year Old | 1,081 (84.3%) | 202 (15.7%) |
| 10 to 14 Year Olds | 969 (89.3%) | 116 (10.7%) |
| 15 to 17 Year Olds | 803 (97.1%) | 24 (2.9%) |
| 18 to 19 Year Olds | 221 (77.3%) | 65 (22.7%) |
| 20 to 24 Year Olds | 374 (93.5%) | 26 (6.5%) |
| 25 to 34 Year Olds | 78 (68.4%) | 36 (31.6%) |
| 35 Years and over | 104 (57.8%) | 76 (42.2%) |
| Total | 3,815 (85.8%) | 631 (14.2%) |
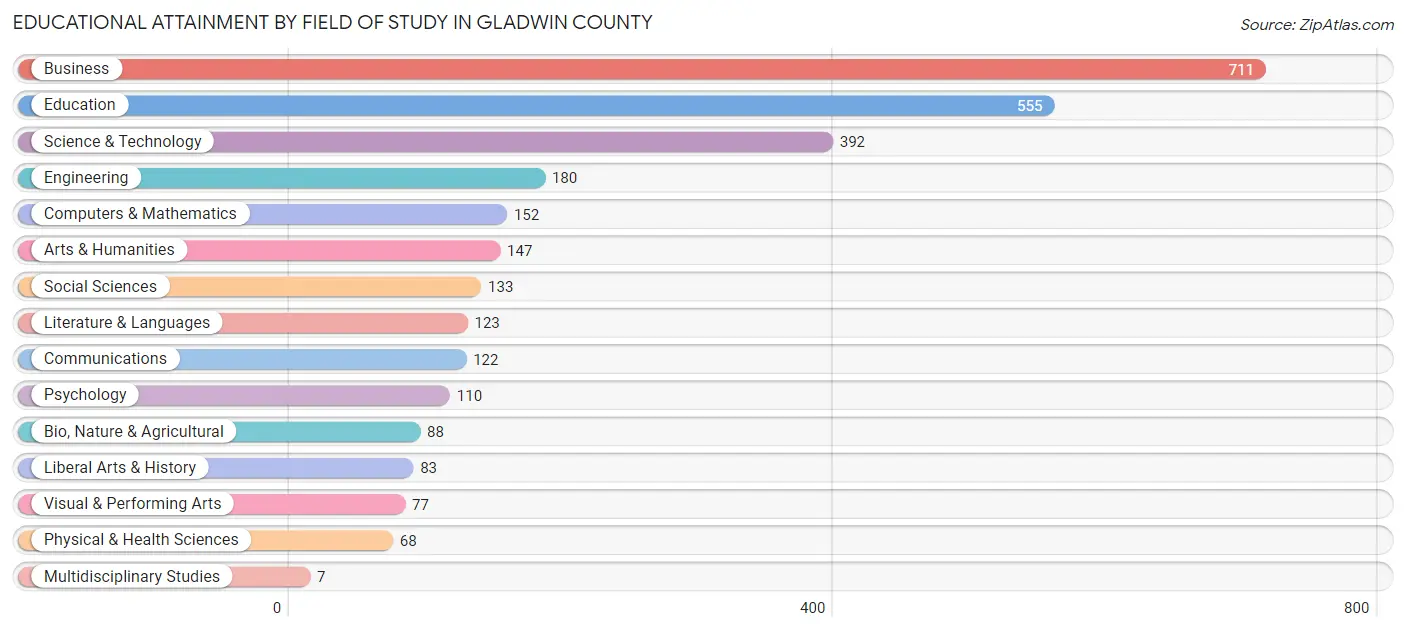
Educational Attainment by Field of Study in Gladwin County
Business (711 | 24.1%), education (555 | 18.8%), science & technology (392 | 13.3%), engineering (180 | 6.1%), and computers & mathematics (152 | 5.2%) are the most common fields of study among 2,948 individuals in Gladwin County who have obtained a bachelor's degree or higher.
| Field of Study | # Graduates | % Graduates |
| Computers & Mathematics | 152 | 5.2% |
| Bio, Nature & Agricultural | 88 | 3.0% |
| Physical & Health Sciences | 68 | 2.3% |
| Psychology | 110 | 3.7% |
| Social Sciences | 133 | 4.5% |
| Engineering | 180 | 6.1% |
| Multidisciplinary Studies | 7 | 0.2% |
| Science & Technology | 392 | 13.3% |
| Business | 711 | 24.1% |
| Education | 555 | 18.8% |
| Literature & Languages | 123 | 4.2% |
| Liberal Arts & History | 83 | 2.8% |
| Visual & Performing Arts | 77 | 2.6% |
| Communications | 122 | 4.1% |
| Arts & Humanities | 147 | 5.0% |
| Total | 2,948 | 100.0% |
Transportation & Commute in Gladwin County
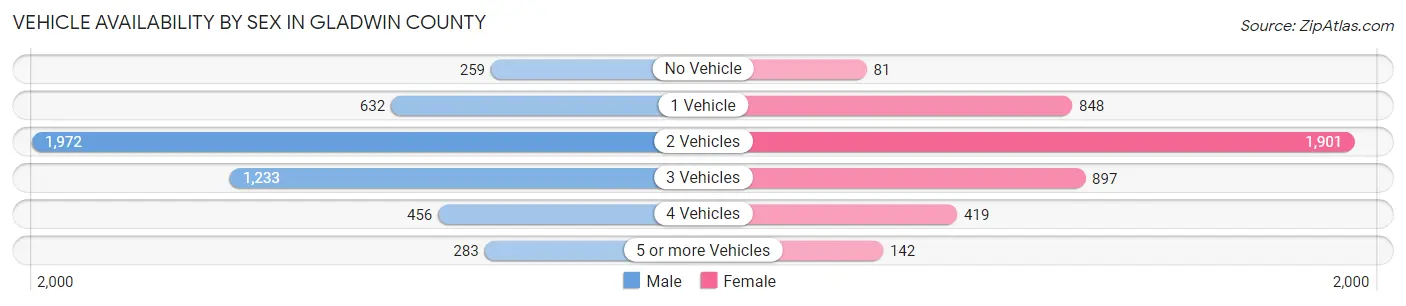
Vehicle Availability by Sex in Gladwin County
The most prevalent vehicle ownership categories in Gladwin County are males with 2 vehicles (1,972, accounting for 40.8%) and females with 2 vehicles (1,901, making up 46.0%).
| Vehicles Available | Male | Female |
| No Vehicle | 259 (5.4%) | 81 (1.9%) |
| 1 Vehicle | 632 (13.1%) | 848 (19.8%) |
| 2 Vehicles | 1,972 (40.8%) | 1,901 (44.3%) |
| 3 Vehicles | 1,233 (25.5%) | 897 (20.9%) |
| 4 Vehicles | 456 (9.4%) | 419 (9.8%) |
| 5 or more Vehicles | 283 (5.9%) | 142 (3.3%) |
| Total | 4,835 (100.0%) | 4,288 (100.0%) |
Commute Time in Gladwin County
The most frequently occuring commute durations in Gladwin County are 45 to 59 minutes (1,166 commuters, 13.8%), 10 to 14 minutes (1,015 commuters, 12.0%), and 5 to 9 minutes (951 commuters, 11.2%).
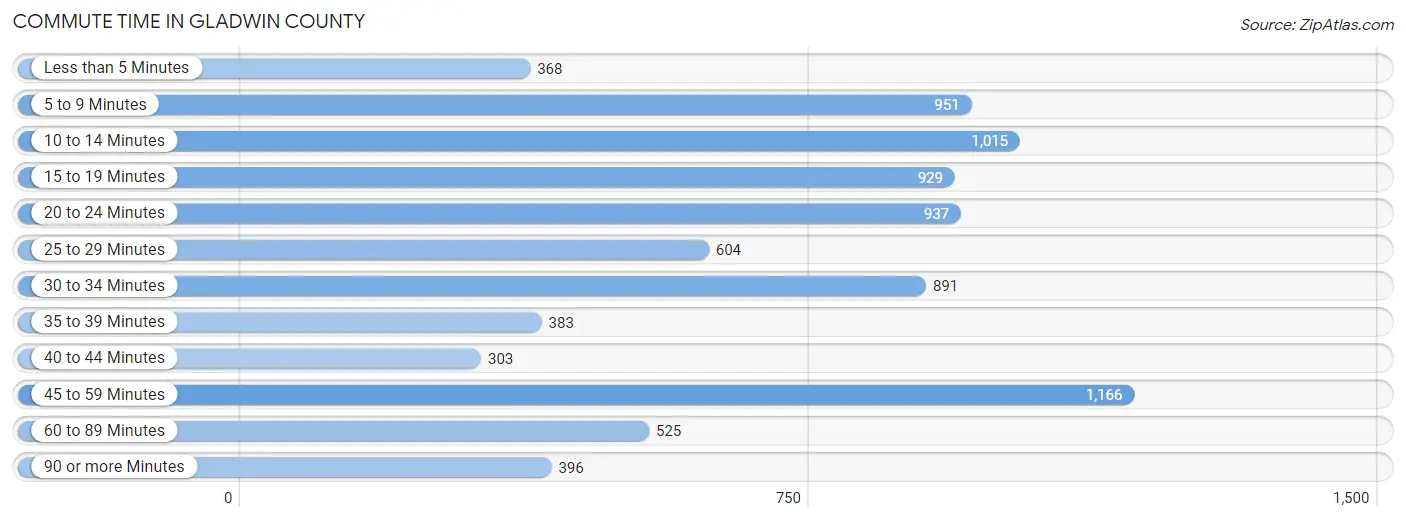
| Commute Time | # Commuters | % Commuters |
| Less than 5 Minutes | 368 | 4.3% |
| 5 to 9 Minutes | 951 | 11.2% |
| 10 to 14 Minutes | 1,015 | 12.0% |
| 15 to 19 Minutes | 929 | 11.0% |
| 20 to 24 Minutes | 937 | 11.1% |
| 25 to 29 Minutes | 604 | 7.1% |
| 30 to 34 Minutes | 891 | 10.5% |
| 35 to 39 Minutes | 383 | 4.5% |
| 40 to 44 Minutes | 303 | 3.6% |
| 45 to 59 Minutes | 1,166 | 13.8% |
| 60 to 89 Minutes | 525 | 6.2% |
| 90 or more Minutes | 396 | 4.7% |
Commute Time by Sex in Gladwin County
The most common commute times in Gladwin County are 45 to 59 minutes (648 commuters, 14.2%) for males and 5 to 9 minutes (567 commuters, 14.5%) for females.
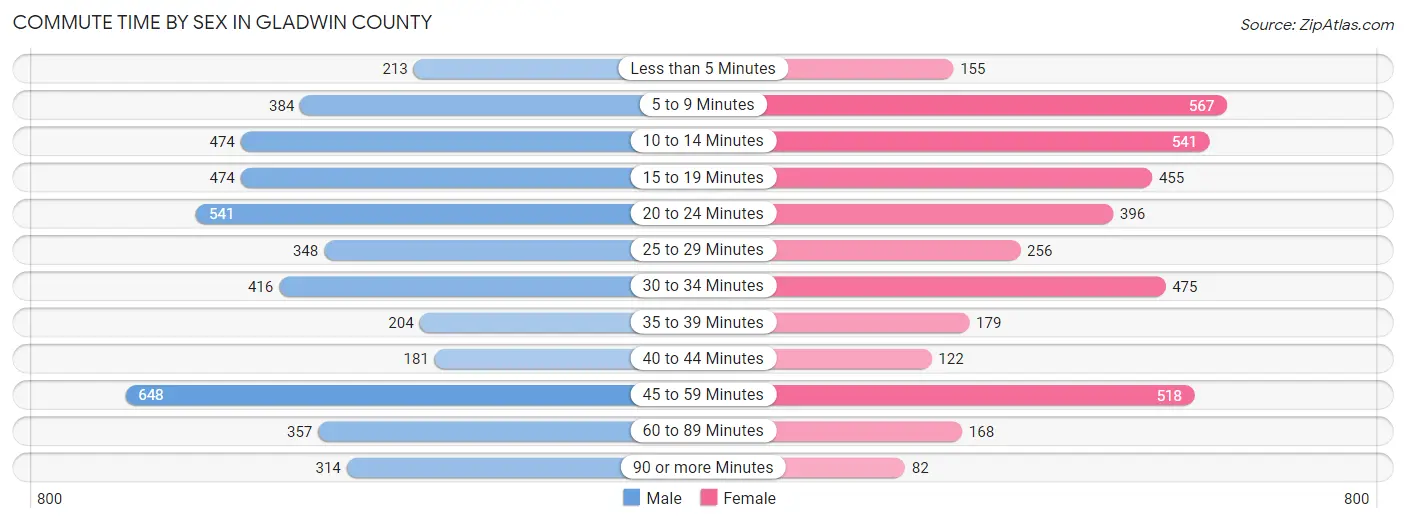
| Commute Time | Male | Female |
| Less than 5 Minutes | 213 (4.7%) | 155 (4.0%) |
| 5 to 9 Minutes | 384 (8.4%) | 567 (14.5%) |
| 10 to 14 Minutes | 474 (10.4%) | 541 (13.8%) |
| 15 to 19 Minutes | 474 (10.4%) | 455 (11.6%) |
| 20 to 24 Minutes | 541 (11.9%) | 396 (10.1%) |
| 25 to 29 Minutes | 348 (7.6%) | 256 (6.5%) |
| 30 to 34 Minutes | 416 (9.1%) | 475 (12.1%) |
| 35 to 39 Minutes | 204 (4.5%) | 179 (4.6%) |
| 40 to 44 Minutes | 181 (4.0%) | 122 (3.1%) |
| 45 to 59 Minutes | 648 (14.2%) | 518 (13.2%) |
| 60 to 89 Minutes | 357 (7.8%) | 168 (4.3%) |
| 90 or more Minutes | 314 (6.9%) | 82 (2.1%) |
Time of Departure to Work by Sex in Gladwin County
The most frequent times of departure to work in Gladwin County are 6:30 AM to 6:59 AM (668, 14.7%) for males and 7:30 AM to 7:59 AM (803, 20.5%) for females.
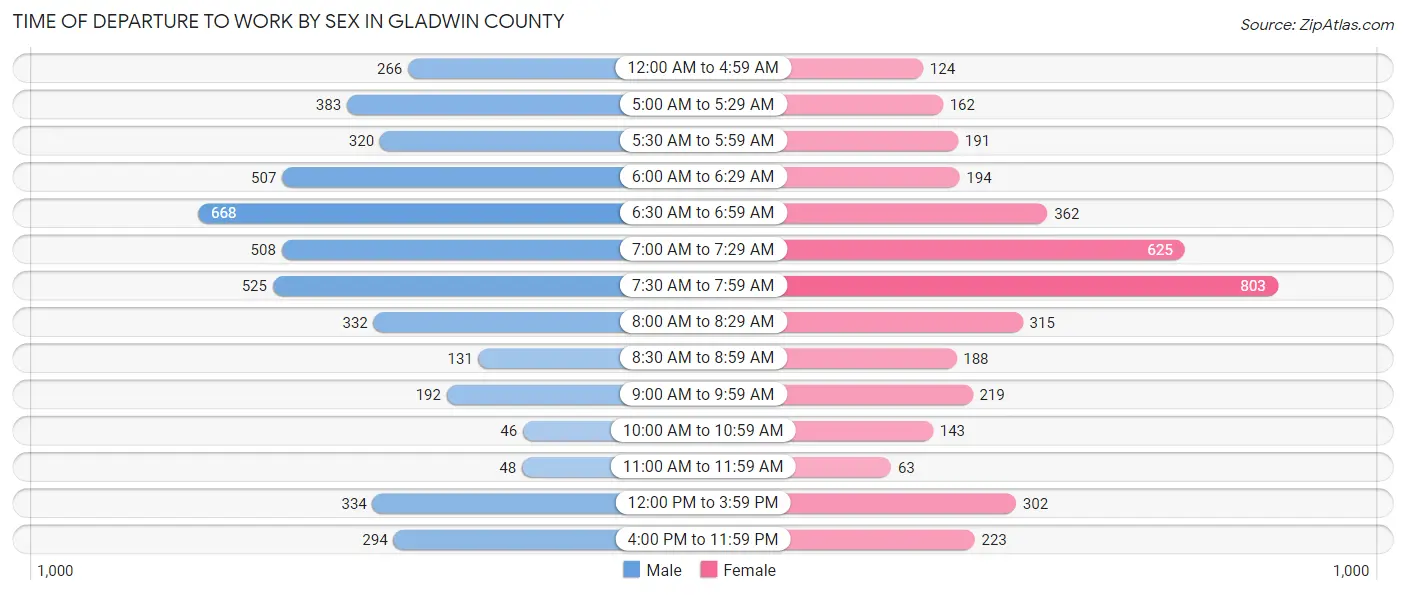
| Time of Departure | Male | Female |
| 12:00 AM to 4:59 AM | 266 (5.8%) | 124 (3.2%) |
| 5:00 AM to 5:29 AM | 383 (8.4%) | 162 (4.1%) |
| 5:30 AM to 5:59 AM | 320 (7.0%) | 191 (4.9%) |
| 6:00 AM to 6:29 AM | 507 (11.1%) | 194 (5.0%) |
| 6:30 AM to 6:59 AM | 668 (14.7%) | 362 (9.2%) |
| 7:00 AM to 7:29 AM | 508 (11.2%) | 625 (16.0%) |
| 7:30 AM to 7:59 AM | 525 (11.5%) | 803 (20.5%) |
| 8:00 AM to 8:29 AM | 332 (7.3%) | 315 (8.1%) |
| 8:30 AM to 8:59 AM | 131 (2.9%) | 188 (4.8%) |
| 9:00 AM to 9:59 AM | 192 (4.2%) | 219 (5.6%) |
| 10:00 AM to 10:59 AM | 46 (1.0%) | 143 (3.6%) |
| 11:00 AM to 11:59 AM | 48 (1.1%) | 63 (1.6%) |
| 12:00 PM to 3:59 PM | 334 (7.3%) | 302 (7.7%) |
| 4:00 PM to 11:59 PM | 294 (6.5%) | 223 (5.7%) |
| Total | 4,554 (100.0%) | 3,914 (100.0%) |
Housing Occupancy in Gladwin County
Occupancy by Ownership in Gladwin County
Of the total 10,859 dwellings in Gladwin County, owner-occupied units account for 9,523 (87.7%), while renter-occupied units make up 1,336 (12.3%).
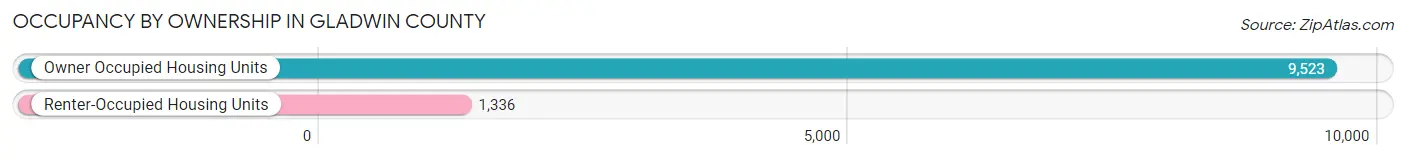
| Occupancy | # Housing Units | % Housing Units |
| Owner Occupied Housing Units | 9,523 | 87.7% |
| Renter-Occupied Housing Units | 1,336 | 12.3% |
| Total Occupied Housing Units | 10,859 | 100.0% |
Occupancy by Household Size in Gladwin County
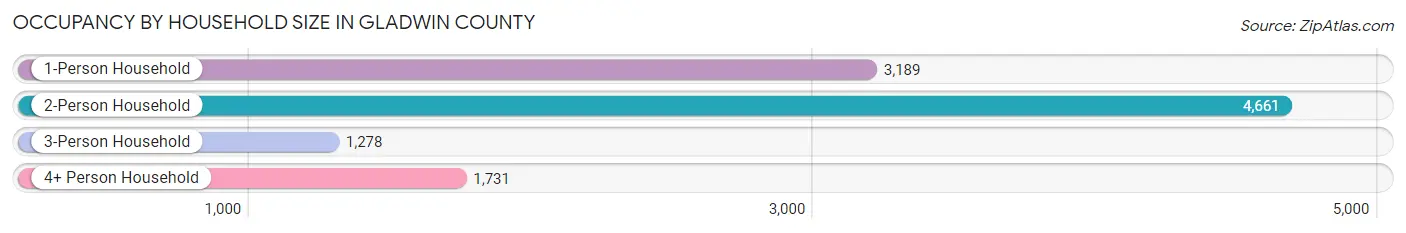
| Household Size | # Housing Units | % Housing Units |
| 1-Person Household | 3,189 | 29.4% |
| 2-Person Household | 4,661 | 42.9% |
| 3-Person Household | 1,278 | 11.8% |
| 4+ Person Household | 1,731 | 15.9% |
| Total Housing Units | 10,859 | 100.0% |
Occupancy by Ownership by Household Size in Gladwin County
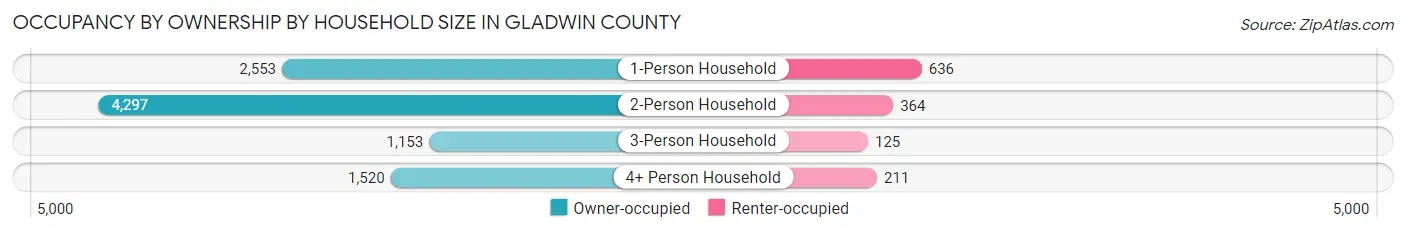
| Household Size | Owner-occupied | Renter-occupied |
| 1-Person Household | 2,553 (80.1%) | 636 (19.9%) |
| 2-Person Household | 4,297 (92.2%) | 364 (7.8%) |
| 3-Person Household | 1,153 (90.2%) | 125 (9.8%) |
| 4+ Person Household | 1,520 (87.8%) | 211 (12.2%) |
| Total Housing Units | 9,523 (87.7%) | 1,336 (12.3%) |
Occupancy by Educational Attainment in Gladwin County
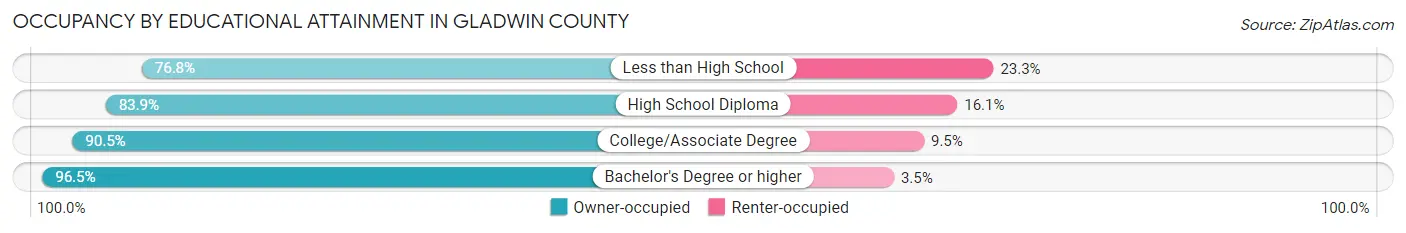
| Household Size | Owner-occupied | Renter-occupied |
| Less than High School | 812 (76.7%) | 246 (23.3%) |
| High School Diploma | 3,349 (83.9%) | 642 (16.1%) |
| College/Associate Degree | 3,691 (90.5%) | 387 (9.5%) |
| Bachelor's Degree or higher | 1,671 (96.5%) | 61 (3.5%) |
Occupancy by Age of Householder in Gladwin County
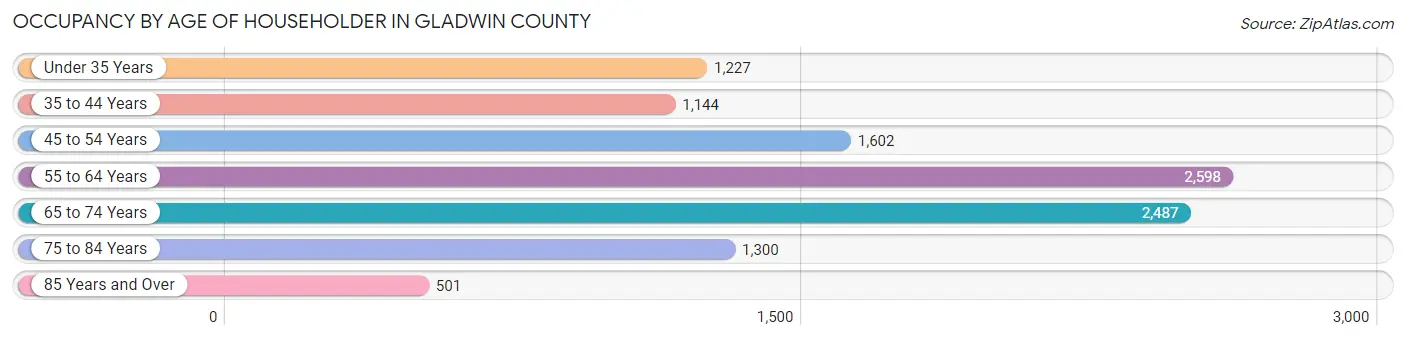
| Age Bracket | # Households | % Households |
| Under 35 Years | 1,227 | 11.3% |
| 35 to 44 Years | 1,144 | 10.5% |
| 45 to 54 Years | 1,602 | 14.7% |
| 55 to 64 Years | 2,598 | 23.9% |
| 65 to 74 Years | 2,487 | 22.9% |
| 75 to 84 Years | 1,300 | 12.0% |
| 85 Years and Over | 501 | 4.6% |
| Total | 10,859 | 100.0% |
Housing Finances in Gladwin County
Median Income by Occupancy in Gladwin County
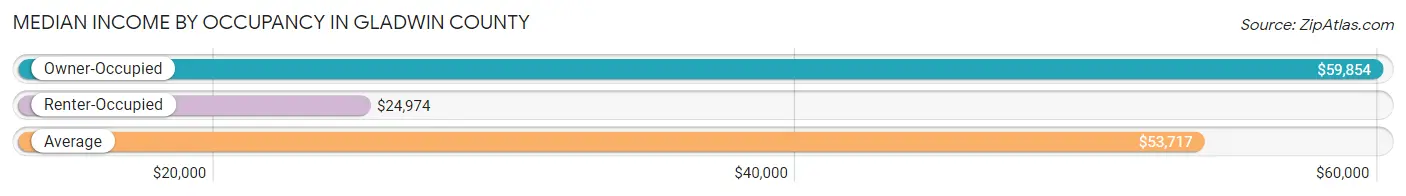
| Occupancy Type | # Households | Median Income |
| Owner-Occupied | 9,523 (87.7%) | $59,854 |
| Renter-Occupied | 1,336 (12.3%) | $24,974 |
| Average | 10,859 (100.0%) | $53,717 |
Occupancy by Householder Income Bracket in Gladwin County
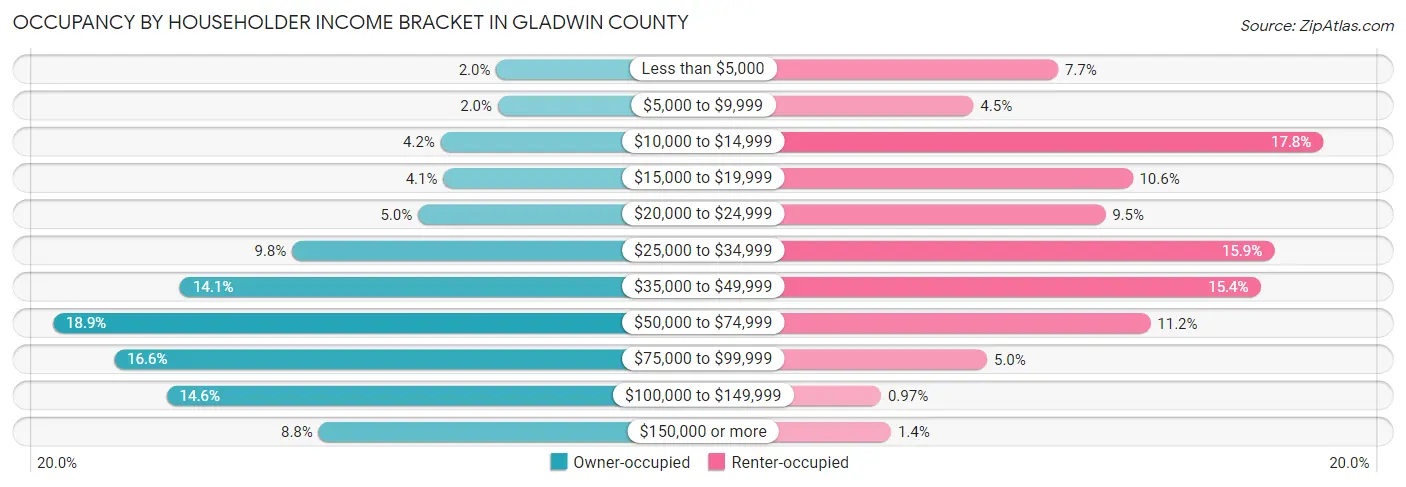
| Income Bracket | Owner-occupied | Renter-occupied |
| Less than $5,000 | 193 (2.0%) | 103 (7.7%) |
| $5,000 to $9,999 | 188 (2.0%) | 60 (4.5%) |
| $10,000 to $14,999 | 395 (4.2%) | 238 (17.8%) |
| $15,000 to $19,999 | 386 (4.1%) | 141 (10.5%) |
| $20,000 to $24,999 | 477 (5.0%) | 127 (9.5%) |
| $25,000 to $34,999 | 934 (9.8%) | 213 (15.9%) |
| $35,000 to $49,999 | 1,341 (14.1%) | 206 (15.4%) |
| $50,000 to $74,999 | 1,802 (18.9%) | 150 (11.2%) |
| $75,000 to $99,999 | 1,580 (16.6%) | 67 (5.0%) |
| $100,000 to $149,999 | 1,389 (14.6%) | 13 (1.0%) |
| $150,000 or more | 838 (8.8%) | 18 (1.3%) |
| Total | 9,523 (100.0%) | 1,336 (100.0%) |
Monthly Housing Cost Tiers in Gladwin County
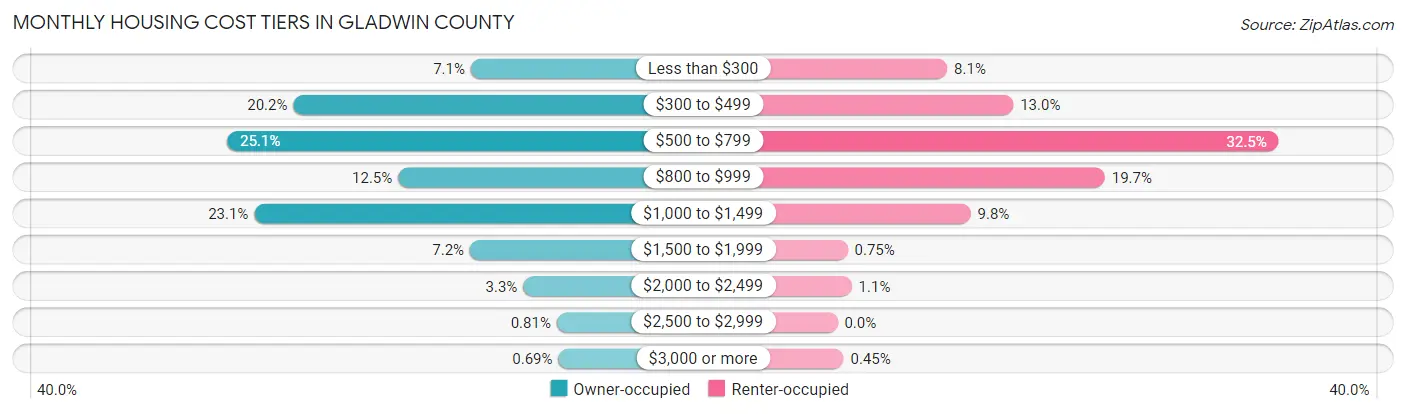
| Monthly Cost | Owner-occupied | Renter-occupied |
| Less than $300 | 680 (7.1%) | 108 (8.1%) |
| $300 to $499 | 1,925 (20.2%) | 173 (13.0%) |
| $500 to $799 | 2,389 (25.1%) | 434 (32.5%) |
| $800 to $999 | 1,189 (12.5%) | 263 (19.7%) |
| $1,000 to $1,499 | 2,199 (23.1%) | 131 (9.8%) |
| $1,500 to $1,999 | 686 (7.2%) | 10 (0.7%) |
| $2,000 to $2,499 | 312 (3.3%) | 14 (1.1%) |
| $2,500 to $2,999 | 77 (0.8%) | 0 (0.0%) |
| $3,000 or more | 66 (0.7%) | 6 (0.4%) |
| Total | 9,523 (100.0%) | 1,336 (100.0%) |
Physical Housing Characteristics in Gladwin County
Housing Structures in Gladwin County
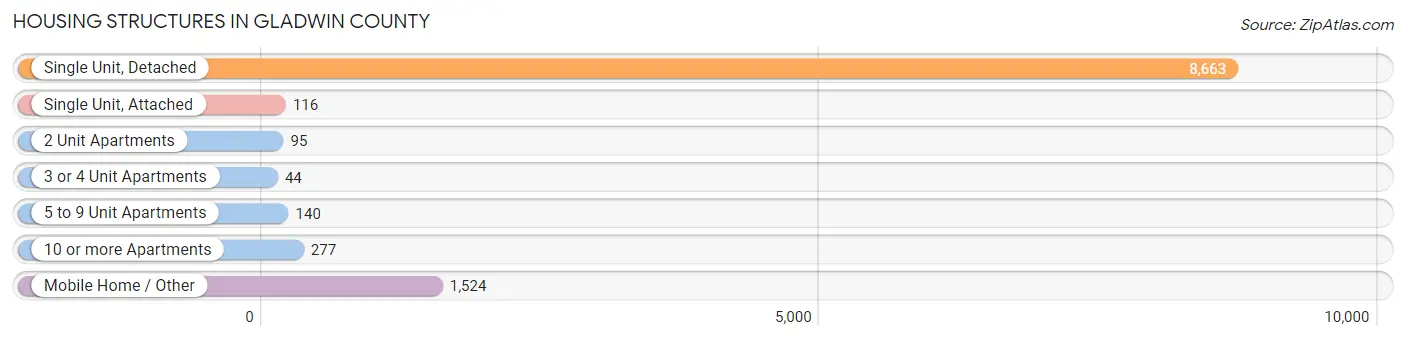
| Structure Type | # Housing Units | % Housing Units |
| Single Unit, Detached | 8,663 | 79.8% |
| Single Unit, Attached | 116 | 1.1% |
| 2 Unit Apartments | 95 | 0.9% |
| 3 or 4 Unit Apartments | 44 | 0.4% |
| 5 to 9 Unit Apartments | 140 | 1.3% |
| 10 or more Apartments | 277 | 2.5% |
| Mobile Home / Other | 1,524 | 14.0% |
| Total | 10,859 | 100.0% |
Housing Structures by Occupancy in Gladwin County
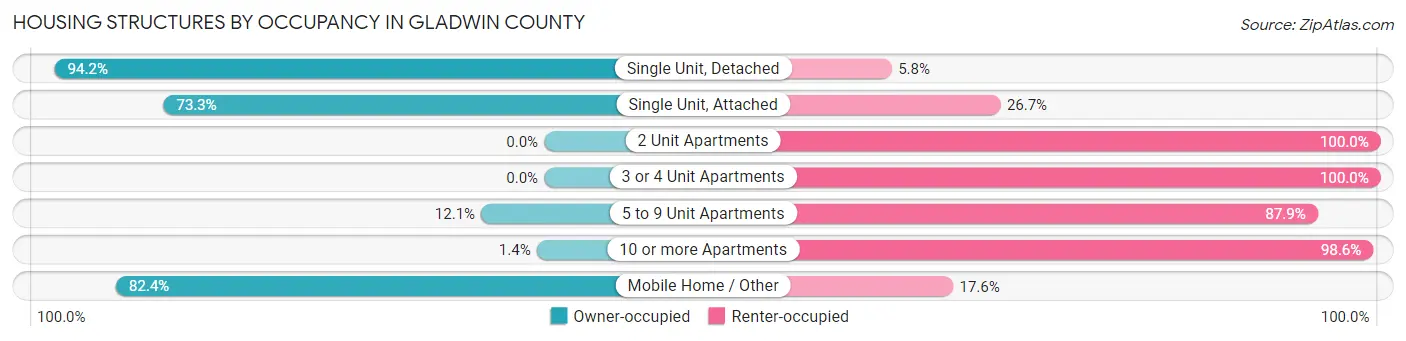
| Structure Type | Owner-occupied | Renter-occupied |
| Single Unit, Detached | 8,161 (94.2%) | 502 (5.8%) |
| Single Unit, Attached | 85 (73.3%) | 31 (26.7%) |
| 2 Unit Apartments | 0 (0.0%) | 95 (100.0%) |
| 3 or 4 Unit Apartments | 0 (0.0%) | 44 (100.0%) |
| 5 to 9 Unit Apartments | 17 (12.1%) | 123 (87.9%) |
| 10 or more Apartments | 4 (1.4%) | 273 (98.6%) |
| Mobile Home / Other | 1,256 (82.4%) | 268 (17.6%) |
| Total | 9,523 (87.7%) | 1,336 (12.3%) |
Housing Structures by Number of Rooms in Gladwin County
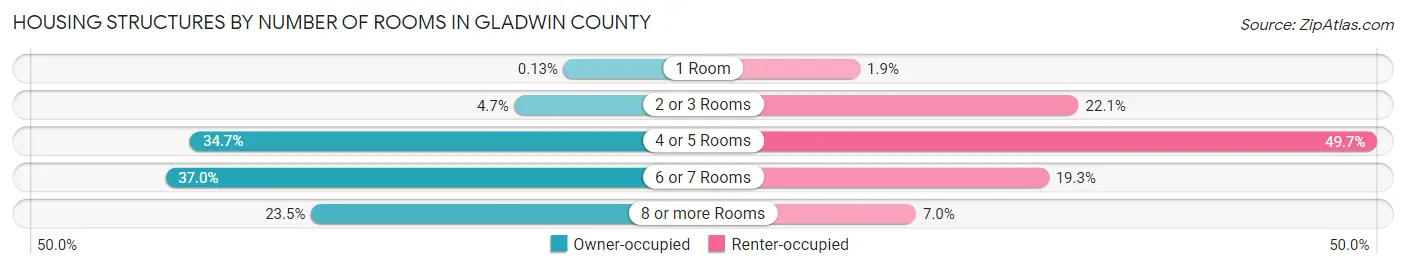
| Number of Rooms | Owner-occupied | Renter-occupied |
| 1 Room | 12 (0.1%) | 25 (1.9%) |
| 2 or 3 Rooms | 447 (4.7%) | 295 (22.1%) |
| 4 or 5 Rooms | 3,304 (34.7%) | 664 (49.7%) |
| 6 or 7 Rooms | 3,523 (37.0%) | 258 (19.3%) |
| 8 or more Rooms | 2,237 (23.5%) | 94 (7.0%) |
| Total | 9,523 (100.0%) | 1,336 (100.0%) |
Housing Structure by Heating Type in Gladwin County
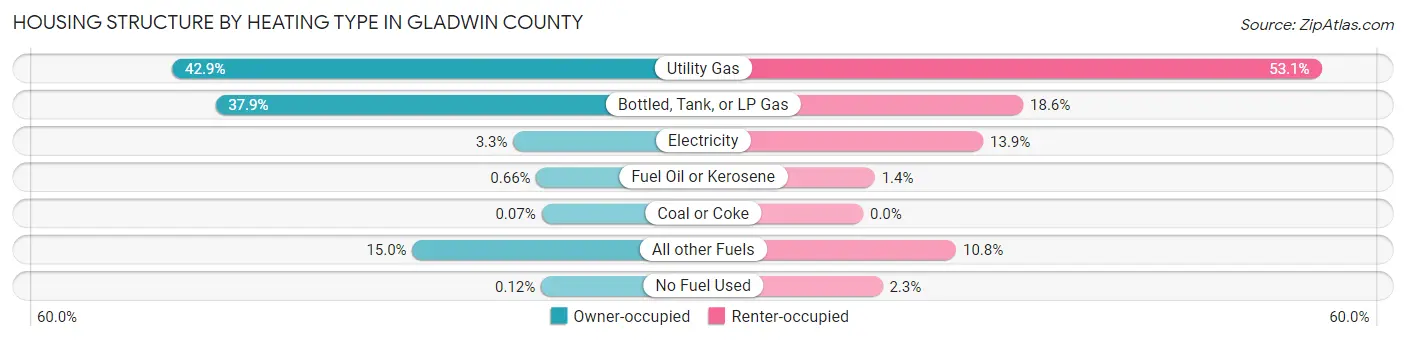
| Heating Type | Owner-occupied | Renter-occupied |
| Utility Gas | 4,084 (42.9%) | 710 (53.1%) |
| Bottled, Tank, or LP Gas | 3,609 (37.9%) | 248 (18.6%) |
| Electricity | 318 (3.3%) | 186 (13.9%) |
| Fuel Oil or Kerosene | 63 (0.7%) | 18 (1.3%) |
| Coal or Coke | 7 (0.1%) | 0 (0.0%) |
| All other Fuels | 1,431 (15.0%) | 144 (10.8%) |
| No Fuel Used | 11 (0.1%) | 30 (2.2%) |
| Total | 9,523 (100.0%) | 1,336 (100.0%) |
Household Vehicle Usage in Gladwin County
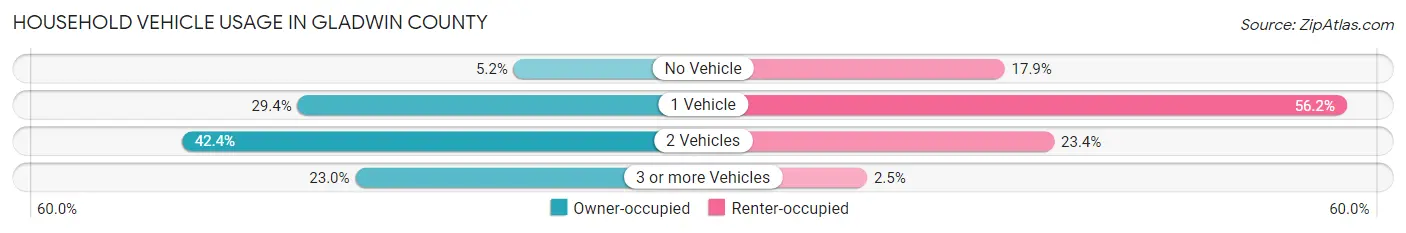
| Vehicles per Household | Owner-occupied | Renter-occupied |
| No Vehicle | 496 (5.2%) | 239 (17.9%) |
| 1 Vehicle | 2,803 (29.4%) | 751 (56.2%) |
| 2 Vehicles | 4,038 (42.4%) | 313 (23.4%) |
| 3 or more Vehicles | 2,186 (23.0%) | 33 (2.5%) |
| Total | 9,523 (100.0%) | 1,336 (100.0%) |
Real Estate & Mortgages in Gladwin County
Real Estate and Mortgage Overview in Gladwin County
| Characteristic | Without Mortgage | With Mortgage |
| Housing Units | 4,672 | 4,851 |
| Median Property Value | $127,200 | $150,500 |
| Median Household Income | $48,681 | $503 |
| Monthly Housing Costs | $480 | $63 |
| Real Estate Taxes | $1,666 | $204 |
Property Value by Mortgage Status in Gladwin County
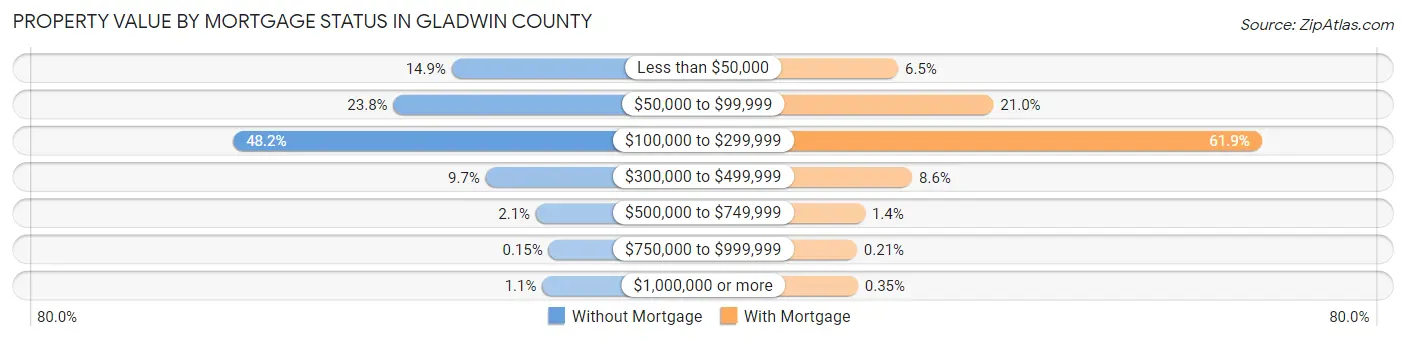
| Property Value | Without Mortgage | With Mortgage |
| Less than $50,000 | 697 (14.9%) | 315 (6.5%) |
| $50,000 to $99,999 | 1,112 (23.8%) | 1,019 (21.0%) |
| $100,000 to $299,999 | 2,252 (48.2%) | 3,002 (61.9%) |
| $300,000 to $499,999 | 455 (9.7%) | 418 (8.6%) |
| $500,000 to $749,999 | 97 (2.1%) | 70 (1.4%) |
| $750,000 to $999,999 | 7 (0.2%) | 10 (0.2%) |
| $1,000,000 or more | 52 (1.1%) | 17 (0.4%) |
| Total | 4,672 (100.0%) | 4,851 (100.0%) |
Household Income by Mortgage Status in Gladwin County
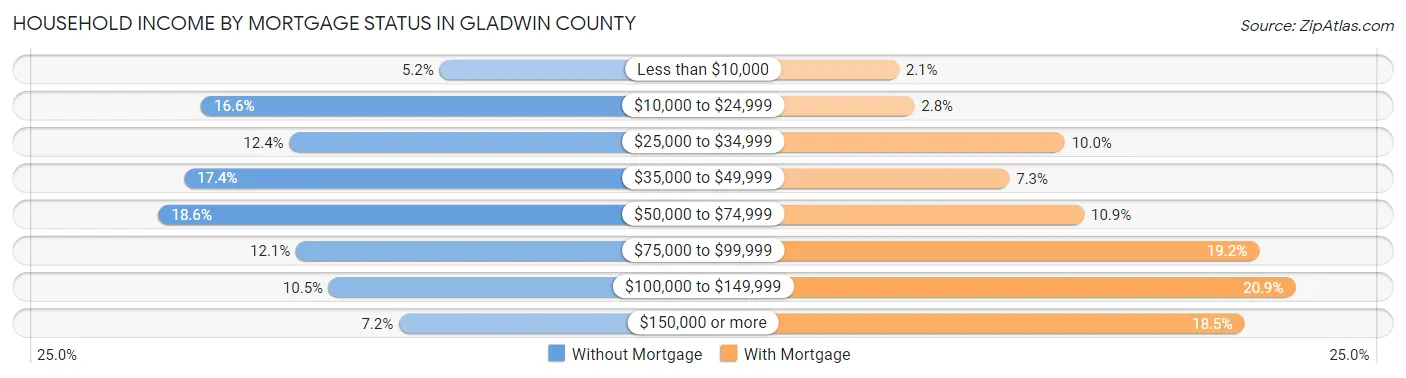
| Household Income | Without Mortgage | With Mortgage |
| Less than $10,000 | 245 (5.2%) | 100 (2.1%) |
| $10,000 to $24,999 | 775 (16.6%) | 136 (2.8%) |
| $25,000 to $34,999 | 579 (12.4%) | 483 (10.0%) |
| $35,000 to $49,999 | 813 (17.4%) | 355 (7.3%) |
| $50,000 to $74,999 | 870 (18.6%) | 528 (10.9%) |
| $75,000 to $99,999 | 564 (12.1%) | 932 (19.2%) |
| $100,000 to $149,999 | 491 (10.5%) | 1,016 (20.9%) |
| $150,000 or more | 335 (7.2%) | 898 (18.5%) |
| Total | 4,672 (100.0%) | 4,851 (100.0%) |
Property Value to Household Income Ratio in Gladwin County
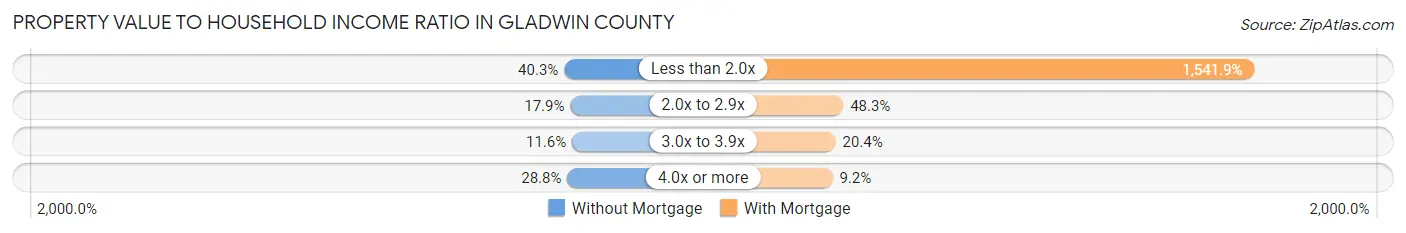
| Value-to-Income Ratio | Without Mortgage | With Mortgage |
| Less than 2.0x | 1,881 (40.3%) | 74,798 (1,541.9%) |
| 2.0x to 2.9x | 838 (17.9%) | 2,343 (48.3%) |
| 3.0x to 3.9x | 544 (11.6%) | 987 (20.3%) |
| 4.0x or more | 1,345 (28.8%) | 444 (9.1%) |
| Total | 4,672 (100.0%) | 4,851 (100.0%) |
Real Estate Taxes by Mortgage Status in Gladwin County
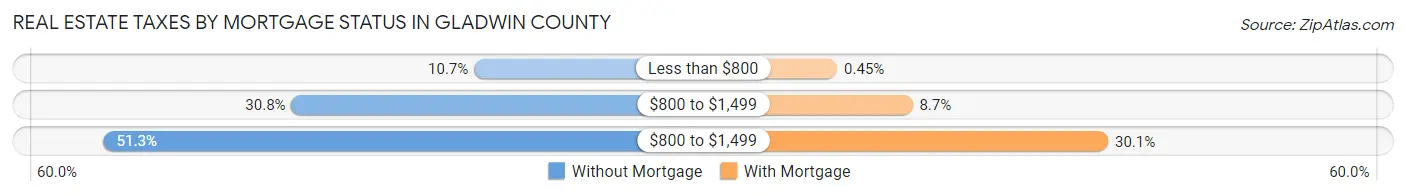
| Property Taxes | Without Mortgage | With Mortgage |
| Less than $800 | 502 (10.7%) | 22 (0.4%) |
| $800 to $1,499 | 1,437 (30.8%) | 422 (8.7%) |
| $800 to $1,499 | 2,398 (51.3%) | 1,462 (30.1%) |
| Total | 4,672 (100.0%) | 4,851 (100.0%) |
Health & Disability in Gladwin County
Health Insurance Coverage by Age in Gladwin County
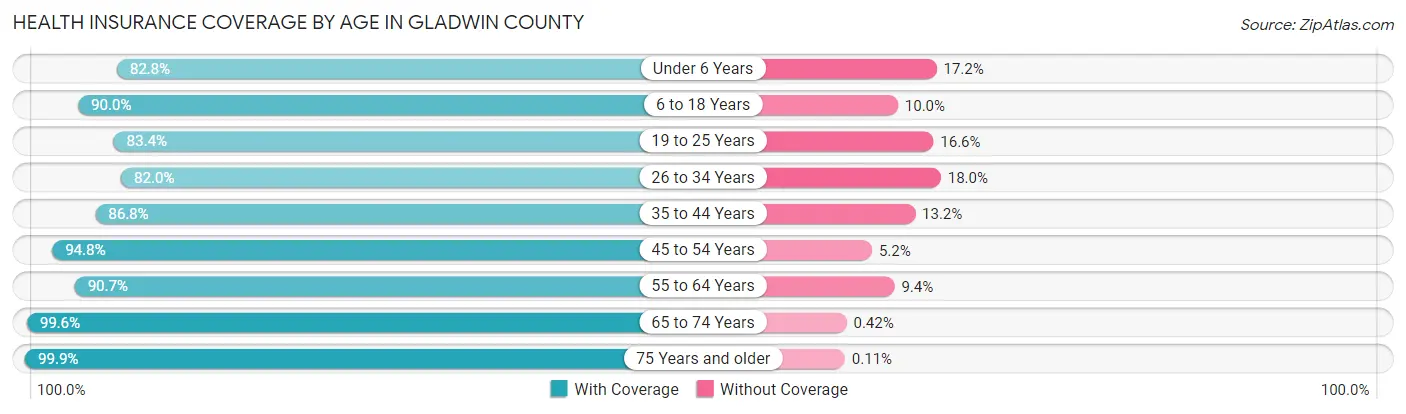
| Age Bracket | With Coverage | Without Coverage |
| Under 6 Years | 1,358 (82.8%) | 282 (17.2%) |
| 6 to 18 Years | 3,110 (90.0%) | 345 (10.0%) |
| 19 to 25 Years | 1,245 (83.4%) | 248 (16.6%) |
| 26 to 34 Years | 1,758 (82.0%) | 386 (18.0%) |
| 35 to 44 Years | 2,071 (86.8%) | 315 (13.2%) |
| 45 to 54 Years | 2,866 (94.8%) | 156 (5.2%) |
| 55 to 64 Years | 3,986 (90.6%) | 411 (9.3%) |
| 65 to 74 Years | 4,029 (99.6%) | 17 (0.4%) |
| 75 Years and older | 2,702 (99.9%) | 3 (0.1%) |
| Total | 23,125 (91.4%) | 2,163 (8.6%) |
Health Insurance Coverage by Citizenship Status in Gladwin County
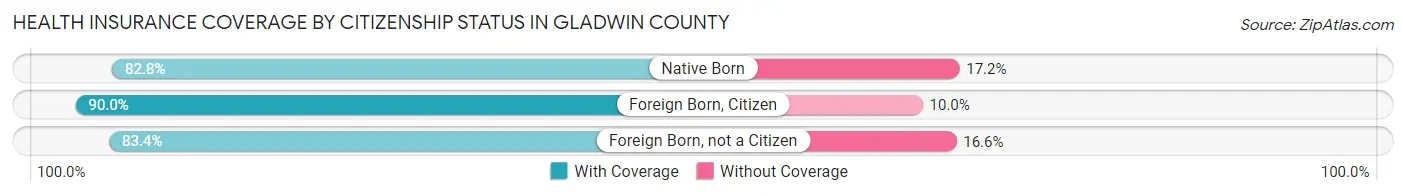
| Citizenship Status | With Coverage | Without Coverage |
| Native Born | 1,358 (82.8%) | 282 (17.2%) |
| Foreign Born, Citizen | 3,110 (90.0%) | 345 (10.0%) |
| Foreign Born, not a Citizen | 1,245 (83.4%) | 248 (16.6%) |
Health Insurance Coverage by Household Income in Gladwin County
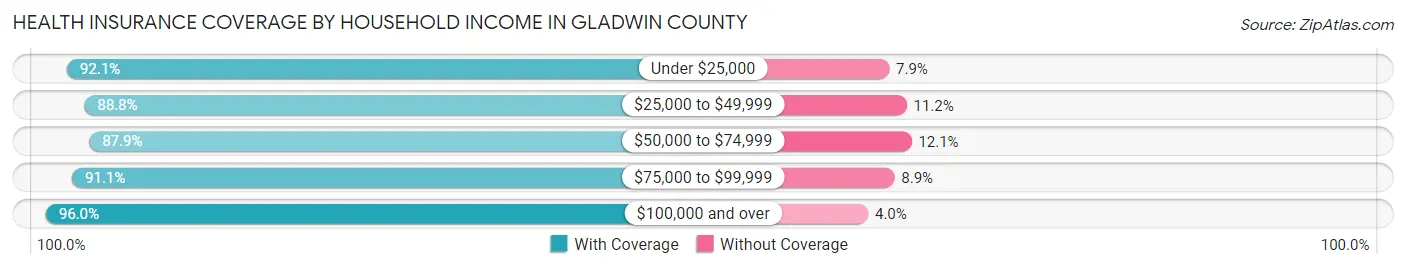
| Household Income | With Coverage | Without Coverage |
| Under $25,000 | 3,470 (92.1%) | 299 (7.9%) |
| $25,000 to $49,999 | 4,945 (88.8%) | 624 (11.2%) |
| $50,000 to $74,999 | 4,150 (87.9%) | 572 (12.1%) |
| $75,000 to $99,999 | 4,129 (91.1%) | 404 (8.9%) |
| $100,000 and over | 6,365 (96.0%) | 264 (4.0%) |
Public vs Private Health Insurance Coverage by Age in Gladwin County
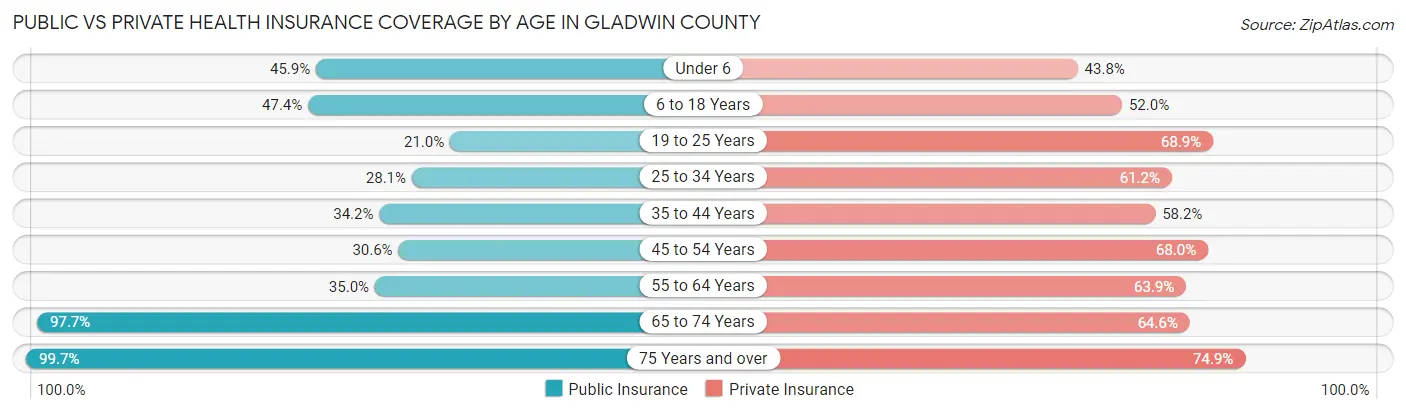
| Age Bracket | Public Insurance | Private Insurance |
| Under 6 | 753 (45.9%) | 718 (43.8%) |
| 6 to 18 Years | 1,637 (47.4%) | 1,797 (52.0%) |
| 19 to 25 Years | 314 (21.0%) | 1,029 (68.9%) |
| 25 to 34 Years | 603 (28.1%) | 1,313 (61.2%) |
| 35 to 44 Years | 815 (34.2%) | 1,388 (58.2%) |
| 45 to 54 Years | 925 (30.6%) | 2,054 (68.0%) |
| 55 to 64 Years | 1,538 (35.0%) | 2,810 (63.9%) |
| 65 to 74 Years | 3,953 (97.7%) | 2,613 (64.6%) |
| 75 Years and over | 2,697 (99.7%) | 2,025 (74.9%) |
| Total | 13,235 (52.3%) | 15,747 (62.3%) |
Disability Status by Sex by Age in Gladwin County
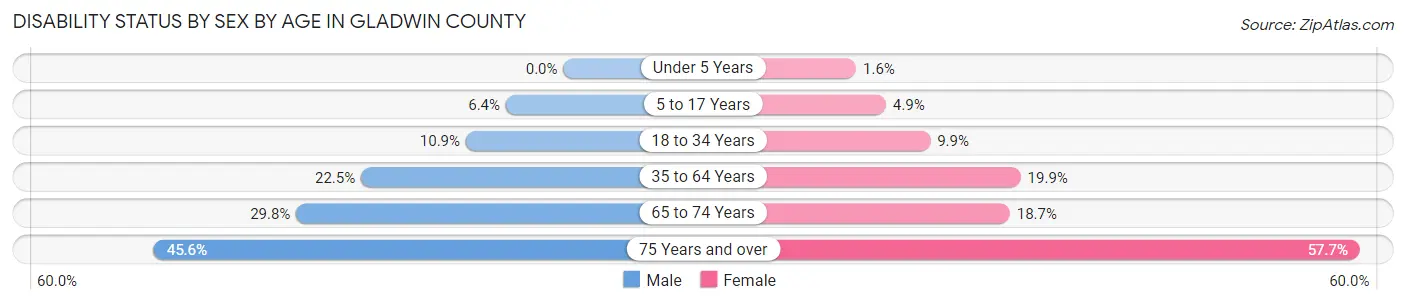
| Age Bracket | Male | Female |
| Under 5 Years | 0 (0.0%) | 10 (1.6%) |
| 5 to 17 Years | 118 (6.4%) | 80 (4.9%) |
| 18 to 34 Years | 215 (10.9%) | 193 (9.9%) |
| 35 to 64 Years | 1,113 (22.5%) | 969 (19.9%) |
| 65 to 74 Years | 598 (29.7%) | 381 (18.7%) |
| 75 Years and over | 572 (45.6%) | 837 (57.7%) |
Disability Class by Sex by Age in Gladwin County
Disability Class: Hearing Difficulty
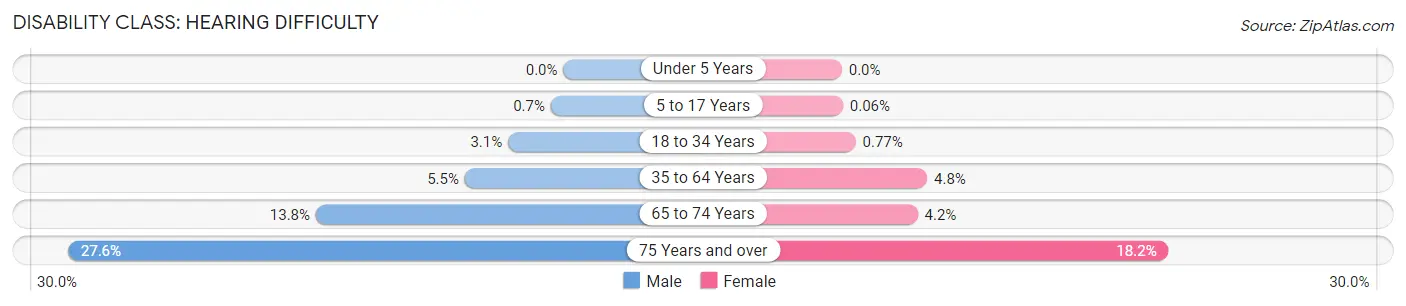
| Age Bracket | Male | Female |
| Under 5 Years | 0 (0.0%) | 0 (0.0%) |
| 5 to 17 Years | 13 (0.7%) | 1 (0.1%) |
| 18 to 34 Years | 61 (3.1%) | 15 (0.8%) |
| 35 to 64 Years | 271 (5.5%) | 231 (4.8%) |
| 65 to 74 Years | 277 (13.8%) | 86 (4.2%) |
| 75 Years and over | 346 (27.6%) | 264 (18.2%) |
Disability Class: Vision Difficulty
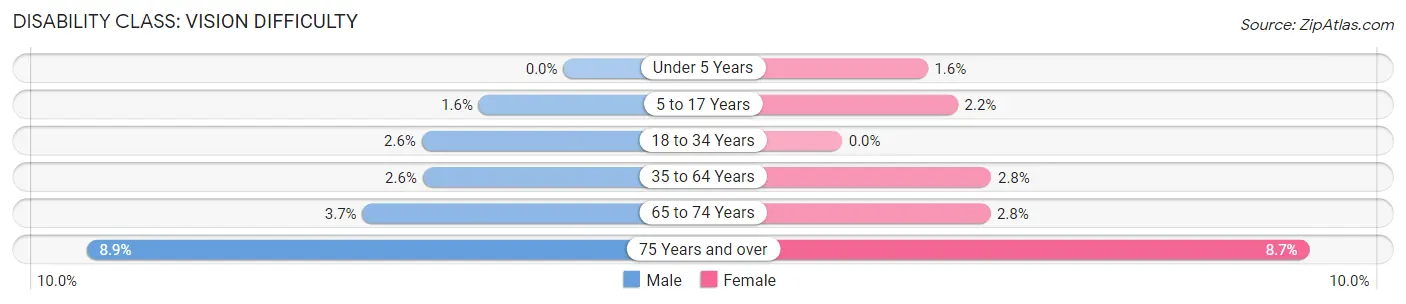
| Age Bracket | Male | Female |
| Under 5 Years | 0 (0.0%) | 10 (1.6%) |
| 5 to 17 Years | 29 (1.6%) | 35 (2.1%) |
| 18 to 34 Years | 52 (2.6%) | 0 (0.0%) |
| 35 to 64 Years | 129 (2.6%) | 135 (2.8%) |
| 65 to 74 Years | 75 (3.7%) | 56 (2.8%) |
| 75 Years and over | 111 (8.8%) | 126 (8.7%) |
Disability Class: Cognitive Difficulty
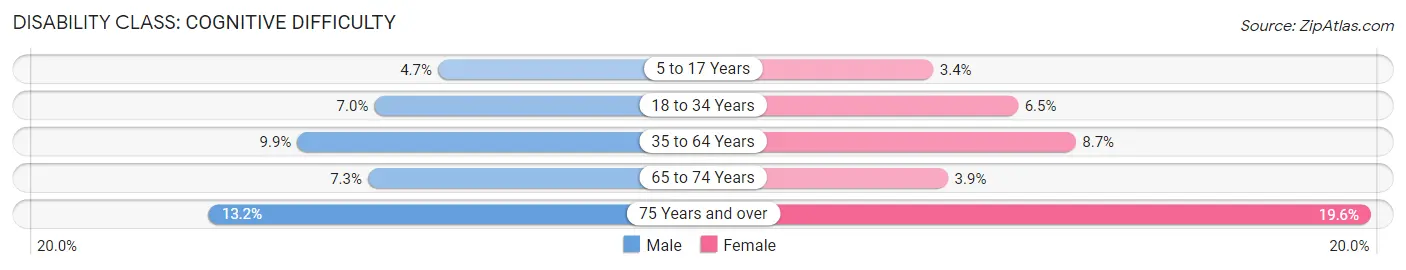
| Age Bracket | Male | Female |
| 5 to 17 Years | 86 (4.7%) | 55 (3.4%) |
| 18 to 34 Years | 139 (7.0%) | 128 (6.5%) |
| 35 to 64 Years | 488 (9.9%) | 422 (8.7%) |
| 65 to 74 Years | 146 (7.3%) | 80 (3.9%) |
| 75 Years and over | 165 (13.2%) | 285 (19.6%) |
Disability Class: Ambulatory Difficulty
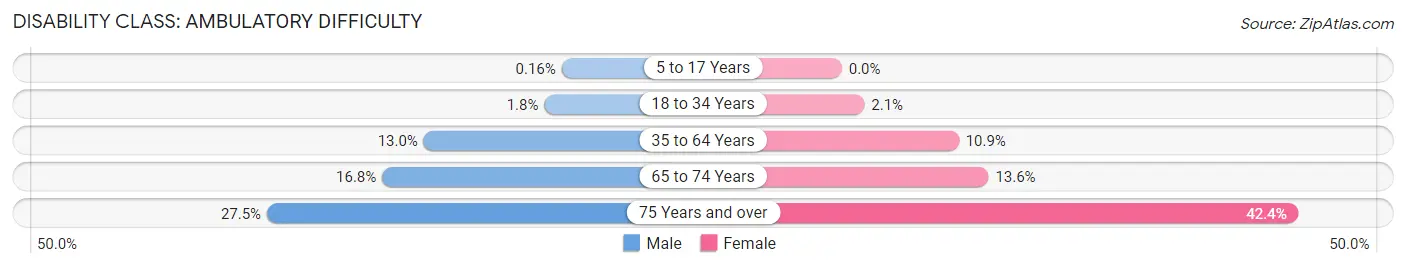
| Age Bracket | Male | Female |
| 5 to 17 Years | 3 (0.2%) | 0 (0.0%) |
| 18 to 34 Years | 35 (1.8%) | 41 (2.1%) |
| 35 to 64 Years | 640 (13.0%) | 528 (10.8%) |
| 65 to 74 Years | 338 (16.8%) | 277 (13.6%) |
| 75 Years and over | 345 (27.5%) | 615 (42.4%) |
Disability Class: Self-Care Difficulty
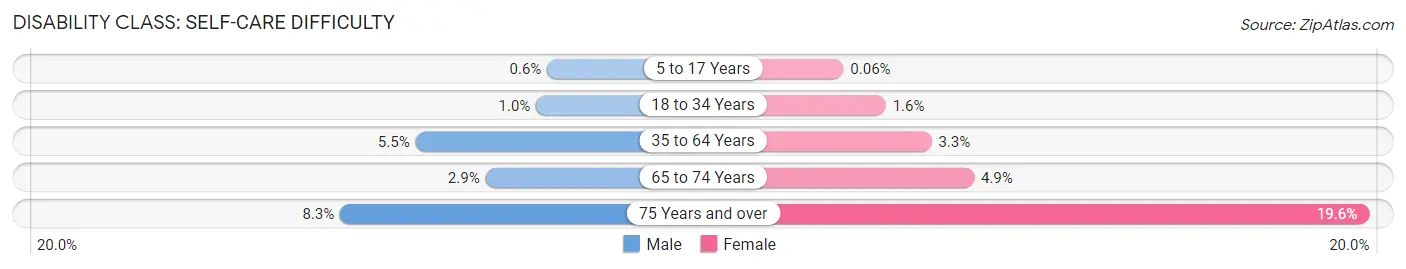
| Age Bracket | Male | Female |
| 5 to 17 Years | 11 (0.6%) | 1 (0.1%) |
| 18 to 34 Years | 20 (1.0%) | 32 (1.6%) |
| 35 to 64 Years | 271 (5.5%) | 162 (3.3%) |
| 65 to 74 Years | 58 (2.9%) | 100 (4.9%) |
| 75 Years and over | 104 (8.3%) | 284 (19.6%) |
Technology Access in Gladwin County
Computing Device Access in Gladwin County
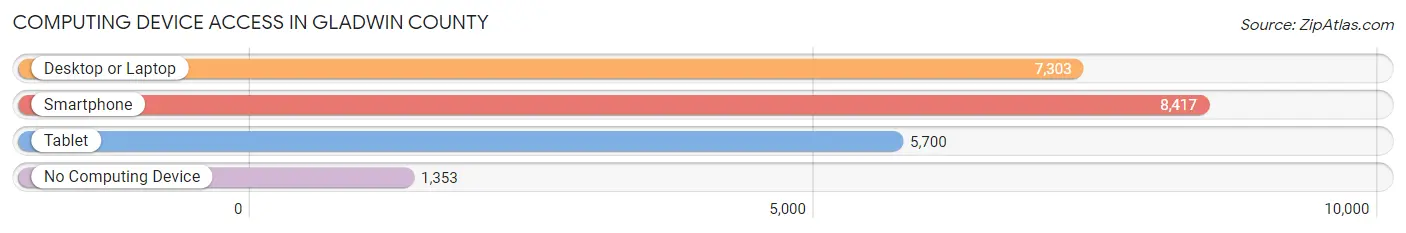
| Device Type | # Households | % Households |
| Desktop or Laptop | 7,303 | 67.2% |
| Smartphone | 8,417 | 77.5% |
| Tablet | 5,700 | 52.5% |
| No Computing Device | 1,353 | 12.5% |
| Total | 10,859 | 100.0% |
Internet Access in Gladwin County
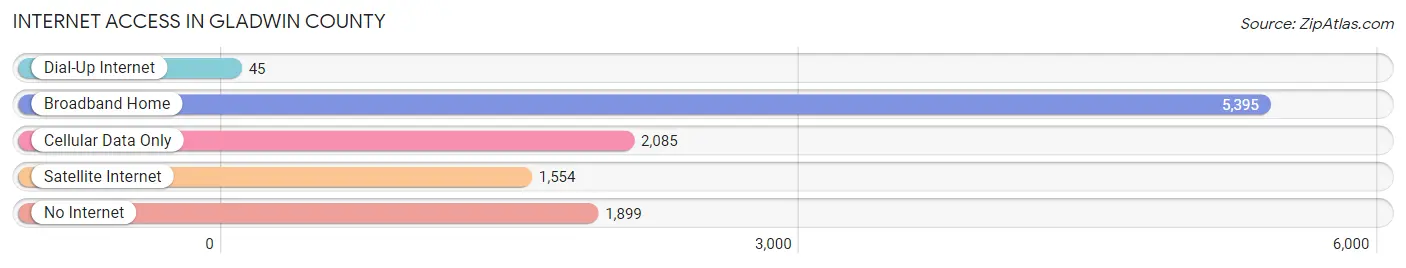
| Internet Type | # Households | % Households |
| Dial-Up Internet | 45 | 0.4% |
| Broadband Home | 5,395 | 49.7% |
| Cellular Data Only | 2,085 | 19.2% |
| Satellite Internet | 1,554 | 14.3% |
| No Internet | 1,899 | 17.5% |
| Total | 10,859 | 100.0% |
Gladwin County Summary
Gladwin County is located in the central region of Michigan’s Lower Peninsula. It is bordered by Midland County to the north, Bay County to the east, Saginaw County to the south, and Isabella County to the west. The county seat is Gladwin, and the county has a total area of 576 square miles.
History
Gladwin County was established in 1831 and was named after Henry Gladwin, a British officer who served in the French and Indian War. The county was originally part of Midland County, but was split off in 1831. The first settlers in the area were mostly of German and English descent. The first permanent settlement was established in 1854, and the county was officially organized in 1875.
The county was largely agricultural in the 19th century, with the main crops being wheat, oats, and potatoes. The lumber industry also played an important role in the county’s economy, with the first sawmill being built in 1876. The county also had several small coal mines, which provided employment for many of the residents.
Geography
Gladwin County is located in the central region of Michigan’s Lower Peninsula. It is bordered by Midland County to the north, Bay County to the east, Saginaw County to the south, and Isabella County to the west. The county has a total area of 576 square miles, with the majority of the land being covered in forests. The terrain is mostly rolling hills, with the highest point being the summit of Sugarloaf Mountain at 1,092 feet.
The county is home to several lakes, including Secord Lake, Smallwood Lake, and Wixom Lake. The Tittabawassee River runs through the county, and there are several smaller creeks and streams. The county is also home to several state parks, including the Gladwin State Forest and the Secord Lake State Park.
Economy
Gladwin County’s economy is largely based on agriculture and tourism. The county is home to several farms, which produce a variety of crops, including wheat, oats, corn, and potatoes. The lumber industry is also an important part of the county’s economy, with several sawmills located in the area.
The county is also home to several manufacturing companies, including automotive parts manufacturers, furniture makers, and metal fabricators. The county is also home to several wineries, which produce a variety of wines. Tourism is also an important part of the county’s economy, with several state parks and recreational areas located in the area.
Demographics
As of the 2010 census, the population of Gladwin County was 25,692. The population is largely white (94.3%), with small percentages of African Americans (2.2%), Native Americans (1.2%), Asians (0.7%), and other races (1.6%). The median household income is $37,945, and the median age is 43.7 years. The county has a poverty rate of 17.3%, and the unemployment rate is 8.2%.
Common Questions
What is Per Capita Income in Gladwin County?
Per Capita income in Gladwin County is $30,893.
What is the Median Family Income in Gladwin County?
Median Family Income in Gladwin County is $67,953.
What is the Median Household income in Gladwin County?
Median Household Income in Gladwin County is $53,717.
What is Income or Wage Gap in Gladwin County?
Income or Wage Gap in Gladwin County is 40.3%.
Women in Gladwin County earn 59.7 cents for every dollar earned by a man.
What is Family Income Deficit in Gladwin County?
Family Income Deficit in Gladwin County is $9,853.
Families that are below poverty line in Gladwin County earn $9,853 less on average than the poverty threshold level.
What is Inequality or Gini Index in Gladwin County?
Inequality or Gini Index in Gladwin County is 0.45.
What is the Total Population of Gladwin County?
Total Population of Gladwin County is 25,461.
What is the Total Male Population of Gladwin County?
Total Male Population of Gladwin County is 12,823.
What is the Total Female Population of Gladwin County?
Total Female Population of Gladwin County is 12,638.
What is the Ratio of Males per 100 Females in Gladwin County?
There are 101.46 Males per 100 Females in Gladwin County.
What is the Ratio of Females per 100 Males in Gladwin County?
There are 98.56 Females per 100 Males in Gladwin County.
What is the Median Population Age in Gladwin County?
Median Population Age in Gladwin County is 50.7 Years.
What is the Average Family Size in Gladwin County
Average Family Size in Gladwin County is 2.9 People.
What is the Average Household Size in Gladwin County
Average Household Size in Gladwin County is 2.3 People.
How Large is the Labor Force in Gladwin County?
There are 9,960 People in the Labor Forcein in Gladwin County.
What is the Percentage of People in the Labor Force in Gladwin County?
46.7% of People are in the Labor Force in Gladwin County.
What is the Unemployment Rate in Gladwin County?
Unemployment Rate in Gladwin County is 6.9%.