Cheboygan County, MI Map & Demographics
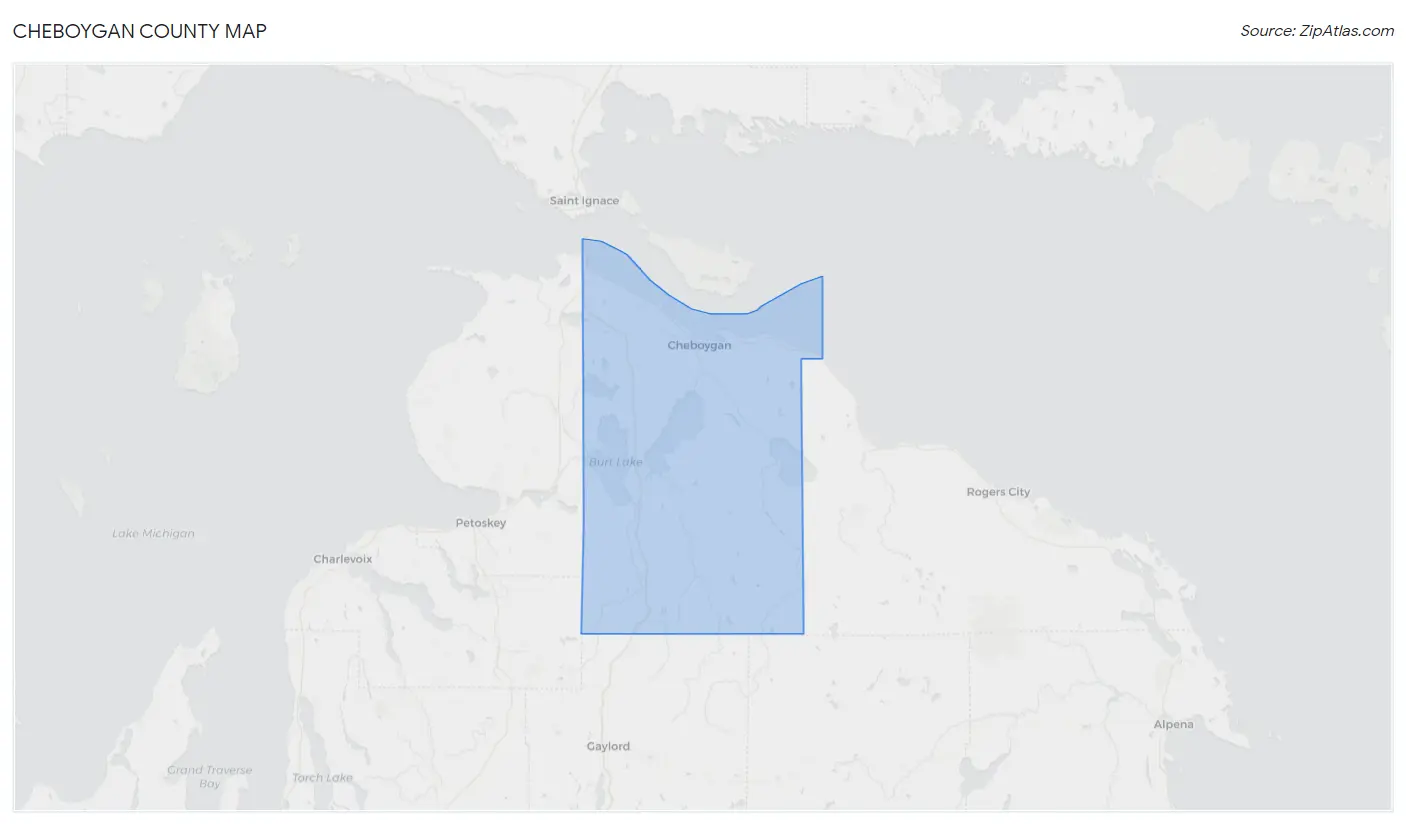
Cheboygan County Map
Cheboygan County Overview
$32,679
PER CAPITA INCOME
$71,685
AVG FAMILY INCOME
$59,557
AVG HOUSEHOLD INCOME
22.7%
WAGE / INCOME GAP [ % ]
77.3¢/ $1
WAGE / INCOME GAP [ $ ]
$8,664
FAMILY INCOME DEFICIT
0.43
INEQUALITY / GINI INDEX
25,709
TOTAL POPULATION
13,072
MALE POPULATION
12,637
FEMALE POPULATION
103.44
MALES / 100 FEMALES
96.67
FEMALES / 100 MALES
52.0
MEDIAN AGE
2.9
AVG FAMILY SIZE
2.4
AVG HOUSEHOLD SIZE
11,234
LABOR FORCE [ PEOPLE ]
50.6%
PERCENT IN LABOR FORCE
7.2%
UNEMPLOYMENT RATE
Income in Cheboygan County
Income Overview in Cheboygan County
Per Capita Income in Cheboygan County is $32,679, while median incomes of families and households are $71,685 and $59,557 respectively.
| Characteristic | Number | Measure |
| Per Capita Income | 25,709 | $32,679 |
| Median Family Income | 6,998 | $71,685 |
| Mean Family Income | 6,998 | $87,123 |
| Median Household Income | 10,650 | $59,557 |
| Mean Household Income | 10,650 | $75,863 |
| Income Deficit | 6,998 | $8,664 |
| Wage / Income Gap (%) | 25,709 | 22.73% |
| Wage / Income Gap ($) | 25,709 | 77.27¢ per $1 |
| Gini / Inequality Index | 25,709 | 0.43 |
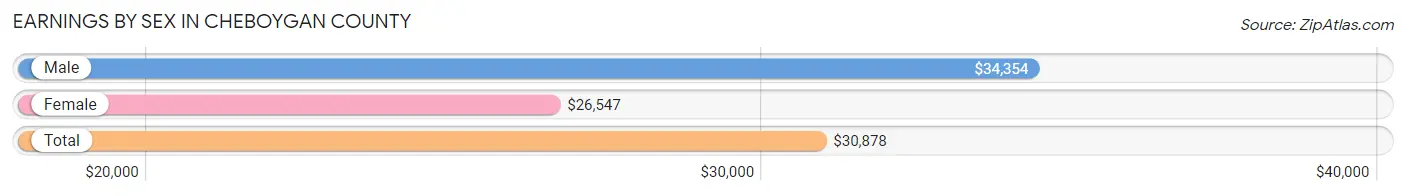
Earnings by Sex in Cheboygan County
Average Earnings in Cheboygan County are $30,878, $34,354 for men and $26,547 for women, a difference of 22.7%.
| Sex | Number | Average Earnings |
| Male | 6,511 (52.4%) | $34,354 |
| Female | 5,903 (47.5%) | $26,547 |
| Total | 12,414 (100.0%) | $30,878 |
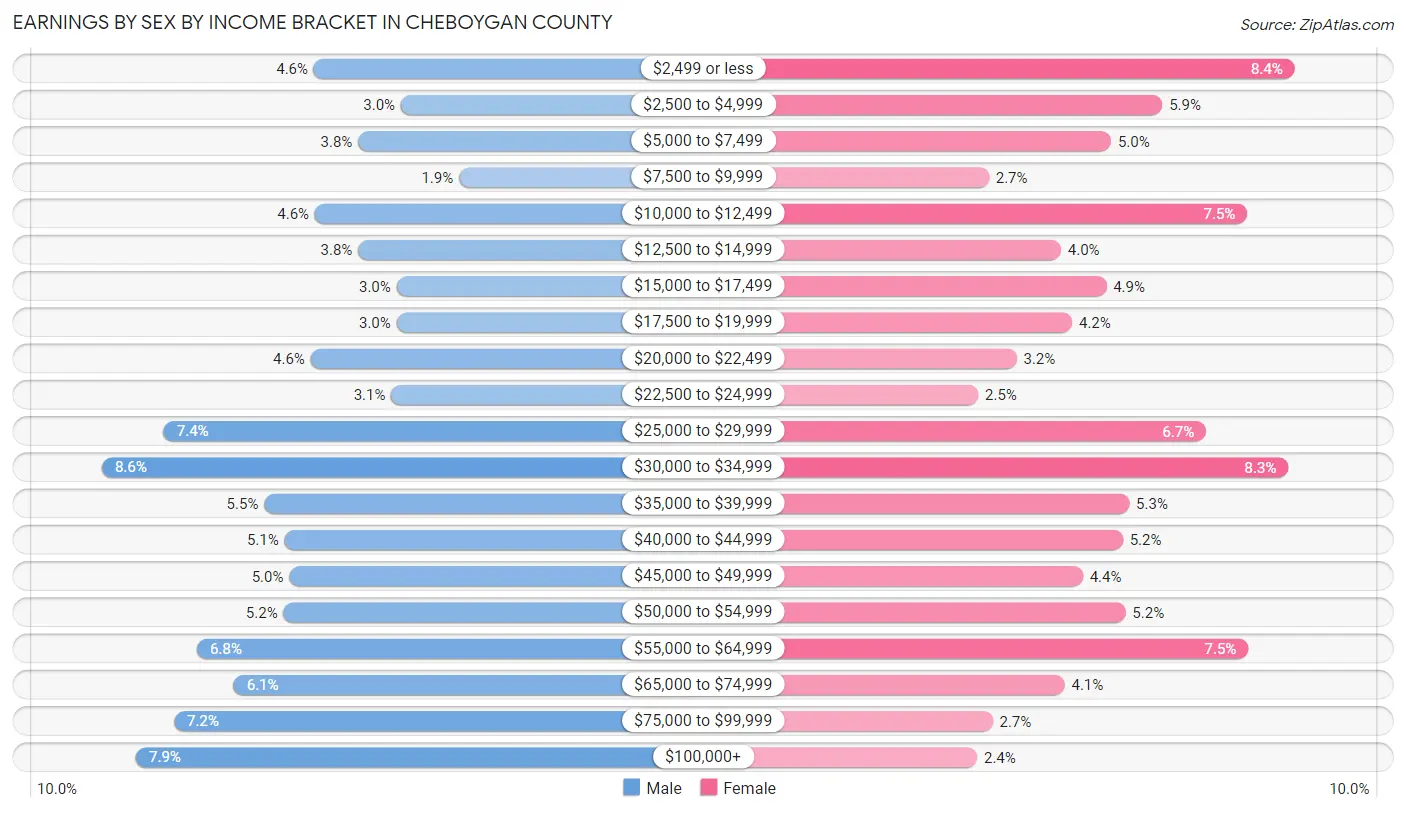
Earnings by Sex by Income Bracket in Cheboygan County
The most common earnings brackets in Cheboygan County are $30,000 to $34,999 for men (557 | 8.6%) and $2,499 or less for women (495 | 8.4%).
| Income | Male | Female |
| $2,499 or less | 298 (4.6%) | 495 (8.4%) |
| $2,500 to $4,999 | 192 (2.9%) | 349 (5.9%) |
| $5,000 to $7,499 | 244 (3.7%) | 292 (5.0%) |
| $7,500 to $9,999 | 121 (1.9%) | 157 (2.7%) |
| $10,000 to $12,499 | 297 (4.6%) | 443 (7.5%) |
| $12,500 to $14,999 | 244 (3.7%) | 237 (4.0%) |
| $15,000 to $17,499 | 197 (3.0%) | 287 (4.9%) |
| $17,500 to $19,999 | 197 (3.0%) | 249 (4.2%) |
| $20,000 to $22,499 | 302 (4.6%) | 188 (3.2%) |
| $22,500 to $24,999 | 204 (3.1%) | 145 (2.5%) |
| $25,000 to $29,999 | 481 (7.4%) | 397 (6.7%) |
| $30,000 to $34,999 | 557 (8.6%) | 488 (8.3%) |
| $35,000 to $39,999 | 359 (5.5%) | 312 (5.3%) |
| $40,000 to $44,999 | 334 (5.1%) | 305 (5.2%) |
| $45,000 to $49,999 | 328 (5.0%) | 261 (4.4%) |
| $50,000 to $54,999 | 335 (5.1%) | 308 (5.2%) |
| $55,000 to $64,999 | 441 (6.8%) | 444 (7.5%) |
| $65,000 to $74,999 | 396 (6.1%) | 241 (4.1%) |
| $75,000 to $99,999 | 469 (7.2%) | 161 (2.7%) |
| $100,000+ | 515 (7.9%) | 144 (2.4%) |
| Total | 6,511 (100.0%) | 5,903 (100.0%) |
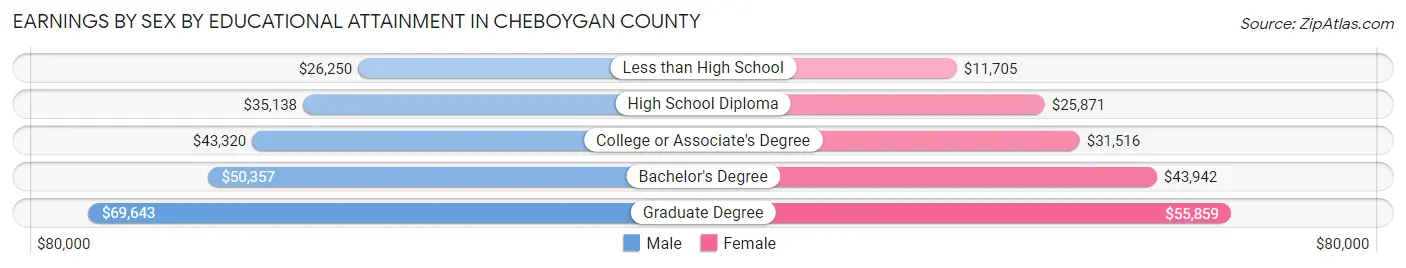
Earnings by Sex by Educational Attainment in Cheboygan County
Average earnings in Cheboygan County are $38,220 for men and $31,009 for women, a difference of 18.9%. Men with an educational attainment of graduate degree enjoy the highest average annual earnings of $69,643, while those with less than high school education earn the least with $26,250. Women with an educational attainment of graduate degree earn the most with the average annual earnings of $55,859, while those with less than high school education have the smallest earnings of $11,705.
| Educational Attainment | Male Income | Female Income |
| Less than High School | $26,250 | $11,705 |
| High School Diploma | $35,138 | $25,871 |
| College or Associate's Degree | $43,320 | $31,516 |
| Bachelor's Degree | $50,357 | $43,942 |
| Graduate Degree | $69,643 | $55,859 |
| Total | $38,220 | $31,009 |
Family Income in Cheboygan County
Family Income Brackets in Cheboygan County
According to the Cheboygan County family income data, there are 1,547 families falling into the $50,000 to $74,999 income range, which is the most common income bracket and makes up 22.1% of all families. Conversely, the $10,000 to $14,999 income bracket is the least frequent group with only 84 families (1.2%) belonging to this category.
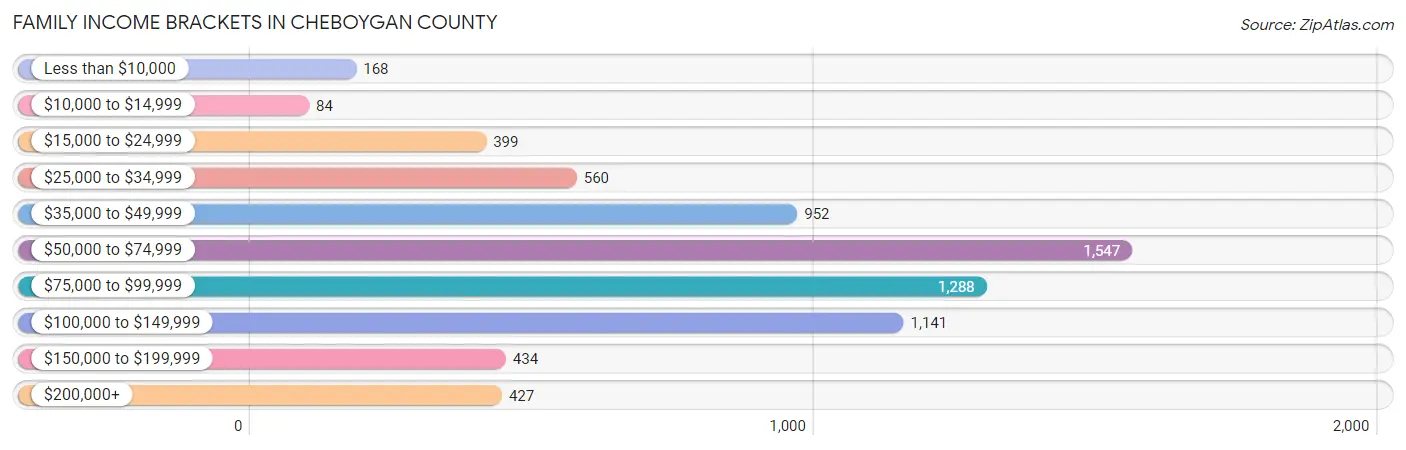
| Income Bracket | # Families | % Families |
| Less than $10,000 | 168 | 2.4% |
| $10,000 to $14,999 | 84 | 1.2% |
| $15,000 to $24,999 | 399 | 5.7% |
| $25,000 to $34,999 | 560 | 8.0% |
| $35,000 to $49,999 | 952 | 13.6% |
| $50,000 to $74,999 | 1,547 | 22.1% |
| $75,000 to $99,999 | 1,288 | 18.4% |
| $100,000 to $149,999 | 1,141 | 16.3% |
| $150,000 to $199,999 | 434 | 6.2% |
| $200,000+ | 427 | 6.1% |
Family Income by Famaliy Size in Cheboygan County
4-person families (940 | 13.4%) account for the highest median family income in Cheboygan County with $86,129 per family, while 2-person families (4,248 | 60.7%) have the highest median income of $32,368 per family member.
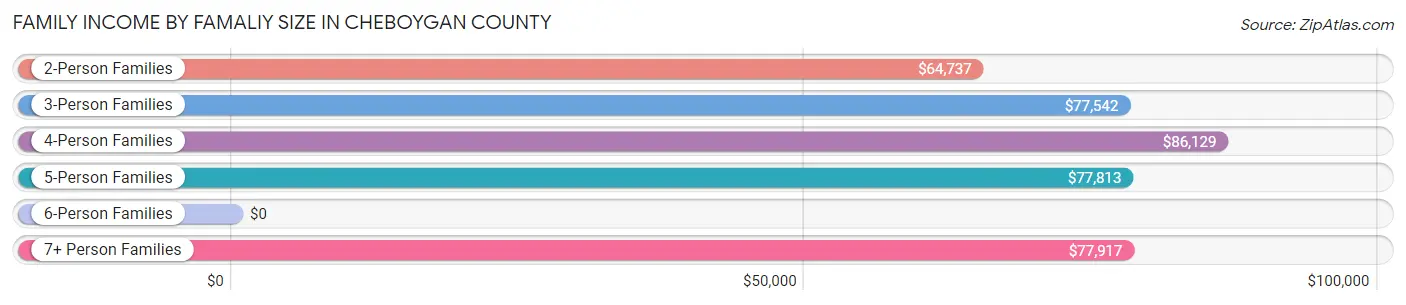
| Income Bracket | # Families | Median Income |
| 2-Person Families | 4,248 (60.7%) | $64,737 |
| 3-Person Families | 1,343 (19.2%) | $77,542 |
| 4-Person Families | 940 (13.4%) | $86,129 |
| 5-Person Families | 275 (3.9%) | $77,813 |
| 6-Person Families | 145 (2.1%) | $0 |
| 7+ Person Families | 47 (0.7%) | $77,917 |
| Total | 6,998 (100.0%) | $71,685 |
Family Income by Number of Earners in Cheboygan County
The median family income in Cheboygan County is $71,685, with families comprising 3+ earners (623) having the highest median family income of $111,250, while families with 1 earner (1,957) have the lowest median family income of $55,281, accounting for 8.9% and 28.0% of families, respectively.
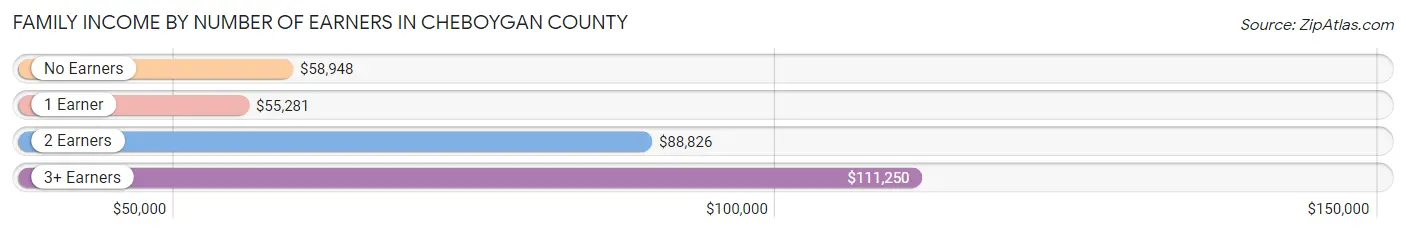
| Number of Earners | # Families | Median Income |
| No Earners | 1,959 (28.0%) | $58,948 |
| 1 Earner | 1,957 (28.0%) | $55,281 |
| 2 Earners | 2,459 (35.1%) | $88,826 |
| 3+ Earners | 623 (8.9%) | $111,250 |
| Total | 6,998 (100.0%) | $71,685 |
Household Income in Cheboygan County
Household Income Brackets in Cheboygan County
With 2,226 households falling in the category, the $50,000 to $74,999 income range is the most frequent in Cheboygan County, accounting for 20.9% of all households. In contrast, only 469 households (4.4%) fall into the less than $10,000 income bracket, making it the least populous group.
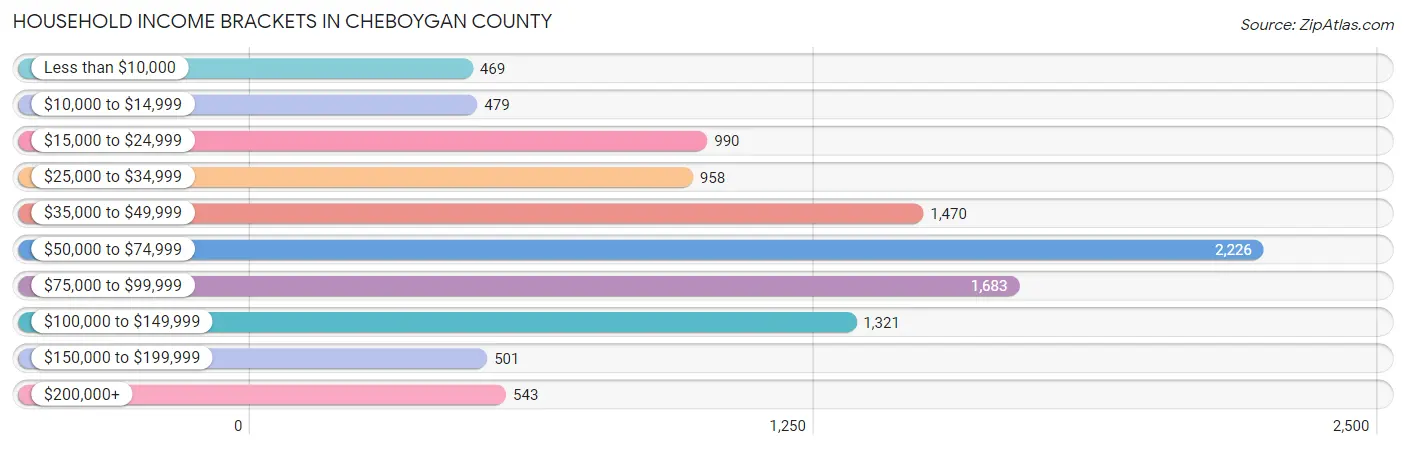
| Income Bracket | # Households | % Households |
| Less than $10,000 | 469 | 4.4% |
| $10,000 to $14,999 | 479 | 4.5% |
| $15,000 to $24,999 | 990 | 9.3% |
| $25,000 to $34,999 | 958 | 9.0% |
| $35,000 to $49,999 | 1,470 | 13.8% |
| $50,000 to $74,999 | 2,226 | 20.9% |
| $75,000 to $99,999 | 1,683 | 15.8% |
| $100,000 to $149,999 | 1,321 | 12.4% |
| $150,000 to $199,999 | 501 | 4.7% |
| $200,000+ | 543 | 5.1% |
Household Income by Householder Age in Cheboygan County
The median household income in Cheboygan County is $59,557, with the highest median household income of $68,475 found in the 45 to 64 years age bracket for the primary householder. A total of 4,091 households (38.4%) fall into this category. Meanwhile, the 15 to 24 years age bracket for the primary householder has the lowest median household income of $46,591, with 142 households (1.3%) in this group.
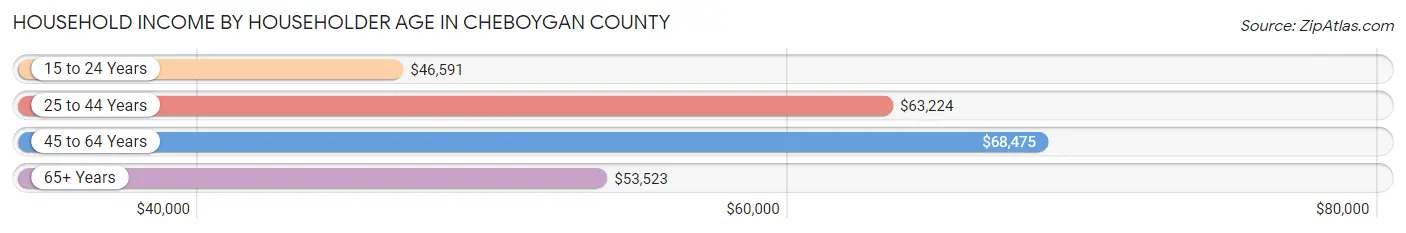
| Income Bracket | # Households | Median Income |
| 15 to 24 Years | 142 (1.3%) | $46,591 |
| 25 to 44 Years | 2,166 (20.3%) | $63,224 |
| 45 to 64 Years | 4,091 (38.4%) | $68,475 |
| 65+ Years | 4,251 (39.9%) | $53,523 |
| Total | 10,650 (100.0%) | $59,557 |
Poverty in Cheboygan County
Income Below Poverty by Sex and Age in Cheboygan County
With 10.7% poverty level for males and 13.2% for females among the residents of Cheboygan County, 15 year old males and 15 year old females are the most vulnerable to poverty, with 64 males (37.9%) and 46 females (41.4%) in their respective age groups living below the poverty level.
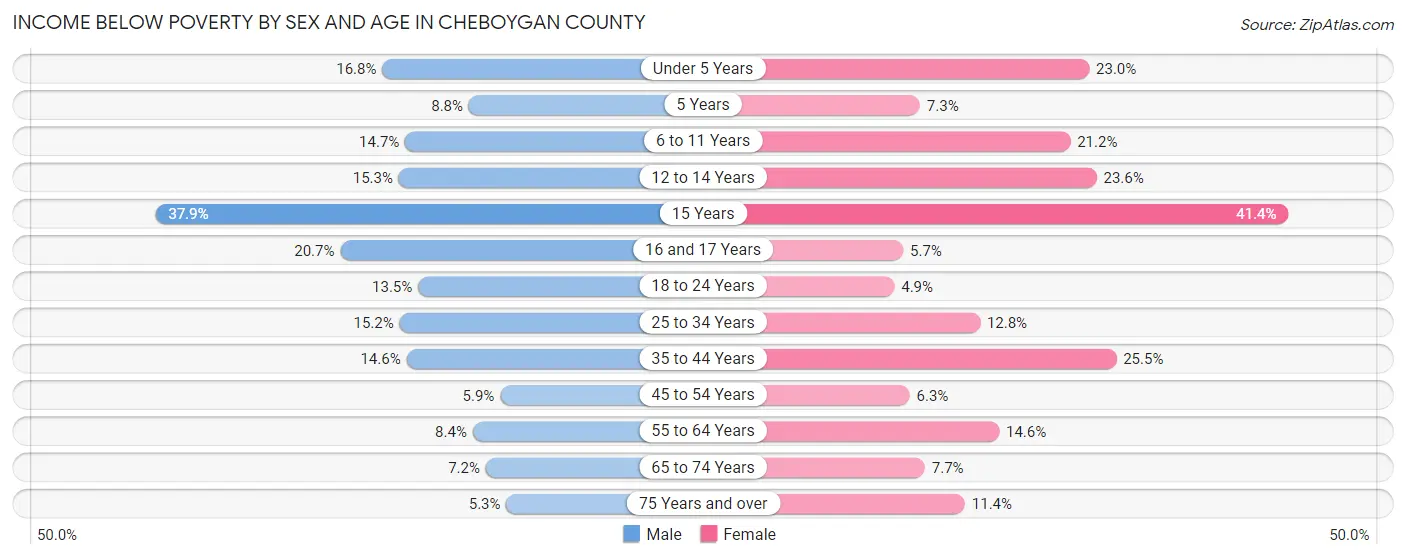
| Age Bracket | Male | Female |
| Under 5 Years | 86 (16.8%) | 109 (23.0%) |
| 5 Years | 10 (8.8%) | 5 (7.2%) |
| 6 to 11 Years | 95 (14.7%) | 127 (21.2%) |
| 12 to 14 Years | 62 (15.3%) | 78 (23.6%) |
| 15 Years | 64 (37.9%) | 46 (41.4%) |
| 16 and 17 Years | 53 (20.7%) | 16 (5.7%) |
| 18 to 24 Years | 125 (13.5%) | 37 (4.9%) |
| 25 to 34 Years | 188 (15.2%) | 156 (12.8%) |
| 35 to 44 Years | 189 (14.6%) | 314 (25.5%) |
| 45 to 54 Years | 95 (5.9%) | 99 (6.3%) |
| 55 to 64 Years | 183 (8.4%) | 331 (14.6%) |
| 65 to 74 Years | 158 (7.2%) | 168 (7.7%) |
| 75 Years and over | 69 (5.3%) | 166 (11.4%) |
| Total | 1,377 (10.7%) | 1,652 (13.2%) |
Income Above Poverty by Sex and Age in Cheboygan County
According to the poverty statistics in Cheboygan County, males aged 75 years and over and females aged 18 to 24 years are the age groups that are most secure financially, with 94.7% of males and 95.1% of females in these age groups living above the poverty line.
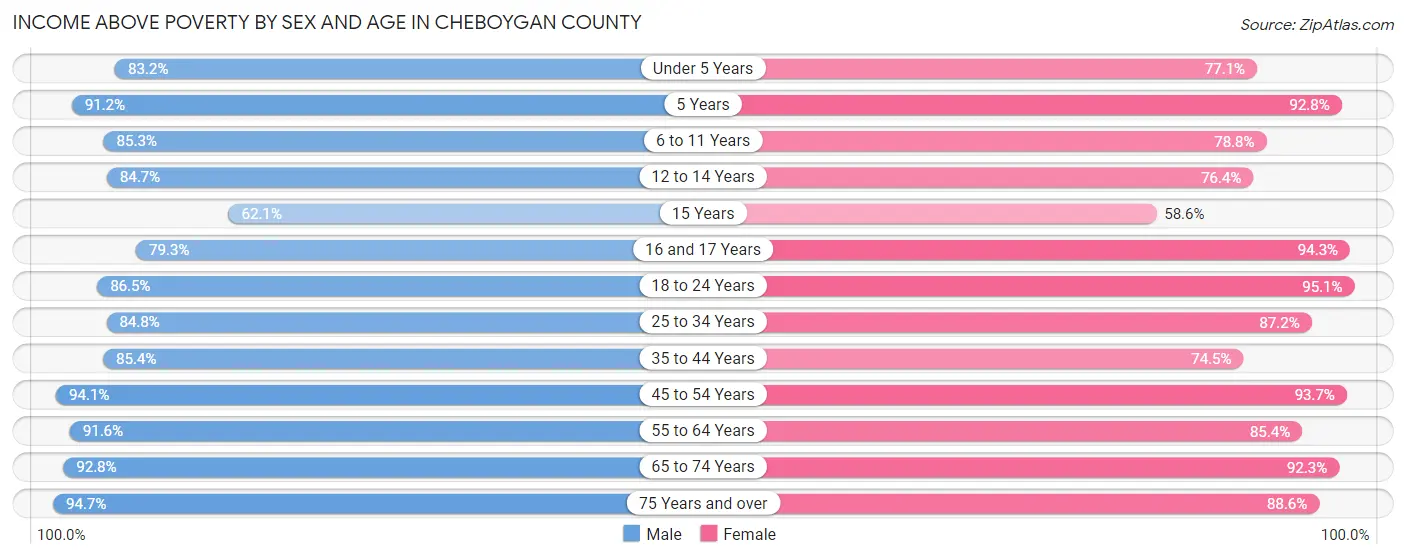
| Age Bracket | Male | Female |
| Under 5 Years | 426 (83.2%) | 366 (77.0%) |
| 5 Years | 104 (91.2%) | 64 (92.7%) |
| 6 to 11 Years | 552 (85.3%) | 472 (78.8%) |
| 12 to 14 Years | 344 (84.7%) | 252 (76.4%) |
| 15 Years | 105 (62.1%) | 65 (58.6%) |
| 16 and 17 Years | 203 (79.3%) | 265 (94.3%) |
| 18 to 24 Years | 802 (86.5%) | 723 (95.1%) |
| 25 to 34 Years | 1,049 (84.8%) | 1,061 (87.2%) |
| 35 to 44 Years | 1,109 (85.4%) | 919 (74.5%) |
| 45 to 54 Years | 1,527 (94.1%) | 1,475 (93.7%) |
| 55 to 64 Years | 1,993 (91.6%) | 1,937 (85.4%) |
| 65 to 74 Years | 2,037 (92.8%) | 2,011 (92.3%) |
| 75 Years and over | 1,235 (94.7%) | 1,288 (88.6%) |
| Total | 11,486 (89.3%) | 10,898 (86.8%) |
Income Below Poverty Among Married-Couple Families in Cheboygan County
The poverty statistics for married-couple families in Cheboygan County show that 5.4% or 312 of the total 5,757 families live below the poverty line. Families with 5 or more children have the highest poverty rate of 36.4%, comprising of 4 families. On the other hand, families with no children have the lowest poverty rate of 3.8%, which includes 157 families.
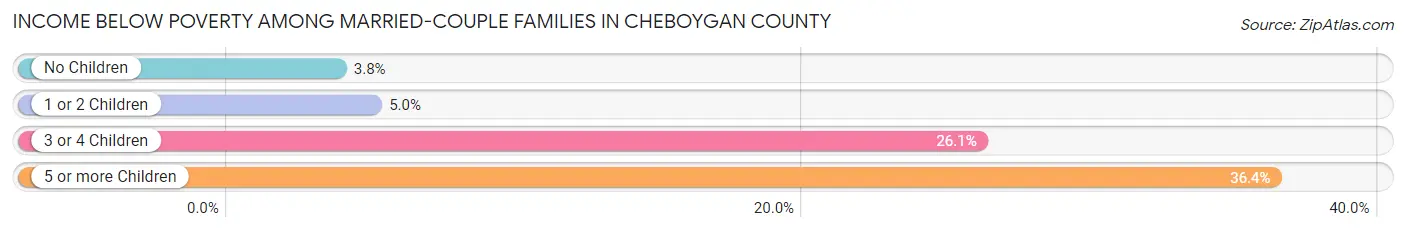
| Children | Above Poverty | Below Poverty |
| No Children | 3,982 (96.2%) | 157 (3.8%) |
| 1 or 2 Children | 1,210 (95.0%) | 64 (5.0%) |
| 3 or 4 Children | 246 (73.9%) | 87 (26.1%) |
| 5 or more Children | 7 (63.6%) | 4 (36.4%) |
| Total | 5,445 (94.6%) | 312 (5.4%) |
Income Below Poverty Among Single-Parent Households in Cheboygan County
According to the poverty data in Cheboygan County, 6.2% or 30 single-father households and 23.6% or 179 single-mother households are living below the poverty line. Among single-father households, those with 1 or 2 children have the highest poverty rate, with 16 households (8.8%) experiencing poverty. Likewise, among single-mother households, those with 3 or 4 children have the highest poverty rate, with 11 households (37.9%) falling below the poverty line.

| Children | Single Father | Single Mother |
| No Children | 13 (4.6%) | 88 (19.5%) |
| 1 or 2 Children | 16 (8.8%) | 80 (28.9%) |
| 3 or 4 Children | 1 (5.6%) | 11 (37.9%) |
| 5 or more Children | 0 (0.0%) | 0 (0.0%) |
| Total | 30 (6.2%) | 179 (23.6%) |
Income Below Poverty Among Married-Couple vs Single-Parent Households in Cheboygan County
The poverty data for Cheboygan County shows that 312 of the married-couple family households (5.4%) and 209 of the single-parent households (16.8%) are living below the poverty level. Within the married-couple family households, those with 5 or more children have the highest poverty rate, with 4 households (36.4%) falling below the poverty line. Among the single-parent households, those with 3 or 4 children have the highest poverty rate, with 12 household (25.5%) living below poverty.
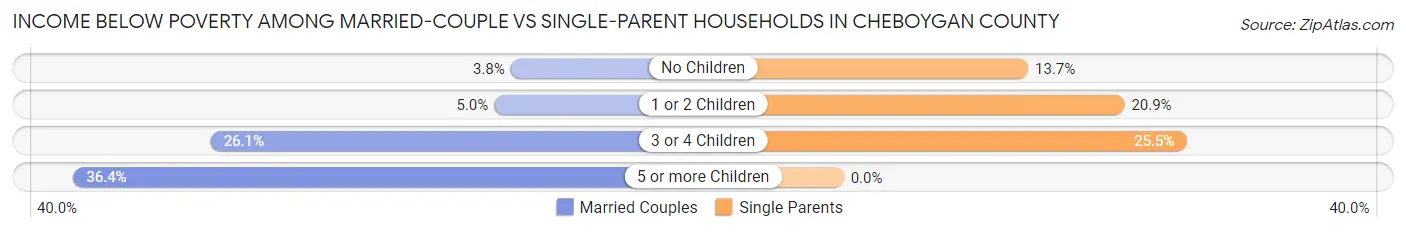
| Children | Married-Couple Families | Single-Parent Households |
| No Children | 157 (3.8%) | 101 (13.7%) |
| 1 or 2 Children | 64 (5.0%) | 96 (20.9%) |
| 3 or 4 Children | 87 (26.1%) | 12 (25.5%) |
| 5 or more Children | 4 (36.4%) | 0 (0.0%) |
| Total | 312 (5.4%) | 209 (16.8%) |
Race in Cheboygan County
The most populous races in Cheboygan County are White / Caucasian (23,474 | 91.3%), Two or more Races (1,313 | 5.1%), and Native / Alaskan (486 | 1.9%).
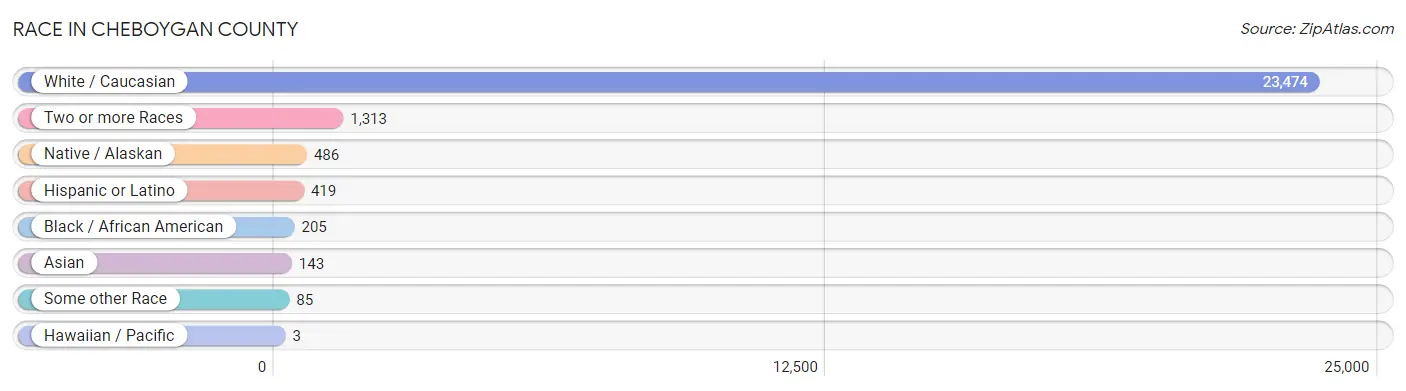
| Race | # Population | % Population |
| Asian | 143 | 0.6% |
| Black / African American | 205 | 0.8% |
| Hawaiian / Pacific | 3 | 0.0% |
| Hispanic or Latino | 419 | 1.6% |
| Native / Alaskan | 486 | 1.9% |
| White / Caucasian | 23,474 | 91.3% |
| Two or more Races | 1,313 | 5.1% |
| Some other Race | 85 | 0.3% |
| Total | 25,709 | 100.0% |
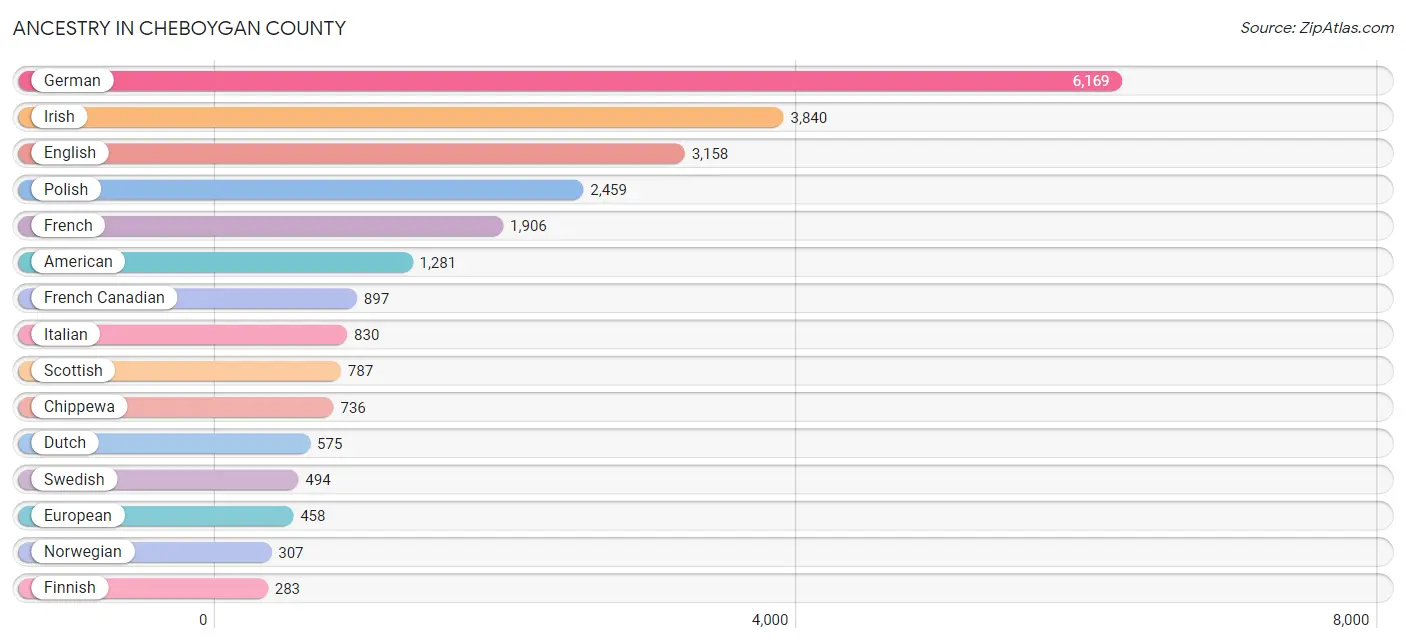
Ancestry in Cheboygan County
The most populous ancestries reported in Cheboygan County are German (6,169 | 24.0%), Irish (3,840 | 14.9%), English (3,158 | 12.3%), Polish (2,459 | 9.6%), and French (1,906 | 7.4%), together accounting for 68.2% of all Cheboygan County residents.
| Ancestry | # Population | % Population |
| African | 35 | 0.1% |
| American | 1,281 | 5.0% |
| Apache | 12 | 0.1% |
| Arab | 129 | 0.5% |
| Armenian | 35 | 0.1% |
| Assyrian / Chaldean / Syriac | 50 | 0.2% |
| Austrian | 39 | 0.2% |
| Bangladeshi | 3 | 0.0% |
| Belgian | 38 | 0.2% |
| Blackfeet | 26 | 0.1% |
| Bolivian | 3 | 0.0% |
| British | 96 | 0.4% |
| Burmese | 13 | 0.1% |
| Canadian | 120 | 0.5% |
| Central American | 2 | 0.0% |
| Central American Indian | 15 | 0.1% |
| Cherokee | 26 | 0.1% |
| Chickasaw | 6 | 0.0% |
| Chippewa | 736 | 2.9% |
| Choctaw | 8 | 0.0% |
| Croatian | 24 | 0.1% |
| Cuban | 16 | 0.1% |
| Czech | 102 | 0.4% |
| Czechoslovakian | 23 | 0.1% |
| Danish | 108 | 0.4% |
| Dutch | 575 | 2.2% |
| Eastern European | 46 | 0.2% |
| English | 3,158 | 12.3% |
| European | 458 | 1.8% |
| Finnish | 283 | 1.1% |
| French | 1,906 | 7.4% |
| French American Indian | 40 | 0.2% |
| French Canadian | 897 | 3.5% |
| German | 6,169 | 24.0% |
| Greek | 75 | 0.3% |
| Guatemalan | 2 | 0.0% |
| Hungarian | 177 | 0.7% |
| Icelander | 4 | 0.0% |
| Indian (Asian) | 11 | 0.0% |
| Irish | 3,840 | 14.9% |
| Iroquois | 3 | 0.0% |
| Italian | 830 | 3.2% |
| Jamaican | 64 | 0.3% |
| Korean | 49 | 0.2% |
| Latvian | 23 | 0.1% |
| Lebanese | 73 | 0.3% |
| Lithuanian | 27 | 0.1% |
| Luxembourger | 2 | 0.0% |
| Maltese | 2 | 0.0% |
| Mexican | 244 | 0.9% |
| Mexican American Indian | 1 | 0.0% |
| Native Hawaiian | 1 | 0.0% |
| Navajo | 10 | 0.0% |
| Northern European | 8 | 0.0% |
| Norwegian | 307 | 1.2% |
| Ottawa | 85 | 0.3% |
| Pakistani | 3 | 0.0% |
| Pennsylvania German | 18 | 0.1% |
| Peruvian | 20 | 0.1% |
| Polish | 2,459 | 9.6% |
| Portuguese | 2 | 0.0% |
| Potawatomi | 20 | 0.1% |
| Puerto Rican | 65 | 0.3% |
| Romanian | 95 | 0.4% |
| Russian | 82 | 0.3% |
| Scandinavian | 105 | 0.4% |
| Scotch-Irish | 169 | 0.7% |
| Scottish | 787 | 3.1% |
| Serbian | 13 | 0.1% |
| Slavic | 11 | 0.0% |
| Slovak | 36 | 0.1% |
| Slovene | 14 | 0.1% |
| South American | 23 | 0.1% |
| South American Indian | 44 | 0.2% |
| Subsaharan African | 48 | 0.2% |
| Swedish | 494 | 1.9% |
| Swiss | 52 | 0.2% |
| Syrian | 53 | 0.2% |
| Thai | 89 | 0.4% |
| Tlingit-Haida | 15 | 0.1% |
| Ukrainian | 64 | 0.3% |
| Welsh | 232 | 0.9% | View All 82 Rows |
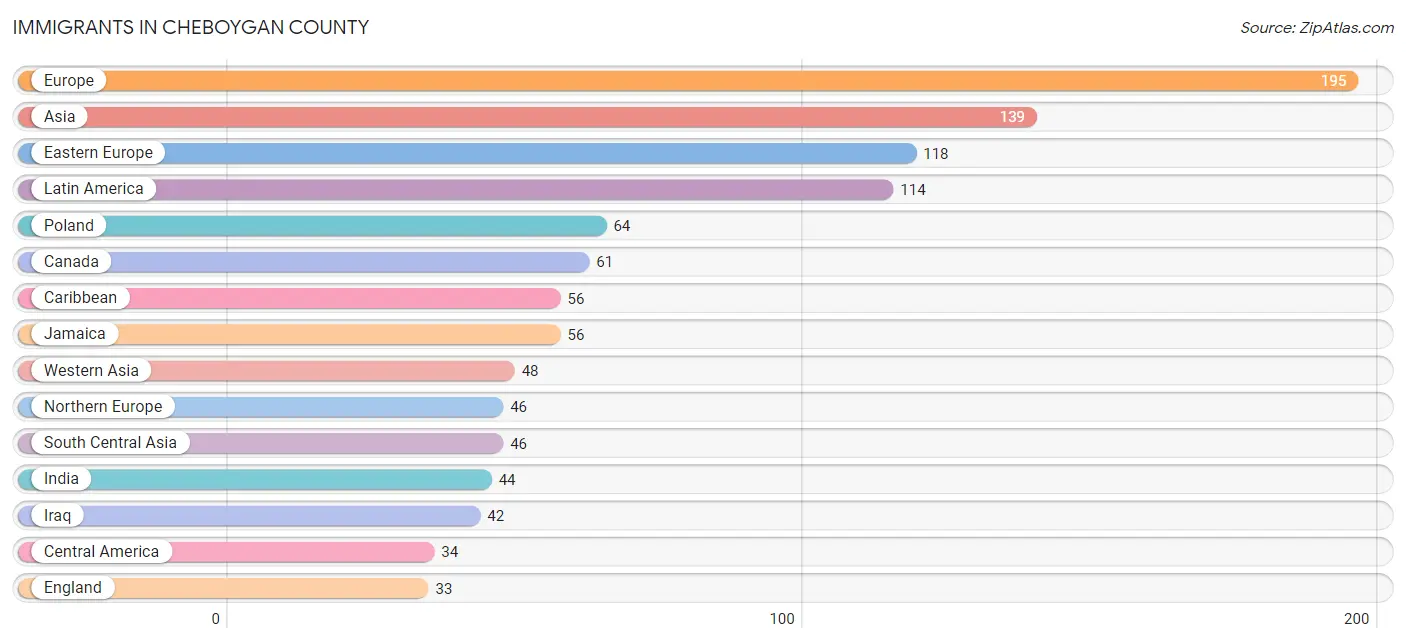
Immigrants in Cheboygan County
The most numerous immigrant groups reported in Cheboygan County came from Europe (195 | 0.8%), Asia (139 | 0.5%), Eastern Europe (118 | 0.5%), Latin America (114 | 0.4%), and Poland (64 | 0.3%), together accounting for 2.5% of all Cheboygan County residents.
| Immigration Origin | # Population | % Population |
| Africa | 19 | 0.1% |
| Asia | 139 | 0.5% |
| Belarus | 17 | 0.1% |
| Bolivia | 2 | 0.0% |
| Canada | 61 | 0.2% |
| Caribbean | 56 | 0.2% |
| Central America | 34 | 0.1% |
| China | 1 | 0.0% |
| Denmark | 2 | 0.0% |
| Eastern Africa | 1 | 0.0% |
| Eastern Asia | 12 | 0.1% |
| Eastern Europe | 118 | 0.5% |
| Ecuador | 2 | 0.0% |
| England | 33 | 0.1% |
| Europe | 195 | 0.8% |
| Germany | 28 | 0.1% |
| Guatemala | 2 | 0.0% |
| India | 44 | 0.2% |
| Iraq | 42 | 0.2% |
| Jamaica | 56 | 0.2% |
| Japan | 1 | 0.0% |
| Korea | 10 | 0.0% |
| Latin America | 114 | 0.4% |
| Latvia | 23 | 0.1% |
| Lebanon | 6 | 0.0% |
| Mexico | 32 | 0.1% |
| Middle Africa | 13 | 0.1% |
| Morocco | 5 | 0.0% |
| Netherlands | 3 | 0.0% |
| Northern Africa | 5 | 0.0% |
| Northern Europe | 46 | 0.2% |
| Pakistan | 2 | 0.0% |
| Peru | 20 | 0.1% |
| Philippines | 30 | 0.1% |
| Poland | 64 | 0.3% |
| South America | 24 | 0.1% |
| South Central Asia | 46 | 0.2% |
| South Eastern Asia | 33 | 0.1% |
| Sweden | 1 | 0.0% |
| Taiwan | 1 | 0.0% |
| Thailand | 3 | 0.0% |
| Ukraine | 12 | 0.1% |
| Western Asia | 48 | 0.2% |
| Western Europe | 31 | 0.1% | View All 44 Rows |
Sex and Age in Cheboygan County
Sex and Age in Cheboygan County
The most populous age groups in Cheboygan County are 60 to 64 Years (1,229 | 9.4%) for men and 60 to 64 Years (1,248 | 9.9%) for women.
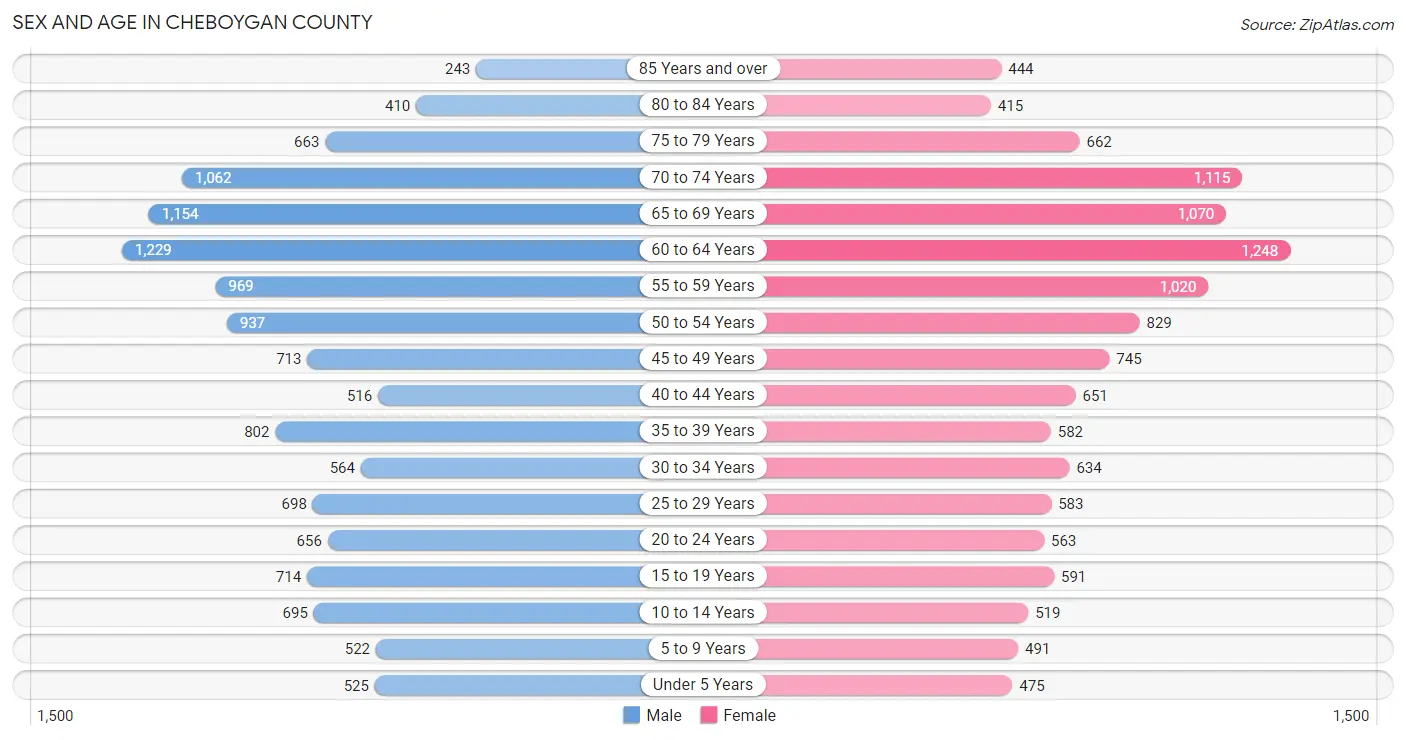
| Age Bracket | Male | Female |
| Under 5 Years | 525 (4.0%) | 475 (3.8%) |
| 5 to 9 Years | 522 (4.0%) | 491 (3.9%) |
| 10 to 14 Years | 695 (5.3%) | 519 (4.1%) |
| 15 to 19 Years | 714 (5.5%) | 591 (4.7%) |
| 20 to 24 Years | 656 (5.0%) | 563 (4.5%) |
| 25 to 29 Years | 698 (5.3%) | 583 (4.6%) |
| 30 to 34 Years | 564 (4.3%) | 634 (5.0%) |
| 35 to 39 Years | 802 (6.1%) | 582 (4.6%) |
| 40 to 44 Years | 516 (4.0%) | 651 (5.1%) |
| 45 to 49 Years | 713 (5.4%) | 745 (5.9%) |
| 50 to 54 Years | 937 (7.2%) | 829 (6.6%) |
| 55 to 59 Years | 969 (7.4%) | 1,020 (8.1%) |
| 60 to 64 Years | 1,229 (9.4%) | 1,248 (9.9%) |
| 65 to 69 Years | 1,154 (8.8%) | 1,070 (8.5%) |
| 70 to 74 Years | 1,062 (8.1%) | 1,115 (8.8%) |
| 75 to 79 Years | 663 (5.1%) | 662 (5.2%) |
| 80 to 84 Years | 410 (3.1%) | 415 (3.3%) |
| 85 Years and over | 243 (1.9%) | 444 (3.5%) |
| Total | 13,072 (100.0%) | 12,637 (100.0%) |
Families and Households in Cheboygan County
Median Family Size in Cheboygan County
The median family size in Cheboygan County is 2.91 persons per family, with single female/mother families (757 | 10.8%) accounting for the largest median family size of 3.3 persons per family. On the other hand, married-couple families (5,757 | 82.3%) represent the smallest median family size with 2.84 persons per family.
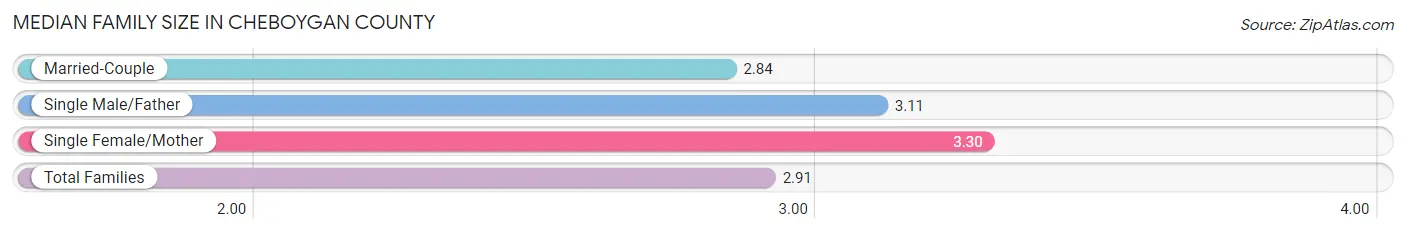
| Family Type | # Families | Family Size |
| Married-Couple | 5,757 (82.3%) | 2.84 |
| Single Male/Father | 484 (6.9%) | 3.11 |
| Single Female/Mother | 757 (10.8%) | 3.30 |
| Total Families | 6,998 (100.0%) | 2.91 |
Median Household Size in Cheboygan County
The median household size in Cheboygan County is 2.39 persons per household, with single female/mother households (757 | 7.1%) accounting for the largest median household size of 3.5 persons per household. non-family households (3,652 | 34.3%) represent the smallest median household size with 1.27 persons per household.
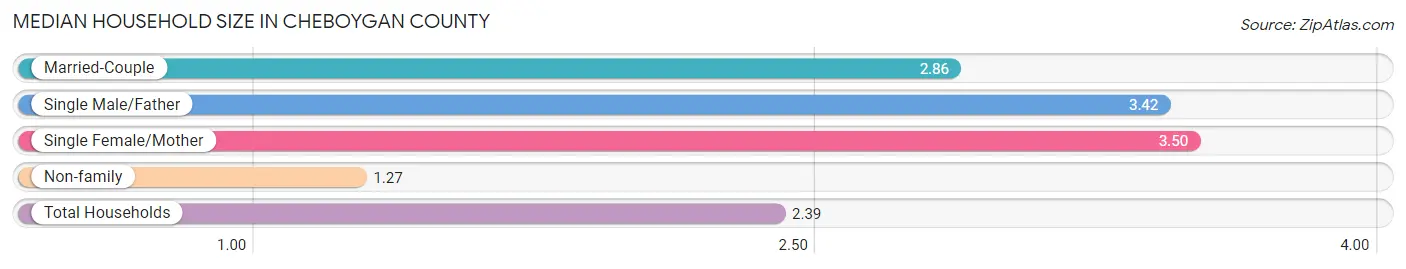
| Household Type | # Households | Household Size |
| Married-Couple | 5,757 (54.1%) | 2.86 |
| Single Male/Father | 484 (4.5%) | 3.42 |
| Single Female/Mother | 757 (7.1%) | 3.50 |
| Non-family | 3,652 (34.3%) | 1.27 |
| Total Households | 10,650 (100.0%) | 2.39 |
Household Size by Marriage Status in Cheboygan County
Out of a total of 10,650 households in Cheboygan County, 6,998 (65.7%) are family households, while 3,652 (34.3%) are nonfamily households. The most numerous type of family households are 2-person households, comprising 4,139, and the most common type of nonfamily households are 1-person households, comprising 3,033.
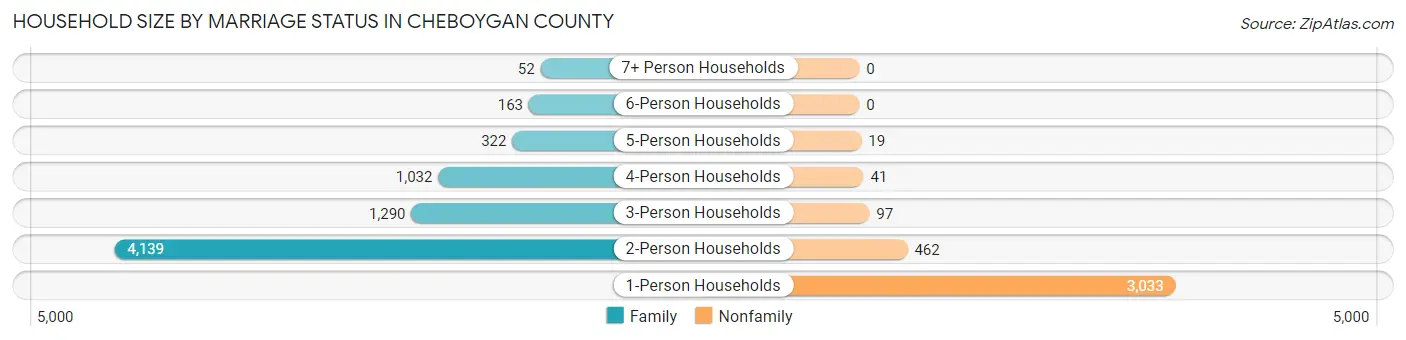
| Household Size | Family Households | Nonfamily Households |
| 1-Person Households | - | 3,033 (28.5%) |
| 2-Person Households | 4,139 (38.9%) | 462 (4.3%) |
| 3-Person Households | 1,290 (12.1%) | 97 (0.9%) |
| 4-Person Households | 1,032 (9.7%) | 41 (0.4%) |
| 5-Person Households | 322 (3.0%) | 19 (0.2%) |
| 6-Person Households | 163 (1.5%) | 0 (0.0%) |
| 7+ Person Households | 52 (0.5%) | 0 (0.0%) |
| Total | 6,998 (65.7%) | 3,652 (34.3%) |
Female Fertility in Cheboygan County
Fertility by Age in Cheboygan County
Average fertility rate in Cheboygan County is 39.0 births per 1,000 women. Women in the age bracket of 20 to 34 years have the highest fertility rate with 92.0 births per 1,000 women. Women in the age bracket of 20 to 34 years acount for 92.7% of all women with births.
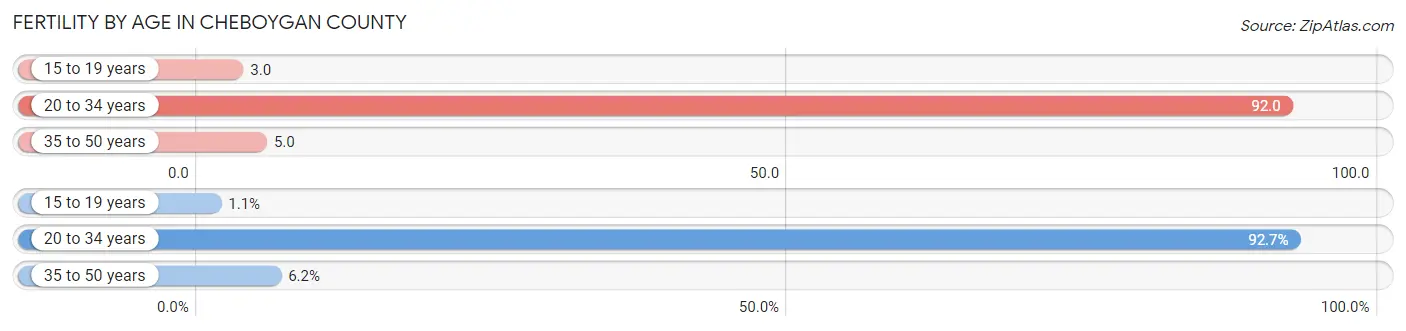
| Age Bracket | Women with Births | Births / 1,000 Women |
| 15 to 19 years | 2 (1.1%) | 3.0 |
| 20 to 34 years | 164 (92.7%) | 92.0 |
| 35 to 50 years | 11 (6.2%) | 5.0 |
| Total | 177 (100.0%) | 39.0 |
Fertility by Age by Marriage Status in Cheboygan County
71.8% of women with births (177) in Cheboygan County are married. The highest percentage of unmarried women with births falls into 15 to 19 years age bracket with 100.0% of them unmarried at the time of birth, while the lowest percentage of unmarried women with births belong to 35 to 50 years age bracket with 0.0% of them unmarried.
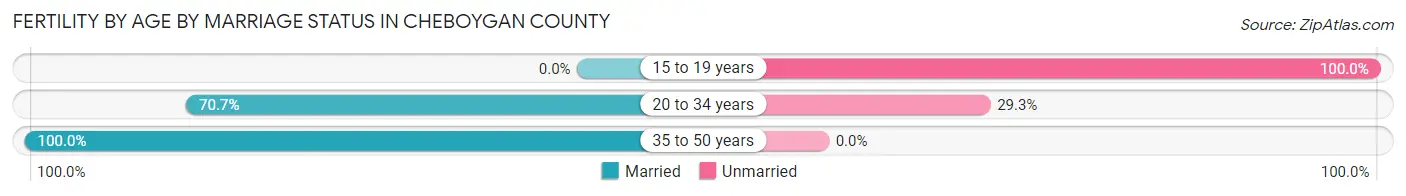
| Age Bracket | Married | Unmarried |
| 15 to 19 years | 0 (0.0%) | 2 (100.0%) |
| 20 to 34 years | 116 (70.7%) | 48 (29.3%) |
| 35 to 50 years | 11 (100.0%) | 0 (0.0%) |
| Total | 127 (71.8%) | 50 (28.2%) |
Fertility by Education in Cheboygan County
Average fertility rate in Cheboygan County is 39.0 births per 1,000 women. Women with the education attainment of bachelor's degree have the highest fertility rate of 96.0 births per 1,000 women, while women with the education attainment of less than high school have the lowest fertility at 3.0 births per 1,000 women. Women with the education attainment of bachelor's degree represent 42.9% of all women with births.
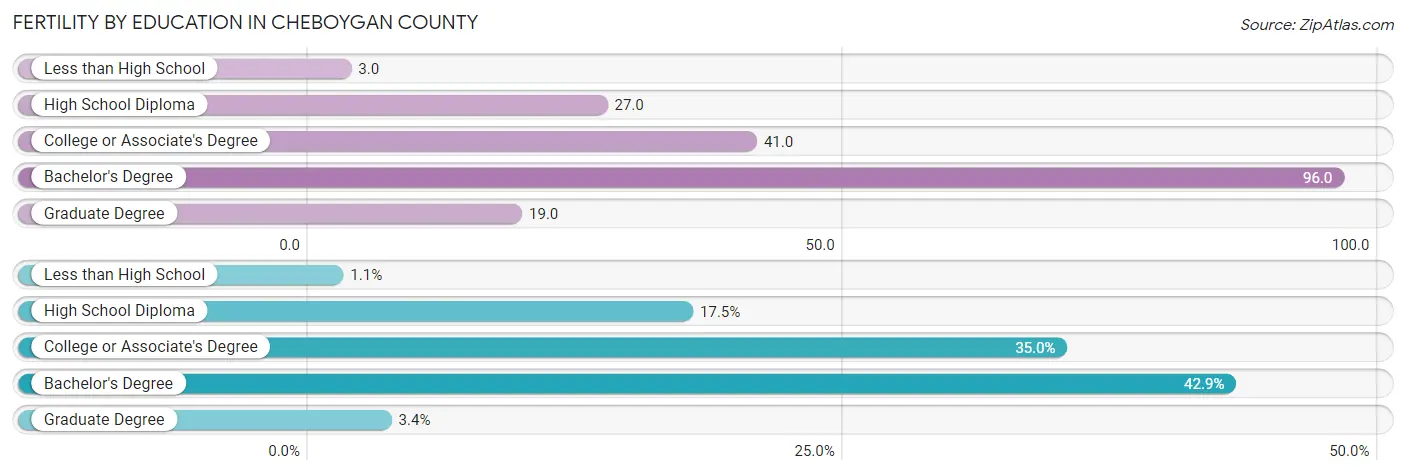
| Educational Attainment | Women with Births | Births / 1,000 Women |
| Less than High School | 2 (1.1%) | 3.0 |
| High School Diploma | 31 (17.5%) | 27.0 |
| College or Associate's Degree | 62 (35.0%) | 41.0 |
| Bachelor's Degree | 76 (42.9%) | 96.0 |
| Graduate Degree | 6 (3.4%) | 19.0 |
| Total | 177 (100.0%) | 39.0 |
Fertility by Education by Marriage Status in Cheboygan County
28.2% of women with births in Cheboygan County are unmarried. Women with the educational attainment of graduate degree are most likely to be married with 100.0% of them married at childbirth, while women with the educational attainment of less than high school are least likely to be married with 100.0% of them unmarried at childbirth.
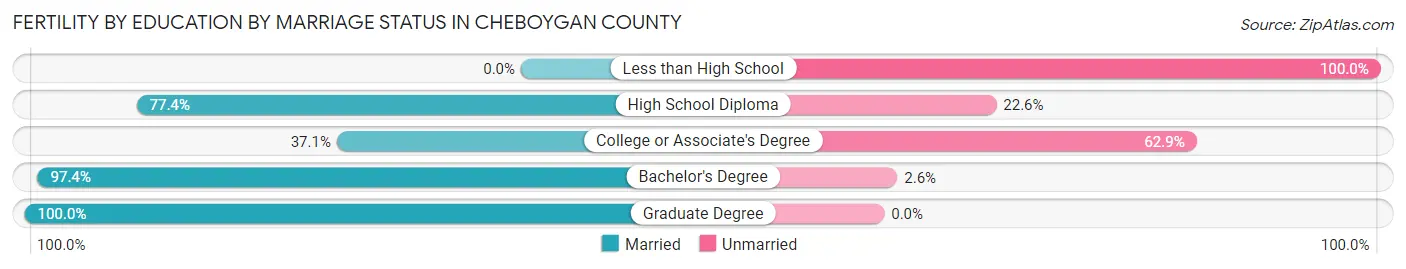
| Educational Attainment | Married | Unmarried |
| Less than High School | 0 (0.0%) | 2 (100.0%) |
| High School Diploma | 24 (77.4%) | 7 (22.6%) |
| College or Associate's Degree | 23 (37.1%) | 39 (62.9%) |
| Bachelor's Degree | 74 (97.4%) | 2 (2.6%) |
| Graduate Degree | 6 (100.0%) | 0 (0.0%) |
| Total | 127 (71.8%) | 50 (28.2%) |
Employment Characteristics in Cheboygan County
Employment by Class of Employer in Cheboygan County
Among the 10,225 employed individuals in Cheboygan County, private company employees (6,756 | 66.1%), not-for-profit organizations (773 | 7.6%), and local government employees (738 | 7.2%) make up the most common classes of employment.
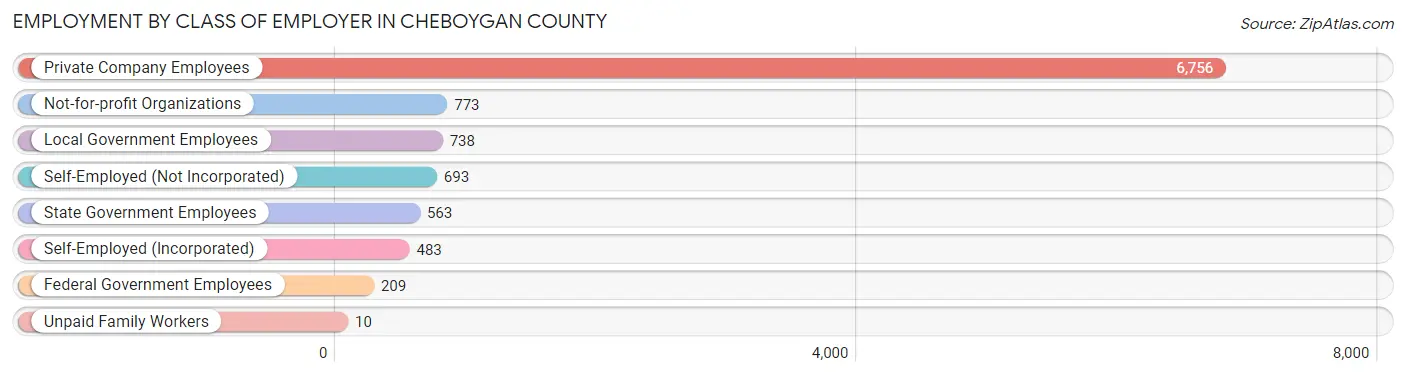
| Employer Class | # Employees | % Employees |
| Private Company Employees | 6,756 | 66.1% |
| Self-Employed (Incorporated) | 483 | 4.7% |
| Self-Employed (Not Incorporated) | 693 | 6.8% |
| Not-for-profit Organizations | 773 | 7.6% |
| Local Government Employees | 738 | 7.2% |
| State Government Employees | 563 | 5.5% |
| Federal Government Employees | 209 | 2.0% |
| Unpaid Family Workers | 10 | 0.1% |
| Total | 10,225 | 100.0% |
Employment Status by Age in Cheboygan County
According to the labor force statistics for Cheboygan County, out of the total population over 16 years of age (22,202), 50.6% or 11,234 individuals are in the labor force, with 7.2% or 809 of them unemployed. The age group with the highest labor force participation rate is 30 to 34 years, with 80.8% or 968 individuals in the labor force. Within the labor force, the 25 to 29 years age range has the highest percentage of unemployed individuals, with 9.4% or 95 of them being unemployed.
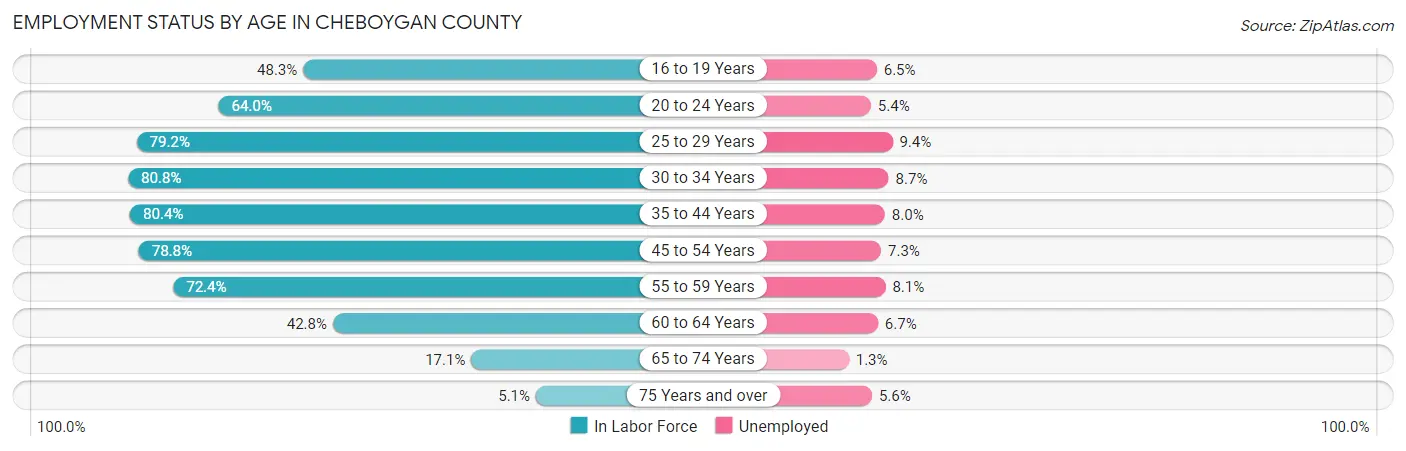
| Age Bracket | In Labor Force | Unemployed |
| 16 to 19 Years | 495 (48.3%) | 32 (6.5%) |
| 20 to 24 Years | 780 (64.0%) | 42 (5.4%) |
| 25 to 29 Years | 1,015 (79.2%) | 95 (9.4%) |
| 30 to 34 Years | 968 (80.8%) | 84 (8.7%) |
| 35 to 44 Years | 2,051 (80.4%) | 164 (8.0%) |
| 45 to 54 Years | 2,541 (78.8%) | 185 (7.3%) |
| 55 to 59 Years | 1,440 (72.4%) | 117 (8.1%) |
| 60 to 64 Years | 1,060 (42.8%) | 71 (6.7%) |
| 65 to 74 Years | 753 (17.1%) | 10 (1.3%) |
| 75 Years and over | 145 (5.1%) | 8 (5.6%) |
| Total | 11,234 (50.6%) | 809 (7.2%) |
Employment Status by Educational Attainment in Cheboygan County
According to labor force statistics for Cheboygan County, 71.3% of individuals (9,069) out of the total population between 25 and 64 years of age (12,720) are in the labor force, with 7.9% or 716 of them being unemployed. The group with the highest labor force participation rate are those with the educational attainment of college / associate degree, with 78.2% or 3,424 individuals in the labor force. Within the labor force, individuals with less than high school education have the highest percentage of unemployment, with 15.0% or 108 of them being unemployed.
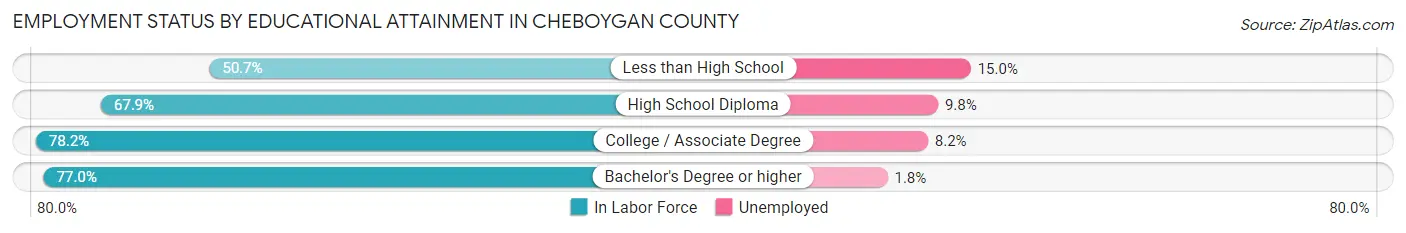
| Educational Attainment | In Labor Force | Unemployed |
| Less than High School | 722 (50.7%) | 214 (15.0%) |
| High School Diploma | 2,988 (67.9%) | 431 (9.8%) |
| College / Associate Degree | 3,424 (78.2%) | 359 (8.2%) |
| Bachelor's Degree or higher | 1,937 (77.0%) | 45 (1.8%) |
| Total | 9,069 (71.3%) | 1,005 (7.9%) |
Employment Occupations by Sex in Cheboygan County
Management, Business, Science and Arts Occupations
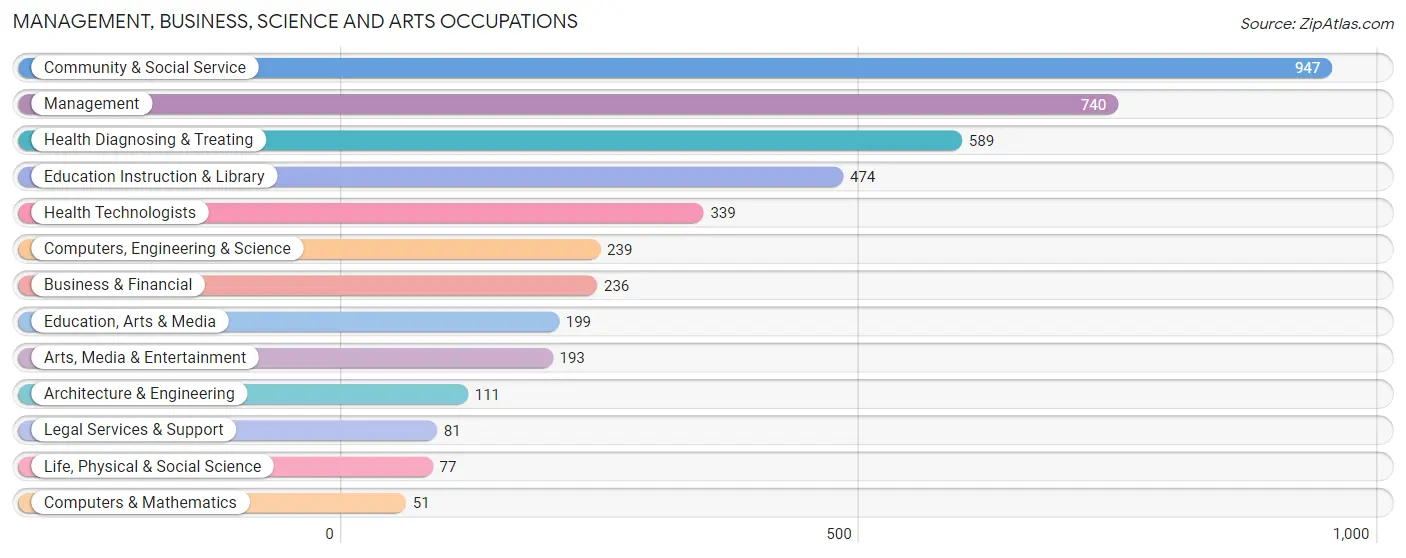
The most common Management, Business, Science and Arts occupations in Cheboygan County are Community & Social Service (947 | 9.1%), Management (740 | 7.1%), Health Diagnosing & Treating (589 | 5.7%), Education Instruction & Library (474 | 4.6%), and Health Technologists (339 | 3.3%).
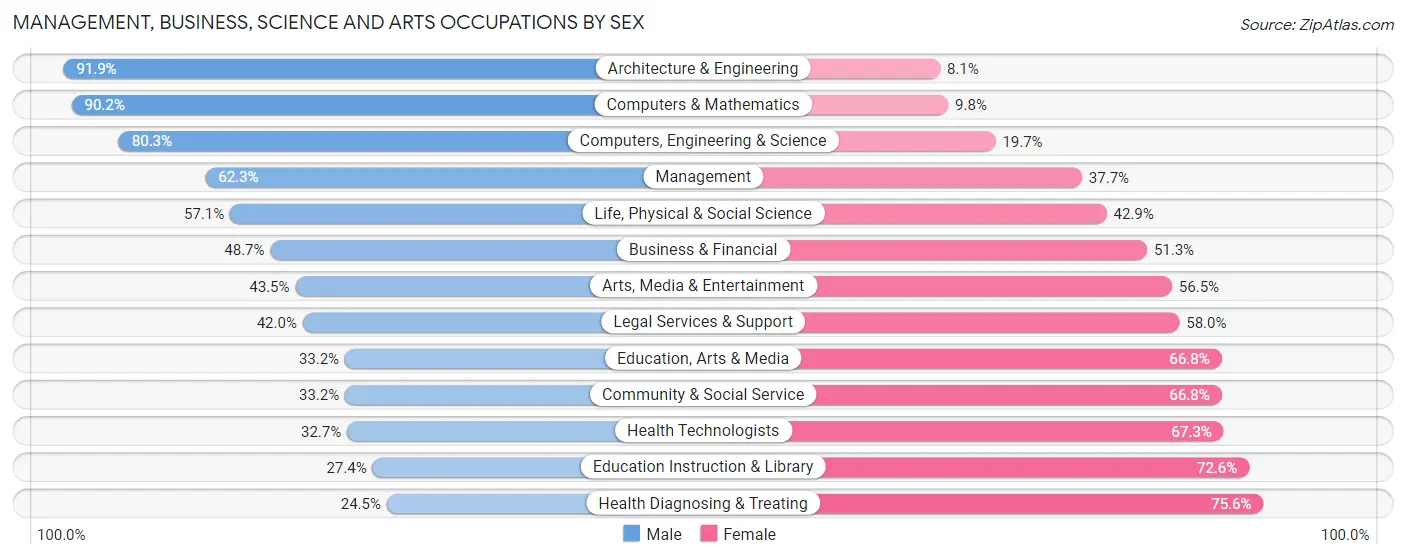
Management, Business, Science and Arts Occupations by Sex
Within the Management, Business, Science and Arts occupations in Cheboygan County, the most male-oriented occupations are Architecture & Engineering (91.9%), Computers & Mathematics (90.2%), and Computers, Engineering & Science (80.3%), while the most female-oriented occupations are Health Diagnosing & Treating (75.5%), Education Instruction & Library (72.6%), and Health Technologists (67.3%).
| Occupation | Male | Female |
| Management | 461 (62.3%) | 279 (37.7%) |
| Business & Financial | 115 (48.7%) | 121 (51.3%) |
| Computers, Engineering & Science | 192 (80.3%) | 47 (19.7%) |
| Computers & Mathematics | 46 (90.2%) | 5 (9.8%) |
| Architecture & Engineering | 102 (91.9%) | 9 (8.1%) |
| Life, Physical & Social Science | 44 (57.1%) | 33 (42.9%) |
| Community & Social Service | 314 (33.2%) | 633 (66.8%) |
| Education, Arts & Media | 66 (33.2%) | 133 (66.8%) |
| Legal Services & Support | 34 (42.0%) | 47 (58.0%) |
| Education Instruction & Library | 130 (27.4%) | 344 (72.6%) |
| Arts, Media & Entertainment | 84 (43.5%) | 109 (56.5%) |
| Health Diagnosing & Treating | 144 (24.4%) | 445 (75.5%) |
| Health Technologists | 111 (32.7%) | 228 (67.3%) |
| Total (Category) | 1,226 (44.6%) | 1,525 (55.4%) |
| Total (Overall) | 5,459 (52.6%) | 4,921 (47.4%) |
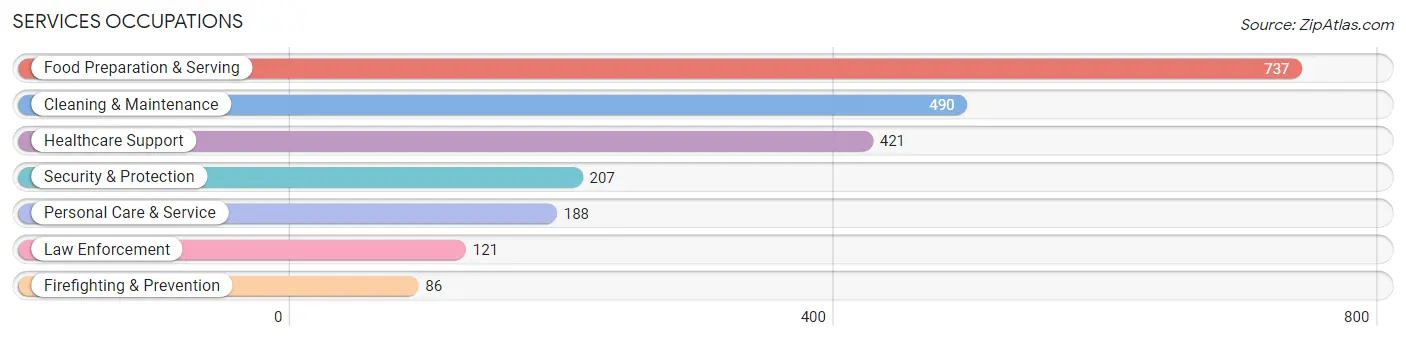
Services Occupations
The most common Services occupations in Cheboygan County are Food Preparation & Serving (737 | 7.1%), Cleaning & Maintenance (490 | 4.7%), Healthcare Support (421 | 4.1%), Security & Protection (207 | 2.0%), and Personal Care & Service (188 | 1.8%).
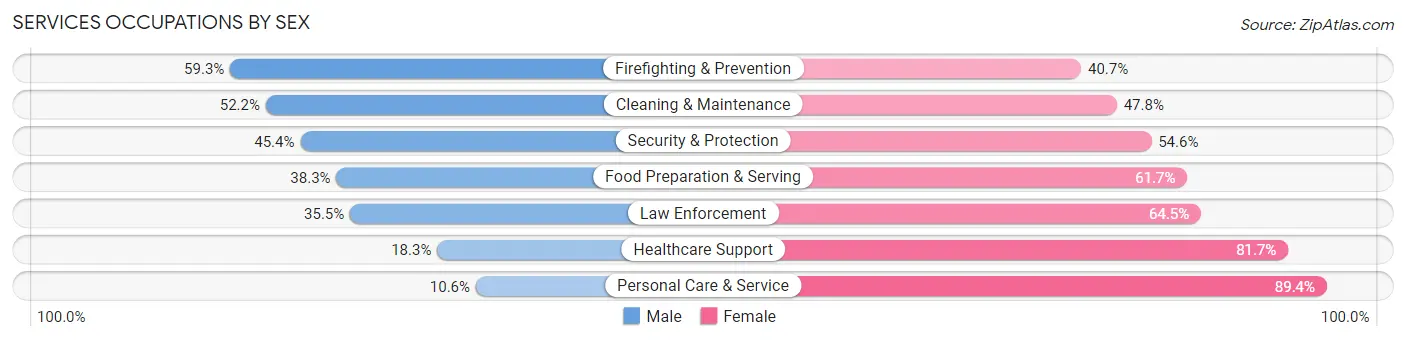
Services Occupations by Sex
Within the Services occupations in Cheboygan County, the most male-oriented occupations are Firefighting & Prevention (59.3%), Cleaning & Maintenance (52.2%), and Security & Protection (45.4%), while the most female-oriented occupations are Personal Care & Service (89.4%), Healthcare Support (81.7%), and Law Enforcement (64.5%).
| Occupation | Male | Female |
| Healthcare Support | 77 (18.3%) | 344 (81.7%) |
| Security & Protection | 94 (45.4%) | 113 (54.6%) |
| Firefighting & Prevention | 51 (59.3%) | 35 (40.7%) |
| Law Enforcement | 43 (35.5%) | 78 (64.5%) |
| Food Preparation & Serving | 282 (38.3%) | 455 (61.7%) |
| Cleaning & Maintenance | 256 (52.2%) | 234 (47.8%) |
| Personal Care & Service | 20 (10.6%) | 168 (89.4%) |
| Total (Category) | 729 (35.7%) | 1,314 (64.3%) |
| Total (Overall) | 5,459 (52.6%) | 4,921 (47.4%) |
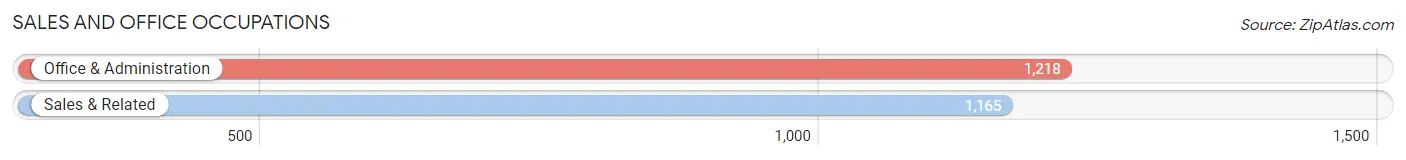
Sales and Office Occupations
The most common Sales and Office occupations in Cheboygan County are Office & Administration (1,218 | 11.7%), and Sales & Related (1,165 | 11.2%).
Sales and Office Occupations by Sex
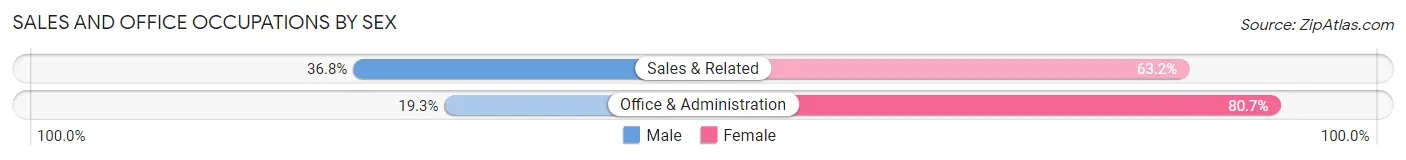
| Occupation | Male | Female |
| Sales & Related | 429 (36.8%) | 736 (63.2%) |
| Office & Administration | 235 (19.3%) | 983 (80.7%) |
| Total (Category) | 664 (27.9%) | 1,719 (72.1%) |
| Total (Overall) | 5,459 (52.6%) | 4,921 (47.4%) |
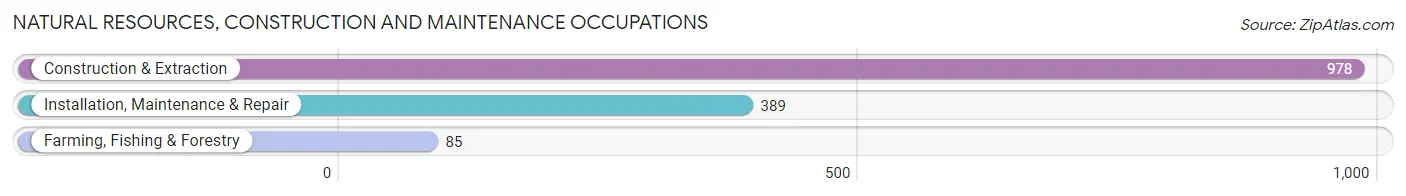
Natural Resources, Construction and Maintenance Occupations
The most common Natural Resources, Construction and Maintenance occupations in Cheboygan County are Construction & Extraction (978 | 9.4%), Installation, Maintenance & Repair (389 | 3.7%), and Farming, Fishing & Forestry (85 | 0.8%).
Natural Resources, Construction and Maintenance Occupations by Sex
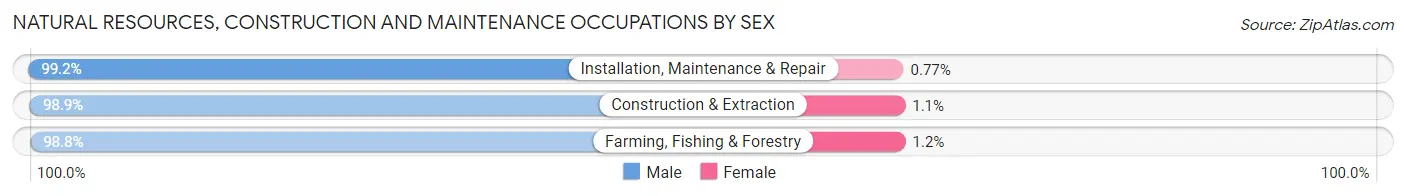
| Occupation | Male | Female |
| Farming, Fishing & Forestry | 84 (98.8%) | 1 (1.2%) |
| Construction & Extraction | 967 (98.9%) | 11 (1.1%) |
| Installation, Maintenance & Repair | 386 (99.2%) | 3 (0.8%) |
| Total (Category) | 1,437 (99.0%) | 15 (1.0%) |
| Total (Overall) | 5,459 (52.6%) | 4,921 (47.4%) |
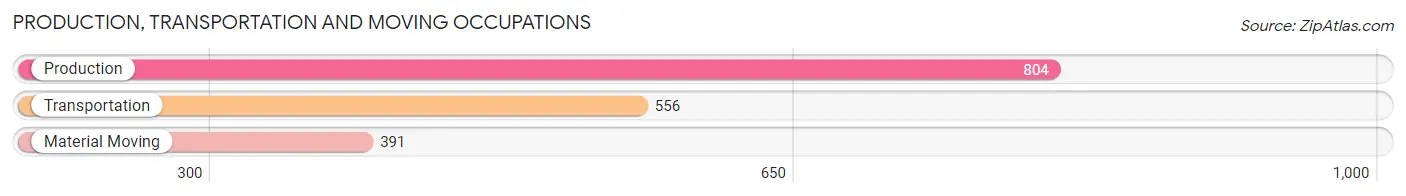
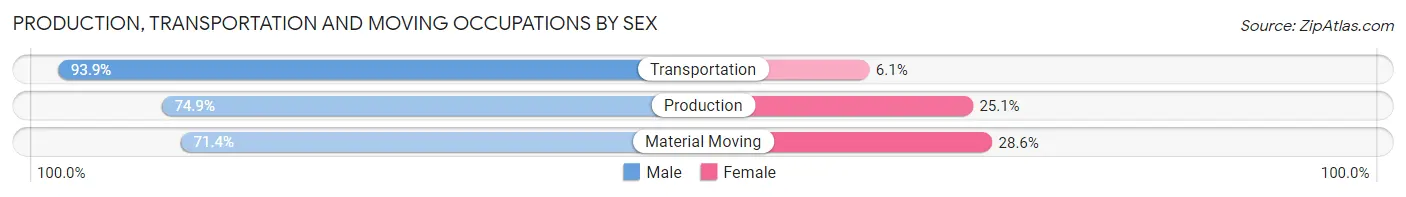
Production, Transportation and Moving Occupations
The most common Production, Transportation and Moving occupations in Cheboygan County are Production (804 | 7.7%), Transportation (556 | 5.4%), and Material Moving (391 | 3.8%).
Production, Transportation and Moving Occupations by Sex
| Occupation | Male | Female |
| Production | 602 (74.9%) | 202 (25.1%) |
| Transportation | 522 (93.9%) | 34 (6.1%) |
| Material Moving | 279 (71.4%) | 112 (28.6%) |
| Total (Category) | 1,403 (80.1%) | 348 (19.9%) |
| Total (Overall) | 5,459 (52.6%) | 4,921 (47.4%) |
Employment Industries by Sex in Cheboygan County
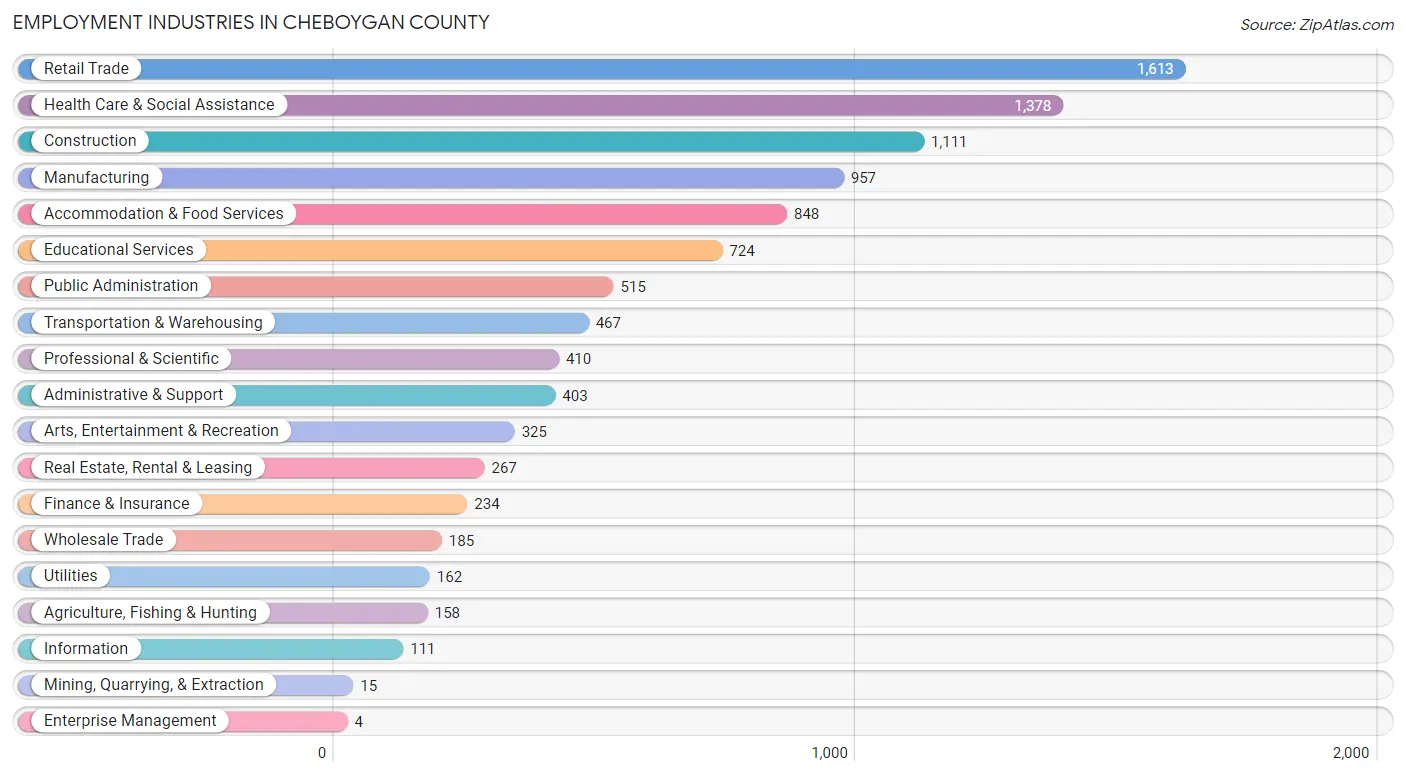
Employment Industries in Cheboygan County
The major employment industries in Cheboygan County include Retail Trade (1,613 | 15.5%), Health Care & Social Assistance (1,378 | 13.3%), Construction (1,111 | 10.7%), Manufacturing (957 | 9.2%), and Accommodation & Food Services (848 | 8.2%).
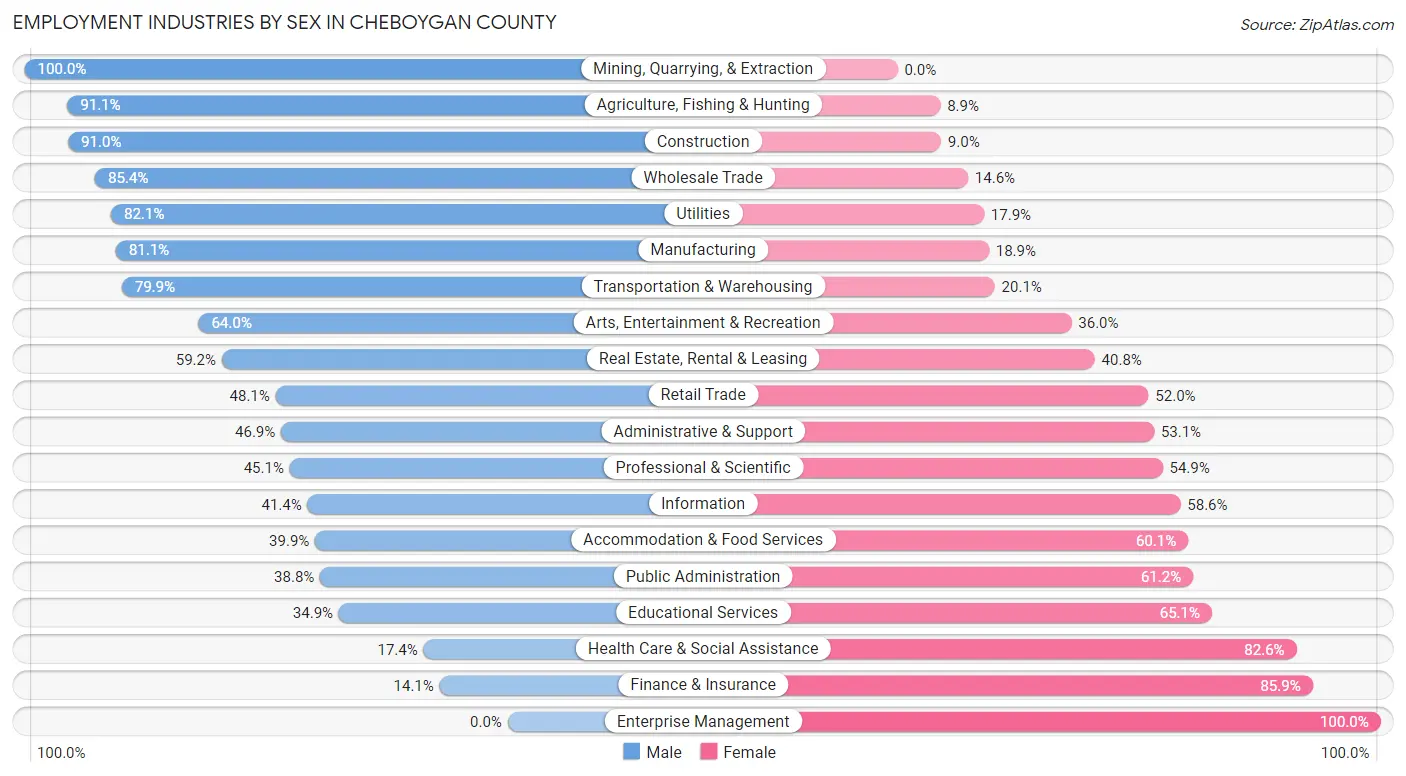
Employment Industries by Sex in Cheboygan County
The Cheboygan County industries that see more men than women are Mining, Quarrying, & Extraction (100.0%), Agriculture, Fishing & Hunting (91.1%), and Construction (91.0%), whereas the industries that tend to have a higher number of women are Enterprise Management (100.0%), Finance & Insurance (85.9%), and Health Care & Social Assistance (82.6%).
| Industry | Male | Female |
| Agriculture, Fishing & Hunting | 144 (91.1%) | 14 (8.9%) |
| Mining, Quarrying, & Extraction | 15 (100.0%) | 0 (0.0%) |
| Construction | 1,011 (91.0%) | 100 (9.0%) |
| Manufacturing | 776 (81.1%) | 181 (18.9%) |
| Wholesale Trade | 158 (85.4%) | 27 (14.6%) |
| Retail Trade | 775 (48.0%) | 838 (51.9%) |
| Transportation & Warehousing | 373 (79.9%) | 94 (20.1%) |
| Utilities | 133 (82.1%) | 29 (17.9%) |
| Information | 46 (41.4%) | 65 (58.6%) |
| Finance & Insurance | 33 (14.1%) | 201 (85.9%) |
| Real Estate, Rental & Leasing | 158 (59.2%) | 109 (40.8%) |
| Professional & Scientific | 185 (45.1%) | 225 (54.9%) |
| Enterprise Management | 0 (0.0%) | 4 (100.0%) |
| Administrative & Support | 189 (46.9%) | 214 (53.1%) |
| Educational Services | 253 (34.9%) | 471 (65.1%) |
| Health Care & Social Assistance | 240 (17.4%) | 1,138 (82.6%) |
| Arts, Entertainment & Recreation | 208 (64.0%) | 117 (36.0%) |
| Accommodation & Food Services | 338 (39.9%) | 510 (60.1%) |
| Public Administration | 200 (38.8%) | 315 (61.2%) |
| Total | 5,459 (52.6%) | 4,921 (47.4%) |
Education in Cheboygan County
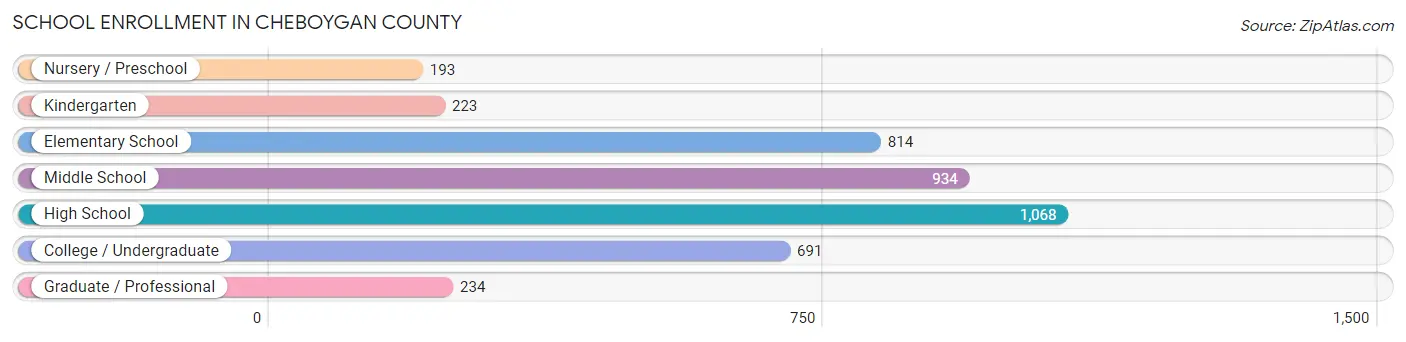
School Enrollment in Cheboygan County
The most common levels of schooling among the 4,157 students in Cheboygan County are high school (1,068 | 25.7%), middle school (934 | 22.5%), and elementary school (814 | 19.6%).
| School Level | # Students | % Students |
| Nursery / Preschool | 193 | 4.6% |
| Kindergarten | 223 | 5.4% |
| Elementary School | 814 | 19.6% |
| Middle School | 934 | 22.5% |
| High School | 1,068 | 25.7% |
| College / Undergraduate | 691 | 16.6% |
| Graduate / Professional | 234 | 5.6% |
| Total | 4,157 | 100.0% |
School Enrollment by Age by Funding Source in Cheboygan County
Out of a total of 4,157 students who are enrolled in schools in Cheboygan County, 719 (17.3%) attend a private institution, while the remaining 3,438 (82.7%) are enrolled in public schools. The age group of 25 to 34 year olds has the highest likelihood of being enrolled in private schools, with 88 (36.2% in the age bracket) enrolled. Conversely, the age group of 18 to 19 year olds has the lowest likelihood of being enrolled in a private school, with 324 (100.0% in the age bracket) attending a public institution.
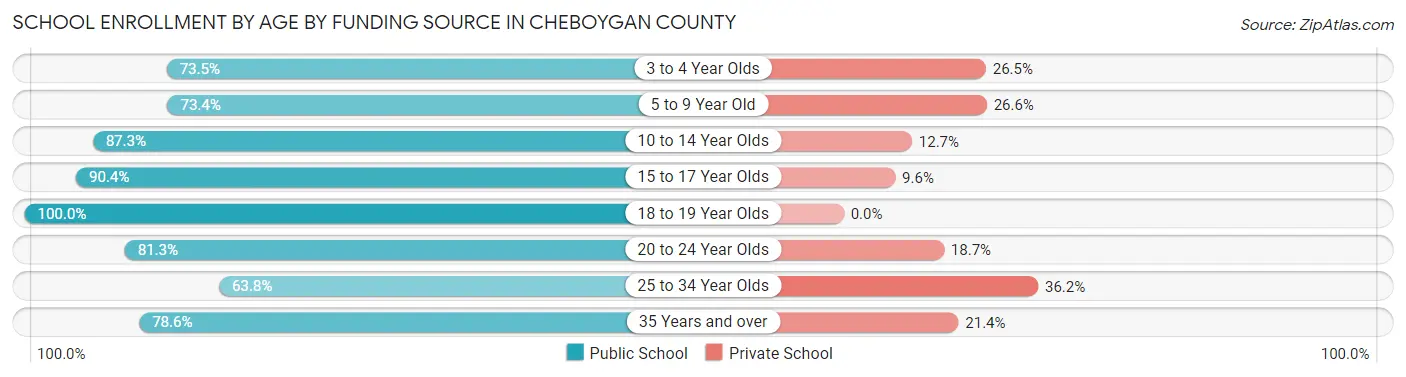
| Age Bracket | Public School | Private School |
| 3 to 4 Year Olds | 100 (73.5%) | 36 (26.5%) |
| 5 to 9 Year Old | 727 (73.4%) | 264 (26.6%) |
| 10 to 14 Year Olds | 997 (87.3%) | 145 (12.7%) |
| 15 to 17 Year Olds | 669 (90.4%) | 71 (9.6%) |
| 18 to 19 Year Olds | 324 (100.0%) | 0 (0.0%) |
| 20 to 24 Year Olds | 305 (81.3%) | 70 (18.7%) |
| 25 to 34 Year Olds | 155 (63.8%) | 88 (36.2%) |
| 35 Years and over | 162 (78.6%) | 44 (21.4%) |
| Total | 3,438 (82.7%) | 719 (17.3%) |
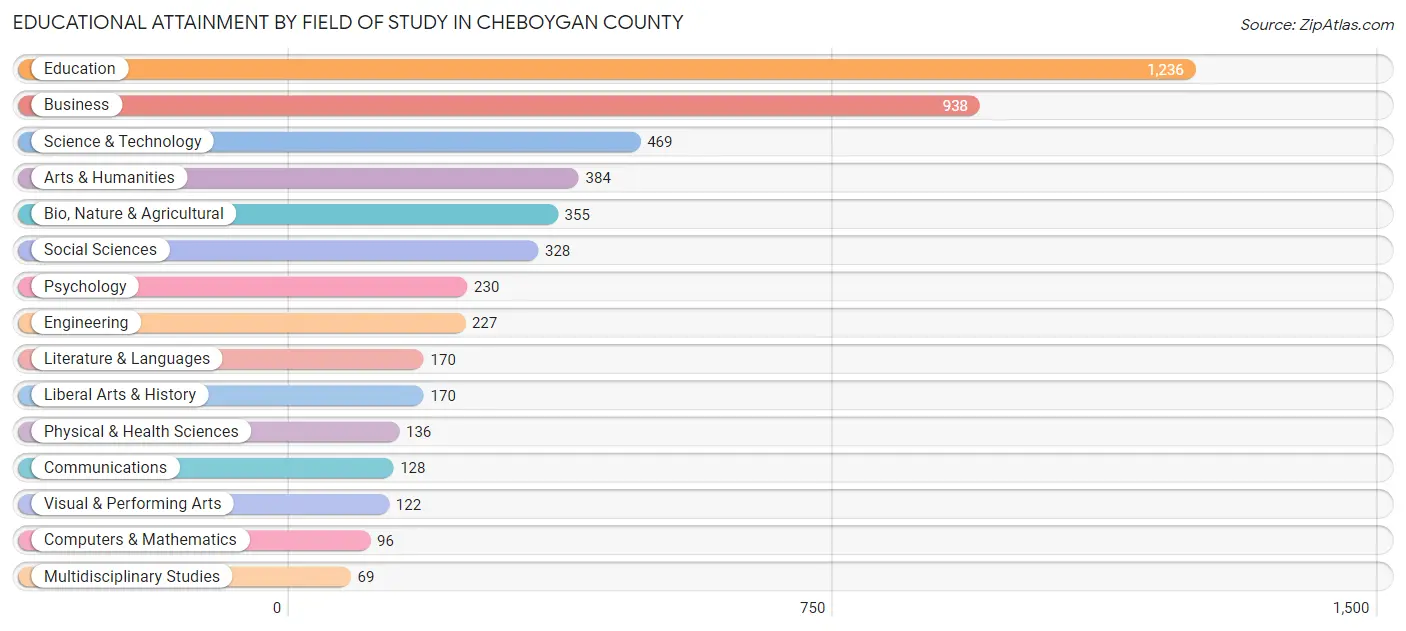
Educational Attainment by Field of Study in Cheboygan County
Education (1,236 | 24.4%), business (938 | 18.5%), science & technology (469 | 9.3%), arts & humanities (384 | 7.6%), and bio, nature & agricultural (355 | 7.0%) are the most common fields of study among 5,058 individuals in Cheboygan County who have obtained a bachelor's degree or higher.
| Field of Study | # Graduates | % Graduates |
| Computers & Mathematics | 96 | 1.9% |
| Bio, Nature & Agricultural | 355 | 7.0% |
| Physical & Health Sciences | 136 | 2.7% |
| Psychology | 230 | 4.5% |
| Social Sciences | 328 | 6.5% |
| Engineering | 227 | 4.5% |
| Multidisciplinary Studies | 69 | 1.4% |
| Science & Technology | 469 | 9.3% |
| Business | 938 | 18.5% |
| Education | 1,236 | 24.4% |
| Literature & Languages | 170 | 3.4% |
| Liberal Arts & History | 170 | 3.4% |
| Visual & Performing Arts | 122 | 2.4% |
| Communications | 128 | 2.5% |
| Arts & Humanities | 384 | 7.6% |
| Total | 5,058 | 100.0% |
Transportation & Commute in Cheboygan County
Vehicle Availability by Sex in Cheboygan County
The most prevalent vehicle ownership categories in Cheboygan County are males with 2 vehicles (2,052, accounting for 38.3%) and females with 2 vehicles (1,991, making up 42.4%).
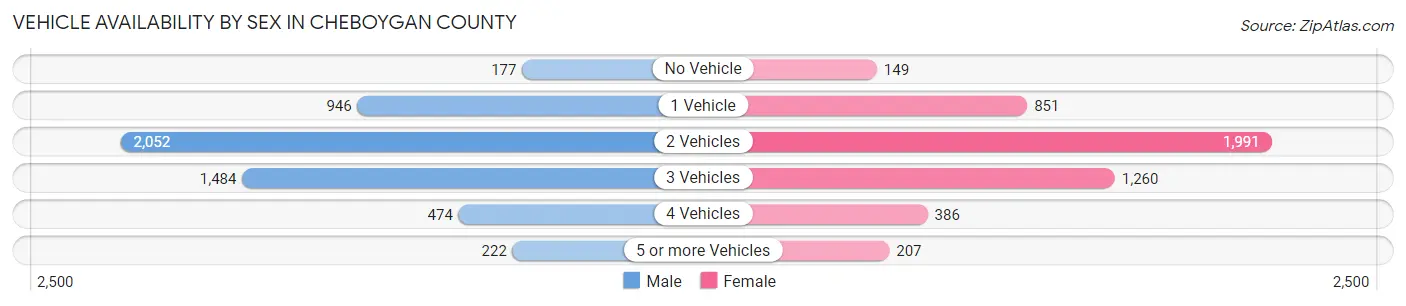
| Vehicles Available | Male | Female |
| No Vehicle | 177 (3.3%) | 149 (3.1%) |
| 1 Vehicle | 946 (17.7%) | 851 (17.6%) |
| 2 Vehicles | 2,052 (38.3%) | 1,991 (41.1%) |
| 3 Vehicles | 1,484 (27.7%) | 1,260 (26.0%) |
| 4 Vehicles | 474 (8.8%) | 386 (8.0%) |
| 5 or more Vehicles | 222 (4.2%) | 207 (4.3%) |
| Total | 5,355 (100.0%) | 4,844 (100.0%) |
Commute Time in Cheboygan County
The most frequently occuring commute durations in Cheboygan County are 5 to 9 minutes (1,466 commuters, 15.7%), 10 to 14 minutes (1,309 commuters, 14.0%), and 15 to 19 minutes (1,227 commuters, 13.1%).
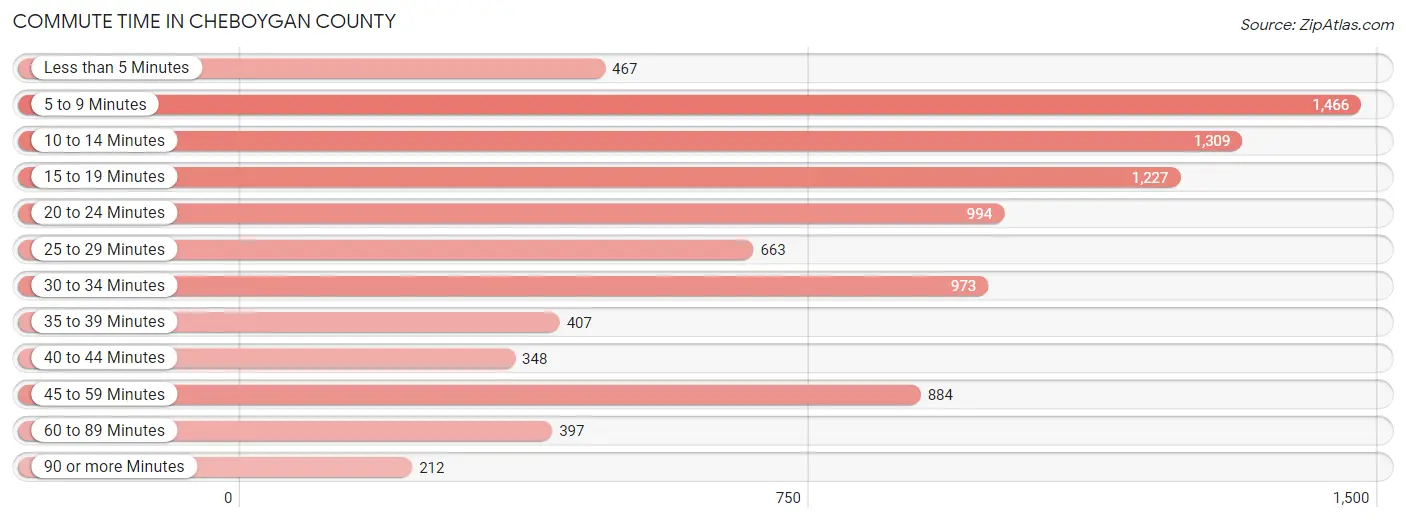
| Commute Time | # Commuters | % Commuters |
| Less than 5 Minutes | 467 | 5.0% |
| 5 to 9 Minutes | 1,466 | 15.7% |
| 10 to 14 Minutes | 1,309 | 14.0% |
| 15 to 19 Minutes | 1,227 | 13.1% |
| 20 to 24 Minutes | 994 | 10.6% |
| 25 to 29 Minutes | 663 | 7.1% |
| 30 to 34 Minutes | 973 | 10.4% |
| 35 to 39 Minutes | 407 | 4.3% |
| 40 to 44 Minutes | 348 | 3.7% |
| 45 to 59 Minutes | 884 | 9.5% |
| 60 to 89 Minutes | 397 | 4.3% |
| 90 or more Minutes | 212 | 2.3% |
Commute Time by Sex in Cheboygan County
The most common commute times in Cheboygan County are 10 to 14 minutes (729 commuters, 14.7%) for males and 5 to 9 minutes (777 commuters, 17.6%) for females.
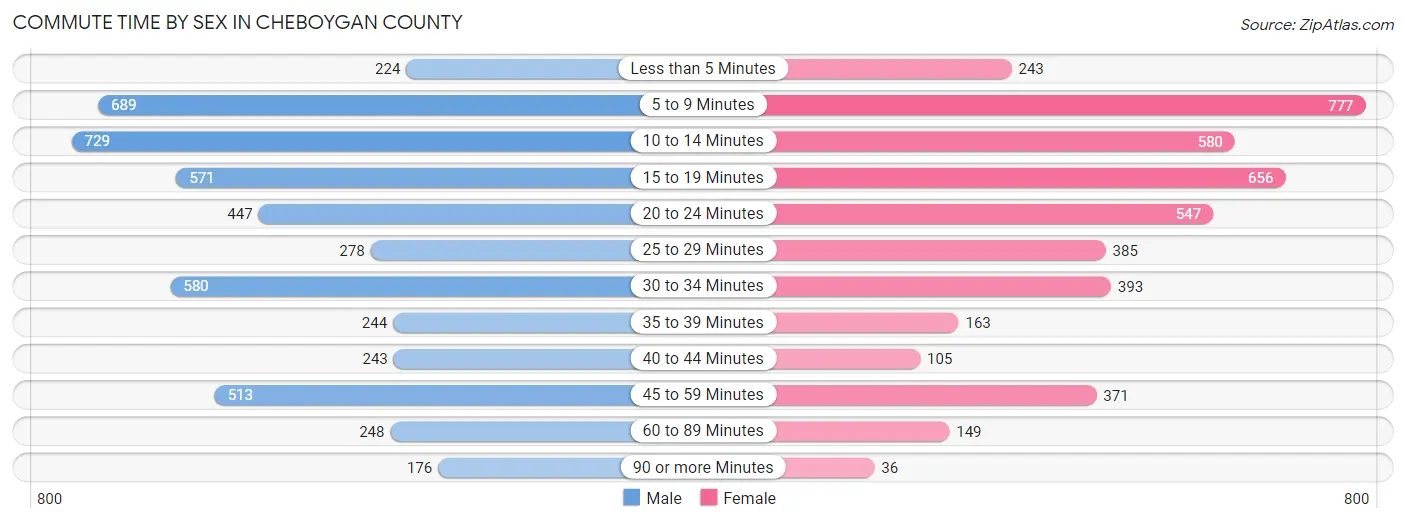
| Commute Time | Male | Female |
| Less than 5 Minutes | 224 (4.5%) | 243 (5.5%) |
| 5 to 9 Minutes | 689 (13.9%) | 777 (17.6%) |
| 10 to 14 Minutes | 729 (14.7%) | 580 (13.2%) |
| 15 to 19 Minutes | 571 (11.6%) | 656 (14.9%) |
| 20 to 24 Minutes | 447 (9.0%) | 547 (12.4%) |
| 25 to 29 Minutes | 278 (5.6%) | 385 (8.7%) |
| 30 to 34 Minutes | 580 (11.7%) | 393 (8.9%) |
| 35 to 39 Minutes | 244 (4.9%) | 163 (3.7%) |
| 40 to 44 Minutes | 243 (4.9%) | 105 (2.4%) |
| 45 to 59 Minutes | 513 (10.4%) | 371 (8.4%) |
| 60 to 89 Minutes | 248 (5.0%) | 149 (3.4%) |
| 90 or more Minutes | 176 (3.6%) | 36 (0.8%) |
Time of Departure to Work by Sex in Cheboygan County
The most frequent times of departure to work in Cheboygan County are 7:00 AM to 7:29 AM (935, 18.9%) for males and 7:30 AM to 7:59 AM (841, 19.1%) for females.
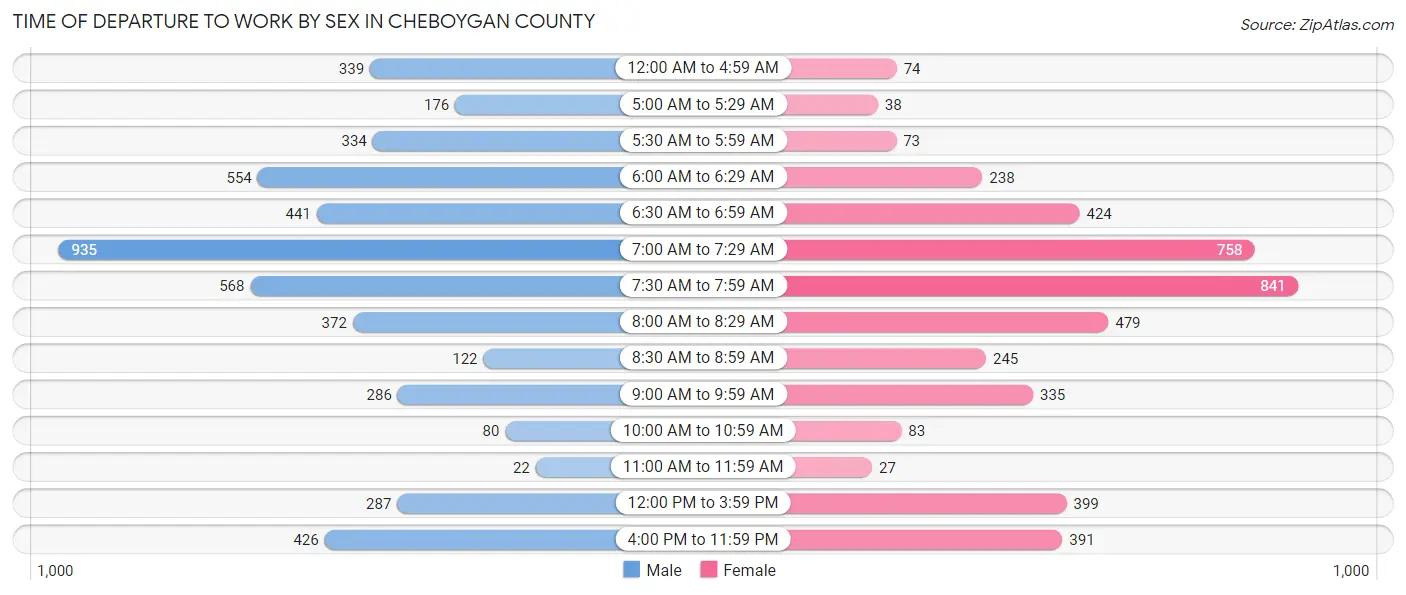
| Time of Departure | Male | Female |
| 12:00 AM to 4:59 AM | 339 (6.9%) | 74 (1.7%) |
| 5:00 AM to 5:29 AM | 176 (3.6%) | 38 (0.9%) |
| 5:30 AM to 5:59 AM | 334 (6.8%) | 73 (1.7%) |
| 6:00 AM to 6:29 AM | 554 (11.2%) | 238 (5.4%) |
| 6:30 AM to 6:59 AM | 441 (8.9%) | 424 (9.6%) |
| 7:00 AM to 7:29 AM | 935 (18.9%) | 758 (17.2%) |
| 7:30 AM to 7:59 AM | 568 (11.5%) | 841 (19.1%) |
| 8:00 AM to 8:29 AM | 372 (7.5%) | 479 (10.9%) |
| 8:30 AM to 8:59 AM | 122 (2.5%) | 245 (5.6%) |
| 9:00 AM to 9:59 AM | 286 (5.8%) | 335 (7.6%) |
| 10:00 AM to 10:59 AM | 80 (1.6%) | 83 (1.9%) |
| 11:00 AM to 11:59 AM | 22 (0.4%) | 27 (0.6%) |
| 12:00 PM to 3:59 PM | 287 (5.8%) | 399 (9.1%) |
| 4:00 PM to 11:59 PM | 426 (8.6%) | 391 (8.9%) |
| Total | 4,942 (100.0%) | 4,405 (100.0%) |
Housing Occupancy in Cheboygan County
Occupancy by Ownership in Cheboygan County
Of the total 10,650 dwellings in Cheboygan County, owner-occupied units account for 9,040 (84.9%), while renter-occupied units make up 1,610 (15.1%).
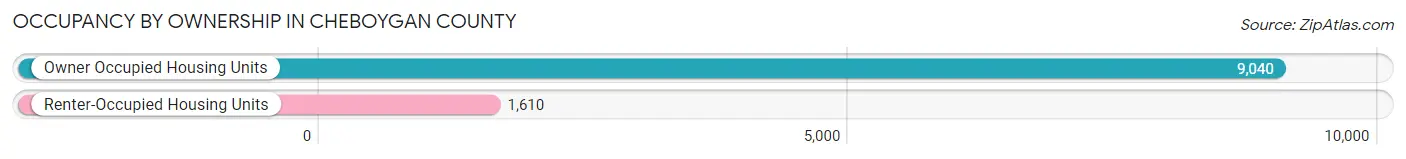
| Occupancy | # Housing Units | % Housing Units |
| Owner Occupied Housing Units | 9,040 | 84.9% |
| Renter-Occupied Housing Units | 1,610 | 15.1% |
| Total Occupied Housing Units | 10,650 | 100.0% |
Occupancy by Household Size in Cheboygan County
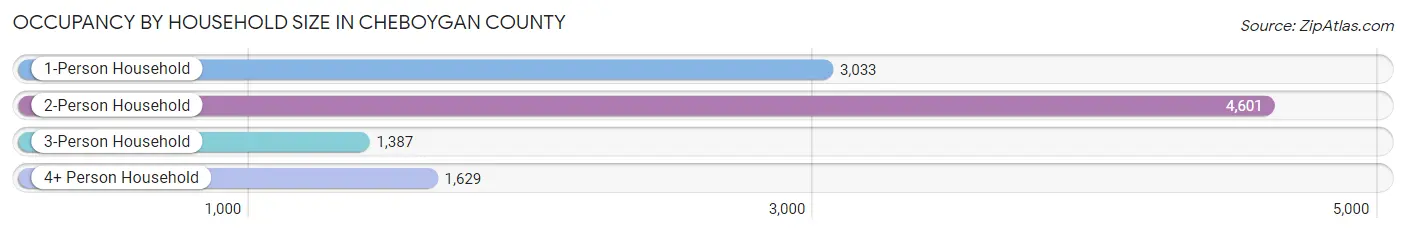
| Household Size | # Housing Units | % Housing Units |
| 1-Person Household | 3,033 | 28.5% |
| 2-Person Household | 4,601 | 43.2% |
| 3-Person Household | 1,387 | 13.0% |
| 4+ Person Household | 1,629 | 15.3% |
| Total Housing Units | 10,650 | 100.0% |
Occupancy by Ownership by Household Size in Cheboygan County
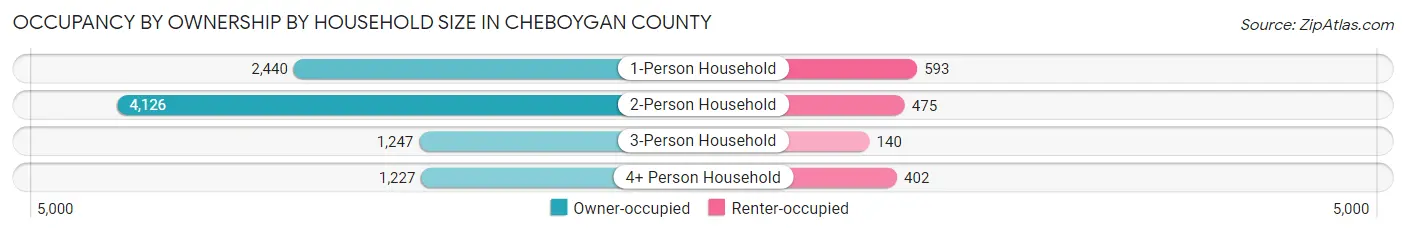
| Household Size | Owner-occupied | Renter-occupied |
| 1-Person Household | 2,440 (80.4%) | 593 (19.6%) |
| 2-Person Household | 4,126 (89.7%) | 475 (10.3%) |
| 3-Person Household | 1,247 (89.9%) | 140 (10.1%) |
| 4+ Person Household | 1,227 (75.3%) | 402 (24.7%) |
| Total Housing Units | 9,040 (84.9%) | 1,610 (15.1%) |
Occupancy by Educational Attainment in Cheboygan County
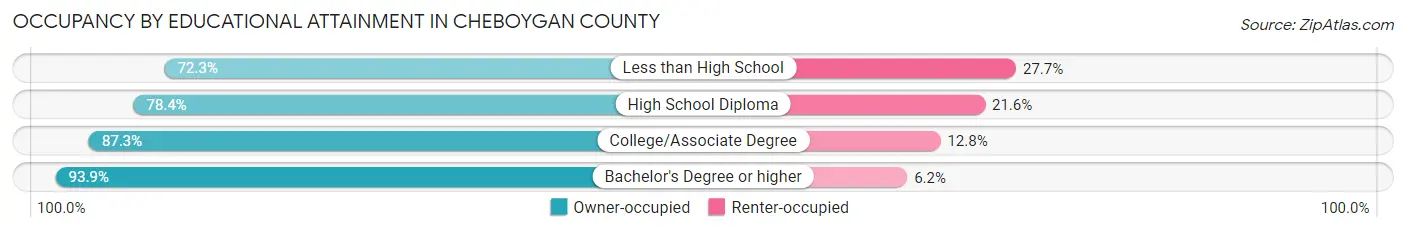
| Household Size | Owner-occupied | Renter-occupied |
| Less than High School | 586 (72.3%) | 225 (27.7%) |
| High School Diploma | 2,697 (78.4%) | 742 (21.6%) |
| College/Associate Degree | 3,298 (87.3%) | 482 (12.8%) |
| Bachelor's Degree or higher | 2,459 (93.9%) | 161 (6.1%) |
Occupancy by Age of Householder in Cheboygan County
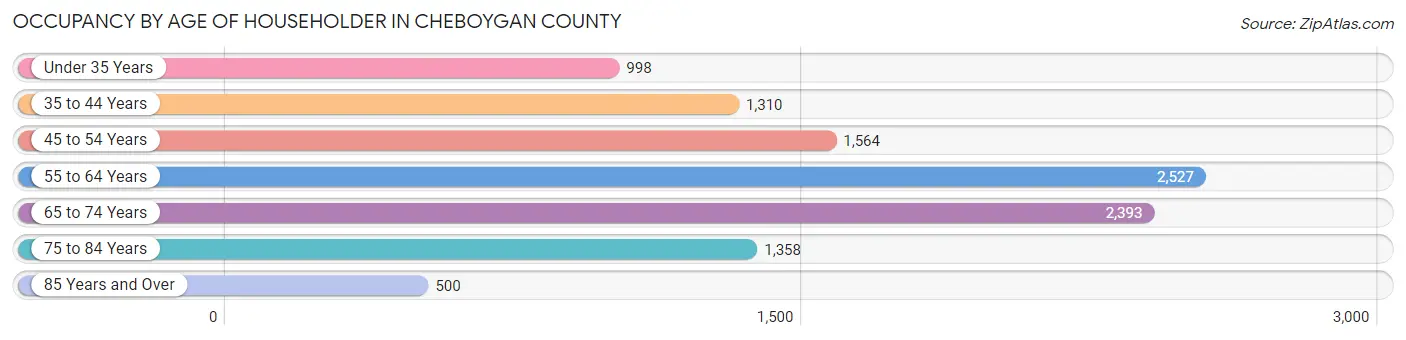
| Age Bracket | # Households | % Households |
| Under 35 Years | 998 | 9.4% |
| 35 to 44 Years | 1,310 | 12.3% |
| 45 to 54 Years | 1,564 | 14.7% |
| 55 to 64 Years | 2,527 | 23.7% |
| 65 to 74 Years | 2,393 | 22.5% |
| 75 to 84 Years | 1,358 | 12.8% |
| 85 Years and Over | 500 | 4.7% |
| Total | 10,650 | 100.0% |
Housing Finances in Cheboygan County
Median Income by Occupancy in Cheboygan County
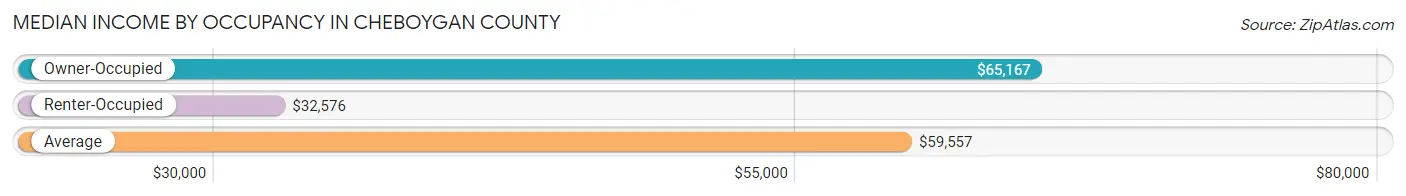
| Occupancy Type | # Households | Median Income |
| Owner-Occupied | 9,040 (84.9%) | $65,167 |
| Renter-Occupied | 1,610 (15.1%) | $32,576 |
| Average | 10,650 (100.0%) | $59,557 |
Occupancy by Householder Income Bracket in Cheboygan County
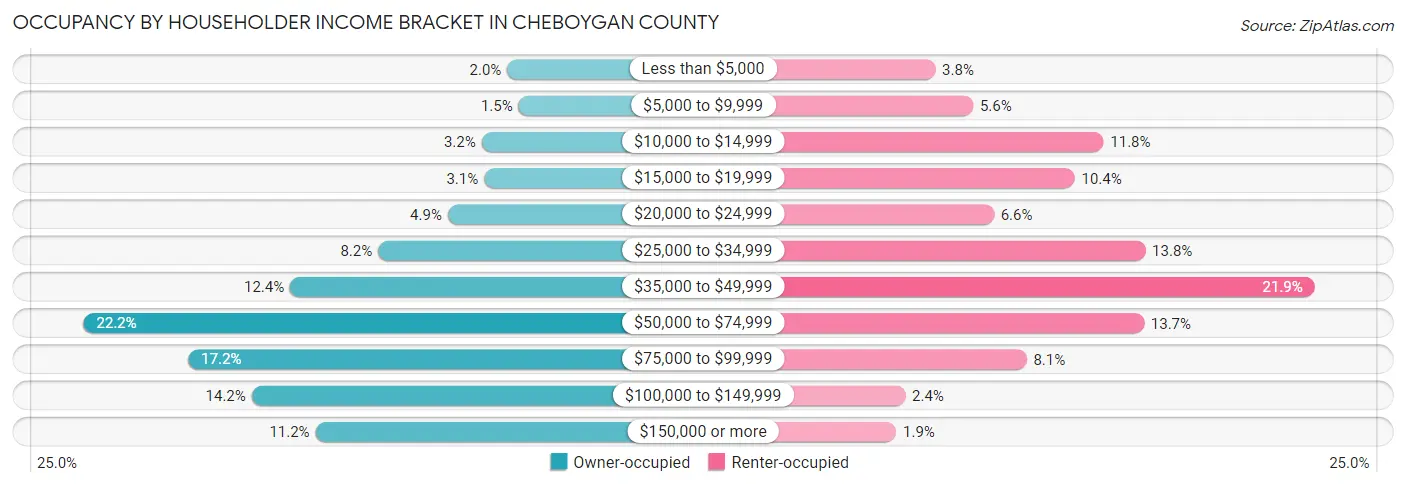
| Income Bracket | Owner-occupied | Renter-occupied |
| Less than $5,000 | 183 (2.0%) | 61 (3.8%) |
| $5,000 to $9,999 | 134 (1.5%) | 90 (5.6%) |
| $10,000 to $14,999 | 293 (3.2%) | 190 (11.8%) |
| $15,000 to $19,999 | 282 (3.1%) | 168 (10.4%) |
| $20,000 to $24,999 | 438 (4.9%) | 106 (6.6%) |
| $25,000 to $34,999 | 739 (8.2%) | 222 (13.8%) |
| $35,000 to $49,999 | 1,117 (12.4%) | 352 (21.9%) |
| $50,000 to $74,999 | 2,007 (22.2%) | 221 (13.7%) |
| $75,000 to $99,999 | 1,556 (17.2%) | 131 (8.1%) |
| $100,000 to $149,999 | 1,283 (14.2%) | 38 (2.4%) |
| $150,000 or more | 1,008 (11.2%) | 31 (1.9%) |
| Total | 9,040 (100.0%) | 1,610 (100.0%) |
Monthly Housing Cost Tiers in Cheboygan County
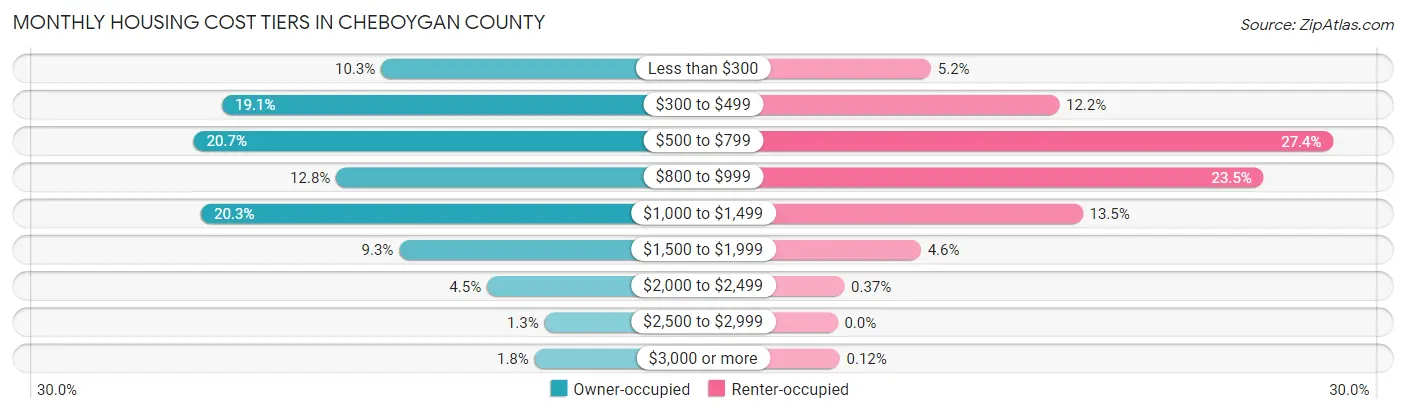
| Monthly Cost | Owner-occupied | Renter-occupied |
| Less than $300 | 932 (10.3%) | 83 (5.2%) |
| $300 to $499 | 1,726 (19.1%) | 197 (12.2%) |
| $500 to $799 | 1,869 (20.7%) | 441 (27.4%) |
| $800 to $999 | 1,156 (12.8%) | 379 (23.5%) |
| $1,000 to $1,499 | 1,831 (20.3%) | 218 (13.5%) |
| $1,500 to $1,999 | 842 (9.3%) | 74 (4.6%) |
| $2,000 to $2,499 | 403 (4.5%) | 6 (0.4%) |
| $2,500 to $2,999 | 116 (1.3%) | 0 (0.0%) |
| $3,000 or more | 165 (1.8%) | 2 (0.1%) |
| Total | 9,040 (100.0%) | 1,610 (100.0%) |
Physical Housing Characteristics in Cheboygan County
Housing Structures in Cheboygan County
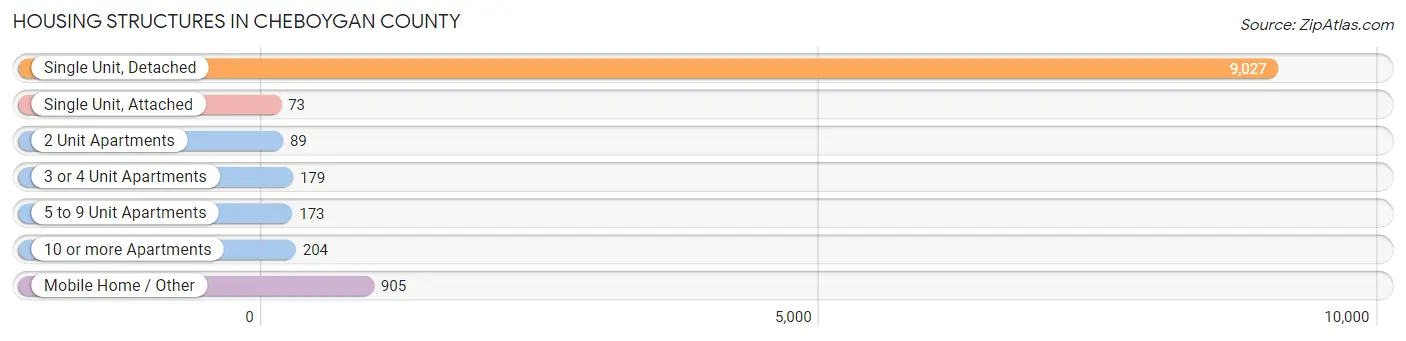
| Structure Type | # Housing Units | % Housing Units |
| Single Unit, Detached | 9,027 | 84.8% |
| Single Unit, Attached | 73 | 0.7% |
| 2 Unit Apartments | 89 | 0.8% |
| 3 or 4 Unit Apartments | 179 | 1.7% |
| 5 to 9 Unit Apartments | 173 | 1.6% |
| 10 or more Apartments | 204 | 1.9% |
| Mobile Home / Other | 905 | 8.5% |
| Total | 10,650 | 100.0% |
Housing Structures by Occupancy in Cheboygan County
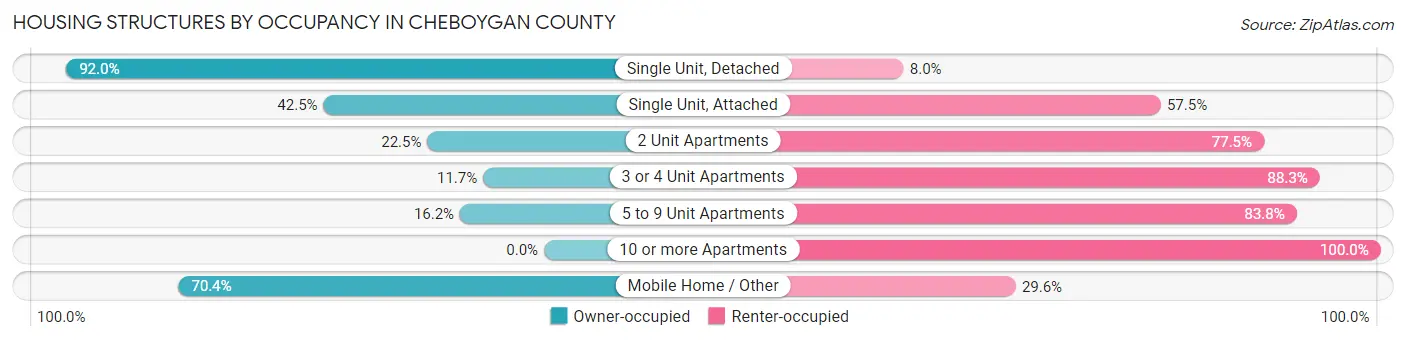
| Structure Type | Owner-occupied | Renter-occupied |
| Single Unit, Detached | 8,303 (92.0%) | 724 (8.0%) |
| Single Unit, Attached | 31 (42.5%) | 42 (57.5%) |
| 2 Unit Apartments | 20 (22.5%) | 69 (77.5%) |
| 3 or 4 Unit Apartments | 21 (11.7%) | 158 (88.3%) |
| 5 to 9 Unit Apartments | 28 (16.2%) | 145 (83.8%) |
| 10 or more Apartments | 0 (0.0%) | 204 (100.0%) |
| Mobile Home / Other | 637 (70.4%) | 268 (29.6%) |
| Total | 9,040 (84.9%) | 1,610 (15.1%) |
Housing Structures by Number of Rooms in Cheboygan County
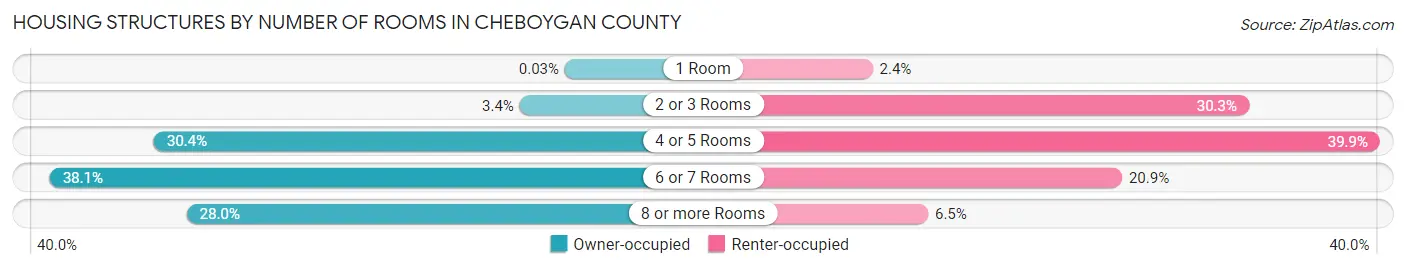
| Number of Rooms | Owner-occupied | Renter-occupied |
| 1 Room | 3 (0.0%) | 39 (2.4%) |
| 2 or 3 Rooms | 305 (3.4%) | 487 (30.2%) |
| 4 or 5 Rooms | 2,752 (30.4%) | 643 (39.9%) |
| 6 or 7 Rooms | 3,448 (38.1%) | 336 (20.9%) |
| 8 or more Rooms | 2,532 (28.0%) | 105 (6.5%) |
| Total | 9,040 (100.0%) | 1,610 (100.0%) |
Housing Structure by Heating Type in Cheboygan County
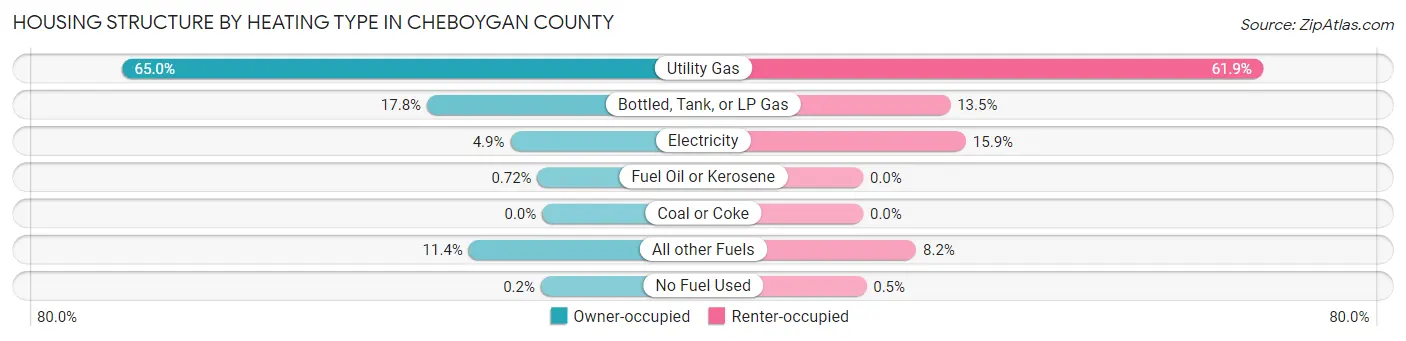
| Heating Type | Owner-occupied | Renter-occupied |
| Utility Gas | 5,876 (65.0%) | 997 (61.9%) |
| Bottled, Tank, or LP Gas | 1,610 (17.8%) | 217 (13.5%) |
| Electricity | 445 (4.9%) | 256 (15.9%) |
| Fuel Oil or Kerosene | 65 (0.7%) | 0 (0.0%) |
| Coal or Coke | 0 (0.0%) | 0 (0.0%) |
| All other Fuels | 1,026 (11.4%) | 132 (8.2%) |
| No Fuel Used | 18 (0.2%) | 8 (0.5%) |
| Total | 9,040 (100.0%) | 1,610 (100.0%) |
Household Vehicle Usage in Cheboygan County
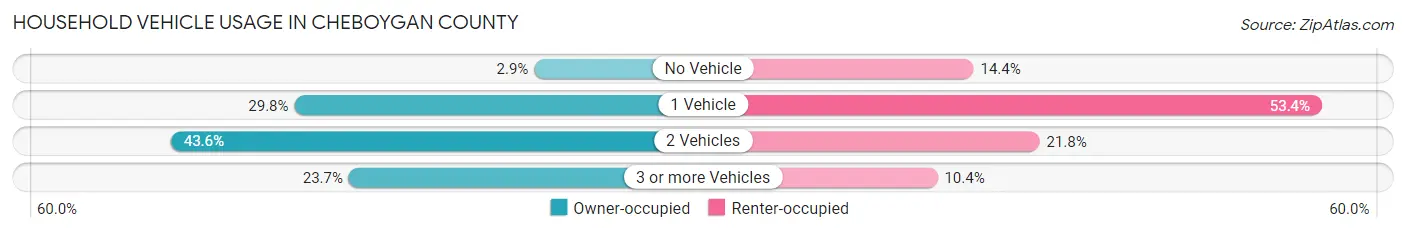
| Vehicles per Household | Owner-occupied | Renter-occupied |
| No Vehicle | 264 (2.9%) | 232 (14.4%) |
| 1 Vehicle | 2,692 (29.8%) | 860 (53.4%) |
| 2 Vehicles | 3,943 (43.6%) | 351 (21.8%) |
| 3 or more Vehicles | 2,141 (23.7%) | 167 (10.4%) |
| Total | 9,040 (100.0%) | 1,610 (100.0%) |
Real Estate & Mortgages in Cheboygan County
Real Estate and Mortgage Overview in Cheboygan County
| Characteristic | Without Mortgage | With Mortgage |
| Housing Units | 4,443 | 4,597 |
| Median Property Value | $149,800 | $183,600 |
| Median Household Income | $55,301 | $558 |
| Monthly Housing Costs | $452 | $130 |
| Real Estate Taxes | $1,537 | $102 |
Property Value by Mortgage Status in Cheboygan County
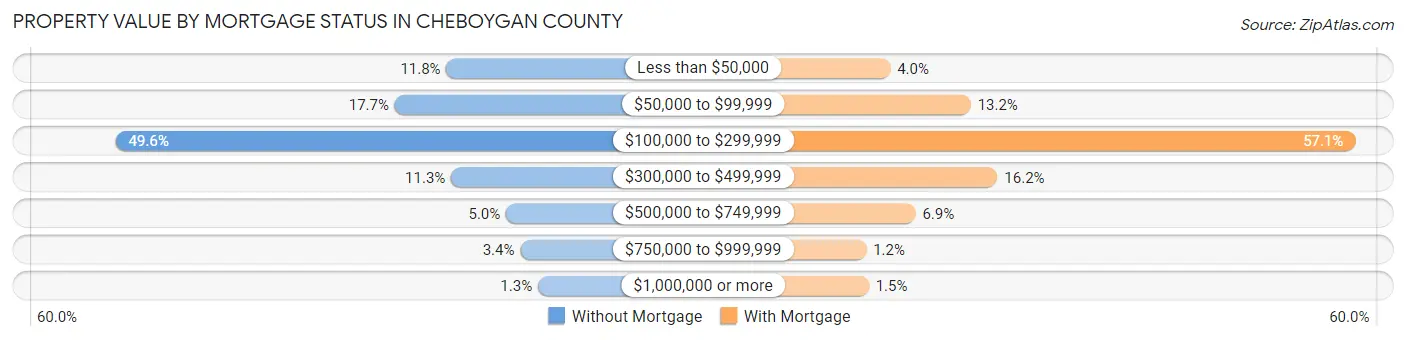
| Property Value | Without Mortgage | With Mortgage |
| Less than $50,000 | 524 (11.8%) | 182 (4.0%) |
| $50,000 to $99,999 | 786 (17.7%) | 605 (13.2%) |
| $100,000 to $299,999 | 2,204 (49.6%) | 2,625 (57.1%) |
| $300,000 to $499,999 | 500 (11.3%) | 745 (16.2%) |
| $500,000 to $749,999 | 221 (5.0%) | 315 (6.9%) |
| $750,000 to $999,999 | 149 (3.4%) | 56 (1.2%) |
| $1,000,000 or more | 59 (1.3%) | 69 (1.5%) |
| Total | 4,443 (100.0%) | 4,597 (100.0%) |
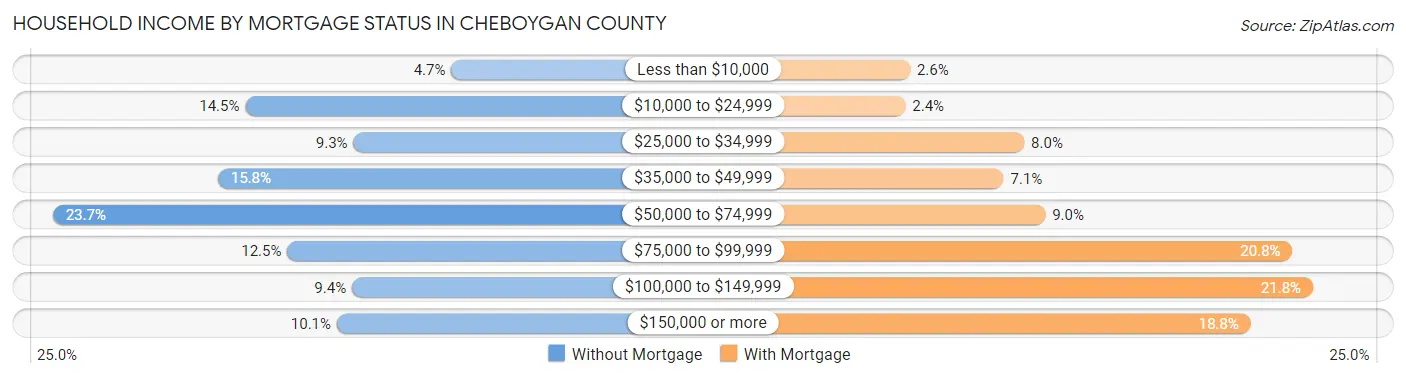
Household Income by Mortgage Status in Cheboygan County
| Household Income | Without Mortgage | With Mortgage |
| Less than $10,000 | 208 (4.7%) | 119 (2.6%) |
| $10,000 to $24,999 | 644 (14.5%) | 109 (2.4%) |
| $25,000 to $34,999 | 415 (9.3%) | 369 (8.0%) |
| $35,000 to $49,999 | 702 (15.8%) | 324 (7.0%) |
| $50,000 to $74,999 | 1,051 (23.7%) | 415 (9.0%) |
| $75,000 to $99,999 | 555 (12.5%) | 956 (20.8%) |
| $100,000 to $149,999 | 418 (9.4%) | 1,001 (21.8%) |
| $150,000 or more | 450 (10.1%) | 865 (18.8%) |
| Total | 4,443 (100.0%) | 4,597 (100.0%) |
Property Value to Household Income Ratio in Cheboygan County
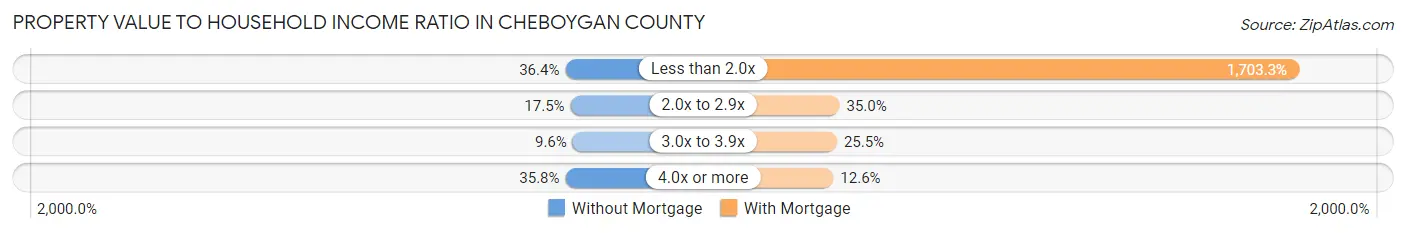
| Value-to-Income Ratio | Without Mortgage | With Mortgage |
| Less than 2.0x | 1,615 (36.3%) | 78,301 (1,703.3%) |
| 2.0x to 2.9x | 777 (17.5%) | 1,611 (35.0%) |
| 3.0x to 3.9x | 425 (9.6%) | 1,173 (25.5%) |
| 4.0x or more | 1,590 (35.8%) | 580 (12.6%) |
| Total | 4,443 (100.0%) | 4,597 (100.0%) |
Real Estate Taxes by Mortgage Status in Cheboygan County
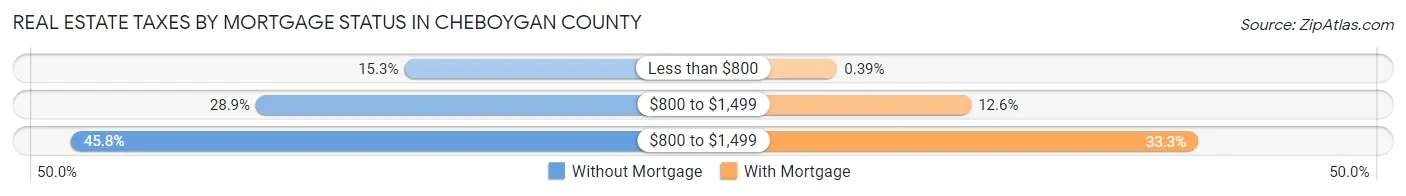
| Property Taxes | Without Mortgage | With Mortgage |
| Less than $800 | 681 (15.3%) | 18 (0.4%) |
| $800 to $1,499 | 1,283 (28.9%) | 580 (12.6%) |
| $800 to $1,499 | 2,033 (45.8%) | 1,532 (33.3%) |
| Total | 4,443 (100.0%) | 4,597 (100.0%) |
Health & Disability in Cheboygan County
Health Insurance Coverage by Age in Cheboygan County
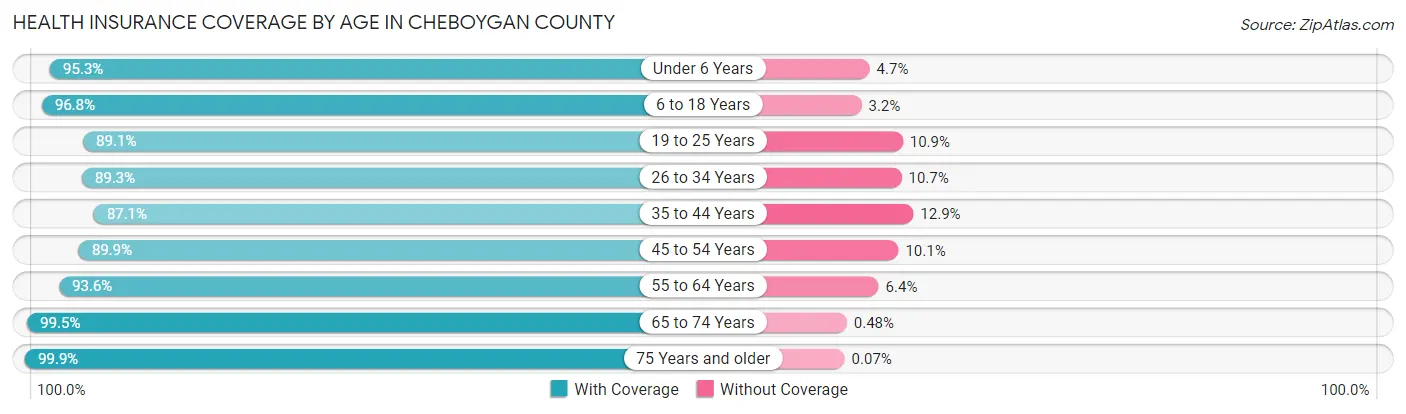
| Age Bracket | With Coverage | Without Coverage |
| Under 6 Years | 1,127 (95.3%) | 56 (4.7%) |
| 6 to 18 Years | 2,989 (96.8%) | 99 (3.2%) |
| 19 to 25 Years | 1,494 (89.1%) | 183 (10.9%) |
| 26 to 34 Years | 1,965 (89.3%) | 235 (10.7%) |
| 35 to 44 Years | 2,204 (87.1%) | 326 (12.9%) |
| 45 to 54 Years | 2,873 (89.9%) | 323 (10.1%) |
| 55 to 64 Years | 4,159 (93.6%) | 285 (6.4%) |
| 65 to 74 Years | 4,353 (99.5%) | 21 (0.5%) |
| 75 Years and older | 2,756 (99.9%) | 2 (0.1%) |
| Total | 23,920 (94.0%) | 1,530 (6.0%) |
Health Insurance Coverage by Citizenship Status in Cheboygan County
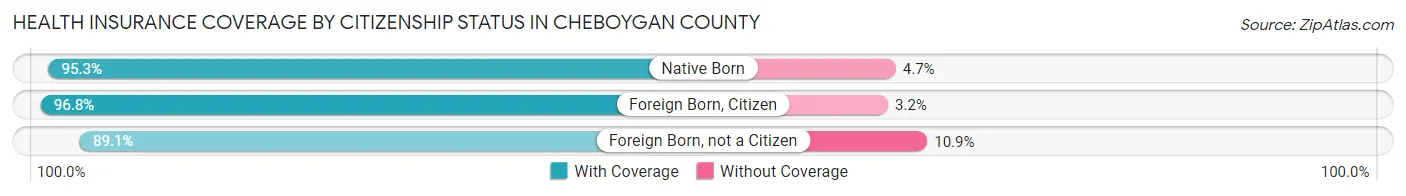
| Citizenship Status | With Coverage | Without Coverage |
| Native Born | 1,127 (95.3%) | 56 (4.7%) |
| Foreign Born, Citizen | 2,989 (96.8%) | 99 (3.2%) |
| Foreign Born, not a Citizen | 1,494 (89.1%) | 183 (10.9%) |
Health Insurance Coverage by Household Income in Cheboygan County
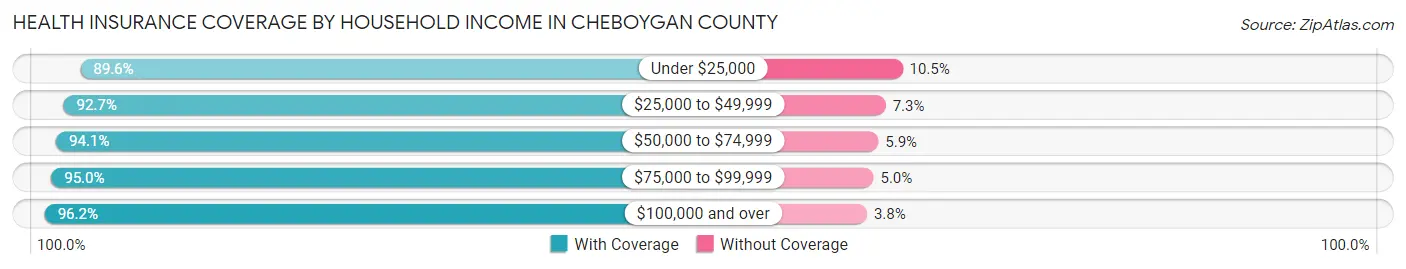
| Household Income | With Coverage | Without Coverage |
| Under $25,000 | 2,741 (89.5%) | 320 (10.4%) |
| $25,000 to $49,999 | 5,068 (92.7%) | 399 (7.3%) |
| $50,000 to $74,999 | 5,098 (94.1%) | 320 (5.9%) |
| $75,000 to $99,999 | 4,493 (95.0%) | 237 (5.0%) |
| $100,000 and over | 6,470 (96.2%) | 254 (3.8%) |
Public vs Private Health Insurance Coverage by Age in Cheboygan County
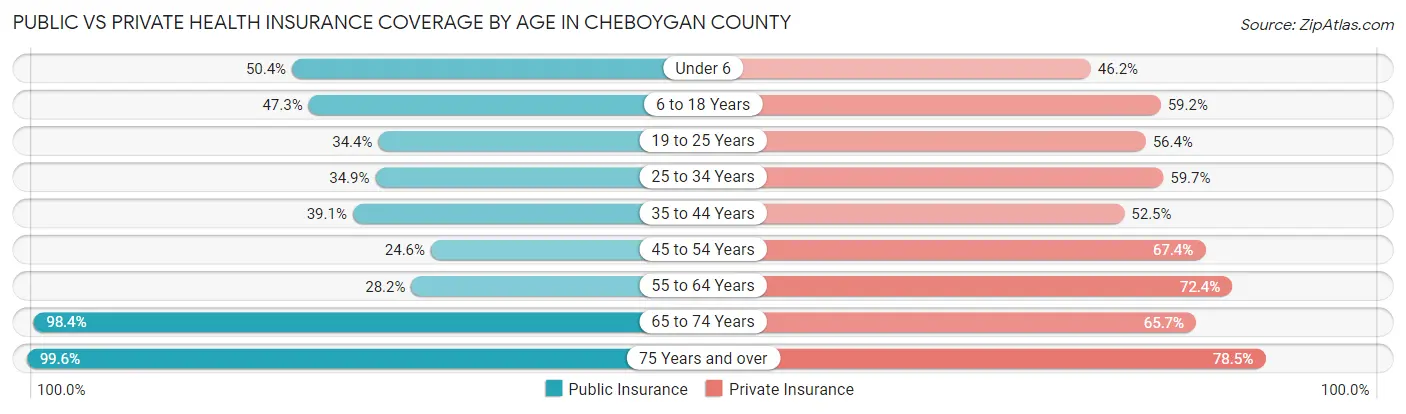
| Age Bracket | Public Insurance | Private Insurance |
| Under 6 | 596 (50.4%) | 547 (46.2%) |
| 6 to 18 Years | 1,461 (47.3%) | 1,828 (59.2%) |
| 19 to 25 Years | 576 (34.4%) | 946 (56.4%) |
| 25 to 34 Years | 768 (34.9%) | 1,313 (59.7%) |
| 35 to 44 Years | 989 (39.1%) | 1,327 (52.4%) |
| 45 to 54 Years | 786 (24.6%) | 2,155 (67.4%) |
| 55 to 64 Years | 1,254 (28.2%) | 3,219 (72.4%) |
| 65 to 74 Years | 4,303 (98.4%) | 2,874 (65.7%) |
| 75 Years and over | 2,747 (99.6%) | 2,166 (78.5%) |
| Total | 13,480 (53.0%) | 16,375 (64.3%) |
Disability Status by Sex by Age in Cheboygan County
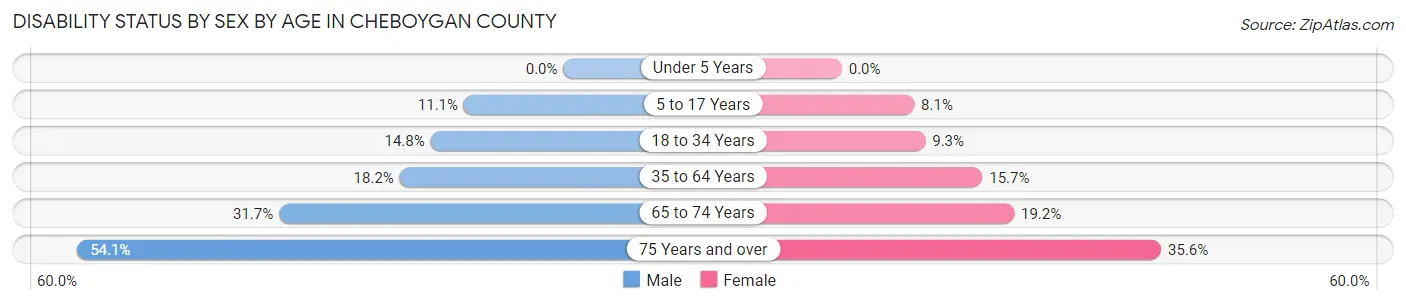
| Age Bracket | Male | Female |
| Under 5 Years | 0 (0.0%) | 0 (0.0%) |
| 5 to 17 Years | 182 (11.1%) | 113 (8.1%) |
| 18 to 34 Years | 316 (14.8%) | 183 (9.3%) |
| 35 to 64 Years | 929 (18.2%) | 794 (15.7%) |
| 65 to 74 Years | 695 (31.7%) | 418 (19.2%) |
| 75 Years and over | 706 (54.1%) | 517 (35.6%) |
Disability Class by Sex by Age in Cheboygan County
Disability Class: Hearing Difficulty
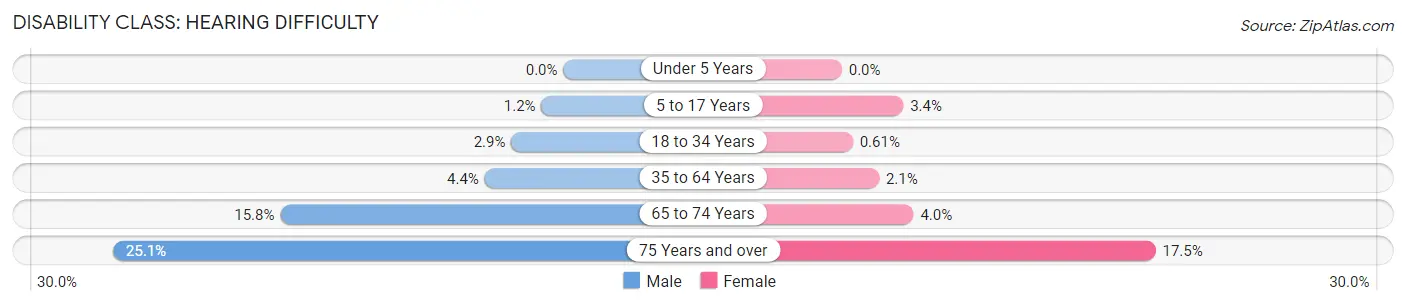
| Age Bracket | Male | Female |
| Under 5 Years | 0 (0.0%) | 0 (0.0%) |
| 5 to 17 Years | 20 (1.2%) | 48 (3.4%) |
| 18 to 34 Years | 62 (2.9%) | 12 (0.6%) |
| 35 to 64 Years | 223 (4.4%) | 105 (2.1%) |
| 65 to 74 Years | 346 (15.8%) | 87 (4.0%) |
| 75 Years and over | 327 (25.1%) | 254 (17.5%) |
Disability Class: Vision Difficulty
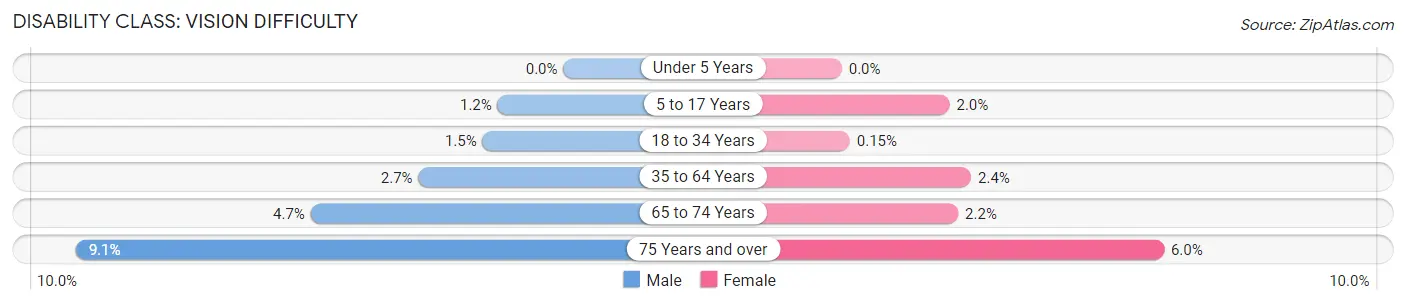
| Age Bracket | Male | Female |
| Under 5 Years | 0 (0.0%) | 0 (0.0%) |
| 5 to 17 Years | 20 (1.2%) | 28 (2.0%) |
| 18 to 34 Years | 32 (1.5%) | 3 (0.2%) |
| 35 to 64 Years | 137 (2.7%) | 122 (2.4%) |
| 65 to 74 Years | 103 (4.7%) | 47 (2.2%) |
| 75 Years and over | 118 (9.0%) | 87 (6.0%) |
Disability Class: Cognitive Difficulty
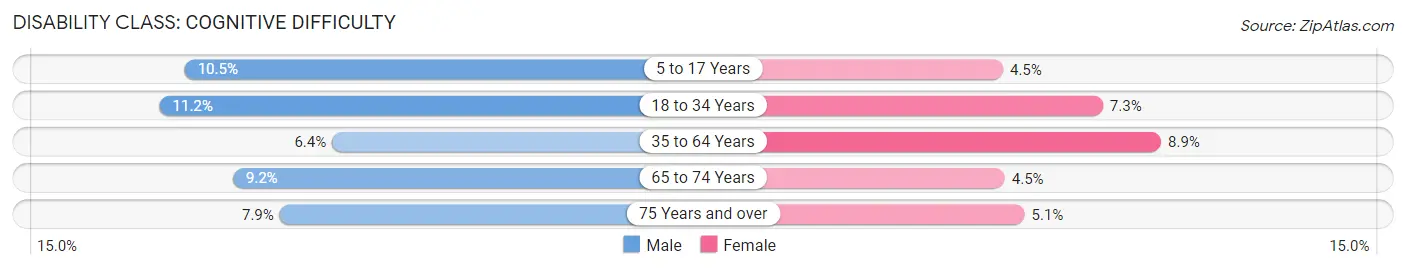
| Age Bracket | Male | Female |
| 5 to 17 Years | 173 (10.5%) | 63 (4.5%) |
| 18 to 34 Years | 240 (11.2%) | 143 (7.3%) |
| 35 to 64 Years | 328 (6.4%) | 451 (8.9%) |
| 65 to 74 Years | 202 (9.2%) | 99 (4.5%) |
| 75 Years and over | 103 (7.9%) | 74 (5.1%) |
Disability Class: Ambulatory Difficulty
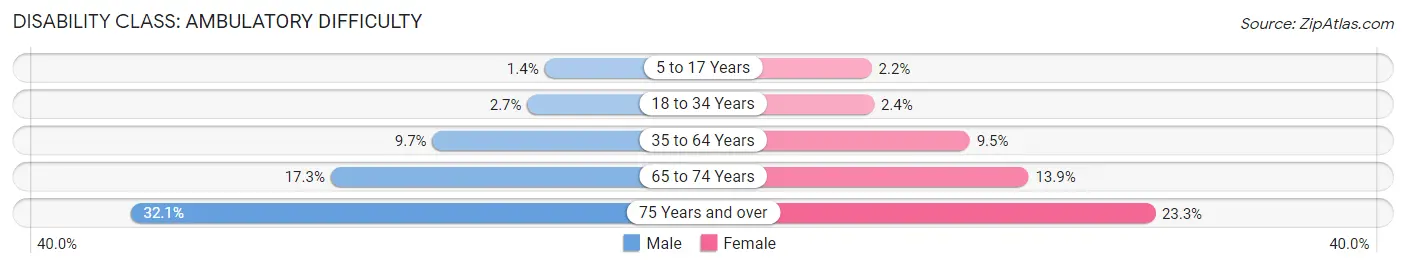
| Age Bracket | Male | Female |
| 5 to 17 Years | 23 (1.4%) | 31 (2.2%) |
| 18 to 34 Years | 57 (2.7%) | 47 (2.4%) |
| 35 to 64 Years | 495 (9.7%) | 482 (9.5%) |
| 65 to 74 Years | 379 (17.3%) | 302 (13.9%) |
| 75 Years and over | 419 (32.1%) | 338 (23.3%) |
Disability Class: Self-Care Difficulty
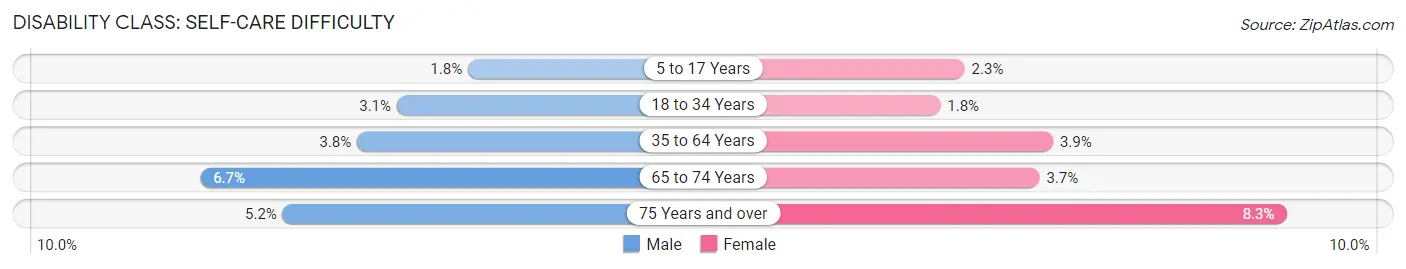
| Age Bracket | Male | Female |
| 5 to 17 Years | 29 (1.8%) | 32 (2.3%) |
| 18 to 34 Years | 66 (3.1%) | 36 (1.8%) |
| 35 to 64 Years | 195 (3.8%) | 199 (3.9%) |
| 65 to 74 Years | 148 (6.7%) | 80 (3.7%) |
| 75 Years and over | 68 (5.2%) | 120 (8.3%) |
Technology Access in Cheboygan County
Computing Device Access in Cheboygan County
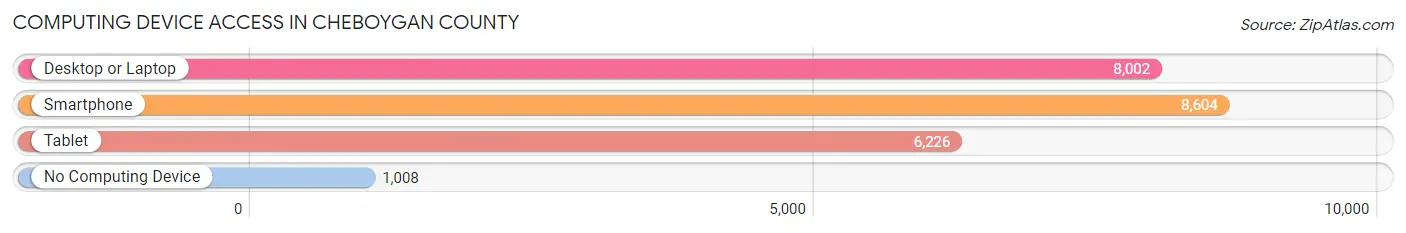
| Device Type | # Households | % Households |
| Desktop or Laptop | 8,002 | 75.1% |
| Smartphone | 8,604 | 80.8% |
| Tablet | 6,226 | 58.5% |
| No Computing Device | 1,008 | 9.5% |
| Total | 10,650 | 100.0% |
Internet Access in Cheboygan County
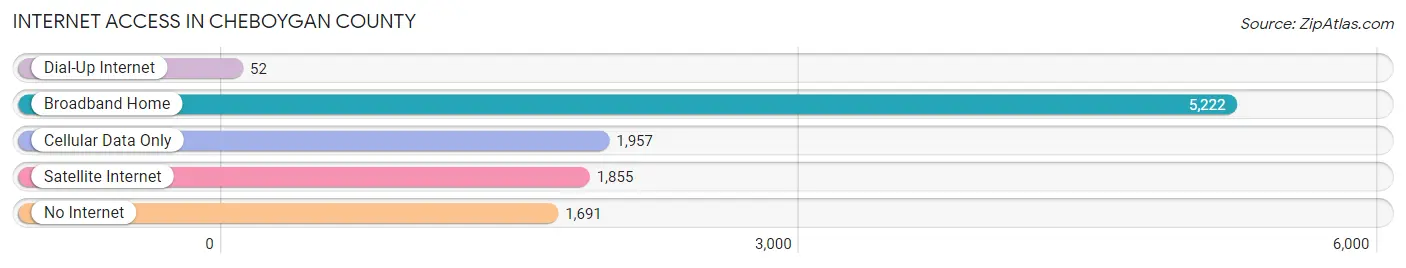
| Internet Type | # Households | % Households |
| Dial-Up Internet | 52 | 0.5% |
| Broadband Home | 5,222 | 49.0% |
| Cellular Data Only | 1,957 | 18.4% |
| Satellite Internet | 1,855 | 17.4% |
| No Internet | 1,691 | 15.9% |
| Total | 10,650 | 100.0% |
Cheboygan County Summary
Cheboygan County is located in the northern part of Michigan’s Lower Peninsula. It is bordered by the Straits of Mackinac to the north, Emmet County to the east, Otsego County to the south, and Charlevoix County to the west. The county seat is the city of Cheboygan.
History
Cheboygan County was first settled in the early 1800s by French fur traders and missionaries. The county was officially organized in 1853 and named after the Cheboygan River, which was named after the Ojibwe word “Zhaabonigan,” meaning “sewing needle.”
The county was initially a logging and fishing center, but by the late 1800s, it had become a popular tourist destination. The county was home to several resorts, including the Grand Hotel on Mackinac Island, which opened in 1887.
In the early 1900s, the county’s economy shifted to agriculture, with the establishment of several large farms. The county also became a major producer of lumber, with several sawmills operating in the area.
Geography
Cheboygan County covers an area of 1,845 square miles and is located in the northern part of Michigan’s Lower Peninsula. It is bordered by the Straits of Mackinac to the north, Emmet County to the east, Otsego County to the south, and Charlevoix County to the west.
The county is home to several lakes, including Burt Lake, Mullett Lake, and Black Lake. The Cheboygan River runs through the county, and the county is also home to several state parks, including Cheboygan State Park and Wilderness State Park.
Economy
Cheboygan County’s economy is largely based on tourism, agriculture, and manufacturing. The county is home to several resorts, including the Grand Hotel on Mackinac Island, which opened in 1887.
Agriculture is also an important part of the county’s economy, with several large farms producing corn, soybeans, wheat, and other crops. The county is also home to several sawmills, which produce lumber for the construction industry.
Demographics
As of the 2010 census, Cheboygan County had a population of 26,448. The racial makeup of the county was 94.3% White, 0.7% African American, 0.7% Native American, 0.5% Asian, 0.1% Pacific Islander, and 2.7% from two or more races.
The median household income in the county was $41,945, and the median family income was $50,945. The per capita income was $21,945. About 11.3% of the population was below the poverty line.
Cheboygan County is served by several school districts, including Cheboygan Area Schools, Inland Lakes Schools, and Wolverine Community Schools. The county is also home to several higher education institutions, including North Central Michigan College and Kirtland Community College.
Common Questions
What is Per Capita Income in Cheboygan County?
Per Capita income in Cheboygan County is $32,679.
What is the Median Family Income in Cheboygan County?
Median Family Income in Cheboygan County is $71,685.
What is the Median Household income in Cheboygan County?
Median Household Income in Cheboygan County is $59,557.
What is Income or Wage Gap in Cheboygan County?
Income or Wage Gap in Cheboygan County is 22.7%.
Women in Cheboygan County earn 77.3 cents for every dollar earned by a man.
What is Family Income Deficit in Cheboygan County?
Family Income Deficit in Cheboygan County is $8,664.
Families that are below poverty line in Cheboygan County earn $8,664 less on average than the poverty threshold level.
What is Inequality or Gini Index in Cheboygan County?
Inequality or Gini Index in Cheboygan County is 0.43.
What is the Total Population of Cheboygan County?
Total Population of Cheboygan County is 25,709.
What is the Total Male Population of Cheboygan County?
Total Male Population of Cheboygan County is 13,072.
What is the Total Female Population of Cheboygan County?
Total Female Population of Cheboygan County is 12,637.
What is the Ratio of Males per 100 Females in Cheboygan County?
There are 103.44 Males per 100 Females in Cheboygan County.
What is the Ratio of Females per 100 Males in Cheboygan County?
There are 96.67 Females per 100 Males in Cheboygan County.
What is the Median Population Age in Cheboygan County?
Median Population Age in Cheboygan County is 52.0 Years.
What is the Average Family Size in Cheboygan County
Average Family Size in Cheboygan County is 2.9 People.
What is the Average Household Size in Cheboygan County
Average Household Size in Cheboygan County is 2.4 People.
How Large is the Labor Force in Cheboygan County?
There are 11,234 People in the Labor Forcein in Cheboygan County.
What is the Percentage of People in the Labor Force in Cheboygan County?
50.6% of People are in the Labor Force in Cheboygan County.
What is the Unemployment Rate in Cheboygan County?
Unemployment Rate in Cheboygan County is 7.2%.