Cass County, MI Map & Demographics
Cass County Map
Cass County Overview
$36,851
PER CAPITA INCOME
$79,502
AVG FAMILY INCOME
$65,183
AVG HOUSEHOLD INCOME
35.7%
WAGE / INCOME GAP [ % ]
64.3¢/ $1
WAGE / INCOME GAP [ $ ]
$11,900
FAMILY INCOME DEFICIT
0.47
INEQUALITY / GINI INDEX
51,604
TOTAL POPULATION
25,911
MALE POPULATION
25,693
FEMALE POPULATION
100.85
MALES / 100 FEMALES
99.16
FEMALES / 100 MALES
45.3
MEDIAN AGE
2.9
AVG FAMILY SIZE
2.5
AVG HOUSEHOLD SIZE
25,194
LABOR FORCE [ PEOPLE ]
59.3%
PERCENT IN LABOR FORCE
5.0%
UNEMPLOYMENT RATE
Cass County Area Codes
Income in Cass County
Income Overview in Cass County
Per Capita Income in Cass County is $36,851, while median incomes of families and households are $79,502 and $65,183 respectively.
| Characteristic | Number | Measure |
| Per Capita Income | 51,604 | $36,851 |
| Median Family Income | 14,138 | $79,502 |
| Mean Family Income | 14,138 | $103,171 |
| Median Household Income | 20,779 | $65,183 |
| Mean Household Income | 20,779 | $90,773 |
| Income Deficit | 14,138 | $11,900 |
| Wage / Income Gap (%) | 51,604 | 35.73% |
| Wage / Income Gap ($) | 51,604 | 64.27¢ per $1 |
| Gini / Inequality Index | 51,604 | 0.47 |
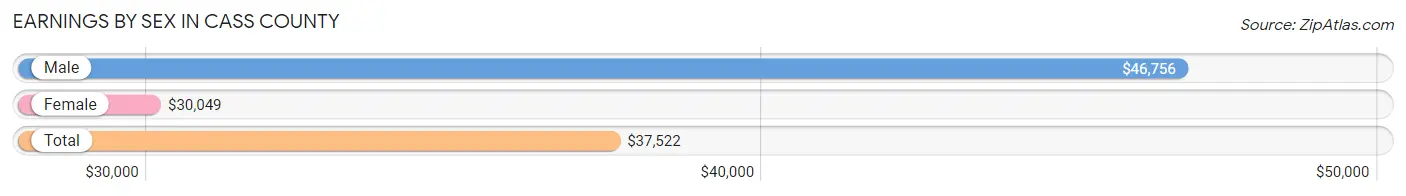
Earnings by Sex in Cass County
Average Earnings in Cass County are $37,522, $46,756 for men and $30,049 for women, a difference of 35.7%.
| Sex | Number | Average Earnings |
| Male | 14,211 (52.7%) | $46,756 |
| Female | 12,751 (47.3%) | $30,049 |
| Total | 26,962 (100.0%) | $37,522 |
Earnings by Sex by Income Bracket in Cass County
The most common earnings brackets in Cass County are $100,000+ for men (2,054 | 14.4%) and $30,000 to $34,999 for women (1,026 | 8.1%).

| Income | Male | Female |
| $2,499 or less | 553 (3.9%) | 1,014 (8.0%) |
| $2,500 to $4,999 | 446 (3.1%) | 845 (6.6%) |
| $5,000 to $7,499 | 393 (2.8%) | 587 (4.6%) |
| $7,500 to $9,999 | 337 (2.4%) | 482 (3.8%) |
| $10,000 to $12,499 | 245 (1.7%) | 462 (3.6%) |
| $12,500 to $14,999 | 278 (2.0%) | 440 (3.5%) |
| $15,000 to $17,499 | 329 (2.3%) | 434 (3.4%) |
| $17,500 to $19,999 | 185 (1.3%) | 320 (2.5%) |
| $20,000 to $22,499 | 412 (2.9%) | 518 (4.1%) |
| $22,500 to $24,999 | 455 (3.2%) | 425 (3.3%) |
| $25,000 to $29,999 | 773 (5.4%) | 834 (6.5%) |
| $30,000 to $34,999 | 679 (4.8%) | 1,026 (8.1%) |
| $35,000 to $39,999 | 885 (6.2%) | 911 (7.1%) |
| $40,000 to $44,999 | 759 (5.3%) | 575 (4.5%) |
| $45,000 to $49,999 | 932 (6.6%) | 522 (4.1%) |
| $50,000 to $54,999 | 631 (4.4%) | 382 (3.0%) |
| $55,000 to $64,999 | 1,563 (11.0%) | 727 (5.7%) |
| $65,000 to $74,999 | 937 (6.6%) | 706 (5.5%) |
| $75,000 to $99,999 | 1,365 (9.6%) | 721 (5.7%) |
| $100,000+ | 2,054 (14.4%) | 820 (6.4%) |
| Total | 14,211 (100.0%) | 12,751 (100.0%) |
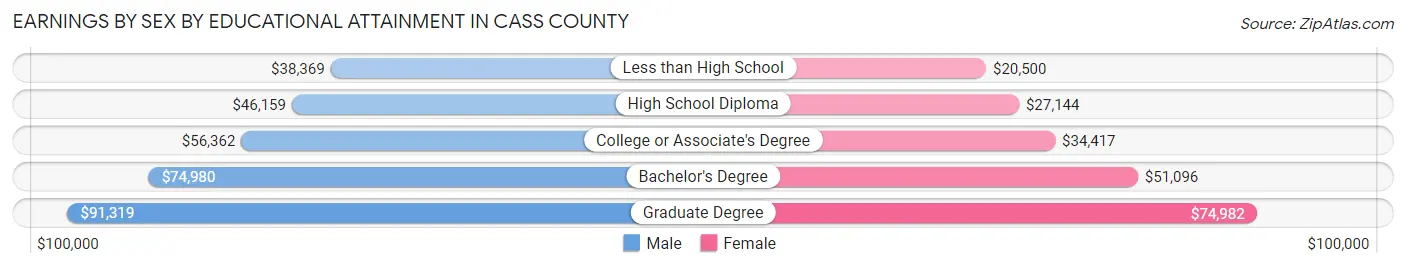
Earnings by Sex by Educational Attainment in Cass County
Average earnings in Cass County are $52,654 for men and $34,603 for women, a difference of 34.3%. Men with an educational attainment of graduate degree enjoy the highest average annual earnings of $91,319, while those with less than high school education earn the least with $38,369. Women with an educational attainment of graduate degree earn the most with the average annual earnings of $74,982, while those with less than high school education have the smallest earnings of $20,500.
| Educational Attainment | Male Income | Female Income |
| Less than High School | $38,369 | $20,500 |
| High School Diploma | $46,159 | $27,144 |
| College or Associate's Degree | $56,362 | $34,417 |
| Bachelor's Degree | $74,980 | $51,096 |
| Graduate Degree | $91,319 | $74,982 |
| Total | $52,654 | $34,603 |
Family Income in Cass County
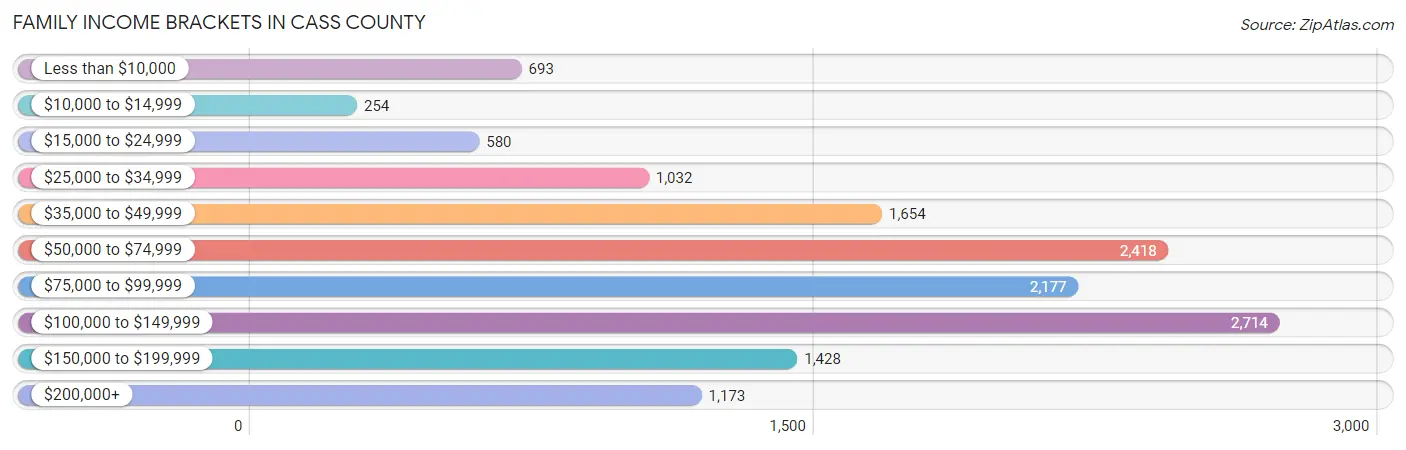
Family Income Brackets in Cass County
According to the Cass County family income data, there are 2,714 families falling into the $100,000 to $149,999 income range, which is the most common income bracket and makes up 19.2% of all families. Conversely, the $10,000 to $14,999 income bracket is the least frequent group with only 254 families (1.8%) belonging to this category.
| Income Bracket | # Families | % Families |
| Less than $10,000 | 693 | 4.9% |
| $10,000 to $14,999 | 254 | 1.8% |
| $15,000 to $24,999 | 580 | 4.1% |
| $25,000 to $34,999 | 1,032 | 7.3% |
| $35,000 to $49,999 | 1,654 | 11.7% |
| $50,000 to $74,999 | 2,418 | 17.1% |
| $75,000 to $99,999 | 2,177 | 15.4% |
| $100,000 to $149,999 | 2,714 | 19.2% |
| $150,000 to $199,999 | 1,428 | 10.1% |
| $200,000+ | 1,173 | 8.3% |
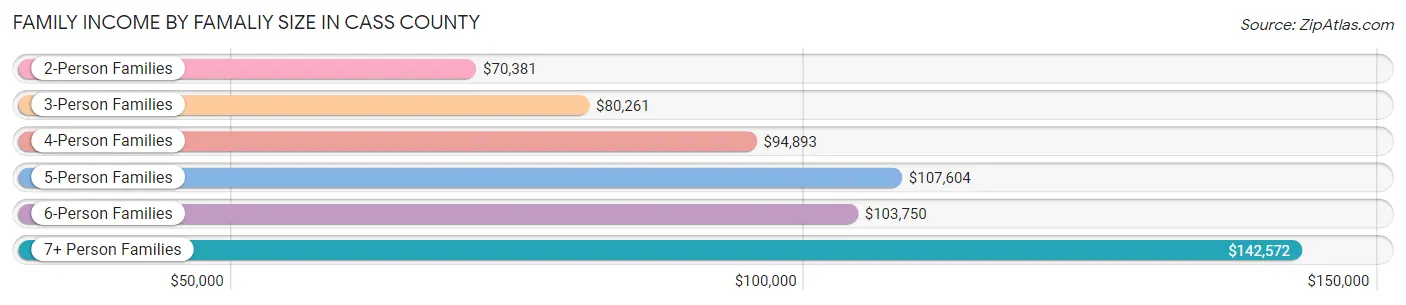
Family Income by Famaliy Size in Cass County
7+ person families (338 | 2.4%) account for the highest median family income in Cass County with $142,572 per family, while 2-person families (7,808 | 55.2%) have the highest median income of $35,190 per family member.
| Income Bracket | # Families | Median Income |
| 2-Person Families | 7,808 (55.2%) | $70,381 |
| 3-Person Families | 2,484 (17.6%) | $80,261 |
| 4-Person Families | 2,023 (14.3%) | $94,893 |
| 5-Person Families | 1,125 (8.0%) | $107,604 |
| 6-Person Families | 360 (2.5%) | $103,750 |
| 7+ Person Families | 338 (2.4%) | $142,572 |
| Total | 14,138 (100.0%) | $79,502 |
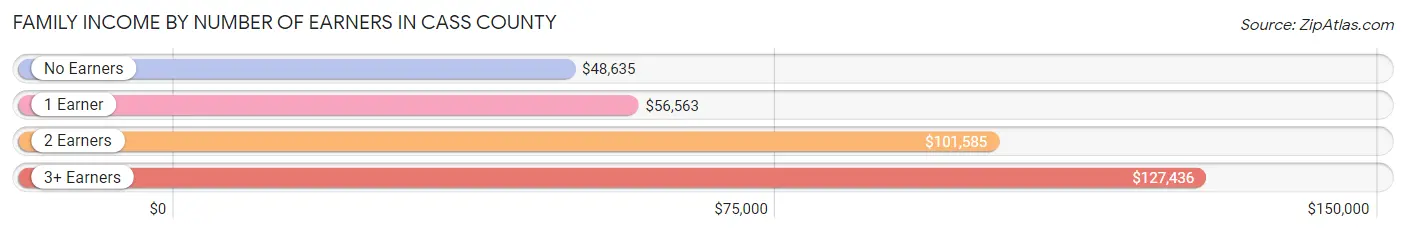
Family Income by Number of Earners in Cass County
The median family income in Cass County is $79,502, with families comprising 3+ earners (1,594) having the highest median family income of $127,436, while families with no earners (2,970) have the lowest median family income of $48,635, accounting for 11.3% and 21.0% of families, respectively.
| Number of Earners | # Families | Median Income |
| No Earners | 2,970 (21.0%) | $48,635 |
| 1 Earner | 4,342 (30.7%) | $56,563 |
| 2 Earners | 5,232 (37.0%) | $101,585 |
| 3+ Earners | 1,594 (11.3%) | $127,436 |
| Total | 14,138 (100.0%) | $79,502 |
Household Income in Cass County
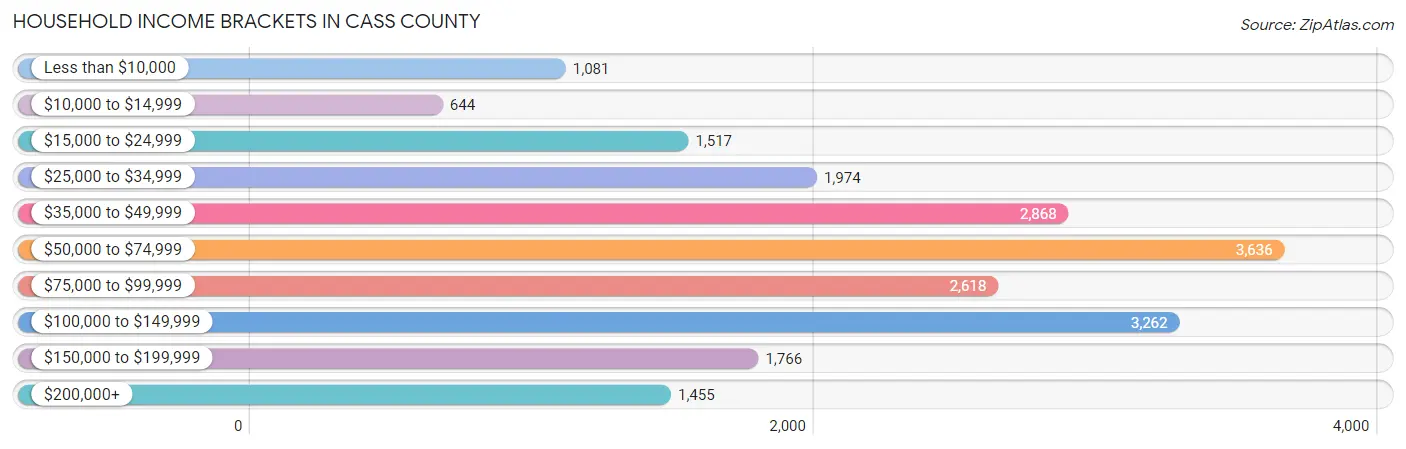
Household Income Brackets in Cass County
With 3,636 households falling in the category, the $50,000 to $74,999 income range is the most frequent in Cass County, accounting for 17.5% of all households. In contrast, only 644 households (3.1%) fall into the $10,000 to $14,999 income bracket, making it the least populous group.
| Income Bracket | # Households | % Households |
| Less than $10,000 | 1,081 | 5.2% |
| $10,000 to $14,999 | 644 | 3.1% |
| $15,000 to $24,999 | 1,517 | 7.3% |
| $25,000 to $34,999 | 1,974 | 9.5% |
| $35,000 to $49,999 | 2,868 | 13.8% |
| $50,000 to $74,999 | 3,636 | 17.5% |
| $75,000 to $99,999 | 2,618 | 12.6% |
| $100,000 to $149,999 | 3,262 | 15.7% |
| $150,000 to $199,999 | 1,766 | 8.5% |
| $200,000+ | 1,455 | 7.0% |
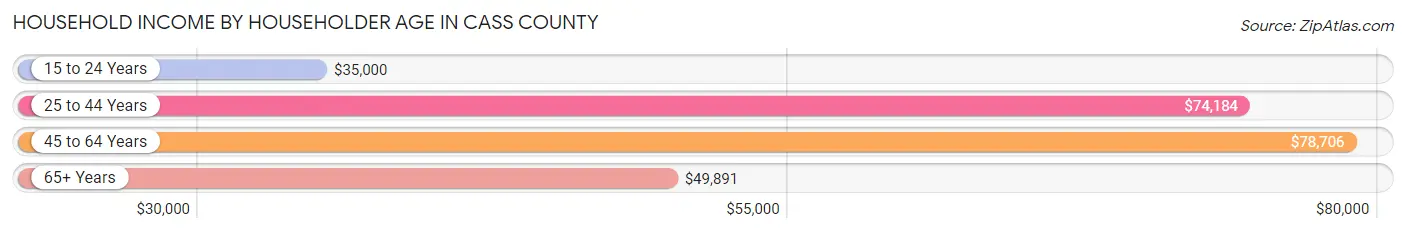
Household Income by Householder Age in Cass County
The median household income in Cass County is $65,183, with the highest median household income of $78,706 found in the 45 to 64 years age bracket for the primary householder. A total of 8,041 households (38.7%) fall into this category. Meanwhile, the 15 to 24 years age bracket for the primary householder has the lowest median household income of $35,000, with 540 households (2.6%) in this group.
| Income Bracket | # Households | Median Income |
| 15 to 24 Years | 540 (2.6%) | $35,000 |
| 25 to 44 Years | 5,285 (25.4%) | $74,184 |
| 45 to 64 Years | 8,041 (38.7%) | $78,706 |
| 65+ Years | 6,913 (33.3%) | $49,891 |
| Total | 20,779 (100.0%) | $65,183 |
Poverty in Cass County
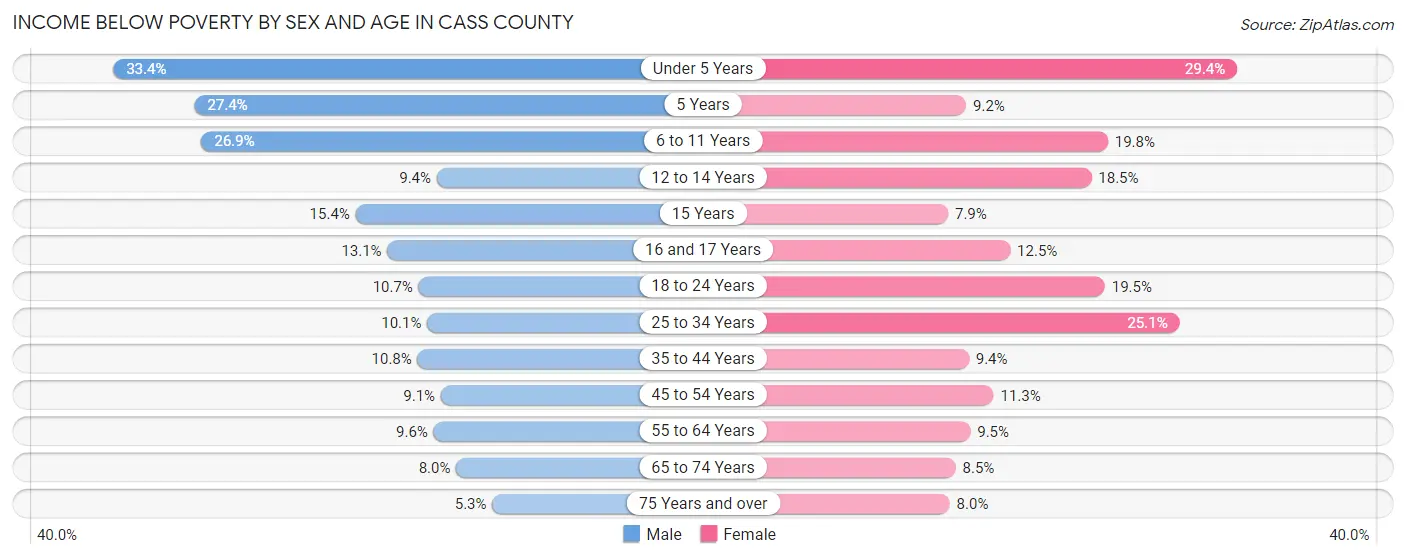
Income Below Poverty by Sex and Age in Cass County
With 11.9% poverty level for males and 13.9% for females among the residents of Cass County, under 5 year old males and under 5 year old females are the most vulnerable to poverty, with 396 males (33.4%) and 351 females (29.3%) in their respective age groups living below the poverty level.
| Age Bracket | Male | Female |
| Under 5 Years | 396 (33.4%) | 351 (29.3%) |
| 5 Years | 66 (27.4%) | 12 (9.2%) |
| 6 to 11 Years | 473 (26.9%) | 322 (19.8%) |
| 12 to 14 Years | 105 (9.4%) | 199 (18.5%) |
| 15 Years | 39 (15.4%) | 27 (7.9%) |
| 16 and 17 Years | 87 (13.1%) | 94 (12.5%) |
| 18 to 24 Years | 223 (10.7%) | 382 (19.5%) |
| 25 to 34 Years | 270 (10.1%) | 650 (25.1%) |
| 35 to 44 Years | 318 (10.8%) | 255 (9.4%) |
| 45 to 54 Years | 309 (9.1%) | 377 (11.3%) |
| 55 to 64 Years | 397 (9.6%) | 380 (9.5%) |
| 65 to 74 Years | 265 (8.0%) | 291 (8.5%) |
| 75 Years and over | 100 (5.3%) | 185 (8.0%) |
| Total | 3,048 (11.9%) | 3,525 (13.9%) |
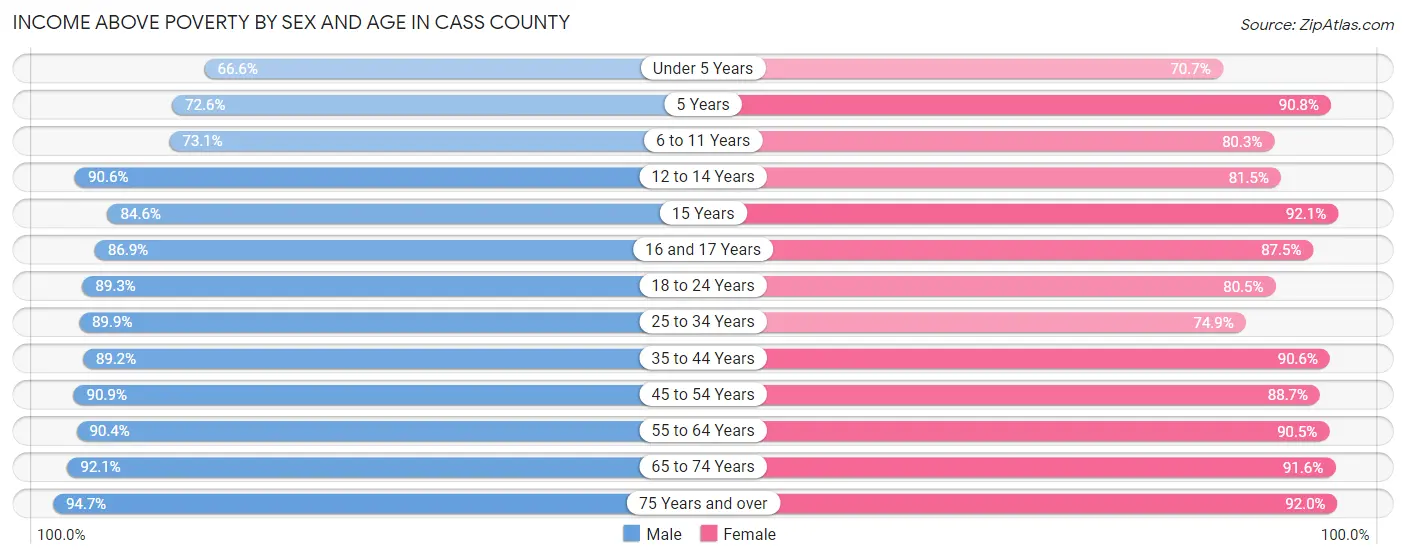
Income Above Poverty by Sex and Age in Cass County
According to the poverty statistics in Cass County, males aged 75 years and over and females aged 15 years are the age groups that are most secure financially, with 94.7% of males and 92.1% of females in these age groups living above the poverty line.
| Age Bracket | Male | Female |
| Under 5 Years | 789 (66.6%) | 845 (70.7%) |
| 5 Years | 175 (72.6%) | 118 (90.8%) |
| 6 to 11 Years | 1,287 (73.1%) | 1,308 (80.2%) |
| 12 to 14 Years | 1,013 (90.6%) | 875 (81.5%) |
| 15 Years | 214 (84.6%) | 315 (92.1%) |
| 16 and 17 Years | 579 (86.9%) | 658 (87.5%) |
| 18 to 24 Years | 1,853 (89.3%) | 1,574 (80.5%) |
| 25 to 34 Years | 2,403 (89.9%) | 1,943 (74.9%) |
| 35 to 44 Years | 2,620 (89.2%) | 2,448 (90.6%) |
| 45 to 54 Years | 3,092 (90.9%) | 2,968 (88.7%) |
| 55 to 64 Years | 3,726 (90.4%) | 3,604 (90.5%) |
| 65 to 74 Years | 3,070 (92.0%) | 3,153 (91.5%) |
| 75 Years and over | 1,797 (94.7%) | 2,125 (92.0%) |
| Total | 22,618 (88.1%) | 21,934 (86.2%) |
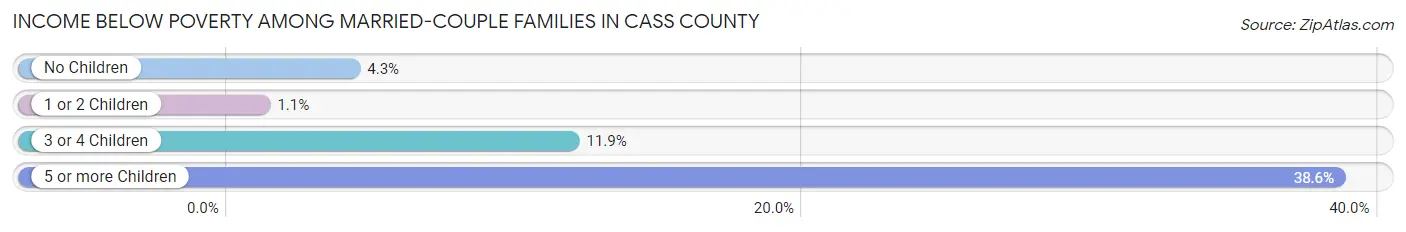
Income Below Poverty Among Married-Couple Families in Cass County
The poverty statistics for married-couple families in Cass County show that 4.4% or 477 of the total 10,817 families live below the poverty line. Families with 5 or more children have the highest poverty rate of 38.6%, comprising of 54 families. On the other hand, families with 1 or 2 children have the lowest poverty rate of 1.1%, which includes 31 families.
| Children | Above Poverty | Below Poverty |
| No Children | 6,902 (95.7%) | 307 (4.3%) |
| 1 or 2 Children | 2,722 (98.9%) | 31 (1.1%) |
| 3 or 4 Children | 630 (88.1%) | 85 (11.9%) |
| 5 or more Children | 86 (61.4%) | 54 (38.6%) |
| Total | 10,340 (95.6%) | 477 (4.4%) |
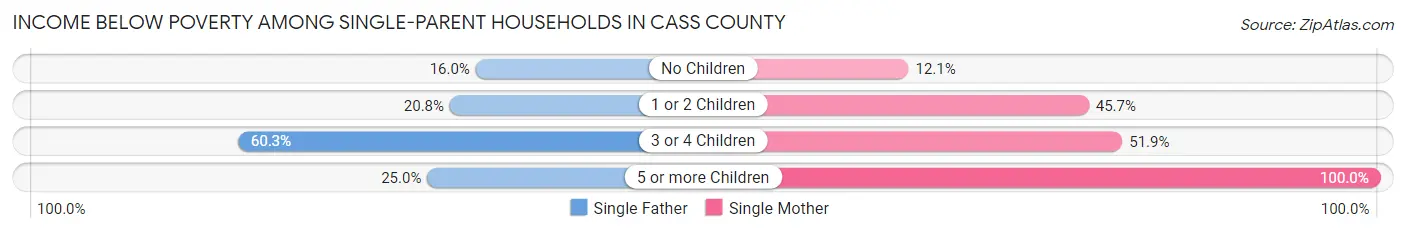
Income Below Poverty Among Single-Parent Households in Cass County
According to the poverty data in Cass County, 20.9% or 252 single-father households and 36.5% or 773 single-mother households are living below the poverty line. Among single-father households, those with 3 or 4 children have the highest poverty rate, with 44 households (60.3%) experiencing poverty. Likewise, among single-mother households, those with 5 or more children have the highest poverty rate, with 60 households (100.0%) falling below the poverty line.
| Children | Single Father | Single Mother |
| No Children | 93 (16.0%) | 89 (12.1%) |
| 1 or 2 Children | 110 (20.8%) | 446 (45.7%) |
| 3 or 4 Children | 44 (60.3%) | 178 (51.9%) |
| 5 or more Children | 5 (25.0%) | 60 (100.0%) |
| Total | 252 (20.9%) | 773 (36.5%) |
Income Below Poverty Among Married-Couple vs Single-Parent Households in Cass County
The poverty data for Cass County shows that 477 of the married-couple family households (4.4%) and 1,025 of the single-parent households (30.9%) are living below the poverty level. Within the married-couple family households, those with 5 or more children have the highest poverty rate, with 54 households (38.6%) falling below the poverty line. Among the single-parent households, those with 5 or more children have the highest poverty rate, with 65 household (81.2%) living below poverty.
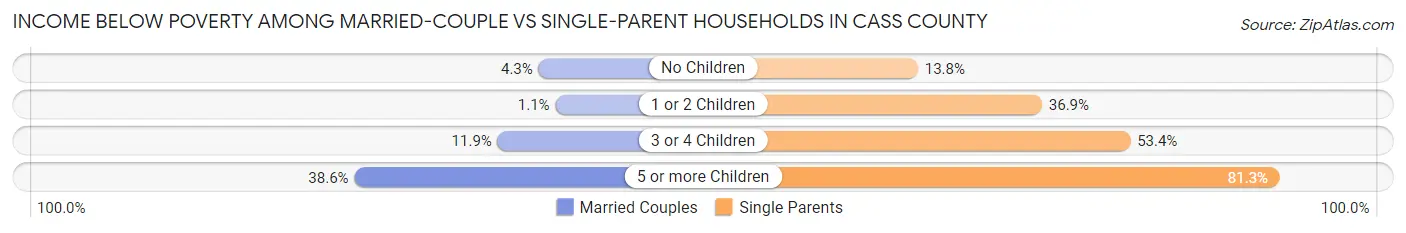
| Children | Married-Couple Families | Single-Parent Households |
| No Children | 307 (4.3%) | 182 (13.8%) |
| 1 or 2 Children | 31 (1.1%) | 556 (36.9%) |
| 3 or 4 Children | 85 (11.9%) | 222 (53.4%) |
| 5 or more Children | 54 (38.6%) | 65 (81.2%) |
| Total | 477 (4.4%) | 1,025 (30.9%) |
Race in Cass County
The most populous races in Cass County are White / Caucasian (44,494 | 86.2%), Two or more Races (2,634 | 5.1%), and Black / African American (2,531 | 4.9%).
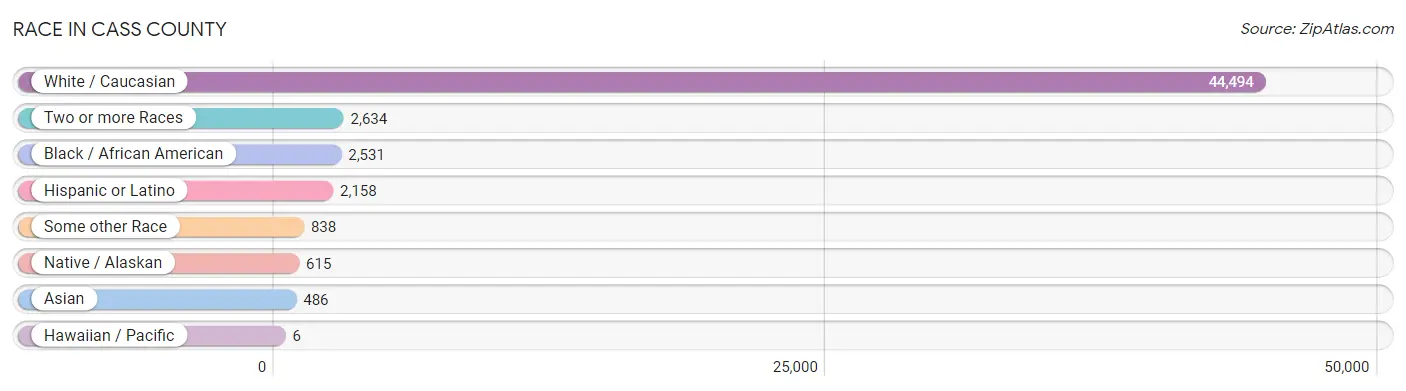
| Race | # Population | % Population |
| Asian | 486 | 0.9% |
| Black / African American | 2,531 | 4.9% |
| Hawaiian / Pacific | 6 | 0.0% |
| Hispanic or Latino | 2,158 | 4.2% |
| Native / Alaskan | 615 | 1.2% |
| White / Caucasian | 44,494 | 86.2% |
| Two or more Races | 2,634 | 5.1% |
| Some other Race | 838 | 1.6% |
| Total | 51,604 | 100.0% |
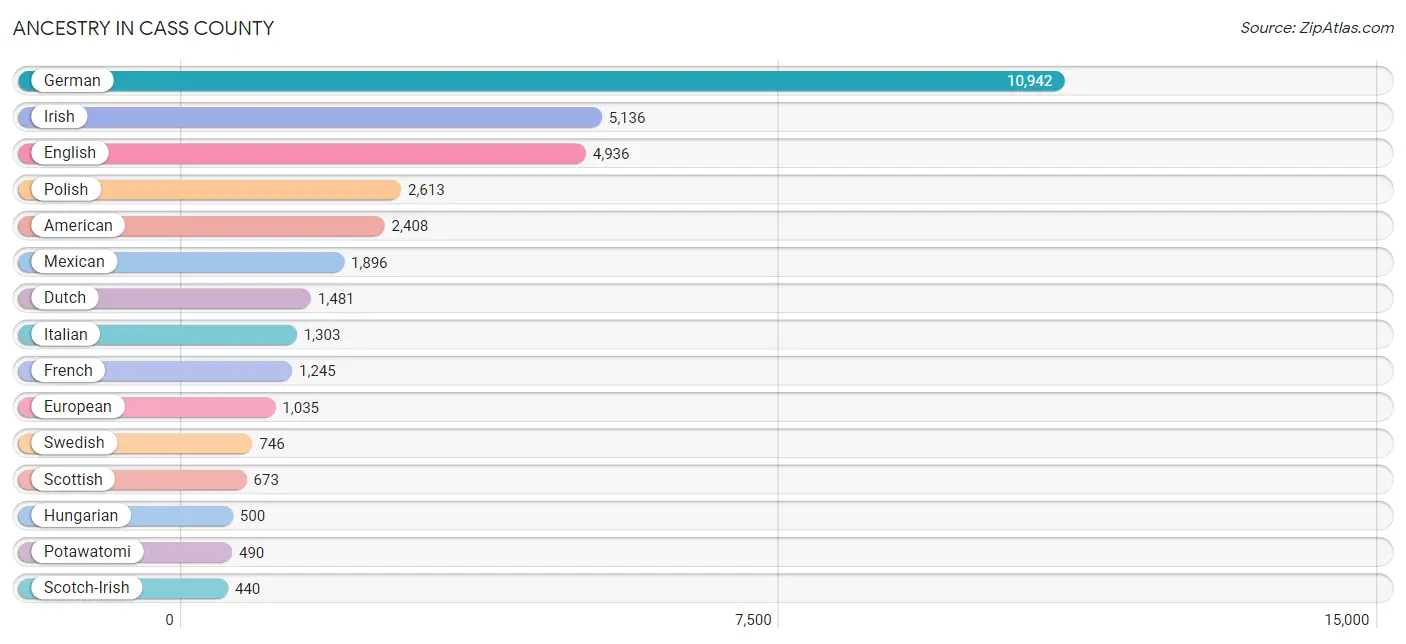
Ancestry in Cass County
The most populous ancestries reported in Cass County are German (10,942 | 21.2%), Irish (5,136 | 10.0%), English (4,936 | 9.6%), Polish (2,613 | 5.1%), and American (2,408 | 4.7%), together accounting for 50.4% of all Cass County residents.
| Ancestry | # Population | % Population |
| African | 44 | 0.1% |
| Alsatian | 5 | 0.0% |
| American | 2,408 | 4.7% |
| Apache | 7 | 0.0% |
| Arab | 98 | 0.2% |
| Assyrian / Chaldean / Syriac | 5 | 0.0% |
| Austrian | 104 | 0.2% |
| Bangladeshi | 3 | 0.0% |
| Belgian | 169 | 0.3% |
| Bhutanese | 23 | 0.0% |
| Blackfeet | 34 | 0.1% |
| Brazilian | 35 | 0.1% |
| British | 168 | 0.3% |
| Burmese | 82 | 0.2% |
| Canadian | 11 | 0.0% |
| Central American | 106 | 0.2% |
| Central American Indian | 11 | 0.0% |
| Cherokee | 166 | 0.3% |
| Chippewa | 75 | 0.2% |
| Comanche | 1 | 0.0% |
| Costa Rican | 25 | 0.1% |
| Croatian | 71 | 0.1% |
| Cuban | 23 | 0.0% |
| Czech | 136 | 0.3% |
| Czechoslovakian | 29 | 0.1% |
| Danish | 263 | 0.5% |
| Dutch | 1,481 | 2.9% |
| Eastern European | 127 | 0.3% |
| Egyptian | 19 | 0.0% |
| English | 4,936 | 9.6% |
| European | 1,035 | 2.0% |
| Filipino | 11 | 0.0% |
| Finnish | 156 | 0.3% |
| French | 1,245 | 2.4% |
| French American Indian | 17 | 0.0% |
| French Canadian | 159 | 0.3% |
| German | 10,942 | 21.2% |
| Greek | 43 | 0.1% |
| Guamanian / Chamorro | 13 | 0.0% |
| Guatemalan | 61 | 0.1% |
| Honduran | 17 | 0.0% |
| Hungarian | 500 | 1.0% |
| Indian (Asian) | 47 | 0.1% |
| Inupiat | 11 | 0.0% |
| Iranian | 4 | 0.0% |
| Irish | 5,136 | 10.0% |
| Iroquois | 31 | 0.1% |
| Italian | 1,303 | 2.5% |
| Jamaican | 74 | 0.1% |
| Korean | 184 | 0.4% |
| Laotian | 30 | 0.1% |
| Latvian | 6 | 0.0% |
| Lebanese | 66 | 0.1% |
| Liberian | 6 | 0.0% |
| Lithuanian | 119 | 0.2% |
| Macedonian | 30 | 0.1% |
| Malaysian | 95 | 0.2% |
| Maltese | 6 | 0.0% |
| Mexican | 1,896 | 3.7% |
| Mexican American Indian | 25 | 0.1% |
| Native Hawaiian | 6 | 0.0% |
| Nigerian | 7 | 0.0% |
| Norwegian | 366 | 0.7% |
| Ottawa | 12 | 0.0% |
| Pakistani | 39 | 0.1% |
| Pennsylvania German | 126 | 0.2% |
| Polish | 2,613 | 5.1% |
| Portuguese | 43 | 0.1% |
| Potawatomi | 490 | 0.9% |
| Puerto Rican | 77 | 0.2% |
| Romanian | 30 | 0.1% |
| Russian | 150 | 0.3% |
| Salvadoran | 3 | 0.0% |
| Samoan | 5 | 0.0% |
| Scandinavian | 193 | 0.4% |
| Scotch-Irish | 440 | 0.9% |
| Scottish | 673 | 1.3% |
| Serbian | 25 | 0.1% |
| Sioux | 7 | 0.0% |
| Slovak | 20 | 0.0% |
| Slovene | 34 | 0.1% |
| Spanish | 7 | 0.0% |
| Sri Lankan | 46 | 0.1% |
| Subsaharan African | 74 | 0.1% |
| Swedish | 746 | 1.5% |
| Swiss | 181 | 0.4% |
| Syrian | 3 | 0.0% |
| Thai | 44 | 0.1% |
| Trinidadian and Tobagonian | 67 | 0.1% |
| Turkish | 25 | 0.1% |
| Ugandan | 17 | 0.0% |
| Ukrainian | 107 | 0.2% |
| Welsh | 241 | 0.5% |
| Yugoslavian | 9 | 0.0% | View All 94 Rows |
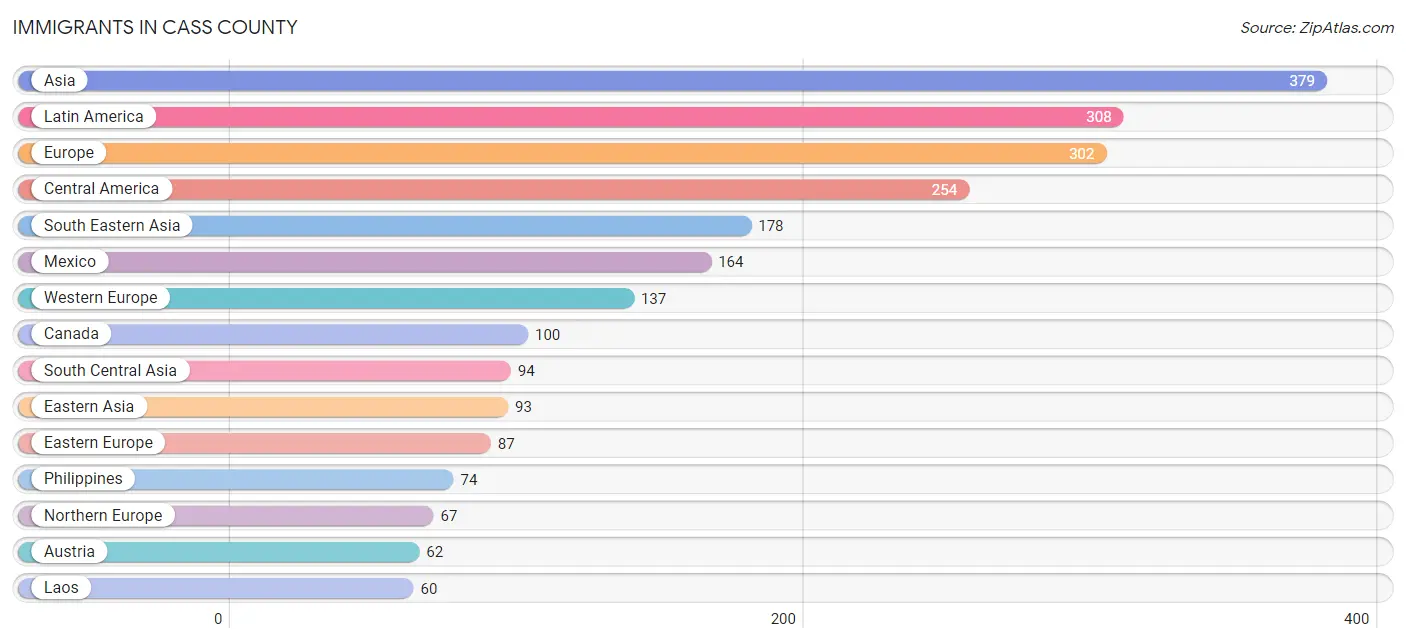
Immigrants in Cass County
The most numerous immigrant groups reported in Cass County came from Asia (379 | 0.7%), Latin America (308 | 0.6%), Europe (302 | 0.6%), Central America (254 | 0.5%), and South Eastern Asia (178 | 0.3%), together accounting for 2.7% of all Cass County residents.
| Immigration Origin | # Population | % Population |
| Africa | 45 | 0.1% |
| Asia | 379 | 0.7% |
| Austria | 62 | 0.1% |
| Brazil | 39 | 0.1% |
| Canada | 100 | 0.2% |
| Caribbean | 15 | 0.0% |
| Central America | 254 | 0.5% |
| China | 47 | 0.1% |
| Costa Rica | 25 | 0.1% |
| Eastern Africa | 19 | 0.0% |
| Eastern Asia | 93 | 0.2% |
| Eastern Europe | 87 | 0.2% |
| Egypt | 13 | 0.0% |
| England | 4 | 0.0% |
| Europe | 302 | 0.6% |
| France | 9 | 0.0% |
| Germany | 55 | 0.1% |
| Guatemala | 35 | 0.1% |
| Hungary | 6 | 0.0% |
| India | 23 | 0.0% |
| Ireland | 4 | 0.0% |
| Jamaica | 15 | 0.0% |
| Korea | 46 | 0.1% |
| Laos | 60 | 0.1% |
| Latin America | 308 | 0.6% |
| Liberia | 6 | 0.0% |
| Mexico | 164 | 0.3% |
| Nepal | 13 | 0.0% |
| Netherlands | 4 | 0.0% |
| Northern Africa | 13 | 0.0% |
| Northern Europe | 67 | 0.1% |
| Oceania | 31 | 0.1% |
| Pakistan | 30 | 0.1% |
| Panama | 30 | 0.1% |
| Philippines | 74 | 0.1% |
| Poland | 42 | 0.1% |
| Portugal | 6 | 0.0% |
| Scotland | 12 | 0.0% |
| South America | 39 | 0.1% |
| South Central Asia | 94 | 0.2% |
| South Eastern Asia | 178 | 0.3% |
| Southern Europe | 6 | 0.0% |
| Sri Lanka | 28 | 0.1% |
| Switzerland | 7 | 0.0% |
| Syria | 14 | 0.0% |
| Taiwan | 11 | 0.0% |
| Thailand | 43 | 0.1% |
| Uganda | 17 | 0.0% |
| Ukraine | 14 | 0.0% |
| Vietnam | 1 | 0.0% |
| Western Africa | 6 | 0.0% |
| Western Asia | 14 | 0.0% |
| Western Europe | 137 | 0.3% |
| Zimbabwe | 2 | 0.0% | View All 54 Rows |
Sex and Age in Cass County
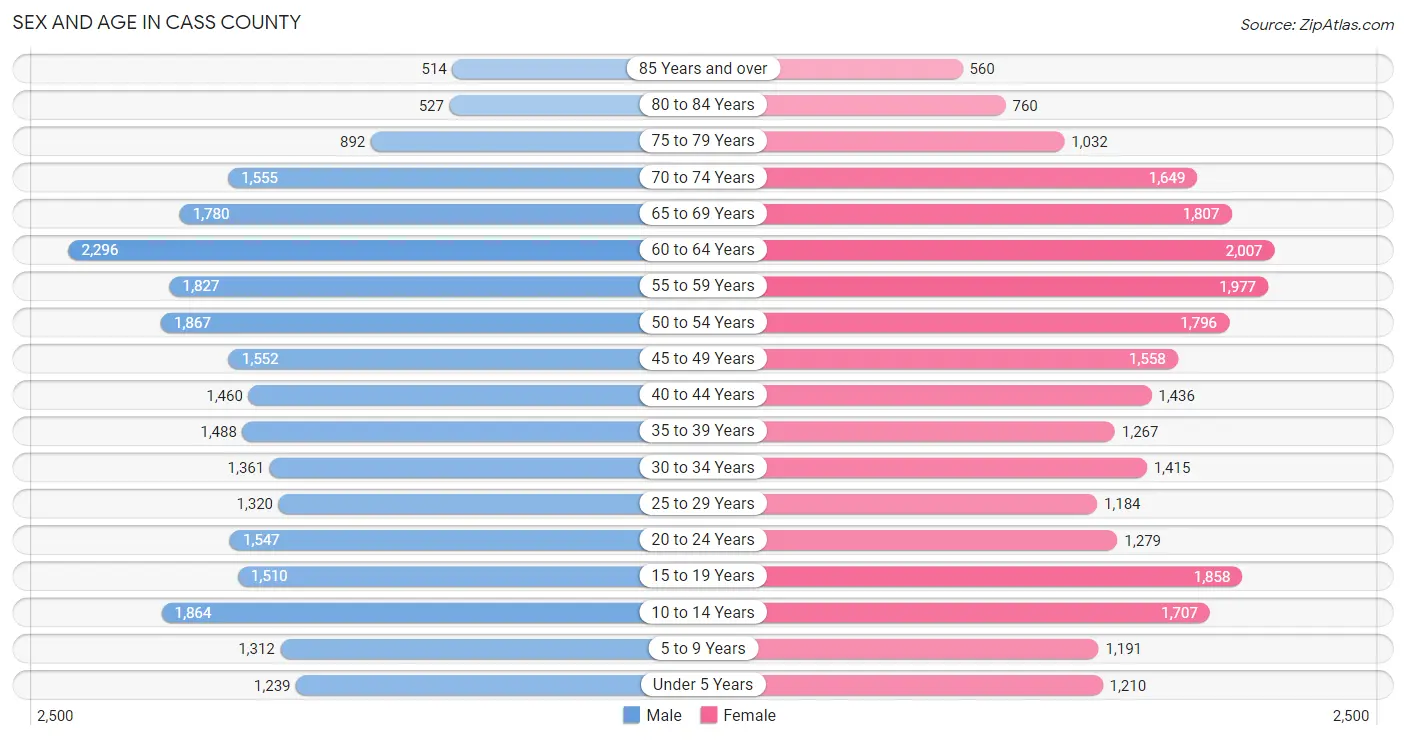
Sex and Age in Cass County
The most populous age groups in Cass County are 60 to 64 Years (2,296 | 8.9%) for men and 60 to 64 Years (2,007 | 7.8%) for women.
| Age Bracket | Male | Female |
| Under 5 Years | 1,239 (4.8%) | 1,210 (4.7%) |
| 5 to 9 Years | 1,312 (5.1%) | 1,191 (4.6%) |
| 10 to 14 Years | 1,864 (7.2%) | 1,707 (6.6%) |
| 15 to 19 Years | 1,510 (5.8%) | 1,858 (7.2%) |
| 20 to 24 Years | 1,547 (6.0%) | 1,279 (5.0%) |
| 25 to 29 Years | 1,320 (5.1%) | 1,184 (4.6%) |
| 30 to 34 Years | 1,361 (5.2%) | 1,415 (5.5%) |
| 35 to 39 Years | 1,488 (5.7%) | 1,267 (4.9%) |
| 40 to 44 Years | 1,460 (5.6%) | 1,436 (5.6%) |
| 45 to 49 Years | 1,552 (6.0%) | 1,558 (6.1%) |
| 50 to 54 Years | 1,867 (7.2%) | 1,796 (7.0%) |
| 55 to 59 Years | 1,827 (7.0%) | 1,977 (7.7%) |
| 60 to 64 Years | 2,296 (8.9%) | 2,007 (7.8%) |
| 65 to 69 Years | 1,780 (6.9%) | 1,807 (7.0%) |
| 70 to 74 Years | 1,555 (6.0%) | 1,649 (6.4%) |
| 75 to 79 Years | 892 (3.4%) | 1,032 (4.0%) |
| 80 to 84 Years | 527 (2.0%) | 760 (3.0%) |
| 85 Years and over | 514 (2.0%) | 560 (2.2%) |
| Total | 25,911 (100.0%) | 25,693 (100.0%) |
Families and Households in Cass County
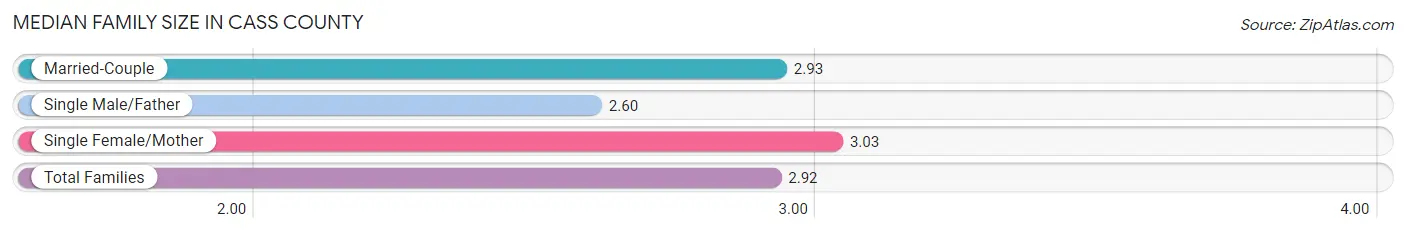
Median Family Size in Cass County
The median family size in Cass County is 2.92 persons per family, with single female/mother families (2,117 | 15.0%) accounting for the largest median family size of 3.03 persons per family. On the other hand, single male/father families (1,204 | 8.5%) represent the smallest median family size with 2.60 persons per family.
| Family Type | # Families | Family Size |
| Married-Couple | 10,817 (76.5%) | 2.93 |
| Single Male/Father | 1,204 (8.5%) | 2.60 |
| Single Female/Mother | 2,117 (15.0%) | 3.03 |
| Total Families | 14,138 (100.0%) | 2.92 |
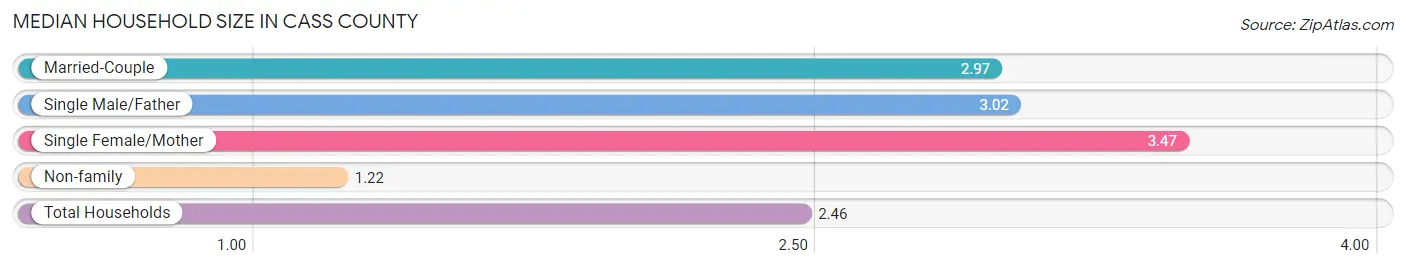
Median Household Size in Cass County
The median household size in Cass County is 2.46 persons per household, with single female/mother households (2,117 | 10.2%) accounting for the largest median household size of 3.47 persons per household. non-family households (6,641 | 32.0%) represent the smallest median household size with 1.22 persons per household.
| Household Type | # Households | Household Size |
| Married-Couple | 10,817 (52.1%) | 2.97 |
| Single Male/Father | 1,204 (5.8%) | 3.02 |
| Single Female/Mother | 2,117 (10.2%) | 3.47 |
| Non-family | 6,641 (32.0%) | 1.22 |
| Total Households | 20,779 (100.0%) | 2.46 |
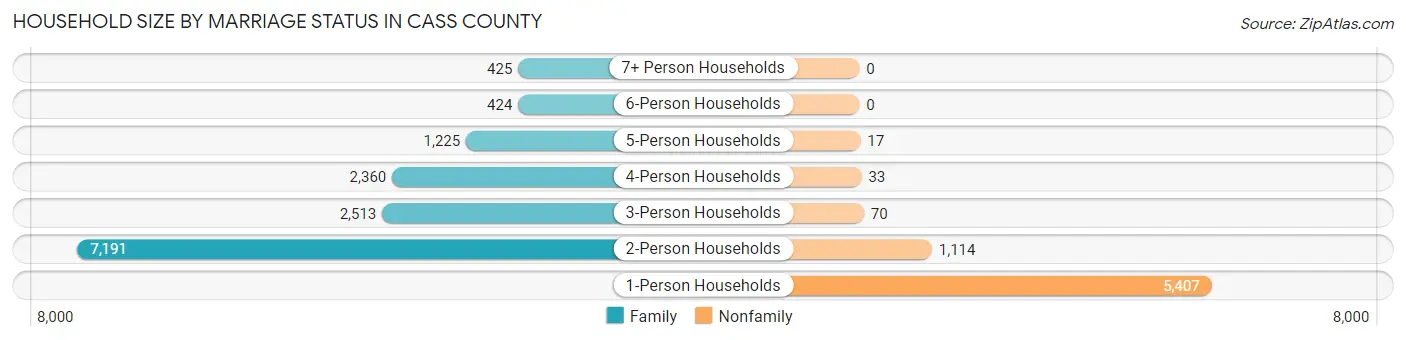
Household Size by Marriage Status in Cass County
Out of a total of 20,779 households in Cass County, 14,138 (68.0%) are family households, while 6,641 (32.0%) are nonfamily households. The most numerous type of family households are 2-person households, comprising 7,191, and the most common type of nonfamily households are 1-person households, comprising 5,407.
| Household Size | Family Households | Nonfamily Households |
| 1-Person Households | - | 5,407 (26.0%) |
| 2-Person Households | 7,191 (34.6%) | 1,114 (5.4%) |
| 3-Person Households | 2,513 (12.1%) | 70 (0.3%) |
| 4-Person Households | 2,360 (11.4%) | 33 (0.2%) |
| 5-Person Households | 1,225 (5.9%) | 17 (0.1%) |
| 6-Person Households | 424 (2.0%) | 0 (0.0%) |
| 7+ Person Households | 425 (2.1%) | 0 (0.0%) |
| Total | 14,138 (68.0%) | 6,641 (32.0%) |
Female Fertility in Cass County
Fertility by Age in Cass County
Average fertility rate in Cass County is 54.0 births per 1,000 women. Women in the age bracket of 20 to 34 years have the highest fertility rate with 114.0 births per 1,000 women. Women in the age bracket of 20 to 34 years acount for 77.5% of all women with births.
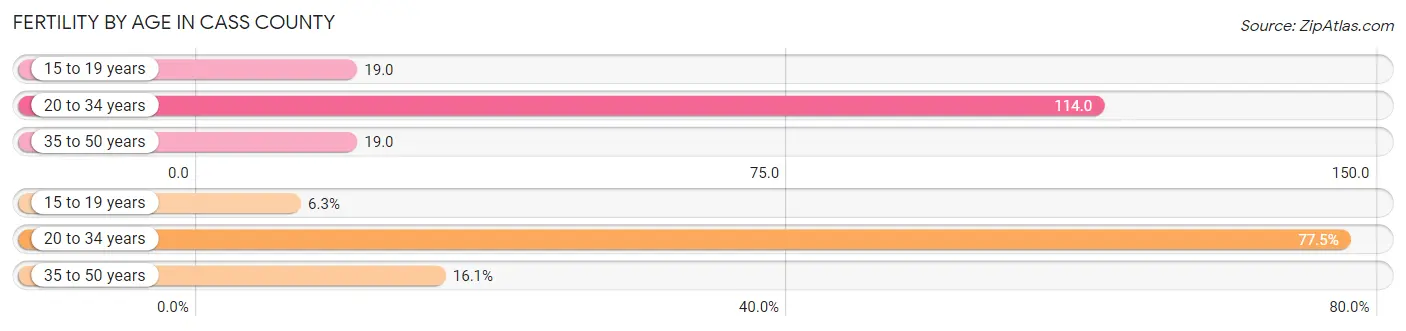
| Age Bracket | Women with Births | Births / 1,000 Women |
| 15 to 19 years | 36 (6.3%) | 19.0 |
| 20 to 34 years | 442 (77.5%) | 114.0 |
| 35 to 50 years | 92 (16.1%) | 19.0 |
| Total | 570 (100.0%) | 54.0 |
Fertility by Age by Marriage Status in Cass County
59.3% of women with births (570) in Cass County are married. The highest percentage of unmarried women with births falls into 15 to 19 years age bracket with 100.0% of them unmarried at the time of birth, while the lowest percentage of unmarried women with births belong to 35 to 50 years age bracket with 6.5% of them unmarried.
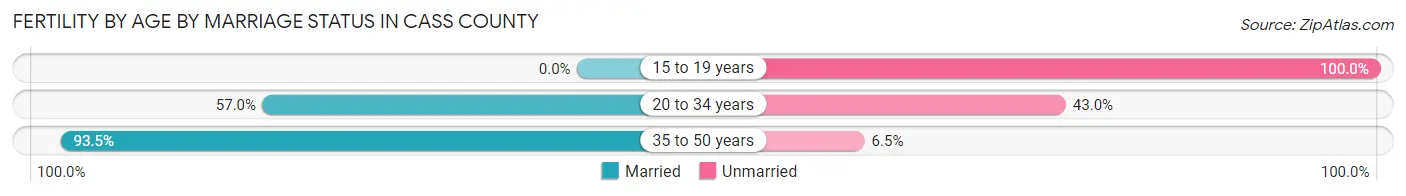
| Age Bracket | Married | Unmarried |
| 15 to 19 years | 0 (0.0%) | 36 (100.0%) |
| 20 to 34 years | 252 (57.0%) | 190 (43.0%) |
| 35 to 50 years | 86 (93.5%) | 6 (6.5%) |
| Total | 338 (59.3%) | 232 (40.7%) |
Fertility by Education in Cass County
Average fertility rate in Cass County is 54.0 births per 1,000 women. Women with the education attainment of bachelor's degree have the highest fertility rate of 98.0 births per 1,000 women, while women with the education attainment of less than high school have the lowest fertility at 30.0 births per 1,000 women. Women with the education attainment of high school diploma represent 30.0% of all women with births.
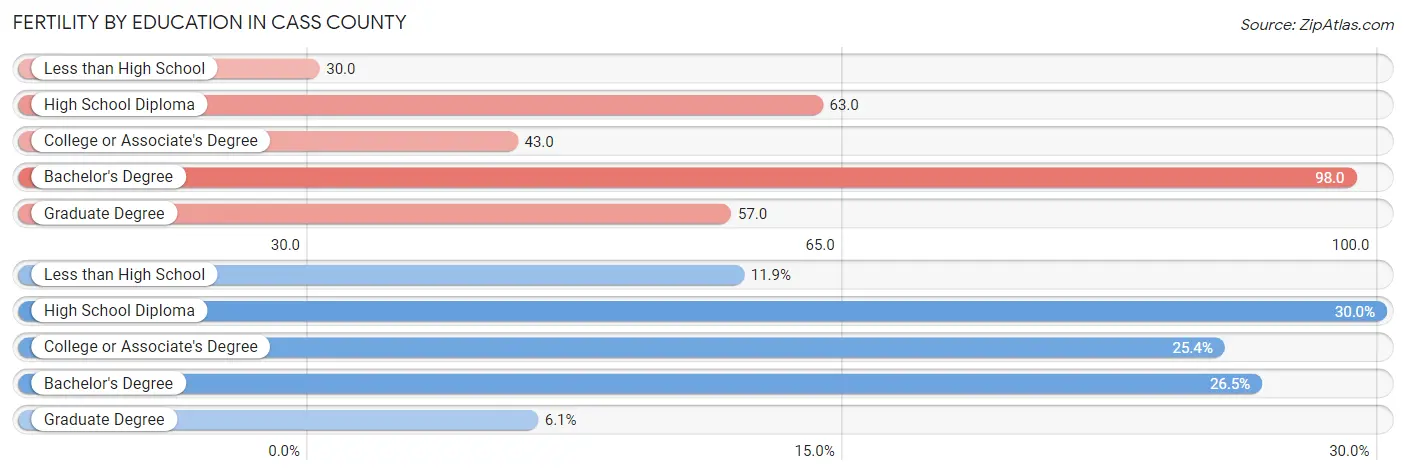
| Educational Attainment | Women with Births | Births / 1,000 Women |
| Less than High School | 68 (11.9%) | 30.0 |
| High School Diploma | 171 (30.0%) | 63.0 |
| College or Associate's Degree | 145 (25.4%) | 43.0 |
| Bachelor's Degree | 151 (26.5%) | 98.0 |
| Graduate Degree | 35 (6.1%) | 57.0 |
| Total | 570 (100.0%) | 54.0 |
Fertility by Education by Marriage Status in Cass County
40.7% of women with births in Cass County are unmarried. Women with the educational attainment of bachelor's degree are most likely to be married with 100.0% of them married at childbirth, while women with the educational attainment of less than high school are least likely to be married with 83.8% of them unmarried at childbirth.
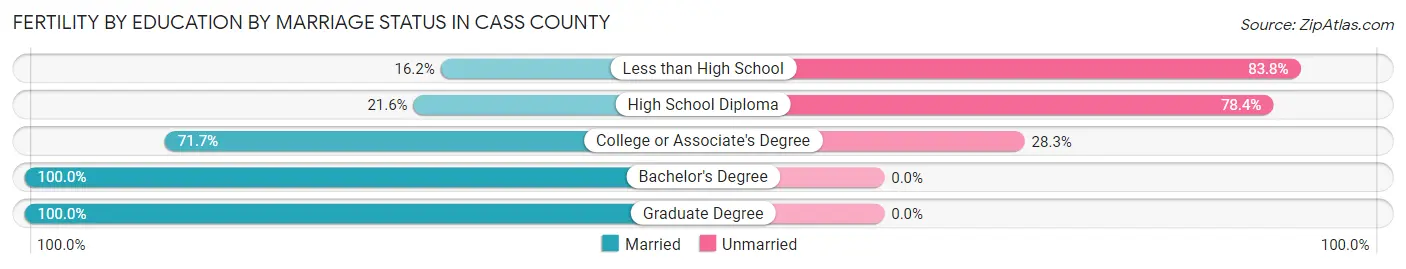
| Educational Attainment | Married | Unmarried |
| Less than High School | 11 (16.2%) | 57 (83.8%) |
| High School Diploma | 37 (21.6%) | 134 (78.4%) |
| College or Associate's Degree | 104 (71.7%) | 41 (28.3%) |
| Bachelor's Degree | 151 (100.0%) | 0 (0.0%) |
| Graduate Degree | 35 (100.0%) | 0 (0.0%) |
| Total | 338 (59.3%) | 232 (40.7%) |
Employment Characteristics in Cass County
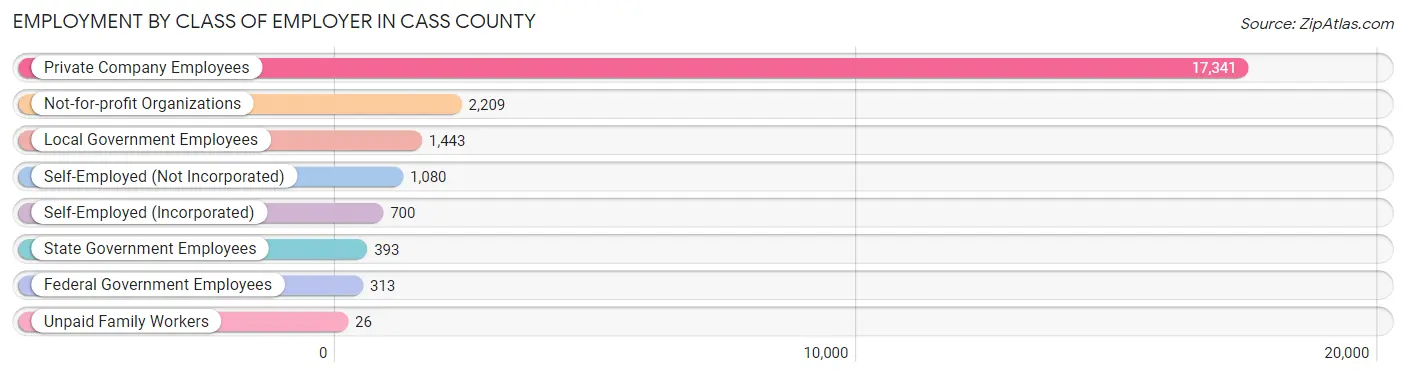
Employment by Class of Employer in Cass County
Among the 23,505 employed individuals in Cass County, private company employees (17,341 | 73.8%), not-for-profit organizations (2,209 | 9.4%), and local government employees (1,443 | 6.1%) make up the most common classes of employment.
| Employer Class | # Employees | % Employees |
| Private Company Employees | 17,341 | 73.8% |
| Self-Employed (Incorporated) | 700 | 3.0% |
| Self-Employed (Not Incorporated) | 1,080 | 4.6% |
| Not-for-profit Organizations | 2,209 | 9.4% |
| Local Government Employees | 1,443 | 6.1% |
| State Government Employees | 393 | 1.7% |
| Federal Government Employees | 313 | 1.3% |
| Unpaid Family Workers | 26 | 0.1% |
| Total | 23,505 | 100.0% |
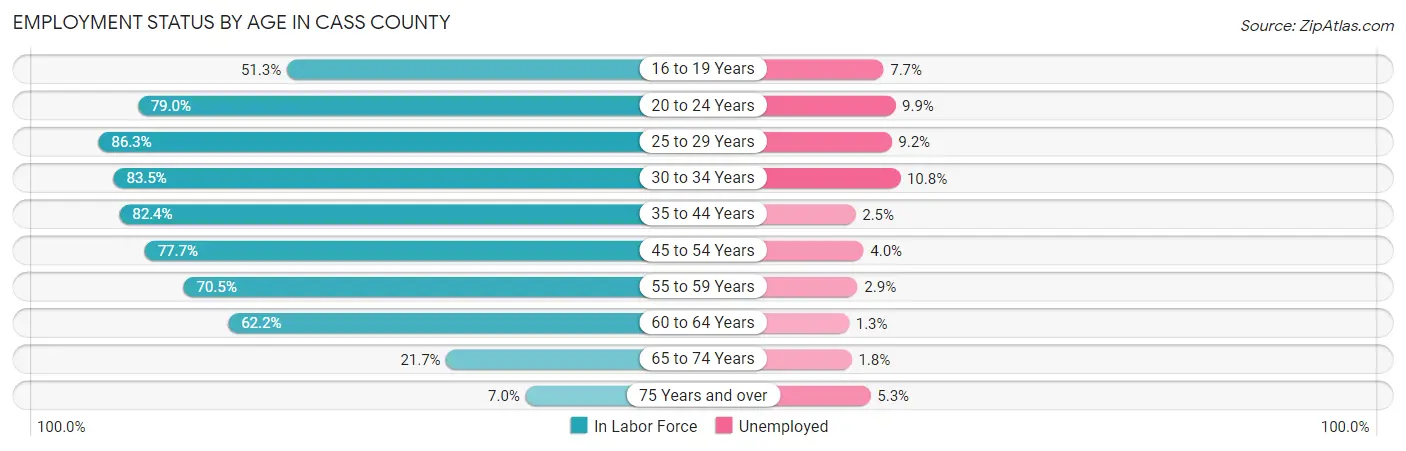
Employment Status by Age in Cass County
According to the labor force statistics for Cass County, out of the total population over 16 years of age (42,486), 59.3% or 25,194 individuals are in the labor force, with 5.0% or 1,260 of them unemployed. The age group with the highest labor force participation rate is 25 to 29 years, with 86.3% or 2,161 individuals in the labor force. Within the labor force, the 30 to 34 years age range has the highest percentage of unemployed individuals, with 10.8% or 250 of them being unemployed.
| Age Bracket | In Labor Force | Unemployed |
| 16 to 19 Years | 1,423 (51.3%) | 110 (7.7%) |
| 20 to 24 Years | 2,233 (79.0%) | 221 (9.9%) |
| 25 to 29 Years | 2,161 (86.3%) | 199 (9.2%) |
| 30 to 34 Years | 2,318 (83.5%) | 250 (10.8%) |
| 35 to 44 Years | 4,656 (82.4%) | 116 (2.5%) |
| 45 to 54 Years | 5,263 (77.7%) | 211 (4.0%) |
| 55 to 59 Years | 2,682 (70.5%) | 78 (2.9%) |
| 60 to 64 Years | 2,676 (62.2%) | 35 (1.3%) |
| 65 to 74 Years | 1,474 (21.7%) | 27 (1.8%) |
| 75 Years and over | 300 (7.0%) | 16 (5.3%) |
| Total | 25,194 (59.3%) | 1,260 (5.0%) |
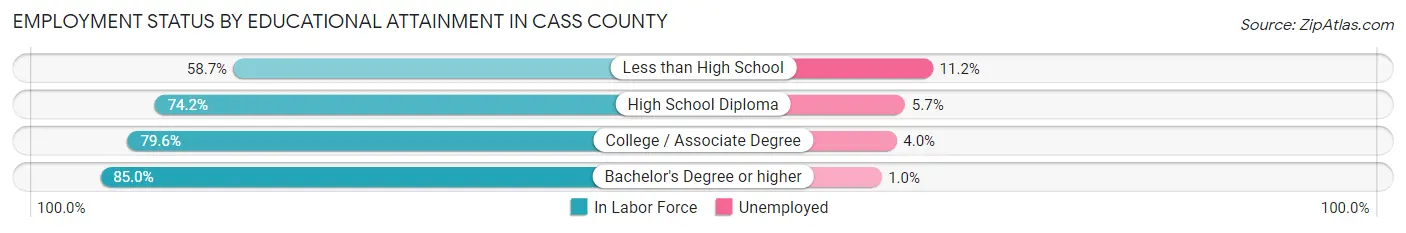
Employment Status by Educational Attainment in Cass County
According to labor force statistics for Cass County, 76.5% of individuals (19,745) out of the total population between 25 and 64 years of age (25,811) are in the labor force, with 4.5% or 889 of them being unemployed. The group with the highest labor force participation rate are those with the educational attainment of bachelor's degree or higher, with 85.0% or 4,467 individuals in the labor force. Within the labor force, individuals with less than high school education have the highest percentage of unemployment, with 11.2% or 200 of them being unemployed.
| Educational Attainment | In Labor Force | Unemployed |
| Less than High School | 1,786 (58.7%) | 341 (11.2%) |
| High School Diploma | 6,118 (74.2%) | 470 (5.7%) |
| College / Associate Degree | 7,378 (79.6%) | 371 (4.0%) |
| Bachelor's Degree or higher | 4,467 (85.0%) | 53 (1.0%) |
| Total | 19,745 (76.5%) | 1,161 (4.5%) |
Employment Occupations by Sex in Cass County
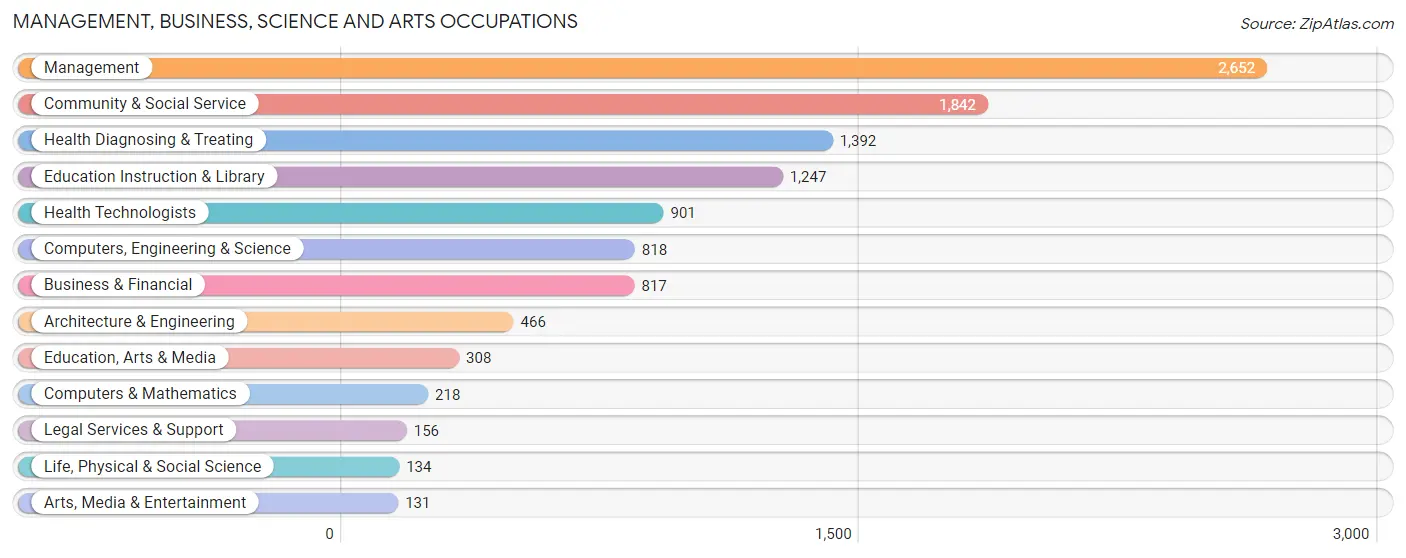
Management, Business, Science and Arts Occupations
The most common Management, Business, Science and Arts occupations in Cass County are Management (2,652 | 11.1%), Community & Social Service (1,842 | 7.7%), Health Diagnosing & Treating (1,392 | 5.8%), Education Instruction & Library (1,247 | 5.2%), and Health Technologists (901 | 3.8%).
Management, Business, Science and Arts Occupations by Sex
Within the Management, Business, Science and Arts occupations in Cass County, the most male-oriented occupations are Life, Physical & Social Science (90.3%), Architecture & Engineering (81.3%), and Computers, Engineering & Science (79.3%), while the most female-oriented occupations are Health Technologists (91.4%), Health Diagnosing & Treating (89.4%), and Education Instruction & Library (82.9%).
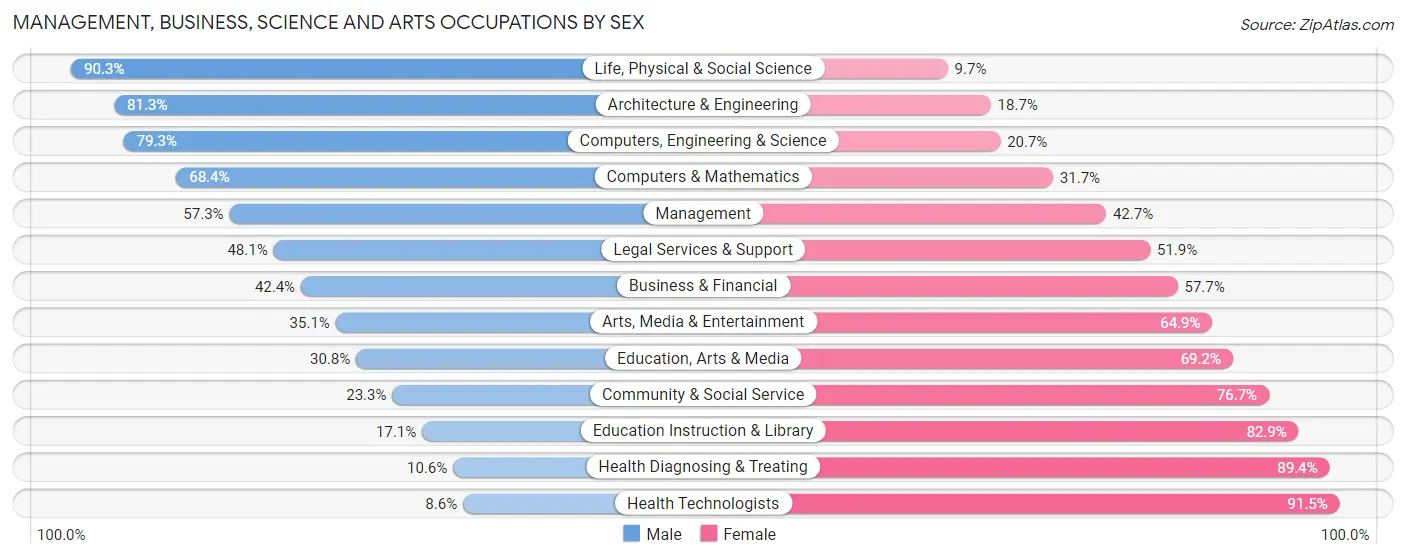
| Occupation | Male | Female |
| Management | 1,519 (57.3%) | 1,133 (42.7%) |
| Business & Financial | 346 (42.3%) | 471 (57.7%) |
| Computers, Engineering & Science | 649 (79.3%) | 169 (20.7%) |
| Computers & Mathematics | 149 (68.3%) | 69 (31.7%) |
| Architecture & Engineering | 379 (81.3%) | 87 (18.7%) |
| Life, Physical & Social Science | 121 (90.3%) | 13 (9.7%) |
| Community & Social Service | 429 (23.3%) | 1,413 (76.7%) |
| Education, Arts & Media | 95 (30.8%) | 213 (69.2%) |
| Legal Services & Support | 75 (48.1%) | 81 (51.9%) |
| Education Instruction & Library | 213 (17.1%) | 1,034 (82.9%) |
| Arts, Media & Entertainment | 46 (35.1%) | 85 (64.9%) |
| Health Diagnosing & Treating | 148 (10.6%) | 1,244 (89.4%) |
| Health Technologists | 77 (8.6%) | 824 (91.4%) |
| Total (Category) | 3,091 (41.1%) | 4,430 (58.9%) |
| Total (Overall) | 12,675 (53.0%) | 11,246 (47.0%) |
Services Occupations
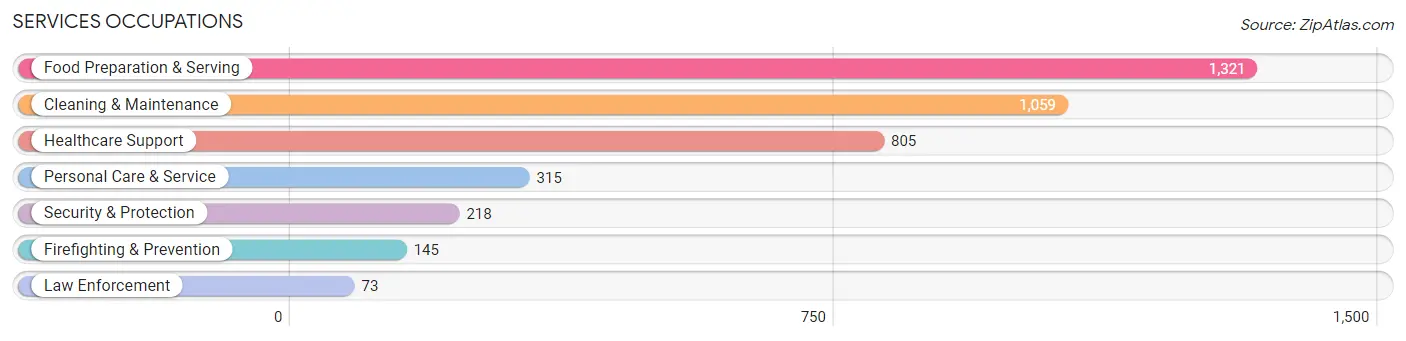
The most common Services occupations in Cass County are Food Preparation & Serving (1,321 | 5.5%), Cleaning & Maintenance (1,059 | 4.4%), Healthcare Support (805 | 3.4%), Personal Care & Service (315 | 1.3%), and Security & Protection (218 | 0.9%).
Services Occupations by Sex
Within the Services occupations in Cass County, the most male-oriented occupations are Law Enforcement (86.3%), Security & Protection (63.8%), and Cleaning & Maintenance (56.9%), while the most female-oriented occupations are Healthcare Support (91.4%), Food Preparation & Serving (77.0%), and Personal Care & Service (71.4%).
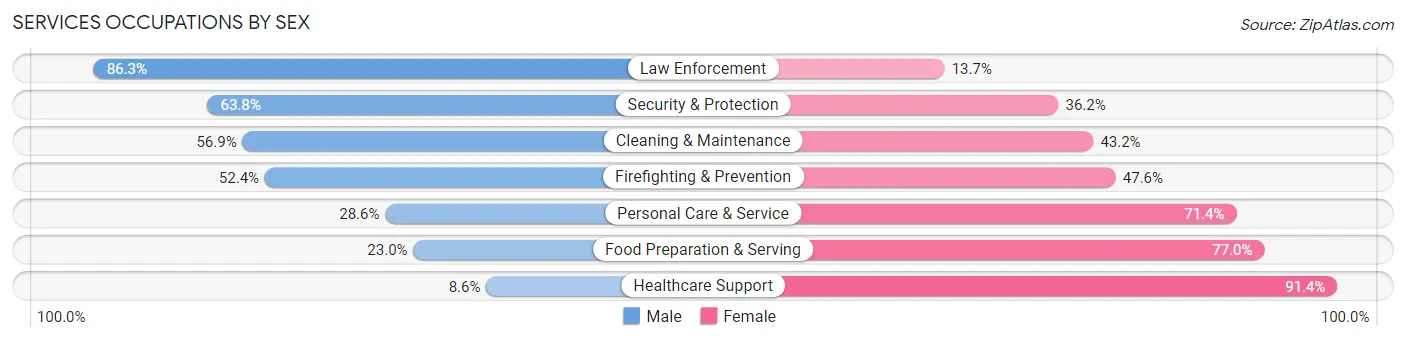
| Occupation | Male | Female |
| Healthcare Support | 69 (8.6%) | 736 (91.4%) |
| Security & Protection | 139 (63.8%) | 79 (36.2%) |
| Firefighting & Prevention | 76 (52.4%) | 69 (47.6%) |
| Law Enforcement | 63 (86.3%) | 10 (13.7%) |
| Food Preparation & Serving | 304 (23.0%) | 1,017 (77.0%) |
| Cleaning & Maintenance | 602 (56.9%) | 457 (43.1%) |
| Personal Care & Service | 90 (28.6%) | 225 (71.4%) |
| Total (Category) | 1,204 (32.4%) | 2,514 (67.6%) |
| Total (Overall) | 12,675 (53.0%) | 11,246 (47.0%) |
Sales and Office Occupations
The most common Sales and Office occupations in Cass County are Office & Administration (2,271 | 9.5%), and Sales & Related (2,111 | 8.8%).
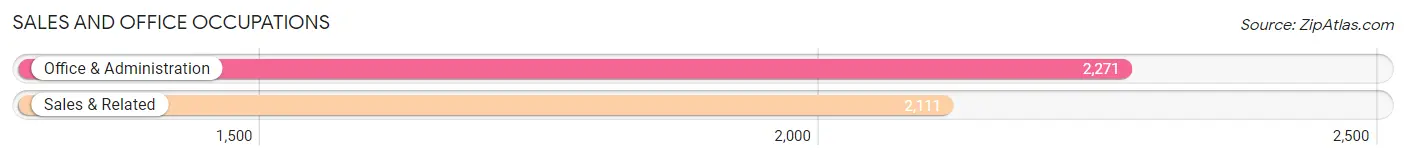
Sales and Office Occupations by Sex
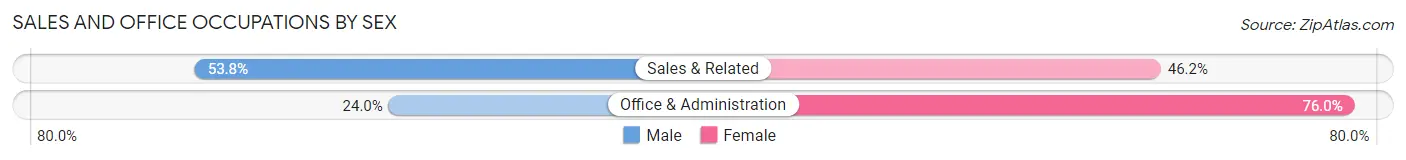
| Occupation | Male | Female |
| Sales & Related | 1,136 (53.8%) | 975 (46.2%) |
| Office & Administration | 545 (24.0%) | 1,726 (76.0%) |
| Total (Category) | 1,681 (38.4%) | 2,701 (61.6%) |
| Total (Overall) | 12,675 (53.0%) | 11,246 (47.0%) |
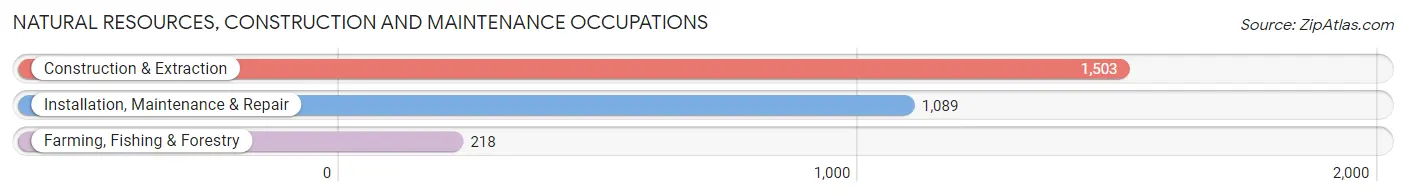
Natural Resources, Construction and Maintenance Occupations
The most common Natural Resources, Construction and Maintenance occupations in Cass County are Construction & Extraction (1,503 | 6.3%), Installation, Maintenance & Repair (1,089 | 4.5%), and Farming, Fishing & Forestry (218 | 0.9%).
Natural Resources, Construction and Maintenance Occupations by Sex
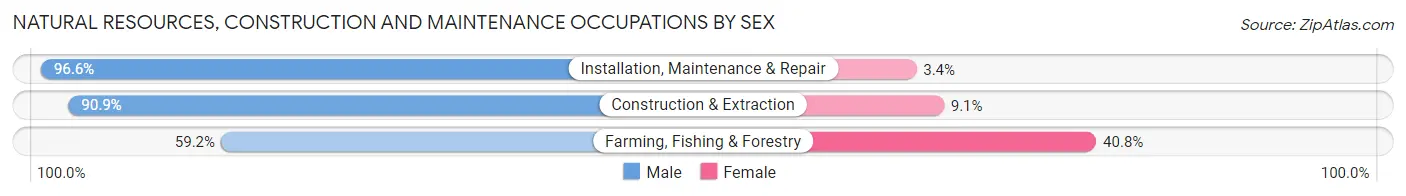
| Occupation | Male | Female |
| Farming, Fishing & Forestry | 129 (59.2%) | 89 (40.8%) |
| Construction & Extraction | 1,366 (90.9%) | 137 (9.1%) |
| Installation, Maintenance & Repair | 1,052 (96.6%) | 37 (3.4%) |
| Total (Category) | 2,547 (90.6%) | 263 (9.4%) |
| Total (Overall) | 12,675 (53.0%) | 11,246 (47.0%) |
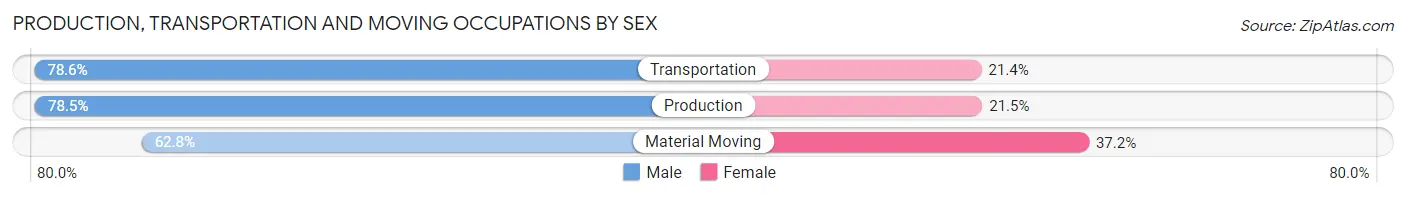
Production, Transportation and Moving Occupations
The most common Production, Transportation and Moving occupations in Cass County are Production (3,370 | 14.1%), Transportation (1,120 | 4.7%), and Material Moving (1,000 | 4.2%).
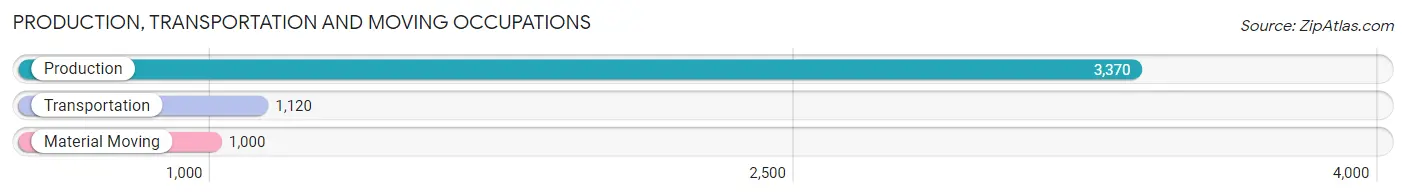
Production, Transportation and Moving Occupations by Sex
| Occupation | Male | Female |
| Production | 2,644 (78.5%) | 726 (21.5%) |
| Transportation | 880 (78.6%) | 240 (21.4%) |
| Material Moving | 628 (62.8%) | 372 (37.2%) |
| Total (Category) | 4,152 (75.6%) | 1,338 (24.4%) |
| Total (Overall) | 12,675 (53.0%) | 11,246 (47.0%) |
Employment Industries by Sex in Cass County
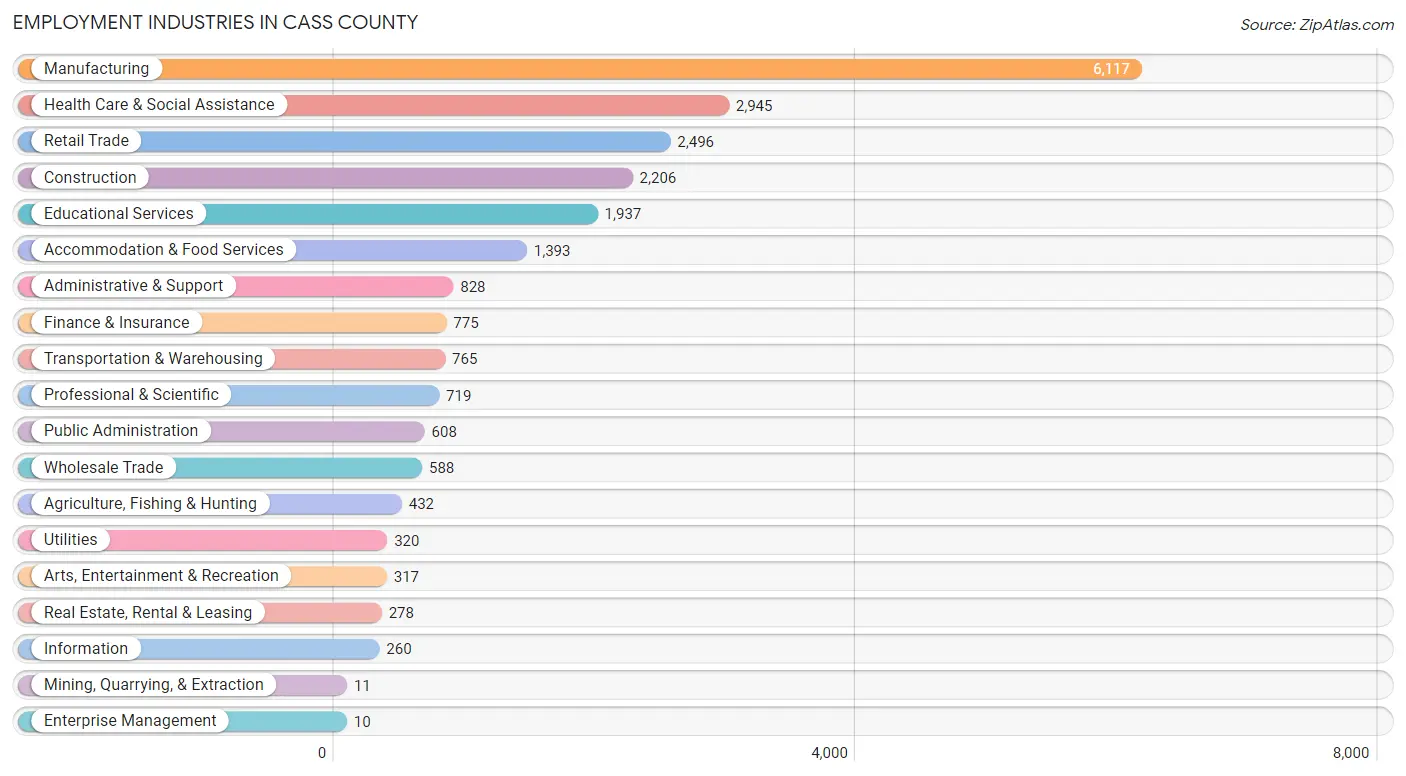
Employment Industries in Cass County
The major employment industries in Cass County include Manufacturing (6,117 | 25.6%), Health Care & Social Assistance (2,945 | 12.3%), Retail Trade (2,496 | 10.4%), Construction (2,206 | 9.2%), and Educational Services (1,937 | 8.1%).
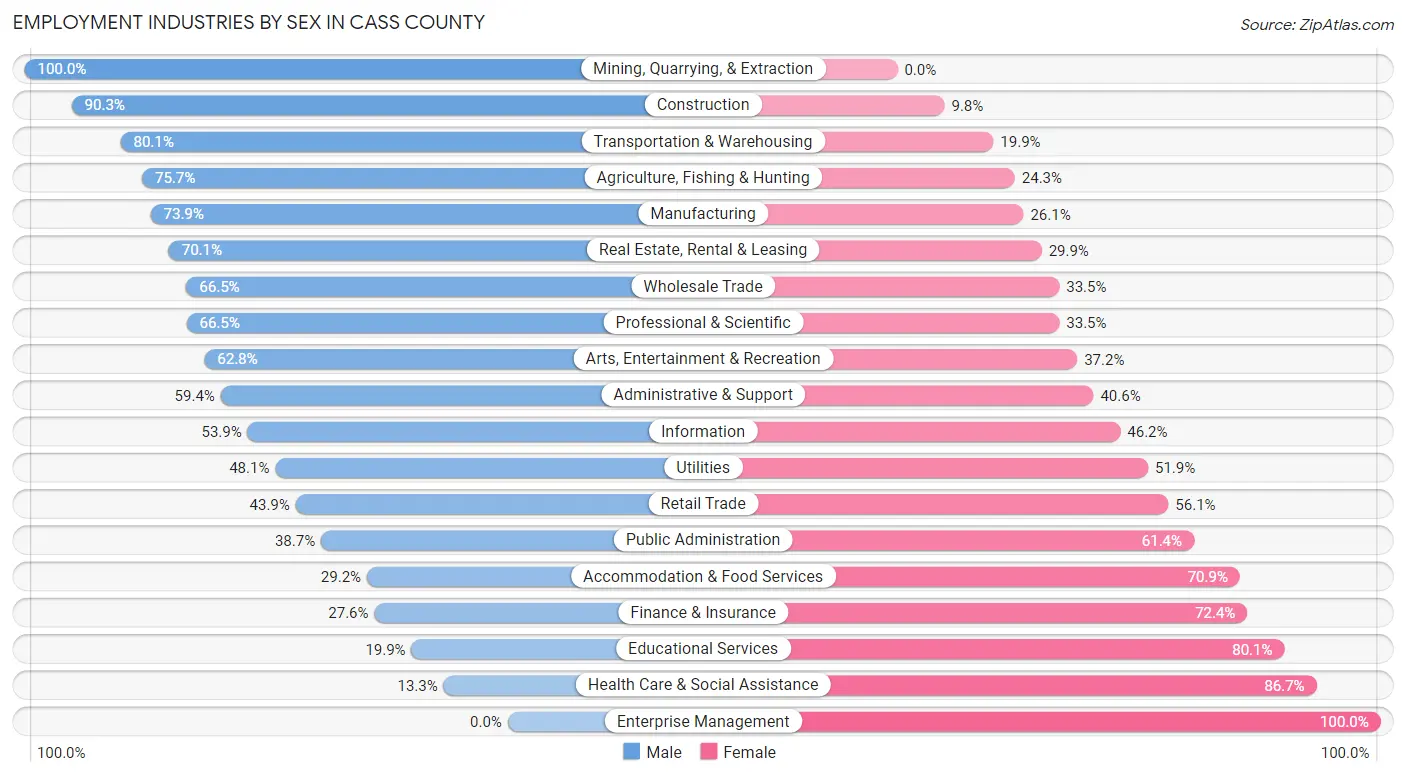
Employment Industries by Sex in Cass County
The Cass County industries that see more men than women are Mining, Quarrying, & Extraction (100.0%), Construction (90.2%), and Transportation & Warehousing (80.1%), whereas the industries that tend to have a higher number of women are Enterprise Management (100.0%), Health Care & Social Assistance (86.7%), and Educational Services (80.1%).
| Industry | Male | Female |
| Agriculture, Fishing & Hunting | 327 (75.7%) | 105 (24.3%) |
| Mining, Quarrying, & Extraction | 11 (100.0%) | 0 (0.0%) |
| Construction | 1,991 (90.2%) | 215 (9.8%) |
| Manufacturing | 4,521 (73.9%) | 1,596 (26.1%) |
| Wholesale Trade | 391 (66.5%) | 197 (33.5%) |
| Retail Trade | 1,096 (43.9%) | 1,400 (56.1%) |
| Transportation & Warehousing | 613 (80.1%) | 152 (19.9%) |
| Utilities | 154 (48.1%) | 166 (51.9%) |
| Information | 140 (53.8%) | 120 (46.2%) |
| Finance & Insurance | 214 (27.6%) | 561 (72.4%) |
| Real Estate, Rental & Leasing | 195 (70.1%) | 83 (29.9%) |
| Professional & Scientific | 478 (66.5%) | 241 (33.5%) |
| Enterprise Management | 0 (0.0%) | 10 (100.0%) |
| Administrative & Support | 492 (59.4%) | 336 (40.6%) |
| Educational Services | 386 (19.9%) | 1,551 (80.1%) |
| Health Care & Social Assistance | 391 (13.3%) | 2,554 (86.7%) |
| Arts, Entertainment & Recreation | 199 (62.8%) | 118 (37.2%) |
| Accommodation & Food Services | 406 (29.1%) | 987 (70.9%) |
| Public Administration | 235 (38.7%) | 373 (61.4%) |
| Total | 12,675 (53.0%) | 11,246 (47.0%) |
Education in Cass County
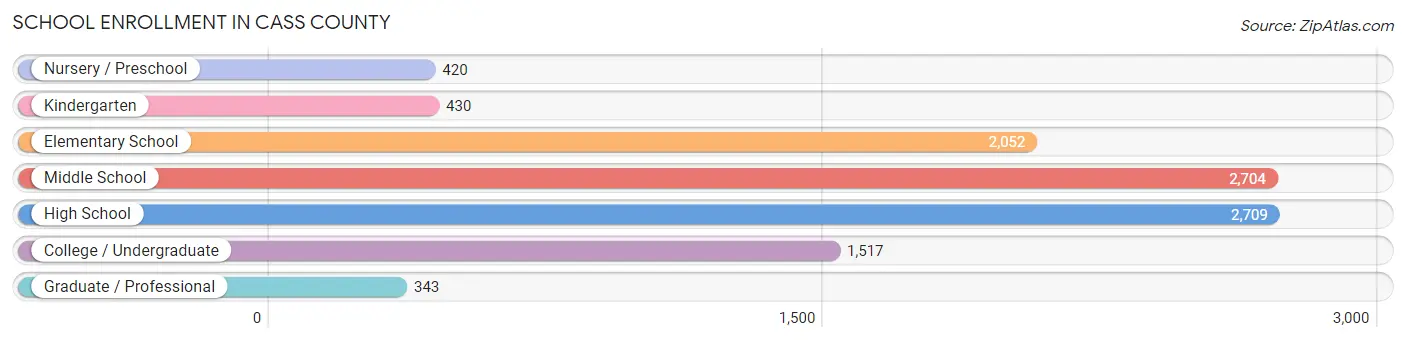
School Enrollment in Cass County
The most common levels of schooling among the 10,175 students in Cass County are high school (2,709 | 26.6%), middle school (2,704 | 26.6%), and elementary school (2,052 | 20.2%).
| School Level | # Students | % Students |
| Nursery / Preschool | 420 | 4.1% |
| Kindergarten | 430 | 4.2% |
| Elementary School | 2,052 | 20.2% |
| Middle School | 2,704 | 26.6% |
| High School | 2,709 | 26.6% |
| College / Undergraduate | 1,517 | 14.9% |
| Graduate / Professional | 343 | 3.4% |
| Total | 10,175 | 100.0% |
School Enrollment by Age by Funding Source in Cass County
Out of a total of 10,175 students who are enrolled in schools in Cass County, 1,343 (13.2%) attend a private institution, while the remaining 8,832 (86.8%) are enrolled in public schools. The age group of 3 to 4 year olds has the highest likelihood of being enrolled in private schools, with 169 (56.5% in the age bracket) enrolled. Conversely, the age group of 10 to 14 year olds has the lowest likelihood of being enrolled in a private school, with 3,087 (91.9% in the age bracket) attending a public institution.
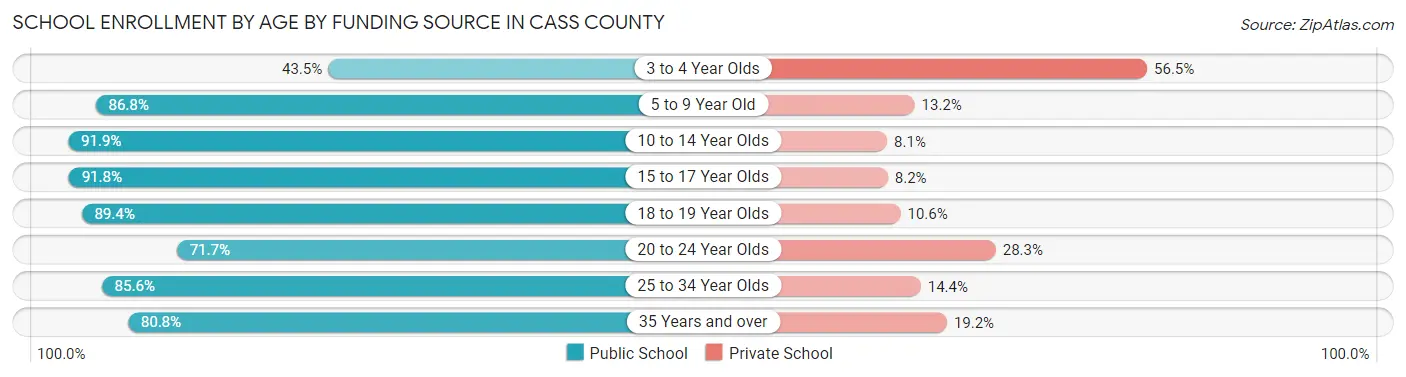
| Age Bracket | Public School | Private School |
| 3 to 4 Year Olds | 130 (43.5%) | 169 (56.5%) |
| 5 to 9 Year Old | 1,963 (86.8%) | 299 (13.2%) |
| 10 to 14 Year Olds | 3,087 (91.9%) | 272 (8.1%) |
| 15 to 17 Year Olds | 1,707 (91.8%) | 153 (8.2%) |
| 18 to 19 Year Olds | 641 (89.4%) | 76 (10.6%) |
| 20 to 24 Year Olds | 579 (71.7%) | 229 (28.3%) |
| 25 to 34 Year Olds | 340 (85.6%) | 57 (14.4%) |
| 35 Years and over | 382 (80.8%) | 91 (19.2%) |
| Total | 8,832 (86.8%) | 1,343 (13.2%) |
Educational Attainment by Field of Study in Cass County
Education (1,840 | 21.8%), business (1,737 | 20.6%), science & technology (1,188 | 14.1%), arts & humanities (535 | 6.4%), and bio, nature & agricultural (433 | 5.1%) are the most common fields of study among 8,431 individuals in Cass County who have obtained a bachelor's degree or higher.
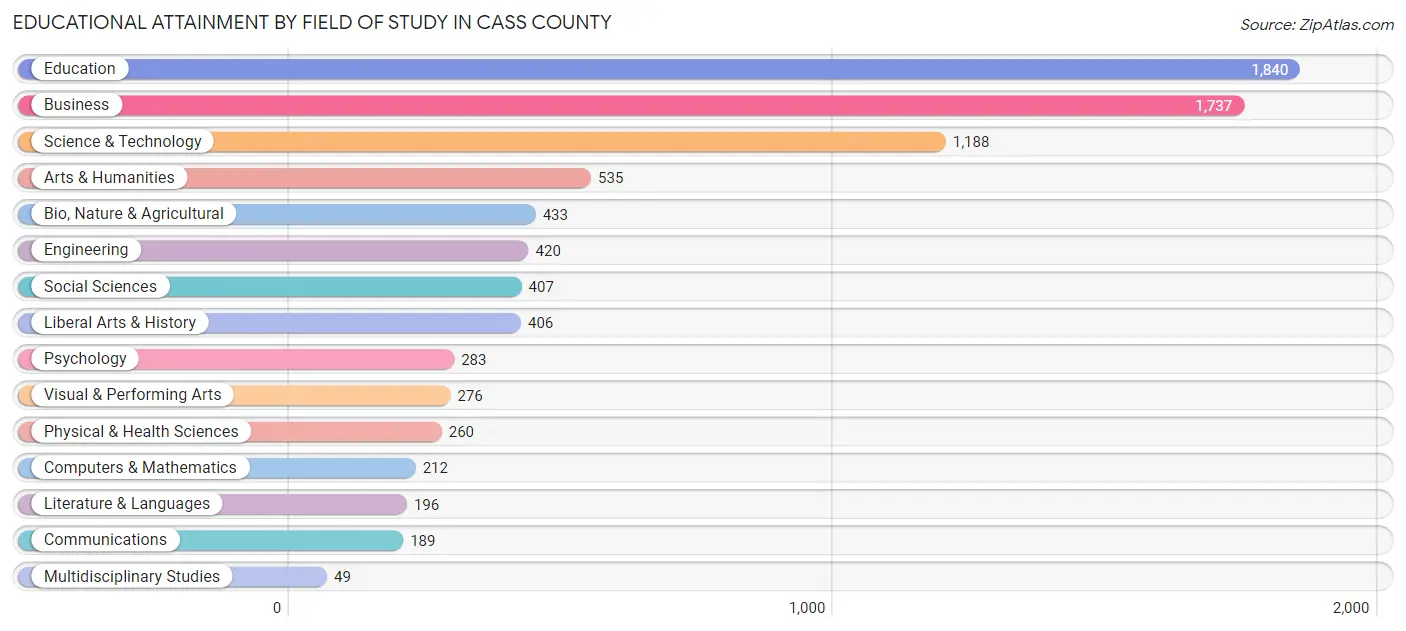
| Field of Study | # Graduates | % Graduates |
| Computers & Mathematics | 212 | 2.5% |
| Bio, Nature & Agricultural | 433 | 5.1% |
| Physical & Health Sciences | 260 | 3.1% |
| Psychology | 283 | 3.4% |
| Social Sciences | 407 | 4.8% |
| Engineering | 420 | 5.0% |
| Multidisciplinary Studies | 49 | 0.6% |
| Science & Technology | 1,188 | 14.1% |
| Business | 1,737 | 20.6% |
| Education | 1,840 | 21.8% |
| Literature & Languages | 196 | 2.3% |
| Liberal Arts & History | 406 | 4.8% |
| Visual & Performing Arts | 276 | 3.3% |
| Communications | 189 | 2.2% |
| Arts & Humanities | 535 | 6.4% |
| Total | 8,431 | 100.0% |
Transportation & Commute in Cass County
Vehicle Availability by Sex in Cass County
The most prevalent vehicle ownership categories in Cass County are males with 2 vehicles (5,164, accounting for 41.4%) and females with 2 vehicles (4,177, making up 47.5%).
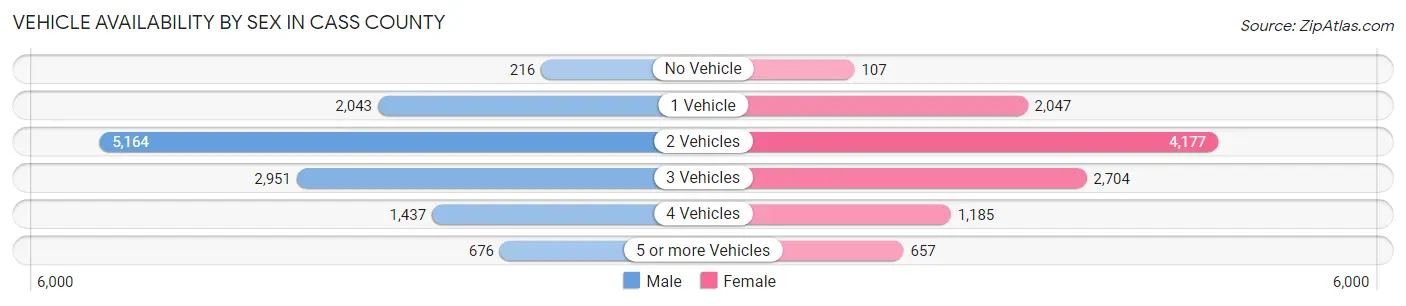
| Vehicles Available | Male | Female |
| No Vehicle | 216 (1.7%) | 107 (1.0%) |
| 1 Vehicle | 2,043 (16.4%) | 2,047 (18.8%) |
| 2 Vehicles | 5,164 (41.4%) | 4,177 (38.4%) |
| 3 Vehicles | 2,951 (23.6%) | 2,704 (24.9%) |
| 4 Vehicles | 1,437 (11.5%) | 1,185 (10.9%) |
| 5 or more Vehicles | 676 (5.4%) | 657 (6.0%) |
| Total | 12,487 (100.0%) | 10,877 (100.0%) |
Commute Time in Cass County
The most frequently occuring commute durations in Cass County are 15 to 19 minutes (3,646 commuters, 16.3%), 20 to 24 minutes (3,448 commuters, 15.4%), and 30 to 34 minutes (3,408 commuters, 15.2%).
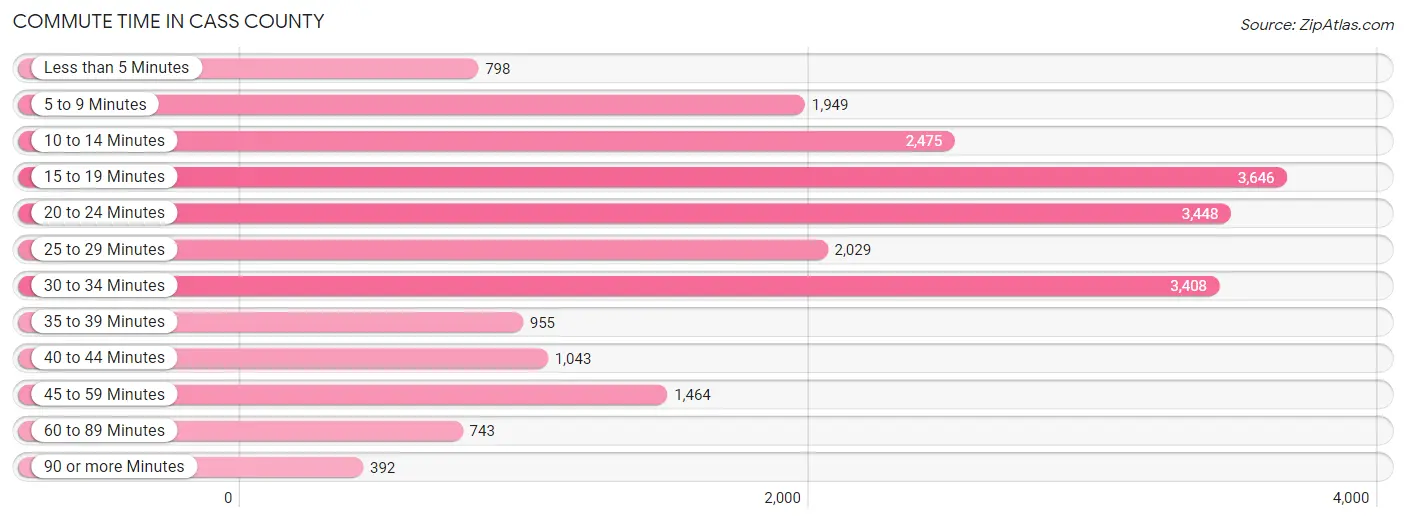
| Commute Time | # Commuters | % Commuters |
| Less than 5 Minutes | 798 | 3.6% |
| 5 to 9 Minutes | 1,949 | 8.7% |
| 10 to 14 Minutes | 2,475 | 11.1% |
| 15 to 19 Minutes | 3,646 | 16.3% |
| 20 to 24 Minutes | 3,448 | 15.4% |
| 25 to 29 Minutes | 2,029 | 9.1% |
| 30 to 34 Minutes | 3,408 | 15.2% |
| 35 to 39 Minutes | 955 | 4.3% |
| 40 to 44 Minutes | 1,043 | 4.7% |
| 45 to 59 Minutes | 1,464 | 6.6% |
| 60 to 89 Minutes | 743 | 3.3% |
| 90 or more Minutes | 392 | 1.8% |
Commute Time by Sex in Cass County
The most common commute times in Cass County are 30 to 34 minutes (2,036 commuters, 17.0%) for males and 15 to 19 minutes (1,886 commuters, 18.2%) for females.
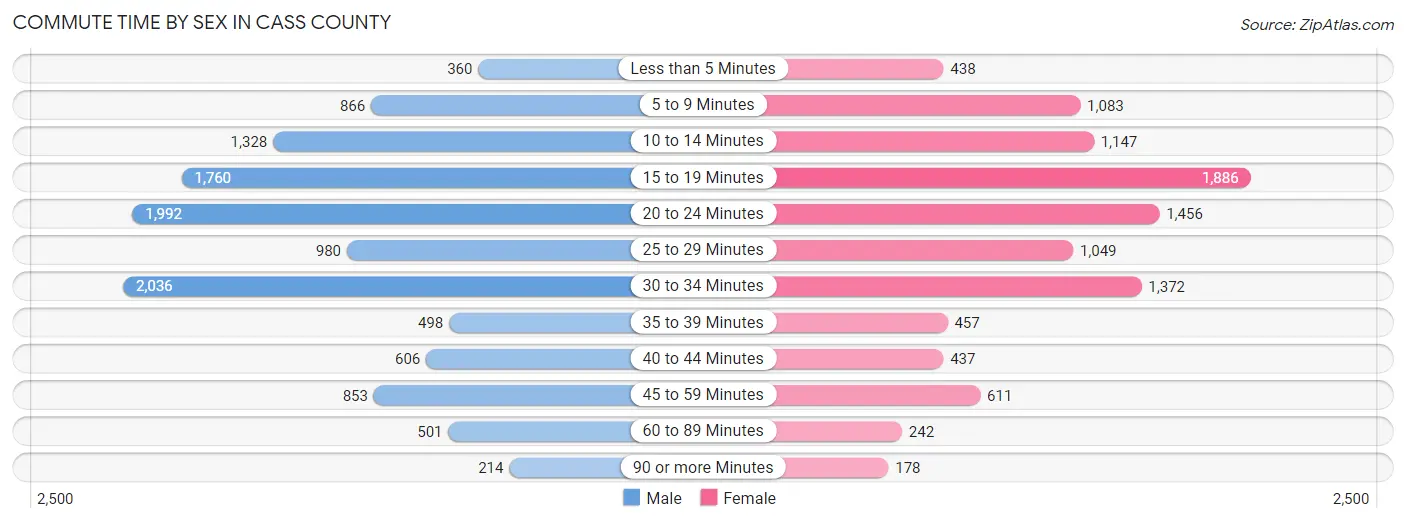
| Commute Time | Male | Female |
| Less than 5 Minutes | 360 (3.0%) | 438 (4.2%) |
| 5 to 9 Minutes | 866 (7.2%) | 1,083 (10.5%) |
| 10 to 14 Minutes | 1,328 (11.1%) | 1,147 (11.1%) |
| 15 to 19 Minutes | 1,760 (14.7%) | 1,886 (18.2%) |
| 20 to 24 Minutes | 1,992 (16.6%) | 1,456 (14.1%) |
| 25 to 29 Minutes | 980 (8.2%) | 1,049 (10.1%) |
| 30 to 34 Minutes | 2,036 (17.0%) | 1,372 (13.3%) |
| 35 to 39 Minutes | 498 (4.2%) | 457 (4.4%) |
| 40 to 44 Minutes | 606 (5.1%) | 437 (4.2%) |
| 45 to 59 Minutes | 853 (7.1%) | 611 (5.9%) |
| 60 to 89 Minutes | 501 (4.2%) | 242 (2.3%) |
| 90 or more Minutes | 214 (1.8%) | 178 (1.7%) |
Time of Departure to Work by Sex in Cass County
The most frequent times of departure to work in Cass County are 12:00 AM to 4:59 AM (1,663, 13.9%) for males and 7:00 AM to 7:29 AM (1,799, 17.4%) for females.
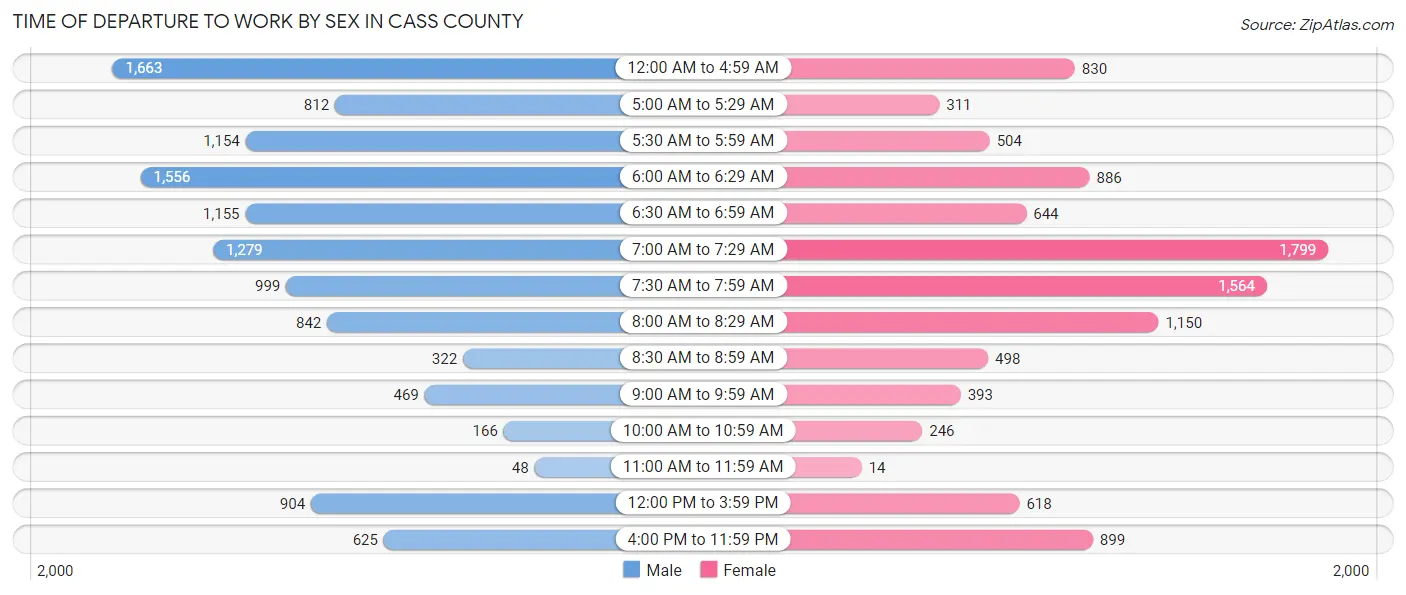
| Time of Departure | Male | Female |
| 12:00 AM to 4:59 AM | 1,663 (13.9%) | 830 (8.0%) |
| 5:00 AM to 5:29 AM | 812 (6.8%) | 311 (3.0%) |
| 5:30 AM to 5:59 AM | 1,154 (9.6%) | 504 (4.9%) |
| 6:00 AM to 6:29 AM | 1,556 (13.0%) | 886 (8.6%) |
| 6:30 AM to 6:59 AM | 1,155 (9.6%) | 644 (6.2%) |
| 7:00 AM to 7:29 AM | 1,279 (10.7%) | 1,799 (17.4%) |
| 7:30 AM to 7:59 AM | 999 (8.3%) | 1,564 (15.1%) |
| 8:00 AM to 8:29 AM | 842 (7.0%) | 1,150 (11.1%) |
| 8:30 AM to 8:59 AM | 322 (2.7%) | 498 (4.8%) |
| 9:00 AM to 9:59 AM | 469 (3.9%) | 393 (3.8%) |
| 10:00 AM to 10:59 AM | 166 (1.4%) | 246 (2.4%) |
| 11:00 AM to 11:59 AM | 48 (0.4%) | 14 (0.1%) |
| 12:00 PM to 3:59 PM | 904 (7.5%) | 618 (6.0%) |
| 4:00 PM to 11:59 PM | 625 (5.2%) | 899 (8.7%) |
| Total | 11,994 (100.0%) | 10,356 (100.0%) |
Housing Occupancy in Cass County
Occupancy by Ownership in Cass County
Of the total 20,779 dwellings in Cass County, owner-occupied units account for 16,943 (81.5%), while renter-occupied units make up 3,836 (18.5%).
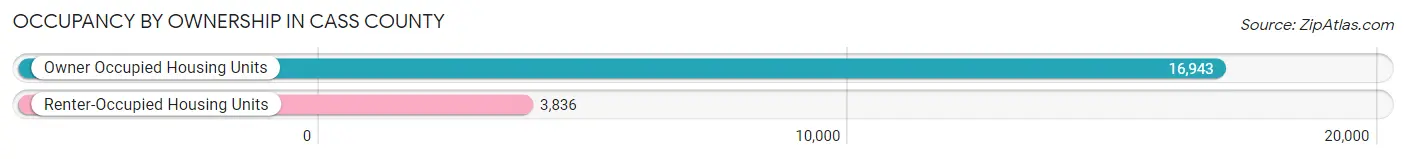
| Occupancy | # Housing Units | % Housing Units |
| Owner Occupied Housing Units | 16,943 | 81.5% |
| Renter-Occupied Housing Units | 3,836 | 18.5% |
| Total Occupied Housing Units | 20,779 | 100.0% |
Occupancy by Household Size in Cass County
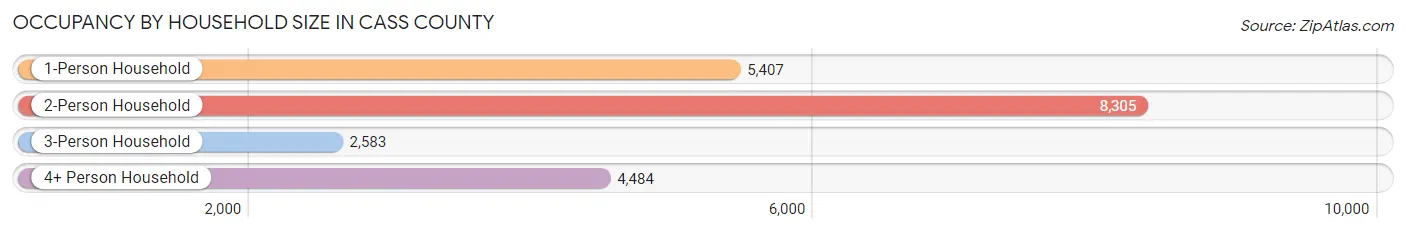
| Household Size | # Housing Units | % Housing Units |
| 1-Person Household | 5,407 | 26.0% |
| 2-Person Household | 8,305 | 40.0% |
| 3-Person Household | 2,583 | 12.4% |
| 4+ Person Household | 4,484 | 21.6% |
| Total Housing Units | 20,779 | 100.0% |
Occupancy by Ownership by Household Size in Cass County
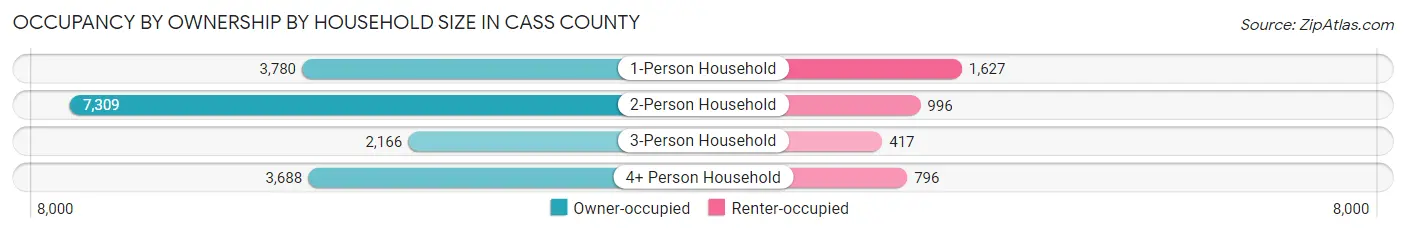
| Household Size | Owner-occupied | Renter-occupied |
| 1-Person Household | 3,780 (69.9%) | 1,627 (30.1%) |
| 2-Person Household | 7,309 (88.0%) | 996 (12.0%) |
| 3-Person Household | 2,166 (83.9%) | 417 (16.1%) |
| 4+ Person Household | 3,688 (82.3%) | 796 (17.7%) |
| Total Housing Units | 16,943 (81.5%) | 3,836 (18.5%) |
Occupancy by Educational Attainment in Cass County
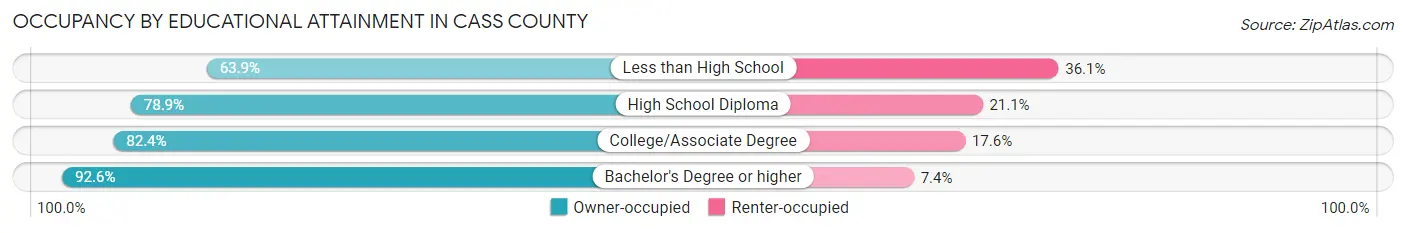
| Household Size | Owner-occupied | Renter-occupied |
| Less than High School | 1,417 (63.9%) | 801 (36.1%) |
| High School Diploma | 5,126 (78.9%) | 1,368 (21.1%) |
| College/Associate Degree | 6,232 (82.4%) | 1,332 (17.6%) |
| Bachelor's Degree or higher | 4,168 (92.6%) | 335 (7.4%) |
Occupancy by Age of Householder in Cass County
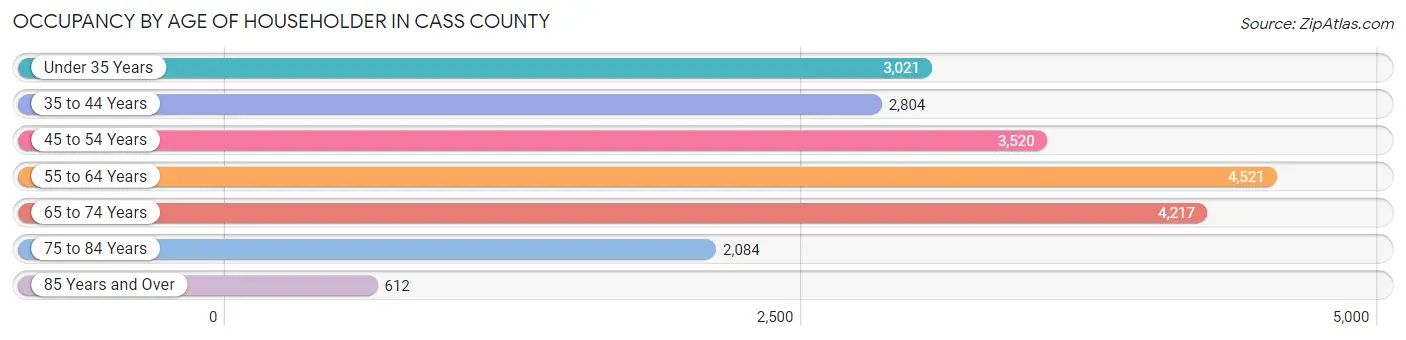
| Age Bracket | # Households | % Households |
| Under 35 Years | 3,021 | 14.5% |
| 35 to 44 Years | 2,804 | 13.5% |
| 45 to 54 Years | 3,520 | 16.9% |
| 55 to 64 Years | 4,521 | 21.8% |
| 65 to 74 Years | 4,217 | 20.3% |
| 75 to 84 Years | 2,084 | 10.0% |
| 85 Years and Over | 612 | 2.9% |
| Total | 20,779 | 100.0% |
Housing Finances in Cass County
Median Income by Occupancy in Cass County
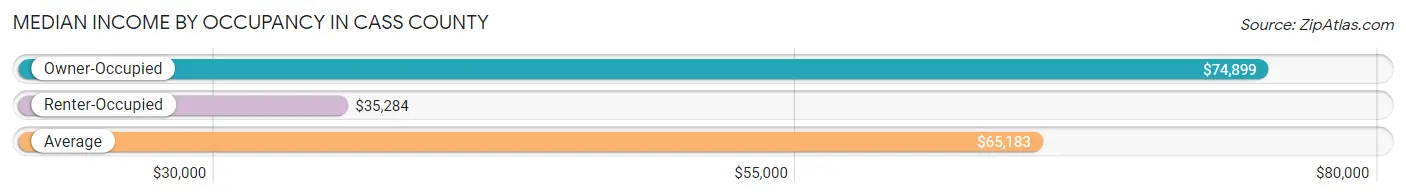
| Occupancy Type | # Households | Median Income |
| Owner-Occupied | 16,943 (81.5%) | $74,899 |
| Renter-Occupied | 3,836 (18.5%) | $35,284 |
| Average | 20,779 (100.0%) | $65,183 |
Occupancy by Householder Income Bracket in Cass County
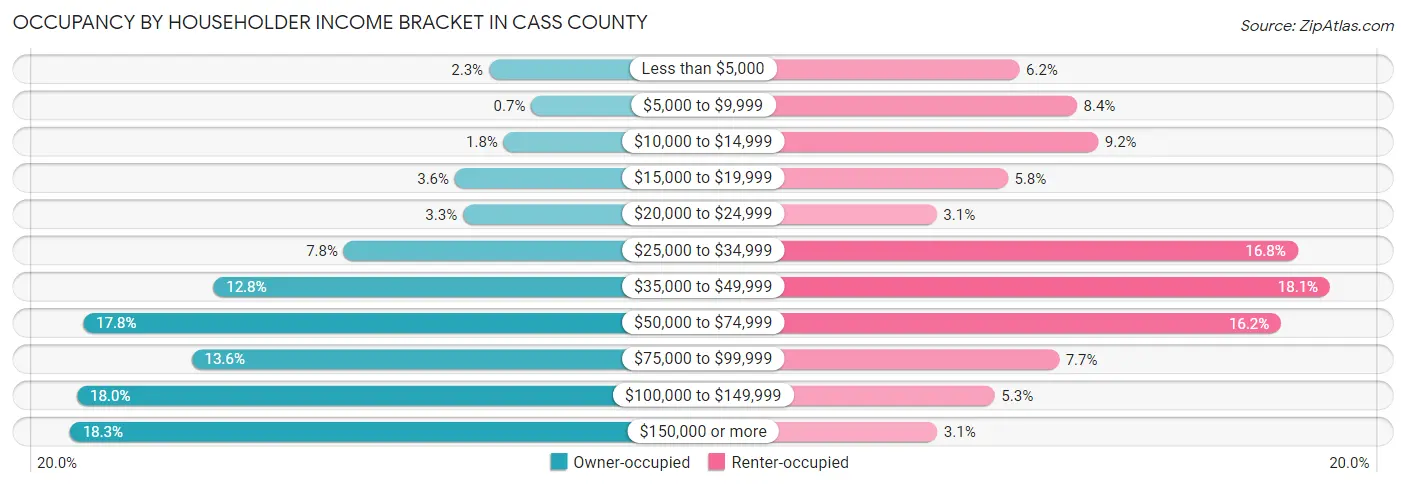
| Income Bracket | Owner-occupied | Renter-occupied |
| Less than $5,000 | 391 (2.3%) | 239 (6.2%) |
| $5,000 to $9,999 | 119 (0.7%) | 323 (8.4%) |
| $10,000 to $14,999 | 297 (1.8%) | 354 (9.2%) |
| $15,000 to $19,999 | 611 (3.6%) | 222 (5.8%) |
| $20,000 to $24,999 | 559 (3.3%) | 118 (3.1%) |
| $25,000 to $34,999 | 1,328 (7.8%) | 646 (16.8%) |
| $35,000 to $49,999 | 2,170 (12.8%) | 693 (18.1%) |
| $50,000 to $74,999 | 3,010 (17.8%) | 622 (16.2%) |
| $75,000 to $99,999 | 2,311 (13.6%) | 297 (7.7%) |
| $100,000 to $149,999 | 3,049 (18.0%) | 203 (5.3%) |
| $150,000 or more | 3,098 (18.3%) | 119 (3.1%) |
| Total | 16,943 (100.0%) | 3,836 (100.0%) |
Monthly Housing Cost Tiers in Cass County
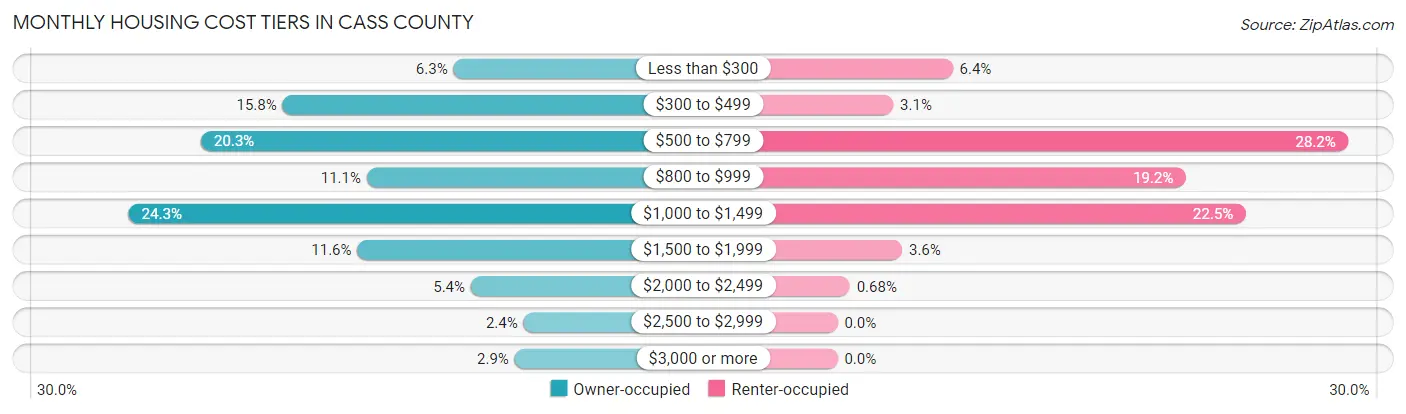
| Monthly Cost | Owner-occupied | Renter-occupied |
| Less than $300 | 1,069 (6.3%) | 244 (6.4%) |
| $300 to $499 | 2,668 (15.8%) | 118 (3.1%) |
| $500 to $799 | 3,432 (20.3%) | 1,081 (28.2%) |
| $800 to $999 | 1,880 (11.1%) | 737 (19.2%) |
| $1,000 to $1,499 | 4,108 (24.2%) | 864 (22.5%) |
| $1,500 to $1,999 | 1,969 (11.6%) | 137 (3.6%) |
| $2,000 to $2,499 | 906 (5.3%) | 26 (0.7%) |
| $2,500 to $2,999 | 414 (2.4%) | 0 (0.0%) |
| $3,000 or more | 497 (2.9%) | 0 (0.0%) |
| Total | 16,943 (100.0%) | 3,836 (100.0%) |
Physical Housing Characteristics in Cass County
Housing Structures in Cass County
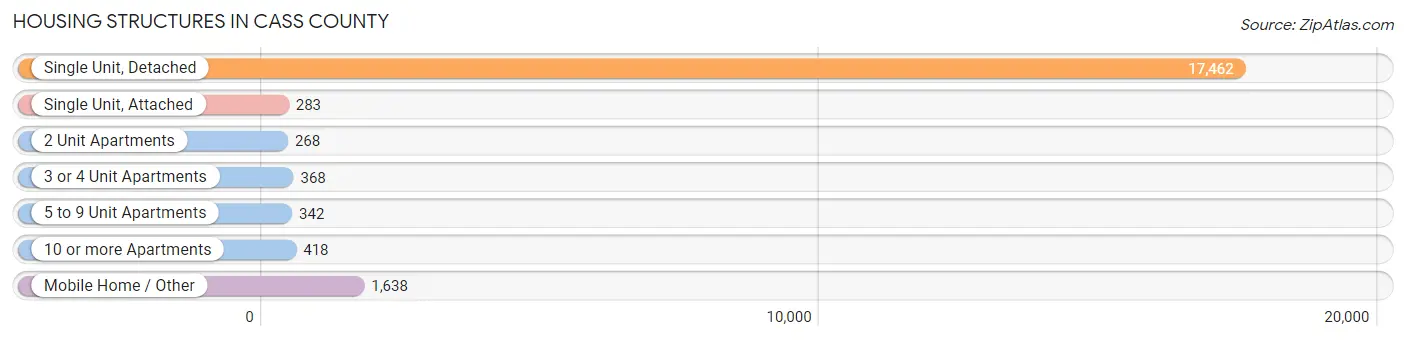
| Structure Type | # Housing Units | % Housing Units |
| Single Unit, Detached | 17,462 | 84.0% |
| Single Unit, Attached | 283 | 1.4% |
| 2 Unit Apartments | 268 | 1.3% |
| 3 or 4 Unit Apartments | 368 | 1.8% |
| 5 to 9 Unit Apartments | 342 | 1.7% |
| 10 or more Apartments | 418 | 2.0% |
| Mobile Home / Other | 1,638 | 7.9% |
| Total | 20,779 | 100.0% |
Housing Structures by Occupancy in Cass County
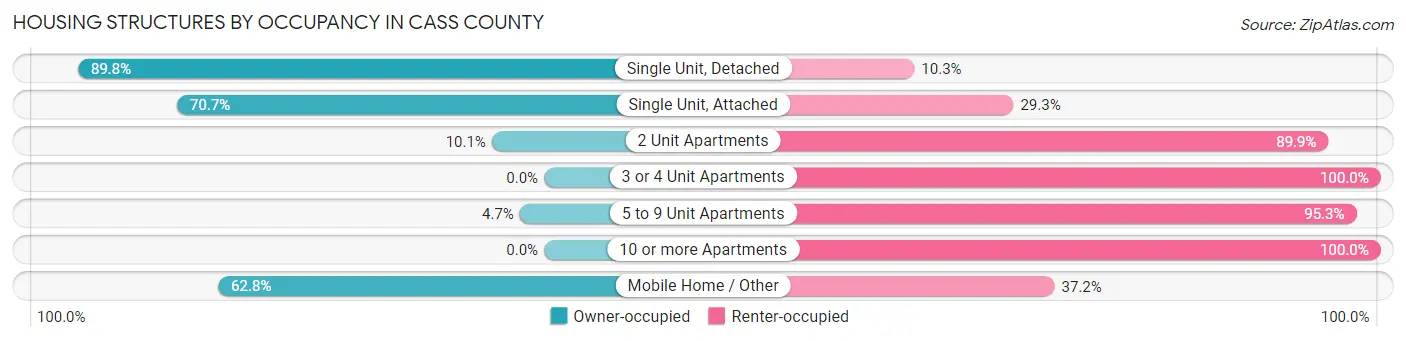
| Structure Type | Owner-occupied | Renter-occupied |
| Single Unit, Detached | 15,672 (89.7%) | 1,790 (10.2%) |
| Single Unit, Attached | 200 (70.7%) | 83 (29.3%) |
| 2 Unit Apartments | 27 (10.1%) | 241 (89.9%) |
| 3 or 4 Unit Apartments | 0 (0.0%) | 368 (100.0%) |
| 5 to 9 Unit Apartments | 16 (4.7%) | 326 (95.3%) |
| 10 or more Apartments | 0 (0.0%) | 418 (100.0%) |
| Mobile Home / Other | 1,028 (62.8%) | 610 (37.2%) |
| Total | 16,943 (81.5%) | 3,836 (18.5%) |
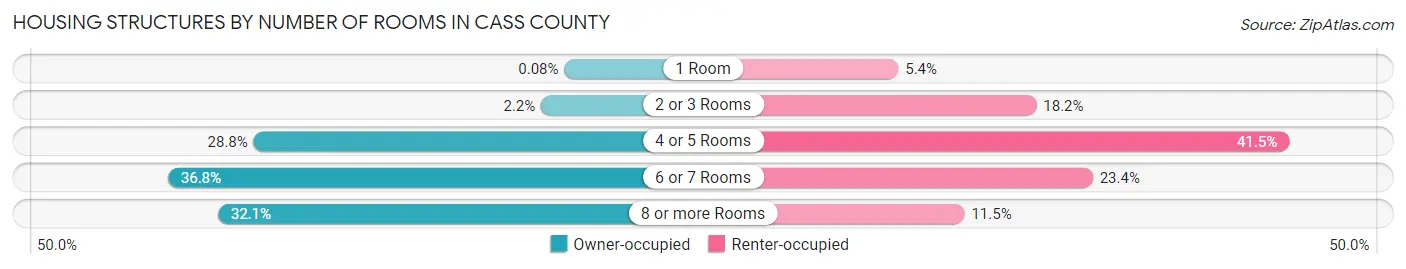
Housing Structures by Number of Rooms in Cass County
| Number of Rooms | Owner-occupied | Renter-occupied |
| 1 Room | 13 (0.1%) | 207 (5.4%) |
| 2 or 3 Rooms | 377 (2.2%) | 697 (18.2%) |
| 4 or 5 Rooms | 4,883 (28.8%) | 1,593 (41.5%) |
| 6 or 7 Rooms | 6,226 (36.7%) | 897 (23.4%) |
| 8 or more Rooms | 5,444 (32.1%) | 442 (11.5%) |
| Total | 16,943 (100.0%) | 3,836 (100.0%) |
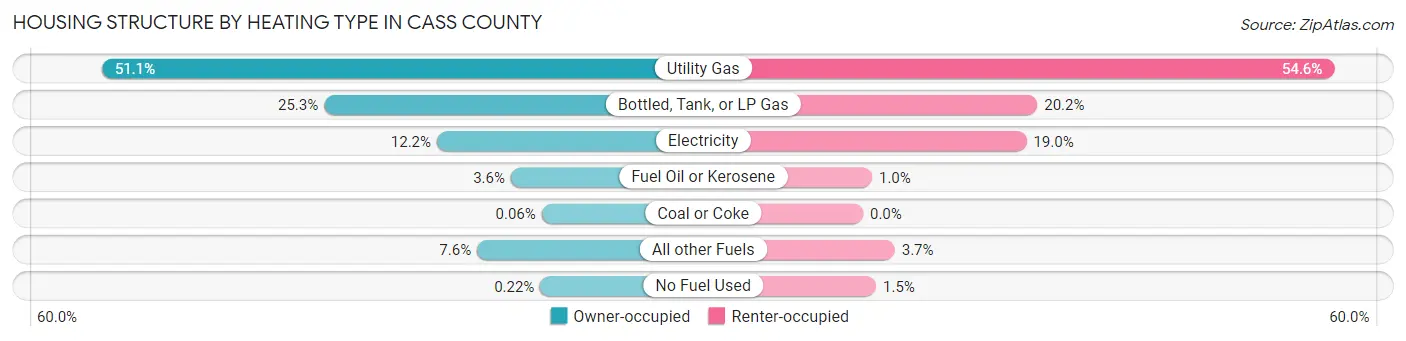
Housing Structure by Heating Type in Cass County
| Heating Type | Owner-occupied | Renter-occupied |
| Utility Gas | 8,650 (51.0%) | 2,095 (54.6%) |
| Bottled, Tank, or LP Gas | 4,284 (25.3%) | 775 (20.2%) |
| Electricity | 2,067 (12.2%) | 727 (19.0%) |
| Fuel Oil or Kerosene | 615 (3.6%) | 40 (1.0%) |
| Coal or Coke | 10 (0.1%) | 0 (0.0%) |
| All other Fuels | 1,279 (7.5%) | 141 (3.7%) |
| No Fuel Used | 38 (0.2%) | 58 (1.5%) |
| Total | 16,943 (100.0%) | 3,836 (100.0%) |
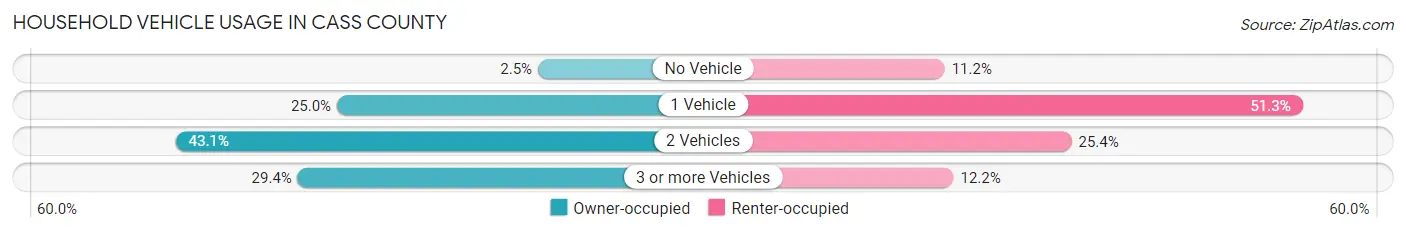
Household Vehicle Usage in Cass County
| Vehicles per Household | Owner-occupied | Renter-occupied |
| No Vehicle | 423 (2.5%) | 429 (11.2%) |
| 1 Vehicle | 4,238 (25.0%) | 1,966 (51.2%) |
| 2 Vehicles | 7,299 (43.1%) | 974 (25.4%) |
| 3 or more Vehicles | 4,983 (29.4%) | 467 (12.2%) |
| Total | 16,943 (100.0%) | 3,836 (100.0%) |
Real Estate & Mortgages in Cass County
Real Estate and Mortgage Overview in Cass County
| Characteristic | Without Mortgage | With Mortgage |
| Housing Units | 7,174 | 9,769 |
| Median Property Value | $165,600 | $195,900 |
| Median Household Income | $55,614 | $2,391 |
| Monthly Housing Costs | $499 | $490 |
| Real Estate Taxes | $1,720 | $380 |
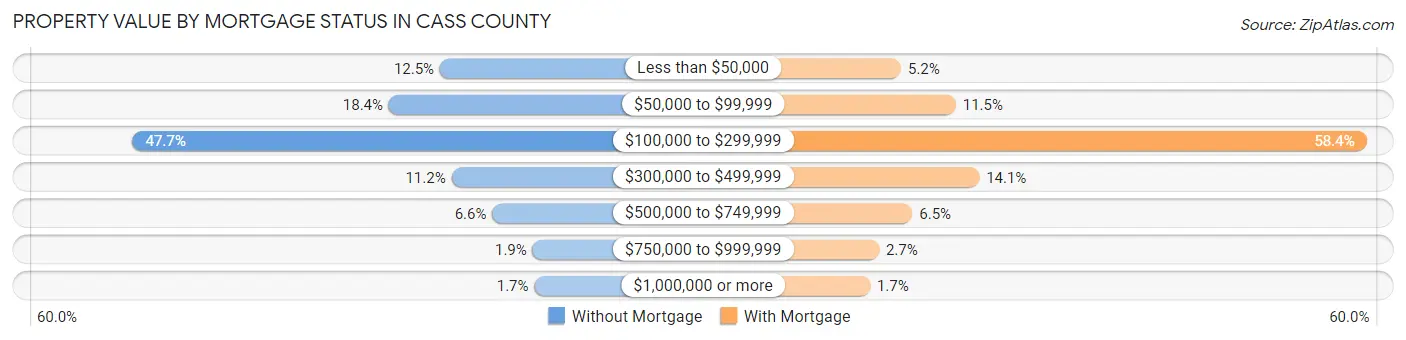
Property Value by Mortgage Status in Cass County
| Property Value | Without Mortgage | With Mortgage |
| Less than $50,000 | 899 (12.5%) | 508 (5.2%) |
| $50,000 to $99,999 | 1,318 (18.4%) | 1,120 (11.5%) |
| $100,000 to $299,999 | 3,419 (47.7%) | 5,704 (58.4%) |
| $300,000 to $499,999 | 804 (11.2%) | 1,380 (14.1%) |
| $500,000 to $749,999 | 470 (6.6%) | 634 (6.5%) |
| $750,000 to $999,999 | 139 (1.9%) | 262 (2.7%) |
| $1,000,000 or more | 125 (1.7%) | 161 (1.7%) |
| Total | 7,174 (100.0%) | 9,769 (100.0%) |
Household Income by Mortgage Status in Cass County
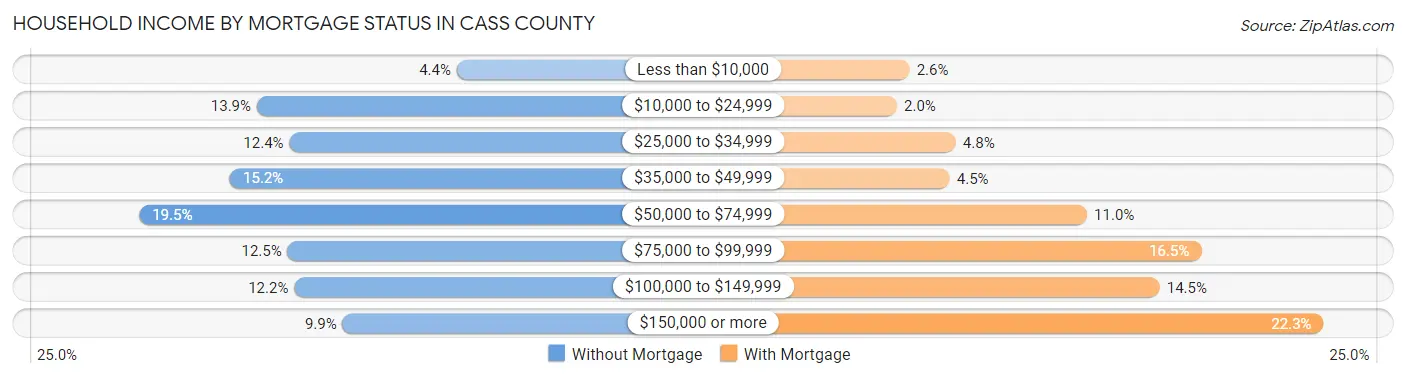
| Household Income | Without Mortgage | With Mortgage |
| Less than $10,000 | 317 (4.4%) | 252 (2.6%) |
| $10,000 to $24,999 | 1,000 (13.9%) | 193 (2.0%) |
| $25,000 to $34,999 | 889 (12.4%) | 467 (4.8%) |
| $35,000 to $49,999 | 1,092 (15.2%) | 439 (4.5%) |
| $50,000 to $74,999 | 1,402 (19.5%) | 1,078 (11.0%) |
| $75,000 to $99,999 | 895 (12.5%) | 1,608 (16.5%) |
| $100,000 to $149,999 | 872 (12.2%) | 1,416 (14.5%) |
| $150,000 or more | 707 (9.9%) | 2,177 (22.3%) |
| Total | 7,174 (100.0%) | 9,769 (100.0%) |
Property Value to Household Income Ratio in Cass County
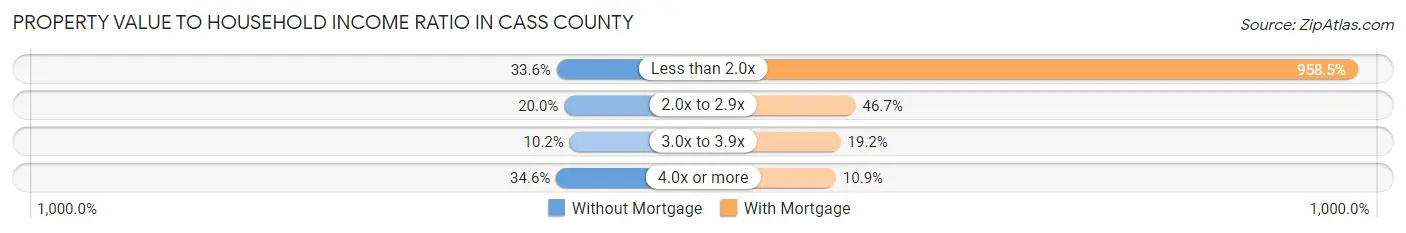
| Value-to-Income Ratio | Without Mortgage | With Mortgage |
| Less than 2.0x | 2,413 (33.6%) | 93,633 (958.5%) |
| 2.0x to 2.9x | 1,436 (20.0%) | 4,565 (46.7%) |
| 3.0x to 3.9x | 732 (10.2%) | 1,875 (19.2%) |
| 4.0x or more | 2,482 (34.6%) | 1,065 (10.9%) |
| Total | 7,174 (100.0%) | 9,769 (100.0%) |
Real Estate Taxes by Mortgage Status in Cass County
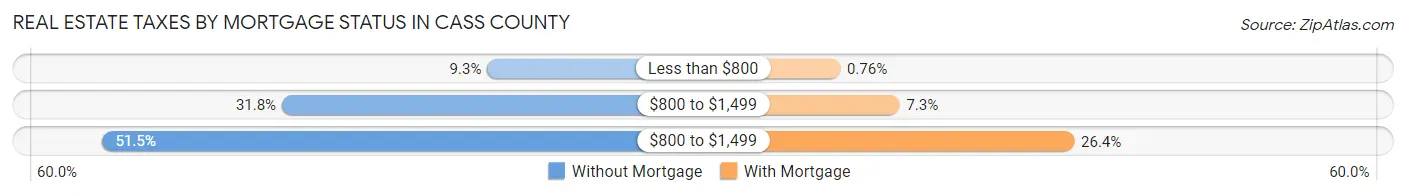
| Property Taxes | Without Mortgage | With Mortgage |
| Less than $800 | 667 (9.3%) | 74 (0.8%) |
| $800 to $1,499 | 2,281 (31.8%) | 711 (7.3%) |
| $800 to $1,499 | 3,692 (51.5%) | 2,581 (26.4%) |
| Total | 7,174 (100.0%) | 9,769 (100.0%) |
Health & Disability in Cass County
Health Insurance Coverage by Age in Cass County
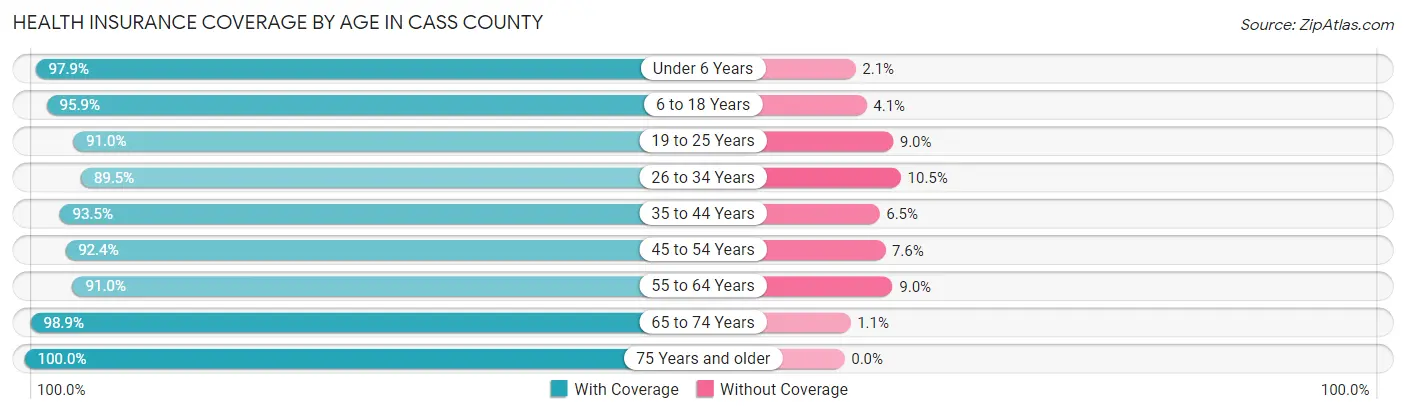
| Age Bracket | With Coverage | Without Coverage |
| Under 6 Years | 2,762 (97.9%) | 58 (2.1%) |
| 6 to 18 Years | 7,987 (95.9%) | 342 (4.1%) |
| 19 to 25 Years | 3,753 (91.0%) | 373 (9.0%) |
| 26 to 34 Years | 4,219 (89.5%) | 495 (10.5%) |
| 35 to 44 Years | 5,273 (93.5%) | 368 (6.5%) |
| 45 to 54 Years | 6,233 (92.4%) | 511 (7.6%) |
| 55 to 64 Years | 7,381 (91.0%) | 726 (9.0%) |
| 65 to 74 Years | 6,704 (98.9%) | 75 (1.1%) |
| 75 Years and older | 4,207 (100.0%) | 0 (0.0%) |
| Total | 48,519 (94.3%) | 2,948 (5.7%) |
Health Insurance Coverage by Citizenship Status in Cass County
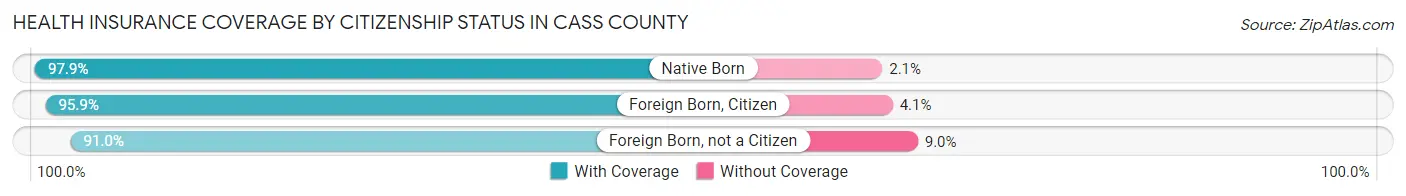
| Citizenship Status | With Coverage | Without Coverage |
| Native Born | 2,762 (97.9%) | 58 (2.1%) |
| Foreign Born, Citizen | 7,987 (95.9%) | 342 (4.1%) |
| Foreign Born, not a Citizen | 3,753 (91.0%) | 373 (9.0%) |
Health Insurance Coverage by Household Income in Cass County
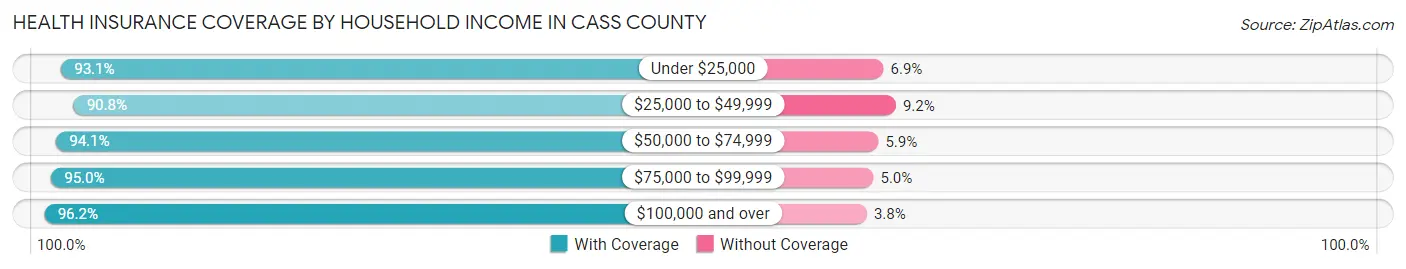
| Household Income | With Coverage | Without Coverage |
| Under $25,000 | 5,029 (93.1%) | 372 (6.9%) |
| $25,000 to $49,999 | 8,806 (90.8%) | 893 (9.2%) |
| $50,000 to $74,999 | 8,216 (94.1%) | 519 (5.9%) |
| $75,000 to $99,999 | 6,773 (95.0%) | 357 (5.0%) |
| $100,000 and over | 19,452 (96.2%) | 764 (3.8%) |
Public vs Private Health Insurance Coverage by Age in Cass County
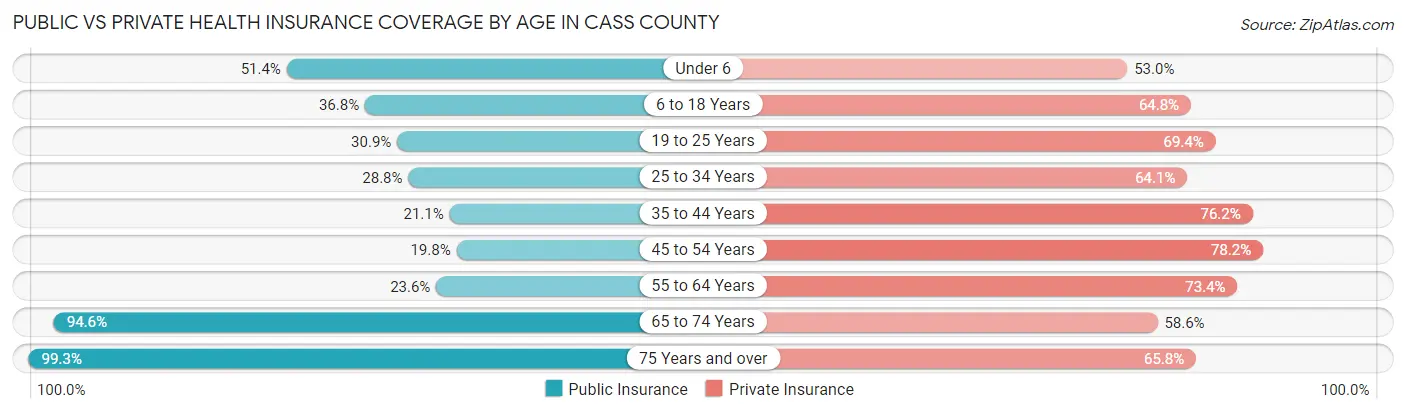
| Age Bracket | Public Insurance | Private Insurance |
| Under 6 | 1,448 (51.3%) | 1,494 (53.0%) |
| 6 to 18 Years | 3,067 (36.8%) | 5,397 (64.8%) |
| 19 to 25 Years | 1,273 (30.8%) | 2,863 (69.4%) |
| 25 to 34 Years | 1,356 (28.8%) | 3,022 (64.1%) |
| 35 to 44 Years | 1,192 (21.1%) | 4,300 (76.2%) |
| 45 to 54 Years | 1,338 (19.8%) | 5,273 (78.2%) |
| 55 to 64 Years | 1,913 (23.6%) | 5,952 (73.4%) |
| 65 to 74 Years | 6,411 (94.6%) | 3,972 (58.6%) |
| 75 Years and over | 4,176 (99.3%) | 2,766 (65.7%) |
| Total | 22,174 (43.1%) | 35,039 (68.1%) |
Disability Status by Sex by Age in Cass County
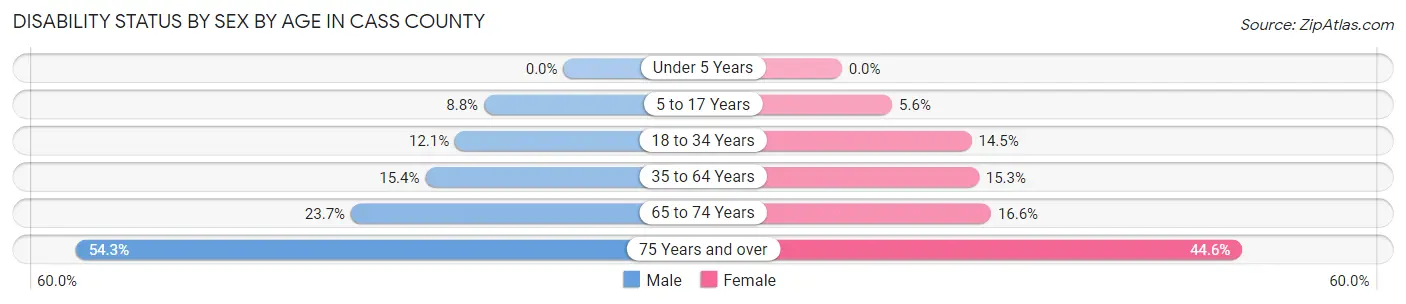
| Age Bracket | Male | Female |
| Under 5 Years | 0 (0.0%) | 0 (0.0%) |
| 5 to 17 Years | 362 (8.8%) | 224 (5.6%) |
| 18 to 34 Years | 580 (12.1%) | 671 (14.4%) |
| 35 to 64 Years | 1,608 (15.4%) | 1,531 (15.3%) |
| 65 to 74 Years | 789 (23.7%) | 572 (16.6%) |
| 75 Years and over | 1,030 (54.3%) | 1,030 (44.6%) |
Disability Class by Sex by Age in Cass County
Disability Class: Hearing Difficulty
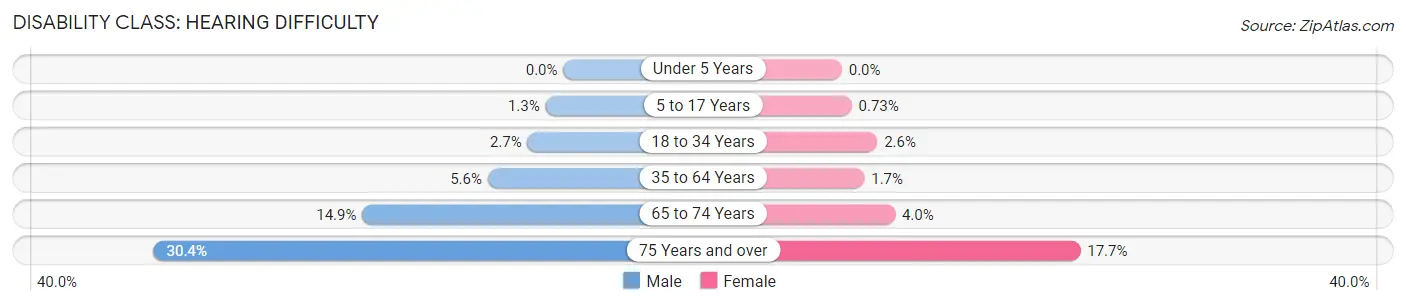
| Age Bracket | Male | Female |
| Under 5 Years | 0 (0.0%) | 0 (0.0%) |
| 5 to 17 Years | 54 (1.3%) | 29 (0.7%) |
| 18 to 34 Years | 128 (2.7%) | 122 (2.6%) |
| 35 to 64 Years | 587 (5.6%) | 168 (1.7%) |
| 65 to 74 Years | 498 (14.9%) | 136 (4.0%) |
| 75 Years and over | 577 (30.4%) | 409 (17.7%) |
Disability Class: Vision Difficulty
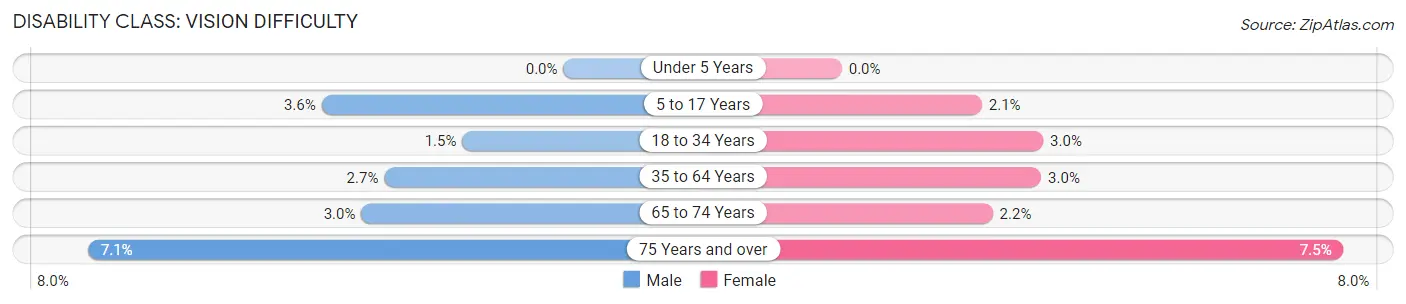
| Age Bracket | Male | Female |
| Under 5 Years | 0 (0.0%) | 0 (0.0%) |
| 5 to 17 Years | 147 (3.6%) | 83 (2.1%) |
| 18 to 34 Years | 72 (1.5%) | 139 (3.0%) |
| 35 to 64 Years | 278 (2.7%) | 297 (3.0%) |
| 65 to 74 Years | 100 (3.0%) | 77 (2.2%) |
| 75 Years and over | 134 (7.1%) | 172 (7.4%) |
Disability Class: Cognitive Difficulty
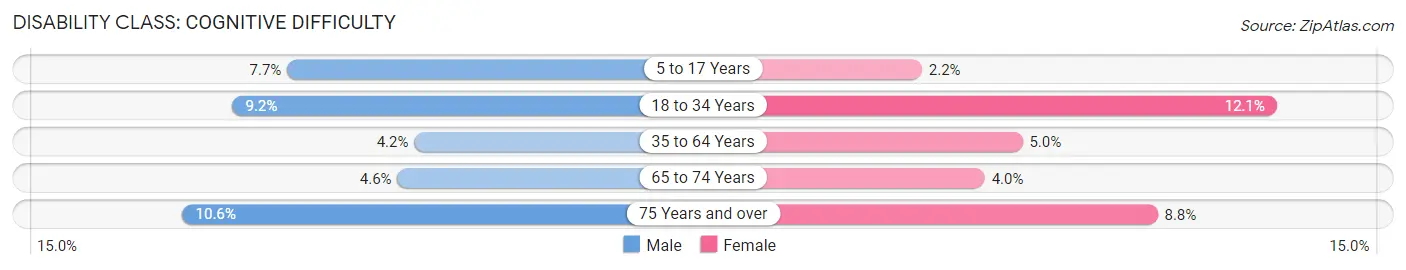
| Age Bracket | Male | Female |
| 5 to 17 Years | 315 (7.7%) | 89 (2.2%) |
| 18 to 34 Years | 443 (9.2%) | 562 (12.1%) |
| 35 to 64 Years | 434 (4.2%) | 505 (5.0%) |
| 65 to 74 Years | 154 (4.6%) | 137 (4.0%) |
| 75 Years and over | 201 (10.6%) | 203 (8.8%) |
Disability Class: Ambulatory Difficulty
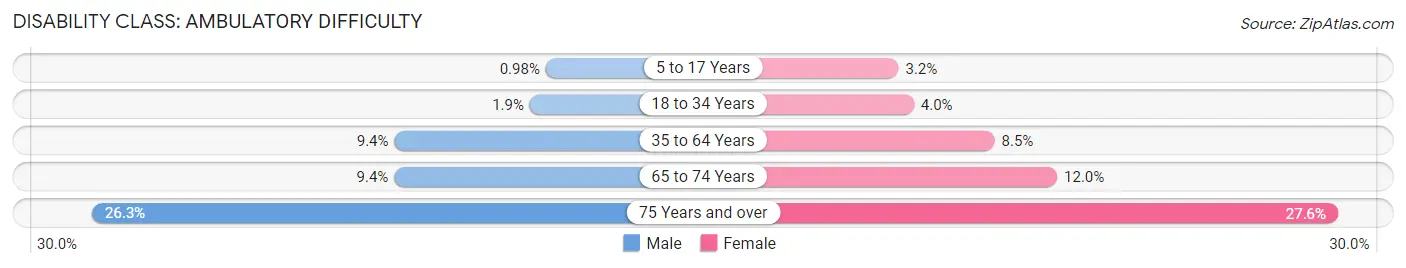
| Age Bracket | Male | Female |
| 5 to 17 Years | 40 (1.0%) | 126 (3.2%) |
| 18 to 34 Years | 90 (1.9%) | 186 (4.0%) |
| 35 to 64 Years | 984 (9.4%) | 854 (8.5%) |
| 65 to 74 Years | 314 (9.4%) | 413 (12.0%) |
| 75 Years and over | 498 (26.3%) | 638 (27.6%) |
Disability Class: Self-Care Difficulty
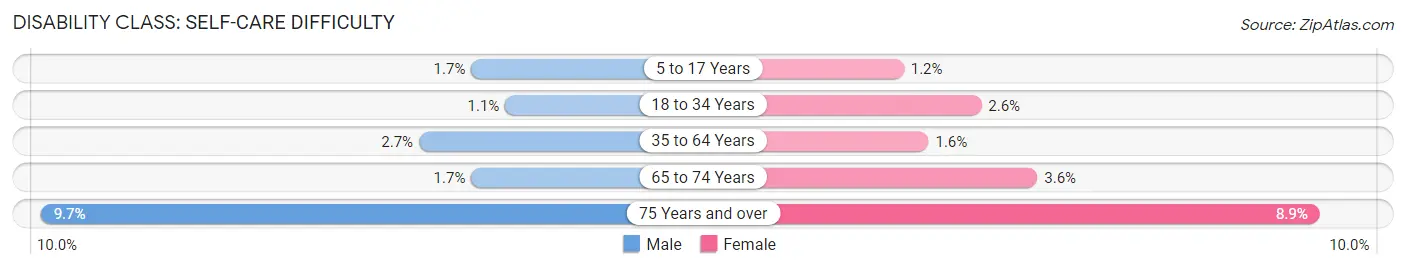
| Age Bracket | Male | Female |
| 5 to 17 Years | 70 (1.7%) | 46 (1.1%) |
| 18 to 34 Years | 52 (1.1%) | 120 (2.6%) |
| 35 to 64 Years | 280 (2.7%) | 162 (1.6%) |
| 65 to 74 Years | 57 (1.7%) | 125 (3.6%) |
| 75 Years and over | 184 (9.7%) | 205 (8.9%) |
Technology Access in Cass County
Computing Device Access in Cass County
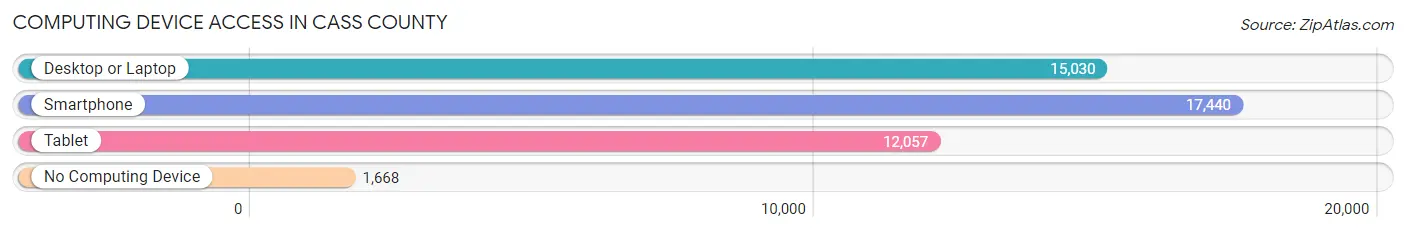
| Device Type | # Households | % Households |
| Desktop or Laptop | 15,030 | 72.3% |
| Smartphone | 17,440 | 83.9% |
| Tablet | 12,057 | 58.0% |
| No Computing Device | 1,668 | 8.0% |
| Total | 20,779 | 100.0% |
Internet Access in Cass County
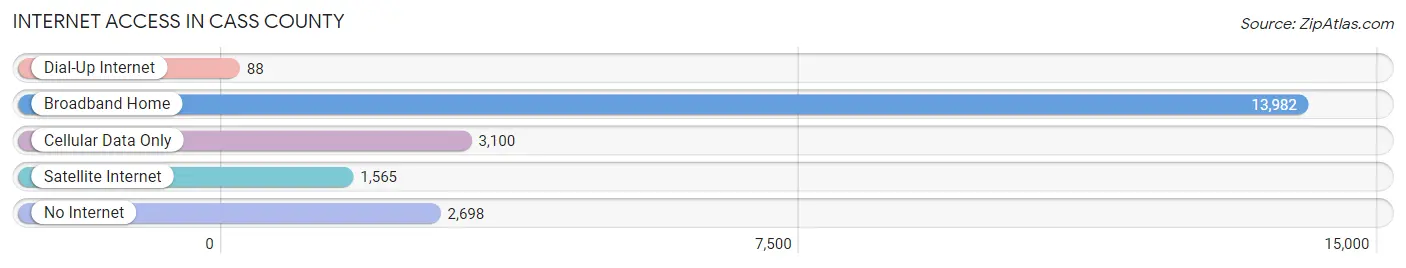
| Internet Type | # Households | % Households |
| Dial-Up Internet | 88 | 0.4% |
| Broadband Home | 13,982 | 67.3% |
| Cellular Data Only | 3,100 | 14.9% |
| Satellite Internet | 1,565 | 7.5% |
| No Internet | 2,698 | 13.0% |
| Total | 20,779 | 100.0% |
Cass County Summary
Cass County, Michigan is located in the southwestern corner of the state and is part of the Great Lakes region. It is bordered by St. Joseph County to the north, Kalamazoo County to the east, Van Buren County to the south, and Berrien County to the west. The county seat is Cassopolis, and the largest city is Dowagiac. The county was established in 1829 and named after Lewis Cass, who was the Governor of Michigan Territory at the time.
Geography
Cass County covers an area of 545 square miles and is mostly rural. The terrain is mostly flat, with some rolling hills in the northern part of the county. The highest point in the county is located in the northeast corner, at an elevation of 890 feet. The county is drained by the St. Joseph River, which flows through the center of the county. Other major waterways include the Dowagiac River, the Galien River, and the Paw Paw River.
The climate of Cass County is humid continental, with cold winters and warm summers. The average annual temperature is around 50 degrees Fahrenheit, and the average annual precipitation is around 33 inches.
Demographics
As of the 2010 census, the population of Cass County was 52,293. The population density was 95.7 people per square mile. The racial makeup of the county was 87.3% White, 8.2% African American, 0.7% Native American, 0.6% Asian, 0.1% Pacific Islander, 1.2% from other races, and 2.1% from two or more races. Hispanic or Latino of any race were 3.2% of the population.
The median income for a household in the county was $41,945, and the median income for a family was $50,945. The per capita income for the county was $20,945. About 11.2% of families and 14.7% of the population were below the poverty line, including 19.2% of those under age 18 and 8.2% of those age 65 or over.
Economy
The economy of Cass County is largely based on agriculture and manufacturing. The county is home to several large farms, which produce corn, soybeans, wheat, and other crops. The county is also home to several manufacturing companies, including a paper mill, a furniture factory, and a plastics factory.
The county is also home to several tourist attractions, including the Pokagon State Park, the Round Barn Winery, and the Dowagiac Riverwalk. These attractions bring in visitors from all over the state and help to boost the local economy.
Cass County is also home to several colleges and universities, including Southwestern Michigan College, Andrews University, and Bethel College. These institutions provide educational opportunities for local residents and help to attract new businesses to the area.
Conclusion
Cass County, Michigan is a rural county located in the southwestern corner of the state. It is home to a diverse population and a strong economy based on agriculture and manufacturing. The county is also home to several tourist attractions and educational institutions, which help to attract new businesses and visitors to the area.
Common Questions
What is Per Capita Income in Cass County?
Per Capita income in Cass County is $36,851.
What is the Median Family Income in Cass County?
Median Family Income in Cass County is $79,502.
What is the Median Household income in Cass County?
Median Household Income in Cass County is $65,183.
What is Income or Wage Gap in Cass County?
Income or Wage Gap in Cass County is 35.7%.
Women in Cass County earn 64.3 cents for every dollar earned by a man.
What is Family Income Deficit in Cass County?
Family Income Deficit in Cass County is $11,900.
Families that are below poverty line in Cass County earn $11,900 less on average than the poverty threshold level.
What is Inequality or Gini Index in Cass County?
Inequality or Gini Index in Cass County is 0.47.
What is the Total Population of Cass County?
Total Population of Cass County is 51,604.
What is the Total Male Population of Cass County?
Total Male Population of Cass County is 25,911.
What is the Total Female Population of Cass County?
Total Female Population of Cass County is 25,693.
What is the Ratio of Males per 100 Females in Cass County?
There are 100.85 Males per 100 Females in Cass County.
What is the Ratio of Females per 100 Males in Cass County?
There are 99.16 Females per 100 Males in Cass County.
What is the Median Population Age in Cass County?
Median Population Age in Cass County is 45.3 Years.
What is the Average Family Size in Cass County
Average Family Size in Cass County is 2.9 People.
What is the Average Household Size in Cass County
Average Household Size in Cass County is 2.5 People.
How Large is the Labor Force in Cass County?
There are 25,194 People in the Labor Forcein in Cass County.
What is the Percentage of People in the Labor Force in Cass County?
59.3% of People are in the Labor Force in Cass County.
What is the Unemployment Rate in Cass County?
Unemployment Rate in Cass County is 5.0%.