Antrim County, MI Map & Demographics
Antrim County Map
Antrim County Overview
$39,166
PER CAPITA INCOME
$85,201
AVG FAMILY INCOME
$68,850
AVG HOUSEHOLD INCOME
27.6%
WAGE / INCOME GAP [ % ]
72.4¢/ $1
WAGE / INCOME GAP [ $ ]
$9,604
FAMILY INCOME DEFICIT
0.43
INEQUALITY / GINI INDEX
23,662
TOTAL POPULATION
11,833
MALE POPULATION
11,829
FEMALE POPULATION
100.03
MALES / 100 FEMALES
99.97
FEMALES / 100 MALES
51.5
MEDIAN AGE
2.6
AVG FAMILY SIZE
2.2
AVG HOUSEHOLD SIZE
11,228
LABOR FORCE [ PEOPLE ]
55.8%
PERCENT IN LABOR FORCE
4.6%
UNEMPLOYMENT RATE
Antrim County Area Codes
Income in Antrim County
Income Overview in Antrim County
Per Capita Income in Antrim County is $39,166, while median incomes of families and households are $85,201 and $68,850 respectively.
| Characteristic | Number | Measure |
| Per Capita Income | 23,662 | $39,166 |
| Median Family Income | 7,287 | $85,201 |
| Mean Family Income | 7,287 | $101,885 |
| Median Household Income | 10,741 | $68,850 |
| Mean Household Income | 10,741 | $87,433 |
| Income Deficit | 7,287 | $9,604 |
| Wage / Income Gap (%) | 23,662 | 27.56% |
| Wage / Income Gap ($) | 23,662 | 72.44¢ per $1 |
| Gini / Inequality Index | 23,662 | 0.43 |
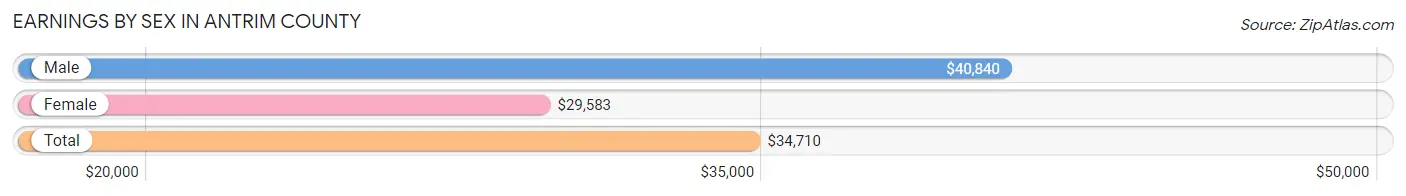
Earnings by Sex in Antrim County
Average Earnings in Antrim County are $34,710, $40,840 for men and $29,583 for women, a difference of 27.6%.
| Sex | Number | Average Earnings |
| Male | 6,457 (53.5%) | $40,840 |
| Female | 5,606 (46.5%) | $29,583 |
| Total | 12,063 (100.0%) | $34,710 |
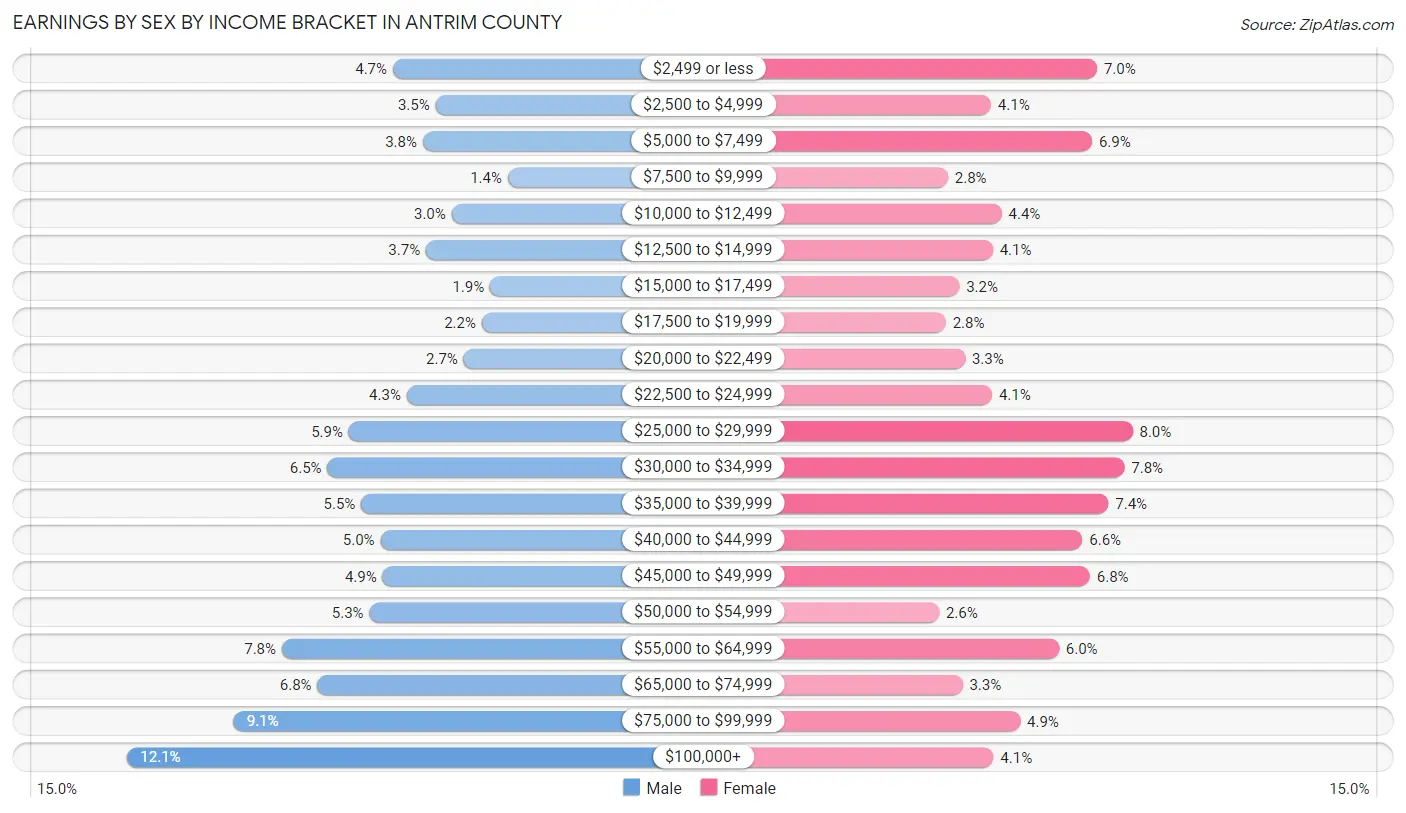
Earnings by Sex by Income Bracket in Antrim County
The most common earnings brackets in Antrim County are $100,000+ for men (782 | 12.1%) and $25,000 to $29,999 for women (450 | 8.0%).
| Income | Male | Female |
| $2,499 or less | 300 (4.6%) | 394 (7.0%) |
| $2,500 to $4,999 | 223 (3.5%) | 227 (4.1%) |
| $5,000 to $7,499 | 246 (3.8%) | 386 (6.9%) |
| $7,500 to $9,999 | 92 (1.4%) | 159 (2.8%) |
| $10,000 to $12,499 | 194 (3.0%) | 244 (4.3%) |
| $12,500 to $14,999 | 240 (3.7%) | 230 (4.1%) |
| $15,000 to $17,499 | 124 (1.9%) | 177 (3.2%) |
| $17,500 to $19,999 | 139 (2.1%) | 156 (2.8%) |
| $20,000 to $22,499 | 172 (2.7%) | 186 (3.3%) |
| $22,500 to $24,999 | 275 (4.3%) | 229 (4.1%) |
| $25,000 to $29,999 | 380 (5.9%) | 450 (8.0%) |
| $30,000 to $34,999 | 419 (6.5%) | 437 (7.8%) |
| $35,000 to $39,999 | 358 (5.5%) | 412 (7.3%) |
| $40,000 to $44,999 | 323 (5.0%) | 371 (6.6%) |
| $45,000 to $49,999 | 319 (4.9%) | 383 (6.8%) |
| $50,000 to $54,999 | 343 (5.3%) | 145 (2.6%) |
| $55,000 to $64,999 | 502 (7.8%) | 334 (6.0%) |
| $65,000 to $74,999 | 437 (6.8%) | 182 (3.3%) |
| $75,000 to $99,999 | 589 (9.1%) | 273 (4.9%) |
| $100,000+ | 782 (12.1%) | 231 (4.1%) |
| Total | 6,457 (100.0%) | 5,606 (100.0%) |
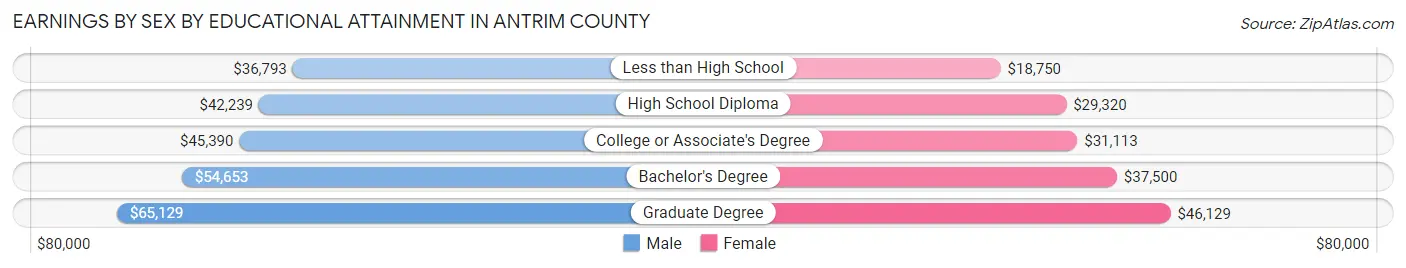
Earnings by Sex by Educational Attainment in Antrim County
Average earnings in Antrim County are $46,449 for men and $32,714 for women, a difference of 29.6%. Men with an educational attainment of graduate degree enjoy the highest average annual earnings of $65,129, while those with less than high school education earn the least with $36,793. Women with an educational attainment of graduate degree earn the most with the average annual earnings of $46,129, while those with less than high school education have the smallest earnings of $18,750.
| Educational Attainment | Male Income | Female Income |
| Less than High School | $36,793 | $18,750 |
| High School Diploma | $42,239 | $29,320 |
| College or Associate's Degree | $45,390 | $31,113 |
| Bachelor's Degree | $54,653 | $37,500 |
| Graduate Degree | $65,129 | $46,129 |
| Total | $46,449 | $32,714 |
Family Income in Antrim County
Family Income Brackets in Antrim County
According to the Antrim County family income data, there are 1,545 families falling into the $100,000 to $149,999 income range, which is the most common income bracket and makes up 21.2% of all families. Conversely, the less than $10,000 income bracket is the least frequent group with only 117 families (1.6%) belonging to this category.
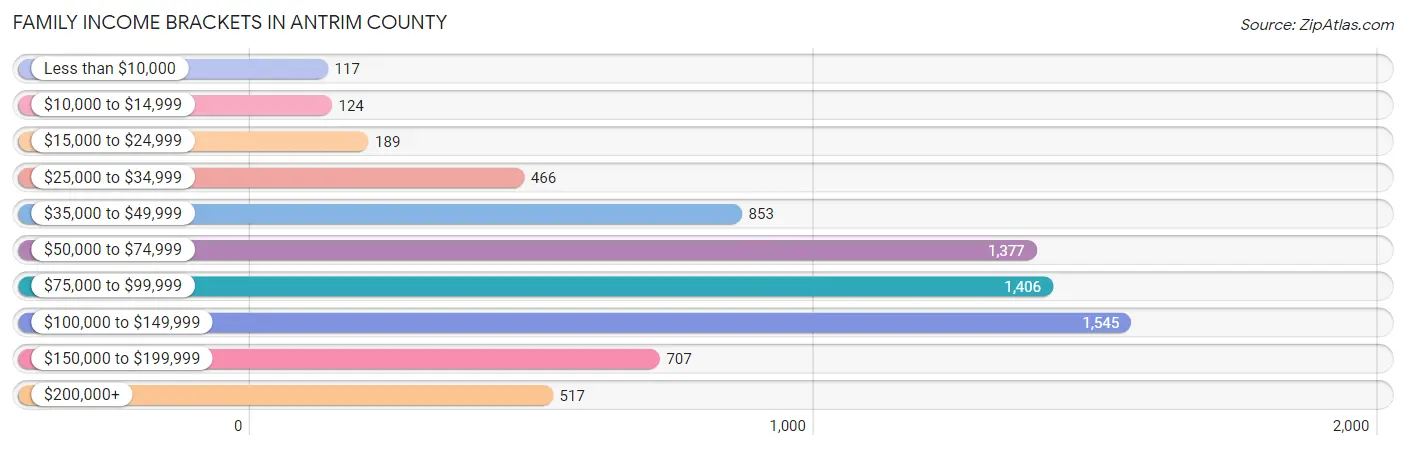
| Income Bracket | # Families | % Families |
| Less than $10,000 | 117 | 1.6% |
| $10,000 to $14,999 | 124 | 1.7% |
| $15,000 to $24,999 | 189 | 2.6% |
| $25,000 to $34,999 | 466 | 6.4% |
| $35,000 to $49,999 | 853 | 11.7% |
| $50,000 to $74,999 | 1,377 | 18.9% |
| $75,000 to $99,999 | 1,406 | 19.3% |
| $100,000 to $149,999 | 1,545 | 21.2% |
| $150,000 to $199,999 | 707 | 9.7% |
| $200,000+ | 517 | 7.1% |
Family Income by Famaliy Size in Antrim County
7+ person families (75 | 1.0%) account for the highest median family income in Antrim County with $125,083 per family, while 2-person families (4,541 | 62.3%) have the highest median income of $40,136 per family member.
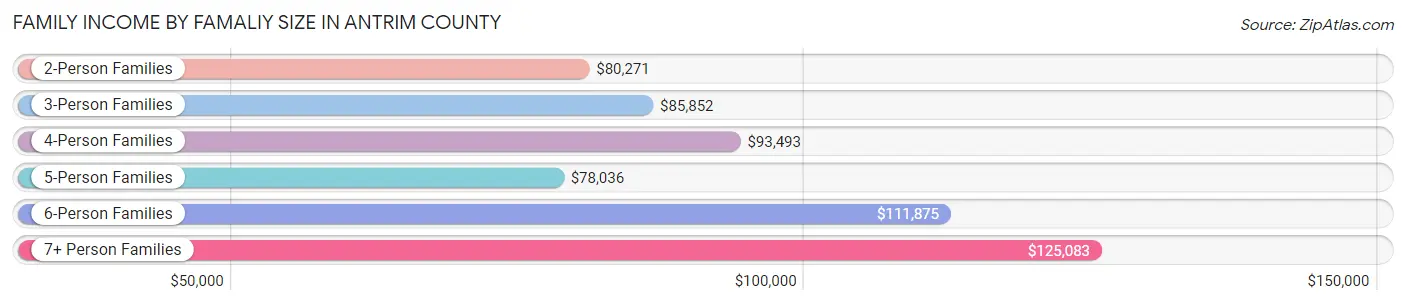
| Income Bracket | # Families | Median Income |
| 2-Person Families | 4,541 (62.3%) | $80,271 |
| 3-Person Families | 1,181 (16.2%) | $85,852 |
| 4-Person Families | 887 (12.2%) | $93,493 |
| 5-Person Families | 417 (5.7%) | $78,036 |
| 6-Person Families | 186 (2.5%) | $111,875 |
| 7+ Person Families | 75 (1.0%) | $125,083 |
| Total | 7,287 (100.0%) | $85,201 |
Family Income by Number of Earners in Antrim County
The median family income in Antrim County is $85,201, with families comprising 3+ earners (883) having the highest median family income of $109,779, while families with 1 earner (1,922) have the lowest median family income of $63,922, accounting for 12.1% and 26.4% of families, respectively.
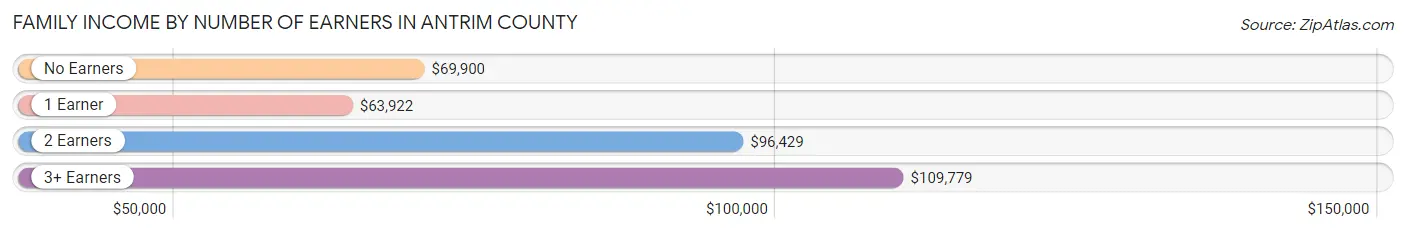
| Number of Earners | # Families | Median Income |
| No Earners | 1,860 (25.5%) | $69,900 |
| 1 Earner | 1,922 (26.4%) | $63,922 |
| 2 Earners | 2,622 (36.0%) | $96,429 |
| 3+ Earners | 883 (12.1%) | $109,779 |
| Total | 7,287 (100.0%) | $85,201 |
Household Income in Antrim County
Household Income Brackets in Antrim County
With 1,912 households falling in the category, the $50,000 to $74,999 income range is the most frequent in Antrim County, accounting for 17.8% of all households. In contrast, only 290 households (2.7%) fall into the less than $10,000 income bracket, making it the least populous group.
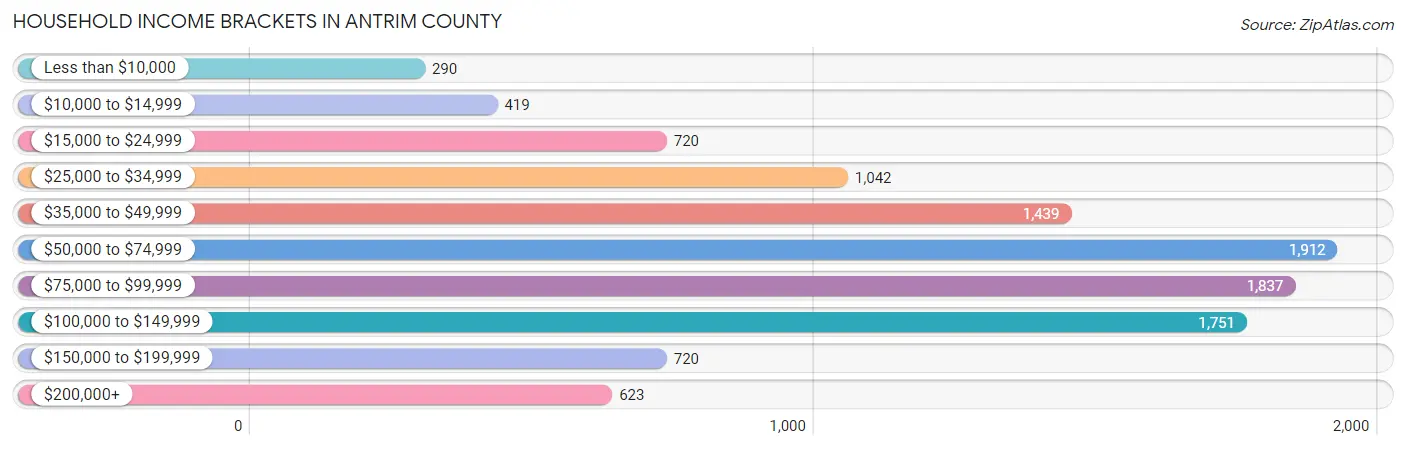
| Income Bracket | # Households | % Households |
| Less than $10,000 | 290 | 2.7% |
| $10,000 to $14,999 | 419 | 3.9% |
| $15,000 to $24,999 | 720 | 6.7% |
| $25,000 to $34,999 | 1,042 | 9.7% |
| $35,000 to $49,999 | 1,439 | 13.4% |
| $50,000 to $74,999 | 1,912 | 17.8% |
| $75,000 to $99,999 | 1,837 | 17.1% |
| $100,000 to $149,999 | 1,751 | 16.3% |
| $150,000 to $199,999 | 720 | 6.7% |
| $200,000+ | 623 | 5.8% |
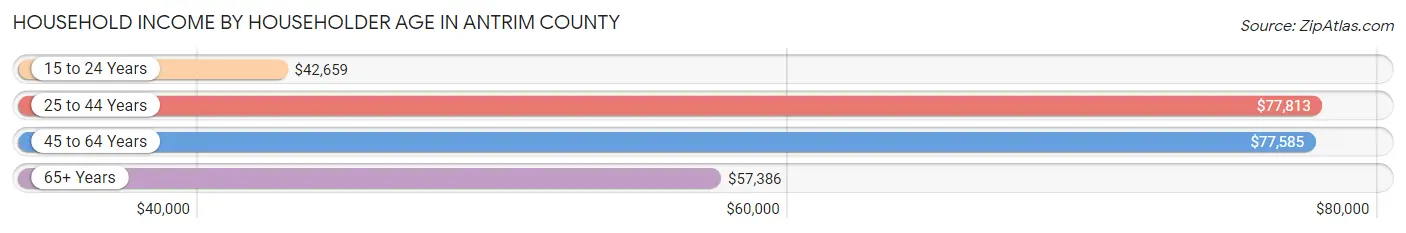
Household Income by Householder Age in Antrim County
The median household income in Antrim County is $68,850, with the highest median household income of $77,813 found in the 25 to 44 years age bracket for the primary householder. A total of 2,267 households (21.1%) fall into this category. Meanwhile, the 15 to 24 years age bracket for the primary householder has the lowest median household income of $42,659, with 355 households (3.3%) in this group.
| Income Bracket | # Households | Median Income |
| 15 to 24 Years | 355 (3.3%) | $42,659 |
| 25 to 44 Years | 2,267 (21.1%) | $77,813 |
| 45 to 64 Years | 3,898 (36.3%) | $77,585 |
| 65+ Years | 4,221 (39.3%) | $57,386 |
| Total | 10,741 (100.0%) | $68,850 |
Poverty in Antrim County
Income Below Poverty by Sex and Age in Antrim County
With 7.7% poverty level for males and 11.1% for females among the residents of Antrim County, 5 year old males and under 5 year old females are the most vulnerable to poverty, with 26 males (22.8%) and 106 females (24.0%) in their respective age groups living below the poverty level.
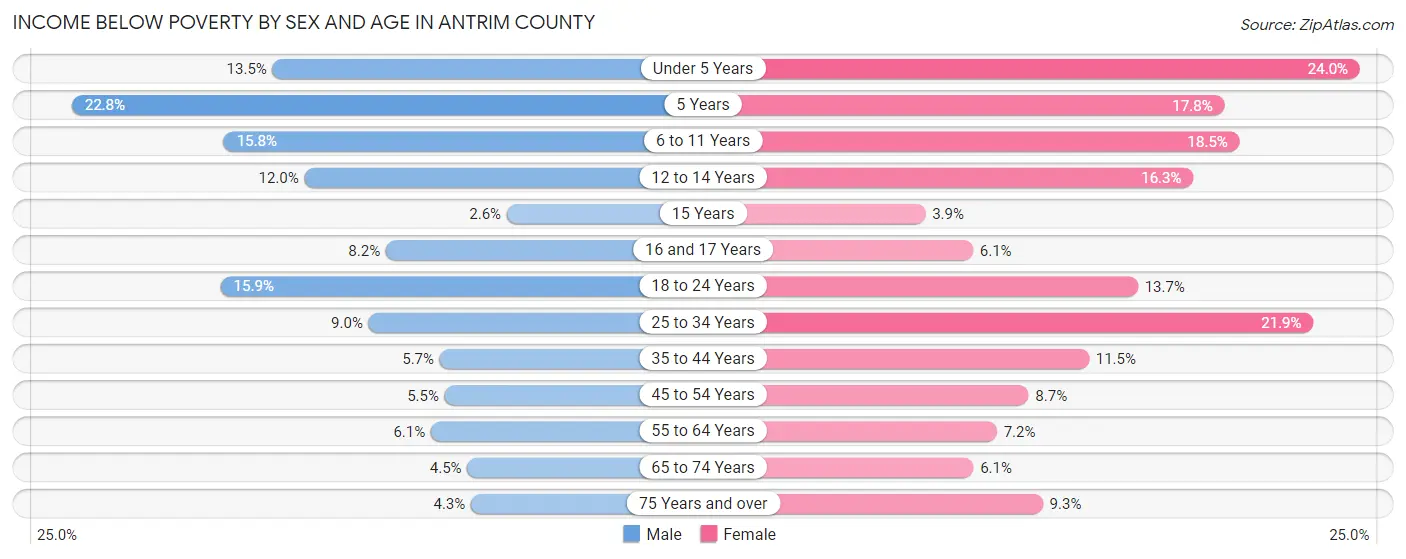
| Age Bracket | Male | Female |
| Under 5 Years | 63 (13.5%) | 106 (24.0%) |
| 5 Years | 26 (22.8%) | 27 (17.8%) |
| 6 to 11 Years | 113 (15.8%) | 113 (18.5%) |
| 12 to 14 Years | 37 (12.0%) | 53 (16.3%) |
| 15 Years | 5 (2.6%) | 6 (3.9%) |
| 16 and 17 Years | 20 (8.2%) | 18 (6.1%) |
| 18 to 24 Years | 128 (15.9%) | 105 (13.7%) |
| 25 to 34 Years | 102 (9.0%) | 223 (21.9%) |
| 35 to 44 Years | 67 (5.7%) | 131 (11.5%) |
| 45 to 54 Years | 77 (5.5%) | 114 (8.7%) |
| 55 to 64 Years | 125 (6.1%) | 154 (7.2%) |
| 65 to 74 Years | 86 (4.4%) | 120 (6.1%) |
| 75 Years and over | 53 (4.3%) | 127 (9.3%) |
| Total | 902 (7.7%) | 1,297 (11.1%) |
Income Above Poverty by Sex and Age in Antrim County
According to the poverty statistics in Antrim County, males aged 15 years and females aged 15 years are the age groups that are most secure financially, with 97.4% of males and 96.1% of females in these age groups living above the poverty line.
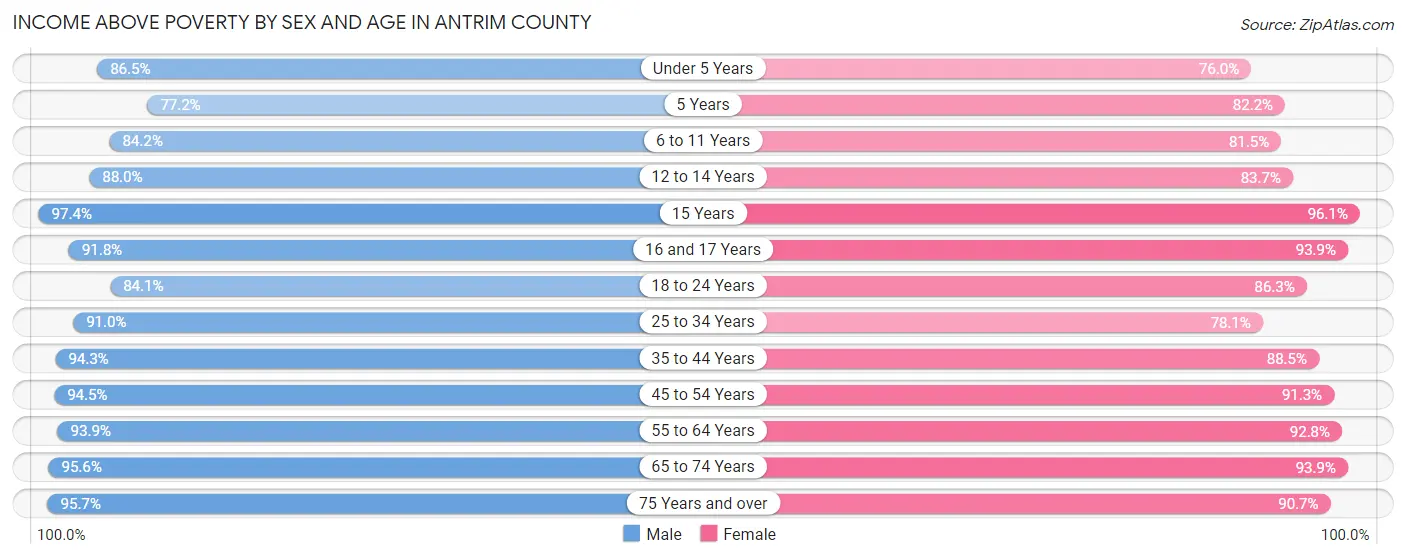
| Age Bracket | Male | Female |
| Under 5 Years | 404 (86.5%) | 335 (76.0%) |
| 5 Years | 88 (77.2%) | 125 (82.2%) |
| 6 to 11 Years | 604 (84.2%) | 499 (81.5%) |
| 12 to 14 Years | 271 (88.0%) | 272 (83.7%) |
| 15 Years | 186 (97.4%) | 149 (96.1%) |
| 16 and 17 Years | 223 (91.8%) | 278 (93.9%) |
| 18 to 24 Years | 677 (84.1%) | 660 (86.3%) |
| 25 to 34 Years | 1,027 (91.0%) | 796 (78.1%) |
| 35 to 44 Years | 1,103 (94.3%) | 1,012 (88.5%) |
| 45 to 54 Years | 1,324 (94.5%) | 1,202 (91.3%) |
| 55 to 64 Years | 1,910 (93.9%) | 1,988 (92.8%) |
| 65 to 74 Years | 1,846 (95.6%) | 1,846 (93.9%) |
| 75 Years and over | 1,184 (95.7%) | 1,235 (90.7%) |
| Total | 10,847 (92.3%) | 10,397 (88.9%) |
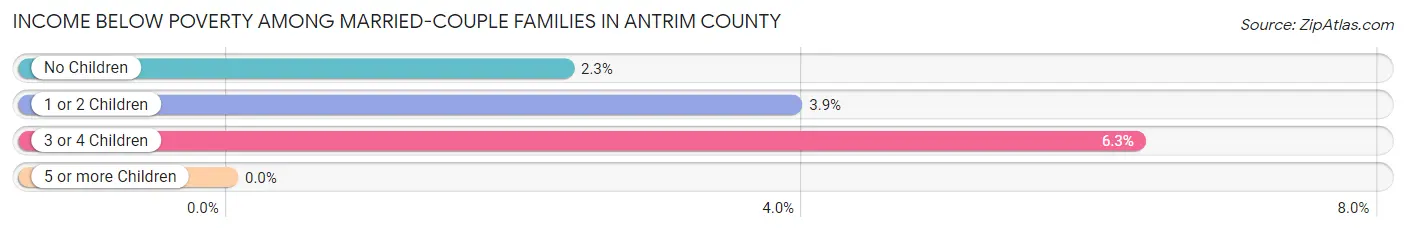
Income Below Poverty Among Married-Couple Families in Antrim County
The poverty statistics for married-couple families in Antrim County show that 2.9% or 170 of the total 5,926 families live below the poverty line. Families with 3 or 4 children have the highest poverty rate of 6.3%, comprising of 22 families. On the other hand, families with 5 or more children have the lowest poverty rate of 0.0%, which includes 0 families.
| Children | Above Poverty | Below Poverty |
| No Children | 4,263 (97.7%) | 102 (2.3%) |
| 1 or 2 Children | 1,123 (96.1%) | 46 (3.9%) |
| 3 or 4 Children | 326 (93.7%) | 22 (6.3%) |
| 5 or more Children | 44 (100.0%) | 0 (0.0%) |
| Total | 5,756 (97.1%) | 170 (2.9%) |
Income Below Poverty Among Single-Parent Households in Antrim County
According to the poverty data in Antrim County, 7.1% or 42 single-father households and 25.7% or 198 single-mother households are living below the poverty line. Among single-father households, those with 1 or 2 children have the highest poverty rate, with 30 households (11.5%) experiencing poverty. Likewise, among single-mother households, those with 5 or more children have the highest poverty rate, with 19 households (100.0%) falling below the poverty line.
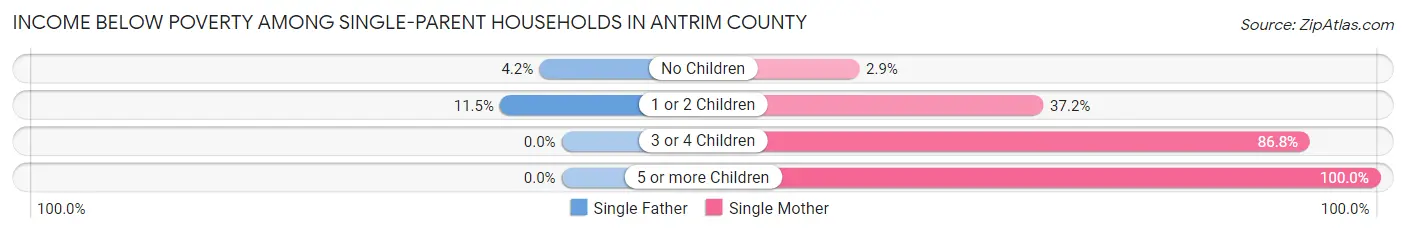
| Children | Single Father | Single Mother |
| No Children | 12 (4.2%) | 10 (2.9%) |
| 1 or 2 Children | 30 (11.5%) | 136 (37.2%) |
| 3 or 4 Children | 0 (0.0%) | 33 (86.8%) |
| 5 or more Children | 0 (0.0%) | 19 (100.0%) |
| Total | 42 (7.1%) | 198 (25.7%) |
Income Below Poverty Among Married-Couple vs Single-Parent Households in Antrim County
The poverty data for Antrim County shows that 170 of the married-couple family households (2.9%) and 240 of the single-parent households (17.6%) are living below the poverty level. Within the married-couple family households, those with 3 or 4 children have the highest poverty rate, with 22 households (6.3%) falling below the poverty line. Among the single-parent households, those with 5 or more children have the highest poverty rate, with 19 household (100.0%) living below poverty.
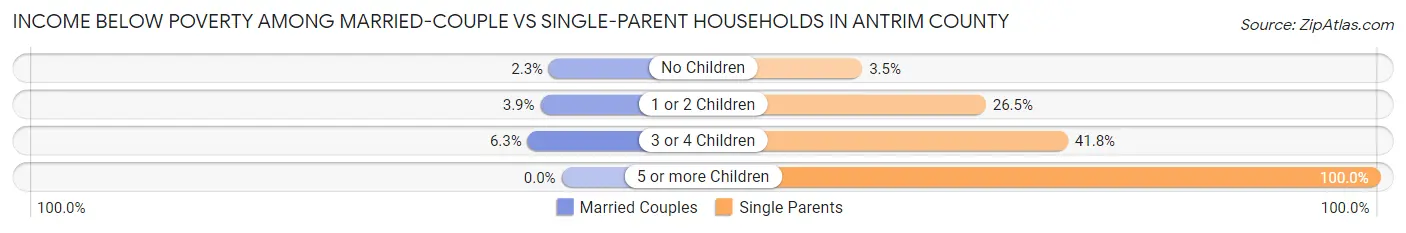
| Children | Married-Couple Families | Single-Parent Households |
| No Children | 102 (2.3%) | 22 (3.5%) |
| 1 or 2 Children | 46 (3.9%) | 166 (26.5%) |
| 3 or 4 Children | 22 (6.3%) | 33 (41.8%) |
| 5 or more Children | 0 (0.0%) | 19 (100.0%) |
| Total | 170 (2.9%) | 240 (17.6%) |
Race in Antrim County
The most populous races in Antrim County are White / Caucasian (22,331 | 94.4%), Two or more Races (811 | 3.4%), and Hispanic or Latino (583 | 2.5%).
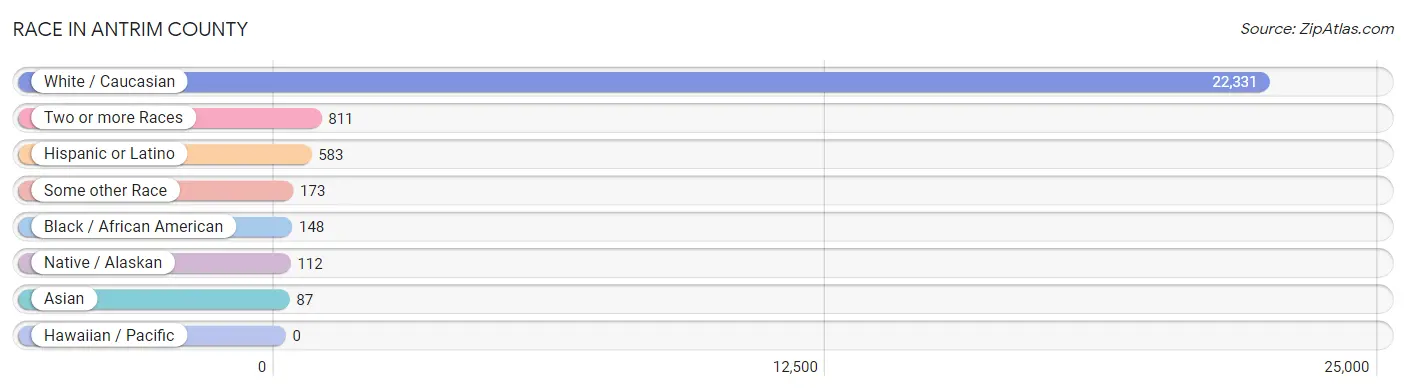
| Race | # Population | % Population |
| Asian | 87 | 0.4% |
| Black / African American | 148 | 0.6% |
| Hawaiian / Pacific | 0 | 0.0% |
| Hispanic or Latino | 583 | 2.5% |
| Native / Alaskan | 112 | 0.5% |
| White / Caucasian | 22,331 | 94.4% |
| Two or more Races | 811 | 3.4% |
| Some other Race | 173 | 0.7% |
| Total | 23,662 | 100.0% |
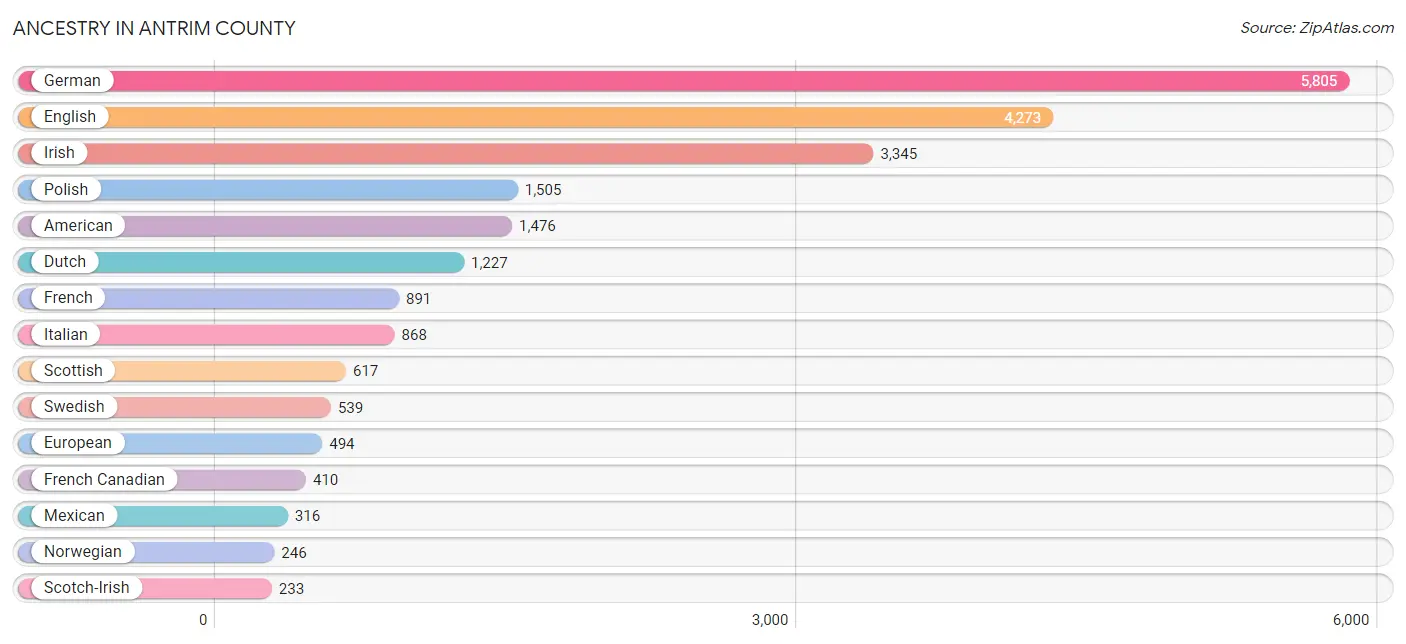
Ancestry in Antrim County
The most populous ancestries reported in Antrim County are German (5,805 | 24.5%), English (4,273 | 18.1%), Irish (3,345 | 14.1%), Polish (1,505 | 6.4%), and American (1,476 | 6.2%), together accounting for 69.3% of all Antrim County residents.
| Ancestry | # Population | % Population |
| American | 1,476 | 6.2% |
| Arab | 43 | 0.2% |
| Argentinean | 60 | 0.3% |
| Armenian | 14 | 0.1% |
| Australian | 4 | 0.0% |
| Austrian | 57 | 0.2% |
| Belgian | 88 | 0.4% |
| Bhutanese | 12 | 0.1% |
| Blackfeet | 5 | 0.0% |
| British | 180 | 0.8% |
| Burmese | 28 | 0.1% |
| Canadian | 90 | 0.4% |
| Central American | 34 | 0.1% |
| Central American Indian | 11 | 0.1% |
| Cherokee | 106 | 0.4% |
| Chilean | 9 | 0.0% |
| Chippewa | 121 | 0.5% |
| Croatian | 21 | 0.1% |
| Czech | 151 | 0.6% |
| Czechoslovakian | 41 | 0.2% |
| Danish | 91 | 0.4% |
| Dominican | 4 | 0.0% |
| Dutch | 1,227 | 5.2% |
| Eastern European | 86 | 0.4% |
| English | 4,273 | 18.1% |
| Ethiopian | 36 | 0.2% |
| European | 494 | 2.1% |
| Finnish | 202 | 0.9% |
| French | 891 | 3.8% |
| French American Indian | 9 | 0.0% |
| French Canadian | 410 | 1.7% |
| German | 5,805 | 24.5% |
| Greek | 94 | 0.4% |
| Guatemalan | 11 | 0.1% |
| Honduran | 19 | 0.1% |
| Hungarian | 112 | 0.5% |
| Icelander | 1 | 0.0% |
| Indian (Asian) | 14 | 0.1% |
| Irish | 3,345 | 14.1% |
| Italian | 868 | 3.7% |
| Jamaican | 39 | 0.2% |
| Jordanian | 8 | 0.0% |
| Kenyan | 2 | 0.0% |
| Korean | 7 | 0.0% |
| Latvian | 30 | 0.1% |
| Lebanese | 32 | 0.1% |
| Lithuanian | 58 | 0.3% |
| Maltese | 9 | 0.0% |
| Mexican | 316 | 1.3% |
| Mexican American Indian | 1 | 0.0% |
| Native Hawaiian | 19 | 0.1% |
| Navajo | 6 | 0.0% |
| Nigerian | 6 | 0.0% |
| Northern European | 23 | 0.1% |
| Norwegian | 246 | 1.0% |
| Ottawa | 107 | 0.4% |
| Pennsylvania German | 6 | 0.0% |
| Polish | 1,505 | 6.4% |
| Portuguese | 12 | 0.1% |
| Potawatomi | 4 | 0.0% |
| Puerto Rican | 43 | 0.2% |
| Romanian | 33 | 0.1% |
| Russian | 74 | 0.3% |
| Salvadoran | 4 | 0.0% |
| Samoan | 5 | 0.0% |
| Scandinavian | 59 | 0.3% |
| Scotch-Irish | 233 | 1.0% |
| Scottish | 617 | 2.6% |
| Serbian | 10 | 0.0% |
| Slavic | 16 | 0.1% |
| Slovak | 60 | 0.3% |
| Slovene | 25 | 0.1% |
| South American | 69 | 0.3% |
| Spaniard | 32 | 0.1% |
| Spanish | 32 | 0.1% |
| Spanish American | 5 | 0.0% |
| Sri Lankan | 14 | 0.1% |
| Subsaharan African | 44 | 0.2% |
| Swedish | 539 | 2.3% |
| Swiss | 104 | 0.4% |
| Syrian | 3 | 0.0% |
| Thai | 35 | 0.2% |
| Tongan | 8 | 0.0% |
| Ukrainian | 173 | 0.7% |
| Welsh | 175 | 0.7% |
| Yugoslavian | 26 | 0.1% | View All 86 Rows |
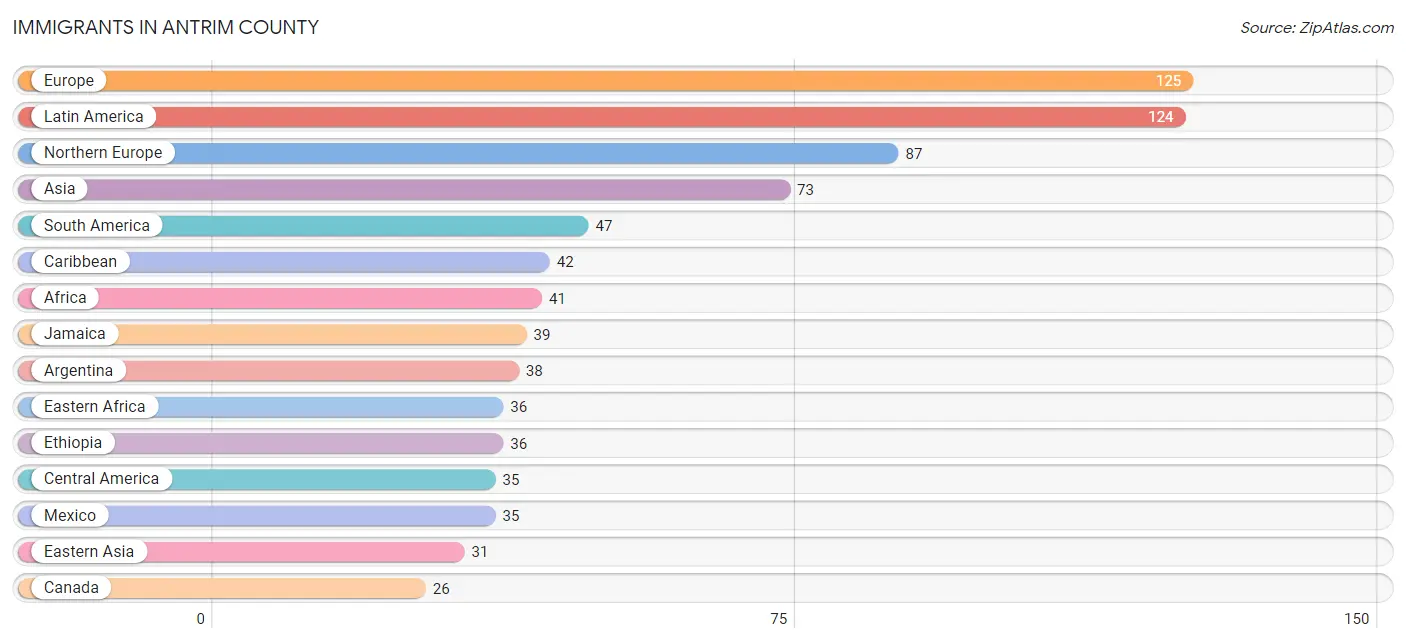
Immigrants in Antrim County
The most numerous immigrant groups reported in Antrim County came from Europe (125 | 0.5%), Latin America (124 | 0.5%), Northern Europe (87 | 0.4%), Asia (73 | 0.3%), and South America (47 | 0.2%), together accounting for 1.9% of all Antrim County residents.
| Immigration Origin | # Population | % Population |
| Africa | 41 | 0.2% |
| Argentina | 38 | 0.2% |
| Asia | 73 | 0.3% |
| Australia | 4 | 0.0% |
| Canada | 26 | 0.1% |
| Caribbean | 42 | 0.2% |
| Central America | 35 | 0.2% |
| Chile | 9 | 0.0% |
| China | 8 | 0.0% |
| Czechoslovakia | 1 | 0.0% |
| Dominican Republic | 3 | 0.0% |
| Eastern Africa | 36 | 0.2% |
| Eastern Asia | 31 | 0.1% |
| Eastern Europe | 14 | 0.1% |
| England | 5 | 0.0% |
| Ethiopia | 36 | 0.2% |
| Europe | 125 | 0.5% |
| Germany | 11 | 0.1% |
| Greece | 3 | 0.0% |
| India | 17 | 0.1% |
| Jamaica | 39 | 0.2% |
| Japan | 10 | 0.0% |
| Korea | 13 | 0.1% |
| Latin America | 124 | 0.5% |
| Lebanon | 13 | 0.1% |
| Mexico | 35 | 0.2% |
| Netherlands | 10 | 0.0% |
| Northern Europe | 87 | 0.4% |
| Oceania | 4 | 0.0% |
| Philippines | 6 | 0.0% |
| Russia | 10 | 0.0% |
| Serbia | 3 | 0.0% |
| South Africa | 5 | 0.0% |
| South America | 47 | 0.2% |
| South Central Asia | 17 | 0.1% |
| South Eastern Asia | 12 | 0.1% |
| Southern Europe | 3 | 0.0% |
| Sweden | 5 | 0.0% |
| Vietnam | 6 | 0.0% |
| Western Asia | 13 | 0.1% |
| Western Europe | 21 | 0.1% | View All 41 Rows |
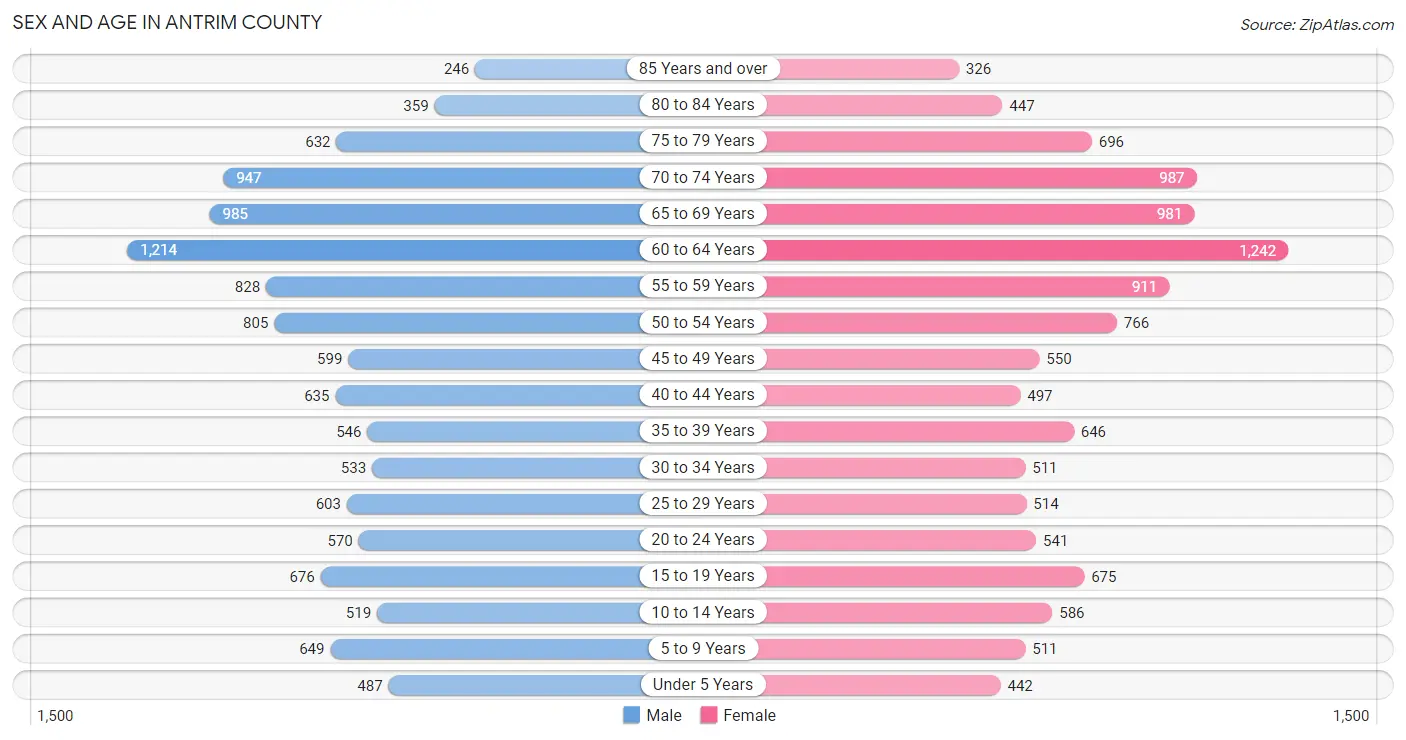
Sex and Age in Antrim County
Sex and Age in Antrim County
The most populous age groups in Antrim County are 60 to 64 Years (1,214 | 10.3%) for men and 60 to 64 Years (1,242 | 10.5%) for women.
| Age Bracket | Male | Female |
| Under 5 Years | 487 (4.1%) | 442 (3.7%) |
| 5 to 9 Years | 649 (5.5%) | 511 (4.3%) |
| 10 to 14 Years | 519 (4.4%) | 586 (5.0%) |
| 15 to 19 Years | 676 (5.7%) | 675 (5.7%) |
| 20 to 24 Years | 570 (4.8%) | 541 (4.6%) |
| 25 to 29 Years | 603 (5.1%) | 514 (4.3%) |
| 30 to 34 Years | 533 (4.5%) | 511 (4.3%) |
| 35 to 39 Years | 546 (4.6%) | 646 (5.5%) |
| 40 to 44 Years | 635 (5.4%) | 497 (4.2%) |
| 45 to 49 Years | 599 (5.1%) | 550 (4.6%) |
| 50 to 54 Years | 805 (6.8%) | 766 (6.5%) |
| 55 to 59 Years | 828 (7.0%) | 911 (7.7%) |
| 60 to 64 Years | 1,214 (10.3%) | 1,242 (10.5%) |
| 65 to 69 Years | 985 (8.3%) | 981 (8.3%) |
| 70 to 74 Years | 947 (8.0%) | 987 (8.3%) |
| 75 to 79 Years | 632 (5.3%) | 696 (5.9%) |
| 80 to 84 Years | 359 (3.0%) | 447 (3.8%) |
| 85 Years and over | 246 (2.1%) | 326 (2.8%) |
| Total | 11,833 (100.0%) | 11,829 (100.0%) |
Families and Households in Antrim County
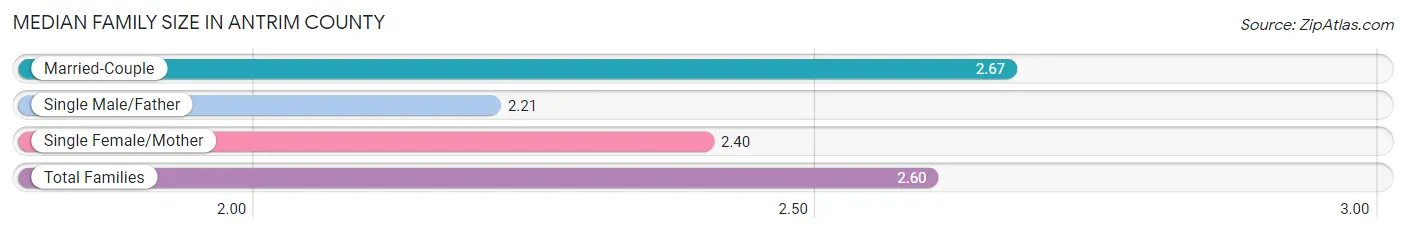
Median Family Size in Antrim County
The median family size in Antrim County is 2.60 persons per family, with married-couple families (5,926 | 81.3%) accounting for the largest median family size of 2.67 persons per family. On the other hand, single male/father families (589 | 8.1%) represent the smallest median family size with 2.21 persons per family.
| Family Type | # Families | Family Size |
| Married-Couple | 5,926 (81.3%) | 2.67 |
| Single Male/Father | 589 (8.1%) | 2.21 |
| Single Female/Mother | 772 (10.6%) | 2.40 |
| Total Families | 7,287 (100.0%) | 2.60 |
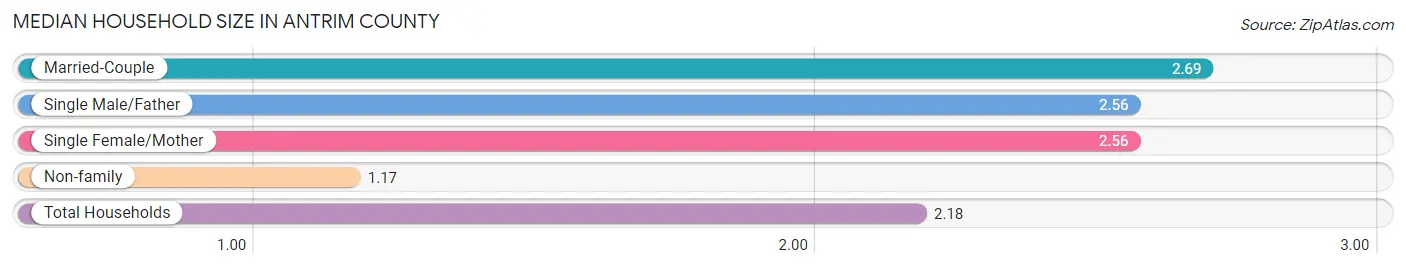
Median Household Size in Antrim County
The median household size in Antrim County is 2.18 persons per household, with married-couple households (5,926 | 55.2%) accounting for the largest median household size of 2.69 persons per household. non-family households (3,454 | 32.2%) represent the smallest median household size with 1.17 persons per household.
| Household Type | # Households | Household Size |
| Married-Couple | 5,926 (55.2%) | 2.69 |
| Single Male/Father | 589 (5.5%) | 2.56 |
| Single Female/Mother | 772 (7.2%) | 2.56 |
| Non-family | 3,454 (32.2%) | 1.17 |
| Total Households | 10,741 (100.0%) | 2.18 |
Household Size by Marriage Status in Antrim County
Out of a total of 10,741 households in Antrim County, 7,287 (67.8%) are family households, while 3,454 (32.2%) are nonfamily households. The most numerous type of family households are 2-person households, comprising 4,327, and the most common type of nonfamily households are 1-person households, comprising 2,854.
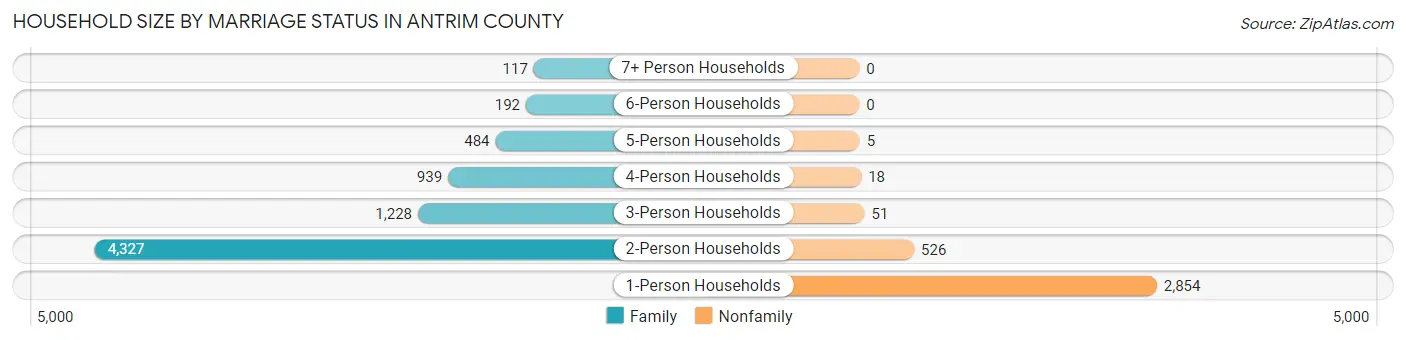
| Household Size | Family Households | Nonfamily Households |
| 1-Person Households | - | 2,854 (26.6%) |
| 2-Person Households | 4,327 (40.3%) | 526 (4.9%) |
| 3-Person Households | 1,228 (11.4%) | 51 (0.5%) |
| 4-Person Households | 939 (8.7%) | 18 (0.2%) |
| 5-Person Households | 484 (4.5%) | 5 (0.1%) |
| 6-Person Households | 192 (1.8%) | 0 (0.0%) |
| 7+ Person Households | 117 (1.1%) | 0 (0.0%) |
| Total | 7,287 (67.8%) | 3,454 (32.2%) |
Female Fertility in Antrim County
Fertility by Age in Antrim County
Average fertility rate in Antrim County is 58.0 births per 1,000 women. Women in the age bracket of 20 to 34 years have the highest fertility rate with 123.0 births per 1,000 women. Women in the age bracket of 20 to 34 years acount for 80.3% of all women with births.
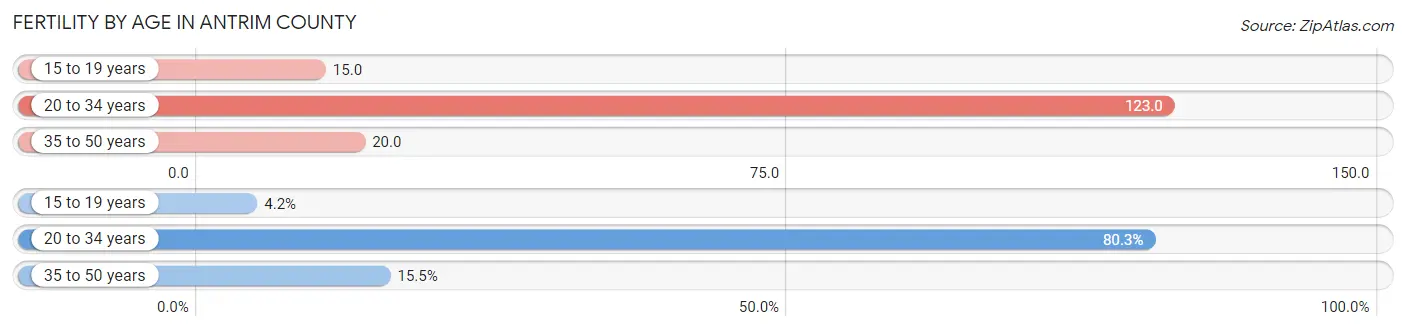
| Age Bracket | Women with Births | Births / 1,000 Women |
| 15 to 19 years | 10 (4.2%) | 15.0 |
| 20 to 34 years | 192 (80.3%) | 123.0 |
| 35 to 50 years | 37 (15.5%) | 20.0 |
| Total | 239 (100.0%) | 58.0 |
Fertility by Age by Marriage Status in Antrim County
69.9% of women with births (239) in Antrim County are married. The highest percentage of unmarried women with births falls into 15 to 19 years age bracket with 100.0% of them unmarried at the time of birth, while the lowest percentage of unmarried women with births belong to 20 to 34 years age bracket with 19.3% of them unmarried.
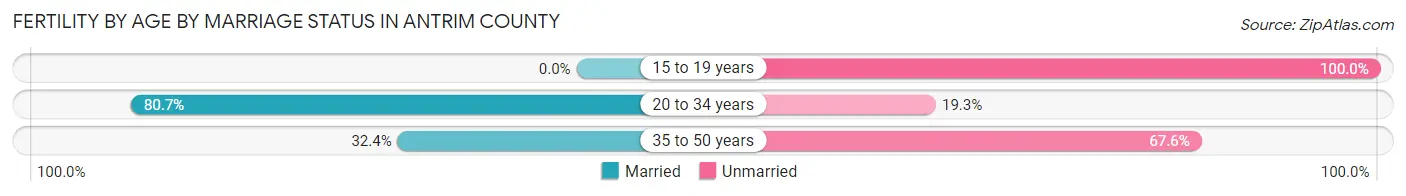
| Age Bracket | Married | Unmarried |
| 15 to 19 years | 0 (0.0%) | 10 (100.0%) |
| 20 to 34 years | 155 (80.7%) | 37 (19.3%) |
| 35 to 50 years | 12 (32.4%) | 25 (67.6%) |
| Total | 167 (69.9%) | 72 (30.1%) |
Fertility by Education in Antrim County
Average fertility rate in Antrim County is 58.0 births per 1,000 women. Women with the education attainment of bachelor's degree have the highest fertility rate of 93.0 births per 1,000 women, while women with the education attainment of less than high school have the lowest fertility at 22.0 births per 1,000 women. Women with the education attainment of college or associate's degree represent 36.8% of all women with births.
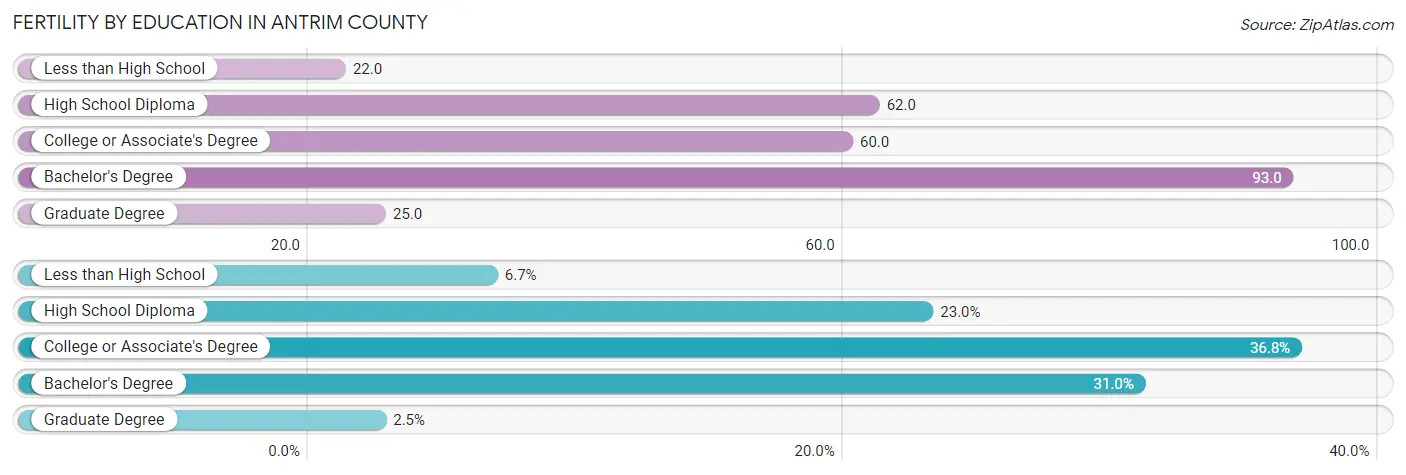
| Educational Attainment | Women with Births | Births / 1,000 Women |
| Less than High School | 16 (6.7%) | 22.0 |
| High School Diploma | 55 (23.0%) | 62.0 |
| College or Associate's Degree | 88 (36.8%) | 60.0 |
| Bachelor's Degree | 74 (31.0%) | 93.0 |
| Graduate Degree | 6 (2.5%) | 25.0 |
| Total | 239 (100.0%) | 58.0 |
Fertility by Education by Marriage Status in Antrim County
30.1% of women with births in Antrim County are unmarried. Women with the educational attainment of graduate degree are most likely to be married with 100.0% of them married at childbirth, while women with the educational attainment of high school diploma are least likely to be married with 49.1% of them unmarried at childbirth.
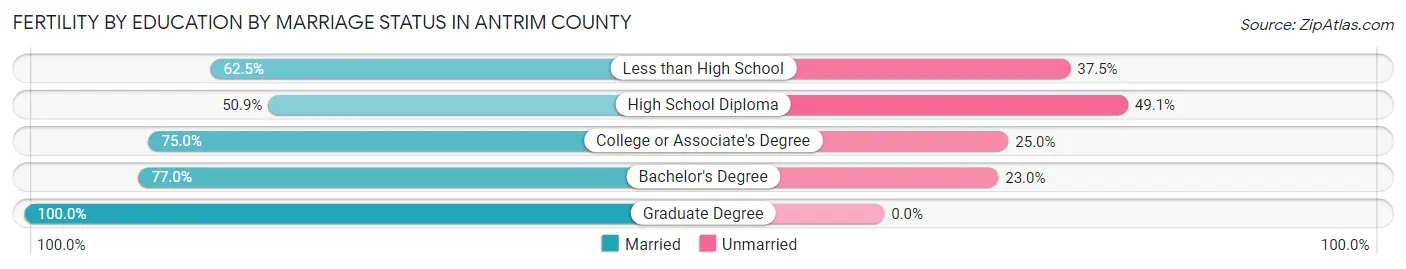
| Educational Attainment | Married | Unmarried |
| Less than High School | 10 (62.5%) | 6 (37.5%) |
| High School Diploma | 28 (50.9%) | 27 (49.1%) |
| College or Associate's Degree | 66 (75.0%) | 22 (25.0%) |
| Bachelor's Degree | 57 (77.0%) | 17 (23.0%) |
| Graduate Degree | 6 (100.0%) | 0 (0.0%) |
| Total | 167 (69.9%) | 72 (30.1%) |
Employment Characteristics in Antrim County
Employment by Class of Employer in Antrim County
Among the 10,480 employed individuals in Antrim County, private company employees (7,057 | 67.3%), local government employees (829 | 7.9%), and self-employed (not incorporated) (787 | 7.5%) make up the most common classes of employment.
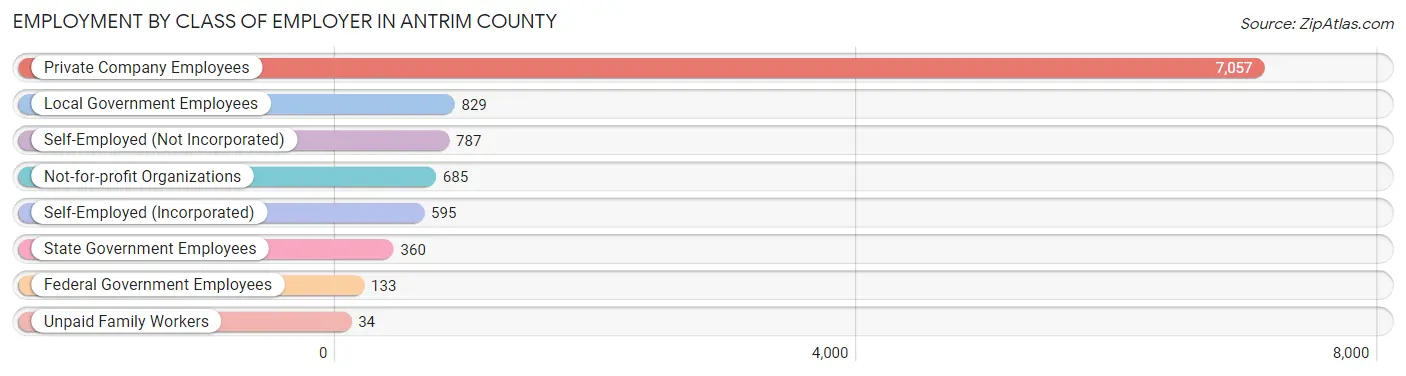
| Employer Class | # Employees | % Employees |
| Private Company Employees | 7,057 | 67.3% |
| Self-Employed (Incorporated) | 595 | 5.7% |
| Self-Employed (Not Incorporated) | 787 | 7.5% |
| Not-for-profit Organizations | 685 | 6.5% |
| Local Government Employees | 829 | 7.9% |
| State Government Employees | 360 | 3.4% |
| Federal Government Employees | 133 | 1.3% |
| Unpaid Family Workers | 34 | 0.3% |
| Total | 10,480 | 100.0% |
Employment Status by Age in Antrim County
According to the labor force statistics for Antrim County, out of the total population over 16 years of age (20,122), 55.8% or 11,228 individuals are in the labor force, with 4.6% or 516 of them unemployed. The age group with the highest labor force participation rate is 20 to 24 years, with 90.2% or 1,002 individuals in the labor force. Within the labor force, the 16 to 19 years age range has the highest percentage of unemployed individuals, with 13.7% or 72 of them being unemployed.
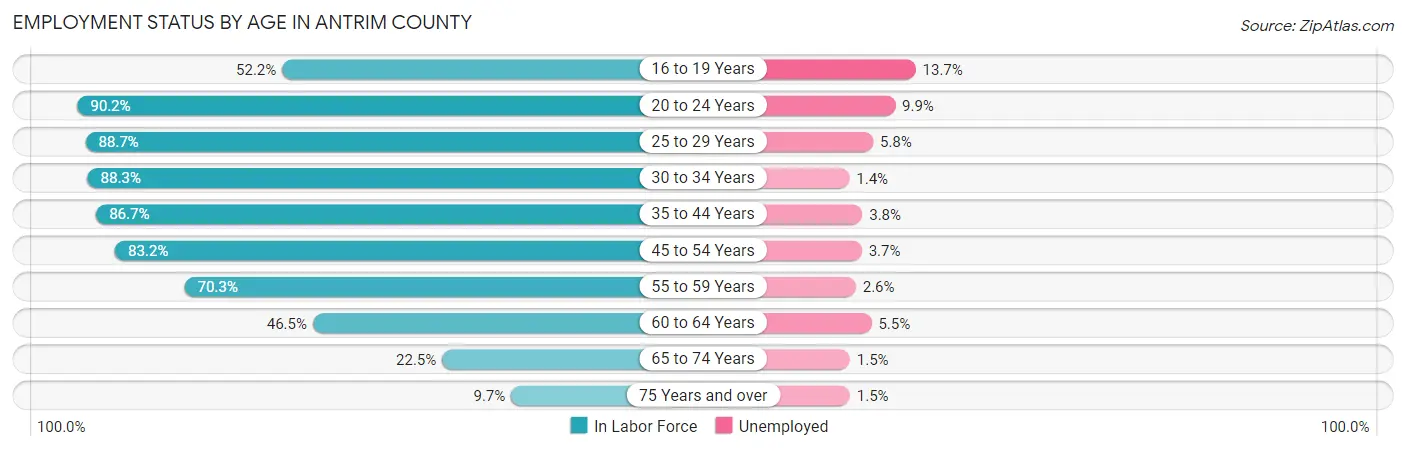
| Age Bracket | In Labor Force | Unemployed |
| 16 to 19 Years | 525 (52.2%) | 72 (13.7%) |
| 20 to 24 Years | 1,002 (90.2%) | 99 (9.9%) |
| 25 to 29 Years | 991 (88.7%) | 57 (5.8%) |
| 30 to 34 Years | 922 (88.3%) | 13 (1.4%) |
| 35 to 44 Years | 2,015 (86.7%) | 77 (3.8%) |
| 45 to 54 Years | 2,263 (83.2%) | 84 (3.7%) |
| 55 to 59 Years | 1,223 (70.3%) | 32 (2.6%) |
| 60 to 64 Years | 1,142 (46.5%) | 63 (5.5%) |
| 65 to 74 Years | 878 (22.5%) | 13 (1.5%) |
| 75 Years and over | 262 (9.7%) | 4 (1.5%) |
| Total | 11,228 (55.8%) | 516 (4.6%) |
Employment Status by Educational Attainment in Antrim County
According to labor force statistics for Antrim County, 75.0% of individuals (8,550) out of the total population between 25 and 64 years of age (11,400) are in the labor force, with 3.8% or 325 of them being unemployed. The group with the highest labor force participation rate are those with the educational attainment of college / associate degree, with 79.7% or 3,172 individuals in the labor force. Within the labor force, individuals with less than high school education have the highest percentage of unemployment, with 11.3% or 50 of them being unemployed.
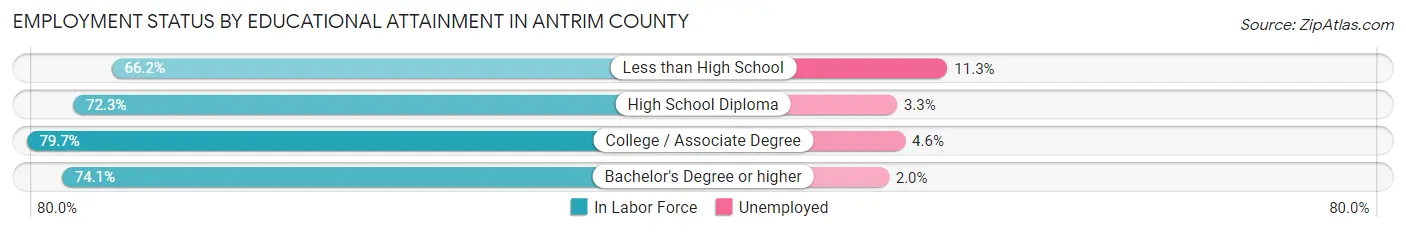
| Educational Attainment | In Labor Force | Unemployed |
| Less than High School | 444 (66.2%) | 76 (11.3%) |
| High School Diploma | 2,433 (72.3%) | 111 (3.3%) |
| College / Associate Degree | 3,172 (79.7%) | 183 (4.6%) |
| Bachelor's Degree or higher | 2,508 (74.1%) | 68 (2.0%) |
| Total | 8,550 (75.0%) | 433 (3.8%) |
Employment Occupations by Sex in Antrim County
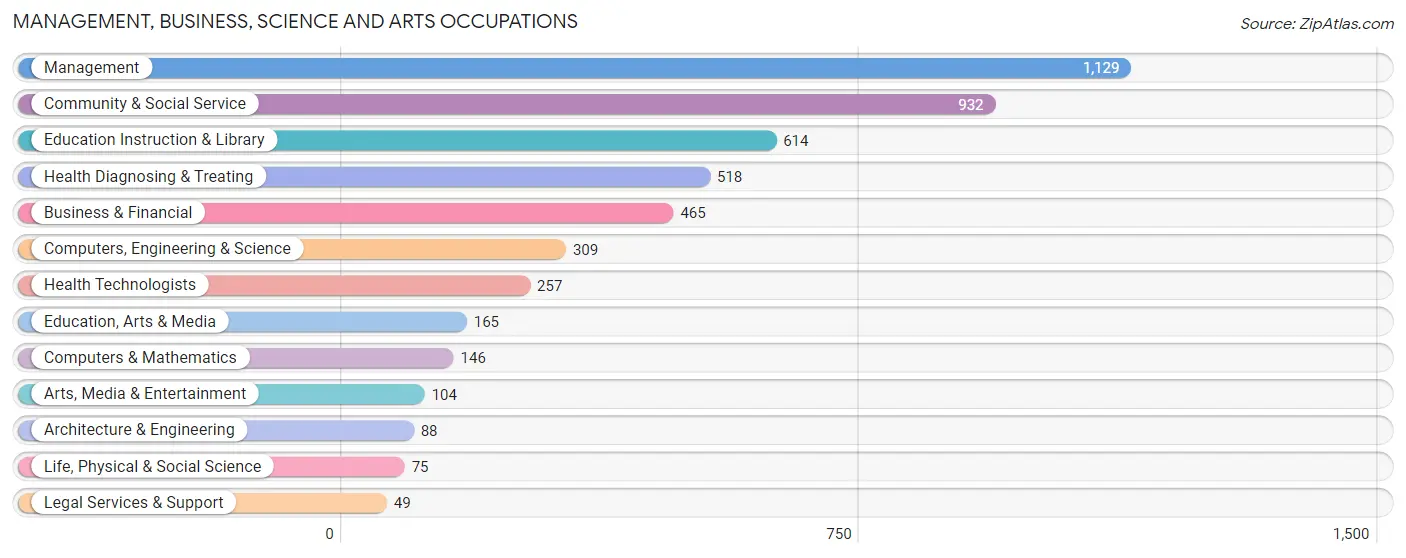
Management, Business, Science and Arts Occupations
The most common Management, Business, Science and Arts occupations in Antrim County are Management (1,129 | 10.5%), Community & Social Service (932 | 8.7%), Education Instruction & Library (614 | 5.7%), Health Diagnosing & Treating (518 | 4.8%), and Business & Financial (465 | 4.3%).
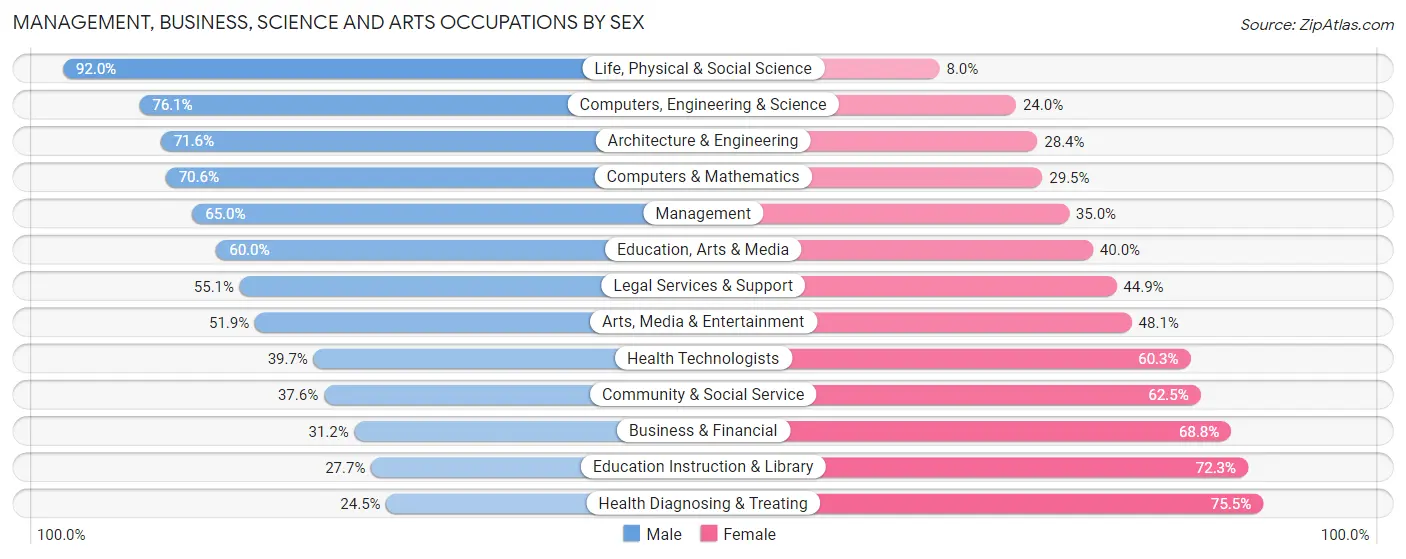
Management, Business, Science and Arts Occupations by Sex
Within the Management, Business, Science and Arts occupations in Antrim County, the most male-oriented occupations are Life, Physical & Social Science (92.0%), Computers, Engineering & Science (76.0%), and Architecture & Engineering (71.6%), while the most female-oriented occupations are Health Diagnosing & Treating (75.5%), Education Instruction & Library (72.3%), and Business & Financial (68.8%).
| Occupation | Male | Female |
| Management | 734 (65.0%) | 395 (35.0%) |
| Business & Financial | 145 (31.2%) | 320 (68.8%) |
| Computers, Engineering & Science | 235 (76.0%) | 74 (23.9%) |
| Computers & Mathematics | 103 (70.6%) | 43 (29.4%) |
| Architecture & Engineering | 63 (71.6%) | 25 (28.4%) |
| Life, Physical & Social Science | 69 (92.0%) | 6 (8.0%) |
| Community & Social Service | 350 (37.6%) | 582 (62.5%) |
| Education, Arts & Media | 99 (60.0%) | 66 (40.0%) |
| Legal Services & Support | 27 (55.1%) | 22 (44.9%) |
| Education Instruction & Library | 170 (27.7%) | 444 (72.3%) |
| Arts, Media & Entertainment | 54 (51.9%) | 50 (48.1%) |
| Health Diagnosing & Treating | 127 (24.5%) | 391 (75.5%) |
| Health Technologists | 102 (39.7%) | 155 (60.3%) |
| Total (Category) | 1,591 (47.4%) | 1,762 (52.5%) |
| Total (Overall) | 5,707 (53.3%) | 5,002 (46.7%) |
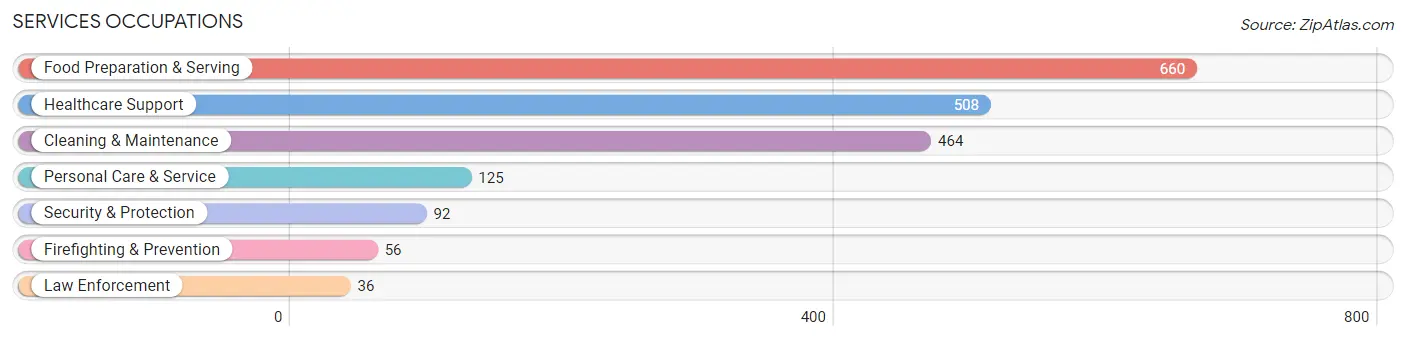
Services Occupations
The most common Services occupations in Antrim County are Food Preparation & Serving (660 | 6.2%), Healthcare Support (508 | 4.7%), Cleaning & Maintenance (464 | 4.3%), Personal Care & Service (125 | 1.2%), and Security & Protection (92 | 0.9%).
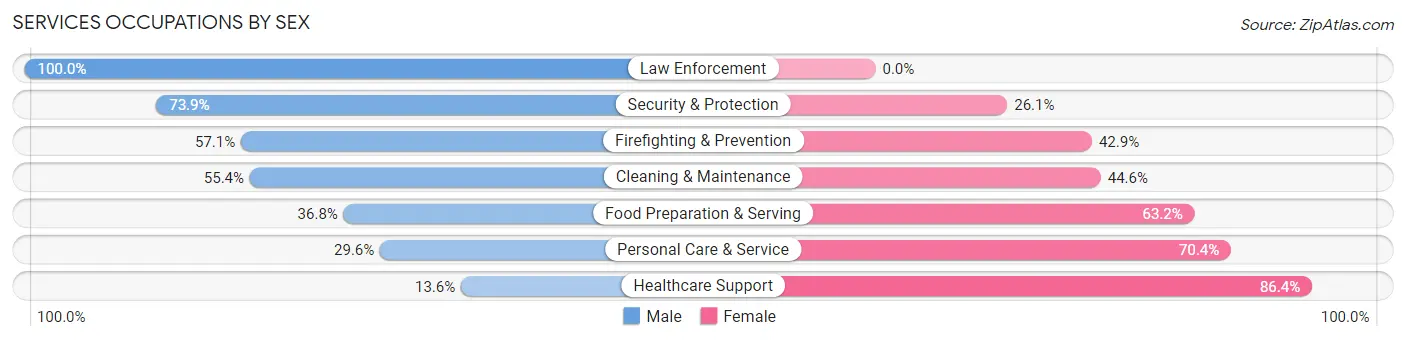
Services Occupations by Sex
Within the Services occupations in Antrim County, the most male-oriented occupations are Law Enforcement (100.0%), Security & Protection (73.9%), and Firefighting & Prevention (57.1%), while the most female-oriented occupations are Healthcare Support (86.4%), Personal Care & Service (70.4%), and Food Preparation & Serving (63.2%).
| Occupation | Male | Female |
| Healthcare Support | 69 (13.6%) | 439 (86.4%) |
| Security & Protection | 68 (73.9%) | 24 (26.1%) |
| Firefighting & Prevention | 32 (57.1%) | 24 (42.9%) |
| Law Enforcement | 36 (100.0%) | 0 (0.0%) |
| Food Preparation & Serving | 243 (36.8%) | 417 (63.2%) |
| Cleaning & Maintenance | 257 (55.4%) | 207 (44.6%) |
| Personal Care & Service | 37 (29.6%) | 88 (70.4%) |
| Total (Category) | 674 (36.4%) | 1,175 (63.5%) |
| Total (Overall) | 5,707 (53.3%) | 5,002 (46.7%) |
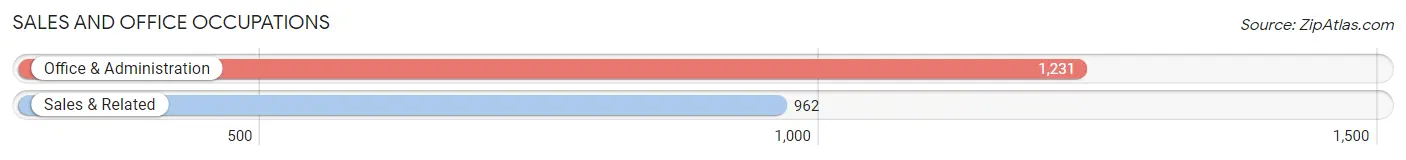
Sales and Office Occupations
The most common Sales and Office occupations in Antrim County are Office & Administration (1,231 | 11.5%), and Sales & Related (962 | 9.0%).
Sales and Office Occupations by Sex
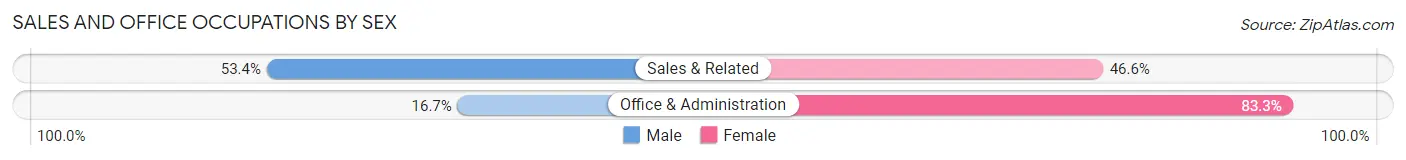
| Occupation | Male | Female |
| Sales & Related | 514 (53.4%) | 448 (46.6%) |
| Office & Administration | 206 (16.7%) | 1,025 (83.3%) |
| Total (Category) | 720 (32.8%) | 1,473 (67.2%) |
| Total (Overall) | 5,707 (53.3%) | 5,002 (46.7%) |
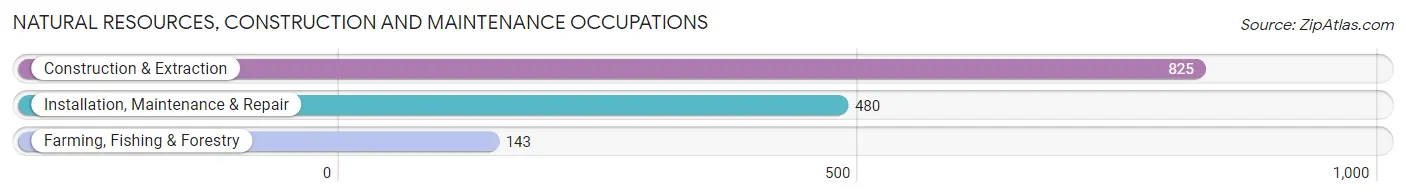
Natural Resources, Construction and Maintenance Occupations
The most common Natural Resources, Construction and Maintenance occupations in Antrim County are Construction & Extraction (825 | 7.7%), Installation, Maintenance & Repair (480 | 4.5%), and Farming, Fishing & Forestry (143 | 1.3%).
Natural Resources, Construction and Maintenance Occupations by Sex
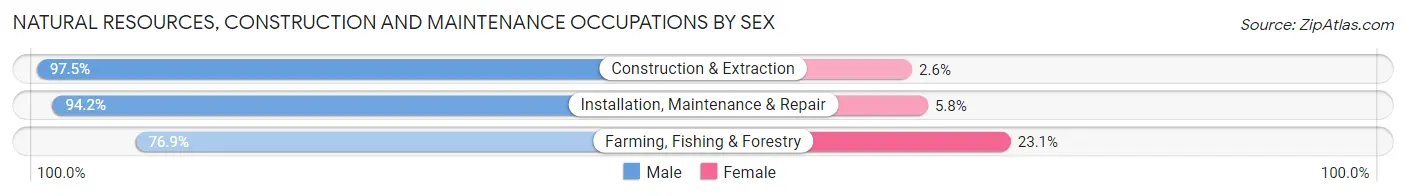
| Occupation | Male | Female |
| Farming, Fishing & Forestry | 110 (76.9%) | 33 (23.1%) |
| Construction & Extraction | 804 (97.5%) | 21 (2.5%) |
| Installation, Maintenance & Repair | 452 (94.2%) | 28 (5.8%) |
| Total (Category) | 1,366 (94.3%) | 82 (5.7%) |
| Total (Overall) | 5,707 (53.3%) | 5,002 (46.7%) |
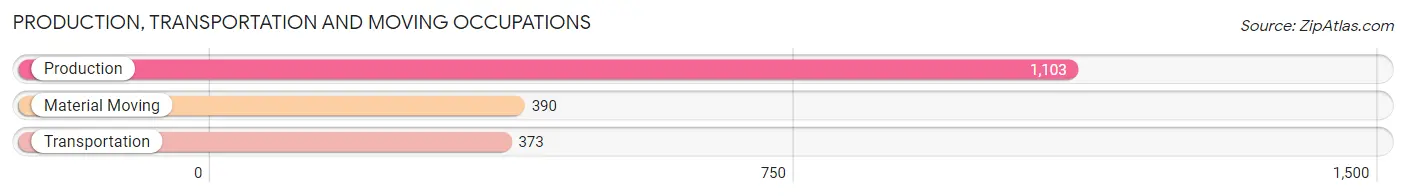
Production, Transportation and Moving Occupations
The most common Production, Transportation and Moving occupations in Antrim County are Production (1,103 | 10.3%), Material Moving (390 | 3.6%), and Transportation (373 | 3.5%).
Production, Transportation and Moving Occupations by Sex
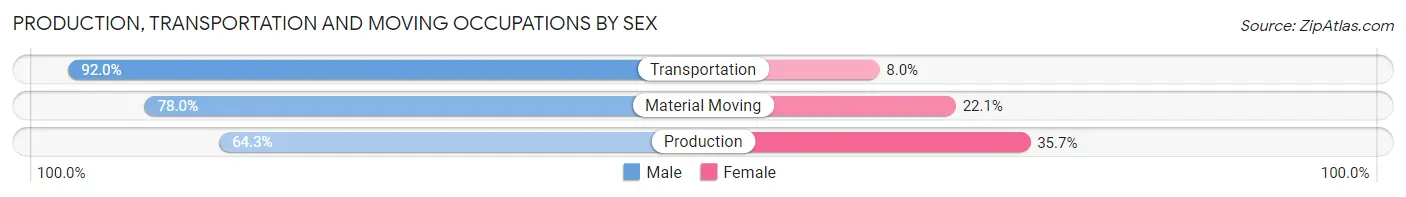
| Occupation | Male | Female |
| Production | 709 (64.3%) | 394 (35.7%) |
| Transportation | 343 (92.0%) | 30 (8.0%) |
| Material Moving | 304 (77.9%) | 86 (22.1%) |
| Total (Category) | 1,356 (72.7%) | 510 (27.3%) |
| Total (Overall) | 5,707 (53.3%) | 5,002 (46.7%) |
Employment Industries by Sex in Antrim County
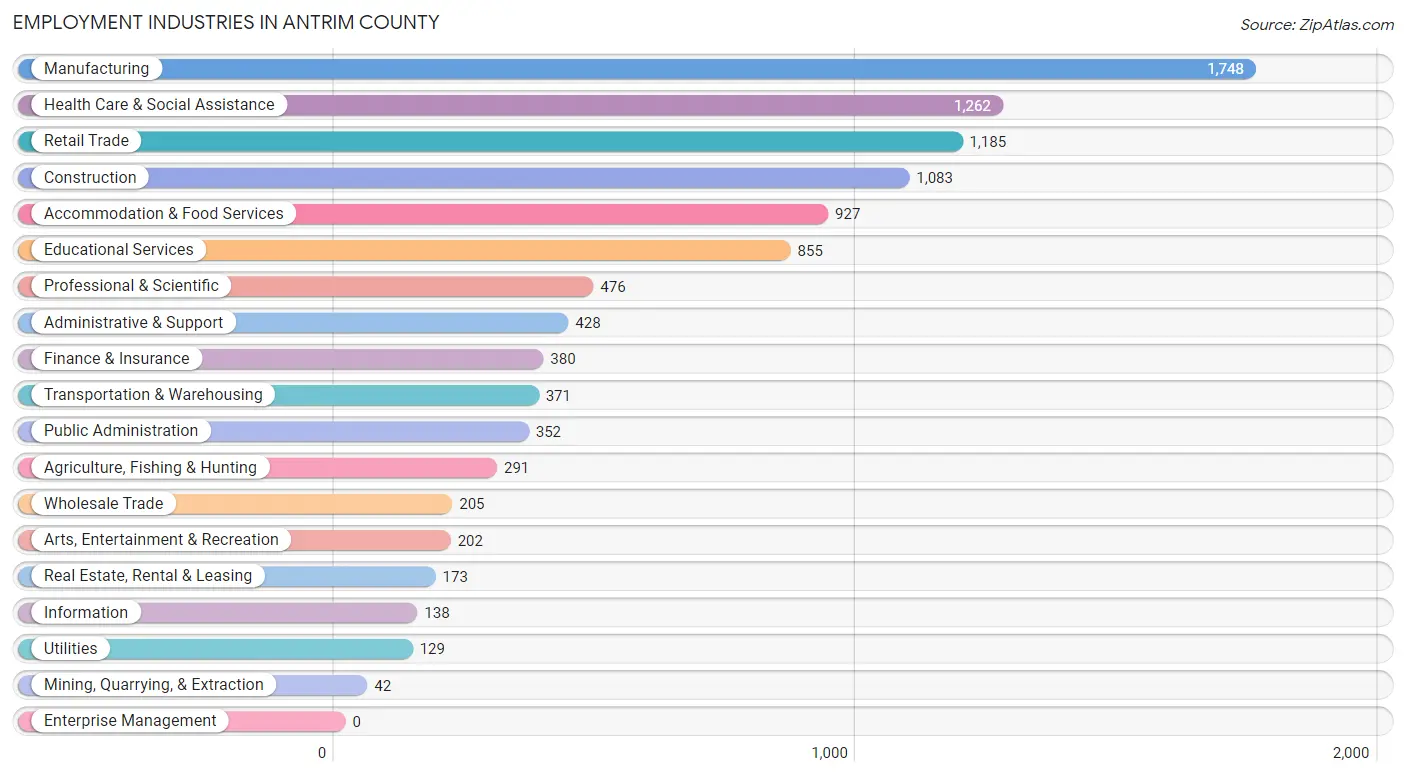
Employment Industries in Antrim County
The major employment industries in Antrim County include Manufacturing (1,748 | 16.3%), Health Care & Social Assistance (1,262 | 11.8%), Retail Trade (1,185 | 11.1%), Construction (1,083 | 10.1%), and Accommodation & Food Services (927 | 8.7%).
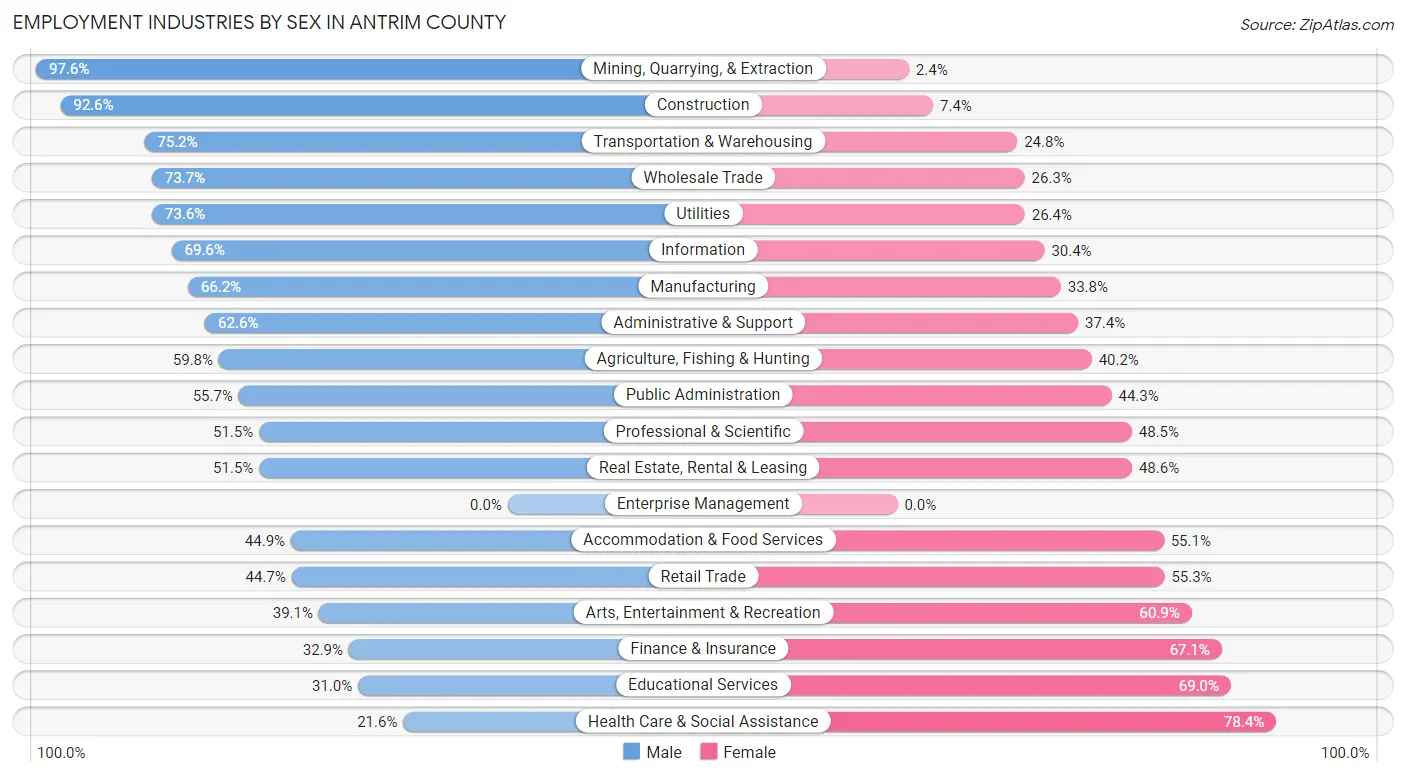
Employment Industries by Sex in Antrim County
The Antrim County industries that see more men than women are Mining, Quarrying, & Extraction (97.6%), Construction (92.6%), and Transportation & Warehousing (75.2%), whereas the industries that tend to have a higher number of women are Health Care & Social Assistance (78.4%), Educational Services (69.0%), and Finance & Insurance (67.1%).
| Industry | Male | Female |
| Agriculture, Fishing & Hunting | 174 (59.8%) | 117 (40.2%) |
| Mining, Quarrying, & Extraction | 41 (97.6%) | 1 (2.4%) |
| Construction | 1,003 (92.6%) | 80 (7.4%) |
| Manufacturing | 1,157 (66.2%) | 591 (33.8%) |
| Wholesale Trade | 151 (73.7%) | 54 (26.3%) |
| Retail Trade | 530 (44.7%) | 655 (55.3%) |
| Transportation & Warehousing | 279 (75.2%) | 92 (24.8%) |
| Utilities | 95 (73.6%) | 34 (26.4%) |
| Information | 96 (69.6%) | 42 (30.4%) |
| Finance & Insurance | 125 (32.9%) | 255 (67.1%) |
| Real Estate, Rental & Leasing | 89 (51.4%) | 84 (48.5%) |
| Professional & Scientific | 245 (51.5%) | 231 (48.5%) |
| Enterprise Management | 0 (0.0%) | 0 (0.0%) |
| Administrative & Support | 268 (62.6%) | 160 (37.4%) |
| Educational Services | 265 (31.0%) | 590 (69.0%) |
| Health Care & Social Assistance | 273 (21.6%) | 989 (78.4%) |
| Arts, Entertainment & Recreation | 79 (39.1%) | 123 (60.9%) |
| Accommodation & Food Services | 416 (44.9%) | 511 (55.1%) |
| Public Administration | 196 (55.7%) | 156 (44.3%) |
| Total | 5,707 (53.3%) | 5,002 (46.7%) |
Education in Antrim County
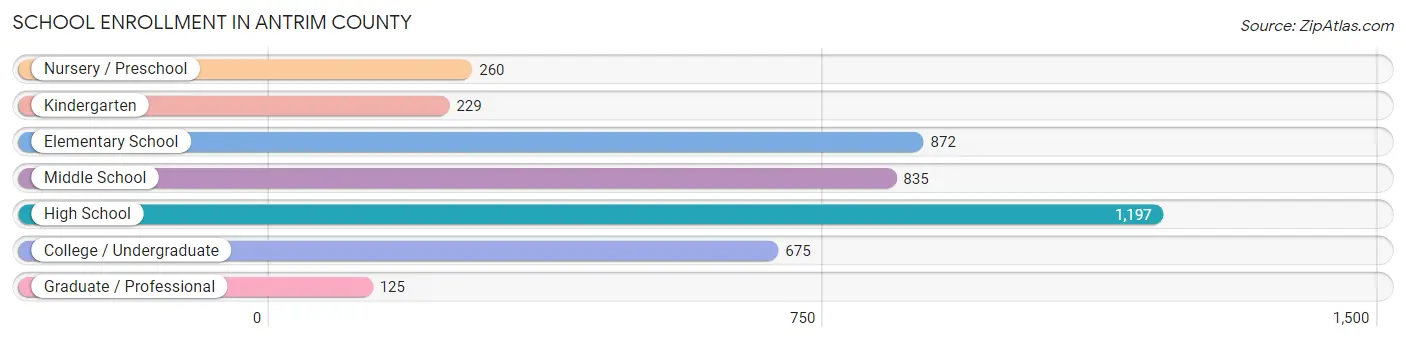
School Enrollment in Antrim County
The most common levels of schooling among the 4,193 students in Antrim County are high school (1,197 | 28.5%), elementary school (872 | 20.8%), and middle school (835 | 19.9%).
| School Level | # Students | % Students |
| Nursery / Preschool | 260 | 6.2% |
| Kindergarten | 229 | 5.5% |
| Elementary School | 872 | 20.8% |
| Middle School | 835 | 19.9% |
| High School | 1,197 | 28.5% |
| College / Undergraduate | 675 | 16.1% |
| Graduate / Professional | 125 | 3.0% |
| Total | 4,193 | 100.0% |
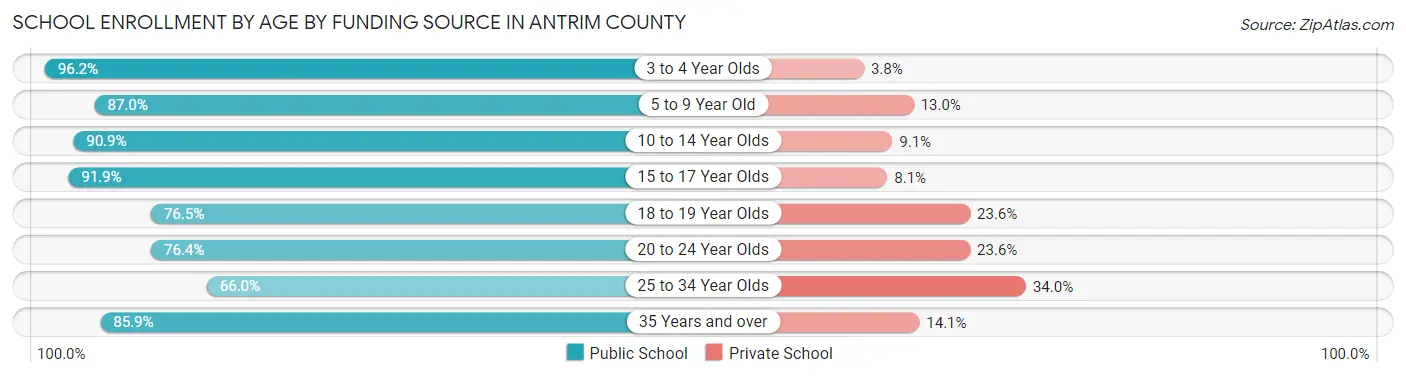
School Enrollment by Age by Funding Source in Antrim County
Out of a total of 4,193 students who are enrolled in schools in Antrim County, 549 (13.1%) attend a private institution, while the remaining 3,644 (86.9%) are enrolled in public schools. The age group of 25 to 34 year olds has the highest likelihood of being enrolled in private schools, with 54 (34.0% in the age bracket) enrolled. Conversely, the age group of 3 to 4 year olds has the lowest likelihood of being enrolled in a private school, with 178 (96.2% in the age bracket) attending a public institution.
| Age Bracket | Public School | Private School |
| 3 to 4 Year Olds | 178 (96.2%) | 7 (3.8%) |
| 5 to 9 Year Old | 954 (87.0%) | 143 (13.0%) |
| 10 to 14 Year Olds | 942 (90.9%) | 94 (9.1%) |
| 15 to 17 Year Olds | 779 (91.9%) | 69 (8.1%) |
| 18 to 19 Year Olds | 237 (76.4%) | 73 (23.5%) |
| 20 to 24 Year Olds | 253 (76.4%) | 78 (23.6%) |
| 25 to 34 Year Olds | 105 (66.0%) | 54 (34.0%) |
| 35 Years and over | 195 (85.9%) | 32 (14.1%) |
| Total | 3,644 (86.9%) | 549 (13.1%) |
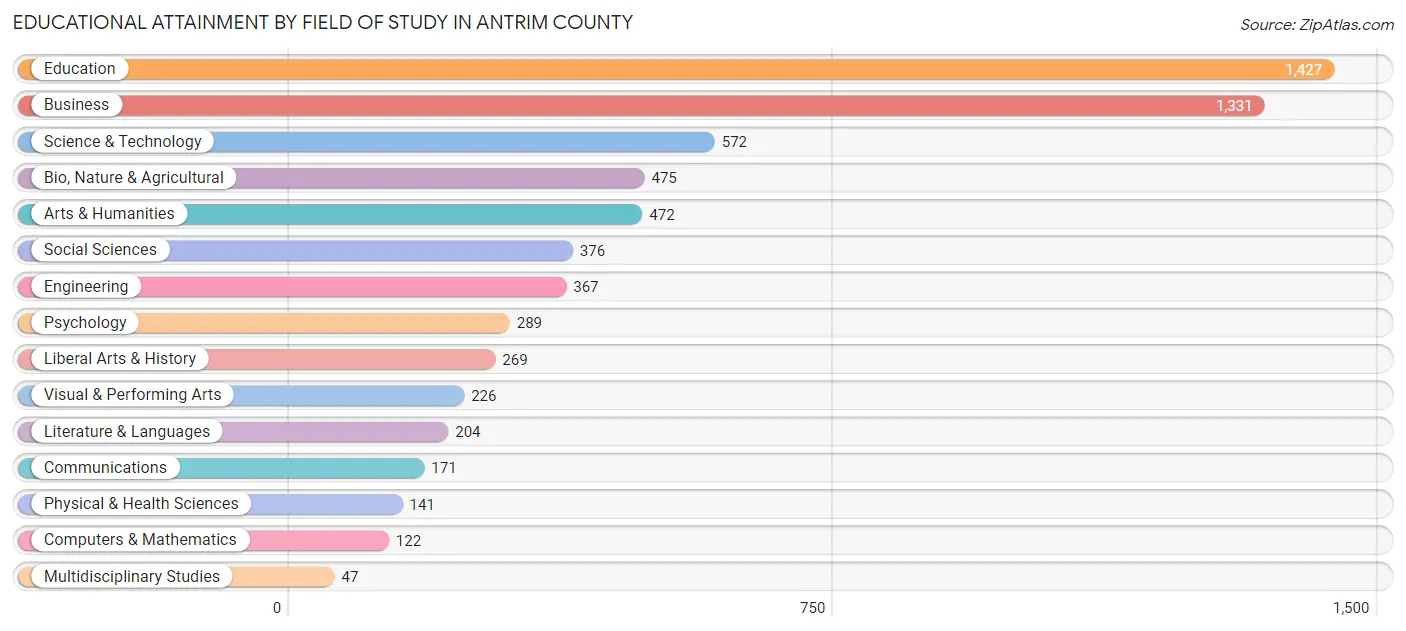
Educational Attainment by Field of Study in Antrim County
Education (1,427 | 22.0%), business (1,331 | 20.5%), science & technology (572 | 8.8%), bio, nature & agricultural (475 | 7.3%), and arts & humanities (472 | 7.3%) are the most common fields of study among 6,489 individuals in Antrim County who have obtained a bachelor's degree or higher.
| Field of Study | # Graduates | % Graduates |
| Computers & Mathematics | 122 | 1.9% |
| Bio, Nature & Agricultural | 475 | 7.3% |
| Physical & Health Sciences | 141 | 2.2% |
| Psychology | 289 | 4.4% |
| Social Sciences | 376 | 5.8% |
| Engineering | 367 | 5.7% |
| Multidisciplinary Studies | 47 | 0.7% |
| Science & Technology | 572 | 8.8% |
| Business | 1,331 | 20.5% |
| Education | 1,427 | 22.0% |
| Literature & Languages | 204 | 3.1% |
| Liberal Arts & History | 269 | 4.2% |
| Visual & Performing Arts | 226 | 3.5% |
| Communications | 171 | 2.6% |
| Arts & Humanities | 472 | 7.3% |
| Total | 6,489 | 100.0% |
Transportation & Commute in Antrim County
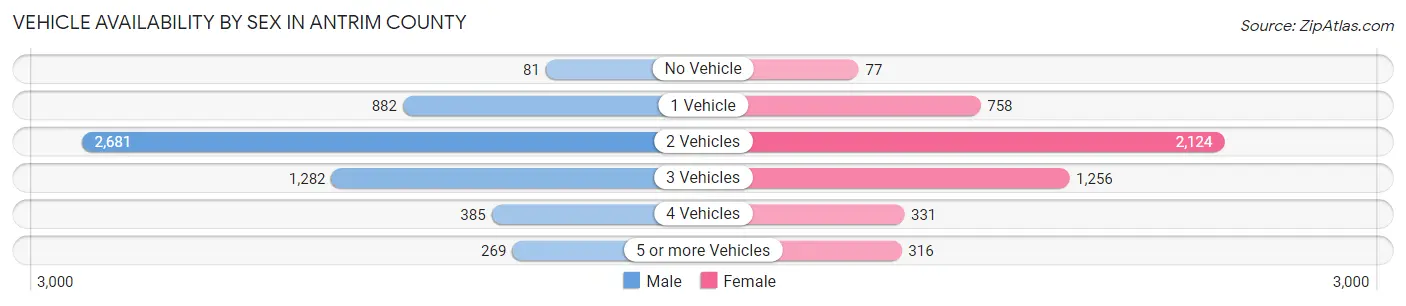
Vehicle Availability by Sex in Antrim County
The most prevalent vehicle ownership categories in Antrim County are males with 2 vehicles (2,681, accounting for 48.0%) and females with 2 vehicles (2,124, making up 55.1%).
| Vehicles Available | Male | Female |
| No Vehicle | 81 (1.5%) | 77 (1.6%) |
| 1 Vehicle | 882 (15.8%) | 758 (15.6%) |
| 2 Vehicles | 2,681 (48.0%) | 2,124 (43.7%) |
| 3 Vehicles | 1,282 (23.0%) | 1,256 (25.8%) |
| 4 Vehicles | 385 (6.9%) | 331 (6.8%) |
| 5 or more Vehicles | 269 (4.8%) | 316 (6.5%) |
| Total | 5,580 (100.0%) | 4,862 (100.0%) |
Commute Time in Antrim County
The most frequently occuring commute durations in Antrim County are 30 to 34 minutes (1,379 commuters, 14.6%), 20 to 24 minutes (1,262 commuters, 13.4%), and 10 to 14 minutes (1,220 commuters, 12.9%).
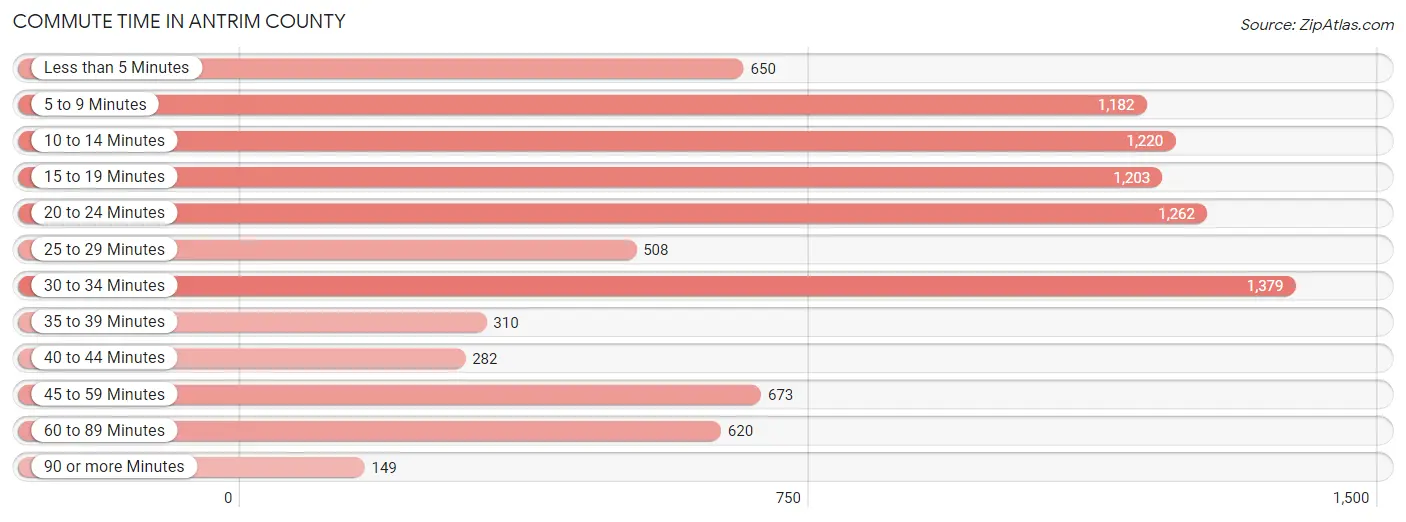
| Commute Time | # Commuters | % Commuters |
| Less than 5 Minutes | 650 | 6.9% |
| 5 to 9 Minutes | 1,182 | 12.5% |
| 10 to 14 Minutes | 1,220 | 12.9% |
| 15 to 19 Minutes | 1,203 | 12.8% |
| 20 to 24 Minutes | 1,262 | 13.4% |
| 25 to 29 Minutes | 508 | 5.4% |
| 30 to 34 Minutes | 1,379 | 14.6% |
| 35 to 39 Minutes | 310 | 3.3% |
| 40 to 44 Minutes | 282 | 3.0% |
| 45 to 59 Minutes | 673 | 7.1% |
| 60 to 89 Minutes | 620 | 6.6% |
| 90 or more Minutes | 149 | 1.6% |
Commute Time by Sex in Antrim County
The most common commute times in Antrim County are 30 to 34 minutes (714 commuters, 14.0%) for males and 30 to 34 minutes (665 commuters, 15.4%) for females.
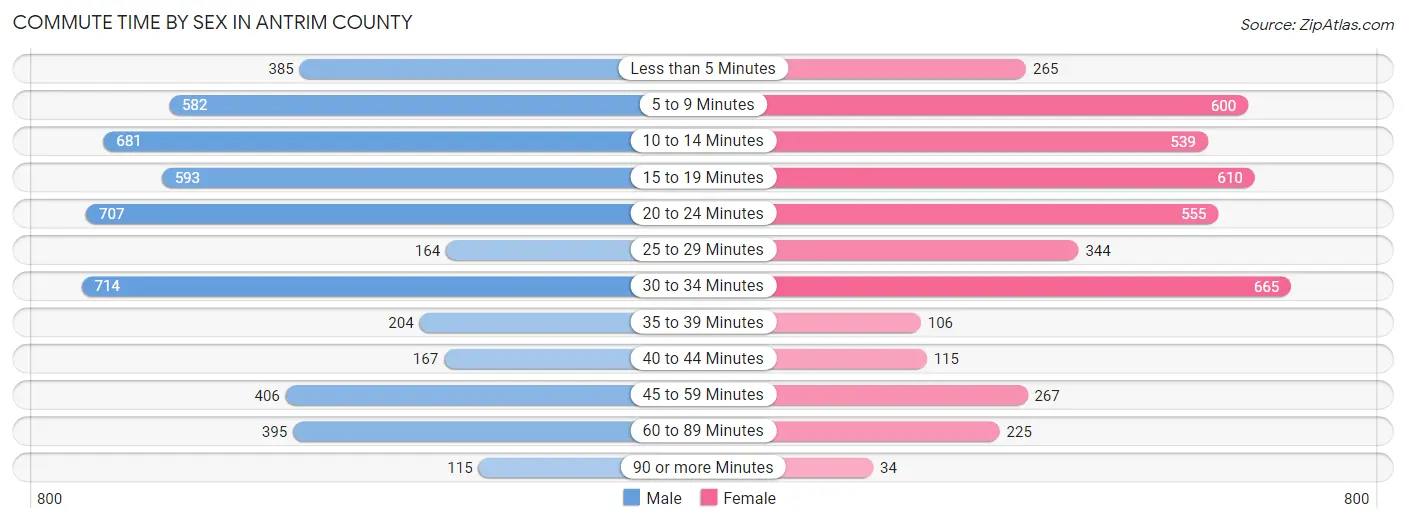
| Commute Time | Male | Female |
| Less than 5 Minutes | 385 (7.5%) | 265 (6.1%) |
| 5 to 9 Minutes | 582 (11.4%) | 600 (13.9%) |
| 10 to 14 Minutes | 681 (13.3%) | 539 (12.5%) |
| 15 to 19 Minutes | 593 (11.6%) | 610 (14.1%) |
| 20 to 24 Minutes | 707 (13.8%) | 555 (12.8%) |
| 25 to 29 Minutes | 164 (3.2%) | 344 (8.0%) |
| 30 to 34 Minutes | 714 (14.0%) | 665 (15.4%) |
| 35 to 39 Minutes | 204 (4.0%) | 106 (2.5%) |
| 40 to 44 Minutes | 167 (3.3%) | 115 (2.7%) |
| 45 to 59 Minutes | 406 (7.9%) | 267 (6.2%) |
| 60 to 89 Minutes | 395 (7.7%) | 225 (5.2%) |
| 90 or more Minutes | 115 (2.2%) | 34 (0.8%) |
Time of Departure to Work by Sex in Antrim County
The most frequent times of departure to work in Antrim County are 6:30 AM to 6:59 AM (737, 14.4%) for males and 7:00 AM to 7:29 AM (650, 15.0%) for females.
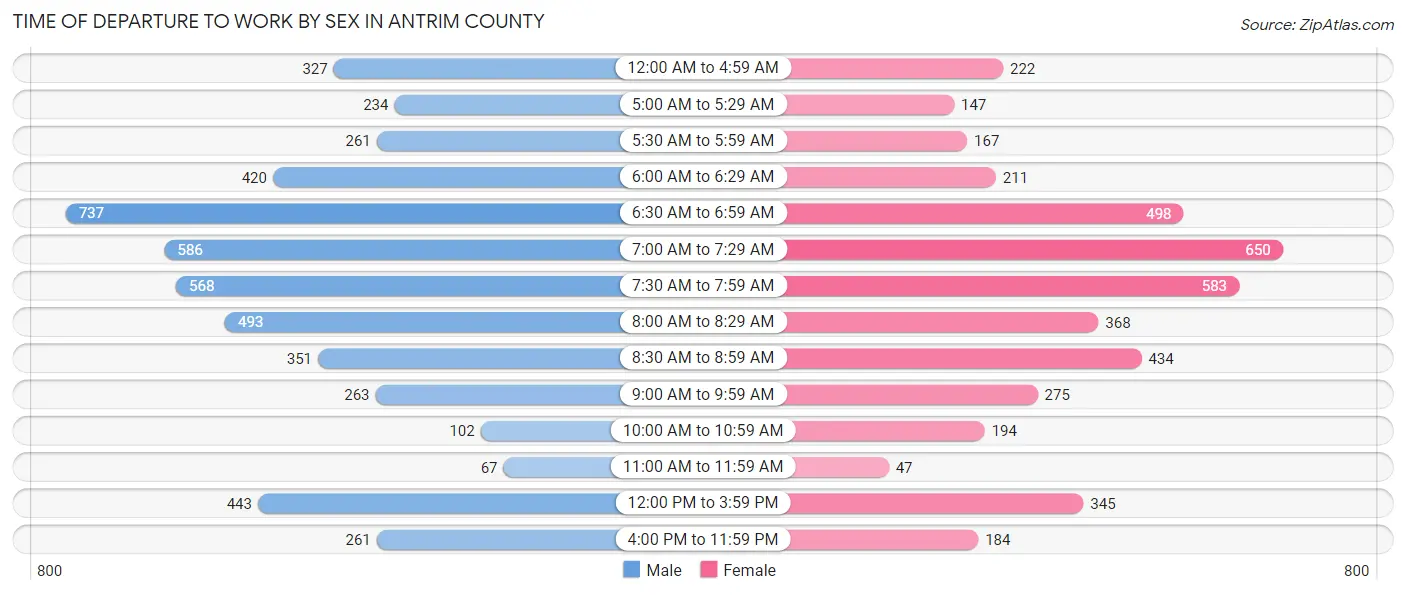
| Time of Departure | Male | Female |
| 12:00 AM to 4:59 AM | 327 (6.4%) | 222 (5.1%) |
| 5:00 AM to 5:29 AM | 234 (4.6%) | 147 (3.4%) |
| 5:30 AM to 5:59 AM | 261 (5.1%) | 167 (3.9%) |
| 6:00 AM to 6:29 AM | 420 (8.2%) | 211 (4.9%) |
| 6:30 AM to 6:59 AM | 737 (14.4%) | 498 (11.5%) |
| 7:00 AM to 7:29 AM | 586 (11.5%) | 650 (15.0%) |
| 7:30 AM to 7:59 AM | 568 (11.1%) | 583 (13.5%) |
| 8:00 AM to 8:29 AM | 493 (9.6%) | 368 (8.5%) |
| 8:30 AM to 8:59 AM | 351 (6.9%) | 434 (10.0%) |
| 9:00 AM to 9:59 AM | 263 (5.1%) | 275 (6.4%) |
| 10:00 AM to 10:59 AM | 102 (2.0%) | 194 (4.5%) |
| 11:00 AM to 11:59 AM | 67 (1.3%) | 47 (1.1%) |
| 12:00 PM to 3:59 PM | 443 (8.7%) | 345 (8.0%) |
| 4:00 PM to 11:59 PM | 261 (5.1%) | 184 (4.3%) |
| Total | 5,113 (100.0%) | 4,325 (100.0%) |
Housing Occupancy in Antrim County
Occupancy by Ownership in Antrim County
Of the total 10,741 dwellings in Antrim County, owner-occupied units account for 9,348 (87.0%), while renter-occupied units make up 1,393 (13.0%).
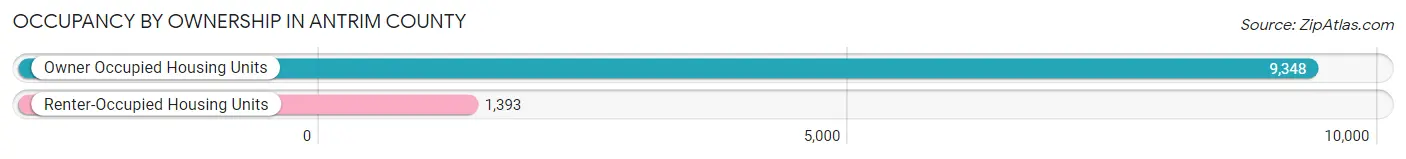
| Occupancy | # Housing Units | % Housing Units |
| Owner Occupied Housing Units | 9,348 | 87.0% |
| Renter-Occupied Housing Units | 1,393 | 13.0% |
| Total Occupied Housing Units | 10,741 | 100.0% |
Occupancy by Household Size in Antrim County
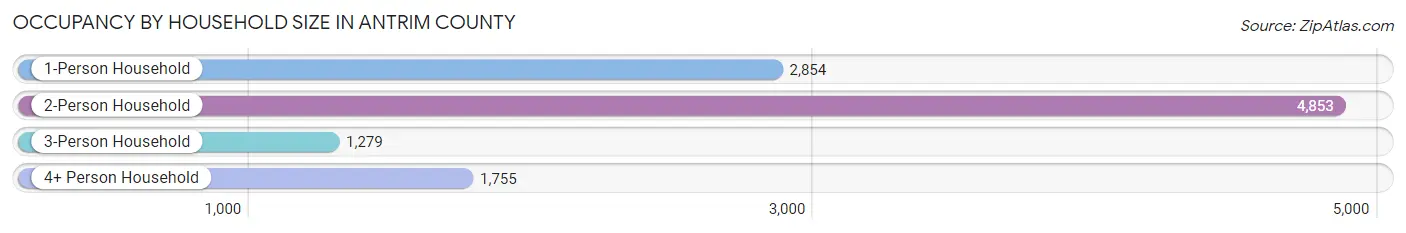
| Household Size | # Housing Units | % Housing Units |
| 1-Person Household | 2,854 | 26.6% |
| 2-Person Household | 4,853 | 45.2% |
| 3-Person Household | 1,279 | 11.9% |
| 4+ Person Household | 1,755 | 16.3% |
| Total Housing Units | 10,741 | 100.0% |
Occupancy by Ownership by Household Size in Antrim County
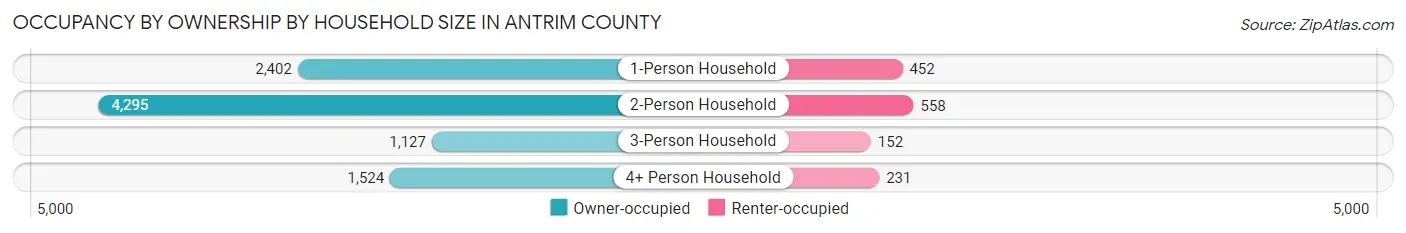
| Household Size | Owner-occupied | Renter-occupied |
| 1-Person Household | 2,402 (84.2%) | 452 (15.8%) |
| 2-Person Household | 4,295 (88.5%) | 558 (11.5%) |
| 3-Person Household | 1,127 (88.1%) | 152 (11.9%) |
| 4+ Person Household | 1,524 (86.8%) | 231 (13.2%) |
| Total Housing Units | 9,348 (87.0%) | 1,393 (13.0%) |
Occupancy by Educational Attainment in Antrim County
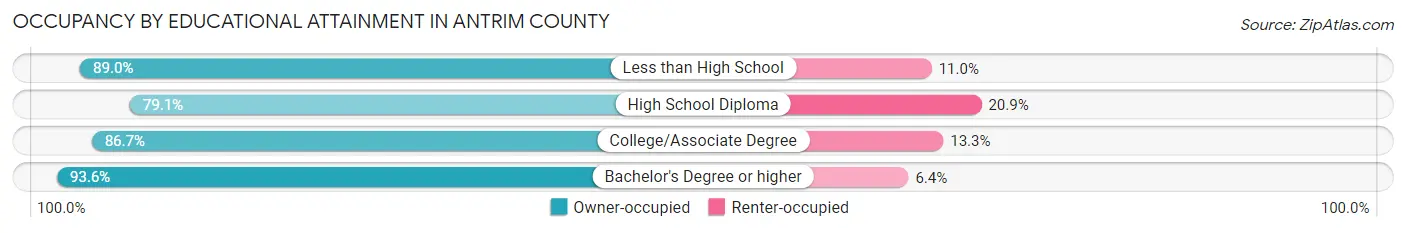
| Household Size | Owner-occupied | Renter-occupied |
| Less than High School | 428 (89.0%) | 53 (11.0%) |
| High School Diploma | 2,391 (79.1%) | 631 (20.9%) |
| College/Associate Degree | 3,081 (86.7%) | 473 (13.3%) |
| Bachelor's Degree or higher | 3,448 (93.6%) | 236 (6.4%) |
Occupancy by Age of Householder in Antrim County
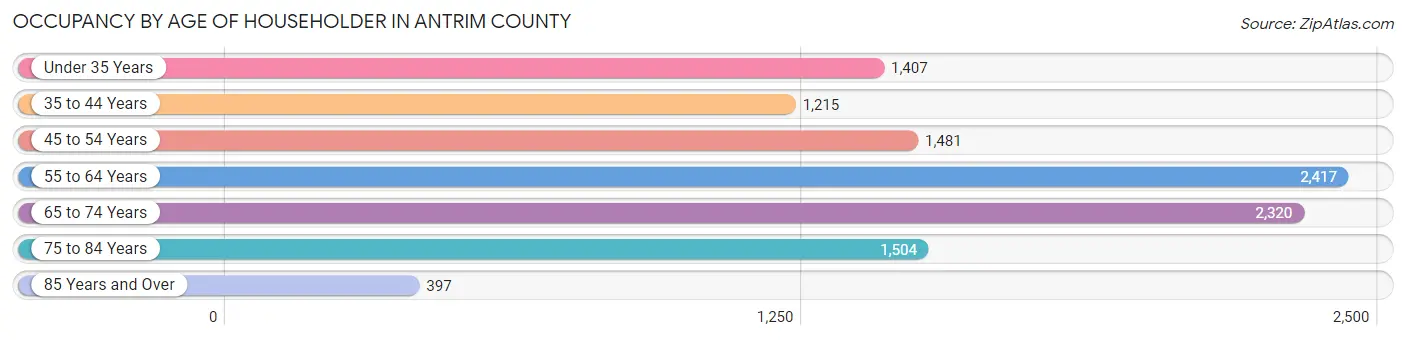
| Age Bracket | # Households | % Households |
| Under 35 Years | 1,407 | 13.1% |
| 35 to 44 Years | 1,215 | 11.3% |
| 45 to 54 Years | 1,481 | 13.8% |
| 55 to 64 Years | 2,417 | 22.5% |
| 65 to 74 Years | 2,320 | 21.6% |
| 75 to 84 Years | 1,504 | 14.0% |
| 85 Years and Over | 397 | 3.7% |
| Total | 10,741 | 100.0% |
Housing Finances in Antrim County
Median Income by Occupancy in Antrim County
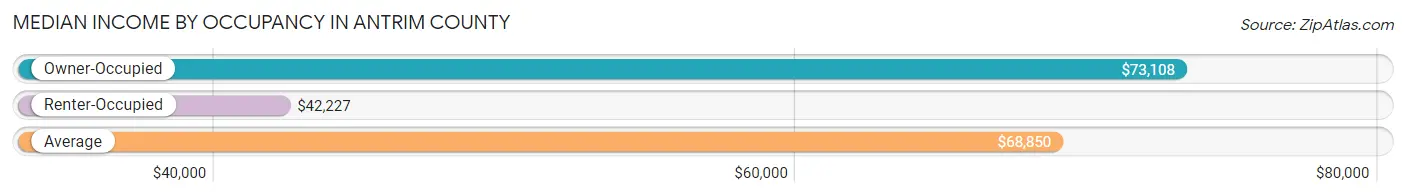
| Occupancy Type | # Households | Median Income |
| Owner-Occupied | 9,348 (87.0%) | $73,108 |
| Renter-Occupied | 1,393 (13.0%) | $42,227 |
| Average | 10,741 (100.0%) | $68,850 |
Occupancy by Householder Income Bracket in Antrim County
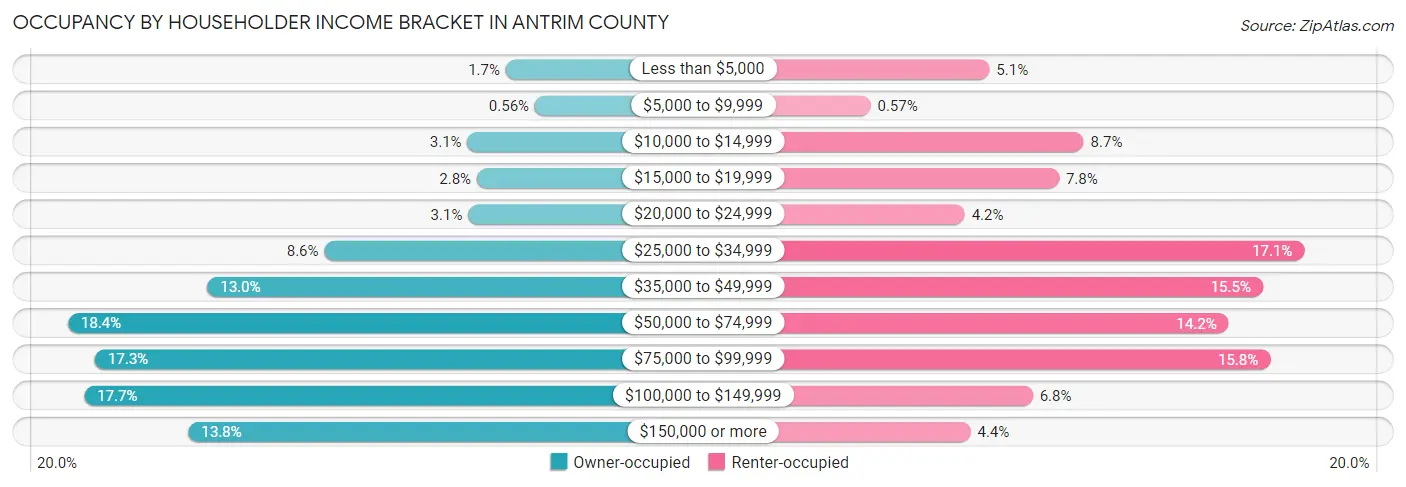
| Income Bracket | Owner-occupied | Renter-occupied |
| Less than $5,000 | 156 (1.7%) | 71 (5.1%) |
| $5,000 to $9,999 | 52 (0.6%) | 8 (0.6%) |
| $10,000 to $14,999 | 293 (3.1%) | 121 (8.7%) |
| $15,000 to $19,999 | 259 (2.8%) | 108 (7.7%) |
| $20,000 to $24,999 | 290 (3.1%) | 58 (4.2%) |
| $25,000 to $34,999 | 802 (8.6%) | 238 (17.1%) |
| $35,000 to $49,999 | 1,219 (13.0%) | 216 (15.5%) |
| $50,000 to $74,999 | 1,715 (18.3%) | 198 (14.2%) |
| $75,000 to $99,999 | 1,619 (17.3%) | 220 (15.8%) |
| $100,000 to $149,999 | 1,657 (17.7%) | 94 (6.8%) |
| $150,000 or more | 1,286 (13.8%) | 61 (4.4%) |
| Total | 9,348 (100.0%) | 1,393 (100.0%) |
Monthly Housing Cost Tiers in Antrim County
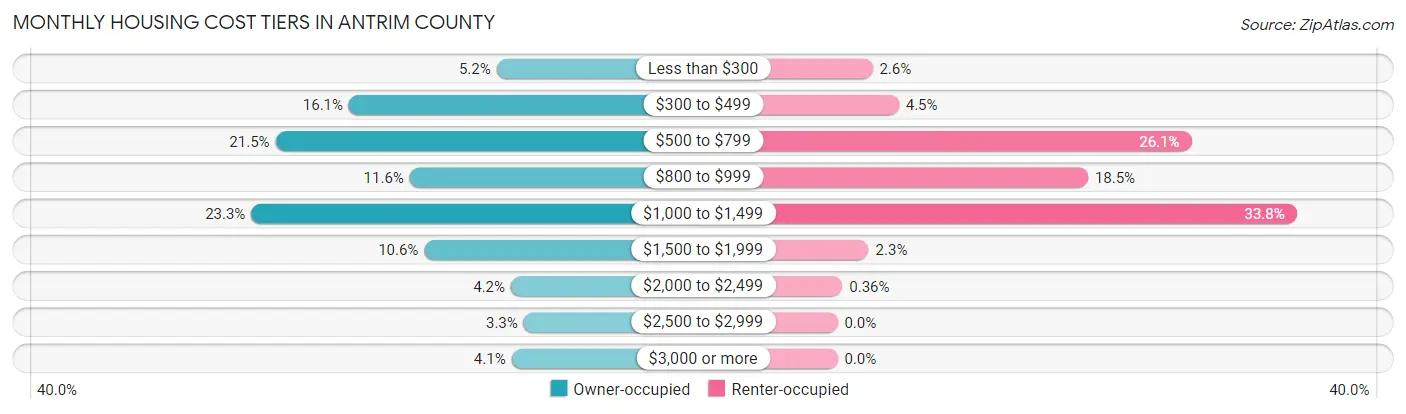
| Monthly Cost | Owner-occupied | Renter-occupied |
| Less than $300 | 490 (5.2%) | 36 (2.6%) |
| $300 to $499 | 1,507 (16.1%) | 63 (4.5%) |
| $500 to $799 | 2,013 (21.5%) | 363 (26.1%) |
| $800 to $999 | 1,088 (11.6%) | 257 (18.4%) |
| $1,000 to $1,499 | 2,179 (23.3%) | 471 (33.8%) |
| $1,500 to $1,999 | 988 (10.6%) | 32 (2.3%) |
| $2,000 to $2,499 | 392 (4.2%) | 5 (0.4%) |
| $2,500 to $2,999 | 304 (3.3%) | 0 (0.0%) |
| $3,000 or more | 387 (4.1%) | 0 (0.0%) |
| Total | 9,348 (100.0%) | 1,393 (100.0%) |
Physical Housing Characteristics in Antrim County
Housing Structures in Antrim County
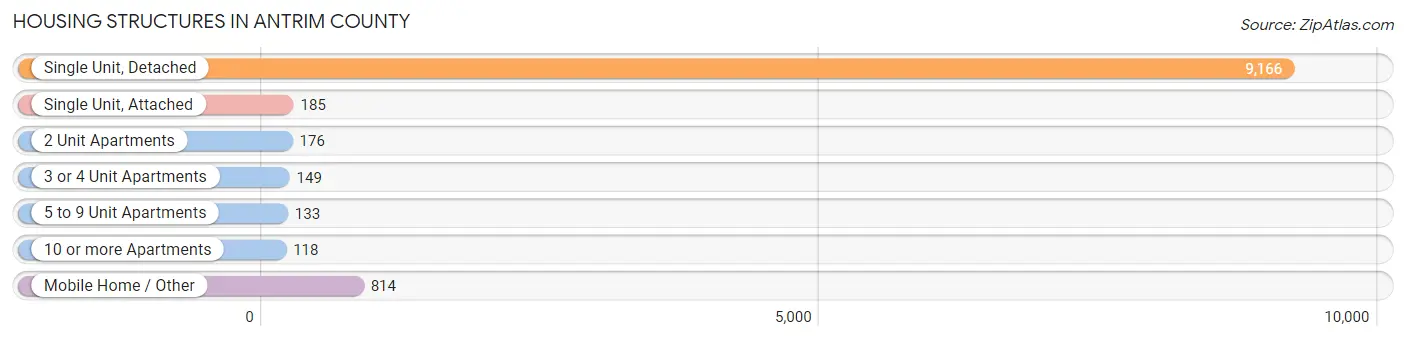
| Structure Type | # Housing Units | % Housing Units |
| Single Unit, Detached | 9,166 | 85.3% |
| Single Unit, Attached | 185 | 1.7% |
| 2 Unit Apartments | 176 | 1.6% |
| 3 or 4 Unit Apartments | 149 | 1.4% |
| 5 to 9 Unit Apartments | 133 | 1.2% |
| 10 or more Apartments | 118 | 1.1% |
| Mobile Home / Other | 814 | 7.6% |
| Total | 10,741 | 100.0% |
Housing Structures by Occupancy in Antrim County
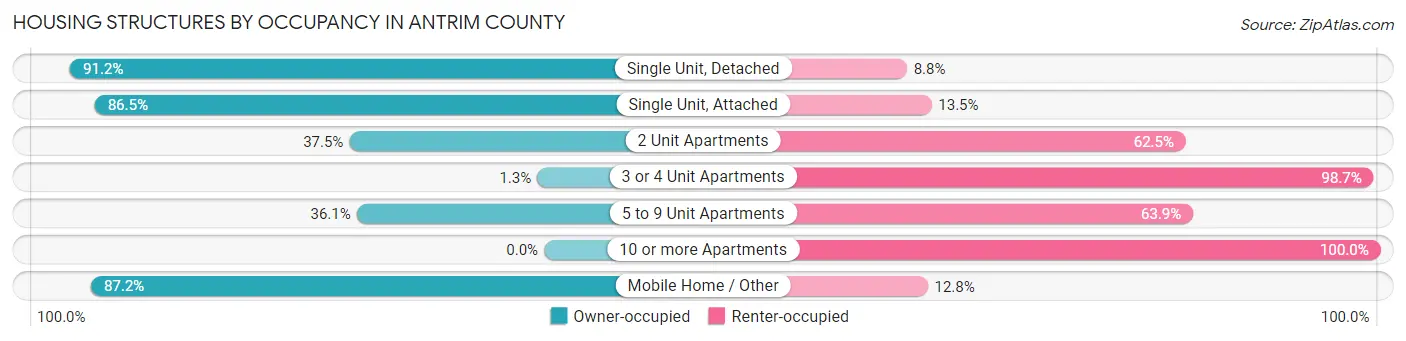
| Structure Type | Owner-occupied | Renter-occupied |
| Single Unit, Detached | 8,362 (91.2%) | 804 (8.8%) |
| Single Unit, Attached | 160 (86.5%) | 25 (13.5%) |
| 2 Unit Apartments | 66 (37.5%) | 110 (62.5%) |
| 3 or 4 Unit Apartments | 2 (1.3%) | 147 (98.7%) |
| 5 to 9 Unit Apartments | 48 (36.1%) | 85 (63.9%) |
| 10 or more Apartments | 0 (0.0%) | 118 (100.0%) |
| Mobile Home / Other | 710 (87.2%) | 104 (12.8%) |
| Total | 9,348 (87.0%) | 1,393 (13.0%) |
Housing Structures by Number of Rooms in Antrim County
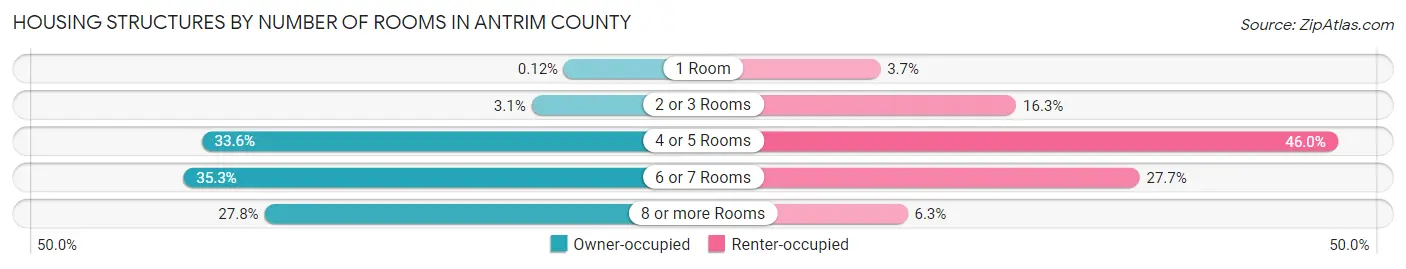
| Number of Rooms | Owner-occupied | Renter-occupied |
| 1 Room | 11 (0.1%) | 52 (3.7%) |
| 2 or 3 Rooms | 292 (3.1%) | 227 (16.3%) |
| 4 or 5 Rooms | 3,143 (33.6%) | 641 (46.0%) |
| 6 or 7 Rooms | 3,301 (35.3%) | 386 (27.7%) |
| 8 or more Rooms | 2,601 (27.8%) | 87 (6.2%) |
| Total | 9,348 (100.0%) | 1,393 (100.0%) |
Housing Structure by Heating Type in Antrim County
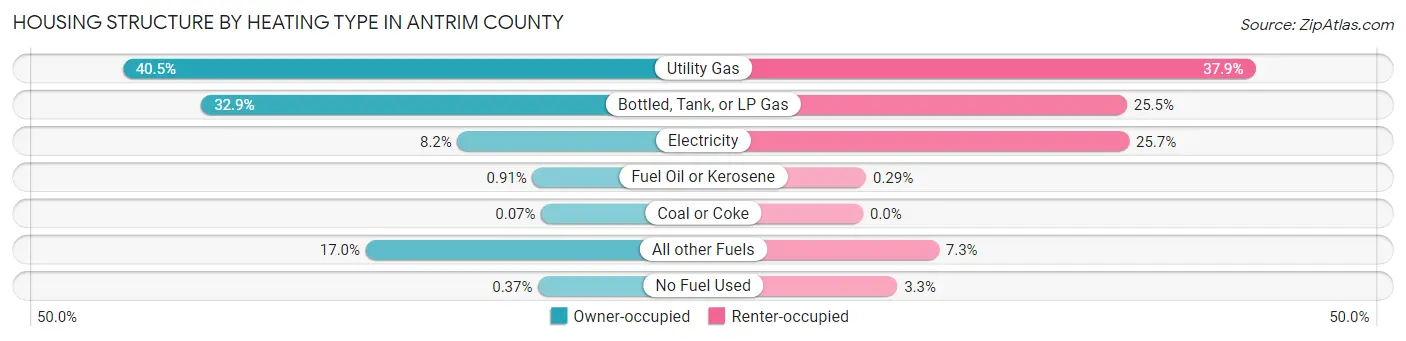
| Heating Type | Owner-occupied | Renter-occupied |
| Utility Gas | 3,788 (40.5%) | 528 (37.9%) |
| Bottled, Tank, or LP Gas | 3,078 (32.9%) | 355 (25.5%) |
| Electricity | 763 (8.2%) | 358 (25.7%) |
| Fuel Oil or Kerosene | 85 (0.9%) | 4 (0.3%) |
| Coal or Coke | 7 (0.1%) | 0 (0.0%) |
| All other Fuels | 1,592 (17.0%) | 102 (7.3%) |
| No Fuel Used | 35 (0.4%) | 46 (3.3%) |
| Total | 9,348 (100.0%) | 1,393 (100.0%) |
Household Vehicle Usage in Antrim County
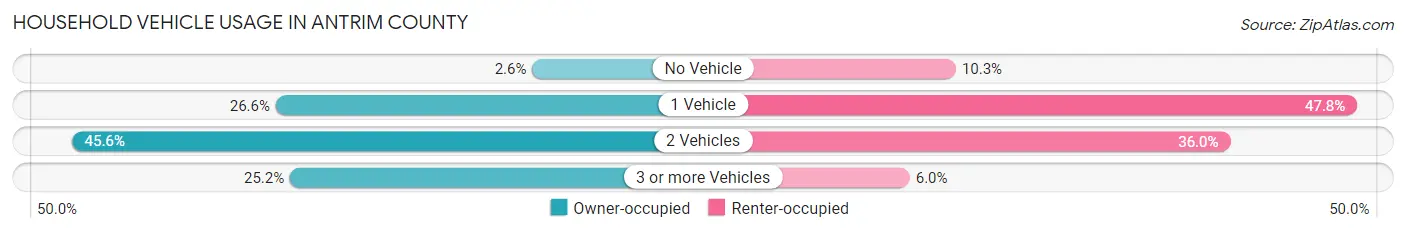
| Vehicles per Household | Owner-occupied | Renter-occupied |
| No Vehicle | 244 (2.6%) | 143 (10.3%) |
| 1 Vehicle | 2,482 (26.6%) | 666 (47.8%) |
| 2 Vehicles | 4,264 (45.6%) | 501 (36.0%) |
| 3 or more Vehicles | 2,358 (25.2%) | 83 (6.0%) |
| Total | 9,348 (100.0%) | 1,393 (100.0%) |
Real Estate & Mortgages in Antrim County
Real Estate and Mortgage Overview in Antrim County
| Characteristic | Without Mortgage | With Mortgage |
| Housing Units | 4,323 | 5,025 |
| Median Property Value | $203,500 | $198,200 |
| Median Household Income | $61,315 | $708 |
| Monthly Housing Costs | $537 | $381 |
| Real Estate Taxes | $1,972 | $172 |
Property Value by Mortgage Status in Antrim County
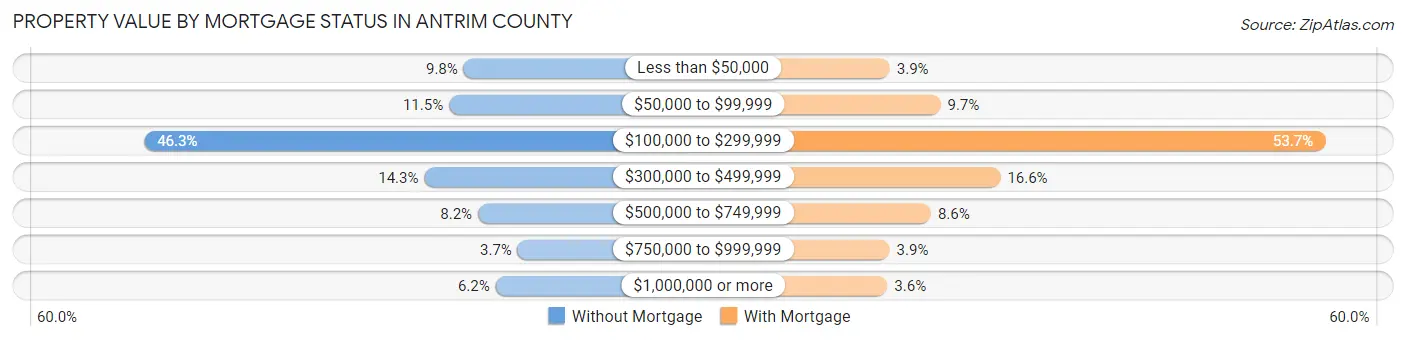
| Property Value | Without Mortgage | With Mortgage |
| Less than $50,000 | 425 (9.8%) | 197 (3.9%) |
| $50,000 to $99,999 | 497 (11.5%) | 488 (9.7%) |
| $100,000 to $299,999 | 2,003 (46.3%) | 2,696 (53.6%) |
| $300,000 to $499,999 | 619 (14.3%) | 832 (16.6%) |
| $500,000 to $749,999 | 354 (8.2%) | 433 (8.6%) |
| $750,000 to $999,999 | 158 (3.6%) | 196 (3.9%) |
| $1,000,000 or more | 267 (6.2%) | 183 (3.6%) |
| Total | 4,323 (100.0%) | 5,025 (100.0%) |
Household Income by Mortgage Status in Antrim County
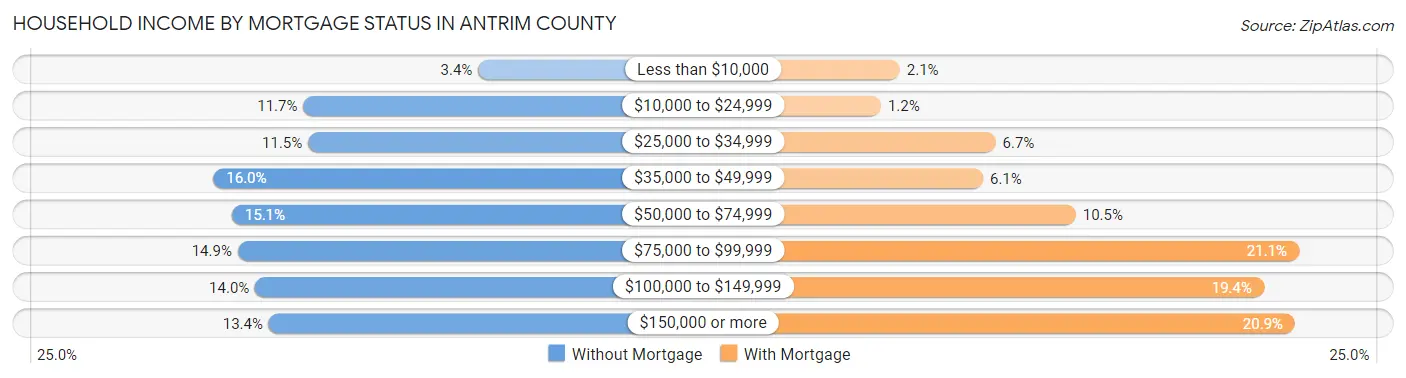
| Household Income | Without Mortgage | With Mortgage |
| Less than $10,000 | 147 (3.4%) | 106 (2.1%) |
| $10,000 to $24,999 | 507 (11.7%) | 61 (1.2%) |
| $25,000 to $34,999 | 497 (11.5%) | 335 (6.7%) |
| $35,000 to $49,999 | 692 (16.0%) | 305 (6.1%) |
| $50,000 to $74,999 | 654 (15.1%) | 527 (10.5%) |
| $75,000 to $99,999 | 642 (14.8%) | 1,061 (21.1%) |
| $100,000 to $149,999 | 606 (14.0%) | 977 (19.4%) |
| $150,000 or more | 578 (13.4%) | 1,051 (20.9%) |
| Total | 4,323 (100.0%) | 5,025 (100.0%) |
Property Value to Household Income Ratio in Antrim County
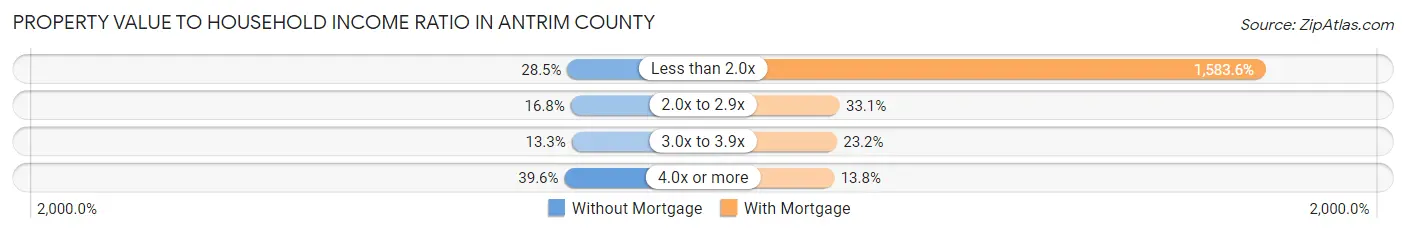
| Value-to-Income Ratio | Without Mortgage | With Mortgage |
| Less than 2.0x | 1,233 (28.5%) | 79,574 (1,583.6%) |
| 2.0x to 2.9x | 728 (16.8%) | 1,664 (33.1%) |
| 3.0x to 3.9x | 574 (13.3%) | 1,166 (23.2%) |
| 4.0x or more | 1,710 (39.6%) | 692 (13.8%) |
| Total | 4,323 (100.0%) | 5,025 (100.0%) |
Real Estate Taxes by Mortgage Status in Antrim County
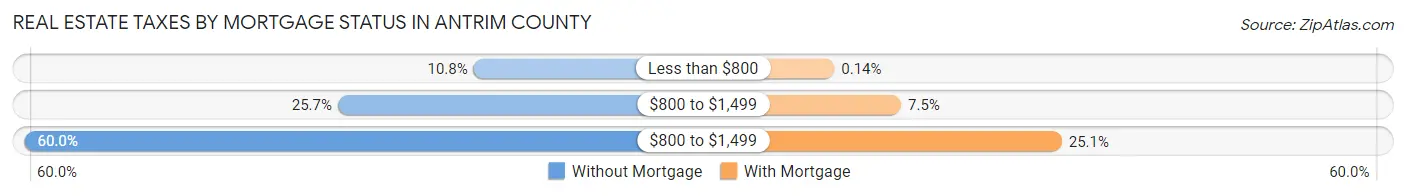
| Property Taxes | Without Mortgage | With Mortgage |
| Less than $800 | 467 (10.8%) | 7 (0.1%) |
| $800 to $1,499 | 1,110 (25.7%) | 375 (7.5%) |
| $800 to $1,499 | 2,594 (60.0%) | 1,260 (25.1%) |
| Total | 4,323 (100.0%) | 5,025 (100.0%) |
Health & Disability in Antrim County
Health Insurance Coverage by Age in Antrim County
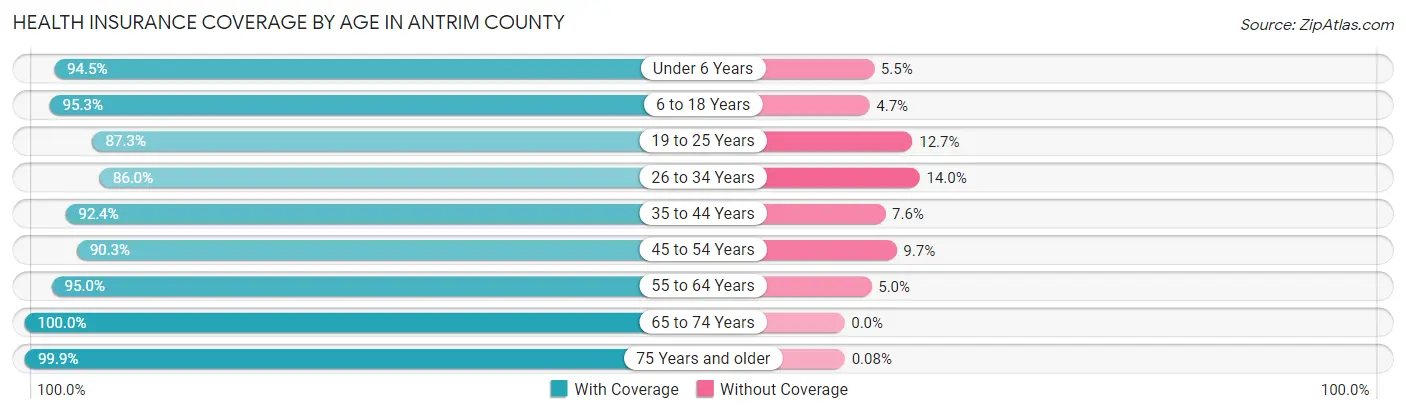
| Age Bracket | With Coverage | Without Coverage |
| Under 6 Years | 1,129 (94.5%) | 66 (5.5%) |
| 6 to 18 Years | 3,041 (95.3%) | 149 (4.7%) |
| 19 to 25 Years | 1,274 (87.3%) | 185 (12.7%) |
| 26 to 34 Years | 1,677 (86.0%) | 274 (14.0%) |
| 35 to 44 Years | 2,137 (92.4%) | 176 (7.6%) |
| 45 to 54 Years | 2,453 (90.3%) | 264 (9.7%) |
| 55 to 64 Years | 3,967 (95.0%) | 210 (5.0%) |
| 65 to 74 Years | 3,898 (100.0%) | 0 (0.0%) |
| 75 Years and older | 2,597 (99.9%) | 2 (0.1%) |
| Total | 22,173 (94.4%) | 1,326 (5.6%) |
Health Insurance Coverage by Citizenship Status in Antrim County
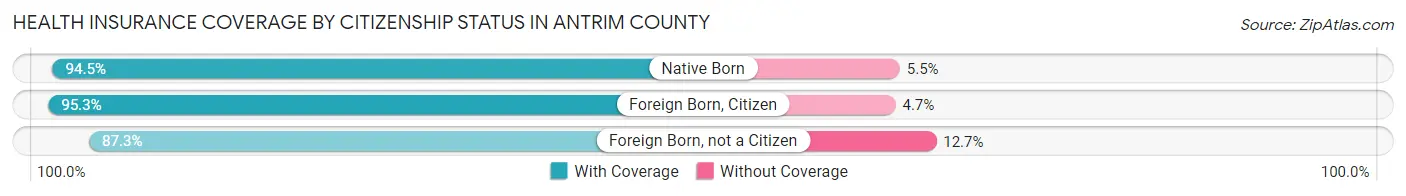
| Citizenship Status | With Coverage | Without Coverage |
| Native Born | 1,129 (94.5%) | 66 (5.5%) |
| Foreign Born, Citizen | 3,041 (95.3%) | 149 (4.7%) |
| Foreign Born, not a Citizen | 1,274 (87.3%) | 185 (12.7%) |
Health Insurance Coverage by Household Income in Antrim County
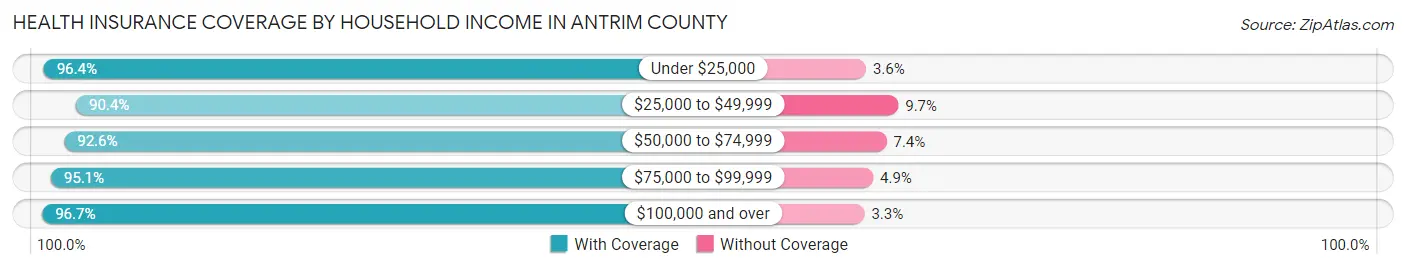
| Household Income | With Coverage | Without Coverage |
| Under $25,000 | 1,906 (96.4%) | 71 (3.6%) |
| $25,000 to $49,999 | 3,943 (90.3%) | 421 (9.7%) |
| $50,000 to $74,999 | 4,092 (92.6%) | 329 (7.4%) |
| $75,000 to $99,999 | 4,324 (95.1%) | 224 (4.9%) |
| $100,000 and over | 7,854 (96.7%) | 269 (3.3%) |
Public vs Private Health Insurance Coverage by Age in Antrim County
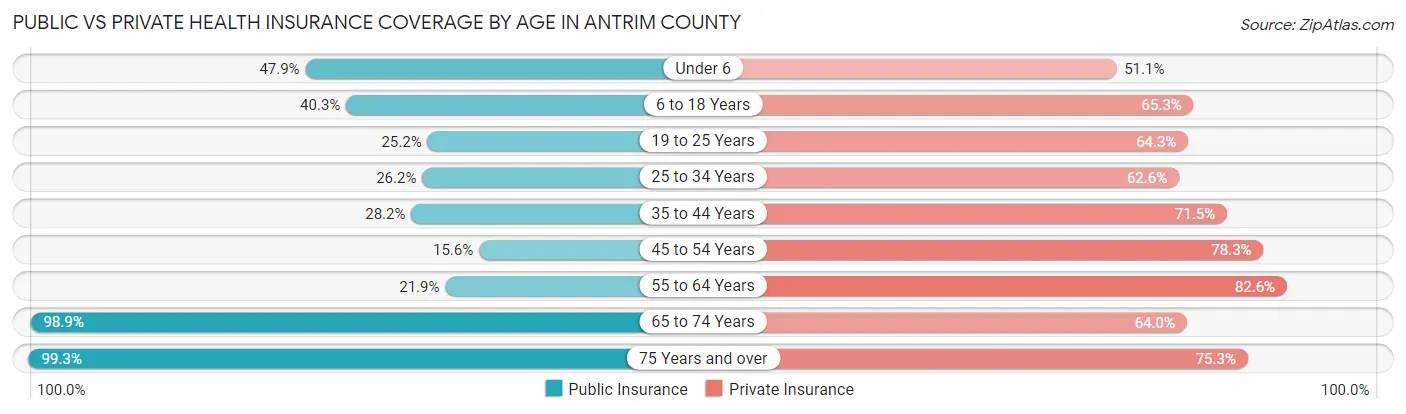
| Age Bracket | Public Insurance | Private Insurance |
| Under 6 | 572 (47.9%) | 611 (51.1%) |
| 6 to 18 Years | 1,286 (40.3%) | 2,083 (65.3%) |
| 19 to 25 Years | 368 (25.2%) | 938 (64.3%) |
| 25 to 34 Years | 511 (26.2%) | 1,221 (62.6%) |
| 35 to 44 Years | 653 (28.2%) | 1,654 (71.5%) |
| 45 to 54 Years | 425 (15.6%) | 2,126 (78.2%) |
| 55 to 64 Years | 915 (21.9%) | 3,451 (82.6%) |
| 65 to 74 Years | 3,855 (98.9%) | 2,496 (64.0%) |
| 75 Years and over | 2,580 (99.3%) | 1,958 (75.3%) |
| Total | 11,165 (47.5%) | 16,538 (70.4%) |
Disability Status by Sex by Age in Antrim County
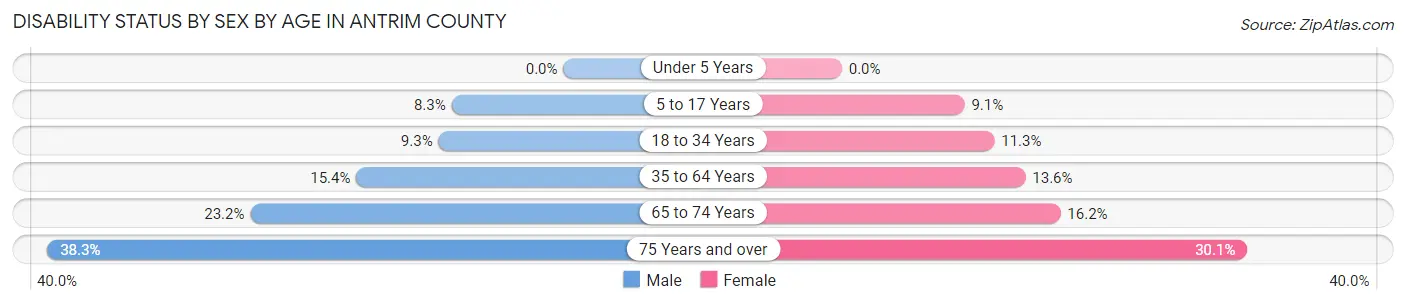
| Age Bracket | Male | Female |
| Under 5 Years | 0 (0.0%) | 0 (0.0%) |
| 5 to 17 Years | 133 (8.3%) | 141 (9.1%) |
| 18 to 34 Years | 179 (9.3%) | 202 (11.3%) |
| 35 to 64 Years | 708 (15.4%) | 627 (13.6%) |
| 65 to 74 Years | 449 (23.2%) | 319 (16.2%) |
| 75 Years and over | 474 (38.3%) | 410 (30.1%) |
Disability Class by Sex by Age in Antrim County
Disability Class: Hearing Difficulty
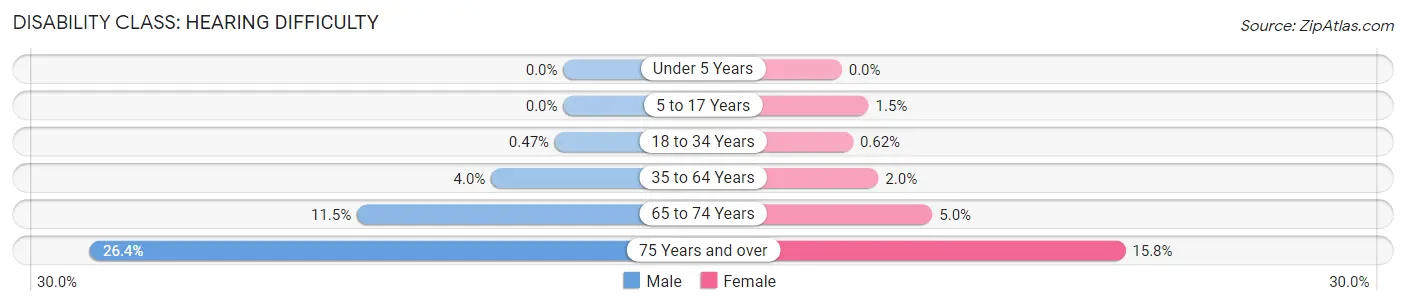
| Age Bracket | Male | Female |
| Under 5 Years | 0 (0.0%) | 0 (0.0%) |
| 5 to 17 Years | 0 (0.0%) | 23 (1.5%) |
| 18 to 34 Years | 9 (0.5%) | 11 (0.6%) |
| 35 to 64 Years | 185 (4.0%) | 94 (2.0%) |
| 65 to 74 Years | 222 (11.5%) | 99 (5.0%) |
| 75 Years and over | 326 (26.4%) | 215 (15.8%) |
Disability Class: Vision Difficulty
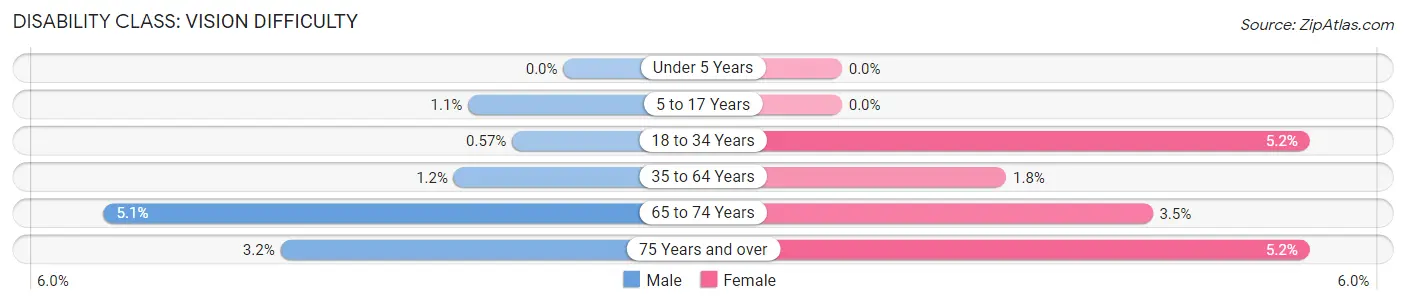
| Age Bracket | Male | Female |
| Under 5 Years | 0 (0.0%) | 0 (0.0%) |
| 5 to 17 Years | 17 (1.1%) | 0 (0.0%) |
| 18 to 34 Years | 11 (0.6%) | 93 (5.2%) |
| 35 to 64 Years | 56 (1.2%) | 84 (1.8%) |
| 65 to 74 Years | 99 (5.1%) | 68 (3.5%) |
| 75 Years and over | 39 (3.2%) | 71 (5.2%) |
Disability Class: Cognitive Difficulty
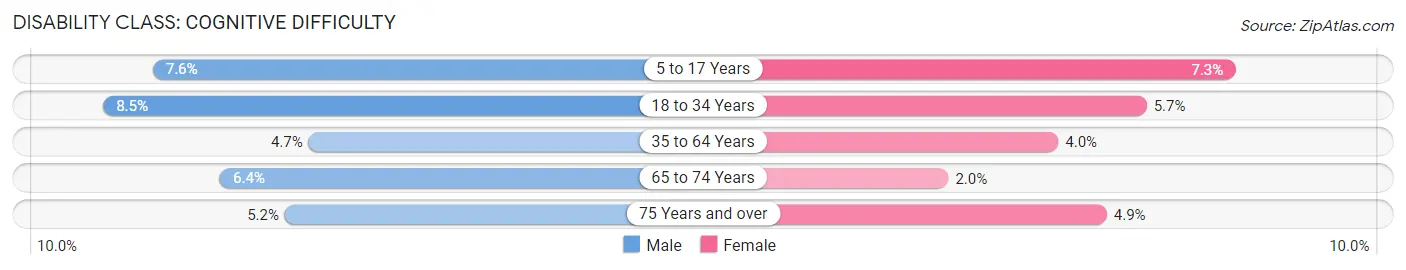
| Age Bracket | Male | Female |
| 5 to 17 Years | 122 (7.6%) | 113 (7.3%) |
| 18 to 34 Years | 165 (8.5%) | 101 (5.7%) |
| 35 to 64 Years | 218 (4.7%) | 185 (4.0%) |
| 65 to 74 Years | 123 (6.4%) | 39 (2.0%) |
| 75 Years and over | 64 (5.2%) | 67 (4.9%) |
Disability Class: Ambulatory Difficulty
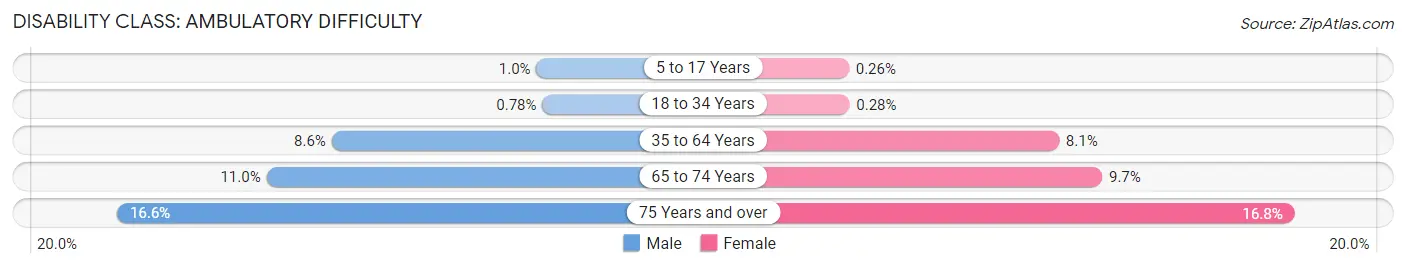
| Age Bracket | Male | Female |
| 5 to 17 Years | 16 (1.0%) | 4 (0.3%) |
| 18 to 34 Years | 15 (0.8%) | 5 (0.3%) |
| 35 to 64 Years | 396 (8.6%) | 371 (8.1%) |
| 65 to 74 Years | 213 (11.0%) | 190 (9.7%) |
| 75 Years and over | 205 (16.6%) | 229 (16.8%) |
Disability Class: Self-Care Difficulty
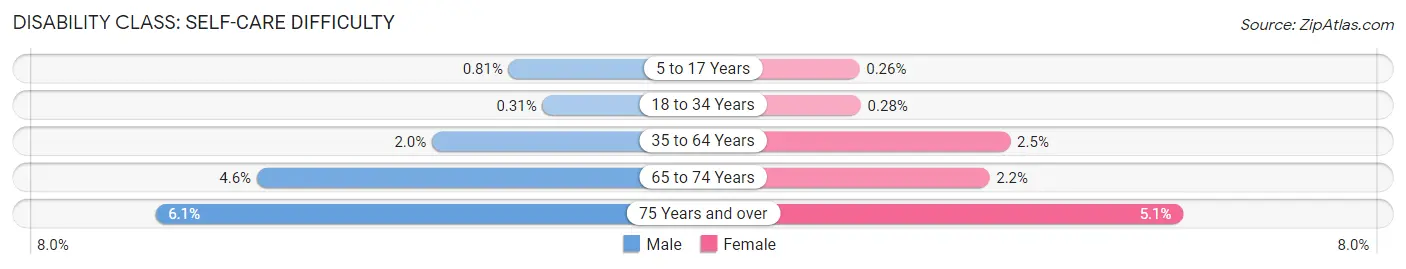
| Age Bracket | Male | Female |
| 5 to 17 Years | 13 (0.8%) | 4 (0.3%) |
| 18 to 34 Years | 6 (0.3%) | 5 (0.3%) |
| 35 to 64 Years | 90 (1.9%) | 115 (2.5%) |
| 65 to 74 Years | 88 (4.5%) | 43 (2.2%) |
| 75 Years and over | 75 (6.1%) | 69 (5.1%) |
Technology Access in Antrim County
Computing Device Access in Antrim County
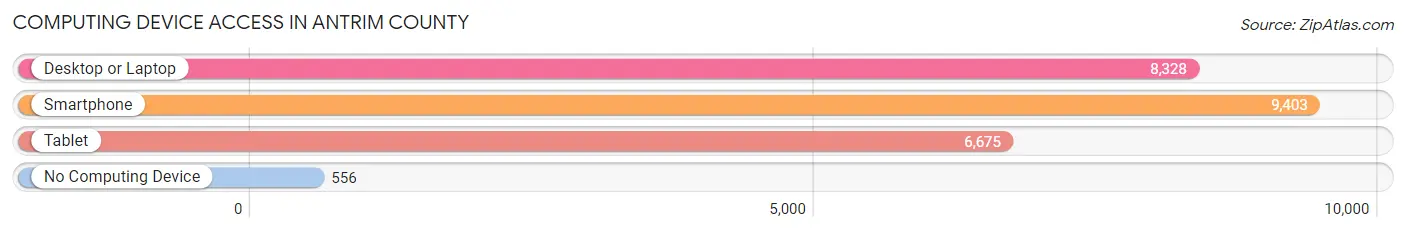
| Device Type | # Households | % Households |
| Desktop or Laptop | 8,328 | 77.5% |
| Smartphone | 9,403 | 87.5% |
| Tablet | 6,675 | 62.2% |
| No Computing Device | 556 | 5.2% |
| Total | 10,741 | 100.0% |
Internet Access in Antrim County
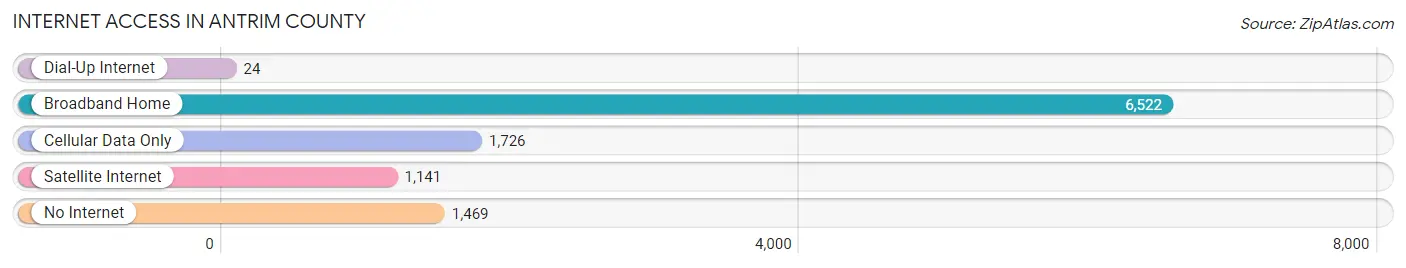
| Internet Type | # Households | % Households |
| Dial-Up Internet | 24 | 0.2% |
| Broadband Home | 6,522 | 60.7% |
| Cellular Data Only | 1,726 | 16.1% |
| Satellite Internet | 1,141 | 10.6% |
| No Internet | 1,469 | 13.7% |
| Total | 10,741 | 100.0% |
Antrim County Summary
Antrim County is located in the northern part of Michigan’s Lower Peninsula. It is bordered by Grand Traverse County to the west, Kalkaska County to the north, Otsego County to the east, and Charlevoix County to the south. The county seat is Bellaire. The county has a total area of 576 square miles, of which 571 square miles is land and 5.2 square miles is water.
History
Antrim County was established in 1840 and was named after County Antrim in Ireland. The county was originally part of Mackinac County, but was split off in 1840. The first settlers in the county were mostly of Irish and Scottish descent. The county was largely agricultural, with the main crops being wheat, oats, and potatoes.
In the late 19th century, the county began to develop a tourism industry, with resorts and hotels being built along the lakeshores. The county also became a popular destination for hunters and fishermen.
Geography
Antrim County is located in the northern part of Michigan’s Lower Peninsula. It is bordered by Grand Traverse County to the west, Kalkaska County to the north, Otsego County to the east, and Charlevoix County to the south. The county seat is Bellaire.
The county has a total area of 576 square miles, of which 571 square miles is land and 5.2 square miles is water. The terrain is mostly rolling hills and lowlands, with some higher elevations in the northern part of the county. The county is home to several lakes, including Torch Lake, Elk Lake, and Intermediate Lake.
Economy
The economy of Antrim County is largely based on tourism and agriculture. The county is home to several resorts and hotels, as well as numerous campgrounds and recreational areas. The county is also home to several wineries and breweries.
Agriculture is also an important part of the economy. The main crops grown in the county are wheat, oats, and potatoes. Livestock production is also important, with dairy and beef cattle being the main types of livestock raised.
Demographics
As of the 2010 census, the population of Antrim County was 23,110. The population density was 40.2 people per square mile. The racial makeup of the county was 95.3% White, 0.7% African American, 0.7% Native American, 0.5% Asian, 0.1% Pacific Islander, 1.2% from other races, and 1.5% from two or more races. Hispanic or Latino of any race were 3.2% of the population.
The median income for a household in the county was $41,945, and the median income for a family was $50,945. The per capita income for the county was $21,945. About 11.2% of families and 15.2% of the population were below the poverty line, including 21.2% of those under age 18 and 8.2% of those age 65 or over.
Common Questions
What is Per Capita Income in Antrim County?
Per Capita income in Antrim County is $39,166.
What is the Median Family Income in Antrim County?
Median Family Income in Antrim County is $85,201.
What is the Median Household income in Antrim County?
Median Household Income in Antrim County is $68,850.
What is Income or Wage Gap in Antrim County?
Income or Wage Gap in Antrim County is 27.6%.
Women in Antrim County earn 72.4 cents for every dollar earned by a man.
What is Family Income Deficit in Antrim County?
Family Income Deficit in Antrim County is $9,604.
Families that are below poverty line in Antrim County earn $9,604 less on average than the poverty threshold level.
What is Inequality or Gini Index in Antrim County?
Inequality or Gini Index in Antrim County is 0.43.
What is the Total Population of Antrim County?
Total Population of Antrim County is 23,662.
What is the Total Male Population of Antrim County?
Total Male Population of Antrim County is 11,833.
What is the Total Female Population of Antrim County?
Total Female Population of Antrim County is 11,829.
What is the Ratio of Males per 100 Females in Antrim County?
There are 100.03 Males per 100 Females in Antrim County.
What is the Ratio of Females per 100 Males in Antrim County?
There are 99.97 Females per 100 Males in Antrim County.
What is the Median Population Age in Antrim County?
Median Population Age in Antrim County is 51.5 Years.
What is the Average Family Size in Antrim County
Average Family Size in Antrim County is 2.6 People.
What is the Average Household Size in Antrim County
Average Household Size in Antrim County is 2.2 People.
How Large is the Labor Force in Antrim County?
There are 11,228 People in the Labor Forcein in Antrim County.
What is the Percentage of People in the Labor Force in Antrim County?
55.8% of People are in the Labor Force in Antrim County.
What is the Unemployment Rate in Antrim County?
Unemployment Rate in Antrim County is 4.6%.