Alpena County, MI Map & Demographics
Alpena County Map
Alpena County Overview
$30,893
PER CAPITA INCOME
$62,299
AVG FAMILY INCOME
$49,133
AVG HOUSEHOLD INCOME
36.5%
WAGE / INCOME GAP [ % ]
63.5¢/ $1
WAGE / INCOME GAP [ $ ]
$9,725
FAMILY INCOME DEFICIT
0.46
INEQUALITY / GINI INDEX
28,911
TOTAL POPULATION
14,366
MALE POPULATION
14,545
FEMALE POPULATION
98.77
MALES / 100 FEMALES
101.25
FEMALES / 100 MALES
47.6
MEDIAN AGE
2.8
AVG FAMILY SIZE
2.2
AVG HOUSEHOLD SIZE
13,214
LABOR FORCE [ PEOPLE ]
54.6%
PERCENT IN LABOR FORCE
7.4%
UNEMPLOYMENT RATE
Alpena County Area Codes
Income in Alpena County
Income Overview in Alpena County
Per Capita Income in Alpena County is $30,893, while median incomes of families and households are $62,299 and $49,133 respectively.
| Characteristic | Number | Measure |
| Per Capita Income | 28,911 | $30,893 |
| Median Family Income | 7,393 | $62,299 |
| Mean Family Income | 7,393 | $78,707 |
| Median Household Income | 12,721 | $49,133 |
| Mean Household Income | 12,721 | $68,111 |
| Income Deficit | 7,393 | $9,725 |
| Wage / Income Gap (%) | 28,911 | 36.53% |
| Wage / Income Gap ($) | 28,911 | 63.47¢ per $1 |
| Gini / Inequality Index | 28,911 | 0.46 |
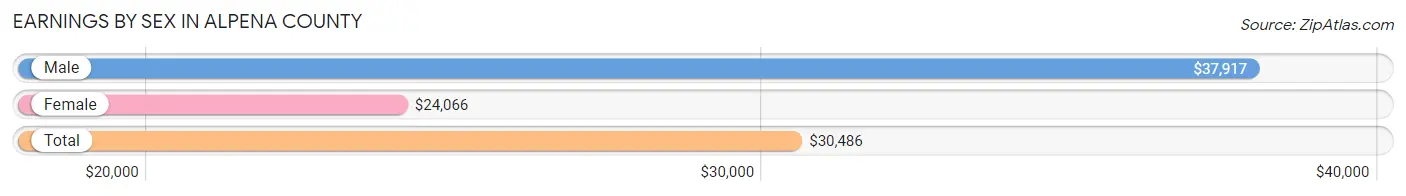
Earnings by Sex in Alpena County
Average Earnings in Alpena County are $30,486, $37,917 for men and $24,066 for women, a difference of 36.5%.
| Sex | Number | Average Earnings |
| Male | 7,184 (52.5%) | $37,917 |
| Female | 6,507 (47.5%) | $24,066 |
| Total | 13,691 (100.0%) | $30,486 |
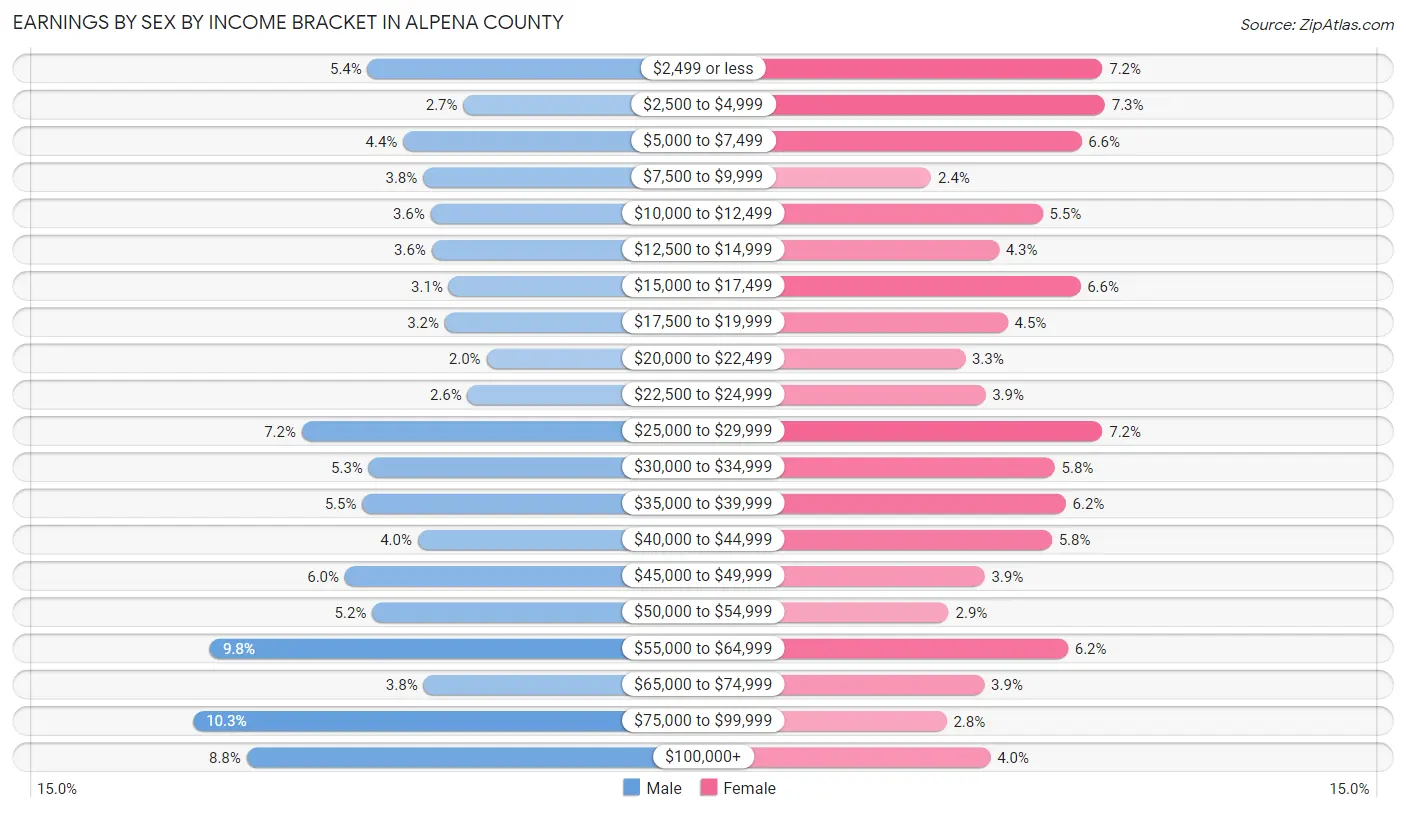
Earnings by Sex by Income Bracket in Alpena County
The most common earnings brackets in Alpena County are $75,000 to $99,999 for men (737 | 10.3%) and $2,500 to $4,999 for women (472 | 7.2%).
| Income | Male | Female |
| $2,499 or less | 385 (5.4%) | 467 (7.2%) |
| $2,500 to $4,999 | 192 (2.7%) | 472 (7.2%) |
| $5,000 to $7,499 | 313 (4.4%) | 429 (6.6%) |
| $7,500 to $9,999 | 273 (3.8%) | 154 (2.4%) |
| $10,000 to $12,499 | 258 (3.6%) | 358 (5.5%) |
| $12,500 to $14,999 | 256 (3.6%) | 278 (4.3%) |
| $15,000 to $17,499 | 221 (3.1%) | 427 (6.6%) |
| $17,500 to $19,999 | 229 (3.2%) | 294 (4.5%) |
| $20,000 to $22,499 | 145 (2.0%) | 216 (3.3%) |
| $22,500 to $24,999 | 183 (2.5%) | 253 (3.9%) |
| $25,000 to $29,999 | 518 (7.2%) | 467 (7.2%) |
| $30,000 to $34,999 | 383 (5.3%) | 380 (5.8%) |
| $35,000 to $39,999 | 396 (5.5%) | 400 (6.1%) |
| $40,000 to $44,999 | 284 (4.0%) | 375 (5.8%) |
| $45,000 to $49,999 | 431 (6.0%) | 252 (3.9%) |
| $50,000 to $54,999 | 376 (5.2%) | 186 (2.9%) |
| $55,000 to $64,999 | 703 (9.8%) | 404 (6.2%) |
| $65,000 to $74,999 | 272 (3.8%) | 251 (3.9%) |
| $75,000 to $99,999 | 737 (10.3%) | 182 (2.8%) |
| $100,000+ | 629 (8.8%) | 262 (4.0%) |
| Total | 7,184 (100.0%) | 6,507 (100.0%) |
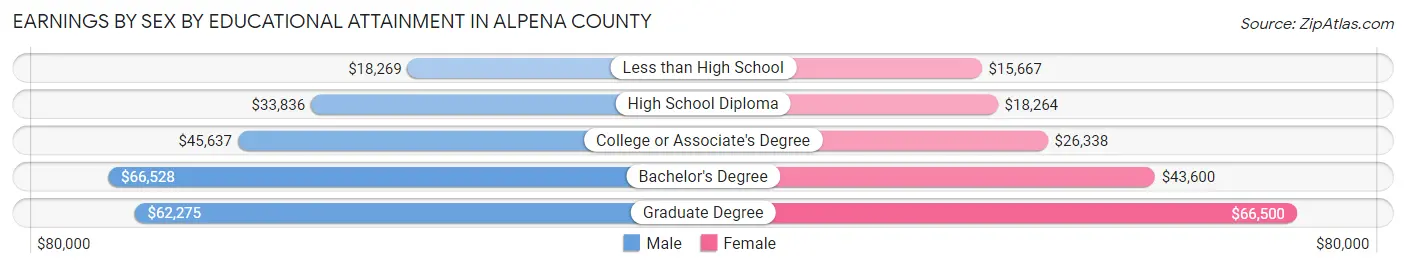
Earnings by Sex by Educational Attainment in Alpena County
Average earnings in Alpena County are $42,095 for men and $27,276 for women, a difference of 35.2%. Men with an educational attainment of bachelor's degree enjoy the highest average annual earnings of $66,528, while those with less than high school education earn the least with $18,269. Women with an educational attainment of graduate degree earn the most with the average annual earnings of $66,500, while those with less than high school education have the smallest earnings of $15,667.
| Educational Attainment | Male Income | Female Income |
| Less than High School | $18,269 | $15,667 |
| High School Diploma | $33,836 | $18,264 |
| College or Associate's Degree | $45,637 | $26,338 |
| Bachelor's Degree | $66,528 | $43,600 |
| Graduate Degree | $62,275 | $66,500 |
| Total | $42,095 | $27,276 |
Family Income in Alpena County
Family Income Brackets in Alpena County
According to the Alpena County family income data, there are 1,353 families falling into the $50,000 to $74,999 income range, which is the most common income bracket and makes up 18.3% of all families. Conversely, the $200,000+ income bracket is the least frequent group with only 237 families (3.2%) belonging to this category.
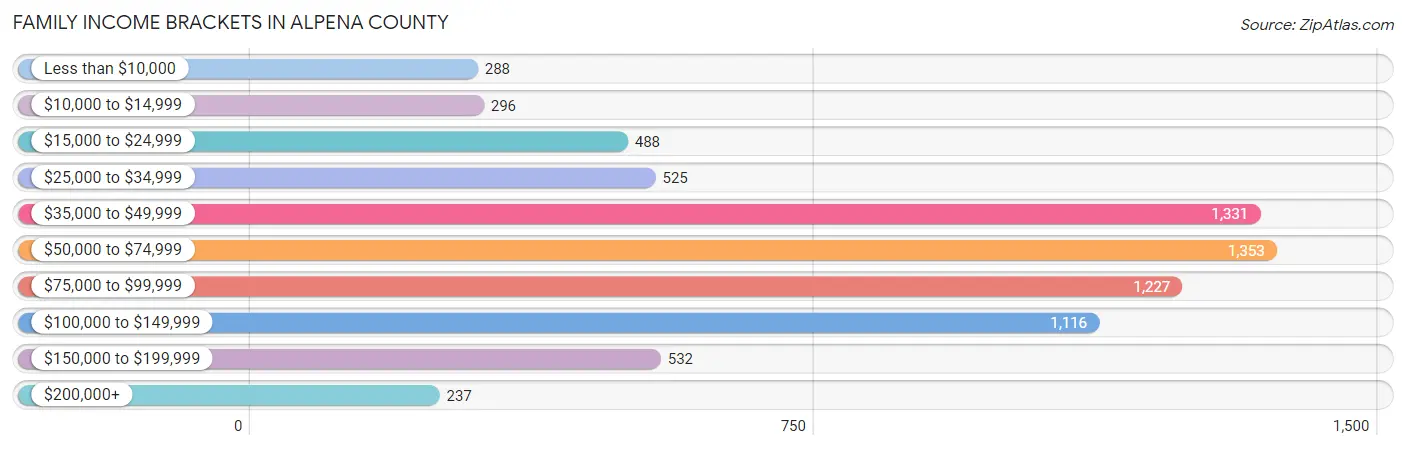
| Income Bracket | # Families | % Families |
| Less than $10,000 | 288 | 3.9% |
| $10,000 to $14,999 | 296 | 4.0% |
| $15,000 to $24,999 | 488 | 6.6% |
| $25,000 to $34,999 | 525 | 7.1% |
| $35,000 to $49,999 | 1,331 | 18.0% |
| $50,000 to $74,999 | 1,353 | 18.3% |
| $75,000 to $99,999 | 1,227 | 16.6% |
| $100,000 to $149,999 | 1,116 | 15.1% |
| $150,000 to $199,999 | 532 | 7.2% |
| $200,000+ | 237 | 3.2% |
Family Income by Famaliy Size in Alpena County
7+ person families (91 | 1.2%) account for the highest median family income in Alpena County with $138,750 per family, while 2-person families (4,404 | 59.6%) have the highest median income of $29,028 per family member.
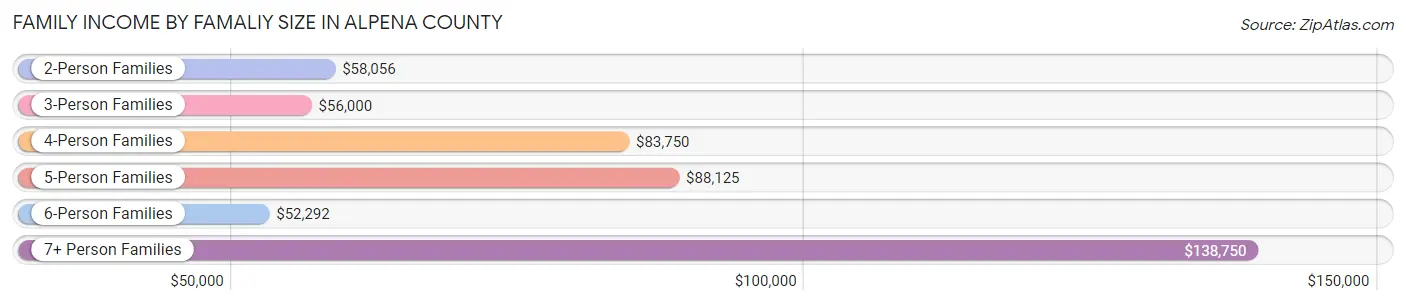
| Income Bracket | # Families | Median Income |
| 2-Person Families | 4,404 (59.6%) | $58,056 |
| 3-Person Families | 1,588 (21.5%) | $56,000 |
| 4-Person Families | 854 (11.6%) | $83,750 |
| 5-Person Families | 334 (4.5%) | $88,125 |
| 6-Person Families | 122 (1.7%) | $52,292 |
| 7+ Person Families | 91 (1.2%) | $138,750 |
| Total | 7,393 (100.0%) | $62,299 |
Family Income by Number of Earners in Alpena County
The median family income in Alpena County is $62,299, with families comprising 3+ earners (541) having the highest median family income of $115,417, while families with no earners (2,033) have the lowest median family income of $42,659, accounting for 7.3% and 27.5% of families, respectively.
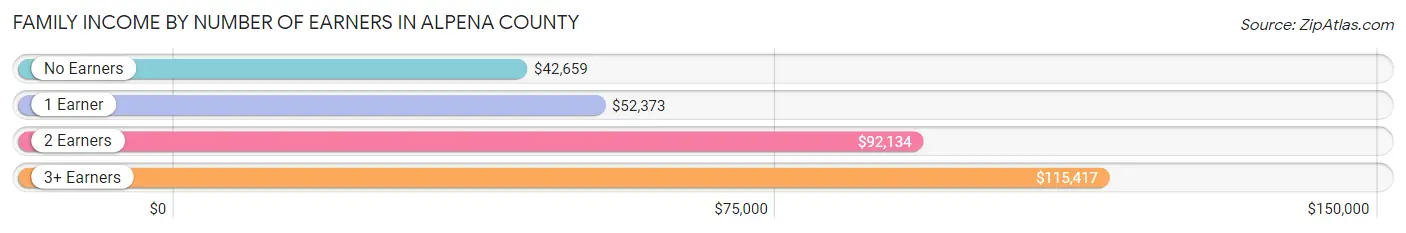
| Number of Earners | # Families | Median Income |
| No Earners | 2,033 (27.5%) | $42,659 |
| 1 Earner | 2,498 (33.8%) | $52,373 |
| 2 Earners | 2,321 (31.4%) | $92,134 |
| 3+ Earners | 541 (7.3%) | $115,417 |
| Total | 7,393 (100.0%) | $62,299 |
Household Income in Alpena County
Household Income Brackets in Alpena County
With 2,213 households falling in the category, the $35,000 to $49,999 income range is the most frequent in Alpena County, accounting for 17.4% of all households. In contrast, only 369 households (2.9%) fall into the $200,000+ income bracket, making it the least populous group.
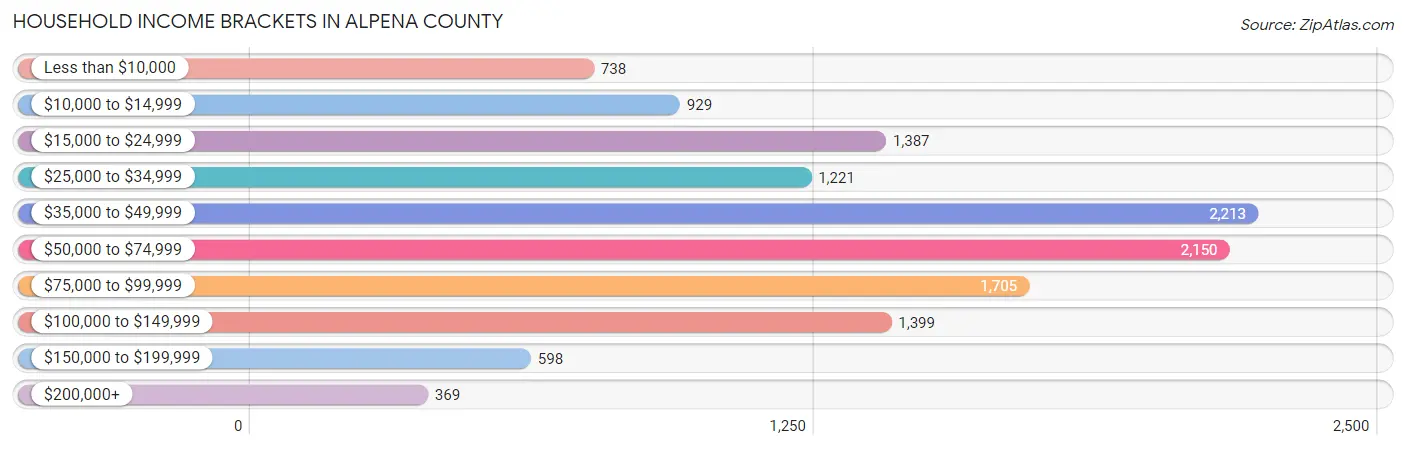
| Income Bracket | # Households | % Households |
| Less than $10,000 | 738 | 5.8% |
| $10,000 to $14,999 | 929 | 7.3% |
| $15,000 to $24,999 | 1,387 | 10.9% |
| $25,000 to $34,999 | 1,221 | 9.6% |
| $35,000 to $49,999 | 2,213 | 17.4% |
| $50,000 to $74,999 | 2,150 | 16.9% |
| $75,000 to $99,999 | 1,705 | 13.4% |
| $100,000 to $149,999 | 1,399 | 11.0% |
| $150,000 to $199,999 | 598 | 4.7% |
| $200,000+ | 369 | 2.9% |
Household Income by Householder Age in Alpena County
The median household income in Alpena County is $49,133, with the highest median household income of $60,959 found in the 25 to 44 years age bracket for the primary householder. A total of 2,956 households (23.2%) fall into this category. Meanwhile, the 65+ years age bracket for the primary householder has the lowest median household income of $41,130, with 4,443 households (34.9%) in this group.
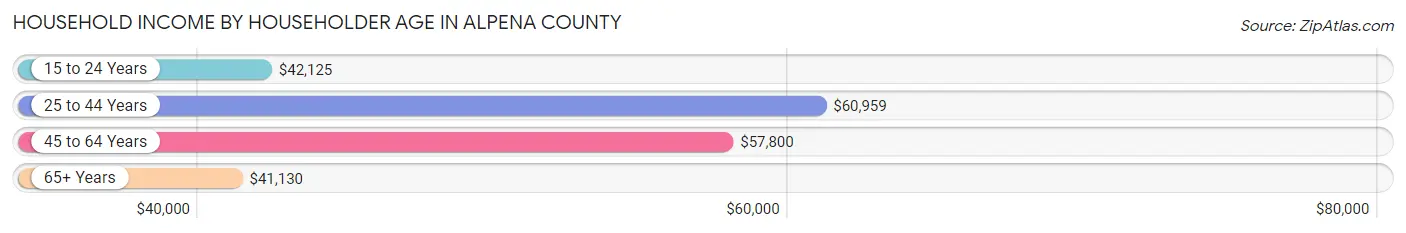
| Income Bracket | # Households | Median Income |
| 15 to 24 Years | 435 (3.4%) | $42,125 |
| 25 to 44 Years | 2,956 (23.2%) | $60,959 |
| 45 to 64 Years | 4,887 (38.4%) | $57,800 |
| 65+ Years | 4,443 (34.9%) | $41,130 |
| Total | 12,721 (100.0%) | $49,133 |
Poverty in Alpena County
Income Below Poverty by Sex and Age in Alpena County
With 15.2% poverty level for males and 17.8% for females among the residents of Alpena County, 15 year old males and 15 year old females are the most vulnerable to poverty, with 73 males (34.3%) and 65 females (42.8%) in their respective age groups living below the poverty level.
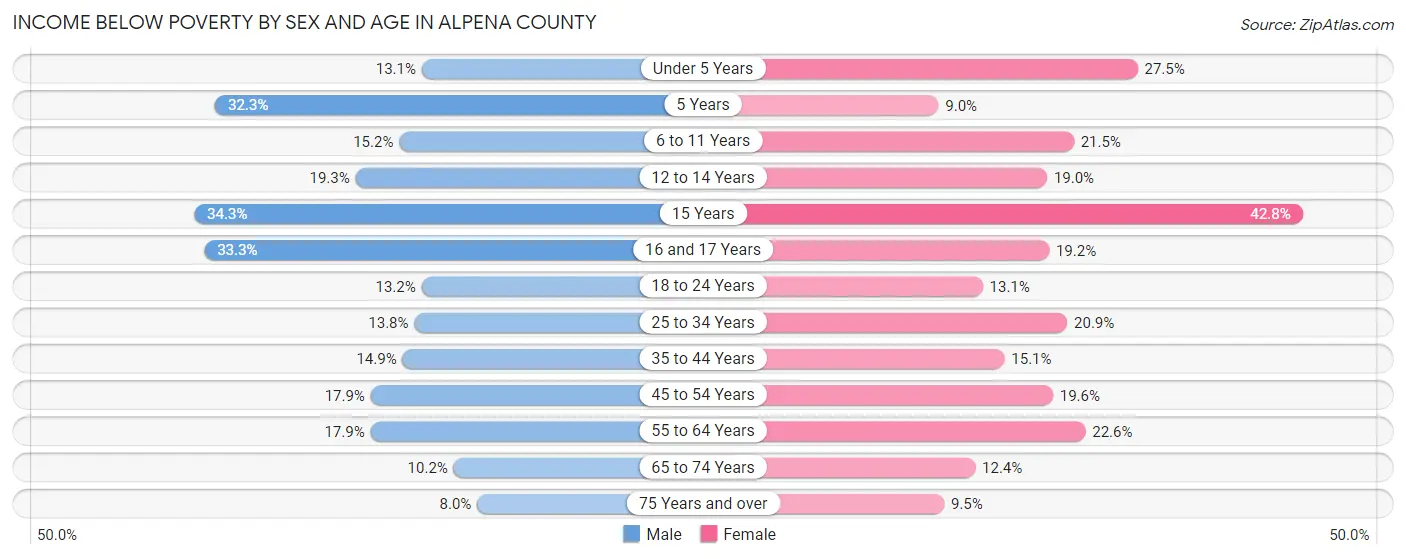
| Age Bracket | Male | Female |
| Under 5 Years | 85 (13.1%) | 182 (27.5%) |
| 5 Years | 32 (32.3%) | 6 (9.0%) |
| 6 to 11 Years | 147 (15.2%) | 173 (21.5%) |
| 12 to 14 Years | 82 (19.3%) | 95 (19.0%) |
| 15 Years | 73 (34.3%) | 65 (42.8%) |
| 16 and 17 Years | 108 (33.3%) | 65 (19.2%) |
| 18 to 24 Years | 133 (13.2%) | 120 (13.1%) |
| 25 to 34 Years | 223 (13.8%) | 312 (20.9%) |
| 35 to 44 Years | 240 (14.9%) | 227 (15.1%) |
| 45 to 54 Years | 300 (17.9%) | 347 (19.6%) |
| 55 to 64 Years | 419 (17.9%) | 552 (22.6%) |
| 65 to 74 Years | 201 (10.2%) | 247 (12.4%) |
| 75 Years and over | 95 (8.0%) | 156 (9.5%) |
| Total | 2,138 (15.2%) | 2,547 (17.8%) |
Income Above Poverty by Sex and Age in Alpena County
According to the poverty statistics in Alpena County, males aged 75 years and over and females aged 5 years are the age groups that are most secure financially, with 92.0% of males and 91.0% of females in these age groups living above the poverty line.
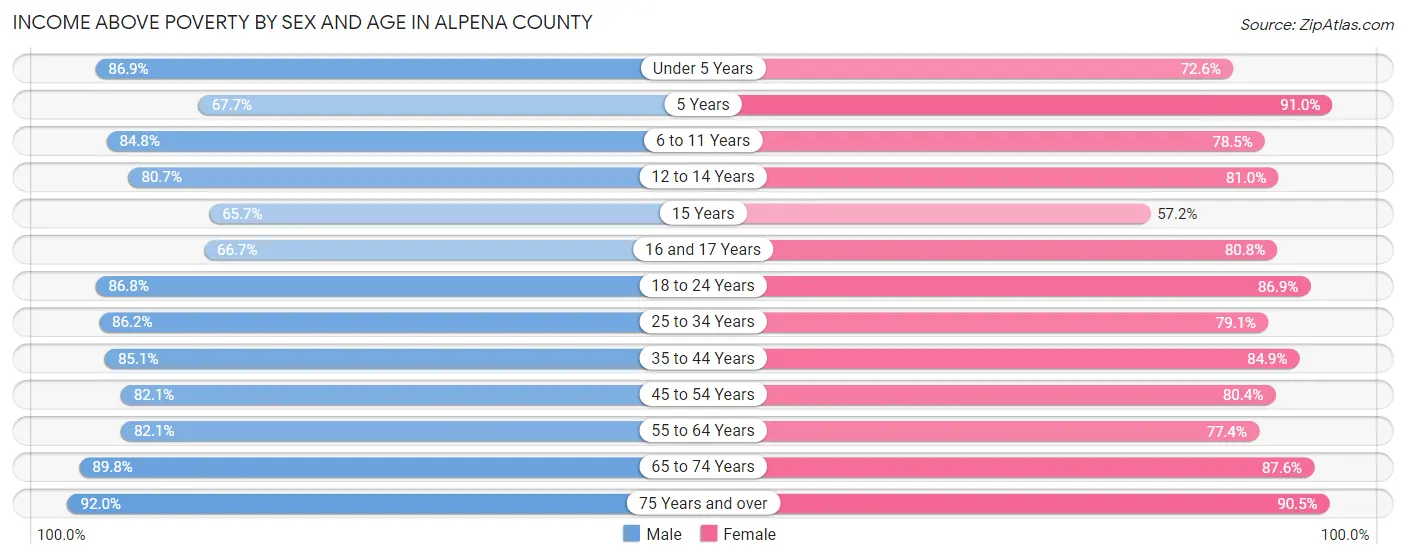
| Age Bracket | Male | Female |
| Under 5 Years | 562 (86.9%) | 481 (72.6%) |
| 5 Years | 67 (67.7%) | 61 (91.0%) |
| 6 to 11 Years | 818 (84.8%) | 631 (78.5%) |
| 12 to 14 Years | 343 (80.7%) | 404 (81.0%) |
| 15 Years | 140 (65.7%) | 87 (57.2%) |
| 16 and 17 Years | 216 (66.7%) | 273 (80.8%) |
| 18 to 24 Years | 878 (86.8%) | 798 (86.9%) |
| 25 to 34 Years | 1,390 (86.2%) | 1,180 (79.1%) |
| 35 to 44 Years | 1,367 (85.1%) | 1,277 (84.9%) |
| 45 to 54 Years | 1,378 (82.1%) | 1,425 (80.4%) |
| 55 to 64 Years | 1,922 (82.1%) | 1,890 (77.4%) |
| 65 to 74 Years | 1,774 (89.8%) | 1,750 (87.6%) |
| 75 Years and over | 1,093 (92.0%) | 1,488 (90.5%) |
| Total | 11,948 (84.8%) | 11,745 (82.2%) |
Income Below Poverty Among Married-Couple Families in Alpena County
The poverty statistics for married-couple families in Alpena County show that 4.3% or 242 of the total 5,605 families live below the poverty line. Families with 5 or more children have the highest poverty rate of 68.4%, comprising of 13 families. On the other hand, families with 1 or 2 children have the lowest poverty rate of 3.2%, which includes 37 families.
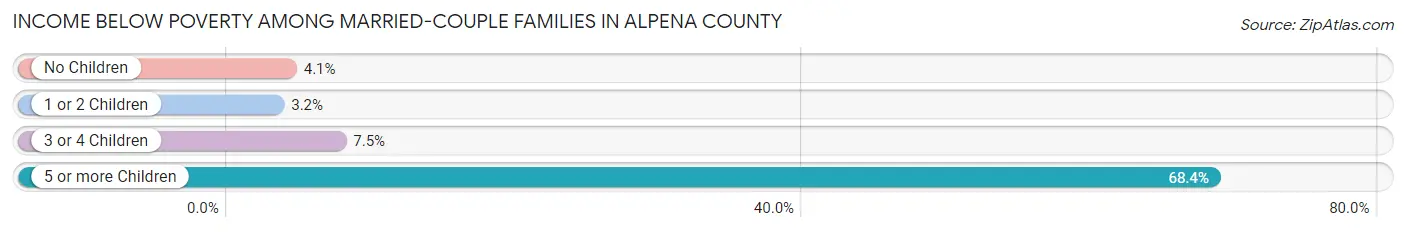
| Children | Above Poverty | Below Poverty |
| No Children | 3,963 (95.9%) | 169 (4.1%) |
| 1 or 2 Children | 1,112 (96.8%) | 37 (3.2%) |
| 3 or 4 Children | 282 (92.5%) | 23 (7.5%) |
| 5 or more Children | 6 (31.6%) | 13 (68.4%) |
| Total | 5,363 (95.7%) | 242 (4.3%) |
Income Below Poverty Among Single-Parent Households in Alpena County
According to the poverty data in Alpena County, 15.3% or 92 single-father households and 42.4% or 503 single-mother households are living below the poverty line. Among single-father households, those with 1 or 2 children have the highest poverty rate, with 59 households (16.0%) experiencing poverty. Likewise, among single-mother households, those with 1 or 2 children have the highest poverty rate, with 402 households (53.3%) falling below the poverty line.
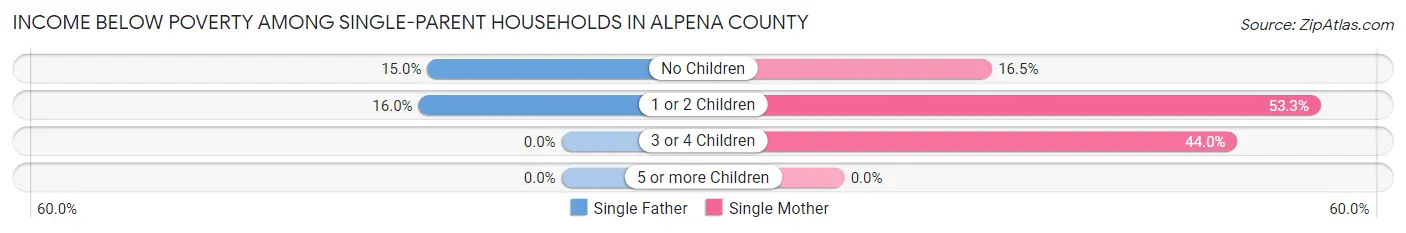
| Children | Single Father | Single Mother |
| No Children | 33 (15.0%) | 46 (16.5%) |
| 1 or 2 Children | 59 (16.0%) | 402 (53.3%) |
| 3 or 4 Children | 0 (0.0%) | 55 (44.0%) |
| 5 or more Children | 0 (0.0%) | 0 (0.0%) |
| Total | 92 (15.3%) | 503 (42.4%) |
Income Below Poverty Among Married-Couple vs Single-Parent Households in Alpena County
The poverty data for Alpena County shows that 242 of the married-couple family households (4.3%) and 595 of the single-parent households (33.3%) are living below the poverty level. Within the married-couple family households, those with 5 or more children have the highest poverty rate, with 13 households (68.4%) falling below the poverty line. Among the single-parent households, those with 1 or 2 children have the highest poverty rate, with 461 household (41.0%) living below poverty.
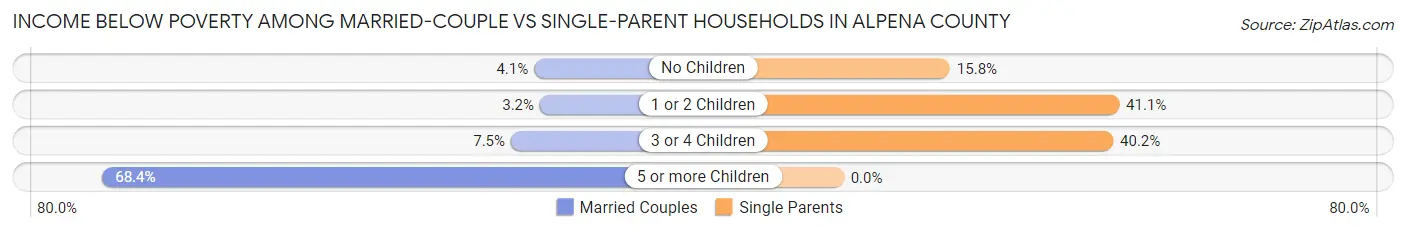
| Children | Married-Couple Families | Single-Parent Households |
| No Children | 169 (4.1%) | 79 (15.8%) |
| 1 or 2 Children | 37 (3.2%) | 461 (41.0%) |
| 3 or 4 Children | 23 (7.5%) | 55 (40.2%) |
| 5 or more Children | 13 (68.4%) | 0 (0.0%) |
| Total | 242 (4.3%) | 595 (33.3%) |
Race in Alpena County
The most populous races in Alpena County are White / Caucasian (27,419 | 94.8%), Two or more Races (988 | 3.4%), and Hispanic or Latino (442 | 1.5%).
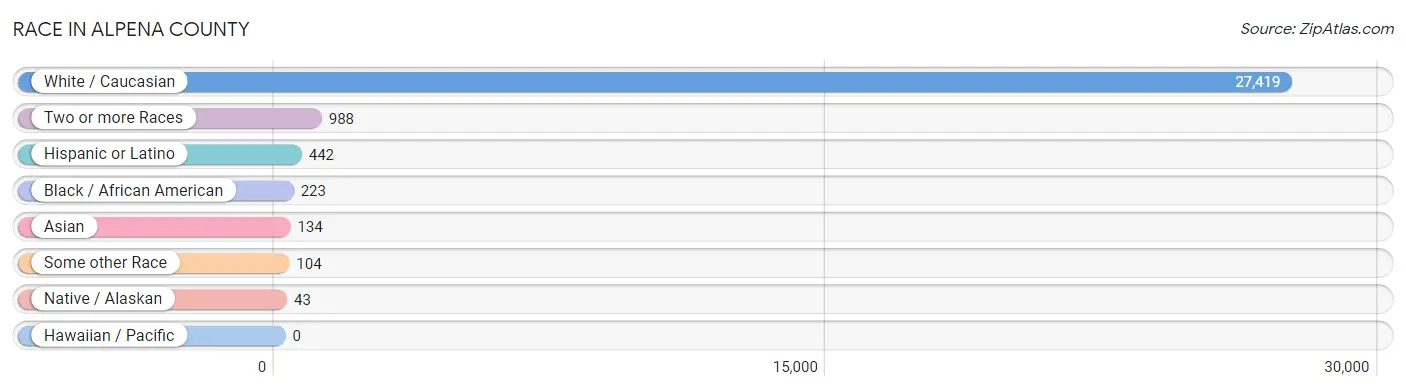
| Race | # Population | % Population |
| Asian | 134 | 0.5% |
| Black / African American | 223 | 0.8% |
| Hawaiian / Pacific | 0 | 0.0% |
| Hispanic or Latino | 442 | 1.5% |
| Native / Alaskan | 43 | 0.2% |
| White / Caucasian | 27,419 | 94.8% |
| Two or more Races | 988 | 3.4% |
| Some other Race | 104 | 0.4% |
| Total | 28,911 | 100.0% |
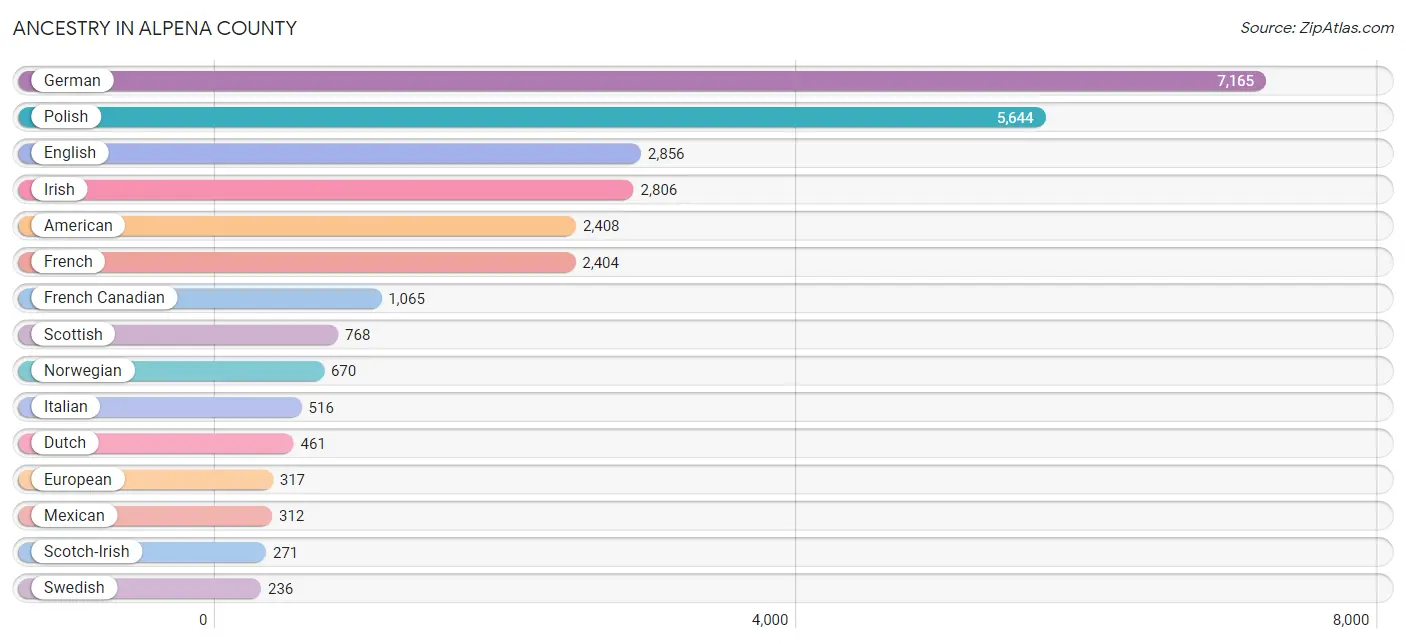
Ancestry in Alpena County
The most populous ancestries reported in Alpena County are German (7,165 | 24.8%), Polish (5,644 | 19.5%), English (2,856 | 9.9%), Irish (2,806 | 9.7%), and American (2,408 | 8.3%), together accounting for 72.2% of all Alpena County residents.
| Ancestry | # Population | % Population |
| African | 19 | 0.1% |
| American | 2,408 | 8.3% |
| Apache | 1 | 0.0% |
| Arab | 37 | 0.1% |
| Armenian | 4 | 0.0% |
| Australian | 2 | 0.0% |
| Austrian | 27 | 0.1% |
| Belgian | 34 | 0.1% |
| Bhutanese | 5 | 0.0% |
| British | 87 | 0.3% |
| Burmese | 41 | 0.1% |
| Canadian | 82 | 0.3% |
| Central American | 4 | 0.0% |
| Cherokee | 28 | 0.1% |
| Chippewa | 44 | 0.2% |
| Choctaw | 12 | 0.0% |
| Colombian | 4 | 0.0% |
| Cree | 13 | 0.0% |
| Croatian | 7 | 0.0% |
| Czech | 10 | 0.0% |
| Czechoslovakian | 24 | 0.1% |
| Danish | 113 | 0.4% |
| Dutch | 461 | 1.6% |
| Eastern European | 32 | 0.1% |
| Ecuadorian | 12 | 0.0% |
| English | 2,856 | 9.9% |
| European | 317 | 1.1% |
| Finnish | 108 | 0.4% |
| French | 2,404 | 8.3% |
| French American Indian | 38 | 0.1% |
| French Canadian | 1,065 | 3.7% |
| German | 7,165 | 24.8% |
| Greek | 24 | 0.1% |
| Guatemalan | 4 | 0.0% |
| Hungarian | 159 | 0.5% |
| Indian (Asian) | 1 | 0.0% |
| Irish | 2,806 | 9.7% |
| Italian | 516 | 1.8% |
| Japanese | 3 | 0.0% |
| Korean | 89 | 0.3% |
| Lebanese | 37 | 0.1% |
| Lithuanian | 44 | 0.2% |
| Maltese | 7 | 0.0% |
| Mexican | 312 | 1.1% |
| Mexican American Indian | 66 | 0.2% |
| Native Hawaiian | 19 | 0.1% |
| Nigerian | 1 | 0.0% |
| Northern European | 49 | 0.2% |
| Norwegian | 670 | 2.3% |
| Ottawa | 17 | 0.1% |
| Pennsylvania German | 12 | 0.0% |
| Polish | 5,644 | 19.5% |
| Portuguese | 36 | 0.1% |
| Potawatomi | 16 | 0.1% |
| Puerto Rican | 90 | 0.3% |
| Romanian | 105 | 0.4% |
| Russian | 208 | 0.7% |
| Scandinavian | 101 | 0.4% |
| Scotch-Irish | 271 | 0.9% |
| Scottish | 768 | 2.7% |
| Serbian | 6 | 0.0% |
| Slavic | 2 | 0.0% |
| Slovak | 20 | 0.1% |
| Slovene | 17 | 0.1% |
| South American | 16 | 0.1% |
| Subsaharan African | 23 | 0.1% |
| Swedish | 236 | 0.8% |
| Swiss | 87 | 0.3% |
| Syrian | 7 | 0.0% |
| Thai | 22 | 0.1% |
| Tlingit-Haida | 6 | 0.0% |
| Turkish | 8 | 0.0% |
| Ukrainian | 58 | 0.2% |
| Vietnamese | 7 | 0.0% |
| Welsh | 74 | 0.3% | View All 75 Rows |
Immigrants in Alpena County
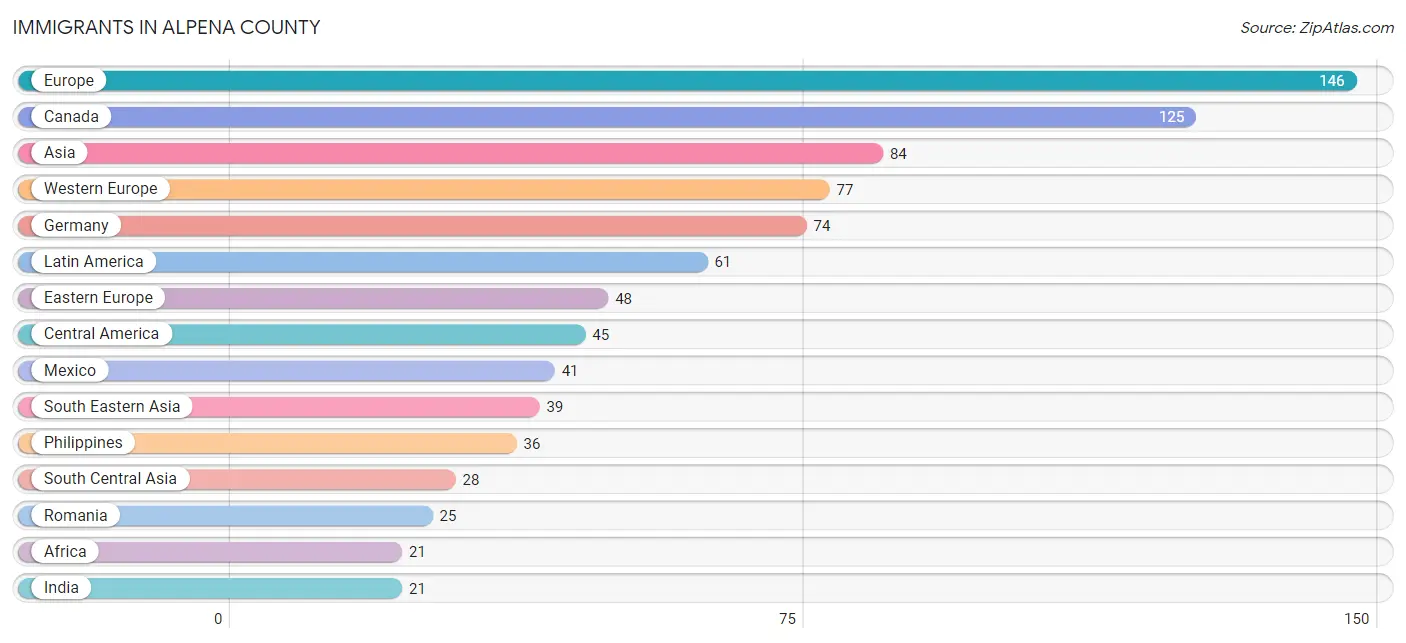
The most numerous immigrant groups reported in Alpena County came from Europe (146 | 0.5%), Canada (125 | 0.4%), Asia (84 | 0.3%), Western Europe (77 | 0.3%), and Germany (74 | 0.3%), together accounting for 1.8% of all Alpena County residents.
| Immigration Origin | # Population | % Population |
| Africa | 21 | 0.1% |
| Asia | 84 | 0.3% |
| Bangladesh | 7 | 0.0% |
| Cambodia | 3 | 0.0% |
| Canada | 125 | 0.4% |
| Caribbean | 4 | 0.0% |
| Central America | 45 | 0.2% |
| Eastern Africa | 10 | 0.0% |
| Eastern Asia | 17 | 0.1% |
| Eastern Europe | 48 | 0.2% |
| Ecuador | 12 | 0.0% |
| Ethiopia | 1 | 0.0% |
| Europe | 146 | 0.5% |
| Germany | 74 | 0.3% |
| Guatemala | 4 | 0.0% |
| India | 21 | 0.1% |
| Jamaica | 4 | 0.0% |
| Korea | 17 | 0.1% |
| Latin America | 61 | 0.2% |
| Lithuania | 9 | 0.0% |
| Mexico | 41 | 0.1% |
| Netherlands | 3 | 0.0% |
| Nigeria | 11 | 0.0% |
| Northern Europe | 21 | 0.1% |
| Philippines | 36 | 0.1% |
| Poland | 4 | 0.0% |
| Romania | 25 | 0.1% |
| Russia | 10 | 0.0% |
| Scotland | 21 | 0.1% |
| South America | 12 | 0.0% |
| South Central Asia | 28 | 0.1% |
| South Eastern Asia | 39 | 0.1% |
| Western Africa | 11 | 0.0% |
| Western Europe | 77 | 0.3% | View All 34 Rows |
Sex and Age in Alpena County
Sex and Age in Alpena County
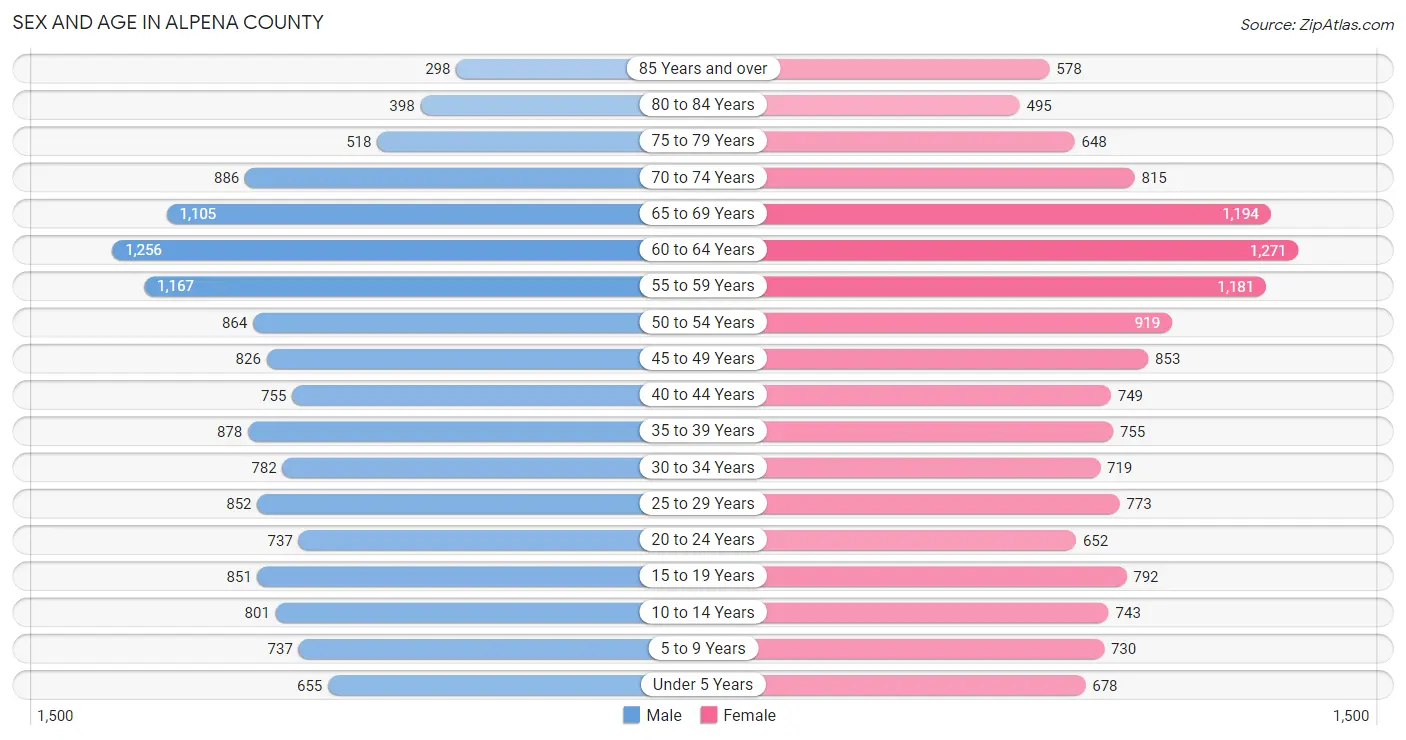
The most populous age groups in Alpena County are 60 to 64 Years (1,256 | 8.7%) for men and 60 to 64 Years (1,271 | 8.7%) for women.
| Age Bracket | Male | Female |
| Under 5 Years | 655 (4.6%) | 678 (4.7%) |
| 5 to 9 Years | 737 (5.1%) | 730 (5.0%) |
| 10 to 14 Years | 801 (5.6%) | 743 (5.1%) |
| 15 to 19 Years | 851 (5.9%) | 792 (5.4%) |
| 20 to 24 Years | 737 (5.1%) | 652 (4.5%) |
| 25 to 29 Years | 852 (5.9%) | 773 (5.3%) |
| 30 to 34 Years | 782 (5.4%) | 719 (4.9%) |
| 35 to 39 Years | 878 (6.1%) | 755 (5.2%) |
| 40 to 44 Years | 755 (5.3%) | 749 (5.1%) |
| 45 to 49 Years | 826 (5.8%) | 853 (5.9%) |
| 50 to 54 Years | 864 (6.0%) | 919 (6.3%) |
| 55 to 59 Years | 1,167 (8.1%) | 1,181 (8.1%) |
| 60 to 64 Years | 1,256 (8.7%) | 1,271 (8.7%) |
| 65 to 69 Years | 1,105 (7.7%) | 1,194 (8.2%) |
| 70 to 74 Years | 886 (6.2%) | 815 (5.6%) |
| 75 to 79 Years | 518 (3.6%) | 648 (4.5%) |
| 80 to 84 Years | 398 (2.8%) | 495 (3.4%) |
| 85 Years and over | 298 (2.1%) | 578 (4.0%) |
| Total | 14,366 (100.0%) | 14,545 (100.0%) |
Families and Households in Alpena County
Median Family Size in Alpena County
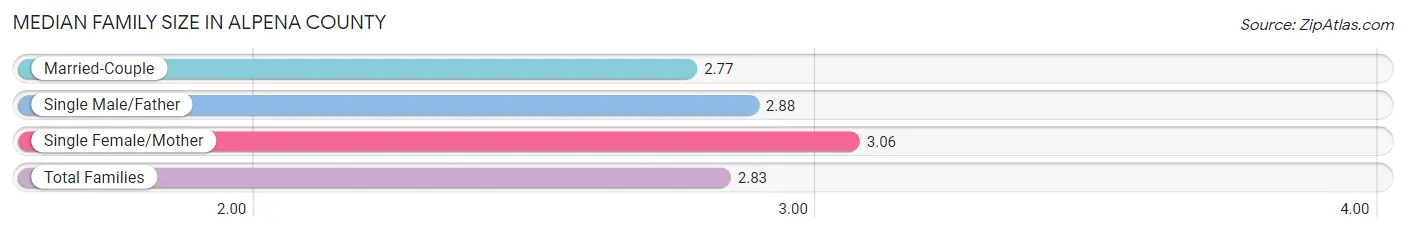
The median family size in Alpena County is 2.83 persons per family, with single female/mother families (1,187 | 16.1%) accounting for the largest median family size of 3.06 persons per family. On the other hand, married-couple families (5,605 | 75.8%) represent the smallest median family size with 2.77 persons per family.
| Family Type | # Families | Family Size |
| Married-Couple | 5,605 (75.8%) | 2.77 |
| Single Male/Father | 601 (8.1%) | 2.88 |
| Single Female/Mother | 1,187 (16.1%) | 3.06 |
| Total Families | 7,393 (100.0%) | 2.83 |
Median Household Size in Alpena County
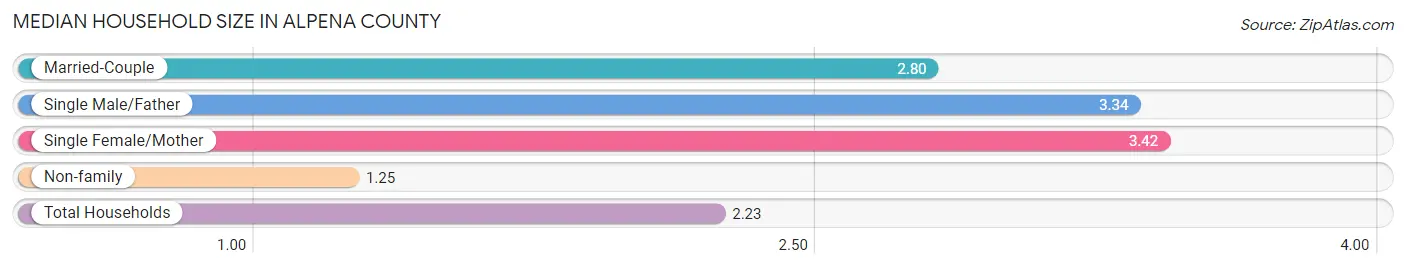
The median household size in Alpena County is 2.23 persons per household, with single female/mother households (1,187 | 9.3%) accounting for the largest median household size of 3.42 persons per household. non-family households (5,328 | 41.9%) represent the smallest median household size with 1.25 persons per household.
| Household Type | # Households | Household Size |
| Married-Couple | 5,605 (44.1%) | 2.80 |
| Single Male/Father | 601 (4.7%) | 3.34 |
| Single Female/Mother | 1,187 (9.3%) | 3.42 |
| Non-family | 5,328 (41.9%) | 1.25 |
| Total Households | 12,721 (100.0%) | 2.23 |
Household Size by Marriage Status in Alpena County
Out of a total of 12,721 households in Alpena County, 7,393 (58.1%) are family households, while 5,328 (41.9%) are nonfamily households. The most numerous type of family households are 2-person households, comprising 4,198, and the most common type of nonfamily households are 1-person households, comprising 4,349.
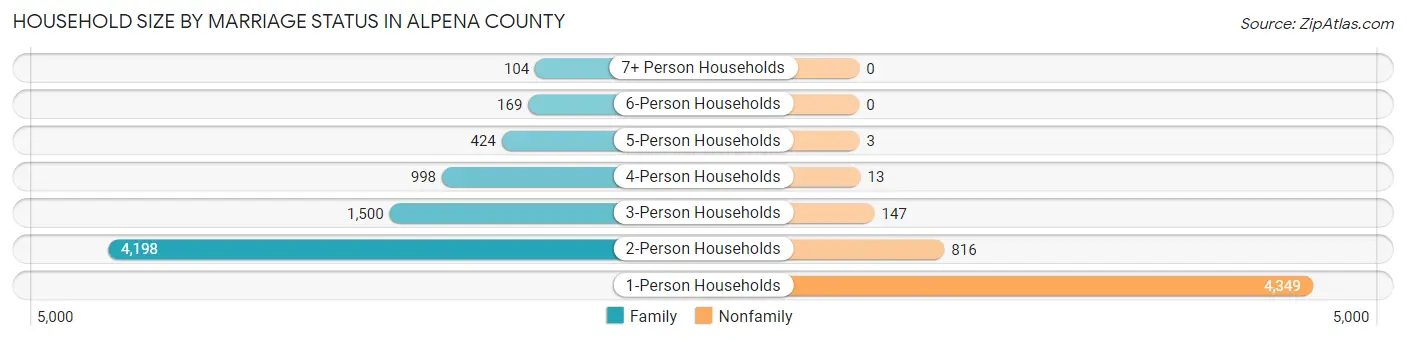
| Household Size | Family Households | Nonfamily Households |
| 1-Person Households | - | 4,349 (34.2%) |
| 2-Person Households | 4,198 (33.0%) | 816 (6.4%) |
| 3-Person Households | 1,500 (11.8%) | 147 (1.2%) |
| 4-Person Households | 998 (7.9%) | 13 (0.1%) |
| 5-Person Households | 424 (3.3%) | 3 (0.0%) |
| 6-Person Households | 169 (1.3%) | 0 (0.0%) |
| 7+ Person Households | 104 (0.8%) | 0 (0.0%) |
| Total | 7,393 (58.1%) | 5,328 (41.9%) |
Female Fertility in Alpena County
Fertility by Age in Alpena County
Average fertility rate in Alpena County is 43.0 births per 1,000 women. Women in the age bracket of 20 to 34 years have the highest fertility rate with 77.0 births per 1,000 women. Women in the age bracket of 20 to 34 years acount for 70.6% of all women with births.
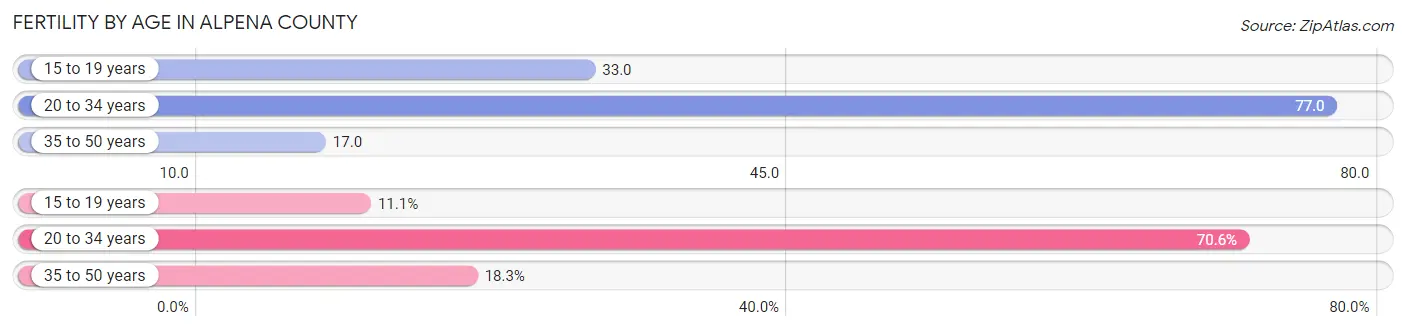
| Age Bracket | Women with Births | Births / 1,000 Women |
| 15 to 19 years | 26 (11.1%) | 33.0 |
| 20 to 34 years | 166 (70.6%) | 77.0 |
| 35 to 50 years | 43 (18.3%) | 17.0 |
| Total | 235 (100.0%) | 43.0 |
Fertility by Age by Marriage Status in Alpena County
69.4% of women with births (235) in Alpena County are married. The highest percentage of unmarried women with births falls into 20 to 34 years age bracket with 38.6% of them unmarried at the time of birth, while the lowest percentage of unmarried women with births belong to 15 to 19 years age bracket with 0.0% of them unmarried.
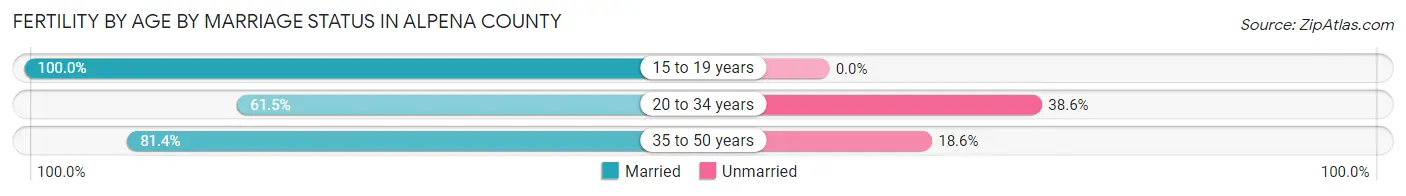
| Age Bracket | Married | Unmarried |
| 15 to 19 years | 26 (100.0%) | 0 (0.0%) |
| 20 to 34 years | 102 (61.5%) | 64 (38.6%) |
| 35 to 50 years | 35 (81.4%) | 8 (18.6%) |
| Total | 163 (69.4%) | 72 (30.6%) |
Fertility by Education in Alpena County
Average fertility rate in Alpena County is 43.0 births per 1,000 women. Women with the education attainment of graduate degree have the highest fertility rate of 73.0 births per 1,000 women, while women with the education attainment of less than high school have the lowest fertility at 2.0 births per 1,000 women. Women with the education attainment of college or associate's degree represent 48.9% of all women with births.
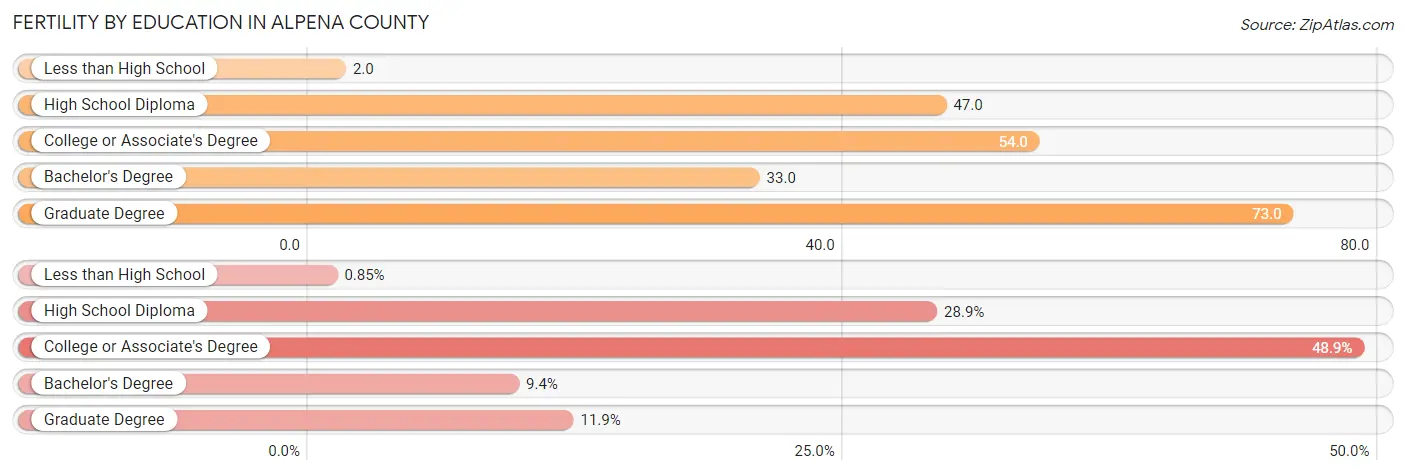
| Educational Attainment | Women with Births | Births / 1,000 Women |
| Less than High School | 2 (0.9%) | 2.0 |
| High School Diploma | 68 (28.9%) | 47.0 |
| College or Associate's Degree | 115 (48.9%) | 54.0 |
| Bachelor's Degree | 22 (9.4%) | 33.0 |
| Graduate Degree | 28 (11.9%) | 73.0 |
| Total | 235 (100.0%) | 43.0 |
Fertility by Education by Marriage Status in Alpena County
30.6% of women with births in Alpena County are unmarried. Women with the educational attainment of high school diploma are most likely to be married with 89.7% of them married at childbirth, while women with the educational attainment of less than high school are least likely to be married with 100.0% of them unmarried at childbirth.
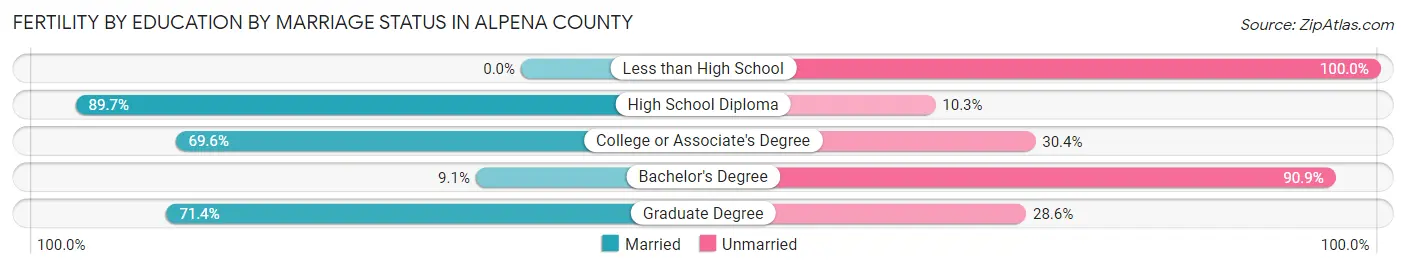
| Educational Attainment | Married | Unmarried |
| Less than High School | 0 (0.0%) | 2 (100.0%) |
| High School Diploma | 61 (89.7%) | 7 (10.3%) |
| College or Associate's Degree | 80 (69.6%) | 35 (30.4%) |
| Bachelor's Degree | 2 (9.1%) | 20 (90.9%) |
| Graduate Degree | 20 (71.4%) | 8 (28.6%) |
| Total | 163 (69.4%) | 72 (30.6%) |
Employment Characteristics in Alpena County
Employment by Class of Employer in Alpena County
Among the 11,893 employed individuals in Alpena County, private company employees (8,406 | 70.7%), not-for-profit organizations (1,409 | 11.8%), and self-employed (not incorporated) (627 | 5.3%) make up the most common classes of employment.
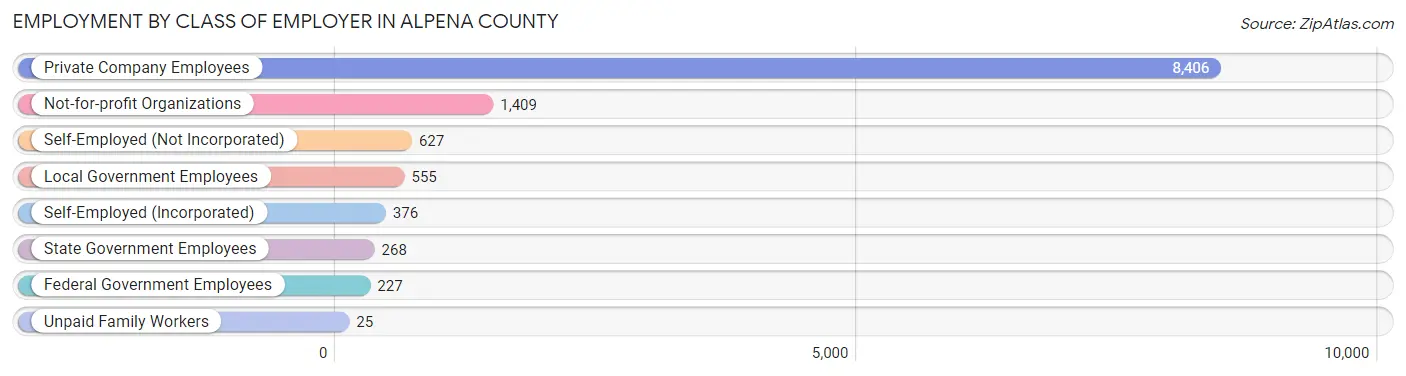
| Employer Class | # Employees | % Employees |
| Private Company Employees | 8,406 | 70.7% |
| Self-Employed (Incorporated) | 376 | 3.2% |
| Self-Employed (Not Incorporated) | 627 | 5.3% |
| Not-for-profit Organizations | 1,409 | 11.8% |
| Local Government Employees | 555 | 4.7% |
| State Government Employees | 268 | 2.2% |
| Federal Government Employees | 227 | 1.9% |
| Unpaid Family Workers | 25 | 0.2% |
| Total | 11,893 | 100.0% |
Employment Status by Age in Alpena County
According to the labor force statistics for Alpena County, out of the total population over 16 years of age (24,201), 54.6% or 13,214 individuals are in the labor force, with 7.4% or 978 of them unemployed. The age group with the highest labor force participation rate is 25 to 29 years, with 89.6% or 1,456 individuals in the labor force. Within the labor force, the 16 to 19 years age range has the highest percentage of unemployed individuals, with 13.7% or 105 of them being unemployed.
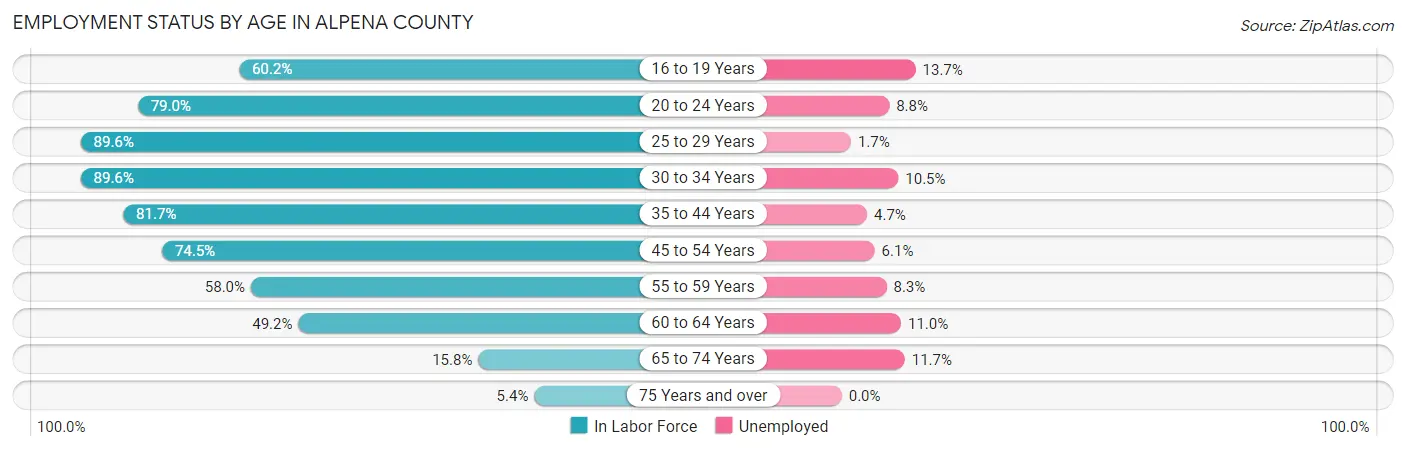
| Age Bracket | In Labor Force | Unemployed |
| 16 to 19 Years | 769 (60.2%) | 105 (13.7%) |
| 20 to 24 Years | 1,097 (79.0%) | 97 (8.8%) |
| 25 to 29 Years | 1,456 (89.6%) | 25 (1.7%) |
| 30 to 34 Years | 1,345 (89.6%) | 141 (10.5%) |
| 35 to 44 Years | 2,563 (81.7%) | 120 (4.7%) |
| 45 to 54 Years | 2,579 (74.5%) | 157 (6.1%) |
| 55 to 59 Years | 1,362 (58.0%) | 113 (8.3%) |
| 60 to 64 Years | 1,243 (49.2%) | 137 (11.0%) |
| 65 to 74 Years | 632 (15.8%) | 74 (11.7%) |
| 75 Years and over | 158 (5.4%) | 0 (0.0%) |
| Total | 13,214 (54.6%) | 978 (7.4%) |
Employment Status by Educational Attainment in Alpena County
According to labor force statistics for Alpena County, 72.3% of individuals (10,556) out of the total population between 25 and 64 years of age (14,600) are in the labor force, with 6.6% or 697 of them being unemployed. The group with the highest labor force participation rate are those with the educational attainment of bachelor's degree or higher, with 85.4% or 2,232 individuals in the labor force. Within the labor force, individuals with high school diploma education have the highest percentage of unemployment, with 10.3% or 349 of them being unemployed.
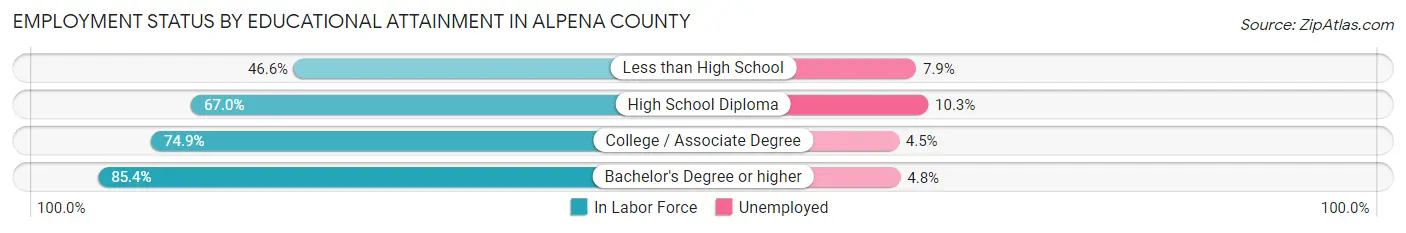
| Educational Attainment | In Labor Force | Unemployed |
| Less than High School | 431 (46.6%) | 73 (7.9%) |
| High School Diploma | 3,393 (67.0%) | 522 (10.3%) |
| College / Associate Degree | 4,493 (74.9%) | 270 (4.5%) |
| Bachelor's Degree or higher | 2,232 (85.4%) | 125 (4.8%) |
| Total | 10,556 (72.3%) | 964 (6.6%) |
Employment Occupations by Sex in Alpena County
Management, Business, Science and Arts Occupations
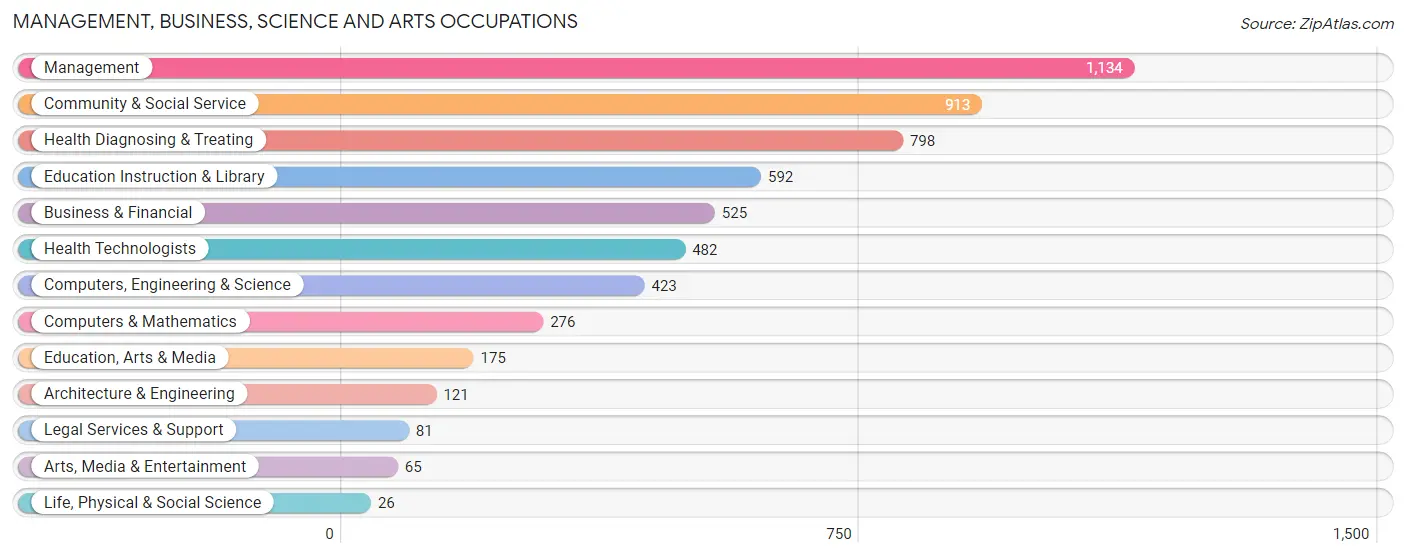
The most common Management, Business, Science and Arts occupations in Alpena County are Management (1,134 | 9.3%), Community & Social Service (913 | 7.5%), Health Diagnosing & Treating (798 | 6.6%), Education Instruction & Library (592 | 4.9%), and Business & Financial (525 | 4.3%).
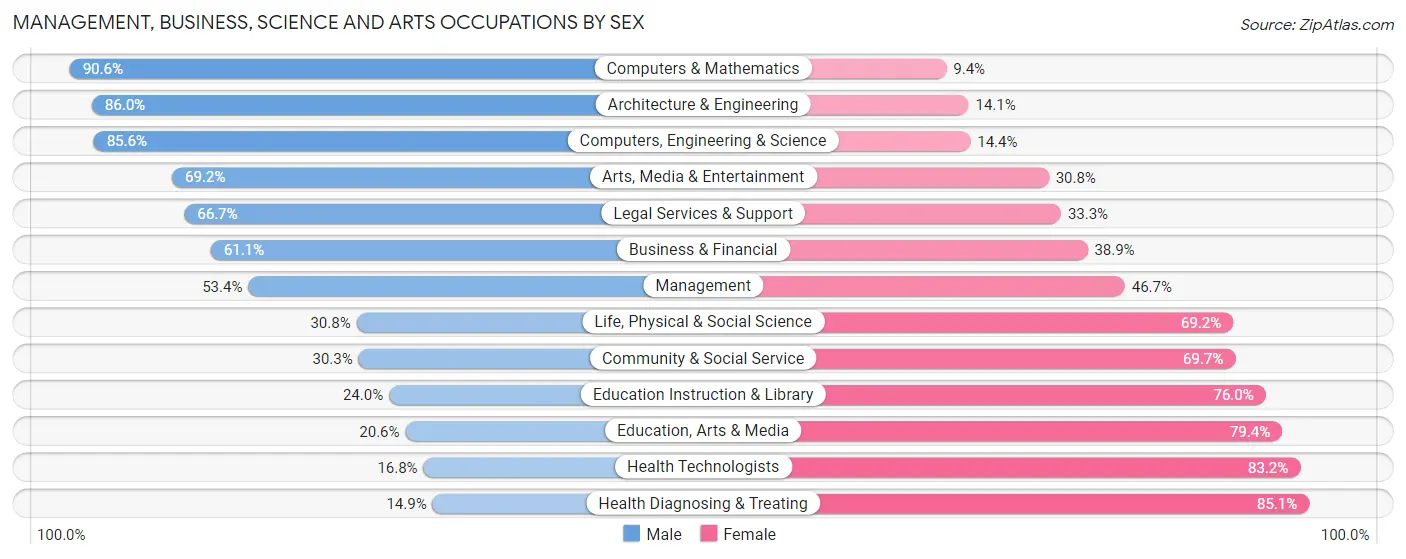
Management, Business, Science and Arts Occupations by Sex
Within the Management, Business, Science and Arts occupations in Alpena County, the most male-oriented occupations are Computers & Mathematics (90.6%), Architecture & Engineering (86.0%), and Computers, Engineering & Science (85.6%), while the most female-oriented occupations are Health Diagnosing & Treating (85.1%), Health Technologists (83.2%), and Education, Arts & Media (79.4%).
| Occupation | Male | Female |
| Management | 605 (53.3%) | 529 (46.7%) |
| Business & Financial | 321 (61.1%) | 204 (38.9%) |
| Computers, Engineering & Science | 362 (85.6%) | 61 (14.4%) |
| Computers & Mathematics | 250 (90.6%) | 26 (9.4%) |
| Architecture & Engineering | 104 (86.0%) | 17 (14.1%) |
| Life, Physical & Social Science | 8 (30.8%) | 18 (69.2%) |
| Community & Social Service | 277 (30.3%) | 636 (69.7%) |
| Education, Arts & Media | 36 (20.6%) | 139 (79.4%) |
| Legal Services & Support | 54 (66.7%) | 27 (33.3%) |
| Education Instruction & Library | 142 (24.0%) | 450 (76.0%) |
| Arts, Media & Entertainment | 45 (69.2%) | 20 (30.8%) |
| Health Diagnosing & Treating | 119 (14.9%) | 679 (85.1%) |
| Health Technologists | 81 (16.8%) | 401 (83.2%) |
| Total (Category) | 1,684 (44.4%) | 2,109 (55.6%) |
| Total (Overall) | 6,274 (51.5%) | 5,900 (48.5%) |
Services Occupations
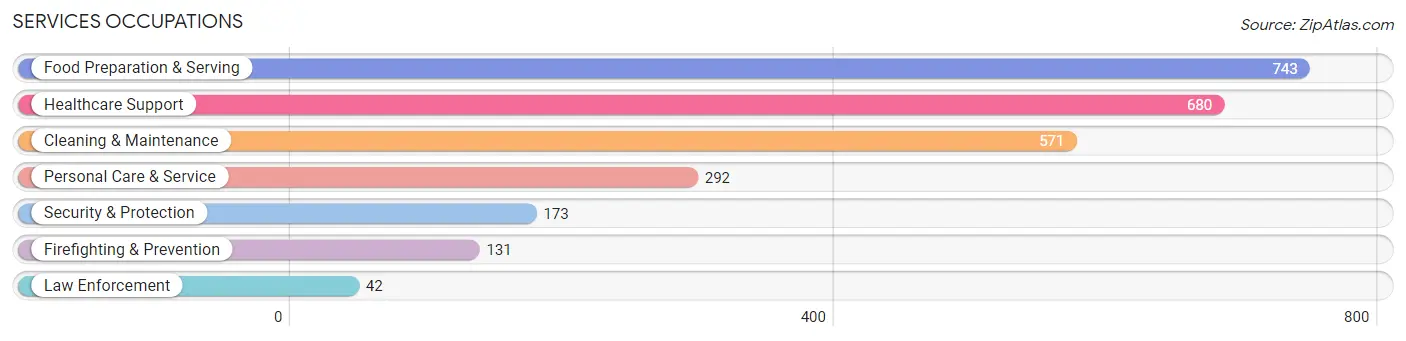
The most common Services occupations in Alpena County are Food Preparation & Serving (743 | 6.1%), Healthcare Support (680 | 5.6%), Cleaning & Maintenance (571 | 4.7%), Personal Care & Service (292 | 2.4%), and Security & Protection (173 | 1.4%).
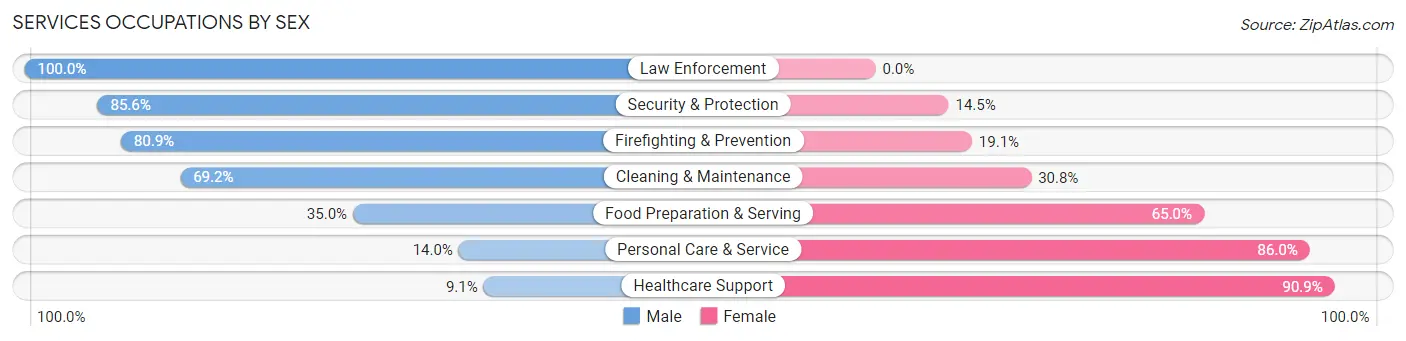
Services Occupations by Sex
Within the Services occupations in Alpena County, the most male-oriented occupations are Law Enforcement (100.0%), Security & Protection (85.6%), and Firefighting & Prevention (80.9%), while the most female-oriented occupations are Healthcare Support (90.9%), Personal Care & Service (86.0%), and Food Preparation & Serving (65.0%).
| Occupation | Male | Female |
| Healthcare Support | 62 (9.1%) | 618 (90.9%) |
| Security & Protection | 148 (85.6%) | 25 (14.4%) |
| Firefighting & Prevention | 106 (80.9%) | 25 (19.1%) |
| Law Enforcement | 42 (100.0%) | 0 (0.0%) |
| Food Preparation & Serving | 260 (35.0%) | 483 (65.0%) |
| Cleaning & Maintenance | 395 (69.2%) | 176 (30.8%) |
| Personal Care & Service | 41 (14.0%) | 251 (86.0%) |
| Total (Category) | 906 (36.8%) | 1,553 (63.2%) |
| Total (Overall) | 6,274 (51.5%) | 5,900 (48.5%) |
Sales and Office Occupations
The most common Sales and Office occupations in Alpena County are Office & Administration (1,494 | 12.3%), and Sales & Related (1,080 | 8.9%).
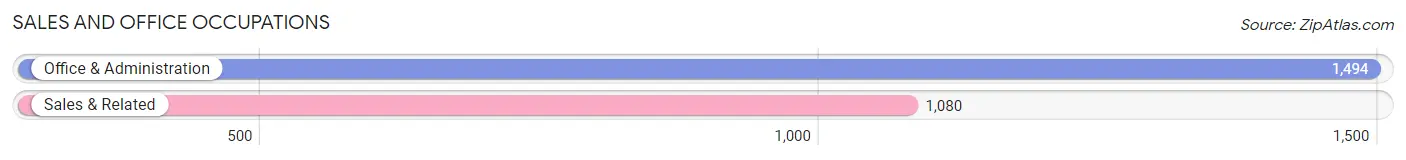
Sales and Office Occupations by Sex

| Occupation | Male | Female |
| Sales & Related | 467 (43.2%) | 613 (56.8%) |
| Office & Administration | 210 (14.1%) | 1,284 (85.9%) |
| Total (Category) | 677 (26.3%) | 1,897 (73.7%) |
| Total (Overall) | 6,274 (51.5%) | 5,900 (48.5%) |
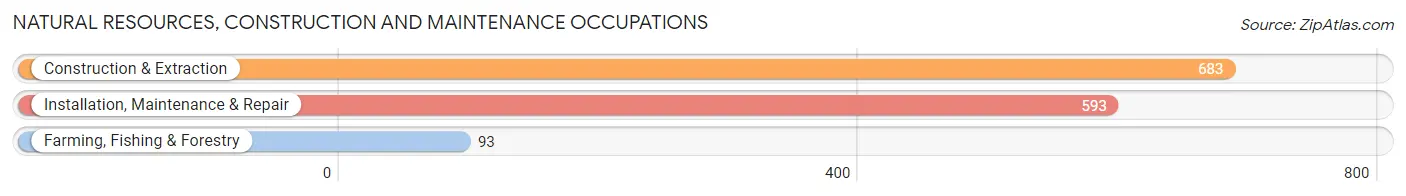
Natural Resources, Construction and Maintenance Occupations
The most common Natural Resources, Construction and Maintenance occupations in Alpena County are Construction & Extraction (683 | 5.6%), Installation, Maintenance & Repair (593 | 4.9%), and Farming, Fishing & Forestry (93 | 0.8%).
Natural Resources, Construction and Maintenance Occupations by Sex
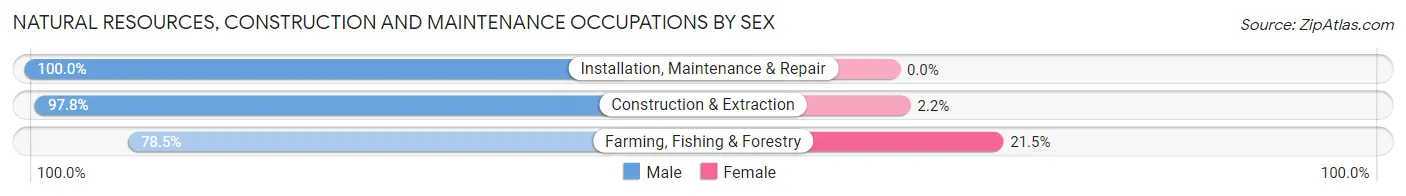
| Occupation | Male | Female |
| Farming, Fishing & Forestry | 73 (78.5%) | 20 (21.5%) |
| Construction & Extraction | 668 (97.8%) | 15 (2.2%) |
| Installation, Maintenance & Repair | 593 (100.0%) | 0 (0.0%) |
| Total (Category) | 1,334 (97.4%) | 35 (2.6%) |
| Total (Overall) | 6,274 (51.5%) | 5,900 (48.5%) |
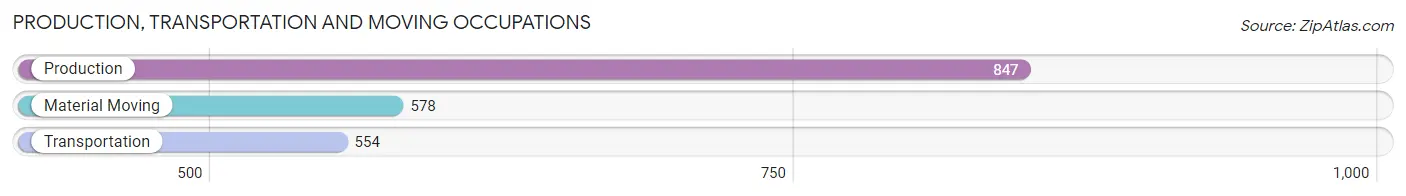
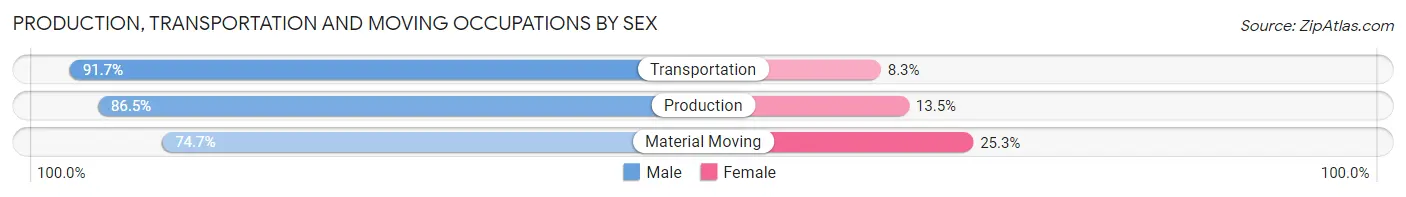
Production, Transportation and Moving Occupations
The most common Production, Transportation and Moving occupations in Alpena County are Production (847 | 7.0%), Material Moving (578 | 4.8%), and Transportation (554 | 4.5%).
Production, Transportation and Moving Occupations by Sex
| Occupation | Male | Female |
| Production | 733 (86.5%) | 114 (13.5%) |
| Transportation | 508 (91.7%) | 46 (8.3%) |
| Material Moving | 432 (74.7%) | 146 (25.3%) |
| Total (Category) | 1,673 (84.5%) | 306 (15.5%) |
| Total (Overall) | 6,274 (51.5%) | 5,900 (48.5%) |
Employment Industries by Sex in Alpena County
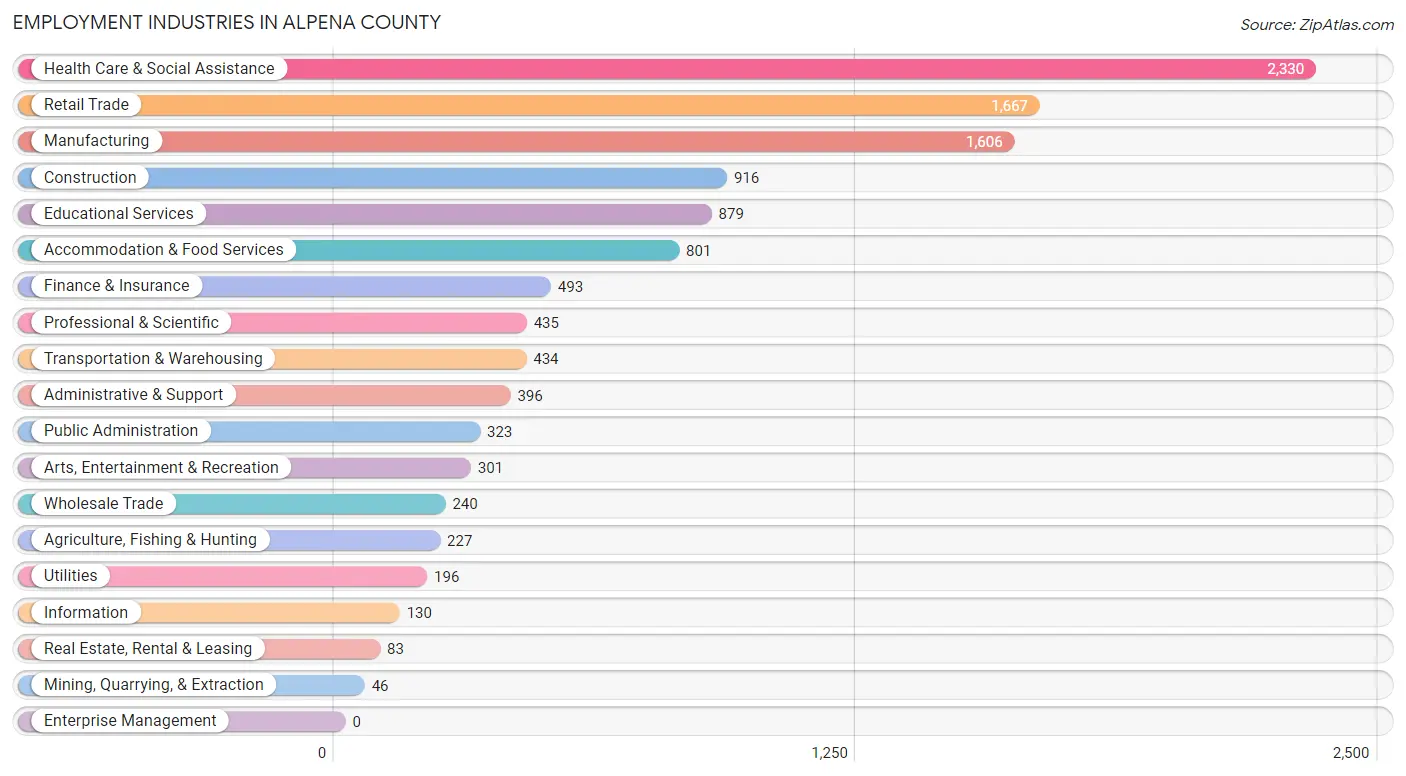
Employment Industries in Alpena County
The major employment industries in Alpena County include Health Care & Social Assistance (2,330 | 19.1%), Retail Trade (1,667 | 13.7%), Manufacturing (1,606 | 13.2%), Construction (916 | 7.5%), and Educational Services (879 | 7.2%).
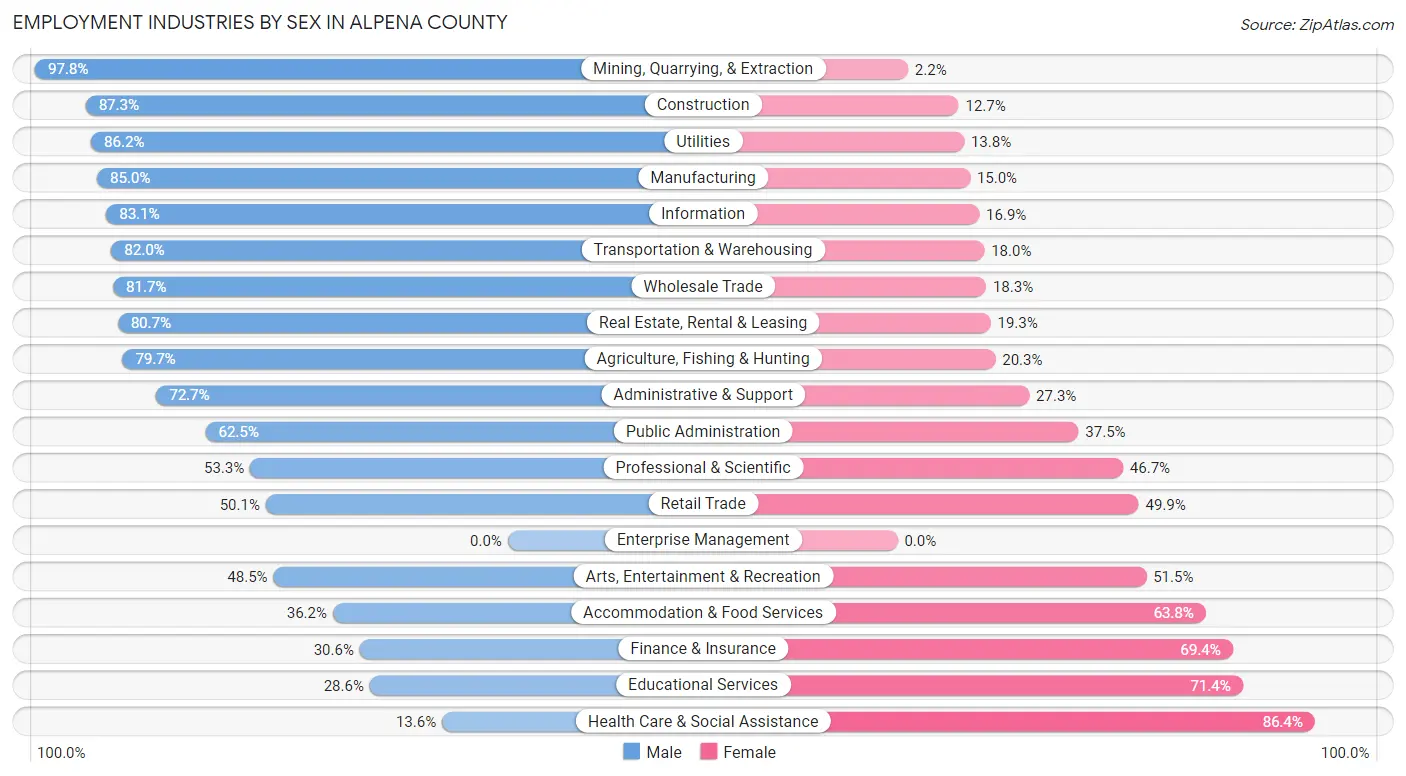
Employment Industries by Sex in Alpena County
The Alpena County industries that see more men than women are Mining, Quarrying, & Extraction (97.8%), Construction (87.3%), and Utilities (86.2%), whereas the industries that tend to have a higher number of women are Health Care & Social Assistance (86.4%), Educational Services (71.4%), and Finance & Insurance (69.4%).
| Industry | Male | Female |
| Agriculture, Fishing & Hunting | 181 (79.7%) | 46 (20.3%) |
| Mining, Quarrying, & Extraction | 45 (97.8%) | 1 (2.2%) |
| Construction | 800 (87.3%) | 116 (12.7%) |
| Manufacturing | 1,365 (85.0%) | 241 (15.0%) |
| Wholesale Trade | 196 (81.7%) | 44 (18.3%) |
| Retail Trade | 835 (50.1%) | 832 (49.9%) |
| Transportation & Warehousing | 356 (82.0%) | 78 (18.0%) |
| Utilities | 169 (86.2%) | 27 (13.8%) |
| Information | 108 (83.1%) | 22 (16.9%) |
| Finance & Insurance | 151 (30.6%) | 342 (69.4%) |
| Real Estate, Rental & Leasing | 67 (80.7%) | 16 (19.3%) |
| Professional & Scientific | 232 (53.3%) | 203 (46.7%) |
| Enterprise Management | 0 (0.0%) | 0 (0.0%) |
| Administrative & Support | 288 (72.7%) | 108 (27.3%) |
| Educational Services | 251 (28.6%) | 628 (71.4%) |
| Health Care & Social Assistance | 317 (13.6%) | 2,013 (86.4%) |
| Arts, Entertainment & Recreation | 146 (48.5%) | 155 (51.5%) |
| Accommodation & Food Services | 290 (36.2%) | 511 (63.8%) |
| Public Administration | 202 (62.5%) | 121 (37.5%) |
| Total | 6,274 (51.5%) | 5,900 (48.5%) |
Education in Alpena County
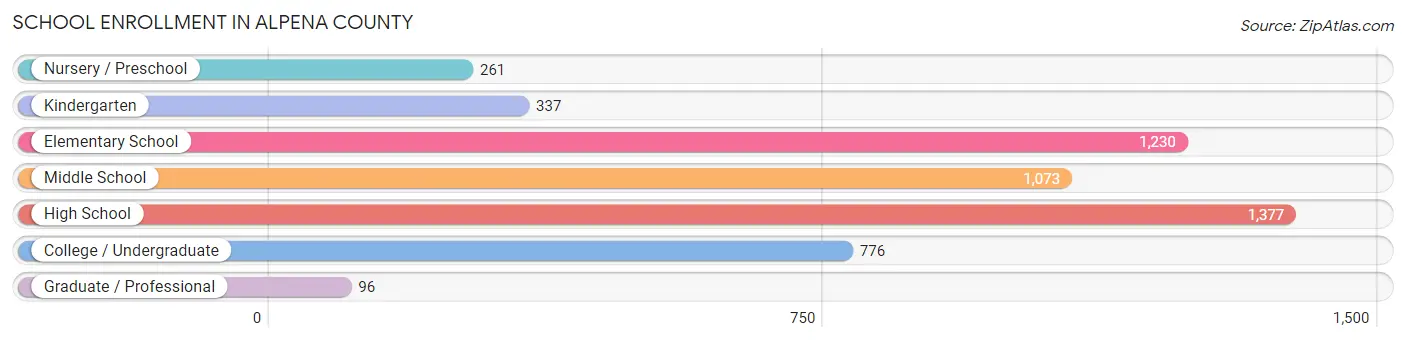
School Enrollment in Alpena County
The most common levels of schooling among the 5,150 students in Alpena County are high school (1,377 | 26.7%), elementary school (1,230 | 23.9%), and middle school (1,073 | 20.8%).
| School Level | # Students | % Students |
| Nursery / Preschool | 261 | 5.1% |
| Kindergarten | 337 | 6.5% |
| Elementary School | 1,230 | 23.9% |
| Middle School | 1,073 | 20.8% |
| High School | 1,377 | 26.7% |
| College / Undergraduate | 776 | 15.1% |
| Graduate / Professional | 96 | 1.9% |
| Total | 5,150 | 100.0% |
School Enrollment by Age by Funding Source in Alpena County
Out of a total of 5,150 students who are enrolled in schools in Alpena County, 566 (11.0%) attend a private institution, while the remaining 4,584 (89.0%) are enrolled in public schools. The age group of 25 to 34 year olds has the highest likelihood of being enrolled in private schools, with 124 (49.4% in the age bracket) enrolled. Conversely, the age group of 10 to 14 year olds has the lowest likelihood of being enrolled in a private school, with 1,460 (97.5% in the age bracket) attending a public institution.
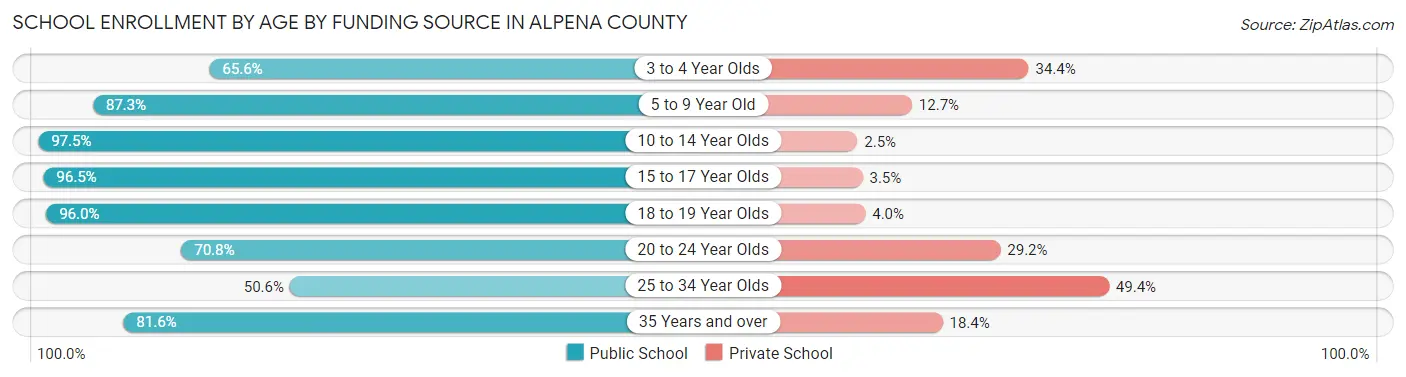
| Age Bracket | Public School | Private School |
| 3 to 4 Year Olds | 139 (65.6%) | 73 (34.4%) |
| 5 to 9 Year Old | 1,250 (87.3%) | 182 (12.7%) |
| 10 to 14 Year Olds | 1,460 (97.5%) | 38 (2.5%) |
| 15 to 17 Year Olds | 962 (96.5%) | 35 (3.5%) |
| 18 to 19 Year Olds | 286 (96.0%) | 12 (4.0%) |
| 20 to 24 Year Olds | 131 (70.8%) | 54 (29.2%) |
| 25 to 34 Year Olds | 127 (50.6%) | 124 (49.4%) |
| 35 Years and over | 226 (81.6%) | 51 (18.4%) |
| Total | 4,584 (89.0%) | 566 (11.0%) |
Educational Attainment by Field of Study in Alpena County
Business (793 | 20.0%), education (566 | 14.3%), science & technology (409 | 10.3%), arts & humanities (396 | 10.0%), and engineering (329 | 8.3%) are the most common fields of study among 3,970 individuals in Alpena County who have obtained a bachelor's degree or higher.
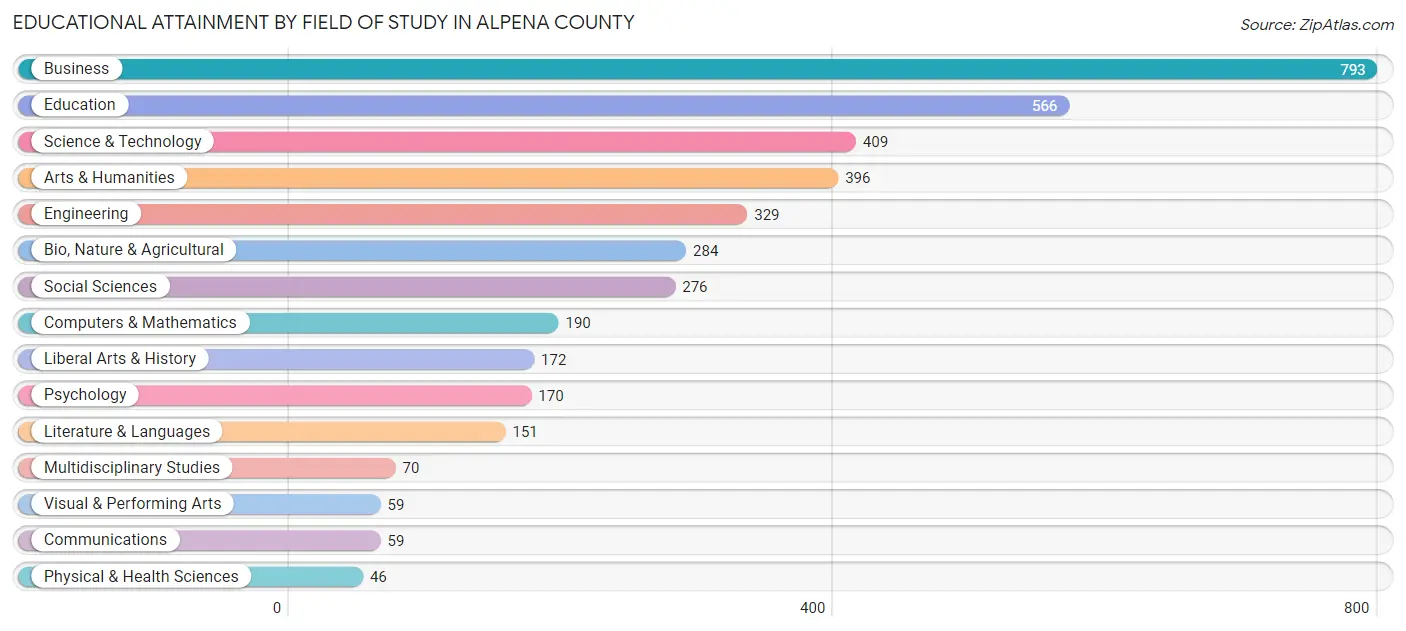
| Field of Study | # Graduates | % Graduates |
| Computers & Mathematics | 190 | 4.8% |
| Bio, Nature & Agricultural | 284 | 7.1% |
| Physical & Health Sciences | 46 | 1.2% |
| Psychology | 170 | 4.3% |
| Social Sciences | 276 | 7.0% |
| Engineering | 329 | 8.3% |
| Multidisciplinary Studies | 70 | 1.8% |
| Science & Technology | 409 | 10.3% |
| Business | 793 | 20.0% |
| Education | 566 | 14.3% |
| Literature & Languages | 151 | 3.8% |
| Liberal Arts & History | 172 | 4.3% |
| Visual & Performing Arts | 59 | 1.5% |
| Communications | 59 | 1.5% |
| Arts & Humanities | 396 | 10.0% |
| Total | 3,970 | 100.0% |
Transportation & Commute in Alpena County
Vehicle Availability by Sex in Alpena County
The most prevalent vehicle ownership categories in Alpena County are males with 2 vehicles (2,748, accounting for 44.6%) and females with 2 vehicles (2,478, making up 48.9%).
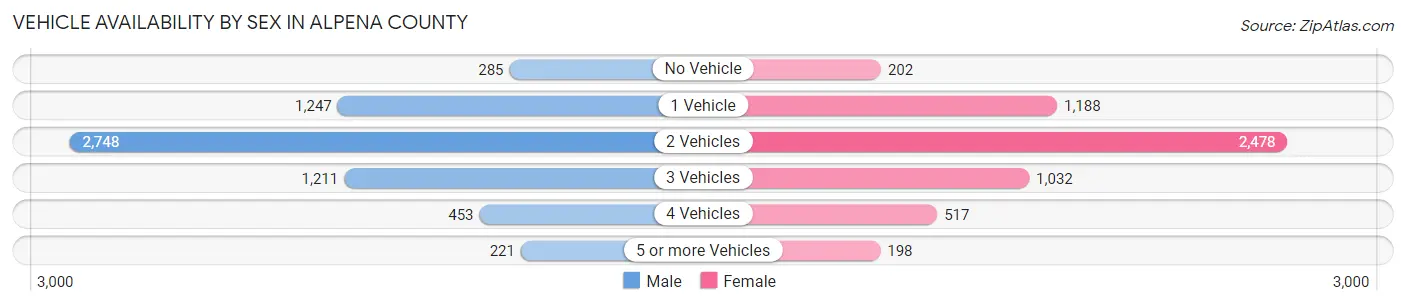
| Vehicles Available | Male | Female |
| No Vehicle | 285 (4.6%) | 202 (3.6%) |
| 1 Vehicle | 1,247 (20.2%) | 1,188 (21.2%) |
| 2 Vehicles | 2,748 (44.6%) | 2,478 (44.1%) |
| 3 Vehicles | 1,211 (19.6%) | 1,032 (18.4%) |
| 4 Vehicles | 453 (7.3%) | 517 (9.2%) |
| 5 or more Vehicles | 221 (3.6%) | 198 (3.5%) |
| Total | 6,165 (100.0%) | 5,615 (100.0%) |
Commute Time in Alpena County
The most frequently occuring commute durations in Alpena County are 5 to 9 minutes (2,443 commuters, 22.1%), 10 to 14 minutes (2,397 commuters, 21.7%), and 15 to 19 minutes (1,888 commuters, 17.1%).
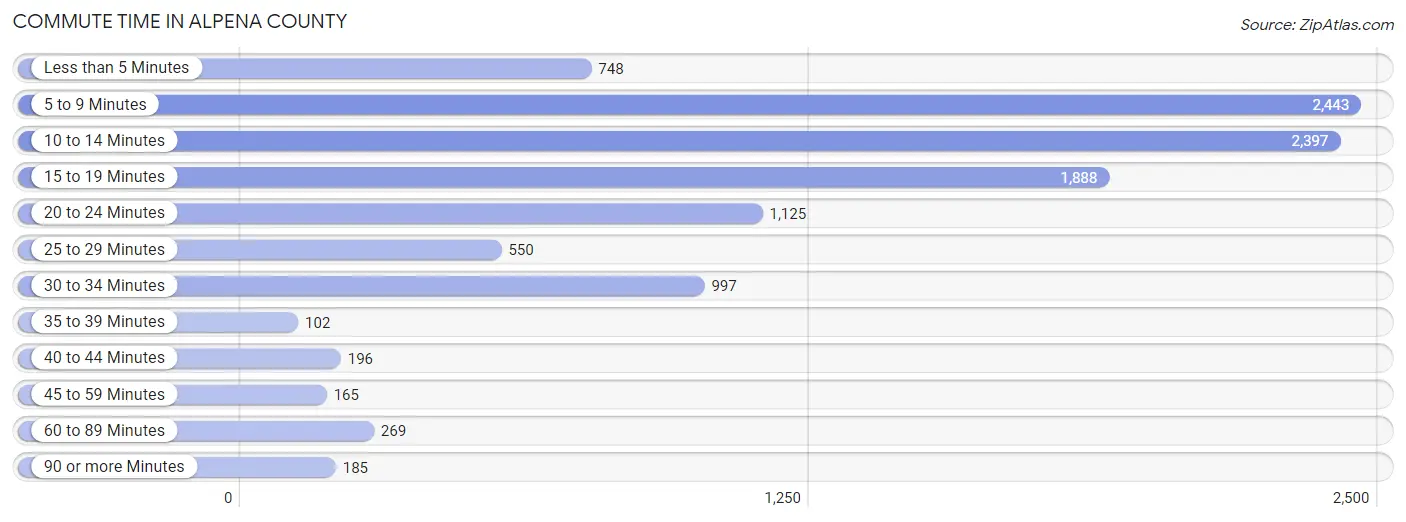
| Commute Time | # Commuters | % Commuters |
| Less than 5 Minutes | 748 | 6.8% |
| 5 to 9 Minutes | 2,443 | 22.1% |
| 10 to 14 Minutes | 2,397 | 21.7% |
| 15 to 19 Minutes | 1,888 | 17.1% |
| 20 to 24 Minutes | 1,125 | 10.2% |
| 25 to 29 Minutes | 550 | 5.0% |
| 30 to 34 Minutes | 997 | 9.0% |
| 35 to 39 Minutes | 102 | 0.9% |
| 40 to 44 Minutes | 196 | 1.8% |
| 45 to 59 Minutes | 165 | 1.5% |
| 60 to 89 Minutes | 269 | 2.4% |
| 90 or more Minutes | 185 | 1.7% |
Commute Time by Sex in Alpena County
The most common commute times in Alpena County are 10 to 14 minutes (1,269 commuters, 22.1%) for males and 5 to 9 minutes (1,269 commuters, 23.9%) for females.
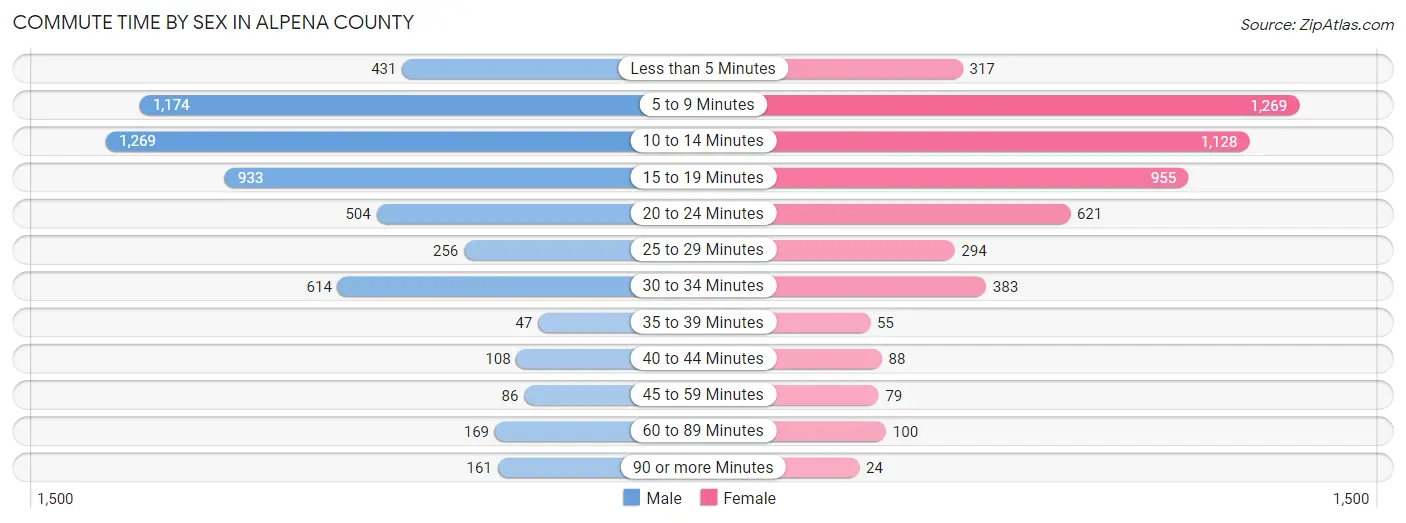
| Commute Time | Male | Female |
| Less than 5 Minutes | 431 (7.5%) | 317 (6.0%) |
| 5 to 9 Minutes | 1,174 (20.4%) | 1,269 (23.9%) |
| 10 to 14 Minutes | 1,269 (22.1%) | 1,128 (21.2%) |
| 15 to 19 Minutes | 933 (16.2%) | 955 (18.0%) |
| 20 to 24 Minutes | 504 (8.8%) | 621 (11.7%) |
| 25 to 29 Minutes | 256 (4.4%) | 294 (5.5%) |
| 30 to 34 Minutes | 614 (10.7%) | 383 (7.2%) |
| 35 to 39 Minutes | 47 (0.8%) | 55 (1.0%) |
| 40 to 44 Minutes | 108 (1.9%) | 88 (1.7%) |
| 45 to 59 Minutes | 86 (1.5%) | 79 (1.5%) |
| 60 to 89 Minutes | 169 (2.9%) | 100 (1.9%) |
| 90 or more Minutes | 161 (2.8%) | 24 (0.4%) |
Time of Departure to Work by Sex in Alpena County
The most frequent times of departure to work in Alpena County are 7:30 AM to 7:59 AM (1,021, 17.7%) for males and 7:30 AM to 7:59 AM (945, 17.8%) for females.
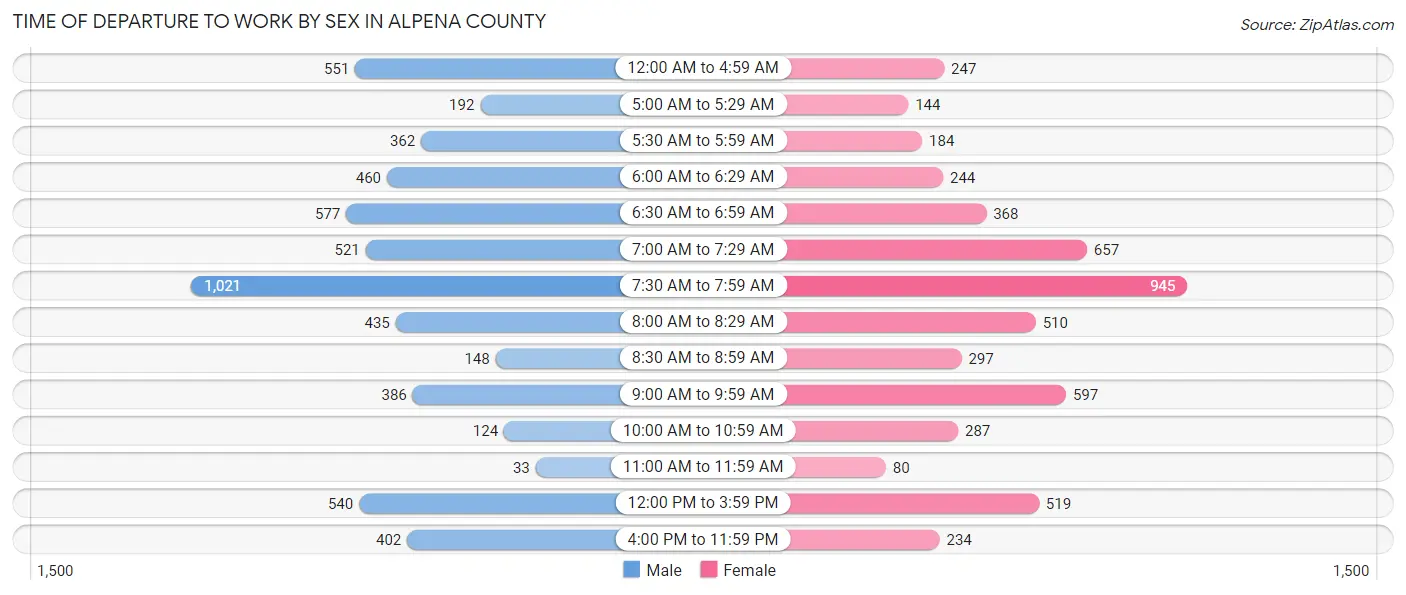
| Time of Departure | Male | Female |
| 12:00 AM to 4:59 AM | 551 (9.6%) | 247 (4.6%) |
| 5:00 AM to 5:29 AM | 192 (3.3%) | 144 (2.7%) |
| 5:30 AM to 5:59 AM | 362 (6.3%) | 184 (3.5%) |
| 6:00 AM to 6:29 AM | 460 (8.0%) | 244 (4.6%) |
| 6:30 AM to 6:59 AM | 577 (10.0%) | 368 (6.9%) |
| 7:00 AM to 7:29 AM | 521 (9.1%) | 657 (12.4%) |
| 7:30 AM to 7:59 AM | 1,021 (17.7%) | 945 (17.8%) |
| 8:00 AM to 8:29 AM | 435 (7.6%) | 510 (9.6%) |
| 8:30 AM to 8:59 AM | 148 (2.6%) | 297 (5.6%) |
| 9:00 AM to 9:59 AM | 386 (6.7%) | 597 (11.2%) |
| 10:00 AM to 10:59 AM | 124 (2.2%) | 287 (5.4%) |
| 11:00 AM to 11:59 AM | 33 (0.6%) | 80 (1.5%) |
| 12:00 PM to 3:59 PM | 540 (9.4%) | 519 (9.8%) |
| 4:00 PM to 11:59 PM | 402 (7.0%) | 234 (4.4%) |
| Total | 5,752 (100.0%) | 5,313 (100.0%) |
Housing Occupancy in Alpena County
Occupancy by Ownership in Alpena County
Of the total 12,721 dwellings in Alpena County, owner-occupied units account for 10,056 (79.0%), while renter-occupied units make up 2,665 (20.9%).
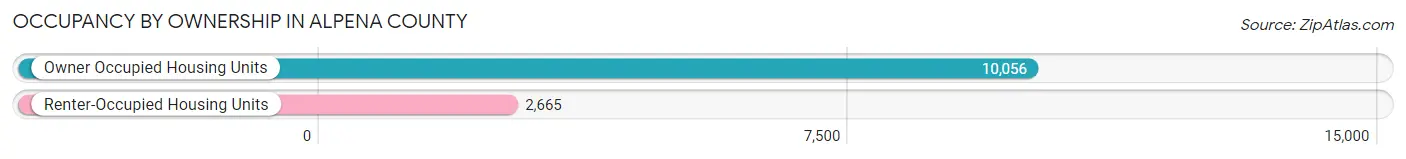
| Occupancy | # Housing Units | % Housing Units |
| Owner Occupied Housing Units | 10,056 | 79.0% |
| Renter-Occupied Housing Units | 2,665 | 20.9% |
| Total Occupied Housing Units | 12,721 | 100.0% |
Occupancy by Household Size in Alpena County
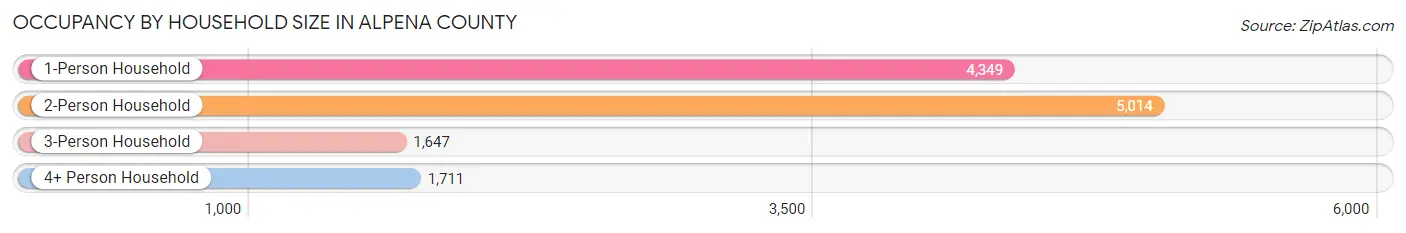
| Household Size | # Housing Units | % Housing Units |
| 1-Person Household | 4,349 | 34.2% |
| 2-Person Household | 5,014 | 39.4% |
| 3-Person Household | 1,647 | 13.0% |
| 4+ Person Household | 1,711 | 13.5% |
| Total Housing Units | 12,721 | 100.0% |
Occupancy by Ownership by Household Size in Alpena County
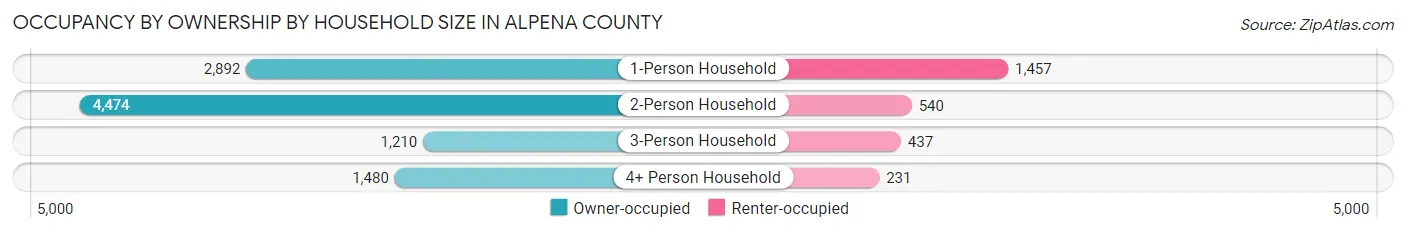
| Household Size | Owner-occupied | Renter-occupied |
| 1-Person Household | 2,892 (66.5%) | 1,457 (33.5%) |
| 2-Person Household | 4,474 (89.2%) | 540 (10.8%) |
| 3-Person Household | 1,210 (73.5%) | 437 (26.5%) |
| 4+ Person Household | 1,480 (86.5%) | 231 (13.5%) |
| Total Housing Units | 10,056 (79.0%) | 2,665 (20.9%) |
Occupancy by Educational Attainment in Alpena County
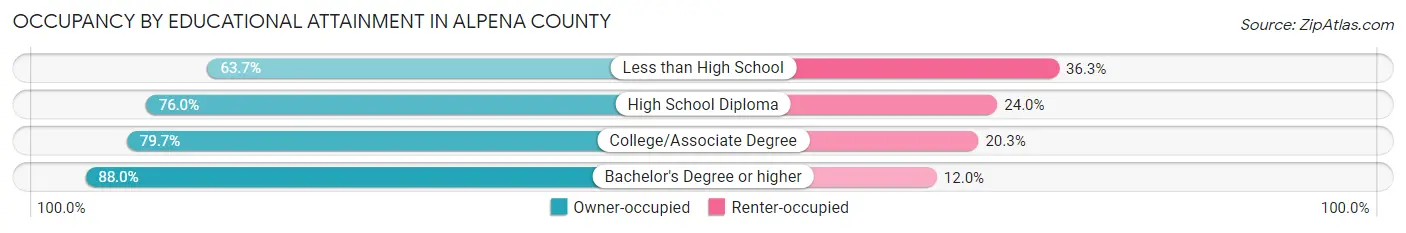
| Household Size | Owner-occupied | Renter-occupied |
| Less than High School | 520 (63.7%) | 296 (36.3%) |
| High School Diploma | 3,099 (76.0%) | 980 (24.0%) |
| College/Associate Degree | 4,319 (79.7%) | 1,099 (20.3%) |
| Bachelor's Degree or higher | 2,118 (88.0%) | 290 (12.0%) |
Occupancy by Age of Householder in Alpena County
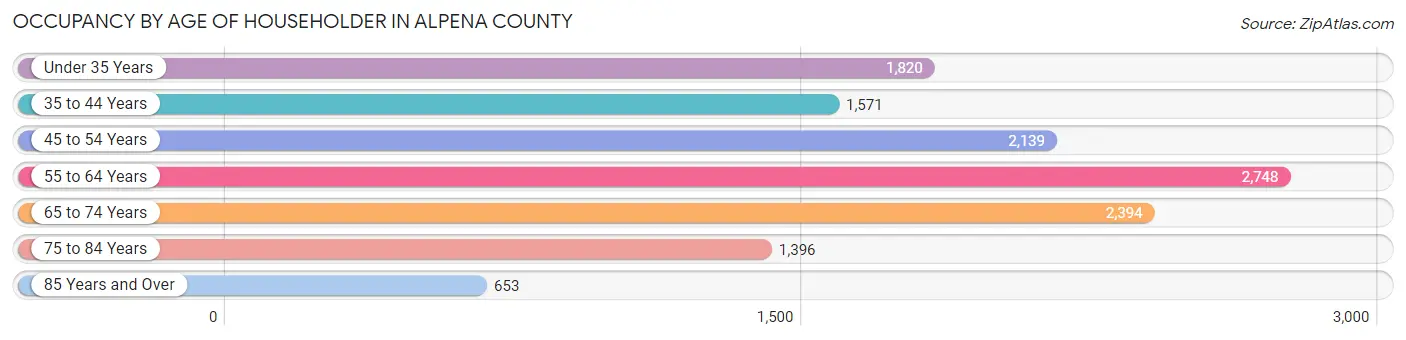
| Age Bracket | # Households | % Households |
| Under 35 Years | 1,820 | 14.3% |
| 35 to 44 Years | 1,571 | 12.3% |
| 45 to 54 Years | 2,139 | 16.8% |
| 55 to 64 Years | 2,748 | 21.6% |
| 65 to 74 Years | 2,394 | 18.8% |
| 75 to 84 Years | 1,396 | 11.0% |
| 85 Years and Over | 653 | 5.1% |
| Total | 12,721 | 100.0% |
Housing Finances in Alpena County
Median Income by Occupancy in Alpena County
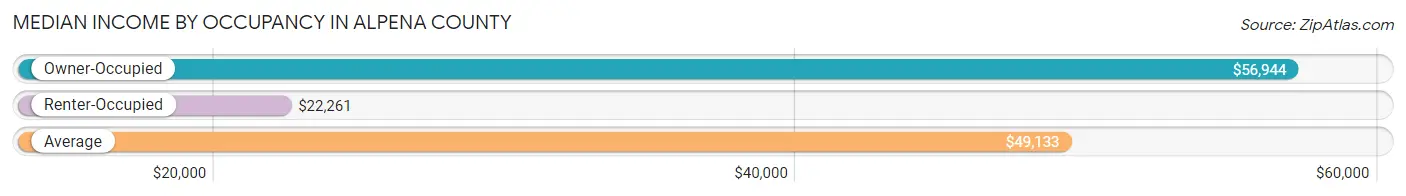
| Occupancy Type | # Households | Median Income |
| Owner-Occupied | 10,056 (79.0%) | $56,944 |
| Renter-Occupied | 2,665 (20.9%) | $22,261 |
| Average | 12,721 (100.0%) | $49,133 |
Occupancy by Householder Income Bracket in Alpena County
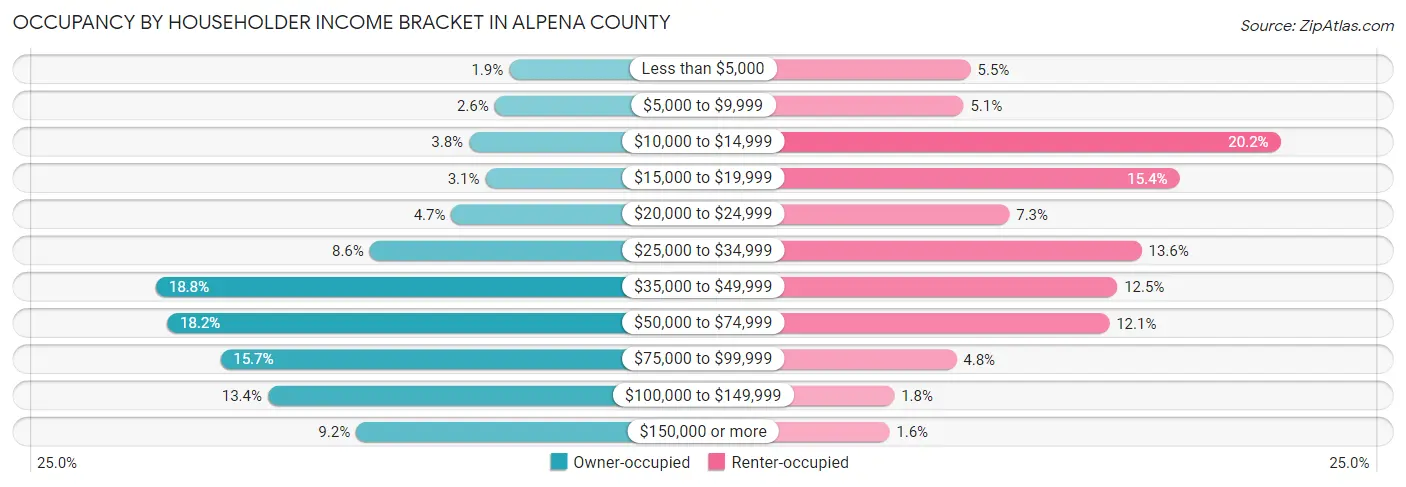
| Income Bracket | Owner-occupied | Renter-occupied |
| Less than $5,000 | 194 (1.9%) | 146 (5.5%) |
| $5,000 to $9,999 | 263 (2.6%) | 137 (5.1%) |
| $10,000 to $14,999 | 386 (3.8%) | 539 (20.2%) |
| $15,000 to $19,999 | 308 (3.1%) | 411 (15.4%) |
| $20,000 to $24,999 | 471 (4.7%) | 195 (7.3%) |
| $25,000 to $34,999 | 862 (8.6%) | 363 (13.6%) |
| $35,000 to $49,999 | 1,886 (18.8%) | 332 (12.5%) |
| $50,000 to $74,999 | 1,832 (18.2%) | 322 (12.1%) |
| $75,000 to $99,999 | 1,577 (15.7%) | 128 (4.8%) |
| $100,000 to $149,999 | 1,350 (13.4%) | 49 (1.8%) |
| $150,000 or more | 927 (9.2%) | 43 (1.6%) |
| Total | 10,056 (100.0%) | 2,665 (100.0%) |
Monthly Housing Cost Tiers in Alpena County
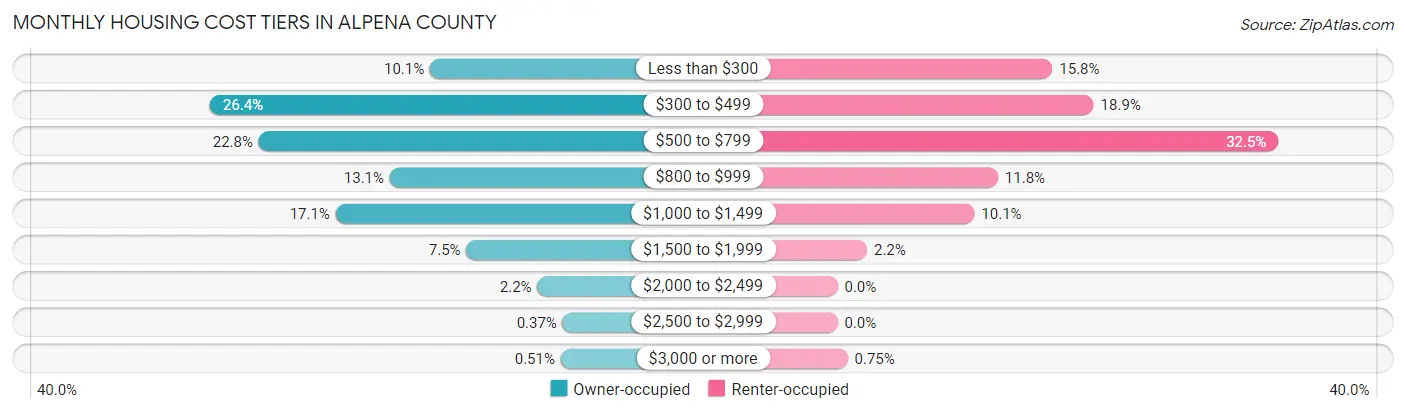
| Monthly Cost | Owner-occupied | Renter-occupied |
| Less than $300 | 1,020 (10.1%) | 422 (15.8%) |
| $300 to $499 | 2,650 (26.4%) | 503 (18.9%) |
| $500 to $799 | 2,288 (22.8%) | 865 (32.5%) |
| $800 to $999 | 1,317 (13.1%) | 315 (11.8%) |
| $1,000 to $1,499 | 1,719 (17.1%) | 269 (10.1%) |
| $1,500 to $1,999 | 750 (7.5%) | 58 (2.2%) |
| $2,000 to $2,499 | 224 (2.2%) | 0 (0.0%) |
| $2,500 to $2,999 | 37 (0.4%) | 0 (0.0%) |
| $3,000 or more | 51 (0.5%) | 20 (0.7%) |
| Total | 10,056 (100.0%) | 2,665 (100.0%) |
Physical Housing Characteristics in Alpena County
Housing Structures in Alpena County
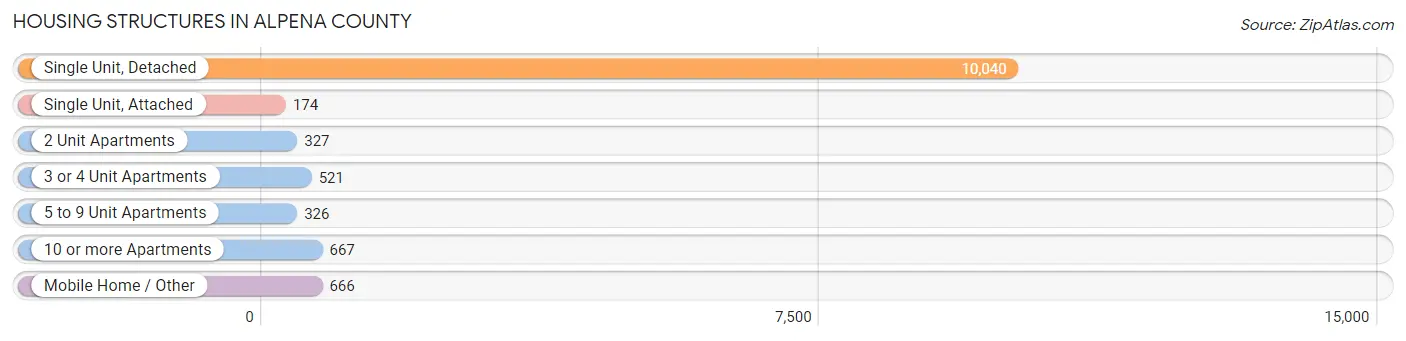
| Structure Type | # Housing Units | % Housing Units |
| Single Unit, Detached | 10,040 | 78.9% |
| Single Unit, Attached | 174 | 1.4% |
| 2 Unit Apartments | 327 | 2.6% |
| 3 or 4 Unit Apartments | 521 | 4.1% |
| 5 to 9 Unit Apartments | 326 | 2.6% |
| 10 or more Apartments | 667 | 5.2% |
| Mobile Home / Other | 666 | 5.2% |
| Total | 12,721 | 100.0% |
Housing Structures by Occupancy in Alpena County
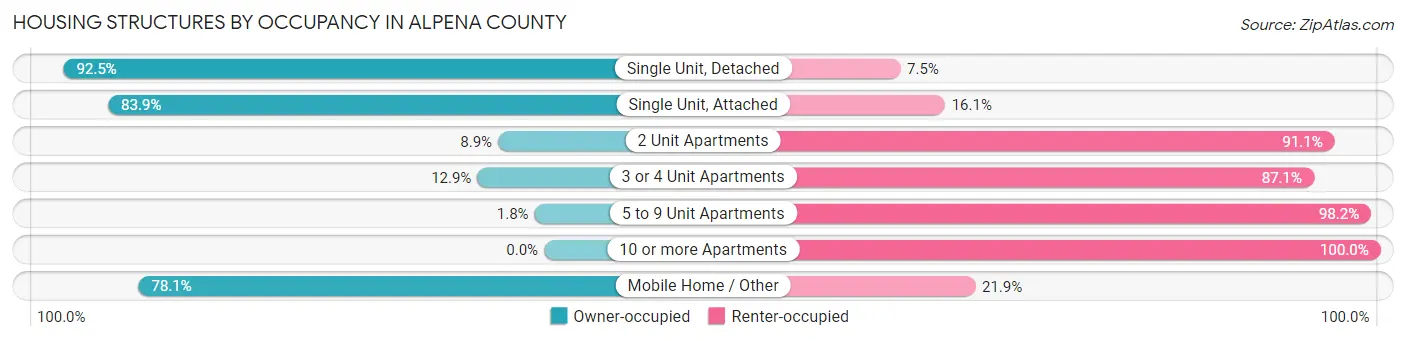
| Structure Type | Owner-occupied | Renter-occupied |
| Single Unit, Detached | 9,288 (92.5%) | 752 (7.5%) |
| Single Unit, Attached | 146 (83.9%) | 28 (16.1%) |
| 2 Unit Apartments | 29 (8.9%) | 298 (91.1%) |
| 3 or 4 Unit Apartments | 67 (12.9%) | 454 (87.1%) |
| 5 to 9 Unit Apartments | 6 (1.8%) | 320 (98.2%) |
| 10 or more Apartments | 0 (0.0%) | 667 (100.0%) |
| Mobile Home / Other | 520 (78.1%) | 146 (21.9%) |
| Total | 10,056 (79.0%) | 2,665 (20.9%) |
Housing Structures by Number of Rooms in Alpena County
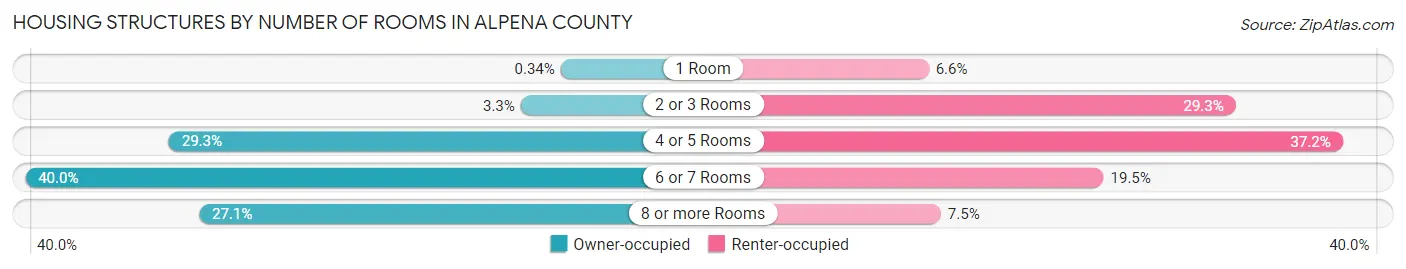
| Number of Rooms | Owner-occupied | Renter-occupied |
| 1 Room | 34 (0.3%) | 175 (6.6%) |
| 2 or 3 Rooms | 332 (3.3%) | 780 (29.3%) |
| 4 or 5 Rooms | 2,949 (29.3%) | 991 (37.2%) |
| 6 or 7 Rooms | 4,017 (40.0%) | 520 (19.5%) |
| 8 or more Rooms | 2,724 (27.1%) | 199 (7.5%) |
| Total | 10,056 (100.0%) | 2,665 (100.0%) |
Housing Structure by Heating Type in Alpena County
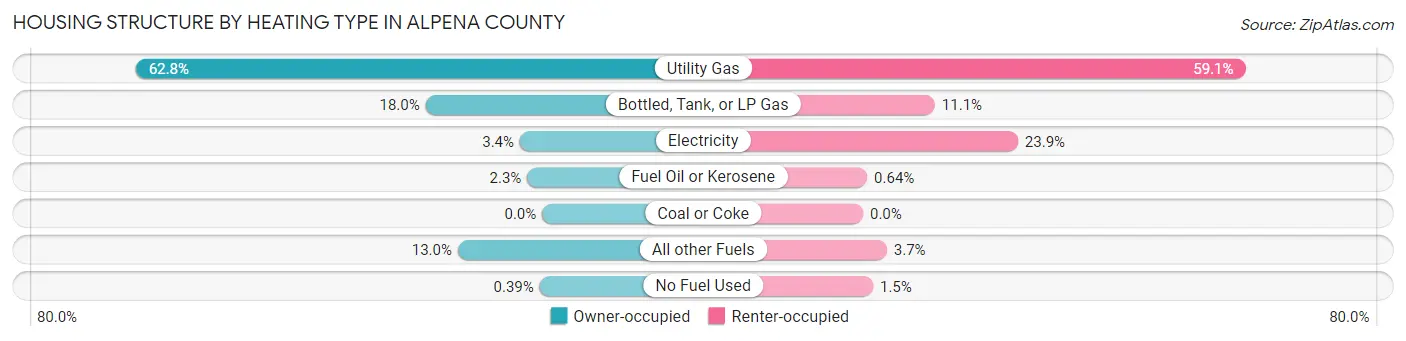
| Heating Type | Owner-occupied | Renter-occupied |
| Utility Gas | 6,317 (62.8%) | 1,575 (59.1%) |
| Bottled, Tank, or LP Gas | 1,812 (18.0%) | 296 (11.1%) |
| Electricity | 346 (3.4%) | 638 (23.9%) |
| Fuel Oil or Kerosene | 232 (2.3%) | 17 (0.6%) |
| Coal or Coke | 0 (0.0%) | 0 (0.0%) |
| All other Fuels | 1,310 (13.0%) | 98 (3.7%) |
| No Fuel Used | 39 (0.4%) | 41 (1.5%) |
| Total | 10,056 (100.0%) | 2,665 (100.0%) |
Household Vehicle Usage in Alpena County
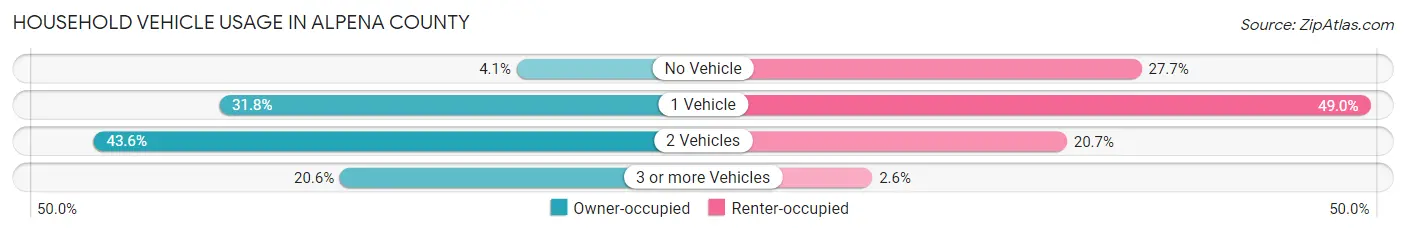
| Vehicles per Household | Owner-occupied | Renter-occupied |
| No Vehicle | 407 (4.1%) | 738 (27.7%) |
| 1 Vehicle | 3,202 (31.8%) | 1,307 (49.0%) |
| 2 Vehicles | 4,380 (43.6%) | 552 (20.7%) |
| 3 or more Vehicles | 2,067 (20.5%) | 68 (2.5%) |
| Total | 10,056 (100.0%) | 2,665 (100.0%) |
Real Estate & Mortgages in Alpena County
Real Estate and Mortgage Overview in Alpena County
| Characteristic | Without Mortgage | With Mortgage |
| Housing Units | 5,128 | 4,928 |
| Median Property Value | $124,800 | $131,700 |
| Median Household Income | $47,245 | $552 |
| Monthly Housing Costs | $422 | $39 |
| Real Estate Taxes | $1,465 | $173 |
Property Value by Mortgage Status in Alpena County
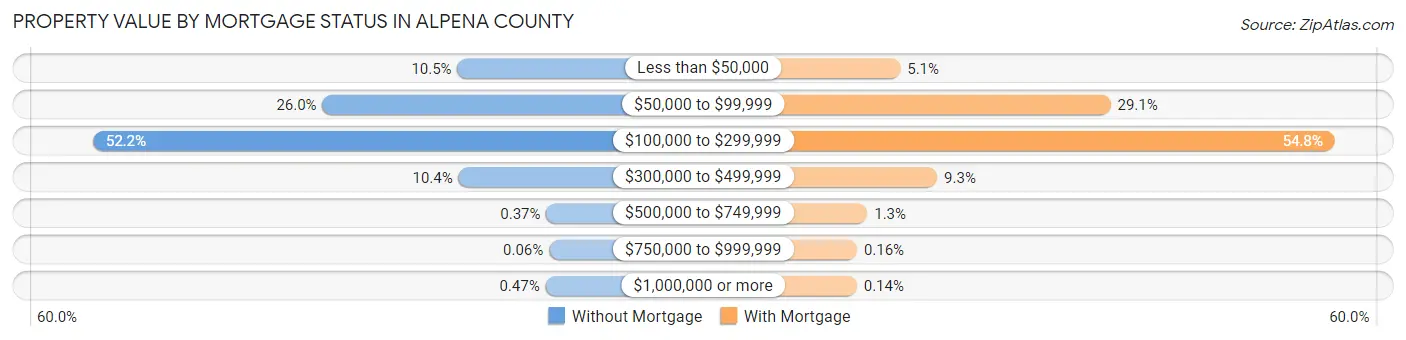
| Property Value | Without Mortgage | With Mortgage |
| Less than $50,000 | 540 (10.5%) | 252 (5.1%) |
| $50,000 to $99,999 | 1,331 (26.0%) | 1,436 (29.1%) |
| $100,000 to $299,999 | 2,677 (52.2%) | 2,699 (54.8%) |
| $300,000 to $499,999 | 534 (10.4%) | 460 (9.3%) |
| $500,000 to $749,999 | 19 (0.4%) | 66 (1.3%) |
| $750,000 to $999,999 | 3 (0.1%) | 8 (0.2%) |
| $1,000,000 or more | 24 (0.5%) | 7 (0.1%) |
| Total | 5,128 (100.0%) | 4,928 (100.0%) |
Household Income by Mortgage Status in Alpena County
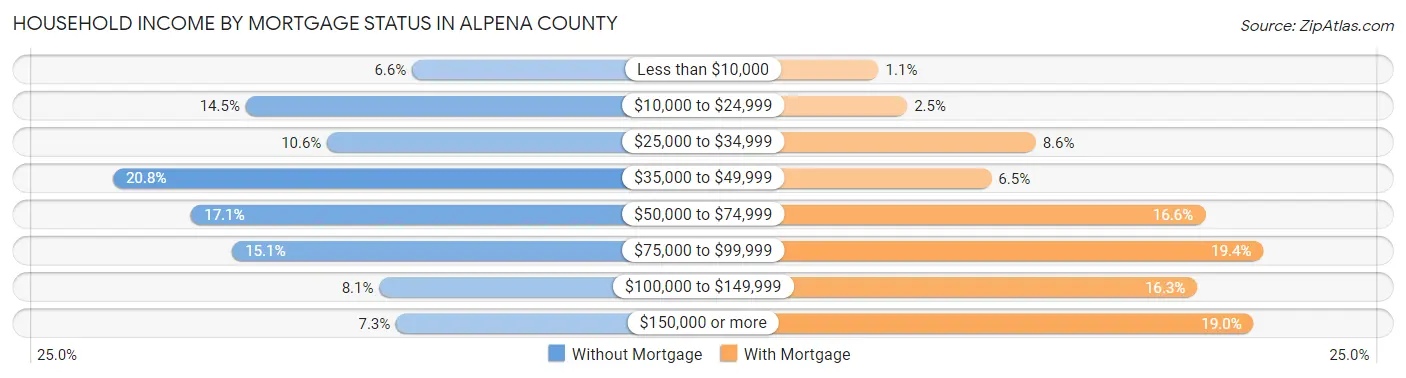
| Household Income | Without Mortgage | With Mortgage |
| Less than $10,000 | 336 (6.6%) | 54 (1.1%) |
| $10,000 to $24,999 | 742 (14.5%) | 121 (2.5%) |
| $25,000 to $34,999 | 543 (10.6%) | 423 (8.6%) |
| $35,000 to $49,999 | 1,066 (20.8%) | 319 (6.5%) |
| $50,000 to $74,999 | 875 (17.1%) | 820 (16.6%) |
| $75,000 to $99,999 | 775 (15.1%) | 957 (19.4%) |
| $100,000 to $149,999 | 416 (8.1%) | 802 (16.3%) |
| $150,000 or more | 375 (7.3%) | 934 (19.0%) |
| Total | 5,128 (100.0%) | 4,928 (100.0%) |
Property Value to Household Income Ratio in Alpena County
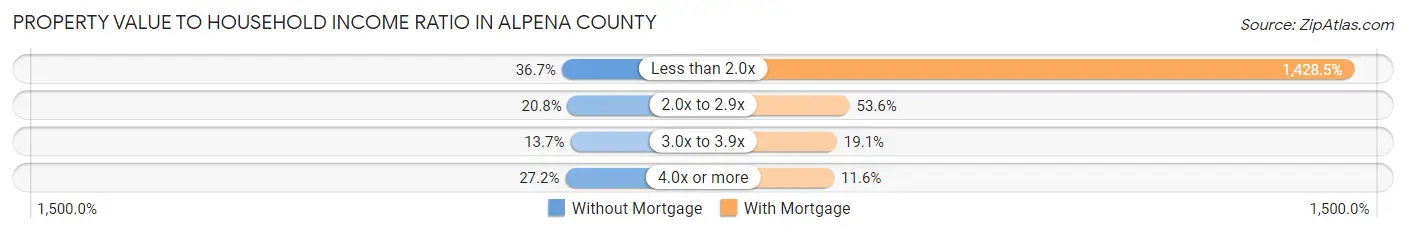
| Value-to-Income Ratio | Without Mortgage | With Mortgage |
| Less than 2.0x | 1,883 (36.7%) | 70,394 (1,428.4%) |
| 2.0x to 2.9x | 1,067 (20.8%) | 2,639 (53.5%) |
| 3.0x to 3.9x | 700 (13.7%) | 941 (19.1%) |
| 4.0x or more | 1,393 (27.2%) | 569 (11.6%) |
| Total | 5,128 (100.0%) | 4,928 (100.0%) |
Real Estate Taxes by Mortgage Status in Alpena County
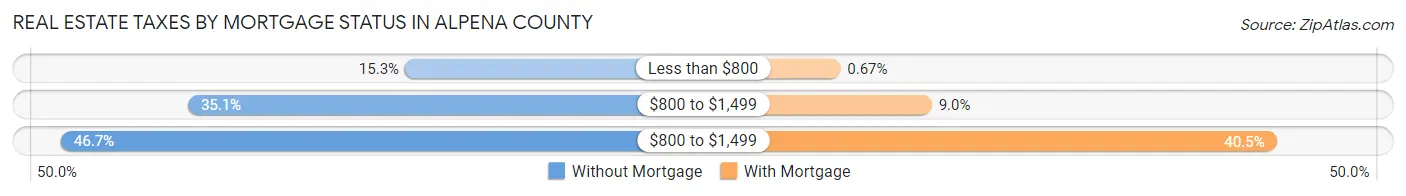
| Property Taxes | Without Mortgage | With Mortgage |
| Less than $800 | 783 (15.3%) | 33 (0.7%) |
| $800 to $1,499 | 1,799 (35.1%) | 444 (9.0%) |
| $800 to $1,499 | 2,394 (46.7%) | 1,996 (40.5%) |
| Total | 5,128 (100.0%) | 4,928 (100.0%) |
Health & Disability in Alpena County
Health Insurance Coverage by Age in Alpena County
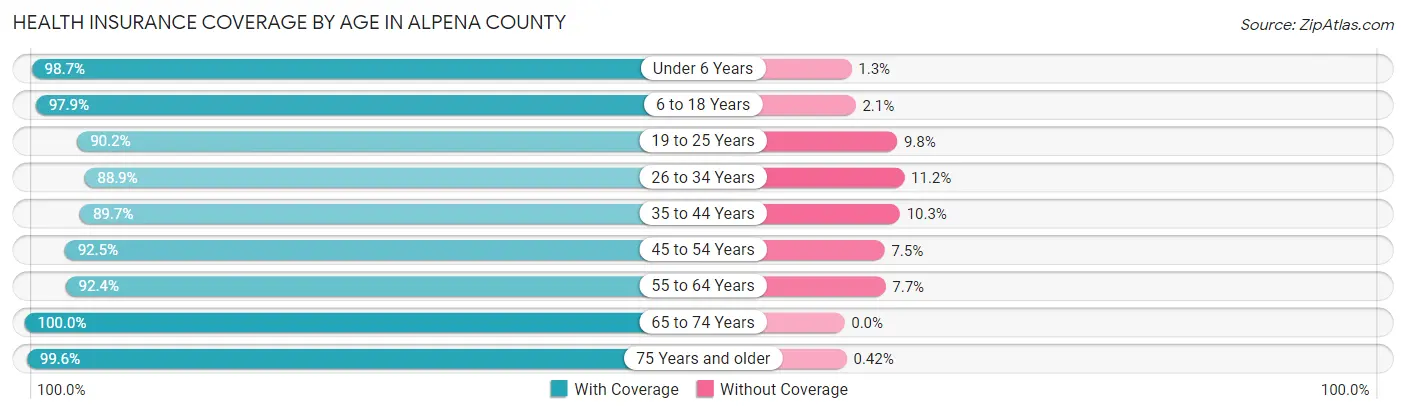
| Age Bracket | With Coverage | Without Coverage |
| Under 6 Years | 1,490 (98.7%) | 20 (1.3%) |
| 6 to 18 Years | 4,105 (97.9%) | 87 (2.1%) |
| 19 to 25 Years | 1,727 (90.2%) | 188 (9.8%) |
| 26 to 34 Years | 2,509 (88.8%) | 315 (11.2%) |
| 35 to 44 Years | 2,761 (89.7%) | 318 (10.3%) |
| 45 to 54 Years | 3,185 (92.5%) | 258 (7.5%) |
| 55 to 64 Years | 4,409 (92.3%) | 365 (7.6%) |
| 65 to 74 Years | 3,972 (100.0%) | 0 (0.0%) |
| 75 Years and older | 2,820 (99.6%) | 12 (0.4%) |
| Total | 26,978 (94.5%) | 1,563 (5.5%) |
Health Insurance Coverage by Citizenship Status in Alpena County
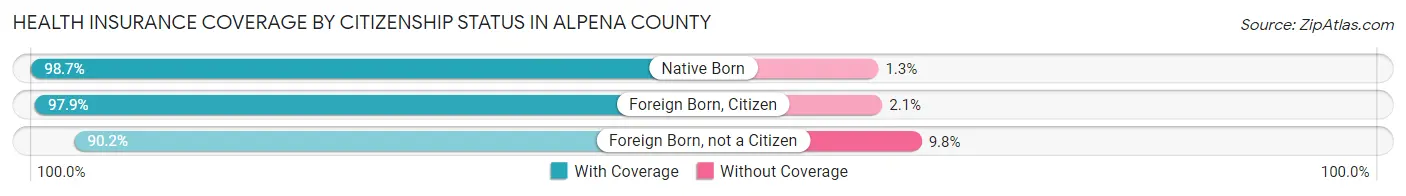
| Citizenship Status | With Coverage | Without Coverage |
| Native Born | 1,490 (98.7%) | 20 (1.3%) |
| Foreign Born, Citizen | 4,105 (97.9%) | 87 (2.1%) |
| Foreign Born, not a Citizen | 1,727 (90.2%) | 188 (9.8%) |
Health Insurance Coverage by Household Income in Alpena County
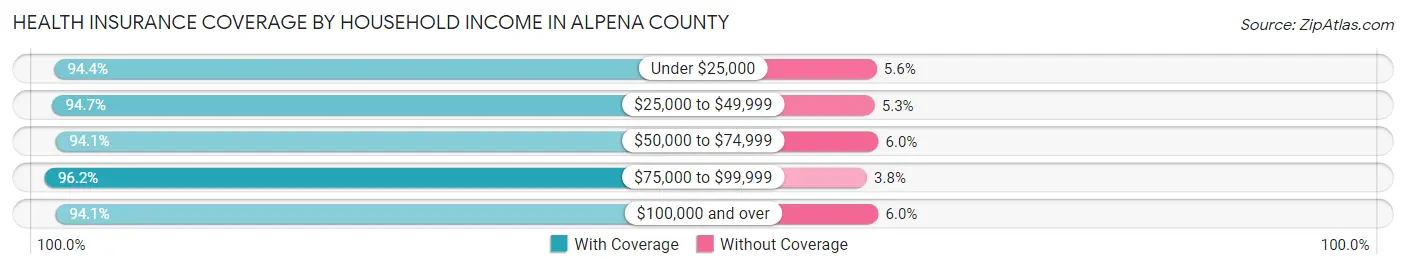
| Household Income | With Coverage | Without Coverage |
| Under $25,000 | 4,485 (94.4%) | 268 (5.6%) |
| $25,000 to $49,999 | 6,685 (94.7%) | 371 (5.3%) |
| $50,000 to $74,999 | 4,996 (94.1%) | 316 (5.9%) |
| $75,000 to $99,999 | 4,129 (96.2%) | 164 (3.8%) |
| $100,000 and over | 6,494 (94.1%) | 411 (5.9%) |
Public vs Private Health Insurance Coverage by Age in Alpena County
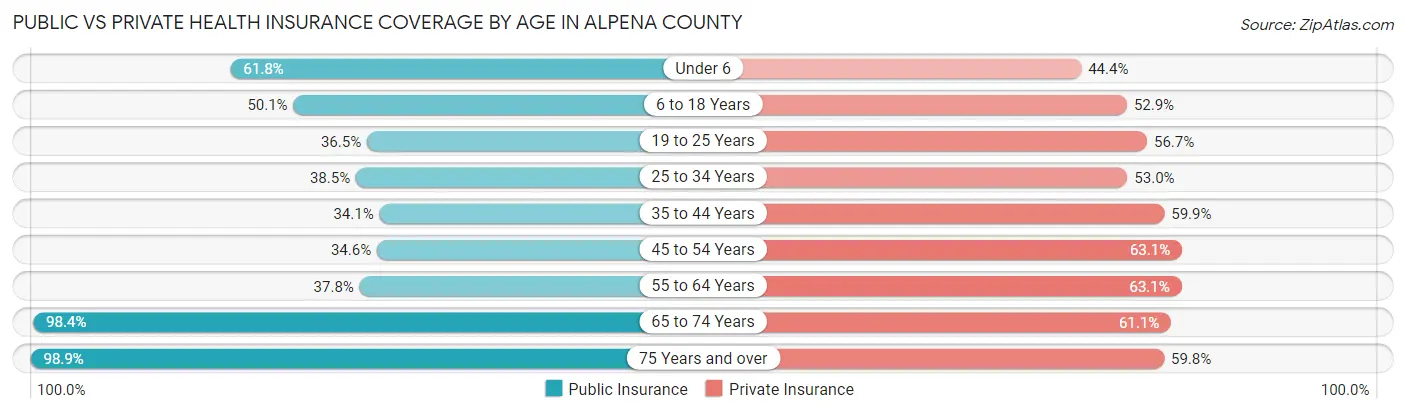
| Age Bracket | Public Insurance | Private Insurance |
| Under 6 | 933 (61.8%) | 671 (44.4%) |
| 6 to 18 Years | 2,100 (50.1%) | 2,219 (52.9%) |
| 19 to 25 Years | 698 (36.4%) | 1,085 (56.7%) |
| 25 to 34 Years | 1,087 (38.5%) | 1,497 (53.0%) |
| 35 to 44 Years | 1,051 (34.1%) | 1,843 (59.9%) |
| 45 to 54 Years | 1,191 (34.6%) | 2,174 (63.1%) |
| 55 to 64 Years | 1,805 (37.8%) | 3,010 (63.0%) |
| 65 to 74 Years | 3,909 (98.4%) | 2,428 (61.1%) |
| 75 Years and over | 2,801 (98.9%) | 1,694 (59.8%) |
| Total | 15,575 (54.6%) | 16,621 (58.2%) |
Disability Status by Sex by Age in Alpena County
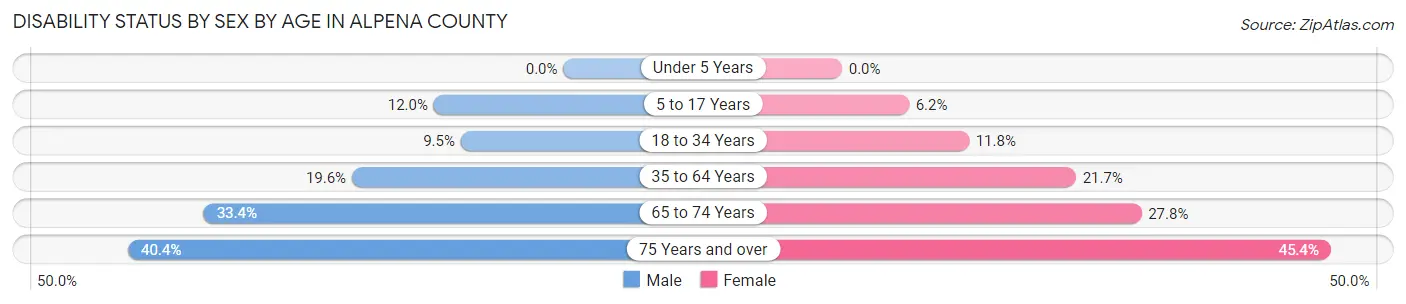
| Age Bracket | Male | Female |
| Under 5 Years | 0 (0.0%) | 0 (0.0%) |
| 5 to 17 Years | 249 (12.0%) | 122 (6.2%) |
| 18 to 34 Years | 252 (9.5%) | 286 (11.8%) |
| 35 to 64 Years | 1,095 (19.6%) | 1,241 (21.7%) |
| 65 to 74 Years | 659 (33.4%) | 555 (27.8%) |
| 75 Years and over | 480 (40.4%) | 746 (45.4%) |
Disability Class by Sex by Age in Alpena County
Disability Class: Hearing Difficulty
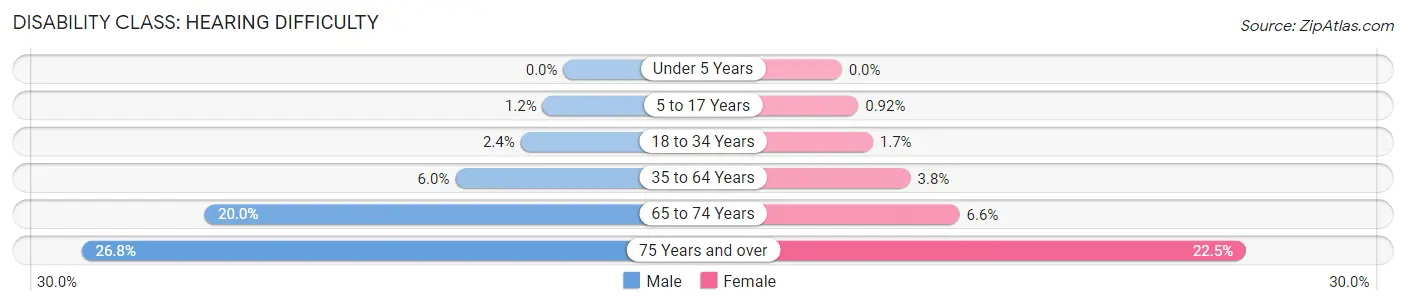
| Age Bracket | Male | Female |
| Under 5 Years | 0 (0.0%) | 0 (0.0%) |
| 5 to 17 Years | 24 (1.2%) | 18 (0.9%) |
| 18 to 34 Years | 63 (2.4%) | 42 (1.7%) |
| 35 to 64 Years | 336 (6.0%) | 219 (3.8%) |
| 65 to 74 Years | 394 (20.0%) | 131 (6.6%) |
| 75 Years and over | 318 (26.8%) | 369 (22.5%) |
Disability Class: Vision Difficulty
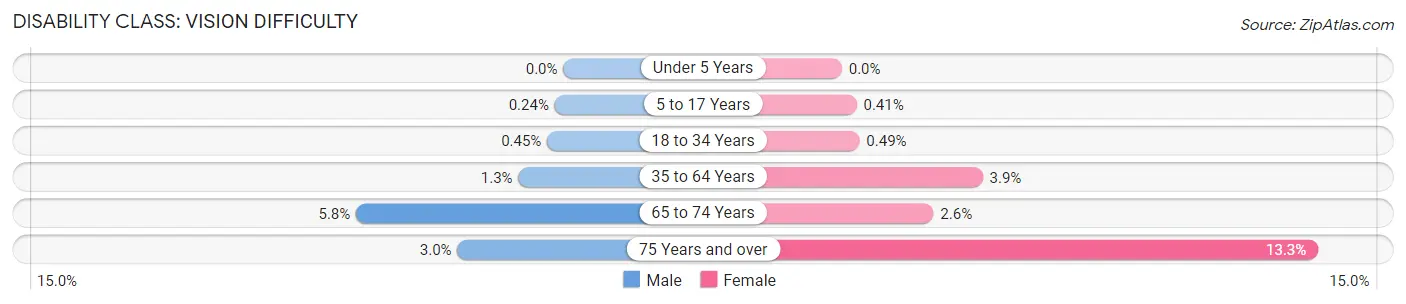
| Age Bracket | Male | Female |
| Under 5 Years | 0 (0.0%) | 0 (0.0%) |
| 5 to 17 Years | 5 (0.2%) | 8 (0.4%) |
| 18 to 34 Years | 12 (0.4%) | 12 (0.5%) |
| 35 to 64 Years | 70 (1.3%) | 224 (3.9%) |
| 65 to 74 Years | 114 (5.8%) | 51 (2.5%) |
| 75 Years and over | 35 (2.9%) | 218 (13.3%) |
Disability Class: Cognitive Difficulty
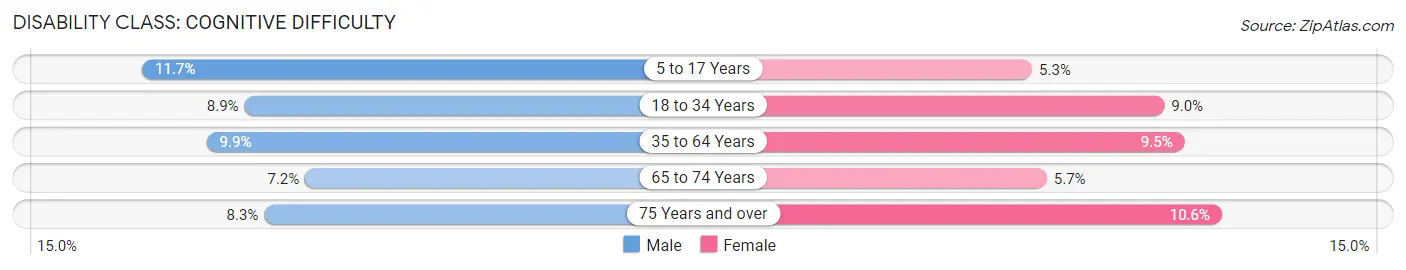
| Age Bracket | Male | Female |
| 5 to 17 Years | 243 (11.7%) | 104 (5.3%) |
| 18 to 34 Years | 235 (8.9%) | 218 (9.0%) |
| 35 to 64 Years | 554 (9.9%) | 545 (9.5%) |
| 65 to 74 Years | 142 (7.2%) | 114 (5.7%) |
| 75 Years and over | 99 (8.3%) | 174 (10.6%) |
Disability Class: Ambulatory Difficulty
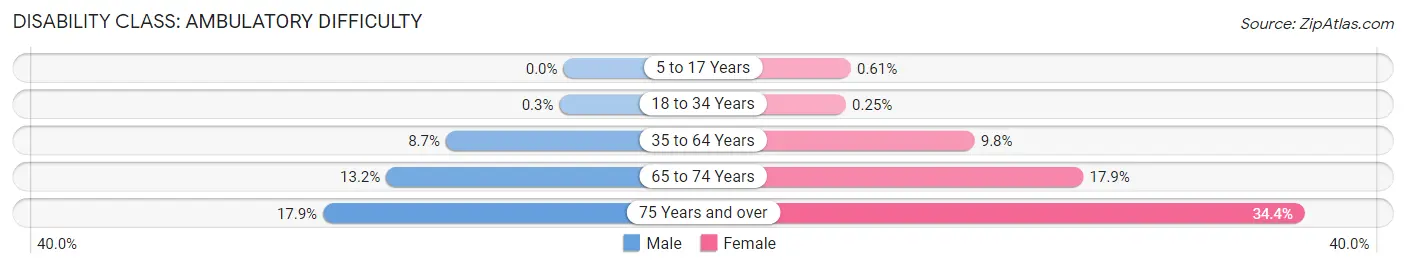
| Age Bracket | Male | Female |
| 5 to 17 Years | 0 (0.0%) | 12 (0.6%) |
| 18 to 34 Years | 8 (0.3%) | 6 (0.3%) |
| 35 to 64 Years | 487 (8.7%) | 560 (9.8%) |
| 65 to 74 Years | 260 (13.2%) | 357 (17.9%) |
| 75 Years and over | 212 (17.8%) | 565 (34.4%) |
Disability Class: Self-Care Difficulty
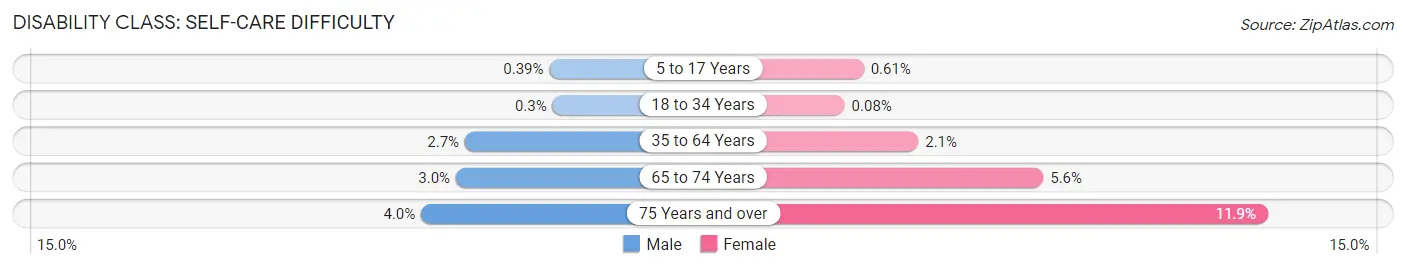
| Age Bracket | Male | Female |
| 5 to 17 Years | 8 (0.4%) | 12 (0.6%) |
| 18 to 34 Years | 8 (0.3%) | 2 (0.1%) |
| 35 to 64 Years | 153 (2.7%) | 122 (2.1%) |
| 65 to 74 Years | 59 (3.0%) | 112 (5.6%) |
| 75 Years and over | 47 (4.0%) | 195 (11.9%) |
Technology Access in Alpena County
Computing Device Access in Alpena County
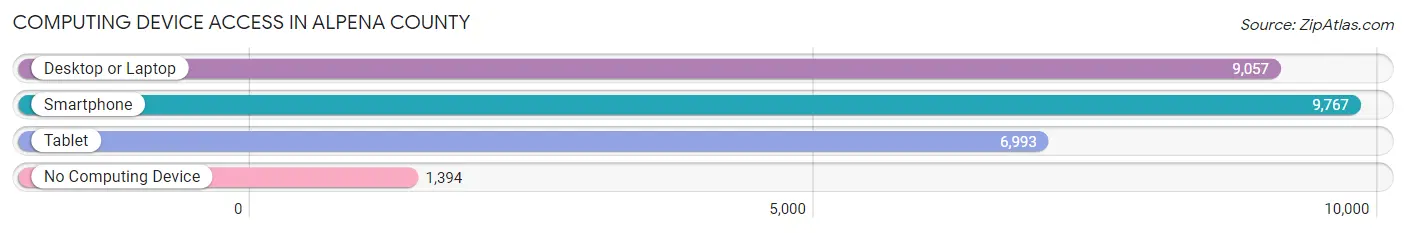
| Device Type | # Households | % Households |
| Desktop or Laptop | 9,057 | 71.2% |
| Smartphone | 9,767 | 76.8% |
| Tablet | 6,993 | 55.0% |
| No Computing Device | 1,394 | 11.0% |
| Total | 12,721 | 100.0% |
Internet Access in Alpena County
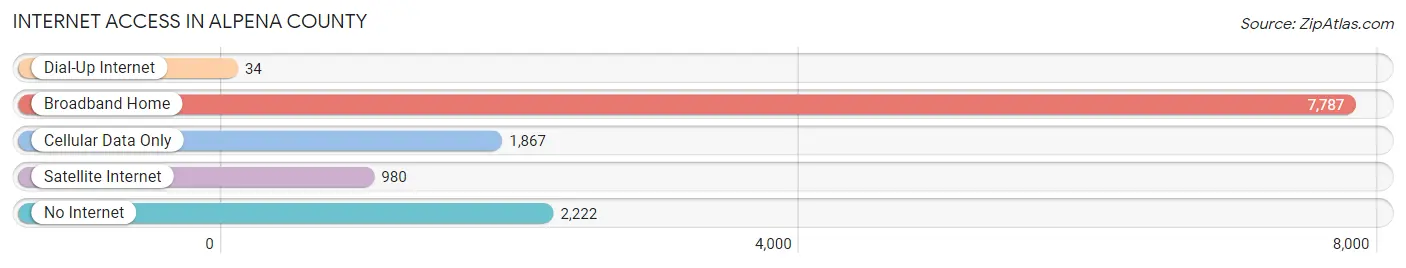
| Internet Type | # Households | % Households |
| Dial-Up Internet | 34 | 0.3% |
| Broadband Home | 7,787 | 61.2% |
| Cellular Data Only | 1,867 | 14.7% |
| Satellite Internet | 980 | 7.7% |
| No Internet | 2,222 | 17.5% |
| Total | 12,721 | 100.0% |
Alpena County Summary
Alpena County is located in the northeastern part of Michigan’s Lower Peninsula. It is bordered by Presque Isle County to the north, Montmorency County to the west, Alcona County to the south, and Lake Huron to the east. The county seat is Alpena, which is also the largest city in the county. Alpena County covers an area of 1,876 square miles and has a population of 29,598 as of the 2010 census.
History
Alpena County was established in 1840 and was originally part of Mackinac County. It was named after the city of Alpena, which was founded in 1857. The city was named after the Alpena Indian tribe, which had inhabited the area for centuries. The county was initially a logging and fishing center, but it later became an important center for the Great Lakes shipping industry.
Geography
Alpena County is located in the northeastern part of Michigan’s Lower Peninsula. It is bordered by Presque Isle County to the north, Montmorency County to the west, Alcona County to the south, and Lake Huron to the east. The county has a total area of 1,876 square miles, of which 1,845 square miles is land and 31 square miles is water. The county is home to several lakes, including Long Lake, Grand Lake, and Thunder Bay.
The terrain of Alpena County is mostly flat, with some rolling hills in the western part of the county. The highest point in the county is located at the summit of Thunder Bay Hill, which has an elevation of 1,068 feet. The county is also home to several state parks, including Negwegon State Park, Thompson’s Harbor State Park, and Rockport State Park.
Economy
Alpena County’s economy is largely based on tourism, manufacturing, and agriculture. The county is home to several manufacturing companies, including Alpena Manufacturing, which produces automotive parts, and Alpena Power Company, which produces electricity. The county is also home to several agricultural operations, including dairy farms, fruit orchards, and vegetable farms.
Tourism is an important part of the county’s economy. The county is home to several popular tourist attractions, including the Thunder Bay National Marine Sanctuary, the Great Lakes Maritime Heritage Center, and the Alpena Wildlife Sanctuary. The county is also home to several popular outdoor recreation areas, including the Huron National Forest and the Negwegon State Park.
Demographics
As of the 2010 census, Alpena County had a population of 29,598. The racial makeup of the county was 94.3% White, 0.7% African American, 0.7% Native American, 0.5% Asian, 0.1% Pacific Islander, 1.7% from other races, and 2.0% from two or more races. Hispanic or Latino of any race were 4.2% of the population.
The median income for a household in the county was $37,845 and the median income for a family was $45,945. The per capita income for the county was $20,845. About 14.2% of the population was below the poverty line. The largest employers in the county are Alpena Regional Medical Center, Alpena Public Schools, and Alpena Power Company.
Common Questions
What is Per Capita Income in Alpena County?
Per Capita income in Alpena County is $30,893.
What is the Median Family Income in Alpena County?
Median Family Income in Alpena County is $62,299.
What is the Median Household income in Alpena County?
Median Household Income in Alpena County is $49,133.
What is Income or Wage Gap in Alpena County?
Income or Wage Gap in Alpena County is 36.5%.
Women in Alpena County earn 63.5 cents for every dollar earned by a man.
What is Family Income Deficit in Alpena County?
Family Income Deficit in Alpena County is $9,725.
Families that are below poverty line in Alpena County earn $9,725 less on average than the poverty threshold level.
What is Inequality or Gini Index in Alpena County?
Inequality or Gini Index in Alpena County is 0.46.
What is the Total Population of Alpena County?
Total Population of Alpena County is 28,911.
What is the Total Male Population of Alpena County?
Total Male Population of Alpena County is 14,366.
What is the Total Female Population of Alpena County?
Total Female Population of Alpena County is 14,545.
What is the Ratio of Males per 100 Females in Alpena County?
There are 98.77 Males per 100 Females in Alpena County.
What is the Ratio of Females per 100 Males in Alpena County?
There are 101.25 Females per 100 Males in Alpena County.
What is the Median Population Age in Alpena County?
Median Population Age in Alpena County is 47.6 Years.
What is the Average Family Size in Alpena County
Average Family Size in Alpena County is 2.8 People.
What is the Average Household Size in Alpena County
Average Household Size in Alpena County is 2.2 People.
How Large is the Labor Force in Alpena County?
There are 13,214 People in the Labor Forcein in Alpena County.
What is the Percentage of People in the Labor Force in Alpena County?
54.6% of People are in the Labor Force in Alpena County.
What is the Unemployment Rate in Alpena County?
Unemployment Rate in Alpena County is 7.4%.