Denton, GA Map & Demographics
Denton Map
Denton Overview
$15,937
PER CAPITA INCOME
$30,250
AVG FAMILY INCOME
$30,250
AVG HOUSEHOLD INCOME
35.9%
WAGE / INCOME GAP [ % ]
64.1¢/ $1
WAGE / INCOME GAP [ $ ]
0.31
INEQUALITY / GINI INDEX
257
TOTAL POPULATION
117
MALE POPULATION
140
FEMALE POPULATION
83.57
MALES / 100 FEMALES
119.66
FEMALES / 100 MALES
55.3
MEDIAN AGE
3.3
AVG FAMILY SIZE
2.6
AVG HOUSEHOLD SIZE
59
LABOR FORCE [ PEOPLE ]
26.6%
PERCENT IN LABOR FORCE
Denton Zip Codes
Denton Area Codes
Income in Denton
Income Overview in Denton
Per Capita Income in Denton is $15,937, while median incomes of families and households are $30,250 and $30,250 respectively.
| Characteristic | Number | Measure |
| Per Capita Income | 257 | $15,937 |
| Median Family Income | 69 | $30,250 |
| Mean Family Income | 69 | $42,823 |
| Median Household Income | 97 | $30,250 |
| Mean Household Income | 97 | $39,416 |
| Income Deficit | 69 | $0 |
| Wage / Income Gap (%) | 257 | 35.85% |
| Wage / Income Gap ($) | 257 | 64.15¢ per $1 |
| Gini / Inequality Index | 257 | 0.31 |
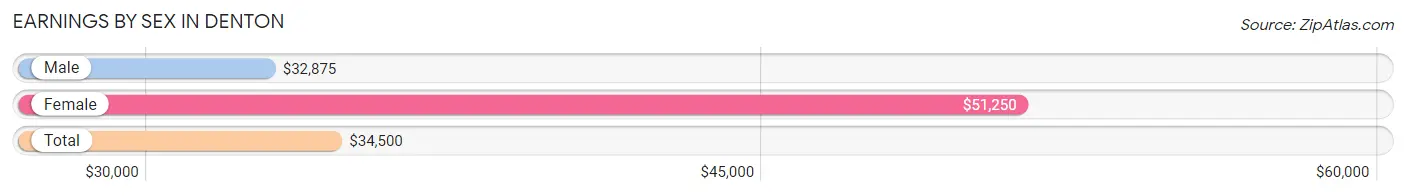
Earnings by Sex in Denton
Average Earnings in Denton are $34,500, $32,875 for men and $51,250 for women, a difference of 35.8%.
| Sex | Number | Average Earnings |
| Male | 39 (60.9%) | $32,875 |
| Female | 25 (39.1%) | $51,250 |
| Total | 64 (100.0%) | $34,500 |
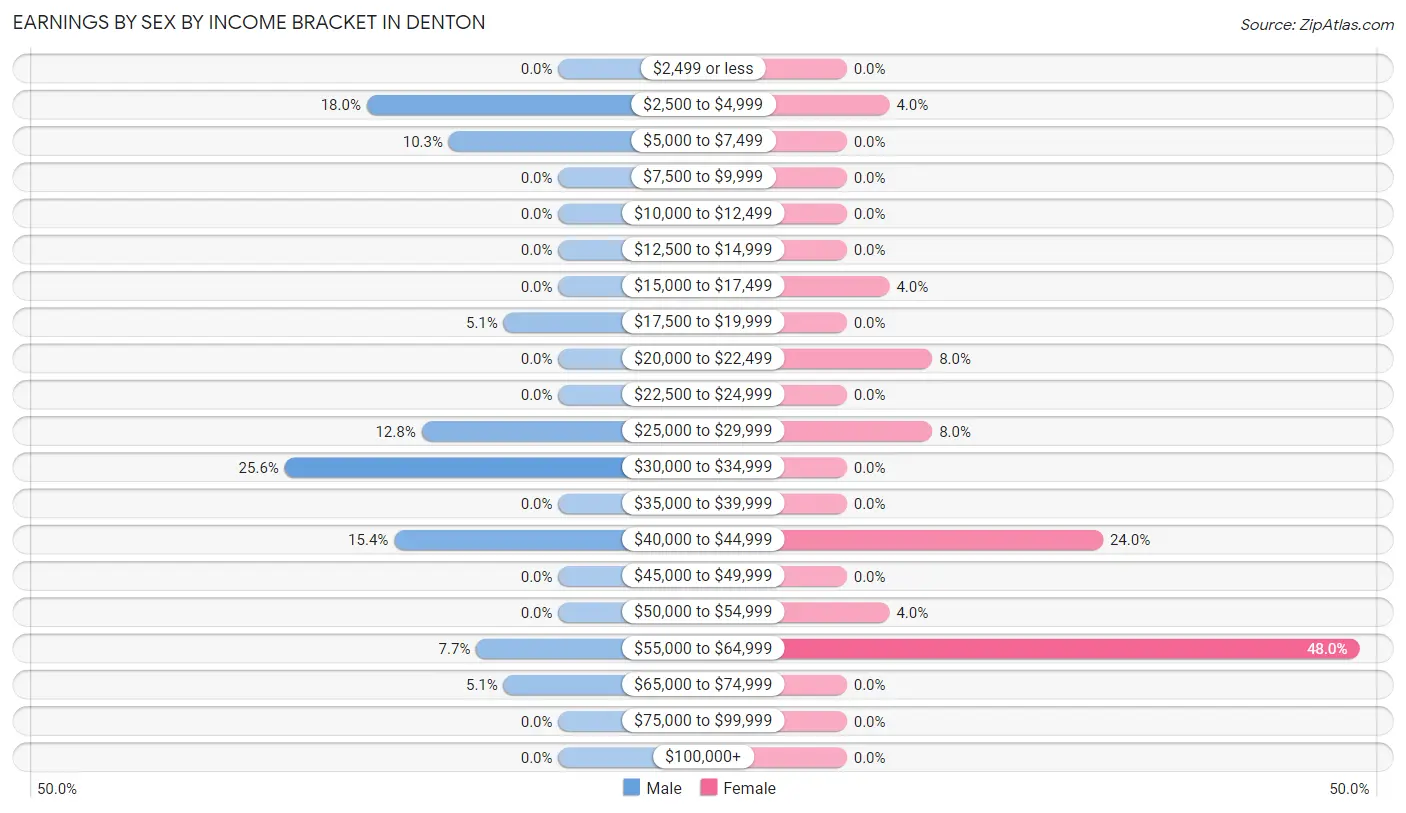
Earnings by Sex by Income Bracket in Denton
The most common earnings brackets in Denton are $30,000 to $34,999 for men (10 | 25.6%) and $55,000 to $64,999 for women (12 | 48.0%).
| Income | Male | Female |
| $2,499 or less | 0 (0.0%) | 0 (0.0%) |
| $2,500 to $4,999 | 7 (17.9%) | 1 (4.0%) |
| $5,000 to $7,499 | 4 (10.3%) | 0 (0.0%) |
| $7,500 to $9,999 | 0 (0.0%) | 0 (0.0%) |
| $10,000 to $12,499 | 0 (0.0%) | 0 (0.0%) |
| $12,500 to $14,999 | 0 (0.0%) | 0 (0.0%) |
| $15,000 to $17,499 | 0 (0.0%) | 1 (4.0%) |
| $17,500 to $19,999 | 2 (5.1%) | 0 (0.0%) |
| $20,000 to $22,499 | 0 (0.0%) | 2 (8.0%) |
| $22,500 to $24,999 | 0 (0.0%) | 0 (0.0%) |
| $25,000 to $29,999 | 5 (12.8%) | 2 (8.0%) |
| $30,000 to $34,999 | 10 (25.6%) | 0 (0.0%) |
| $35,000 to $39,999 | 0 (0.0%) | 0 (0.0%) |
| $40,000 to $44,999 | 6 (15.4%) | 6 (24.0%) |
| $45,000 to $49,999 | 0 (0.0%) | 0 (0.0%) |
| $50,000 to $54,999 | 0 (0.0%) | 1 (4.0%) |
| $55,000 to $64,999 | 3 (7.7%) | 12 (48.0%) |
| $65,000 to $74,999 | 2 (5.1%) | 0 (0.0%) |
| $75,000 to $99,999 | 0 (0.0%) | 0 (0.0%) |
| $100,000+ | 0 (0.0%) | 0 (0.0%) |
| Total | 39 (100.0%) | 25 (100.0%) |
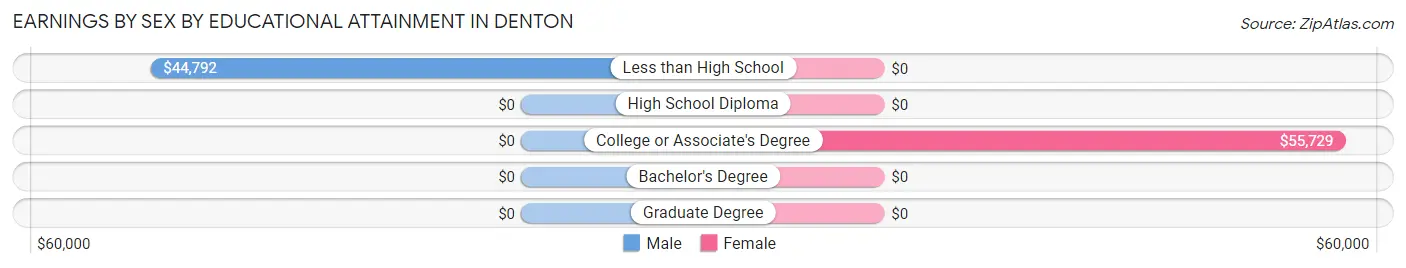
Earnings by Sex by Educational Attainment in Denton
Average earnings in Denton are $32,875 for men and $55,521 for women, a difference of 40.8%. Men with an educational attainment of less than high school enjoy the highest average annual earnings of $44,792, while those with less than high school education earn the least with $44,792. Women with an educational attainment of college or associate's degree earn the most with the average annual earnings of $55,729, while those with college or associate's degree education have the smallest earnings of $55,729.
| Educational Attainment | Male Income | Female Income |
| Less than High School | $44,792 | $0 |
| High School Diploma | - | - |
| College or Associate's Degree | - | - |
| Bachelor's Degree | - | - |
| Graduate Degree | - | - |
| Total | $32,875 | $55,521 |
Family Income in Denton
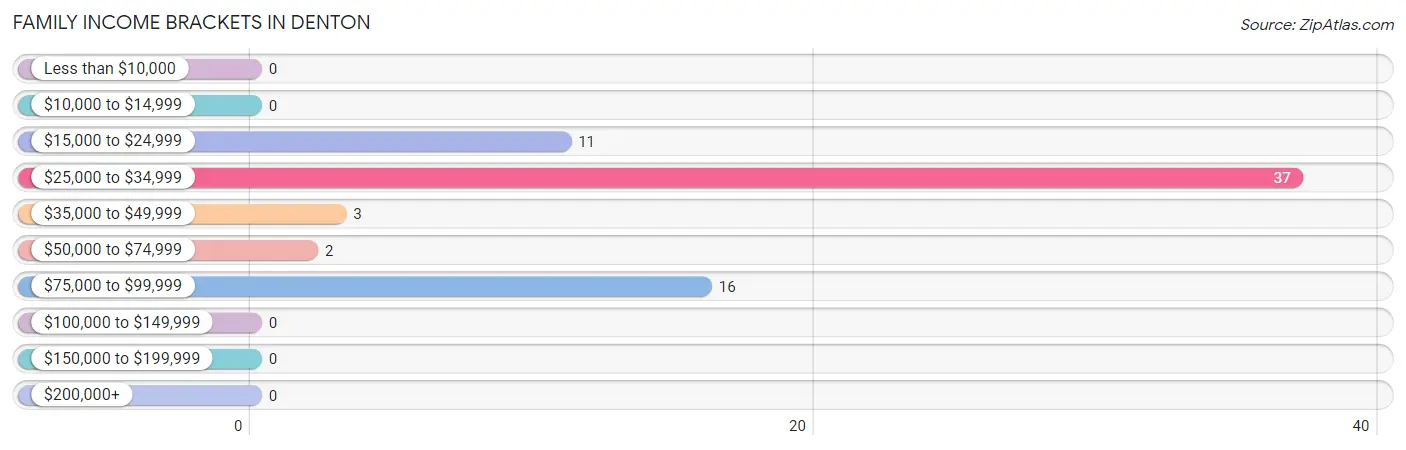
Family Income Brackets in Denton
According to the Denton family income data, there are 37 families falling into the $25,000 to $34,999 income range, which is the most common income bracket and makes up 53.6% of all families.
| Income Bracket | # Families | % Families |
| Less than $10,000 | 0 | 0.0% |
| $10,000 to $14,999 | 0 | 0.0% |
| $15,000 to $24,999 | 11 | 15.9% |
| $25,000 to $34,999 | 37 | 53.6% |
| $35,000 to $49,999 | 3 | 4.3% |
| $50,000 to $74,999 | 2 | 2.9% |
| $75,000 to $99,999 | 16 | 23.2% |
| $100,000 to $149,999 | 0 | 0.0% |
| $150,000 to $199,999 | 0 | 0.0% |
| $200,000+ | 0 | 0.0% |
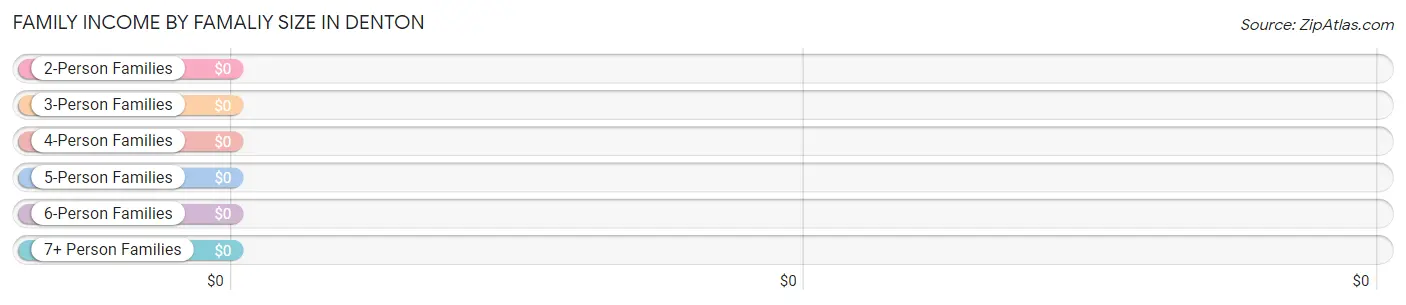
Family Income by Famaliy Size in Denton
| Income Bracket | # Families | Median Income |
| 2-Person Families | 40 (58.0%) | $0 |
| 3-Person Families | 22 (31.9%) | $0 |
| 4-Person Families | 0 (0.0%) | $0 |
| 5-Person Families | 6 (8.7%) | $0 |
| 6-Person Families | 0 (0.0%) | $0 |
| 7+ Person Families | 1 (1.5%) | $0 |
| Total | 69 (100.0%) | $30,250 |
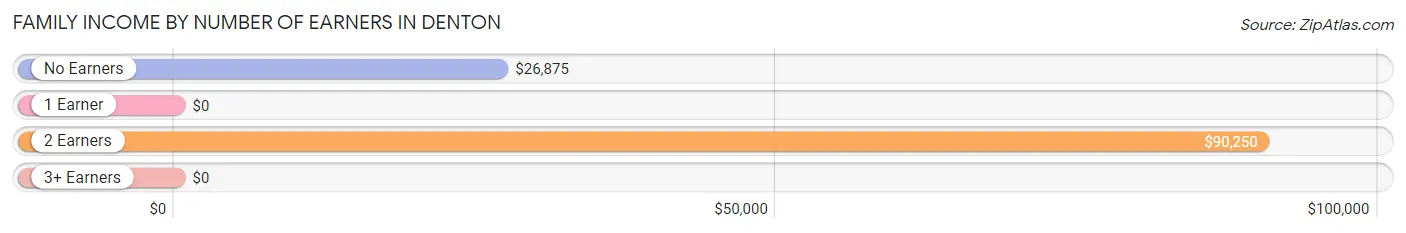
Family Income by Number of Earners in Denton
| Number of Earners | # Families | Median Income |
| No Earners | 43 (62.3%) | $26,875 |
| 1 Earner | 8 (11.6%) | $0 |
| 2 Earners | 18 (26.1%) | $90,250 |
| 3+ Earners | 0 (0.0%) | $0 |
| Total | 69 (100.0%) | $30,250 |
Household Income in Denton
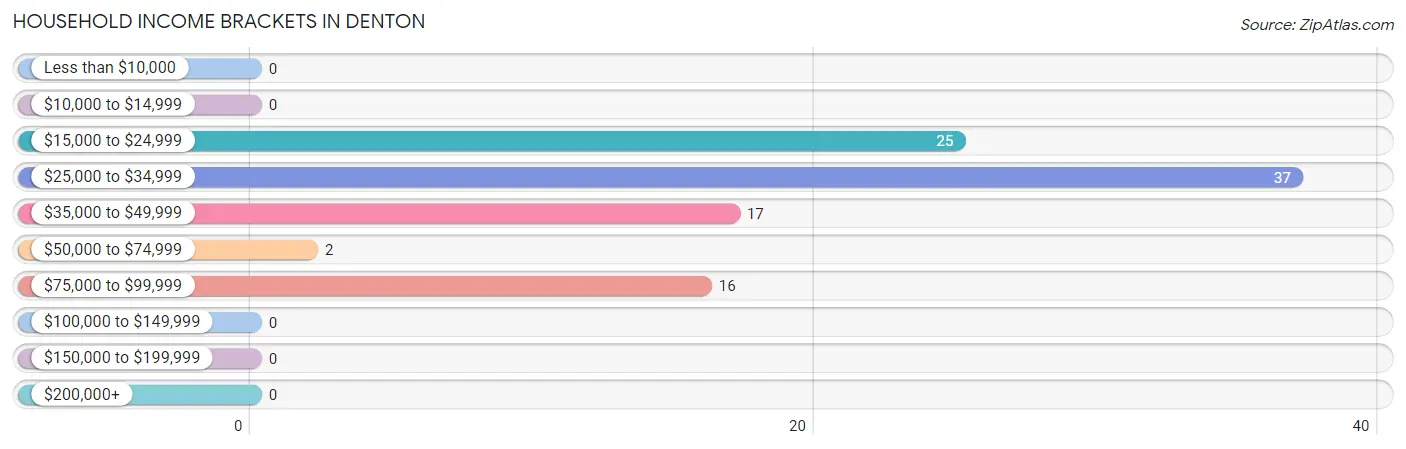
Household Income Brackets in Denton
With 37 households falling in the category, the $25,000 to $34,999 income range is the most frequent in Denton, accounting for 38.1% of all households.
| Income Bracket | # Households | % Households |
| Less than $10,000 | 0 | 0.0% |
| $10,000 to $14,999 | 0 | 0.0% |
| $15,000 to $24,999 | 25 | 25.8% |
| $25,000 to $34,999 | 37 | 38.1% |
| $35,000 to $49,999 | 17 | 17.5% |
| $50,000 to $74,999 | 2 | 2.1% |
| $75,000 to $99,999 | 16 | 16.5% |
| $100,000 to $149,999 | 0 | 0.0% |
| $150,000 to $199,999 | 0 | 0.0% |
| $200,000+ | 0 | 0.0% |
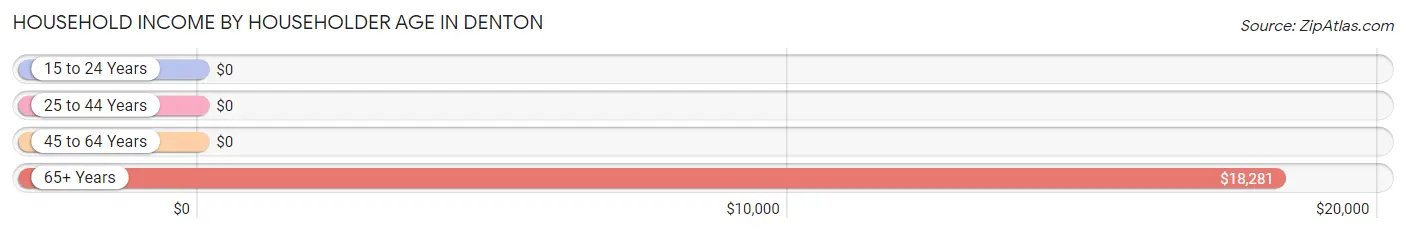
Household Income by Householder Age in Denton
The median household income in Denton is $30,250, with the highest median household income of $18,281 found in the 65+ years age bracket for the primary householder. A total of 21 households (21.6%) fall into this category. Meanwhile, the 15 to 24 years age bracket for the primary householder has the lowest median household income of $0, with 6 households (6.2%) in this group.
| Income Bracket | # Households | Median Income |
| 15 to 24 Years | 6 (6.2%) | $0 |
| 25 to 44 Years | 36 (37.1%) | $0 |
| 45 to 64 Years | 34 (35.0%) | $0 |
| 65+ Years | 21 (21.6%) | $18,281 |
| Total | 97 (100.0%) | $30,250 |
Poverty in Denton
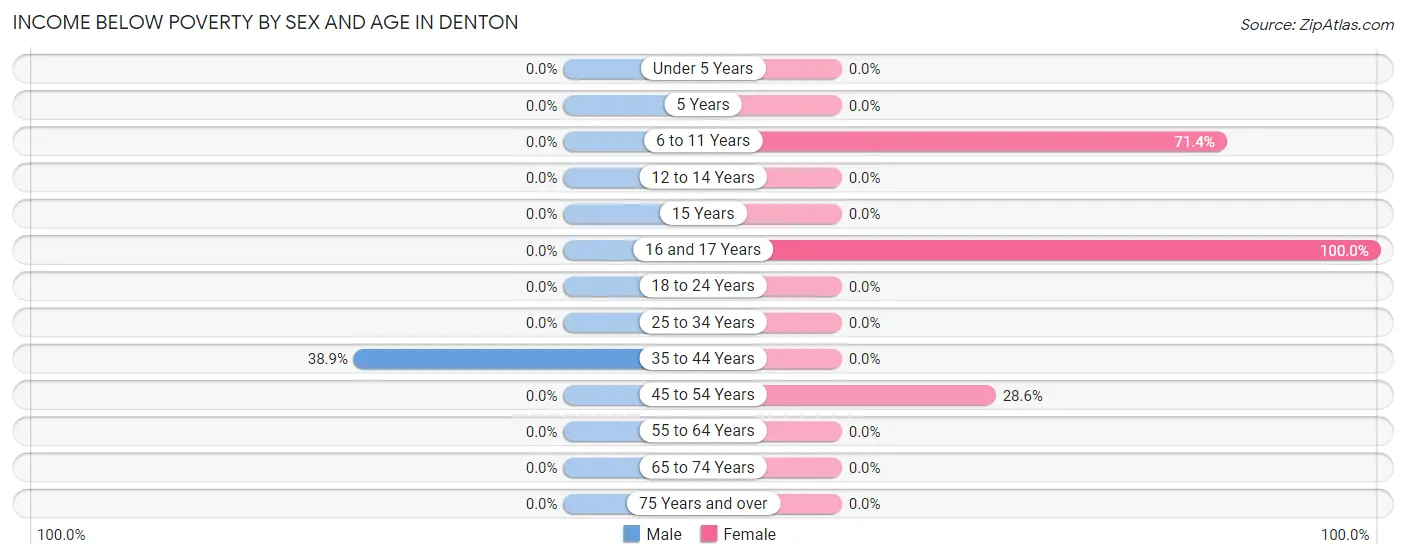
Income Below Poverty by Sex and Age in Denton
With 12.0% poverty level for males and 12.1% for females among the residents of Denton, 35 to 44 year old males and 16 and 17 year old females are the most vulnerable to poverty, with 14 males (38.9%) and 6 females (100.0%) in their respective age groups living below the poverty level.
| Age Bracket | Male | Female |
| Under 5 Years | 0 (0.0%) | 0 (0.0%) |
| 5 Years | 0 (0.0%) | 0 (0.0%) |
| 6 to 11 Years | 0 (0.0%) | 5 (71.4%) |
| 12 to 14 Years | 0 (0.0%) | 0 (0.0%) |
| 15 Years | 0 (0.0%) | 0 (0.0%) |
| 16 and 17 Years | 0 (0.0%) | 6 (100.0%) |
| 18 to 24 Years | 0 (0.0%) | 0 (0.0%) |
| 25 to 34 Years | 0 (0.0%) | 0 (0.0%) |
| 35 to 44 Years | 14 (38.9%) | 0 (0.0%) |
| 45 to 54 Years | 0 (0.0%) | 6 (28.6%) |
| 55 to 64 Years | 0 (0.0%) | 0 (0.0%) |
| 65 to 74 Years | 0 (0.0%) | 0 (0.0%) |
| 75 Years and over | 0 (0.0%) | 0 (0.0%) |
| Total | 14 (12.0%) | 17 (12.1%) |
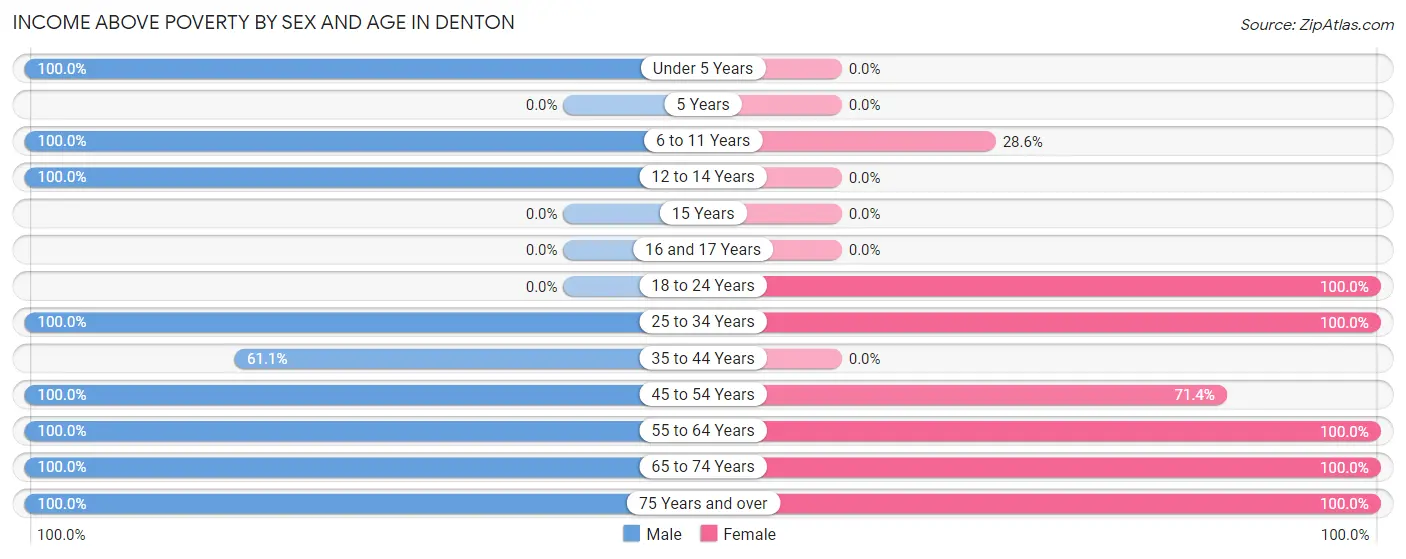
Income Above Poverty by Sex and Age in Denton
According to the poverty statistics in Denton, males aged under 5 years and females aged 18 to 24 years are the age groups that are most secure financially, with 100.0% of males and 100.0% of females in these age groups living above the poverty line.
| Age Bracket | Male | Female |
| Under 5 Years | 5 (100.0%) | 0 (0.0%) |
| 5 Years | 0 (0.0%) | 0 (0.0%) |
| 6 to 11 Years | 2 (100.0%) | 2 (28.6%) |
| 12 to 14 Years | 21 (100.0%) | 0 (0.0%) |
| 15 Years | 0 (0.0%) | 0 (0.0%) |
| 16 and 17 Years | 0 (0.0%) | 0 (0.0%) |
| 18 to 24 Years | 0 (0.0%) | 6 (100.0%) |
| 25 to 34 Years | 19 (100.0%) | 2 (100.0%) |
| 35 to 44 Years | 22 (61.1%) | 0 (0.0%) |
| 45 to 54 Years | 3 (100.0%) | 15 (71.4%) |
| 55 to 64 Years | 17 (100.0%) | 88 (100.0%) |
| 65 to 74 Years | 8 (100.0%) | 4 (100.0%) |
| 75 Years and over | 6 (100.0%) | 6 (100.0%) |
| Total | 103 (88.0%) | 123 (87.9%) |
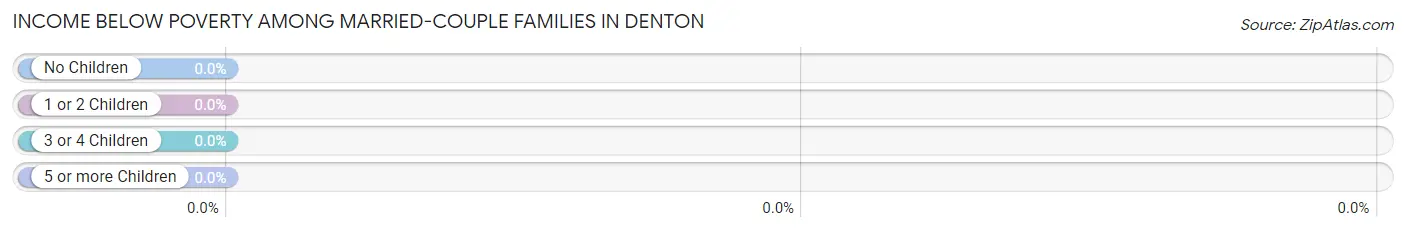
Income Below Poverty Among Married-Couple Families in Denton
| Children | Above Poverty | Below Poverty |
| No Children | 35 (100.0%) | 0 (0.0%) |
| 1 or 2 Children | 0 (0.0%) | 0 (0.0%) |
| 3 or 4 Children | 0 (0.0%) | 0 (0.0%) |
| 5 or more Children | 1 (100.0%) | 0 (0.0%) |
| Total | 36 (100.0%) | 0 (0.0%) |
Income Below Poverty Among Single-Parent Households in Denton
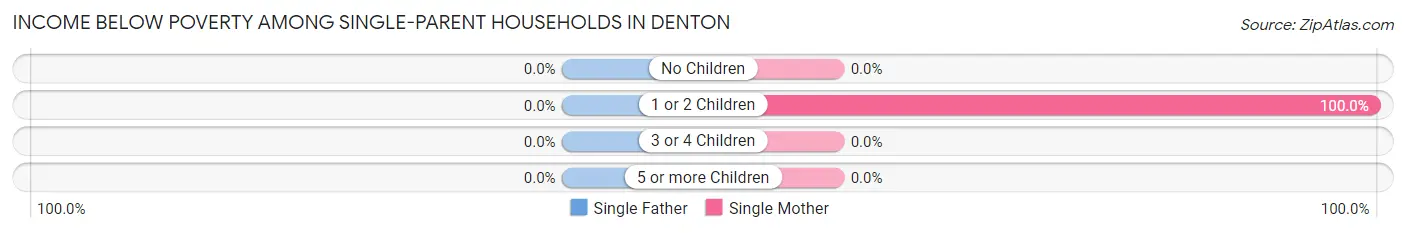
| Children | Single Father | Single Mother |
| No Children | 0 (0.0%) | 0 (0.0%) |
| 1 or 2 Children | 0 (0.0%) | 6 (100.0%) |
| 3 or 4 Children | 0 (0.0%) | 0 (0.0%) |
| 5 or more Children | 0 (0.0%) | 0 (0.0%) |
| Total | 0 (0.0%) | 6 (66.7%) |
Income Below Poverty Among Married-Couple vs Single-Parent Households in Denton
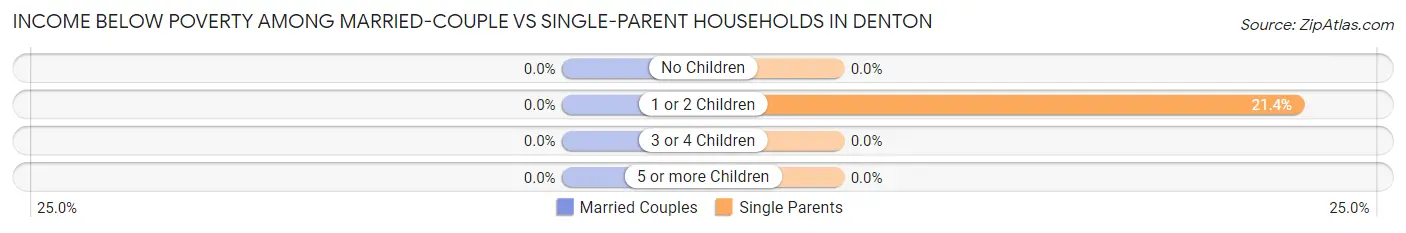
| Children | Married-Couple Families | Single-Parent Households |
| No Children | 0 (0.0%) | 0 (0.0%) |
| 1 or 2 Children | 0 (0.0%) | 6 (21.4%) |
| 3 or 4 Children | 0 (0.0%) | 0 (0.0%) |
| 5 or more Children | 0 (0.0%) | 0 (0.0%) |
| Total | 0 (0.0%) | 6 (18.2%) |
Race in Denton
The most populous races in Denton are Two or more Races (117 | 45.5%), Hispanic or Latino (113 | 44.0%), and White / Caucasian (106 | 41.2%).
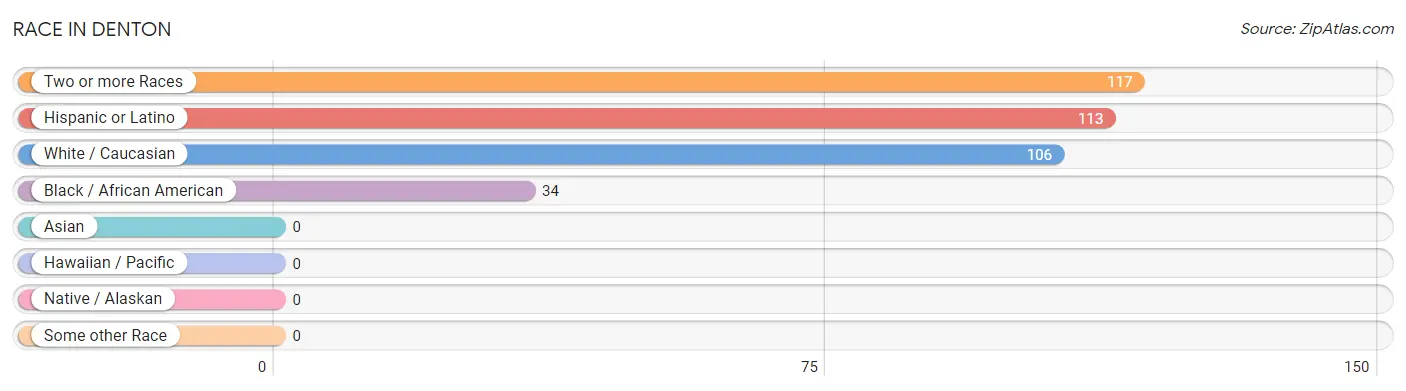
| Race | # Population | % Population |
| Asian | 0 | 0.0% |
| Black / African American | 34 | 13.2% |
| Hawaiian / Pacific | 0 | 0.0% |
| Hispanic or Latino | 113 | 44.0% |
| Native / Alaskan | 0 | 0.0% |
| White / Caucasian | 106 | 41.2% |
| Two or more Races | 117 | 45.5% |
| Some other Race | 0 | 0.0% |
| Total | 257 | 100.0% |
Ancestry in Denton
The most populous ancestries reported in Denton are Mexican (113 | 44.0%), American (6 | 2.3%), English (6 | 2.3%), German (6 | 2.3%), and Irish (2 | 0.8%), together accounting for 51.7% of all Denton residents.
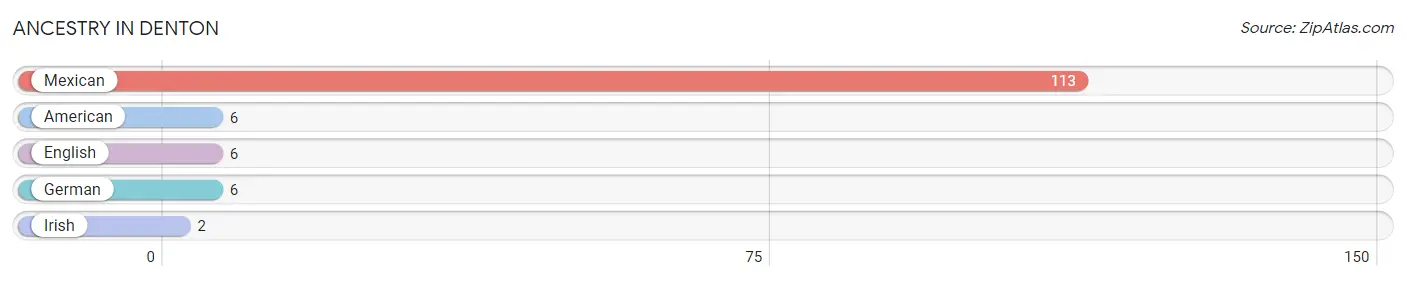
| Ancestry | # Population | % Population |
| American | 6 | 2.3% |
| English | 6 | 2.3% |
| German | 6 | 2.3% |
| Irish | 2 | 0.8% |
| Mexican | 113 | 44.0% | View All 5 Rows |
Immigrants in Denton

| Immigration Origin | # Population | % Population | View All 0 Rows |
Sex and Age in Denton
Sex and Age in Denton
The most populous age groups in Denton are 35 to 39 Years (36 | 30.8%) for men and 55 to 59 Years (87 | 62.1%) for women.
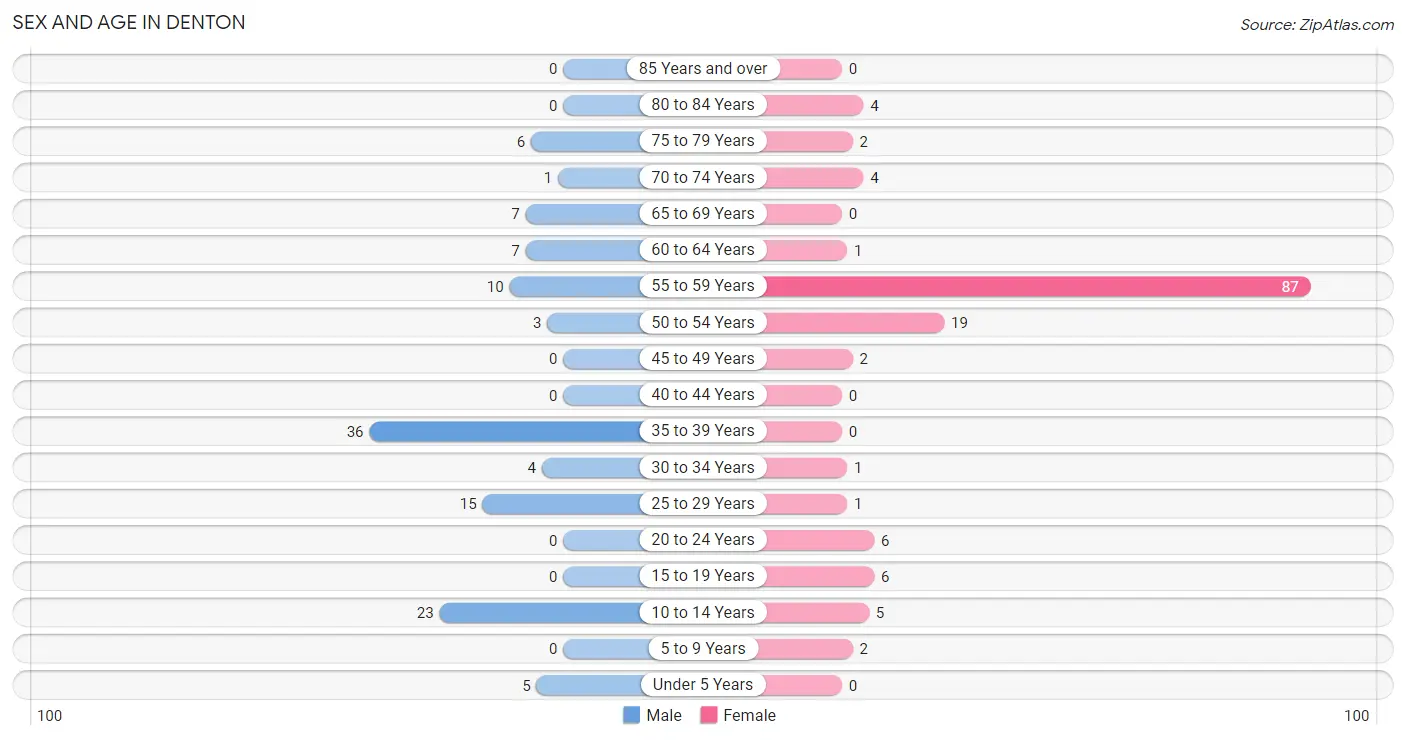
| Age Bracket | Male | Female |
| Under 5 Years | 5 (4.3%) | 0 (0.0%) |
| 5 to 9 Years | 0 (0.0%) | 2 (1.4%) |
| 10 to 14 Years | 23 (19.7%) | 5 (3.6%) |
| 15 to 19 Years | 0 (0.0%) | 6 (4.3%) |
| 20 to 24 Years | 0 (0.0%) | 6 (4.3%) |
| 25 to 29 Years | 15 (12.8%) | 1 (0.7%) |
| 30 to 34 Years | 4 (3.4%) | 1 (0.7%) |
| 35 to 39 Years | 36 (30.8%) | 0 (0.0%) |
| 40 to 44 Years | 0 (0.0%) | 0 (0.0%) |
| 45 to 49 Years | 0 (0.0%) | 2 (1.4%) |
| 50 to 54 Years | 3 (2.6%) | 19 (13.6%) |
| 55 to 59 Years | 10 (8.6%) | 87 (62.1%) |
| 60 to 64 Years | 7 (6.0%) | 1 (0.7%) |
| 65 to 69 Years | 7 (6.0%) | 0 (0.0%) |
| 70 to 74 Years | 1 (0.9%) | 4 (2.9%) |
| 75 to 79 Years | 6 (5.1%) | 2 (1.4%) |
| 80 to 84 Years | 0 (0.0%) | 4 (2.9%) |
| 85 Years and over | 0 (0.0%) | 0 (0.0%) |
| Total | 117 (100.0%) | 140 (100.0%) |
Families and Households in Denton
Median Family Size in Denton
The median family size in Denton is 3.29 persons per family, with single male/father families (24 | 34.8%) accounting for the largest median family size of 4.96 persons per family. On the other hand, married-couple families (36 | 52.2%) represent the smallest median family size with 1.94 persons per family.
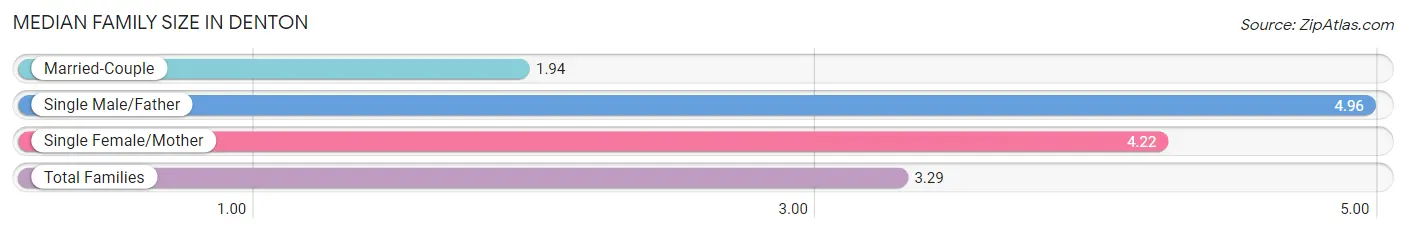
| Family Type | # Families | Family Size |
| Married-Couple | 36 (52.2%) | 1.94 |
| Single Male/Father | 24 (34.8%) | 4.96 |
| Single Female/Mother | 9 (13.0%) | 4.22 |
| Total Families | 69 (100.0%) | 3.29 |
Median Household Size in Denton
The median household size in Denton is 2.65 persons per household, with single male/father households (24 | 24.7%) accounting for the largest median household size of 4.96 persons per household. non-family households (28 | 28.9%) represent the smallest median household size with 1.07 persons per household.
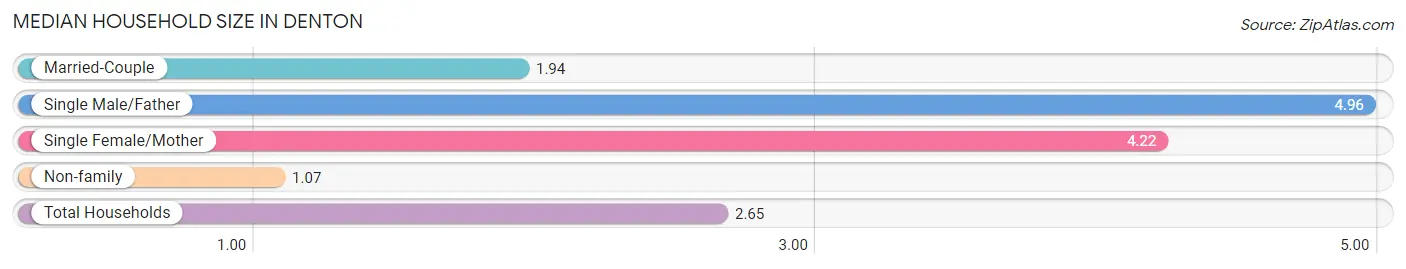
| Household Type | # Households | Household Size |
| Married-Couple | 36 (37.1%) | 1.94 |
| Single Male/Father | 24 (24.7%) | 4.96 |
| Single Female/Mother | 9 (9.3%) | 4.22 |
| Non-family | 28 (28.9%) | 1.07 |
| Total Households | 97 (100.0%) | 2.65 |
Household Size by Marriage Status in Denton
Out of a total of 97 households in Denton, 69 (71.1%) are family households, while 28 (28.9%) are nonfamily households. The most numerous type of family households are 2-person households, comprising 40, and the most common type of nonfamily households are 1-person households, comprising 26.
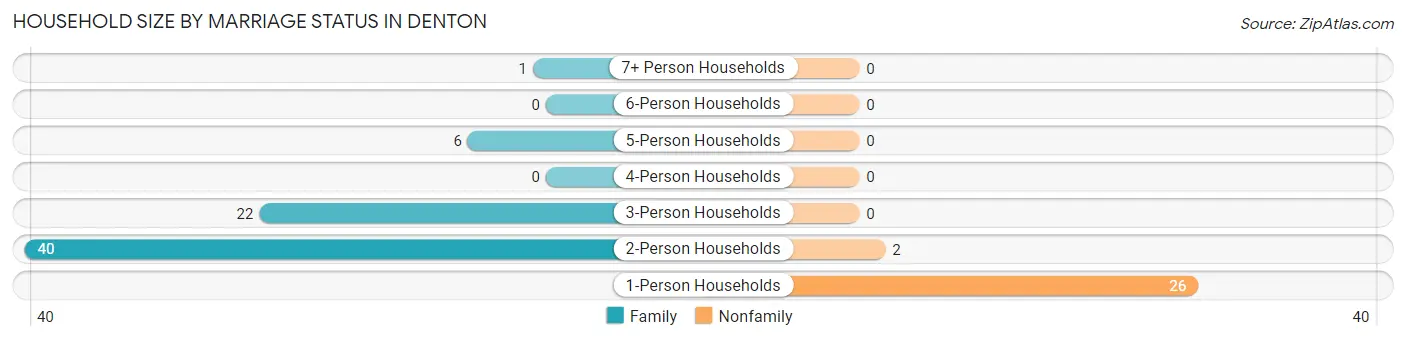
| Household Size | Family Households | Nonfamily Households |
| 1-Person Households | - | 26 (26.8%) |
| 2-Person Households | 40 (41.2%) | 2 (2.1%) |
| 3-Person Households | 22 (22.7%) | 0 (0.0%) |
| 4-Person Households | 0 (0.0%) | 0 (0.0%) |
| 5-Person Households | 6 (6.2%) | 0 (0.0%) |
| 6-Person Households | 0 (0.0%) | 0 (0.0%) |
| 7+ Person Households | 1 (1.0%) | 0 (0.0%) |
| Total | 69 (71.1%) | 28 (28.9%) |
Female Fertility in Denton
Fertility by Age in Denton
Average fertility rate in Denton is 63.0 births per 1,000 women. Women in the age bracket of 20 to 34 years have the highest fertility rate with 125.0 births per 1,000 women. Women in the age bracket of 20 to 34 years acount for 100.0% of all women with births.
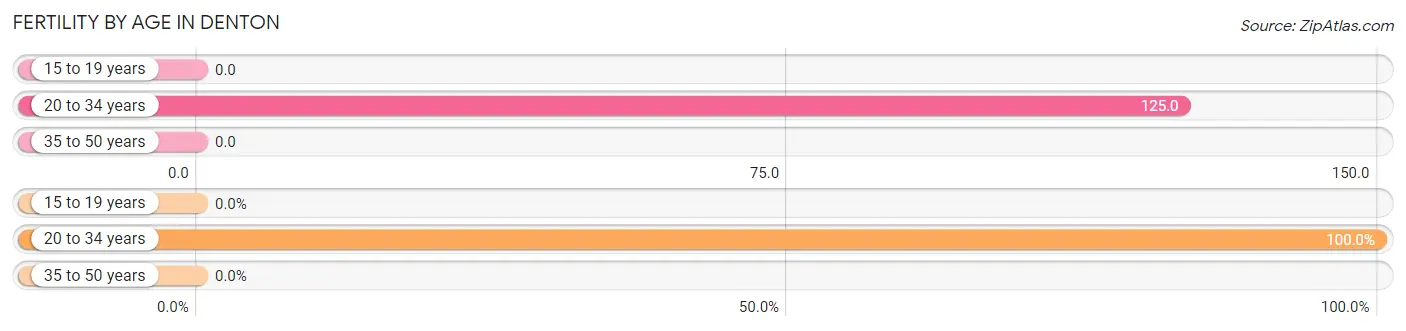
| Age Bracket | Women with Births | Births / 1,000 Women |
| 15 to 19 years | 0 (0.0%) | 0.0 |
| 20 to 34 years | 1 (100.0%) | 125.0 |
| 35 to 50 years | 0 (0.0%) | 0.0 |
| Total | 1 (100.0%) | 63.0 |
Fertility by Age by Marriage Status in Denton
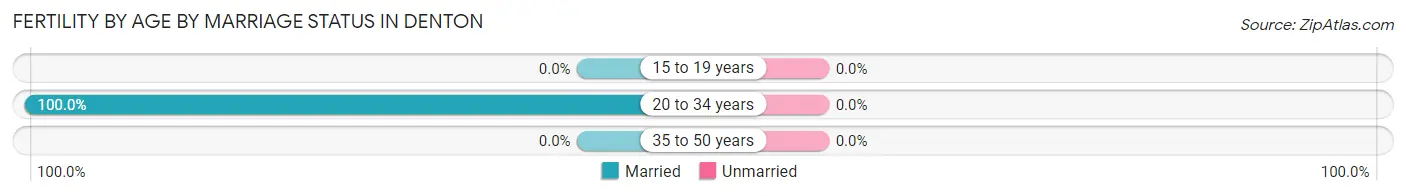
| Age Bracket | Married | Unmarried |
| 15 to 19 years | 0 (0.0%) | 0 (0.0%) |
| 20 to 34 years | 1 (100.0%) | 0 (0.0%) |
| 35 to 50 years | 0 (0.0%) | 0 (0.0%) |
| Total | 1 (100.0%) | 0 (0.0%) |
Fertility by Education in Denton
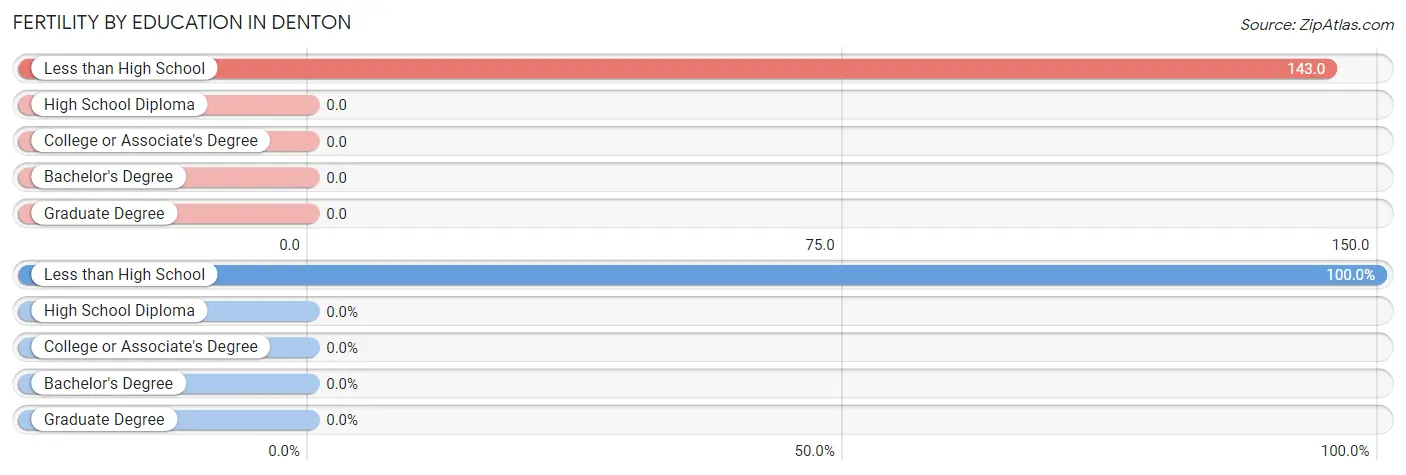
| Educational Attainment | Women with Births | Births / 1,000 Women |
| Less than High School | 1 (100.0%) | 143.0 |
| High School Diploma | 0 (0.0%) | 0.0 |
| College or Associate's Degree | 0 (0.0%) | 0.0 |
| Bachelor's Degree | 0 (0.0%) | 0.0 |
| Graduate Degree | 0 (0.0%) | 0.0 |
| Total | 1 (100.0%) | 63.0 |
Fertility by Education by Marriage Status in Denton
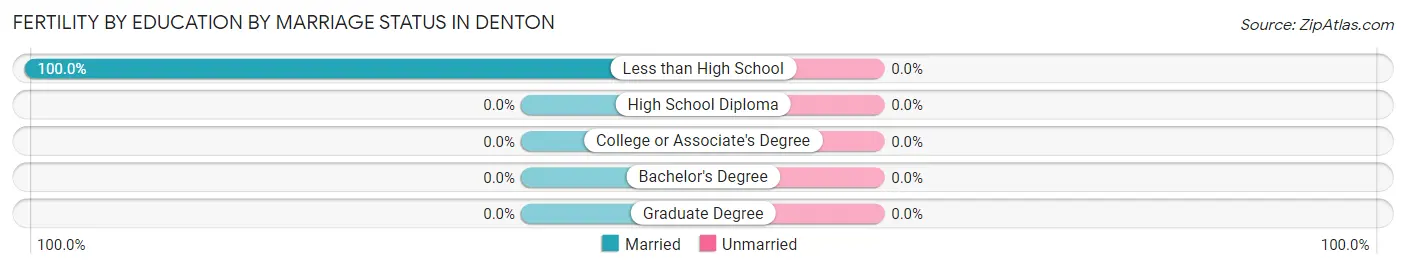
| Educational Attainment | Married | Unmarried |
| Less than High School | 1 (100.0%) | 0 (0.0%) |
| High School Diploma | 0 (0.0%) | 0 (0.0%) |
| College or Associate's Degree | 0 (0.0%) | 0 (0.0%) |
| Bachelor's Degree | 0 (0.0%) | 0 (0.0%) |
| Graduate Degree | 0 (0.0%) | 0 (0.0%) |
| Total | 1 (100.0%) | 0 (0.0%) |
Employment Characteristics in Denton
Employment by Class of Employer in Denton
Among the 59 employed individuals in Denton, private company employees (35 | 59.3%), local government employees (11 | 18.6%), and state government employees (8 | 13.6%) make up the most common classes of employment.
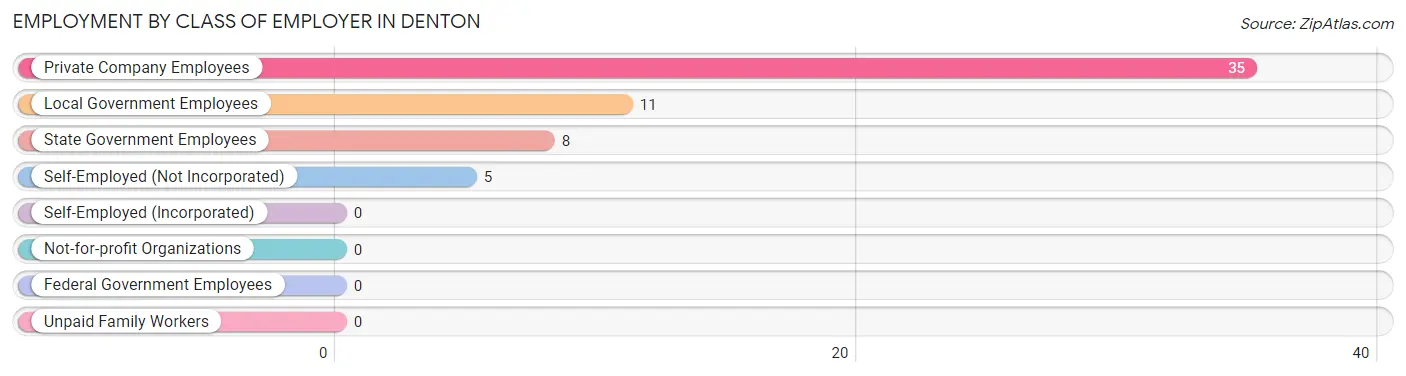
| Employer Class | # Employees | % Employees |
| Private Company Employees | 35 | 59.3% |
| Self-Employed (Incorporated) | 0 | 0.0% |
| Self-Employed (Not Incorporated) | 5 | 8.5% |
| Not-for-profit Organizations | 0 | 0.0% |
| Local Government Employees | 11 | 18.6% |
| State Government Employees | 8 | 13.6% |
| Federal Government Employees | 0 | 0.0% |
| Unpaid Family Workers | 0 | 0.0% |
| Total | 59 | 100.0% |
Employment Status by Age in Denton
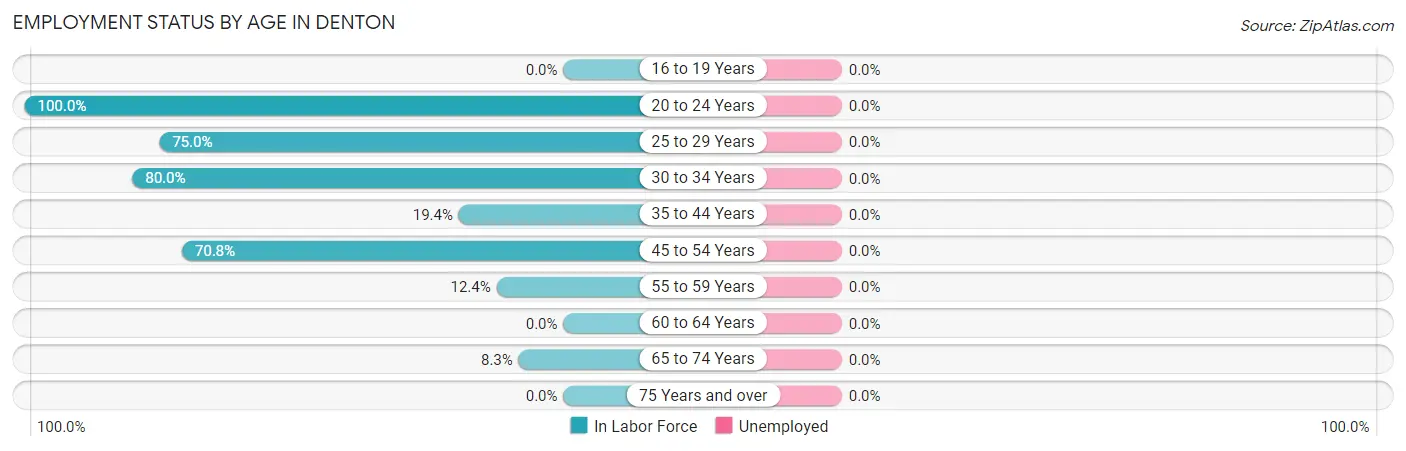
| Age Bracket | In Labor Force | Unemployed |
| 16 to 19 Years | 0 (0.0%) | 0 (0.0%) |
| 20 to 24 Years | 6 (100.0%) | 0 (0.0%) |
| 25 to 29 Years | 12 (75.0%) | 0 (0.0%) |
| 30 to 34 Years | 4 (80.0%) | 0 (0.0%) |
| 35 to 44 Years | 7 (19.4%) | 0 (0.0%) |
| 45 to 54 Years | 17 (70.8%) | 0 (0.0%) |
| 55 to 59 Years | 12 (12.4%) | 0 (0.0%) |
| 60 to 64 Years | 0 (0.0%) | 0 (0.0%) |
| 65 to 74 Years | 1 (8.3%) | 0 (0.0%) |
| 75 Years and over | 0 (0.0%) | 0 (0.0%) |
| Total | 59 (26.6%) | 0 (0.0%) |
Employment Status by Educational Attainment in Denton
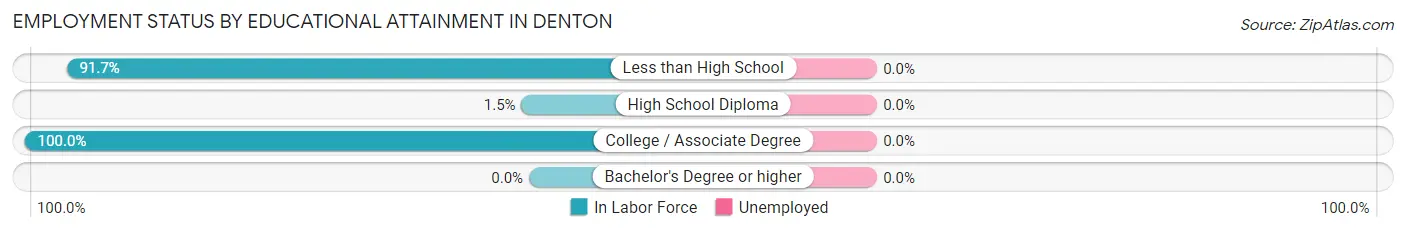
| Educational Attainment | In Labor Force | Unemployed |
| Less than High School | 11 (91.7%) | 0 (0.0%) |
| High School Diploma | 2 (1.5%) | 0 (0.0%) |
| College / Associate Degree | 39 (100.0%) | 0 (0.0%) |
| Bachelor's Degree or higher | 0 (0.0%) | 0 (0.0%) |
| Total | 52 (28.0%) | 0 (0.0%) |
Employment Occupations by Sex in Denton
Management, Business, Science and Arts Occupations
The most common Management, Business, Science and Arts occupations in Denton are , and Management (13 | 22.0%).
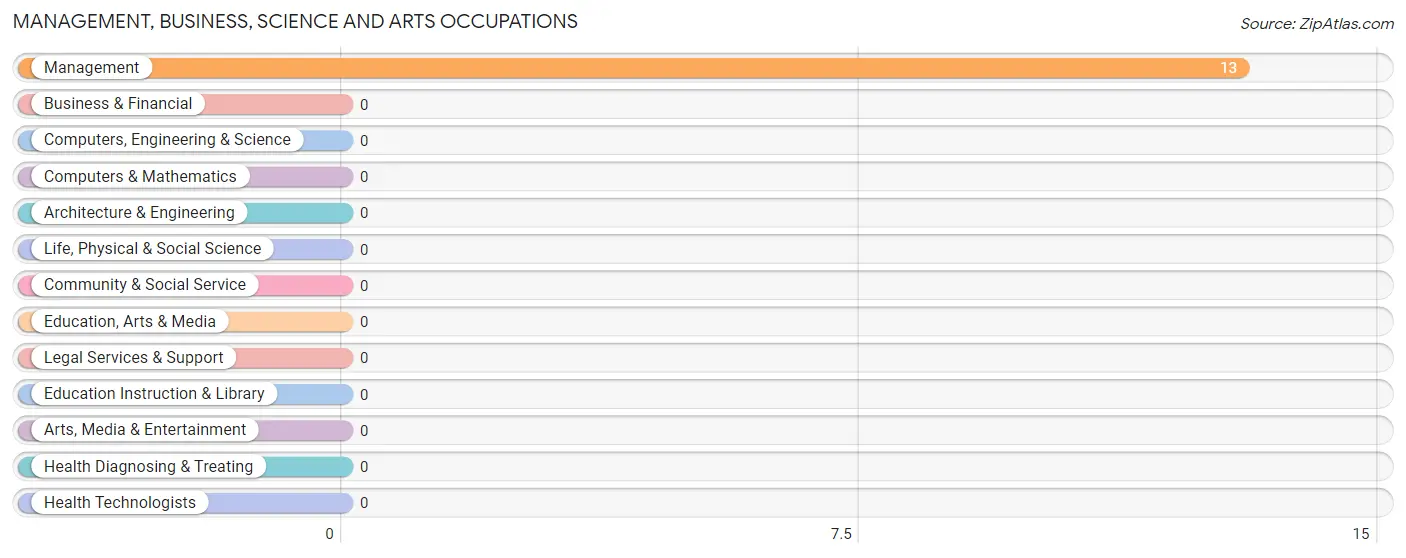
Management, Business, Science and Arts Occupations by Sex
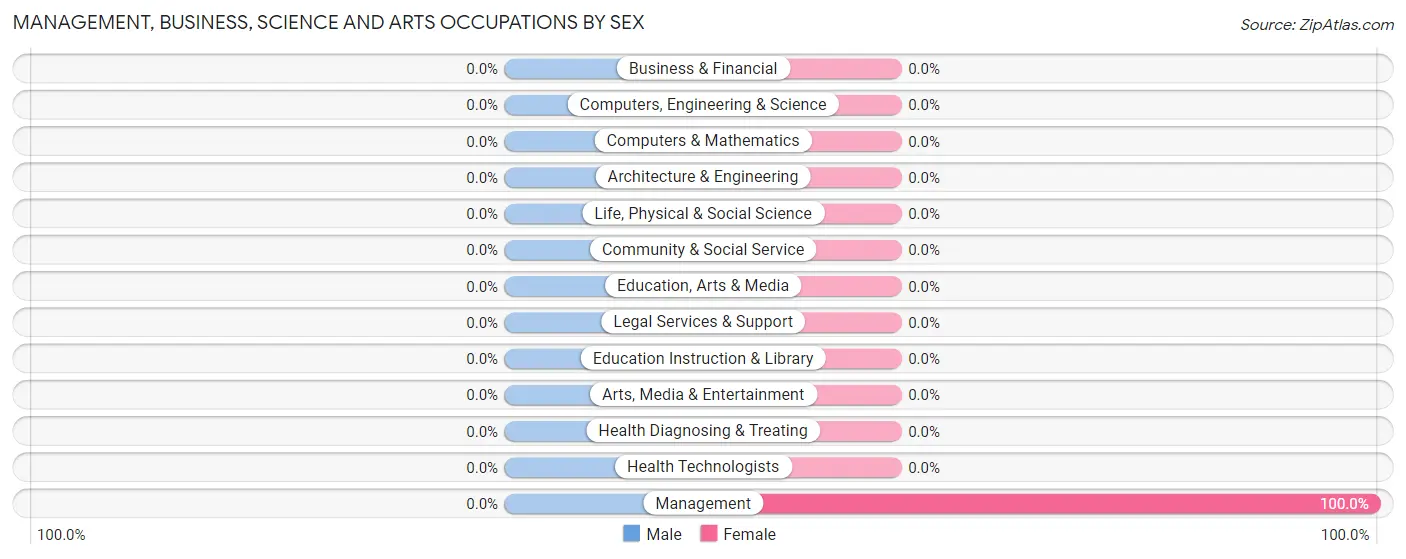
| Occupation | Male | Female |
| Management | 0 (0.0%) | 13 (100.0%) |
| Business & Financial | 0 (0.0%) | 0 (0.0%) |
| Computers, Engineering & Science | 0 (0.0%) | 0 (0.0%) |
| Computers & Mathematics | 0 (0.0%) | 0 (0.0%) |
| Architecture & Engineering | 0 (0.0%) | 0 (0.0%) |
| Life, Physical & Social Science | 0 (0.0%) | 0 (0.0%) |
| Community & Social Service | 0 (0.0%) | 0 (0.0%) |
| Education, Arts & Media | 0 (0.0%) | 0 (0.0%) |
| Legal Services & Support | 0 (0.0%) | 0 (0.0%) |
| Education Instruction & Library | 0 (0.0%) | 0 (0.0%) |
| Arts, Media & Entertainment | 0 (0.0%) | 0 (0.0%) |
| Health Diagnosing & Treating | 0 (0.0%) | 0 (0.0%) |
| Health Technologists | 0 (0.0%) | 0 (0.0%) |
| Total (Category) | 0 (0.0%) | 13 (100.0%) |
| Total (Overall) | 35 (59.3%) | 24 (40.7%) |
Services Occupations
The most common Services occupations in Denton are Security & Protection (10 | 17.0%), and Law Enforcement (10 | 17.0%).
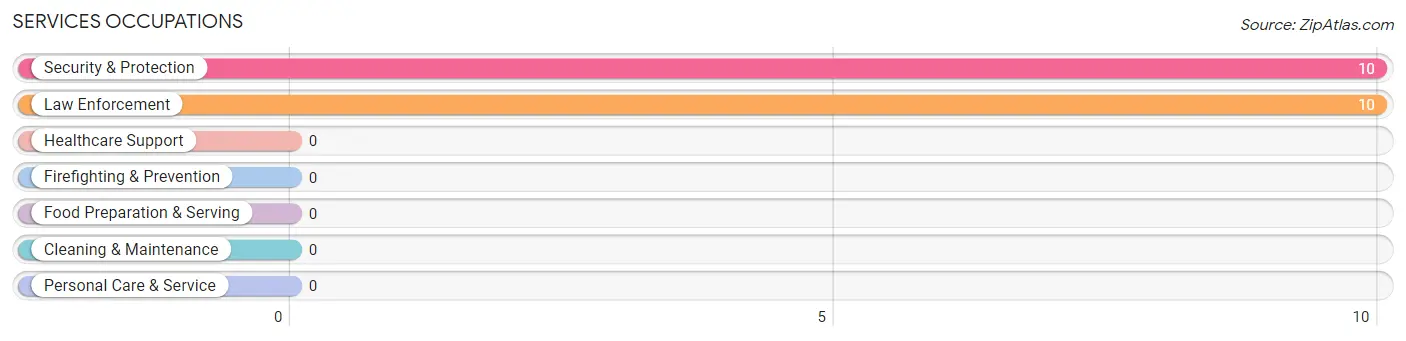
Services Occupations by Sex
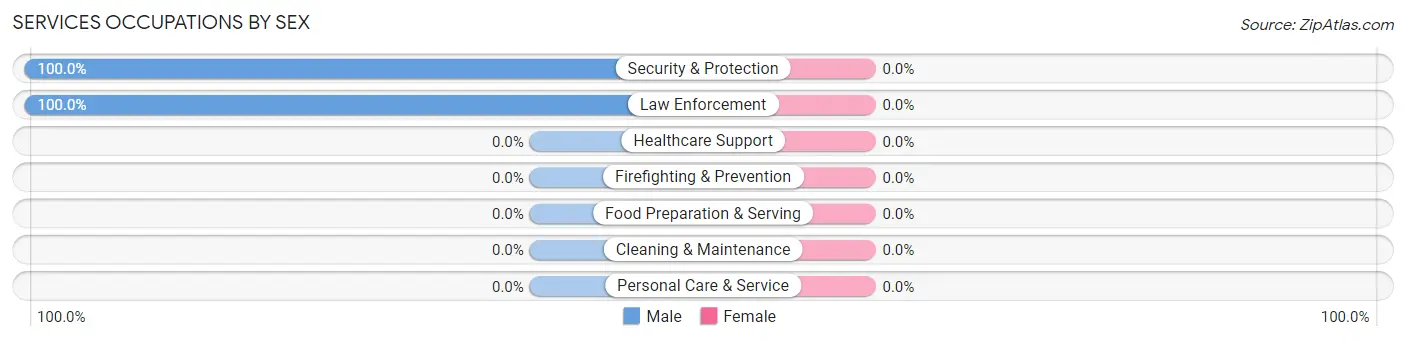
| Occupation | Male | Female |
| Healthcare Support | 0 (0.0%) | 0 (0.0%) |
| Security & Protection | 10 (100.0%) | 0 (0.0%) |
| Firefighting & Prevention | 0 (0.0%) | 0 (0.0%) |
| Law Enforcement | 10 (100.0%) | 0 (0.0%) |
| Food Preparation & Serving | 0 (0.0%) | 0 (0.0%) |
| Cleaning & Maintenance | 0 (0.0%) | 0 (0.0%) |
| Personal Care & Service | 0 (0.0%) | 0 (0.0%) |
| Total (Category) | 10 (100.0%) | 0 (0.0%) |
| Total (Overall) | 35 (59.3%) | 24 (40.7%) |
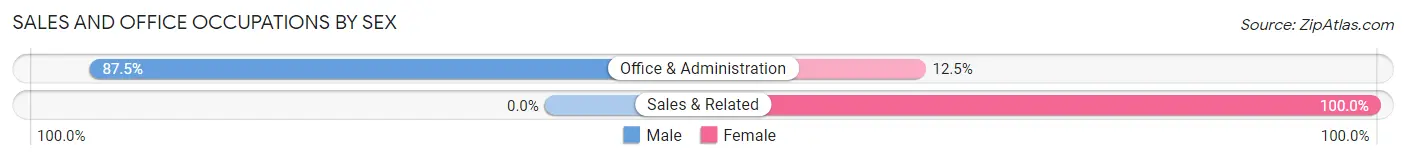
Sales and Office Occupations
The most common Sales and Office occupations in Denton are Office & Administration (8 | 13.6%), and Sales & Related (6 | 10.2%).
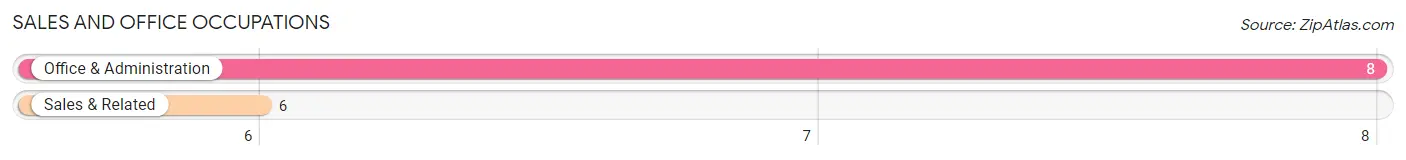
Sales and Office Occupations by Sex
| Occupation | Male | Female |
| Sales & Related | 0 (0.0%) | 6 (100.0%) |
| Office & Administration | 7 (87.5%) | 1 (12.5%) |
| Total (Category) | 7 (50.0%) | 7 (50.0%) |
| Total (Overall) | 35 (59.3%) | 24 (40.7%) |
Natural Resources, Construction and Maintenance Occupations
The most common Natural Resources, Construction and Maintenance occupations in Denton are , and Installation, Maintenance & Repair (2 | 3.4%).
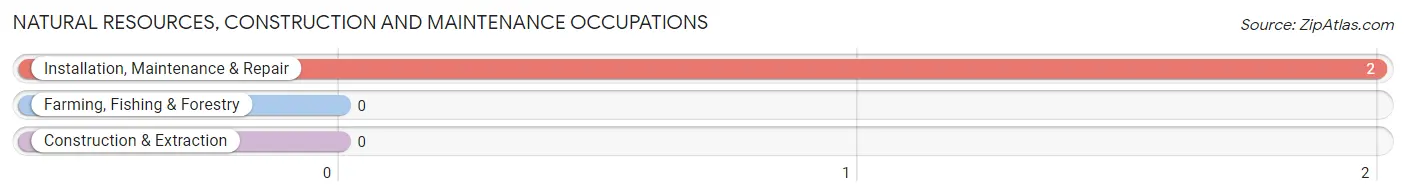
Natural Resources, Construction and Maintenance Occupations by Sex
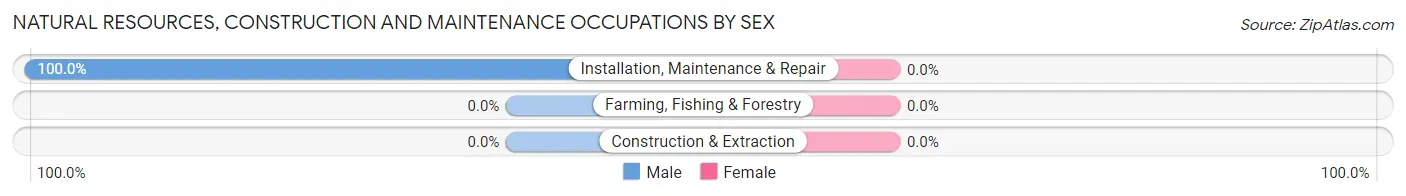
| Occupation | Male | Female |
| Farming, Fishing & Forestry | 0 (0.0%) | 0 (0.0%) |
| Construction & Extraction | 0 (0.0%) | 0 (0.0%) |
| Installation, Maintenance & Repair | 2 (100.0%) | 0 (0.0%) |
| Total (Category) | 2 (100.0%) | 0 (0.0%) |
| Total (Overall) | 35 (59.3%) | 24 (40.7%) |
Production, Transportation and Moving Occupations
The most common Production, Transportation and Moving occupations in Denton are Production (12 | 20.3%), and Transportation (8 | 13.6%).
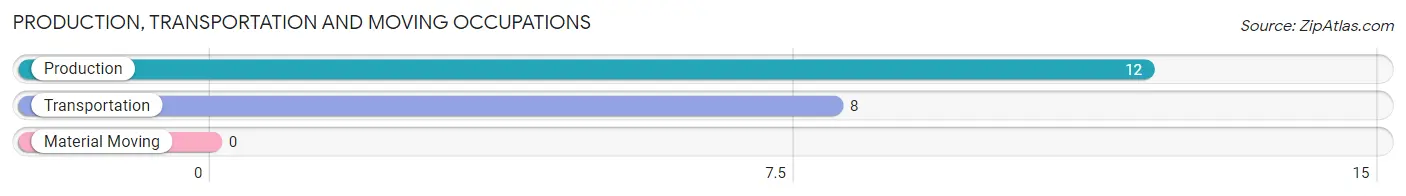
Production, Transportation and Moving Occupations by Sex
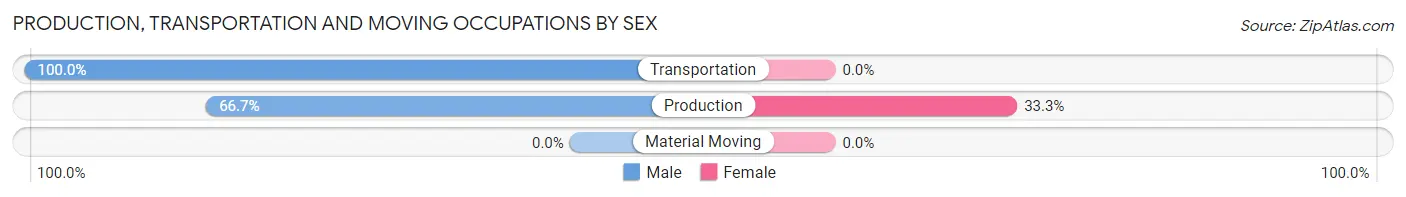
| Occupation | Male | Female |
| Production | 8 (66.7%) | 4 (33.3%) |
| Transportation | 8 (100.0%) | 0 (0.0%) |
| Material Moving | 0 (0.0%) | 0 (0.0%) |
| Total (Category) | 16 (80.0%) | 4 (20.0%) |
| Total (Overall) | 35 (59.3%) | 24 (40.7%) |
Employment Industries by Sex in Denton
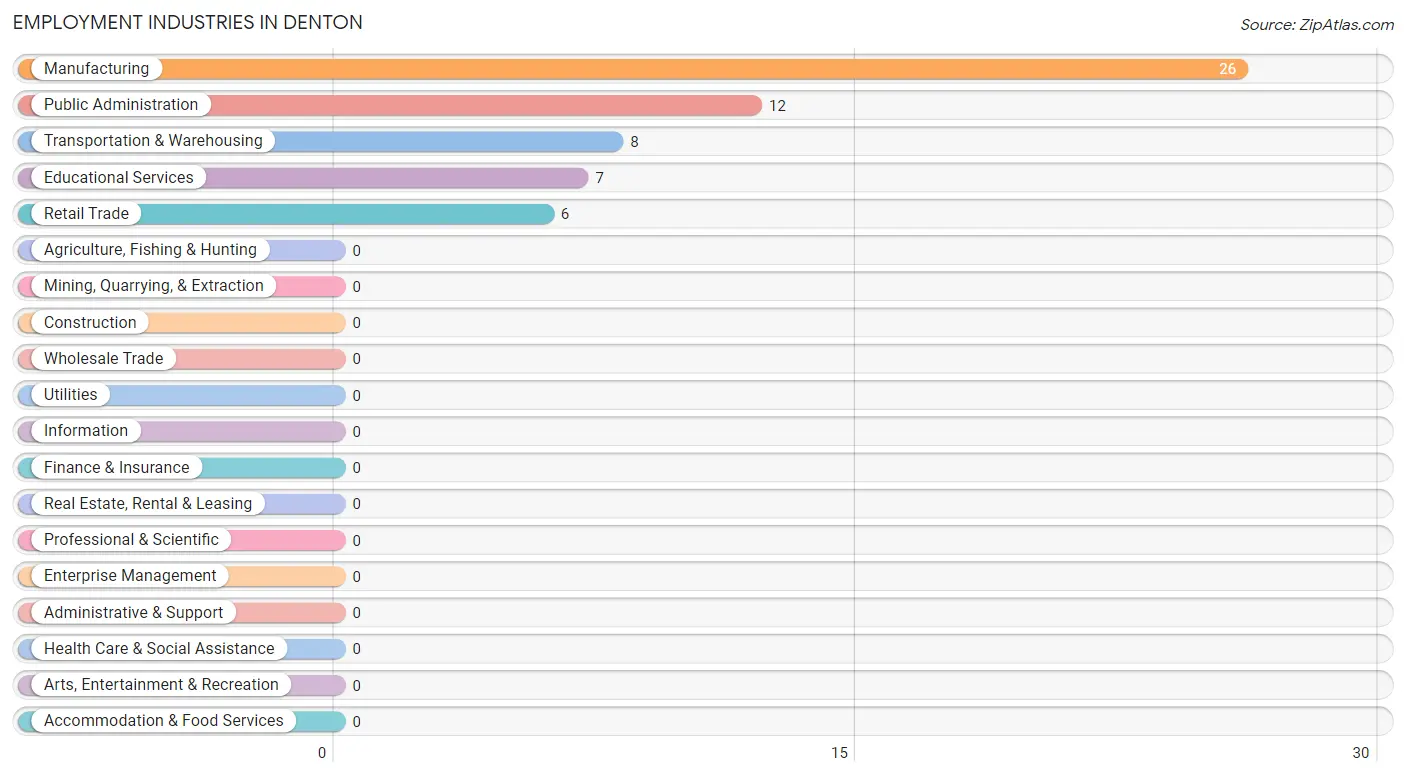
Employment Industries in Denton
The major employment industries in Denton include Manufacturing (26 | 44.1%), Public Administration (12 | 20.3%), Transportation & Warehousing (8 | 13.6%), Educational Services (7 | 11.9%), and Retail Trade (6 | 10.2%).
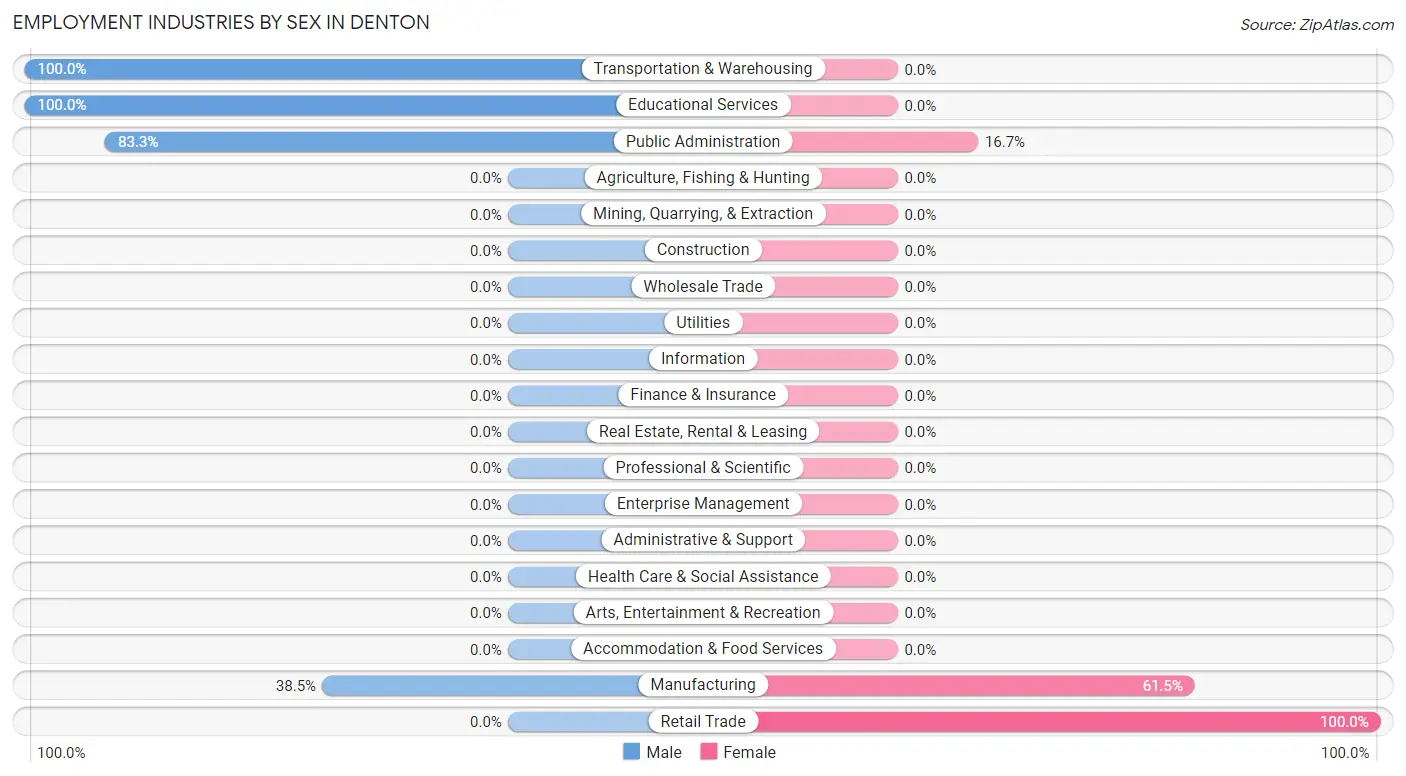
Employment Industries by Sex in Denton
The Denton industries that see more men than women are Transportation & Warehousing (100.0%), Educational Services (100.0%), and Public Administration (83.3%), whereas the industries that tend to have a higher number of women are Retail Trade (100.0%), Manufacturing (61.5%), and Public Administration (16.7%).
| Industry | Male | Female |
| Agriculture, Fishing & Hunting | 0 (0.0%) | 0 (0.0%) |
| Mining, Quarrying, & Extraction | 0 (0.0%) | 0 (0.0%) |
| Construction | 0 (0.0%) | 0 (0.0%) |
| Manufacturing | 10 (38.5%) | 16 (61.5%) |
| Wholesale Trade | 0 (0.0%) | 0 (0.0%) |
| Retail Trade | 0 (0.0%) | 6 (100.0%) |
| Transportation & Warehousing | 8 (100.0%) | 0 (0.0%) |
| Utilities | 0 (0.0%) | 0 (0.0%) |
| Information | 0 (0.0%) | 0 (0.0%) |
| Finance & Insurance | 0 (0.0%) | 0 (0.0%) |
| Real Estate, Rental & Leasing | 0 (0.0%) | 0 (0.0%) |
| Professional & Scientific | 0 (0.0%) | 0 (0.0%) |
| Enterprise Management | 0 (0.0%) | 0 (0.0%) |
| Administrative & Support | 0 (0.0%) | 0 (0.0%) |
| Educational Services | 7 (100.0%) | 0 (0.0%) |
| Health Care & Social Assistance | 0 (0.0%) | 0 (0.0%) |
| Arts, Entertainment & Recreation | 0 (0.0%) | 0 (0.0%) |
| Accommodation & Food Services | 0 (0.0%) | 0 (0.0%) |
| Public Administration | 10 (83.3%) | 2 (16.7%) |
| Total | 35 (59.3%) | 24 (40.7%) |
Education in Denton
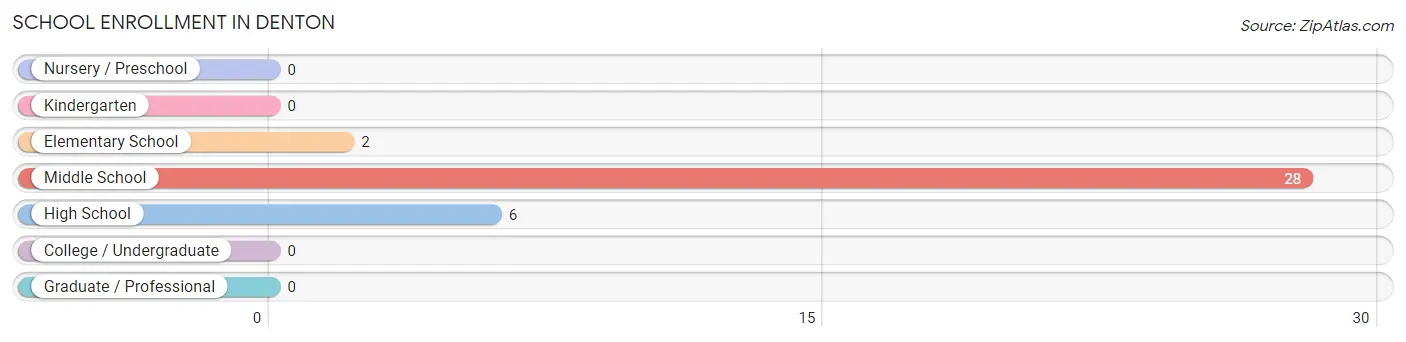
School Enrollment in Denton
The most common levels of schooling among the 36 students in Denton are middle school (28 | 77.8%), high school (6 | 16.7%), and elementary school (2 | 5.6%).
| School Level | # Students | % Students |
| Nursery / Preschool | 0 | 0.0% |
| Kindergarten | 0 | 0.0% |
| Elementary School | 2 | 5.6% |
| Middle School | 28 | 77.8% |
| High School | 6 | 16.7% |
| College / Undergraduate | 0 | 0.0% |
| Graduate / Professional | 0 | 0.0% |
| Total | 36 | 100.0% |
School Enrollment by Age by Funding Source in Denton
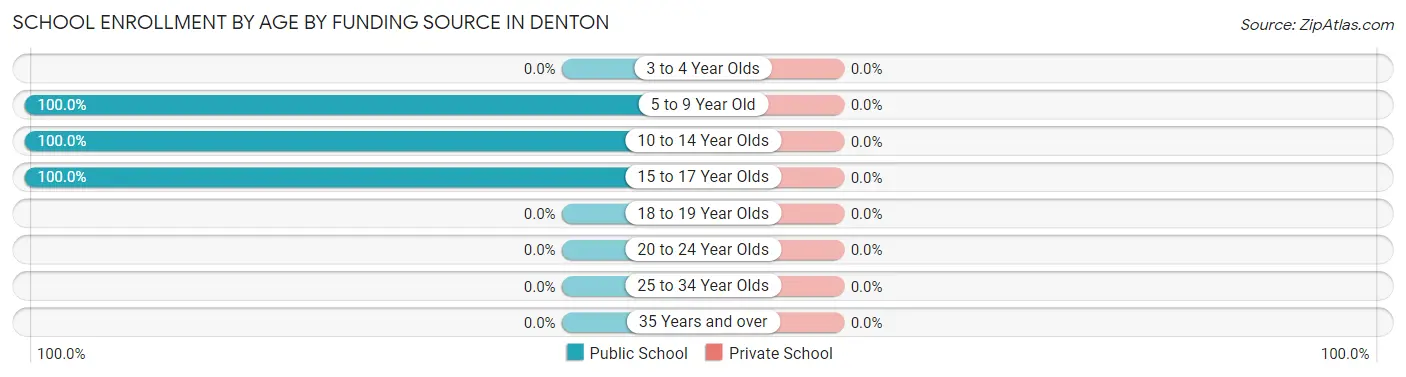
| Age Bracket | Public School | Private School |
| 3 to 4 Year Olds | 0 (0.0%) | 0 (0.0%) |
| 5 to 9 Year Old | 2 (100.0%) | 0 (0.0%) |
| 10 to 14 Year Olds | 28 (100.0%) | 0 (0.0%) |
| 15 to 17 Year Olds | 6 (100.0%) | 0 (0.0%) |
| 18 to 19 Year Olds | 0 (0.0%) | 0 (0.0%) |
| 20 to 24 Year Olds | 0 (0.0%) | 0 (0.0%) |
| 25 to 34 Year Olds | 0 (0.0%) | 0 (0.0%) |
| 35 Years and over | 0 (0.0%) | 0 (0.0%) |
| Total | 36 (100.0%) | 0 (0.0%) |
Educational Attainment by Field of Study in Denton
, and education (1 | 100.0%) are the most common fields of study among 1 individuals in Denton who have obtained a bachelor's degree or higher.
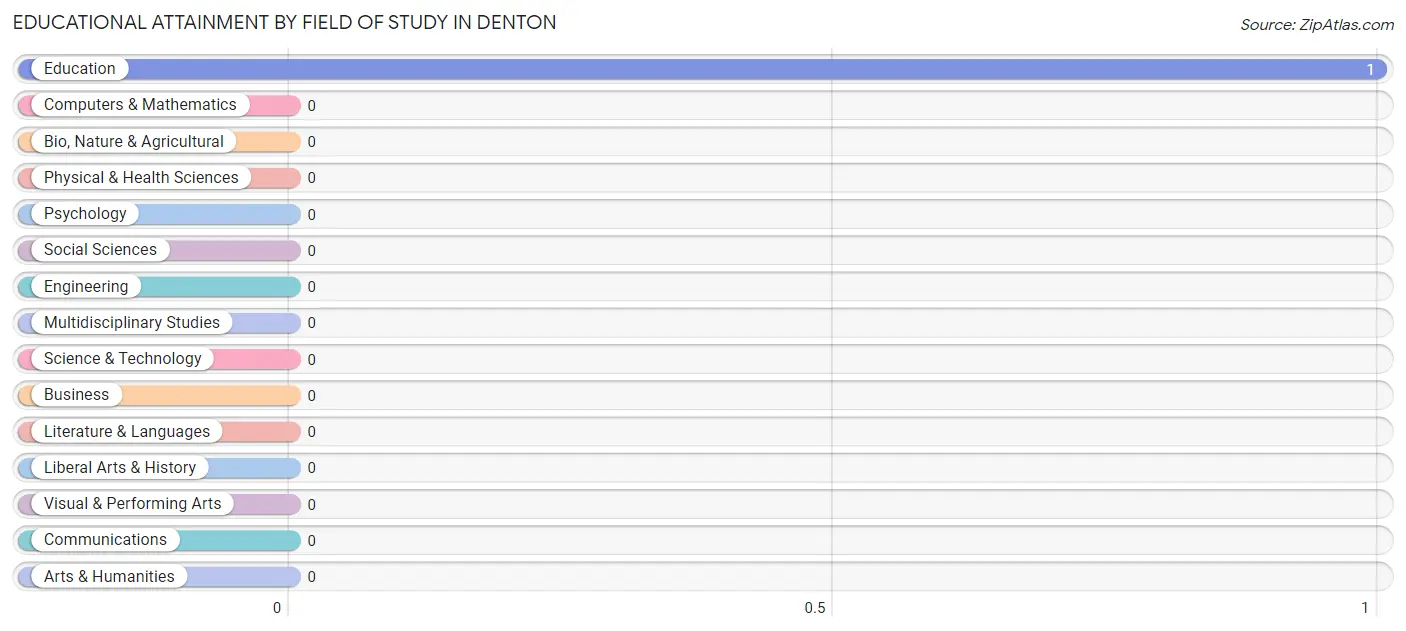
| Field of Study | # Graduates | % Graduates |
| Computers & Mathematics | 0 | 0.0% |
| Bio, Nature & Agricultural | 0 | 0.0% |
| Physical & Health Sciences | 0 | 0.0% |
| Psychology | 0 | 0.0% |
| Social Sciences | 0 | 0.0% |
| Engineering | 0 | 0.0% |
| Multidisciplinary Studies | 0 | 0.0% |
| Science & Technology | 0 | 0.0% |
| Business | 0 | 0.0% |
| Education | 1 | 100.0% |
| Literature & Languages | 0 | 0.0% |
| Liberal Arts & History | 0 | 0.0% |
| Visual & Performing Arts | 0 | 0.0% |
| Communications | 0 | 0.0% |
| Arts & Humanities | 0 | 0.0% |
| Total | 1 | 100.0% |
Transportation & Commute in Denton
Vehicle Availability by Sex in Denton
The most prevalent vehicle ownership categories in Denton are males with 3 vehicles (15, accounting for 42.9%) and females with 3 vehicles (13, making up 62.5%).
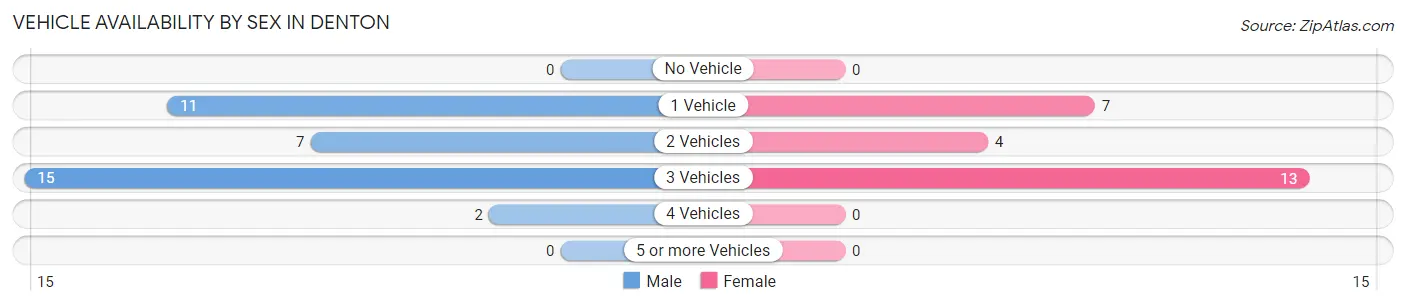
| Vehicles Available | Male | Female |
| No Vehicle | 0 (0.0%) | 0 (0.0%) |
| 1 Vehicle | 11 (31.4%) | 7 (29.2%) |
| 2 Vehicles | 7 (20.0%) | 4 (16.7%) |
| 3 Vehicles | 15 (42.9%) | 13 (54.2%) |
| 4 Vehicles | 2 (5.7%) | 0 (0.0%) |
| 5 or more Vehicles | 0 (0.0%) | 0 (0.0%) |
| Total | 35 (100.0%) | 24 (100.0%) |
Commute Time in Denton
The most frequently occuring commute durations in Denton are 30 to 34 minutes (17 commuters, 28.8%), 45 to 59 minutes (16 commuters, 27.1%), and 15 to 19 minutes (9 commuters, 15.2%).
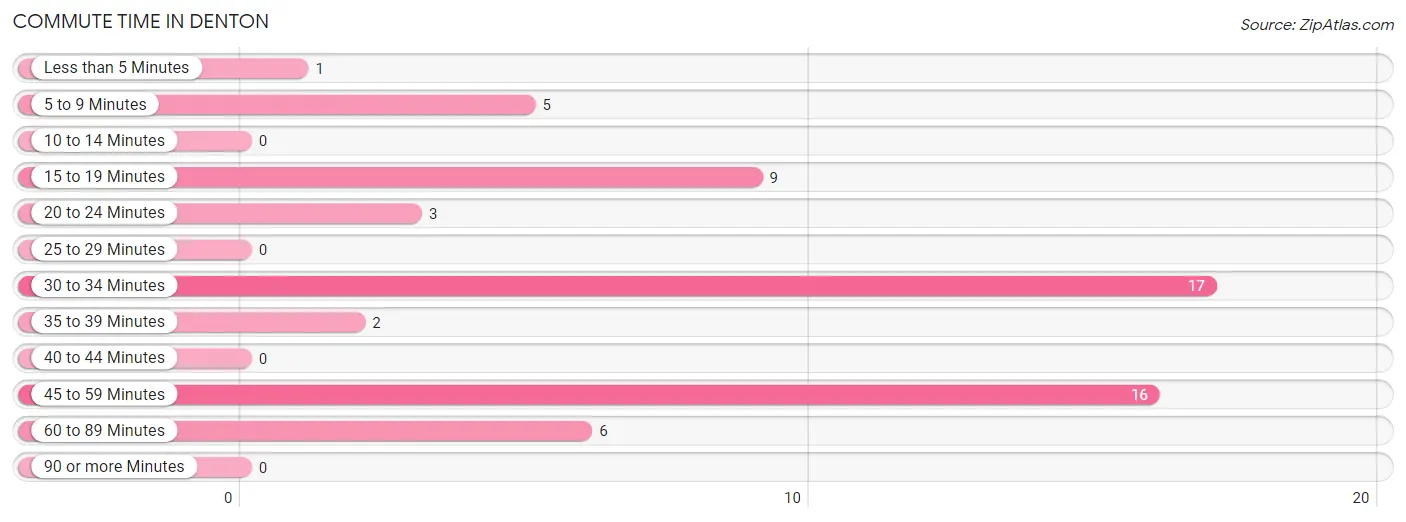
| Commute Time | # Commuters | % Commuters |
| Less than 5 Minutes | 1 | 1.7% |
| 5 to 9 Minutes | 5 | 8.5% |
| 10 to 14 Minutes | 0 | 0.0% |
| 15 to 19 Minutes | 9 | 15.2% |
| 20 to 24 Minutes | 3 | 5.1% |
| 25 to 29 Minutes | 0 | 0.0% |
| 30 to 34 Minutes | 17 | 28.8% |
| 35 to 39 Minutes | 2 | 3.4% |
| 40 to 44 Minutes | 0 | 0.0% |
| 45 to 59 Minutes | 16 | 27.1% |
| 60 to 89 Minutes | 6 | 10.2% |
| 90 or more Minutes | 0 | 0.0% |
Commute Time by Sex in Denton
The most common commute times in Denton are 45 to 59 minutes (16 commuters, 45.7%) for males and 30 to 34 minutes (15 commuters, 62.5%) for females.
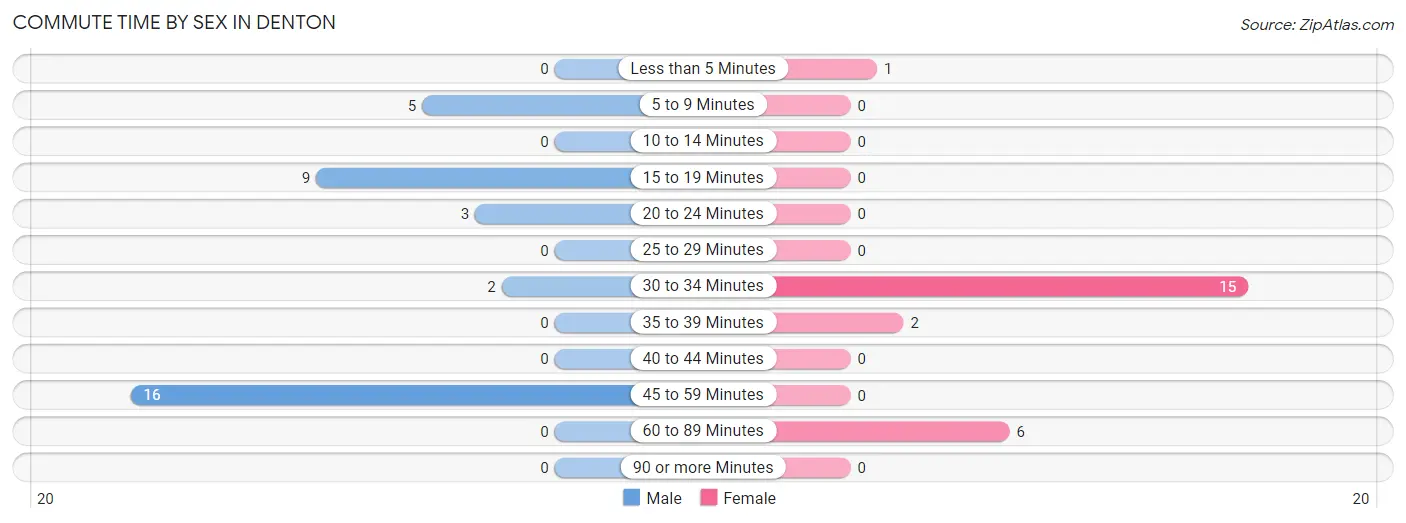
| Commute Time | Male | Female |
| Less than 5 Minutes | 0 (0.0%) | 1 (4.2%) |
| 5 to 9 Minutes | 5 (14.3%) | 0 (0.0%) |
| 10 to 14 Minutes | 0 (0.0%) | 0 (0.0%) |
| 15 to 19 Minutes | 9 (25.7%) | 0 (0.0%) |
| 20 to 24 Minutes | 3 (8.6%) | 0 (0.0%) |
| 25 to 29 Minutes | 0 (0.0%) | 0 (0.0%) |
| 30 to 34 Minutes | 2 (5.7%) | 15 (62.5%) |
| 35 to 39 Minutes | 0 (0.0%) | 2 (8.3%) |
| 40 to 44 Minutes | 0 (0.0%) | 0 (0.0%) |
| 45 to 59 Minutes | 16 (45.7%) | 0 (0.0%) |
| 60 to 89 Minutes | 0 (0.0%) | 6 (25.0%) |
| 90 or more Minutes | 0 (0.0%) | 0 (0.0%) |
Time of Departure to Work by Sex in Denton
The most frequent times of departure to work in Denton are 7:00 AM to 7:29 AM (20, 57.1%) for males and 6:30 AM to 6:59 AM (13, 54.2%) for females.
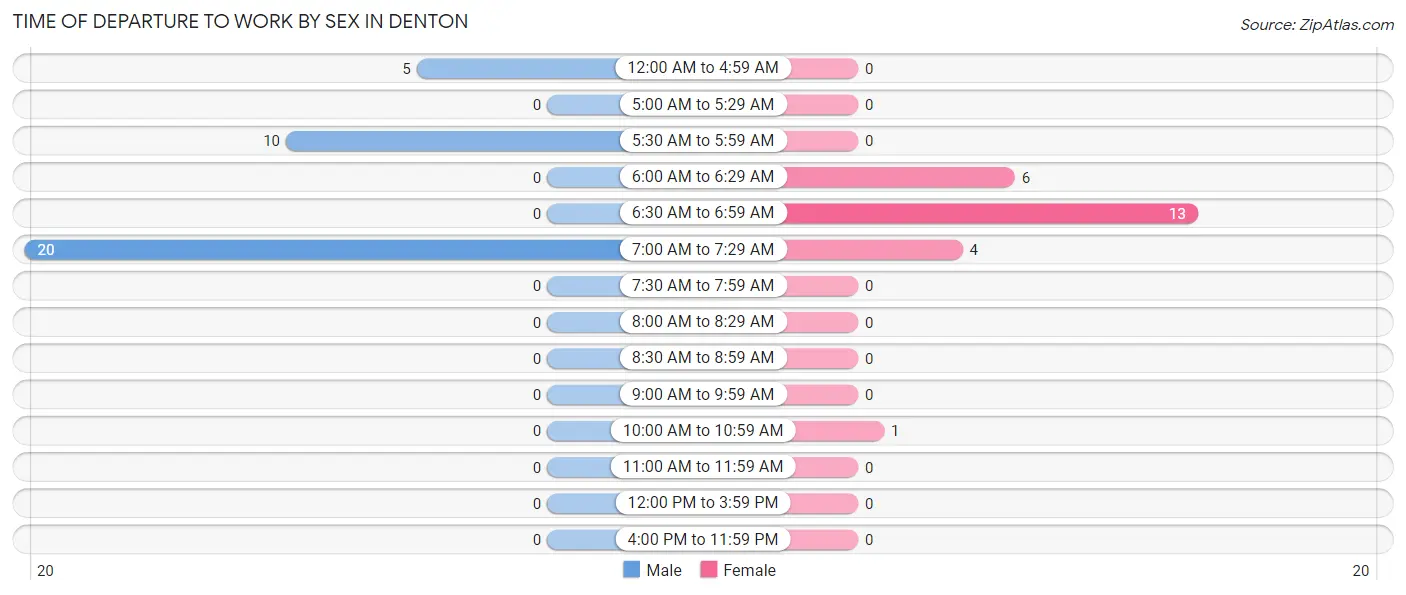
| Time of Departure | Male | Female |
| 12:00 AM to 4:59 AM | 5 (14.3%) | 0 (0.0%) |
| 5:00 AM to 5:29 AM | 0 (0.0%) | 0 (0.0%) |
| 5:30 AM to 5:59 AM | 10 (28.6%) | 0 (0.0%) |
| 6:00 AM to 6:29 AM | 0 (0.0%) | 6 (25.0%) |
| 6:30 AM to 6:59 AM | 0 (0.0%) | 13 (54.2%) |
| 7:00 AM to 7:29 AM | 20 (57.1%) | 4 (16.7%) |
| 7:30 AM to 7:59 AM | 0 (0.0%) | 0 (0.0%) |
| 8:00 AM to 8:29 AM | 0 (0.0%) | 0 (0.0%) |
| 8:30 AM to 8:59 AM | 0 (0.0%) | 0 (0.0%) |
| 9:00 AM to 9:59 AM | 0 (0.0%) | 0 (0.0%) |
| 10:00 AM to 10:59 AM | 0 (0.0%) | 1 (4.2%) |
| 11:00 AM to 11:59 AM | 0 (0.0%) | 0 (0.0%) |
| 12:00 PM to 3:59 PM | 0 (0.0%) | 0 (0.0%) |
| 4:00 PM to 11:59 PM | 0 (0.0%) | 0 (0.0%) |
| Total | 35 (100.0%) | 24 (100.0%) |
Housing Occupancy in Denton
Occupancy by Ownership in Denton
Of the total 97 dwellings in Denton, owner-occupied units account for 84 (86.6%), while renter-occupied units make up 13 (13.4%).
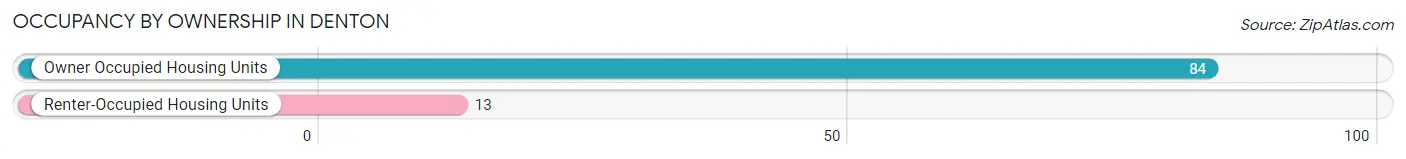
| Occupancy | # Housing Units | % Housing Units |
| Owner Occupied Housing Units | 84 | 86.6% |
| Renter-Occupied Housing Units | 13 | 13.4% |
| Total Occupied Housing Units | 97 | 100.0% |
Occupancy by Household Size in Denton
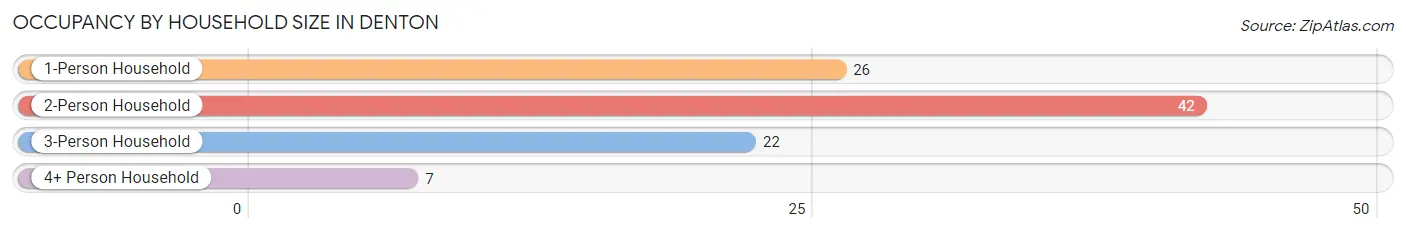
| Household Size | # Housing Units | % Housing Units |
| 1-Person Household | 26 | 26.8% |
| 2-Person Household | 42 | 43.3% |
| 3-Person Household | 22 | 22.7% |
| 4+ Person Household | 7 | 7.2% |
| Total Housing Units | 97 | 100.0% |
Occupancy by Ownership by Household Size in Denton
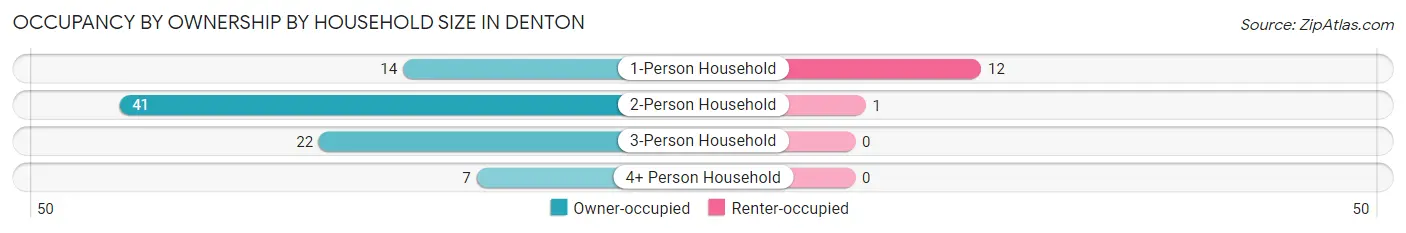
| Household Size | Owner-occupied | Renter-occupied |
| 1-Person Household | 14 (53.8%) | 12 (46.2%) |
| 2-Person Household | 41 (97.6%) | 1 (2.4%) |
| 3-Person Household | 22 (100.0%) | 0 (0.0%) |
| 4+ Person Household | 7 (100.0%) | 0 (0.0%) |
| Total Housing Units | 84 (86.6%) | 13 (13.4%) |
Occupancy by Educational Attainment in Denton
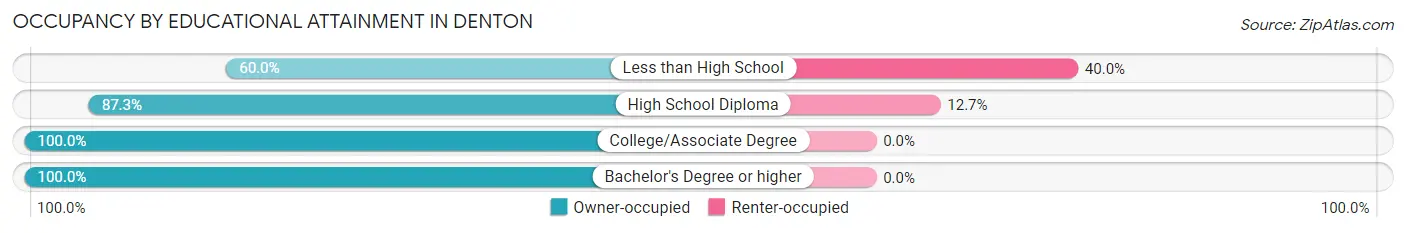
| Household Size | Owner-occupied | Renter-occupied |
| Less than High School | 9 (60.0%) | 6 (40.0%) |
| High School Diploma | 48 (87.3%) | 7 (12.7%) |
| College/Associate Degree | 26 (100.0%) | 0 (0.0%) |
| Bachelor's Degree or higher | 1 (100.0%) | 0 (0.0%) |
Occupancy by Age of Householder in Denton
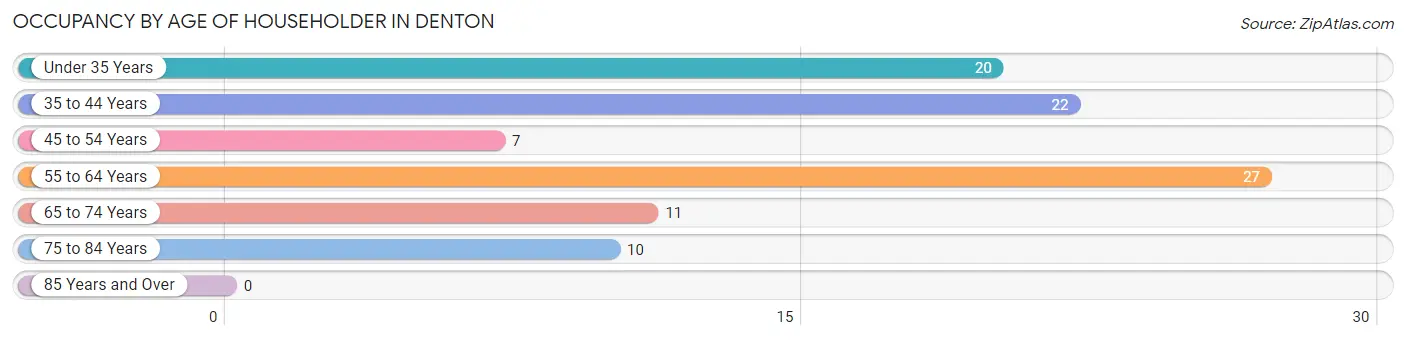
| Age Bracket | # Households | % Households |
| Under 35 Years | 20 | 20.6% |
| 35 to 44 Years | 22 | 22.7% |
| 45 to 54 Years | 7 | 7.2% |
| 55 to 64 Years | 27 | 27.8% |
| 65 to 74 Years | 11 | 11.3% |
| 75 to 84 Years | 10 | 10.3% |
| 85 Years and Over | 0 | 0.0% |
| Total | 97 | 100.0% |
Housing Finances in Denton
Median Income by Occupancy in Denton
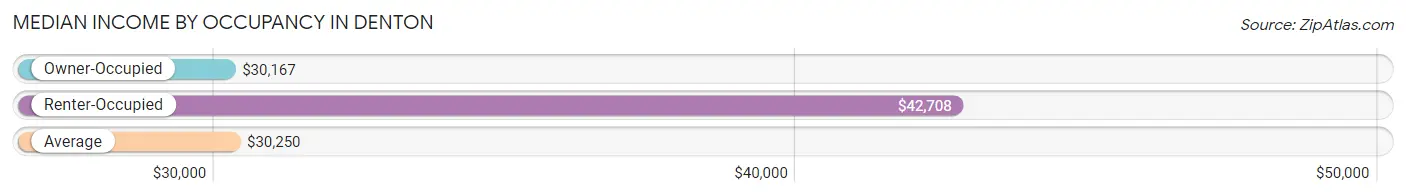
| Occupancy Type | # Households | Median Income |
| Owner-Occupied | 84 (86.6%) | $30,167 |
| Renter-Occupied | 13 (13.4%) | $42,708 |
| Average | 97 (100.0%) | $30,250 |
Occupancy by Householder Income Bracket in Denton
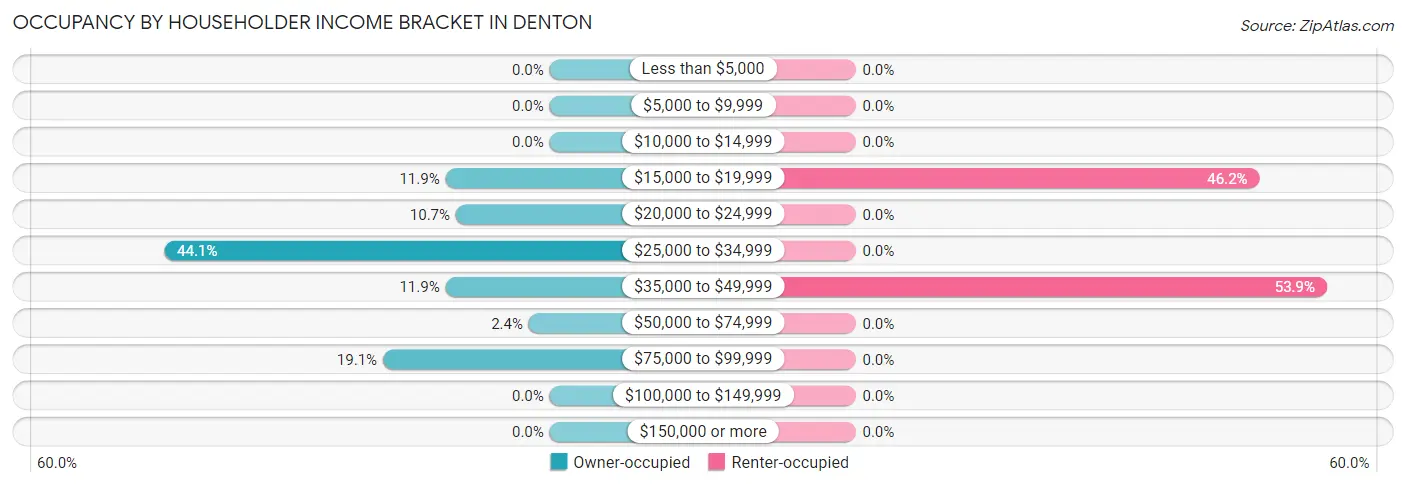
| Income Bracket | Owner-occupied | Renter-occupied |
| Less than $5,000 | 0 (0.0%) | 0 (0.0%) |
| $5,000 to $9,999 | 0 (0.0%) | 0 (0.0%) |
| $10,000 to $14,999 | 0 (0.0%) | 0 (0.0%) |
| $15,000 to $19,999 | 10 (11.9%) | 6 (46.2%) |
| $20,000 to $24,999 | 9 (10.7%) | 0 (0.0%) |
| $25,000 to $34,999 | 37 (44.1%) | 0 (0.0%) |
| $35,000 to $49,999 | 10 (11.9%) | 7 (53.8%) |
| $50,000 to $74,999 | 2 (2.4%) | 0 (0.0%) |
| $75,000 to $99,999 | 16 (19.1%) | 0 (0.0%) |
| $100,000 to $149,999 | 0 (0.0%) | 0 (0.0%) |
| $150,000 or more | 0 (0.0%) | 0 (0.0%) |
| Total | 84 (100.0%) | 13 (100.0%) |
Monthly Housing Cost Tiers in Denton
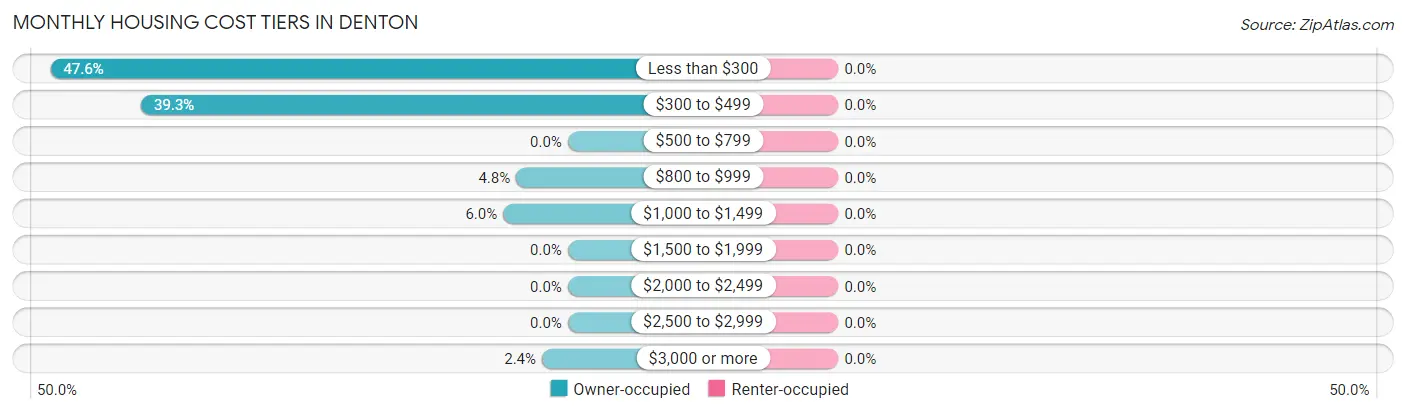
| Monthly Cost | Owner-occupied | Renter-occupied |
| Less than $300 | 40 (47.6%) | 0 (0.0%) |
| $300 to $499 | 33 (39.3%) | 0 (0.0%) |
| $500 to $799 | 0 (0.0%) | 0 (0.0%) |
| $800 to $999 | 4 (4.8%) | 0 (0.0%) |
| $1,000 to $1,499 | 5 (5.9%) | 0 (0.0%) |
| $1,500 to $1,999 | 0 (0.0%) | 0 (0.0%) |
| $2,000 to $2,499 | 0 (0.0%) | 0 (0.0%) |
| $2,500 to $2,999 | 0 (0.0%) | 0 (0.0%) |
| $3,000 or more | 2 (2.4%) | 0 (0.0%) |
| Total | 84 (100.0%) | 13 (100.0%) |
Physical Housing Characteristics in Denton
Housing Structures in Denton
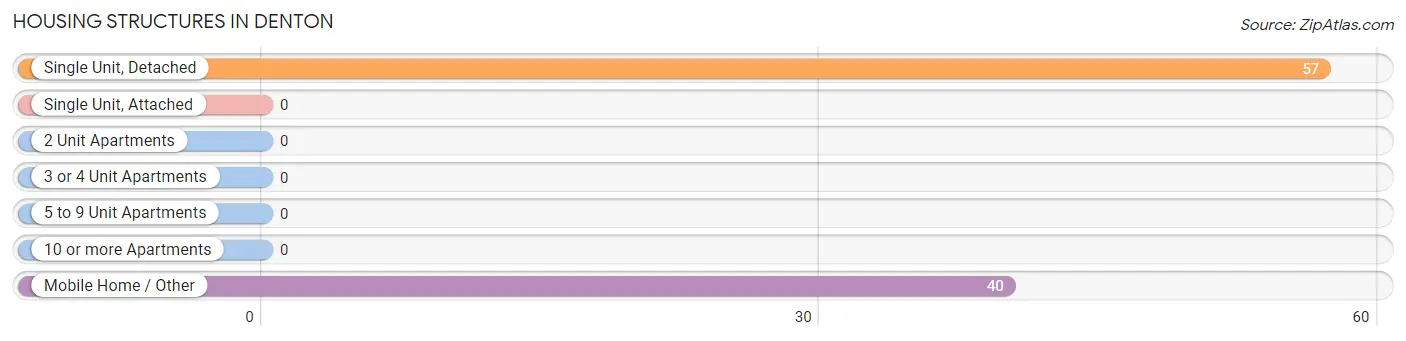
| Structure Type | # Housing Units | % Housing Units |
| Single Unit, Detached | 57 | 58.8% |
| Single Unit, Attached | 0 | 0.0% |
| 2 Unit Apartments | 0 | 0.0% |
| 3 or 4 Unit Apartments | 0 | 0.0% |
| 5 to 9 Unit Apartments | 0 | 0.0% |
| 10 or more Apartments | 0 | 0.0% |
| Mobile Home / Other | 40 | 41.2% |
| Total | 97 | 100.0% |
Housing Structures by Occupancy in Denton
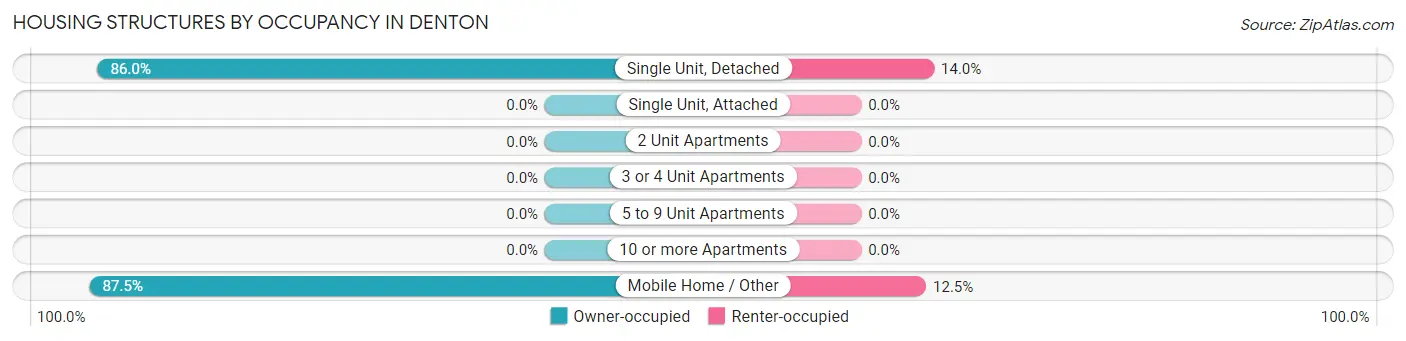
| Structure Type | Owner-occupied | Renter-occupied |
| Single Unit, Detached | 49 (86.0%) | 8 (14.0%) |
| Single Unit, Attached | 0 (0.0%) | 0 (0.0%) |
| 2 Unit Apartments | 0 (0.0%) | 0 (0.0%) |
| 3 or 4 Unit Apartments | 0 (0.0%) | 0 (0.0%) |
| 5 to 9 Unit Apartments | 0 (0.0%) | 0 (0.0%) |
| 10 or more Apartments | 0 (0.0%) | 0 (0.0%) |
| Mobile Home / Other | 35 (87.5%) | 5 (12.5%) |
| Total | 84 (86.6%) | 13 (13.4%) |
Housing Structures by Number of Rooms in Denton
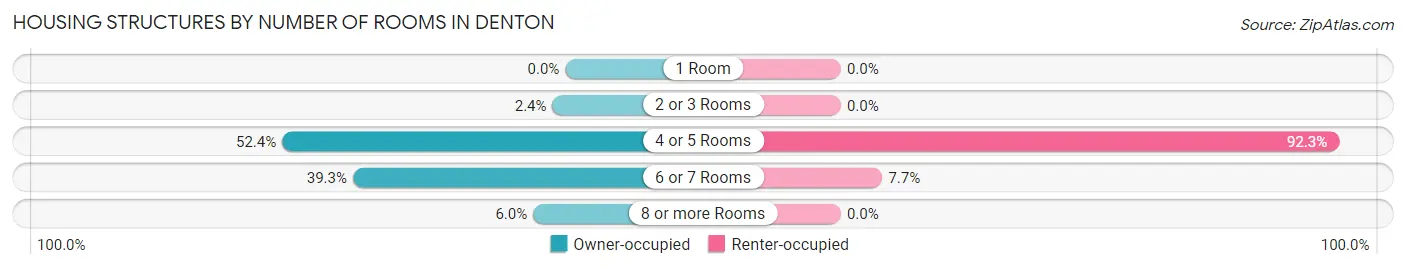
| Number of Rooms | Owner-occupied | Renter-occupied |
| 1 Room | 0 (0.0%) | 0 (0.0%) |
| 2 or 3 Rooms | 2 (2.4%) | 0 (0.0%) |
| 4 or 5 Rooms | 44 (52.4%) | 12 (92.3%) |
| 6 or 7 Rooms | 33 (39.3%) | 1 (7.7%) |
| 8 or more Rooms | 5 (5.9%) | 0 (0.0%) |
| Total | 84 (100.0%) | 13 (100.0%) |
Housing Structure by Heating Type in Denton
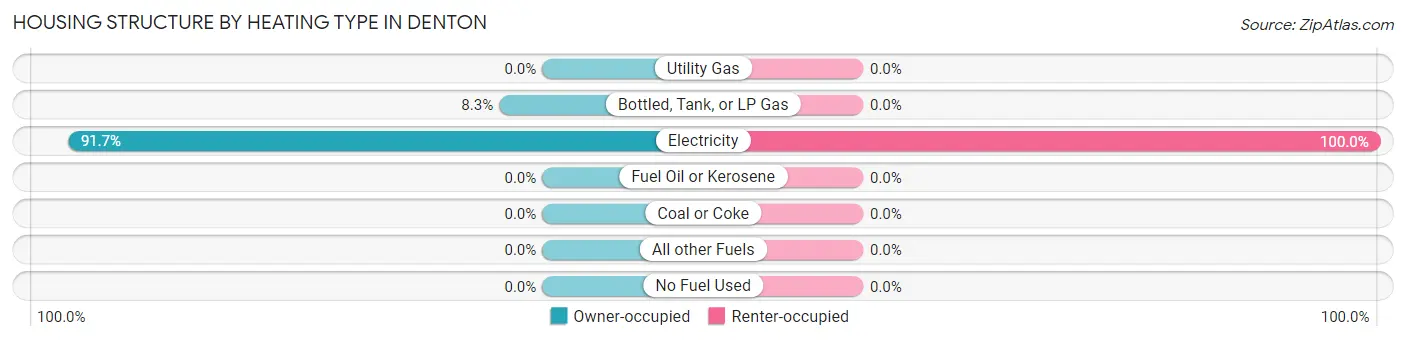
| Heating Type | Owner-occupied | Renter-occupied |
| Utility Gas | 0 (0.0%) | 0 (0.0%) |
| Bottled, Tank, or LP Gas | 7 (8.3%) | 0 (0.0%) |
| Electricity | 77 (91.7%) | 13 (100.0%) |
| Fuel Oil or Kerosene | 0 (0.0%) | 0 (0.0%) |
| Coal or Coke | 0 (0.0%) | 0 (0.0%) |
| All other Fuels | 0 (0.0%) | 0 (0.0%) |
| No Fuel Used | 0 (0.0%) | 0 (0.0%) |
| Total | 84 (100.0%) | 13 (100.0%) |
Household Vehicle Usage in Denton
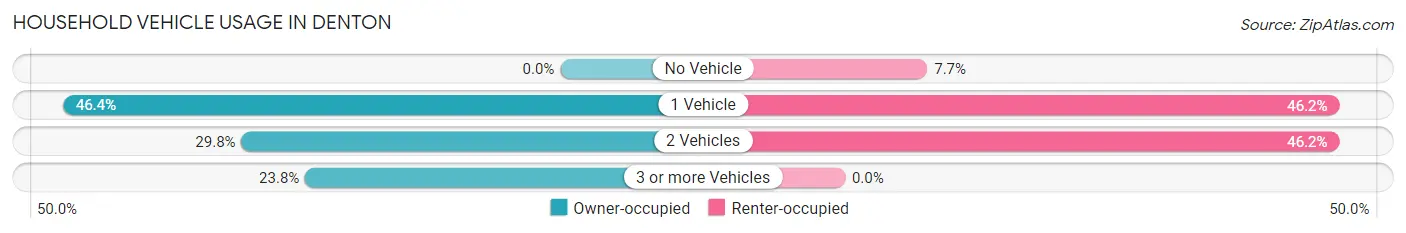
| Vehicles per Household | Owner-occupied | Renter-occupied |
| No Vehicle | 0 (0.0%) | 1 (7.7%) |
| 1 Vehicle | 39 (46.4%) | 6 (46.2%) |
| 2 Vehicles | 25 (29.8%) | 6 (46.2%) |
| 3 or more Vehicles | 20 (23.8%) | 0 (0.0%) |
| Total | 84 (100.0%) | 13 (100.0%) |
Real Estate & Mortgages in Denton
Real Estate and Mortgage Overview in Denton
| Characteristic | Without Mortgage | With Mortgage |
| Housing Units | 77 | 7 |
| Median Property Value | - | - |
| Median Household Income | $27,216 | $0 |
| Monthly Housing Costs | $248 | $0 |
| Real Estate Taxes | $276 | $0 |
Property Value by Mortgage Status in Denton
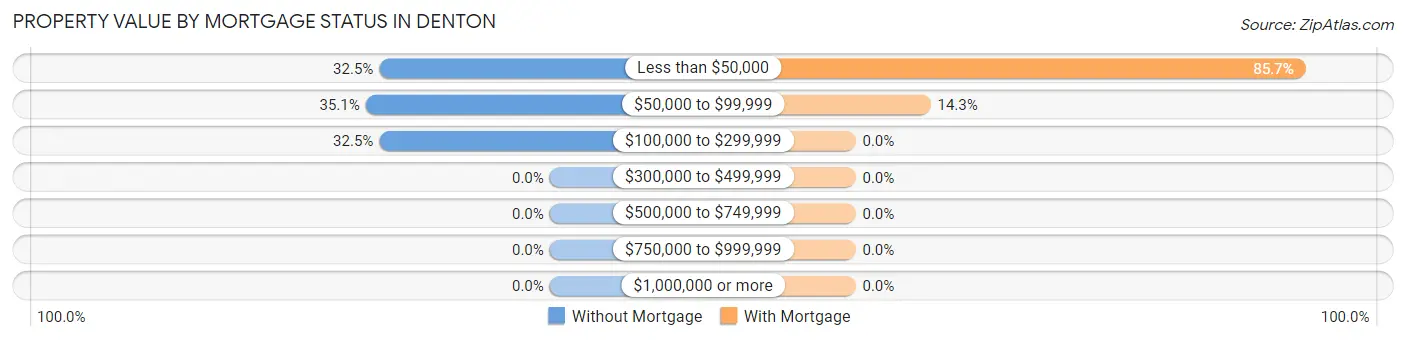
| Property Value | Without Mortgage | With Mortgage |
| Less than $50,000 | 25 (32.5%) | 6 (85.7%) |
| $50,000 to $99,999 | 27 (35.1%) | 1 (14.3%) |
| $100,000 to $299,999 | 25 (32.5%) | 0 (0.0%) |
| $300,000 to $499,999 | 0 (0.0%) | 0 (0.0%) |
| $500,000 to $749,999 | 0 (0.0%) | 0 (0.0%) |
| $750,000 to $999,999 | 0 (0.0%) | 0 (0.0%) |
| $1,000,000 or more | 0 (0.0%) | 0 (0.0%) |
| Total | 77 (100.0%) | 7 (100.0%) |
Household Income by Mortgage Status in Denton
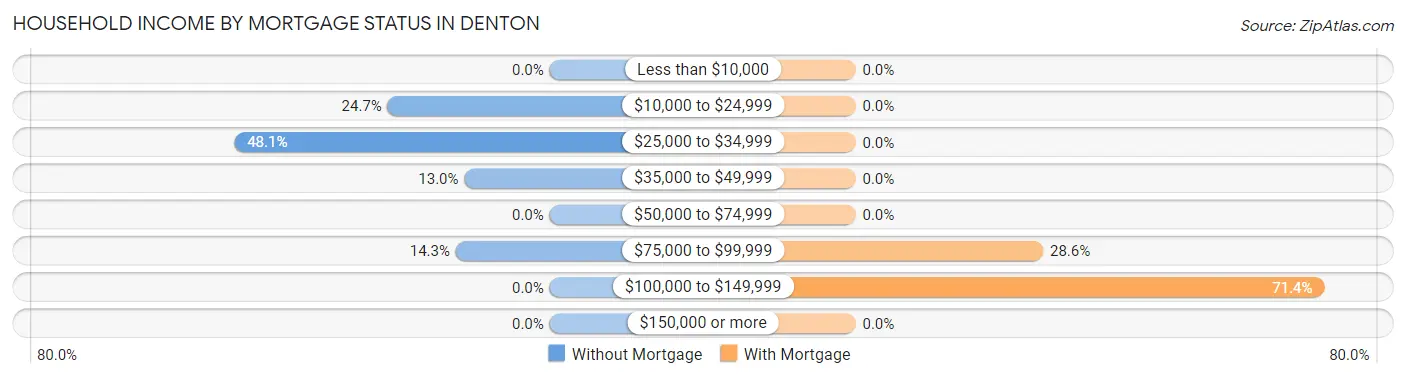
| Household Income | Without Mortgage | With Mortgage |
| Less than $10,000 | 0 (0.0%) | 0 (0.0%) |
| $10,000 to $24,999 | 19 (24.7%) | 0 (0.0%) |
| $25,000 to $34,999 | 37 (48.0%) | 0 (0.0%) |
| $35,000 to $49,999 | 10 (13.0%) | 0 (0.0%) |
| $50,000 to $74,999 | 0 (0.0%) | 0 (0.0%) |
| $75,000 to $99,999 | 11 (14.3%) | 2 (28.6%) |
| $100,000 to $149,999 | 0 (0.0%) | 5 (71.4%) |
| $150,000 or more | 0 (0.0%) | 0 (0.0%) |
| Total | 77 (100.0%) | 7 (100.0%) |
Property Value to Household Income Ratio in Denton
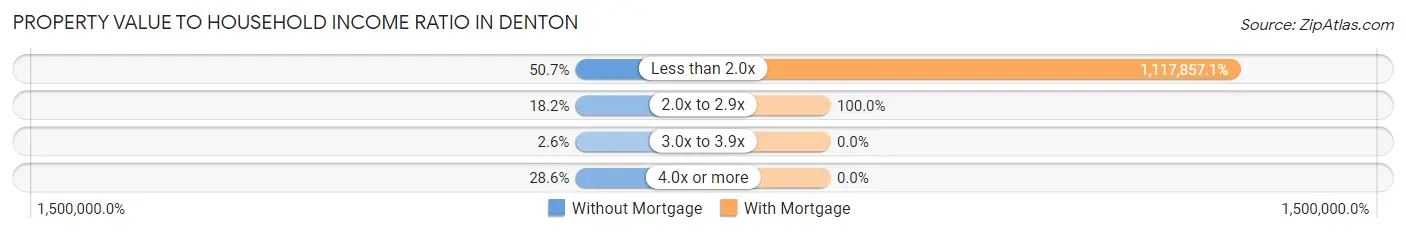
| Value-to-Income Ratio | Without Mortgage | With Mortgage |
| Less than 2.0x | 39 (50.6%) | 78,250 (1,117,857.1%) |
| 2.0x to 2.9x | 14 (18.2%) | 7 (100.0%) |
| 3.0x to 3.9x | 2 (2.6%) | 0 (0.0%) |
| 4.0x or more | 22 (28.6%) | 0 (0.0%) |
| Total | 77 (100.0%) | 7 (100.0%) |
Real Estate Taxes by Mortgage Status in Denton
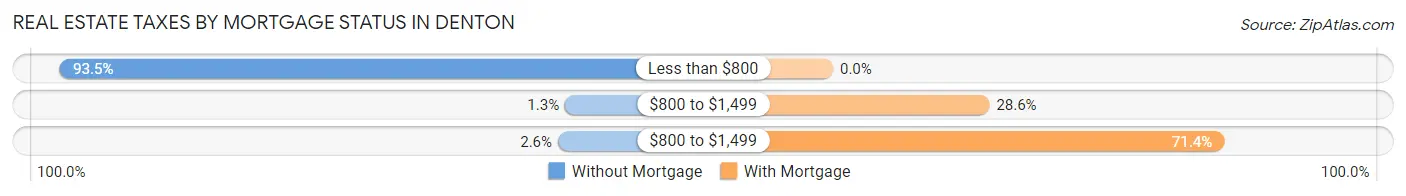
| Property Taxes | Without Mortgage | With Mortgage |
| Less than $800 | 72 (93.5%) | 0 (0.0%) |
| $800 to $1,499 | 1 (1.3%) | 2 (28.6%) |
| $800 to $1,499 | 2 (2.6%) | 5 (71.4%) |
| Total | 77 (100.0%) | 7 (100.0%) |
Health & Disability in Denton
Health Insurance Coverage by Age in Denton
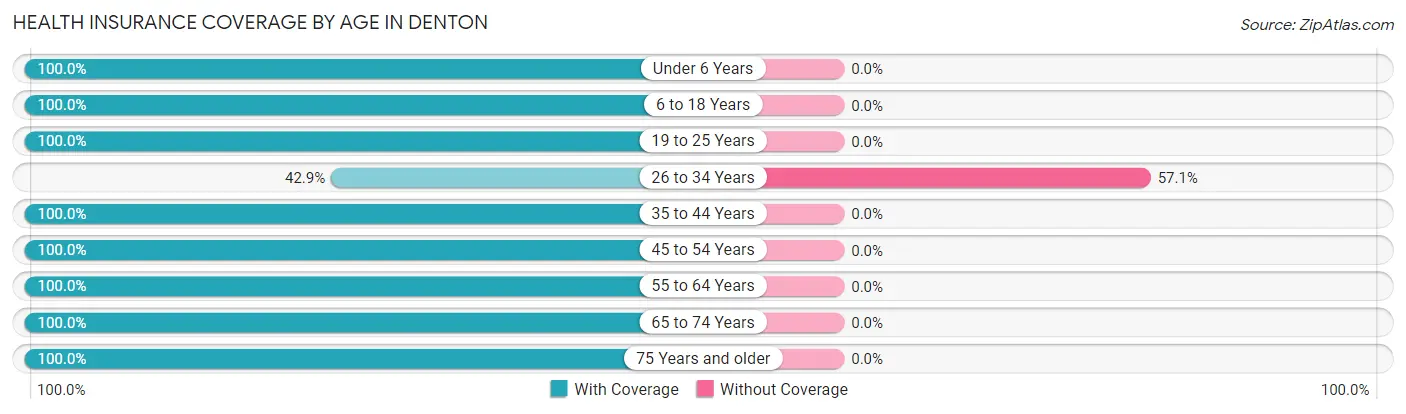
| Age Bracket | With Coverage | Without Coverage |
| Under 6 Years | 5 (100.0%) | 0 (0.0%) |
| 6 to 18 Years | 36 (100.0%) | 0 (0.0%) |
| 19 to 25 Years | 6 (100.0%) | 0 (0.0%) |
| 26 to 34 Years | 9 (42.9%) | 12 (57.1%) |
| 35 to 44 Years | 36 (100.0%) | 0 (0.0%) |
| 45 to 54 Years | 24 (100.0%) | 0 (0.0%) |
| 55 to 64 Years | 105 (100.0%) | 0 (0.0%) |
| 65 to 74 Years | 12 (100.0%) | 0 (0.0%) |
| 75 Years and older | 12 (100.0%) | 0 (0.0%) |
| Total | 245 (95.3%) | 12 (4.7%) |
Health Insurance Coverage by Citizenship Status in Denton
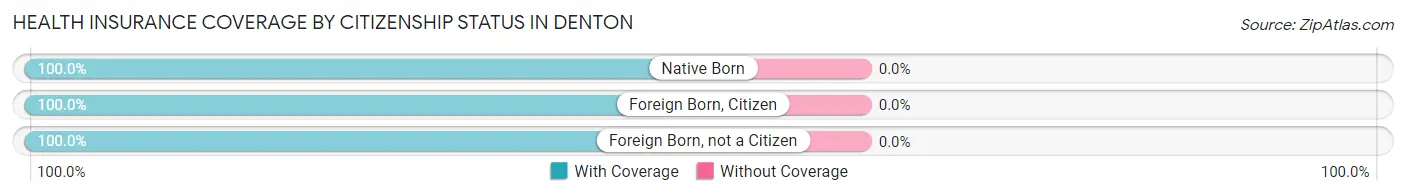
| Citizenship Status | With Coverage | Without Coverage |
| Native Born | 5 (100.0%) | 0 (0.0%) |
| Foreign Born, Citizen | 36 (100.0%) | 0 (0.0%) |
| Foreign Born, not a Citizen | 6 (100.0%) | 0 (0.0%) |
Health Insurance Coverage by Household Income in Denton
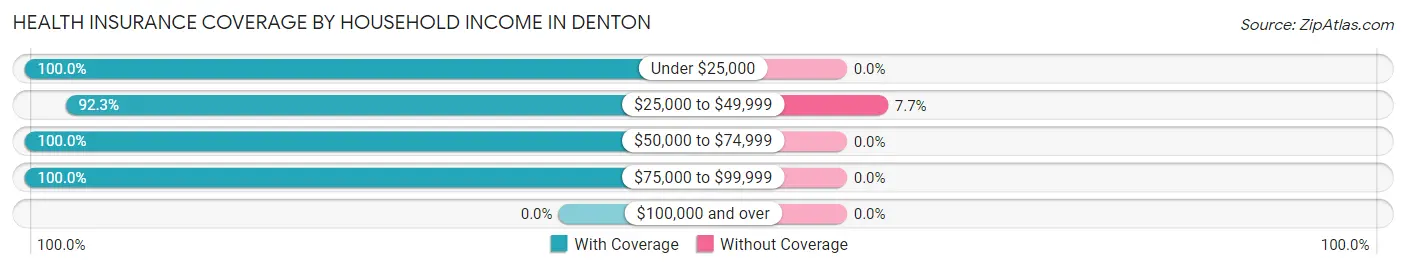
| Household Income | With Coverage | Without Coverage |
| Under $25,000 | 55 (100.0%) | 0 (0.0%) |
| $25,000 to $49,999 | 144 (92.3%) | 12 (7.7%) |
| $50,000 to $74,999 | 16 (100.0%) | 0 (0.0%) |
| $75,000 to $99,999 | 30 (100.0%) | 0 (0.0%) |
| $100,000 and over | 0 (0.0%) | 0 (0.0%) |
Public vs Private Health Insurance Coverage by Age in Denton
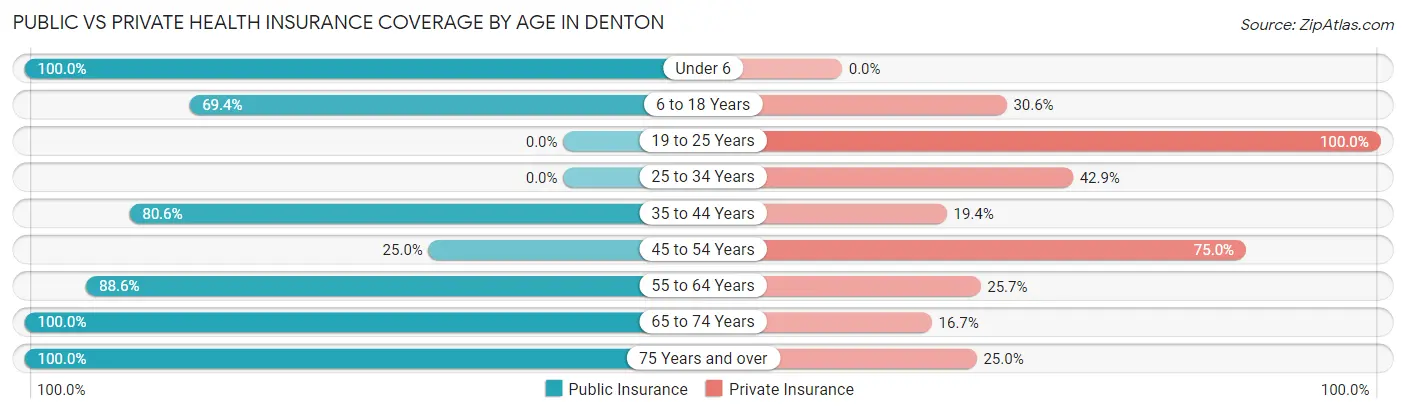
| Age Bracket | Public Insurance | Private Insurance |
| Under 6 | 5 (100.0%) | 0 (0.0%) |
| 6 to 18 Years | 25 (69.4%) | 11 (30.6%) |
| 19 to 25 Years | 0 (0.0%) | 6 (100.0%) |
| 25 to 34 Years | 0 (0.0%) | 9 (42.9%) |
| 35 to 44 Years | 29 (80.6%) | 7 (19.4%) |
| 45 to 54 Years | 6 (25.0%) | 18 (75.0%) |
| 55 to 64 Years | 93 (88.6%) | 27 (25.7%) |
| 65 to 74 Years | 12 (100.0%) | 2 (16.7%) |
| 75 Years and over | 12 (100.0%) | 3 (25.0%) |
| Total | 182 (70.8%) | 83 (32.3%) |
Disability Status by Sex by Age in Denton
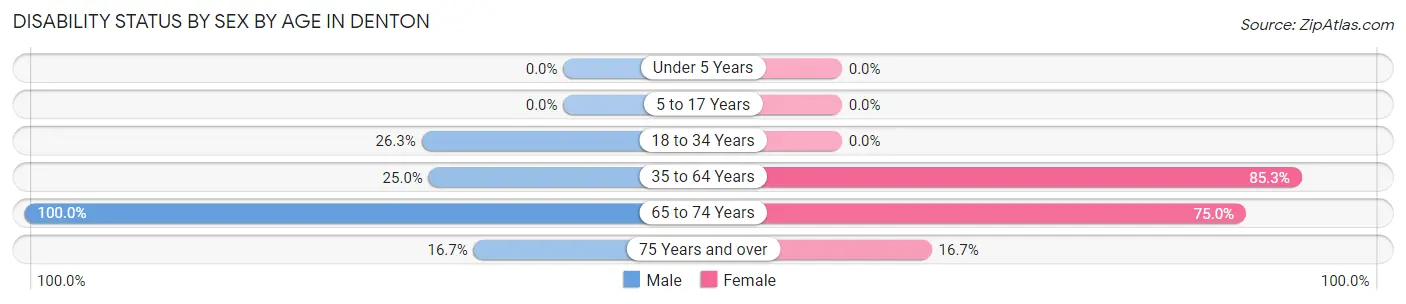
| Age Bracket | Male | Female |
| Under 5 Years | 0 (0.0%) | 0 (0.0%) |
| 5 to 17 Years | 0 (0.0%) | 0 (0.0%) |
| 18 to 34 Years | 5 (26.3%) | 0 (0.0%) |
| 35 to 64 Years | 14 (25.0%) | 93 (85.3%) |
| 65 to 74 Years | 8 (100.0%) | 3 (75.0%) |
| 75 Years and over | 1 (16.7%) | 1 (16.7%) |
Disability Class by Sex by Age in Denton
Disability Class: Hearing Difficulty
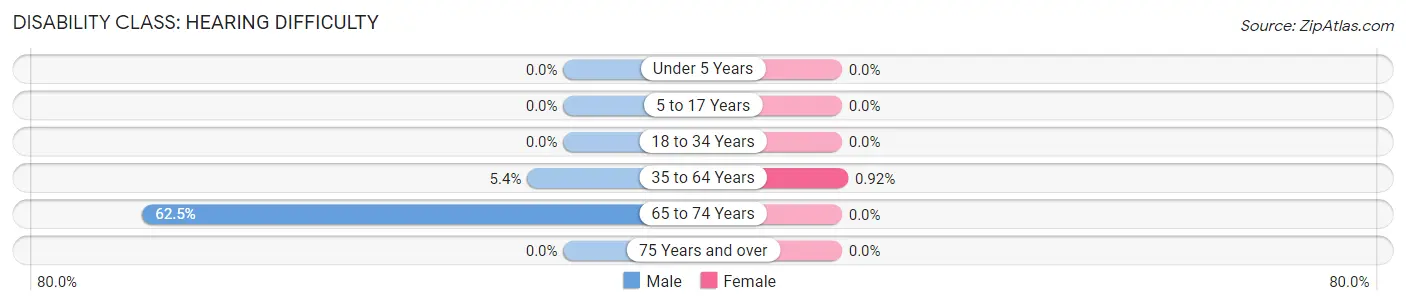
| Age Bracket | Male | Female |
| Under 5 Years | 0 (0.0%) | 0 (0.0%) |
| 5 to 17 Years | 0 (0.0%) | 0 (0.0%) |
| 18 to 34 Years | 0 (0.0%) | 0 (0.0%) |
| 35 to 64 Years | 3 (5.4%) | 1 (0.9%) |
| 65 to 74 Years | 5 (62.5%) | 0 (0.0%) |
| 75 Years and over | 0 (0.0%) | 0 (0.0%) |
Disability Class: Vision Difficulty
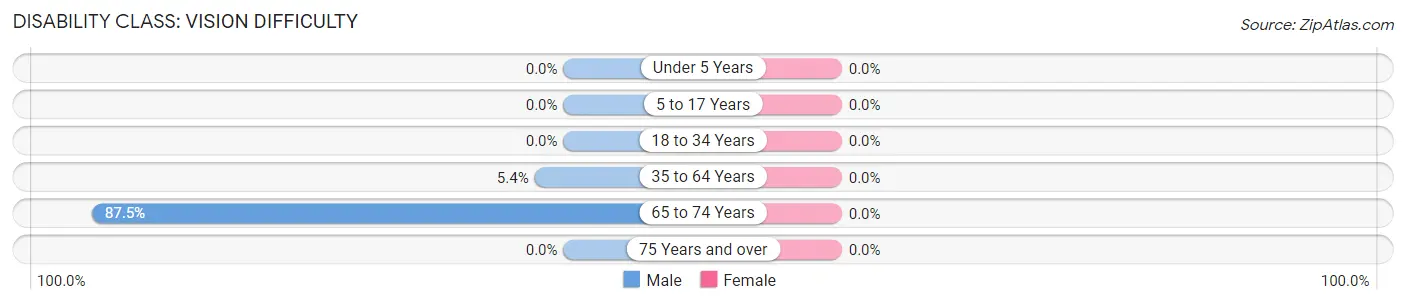
| Age Bracket | Male | Female |
| Under 5 Years | 0 (0.0%) | 0 (0.0%) |
| 5 to 17 Years | 0 (0.0%) | 0 (0.0%) |
| 18 to 34 Years | 0 (0.0%) | 0 (0.0%) |
| 35 to 64 Years | 3 (5.4%) | 0 (0.0%) |
| 65 to 74 Years | 7 (87.5%) | 0 (0.0%) |
| 75 Years and over | 0 (0.0%) | 0 (0.0%) |
Disability Class: Cognitive Difficulty
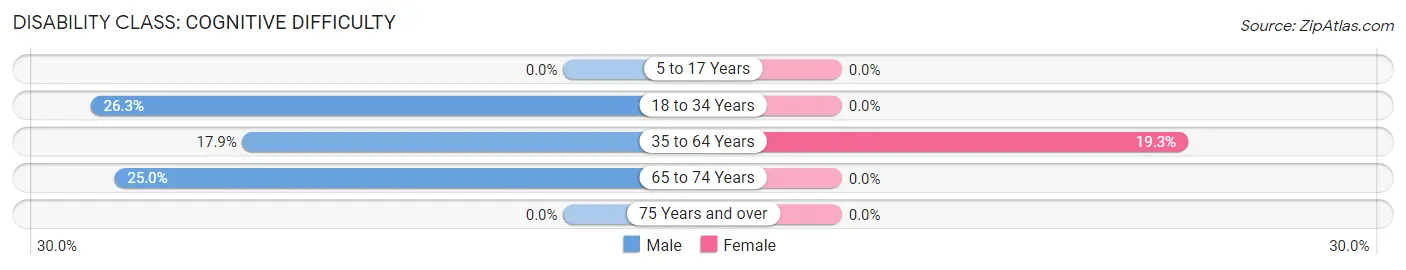
| Age Bracket | Male | Female |
| 5 to 17 Years | 0 (0.0%) | 0 (0.0%) |
| 18 to 34 Years | 5 (26.3%) | 0 (0.0%) |
| 35 to 64 Years | 10 (17.9%) | 21 (19.3%) |
| 65 to 74 Years | 2 (25.0%) | 0 (0.0%) |
| 75 Years and over | 0 (0.0%) | 0 (0.0%) |
Disability Class: Ambulatory Difficulty
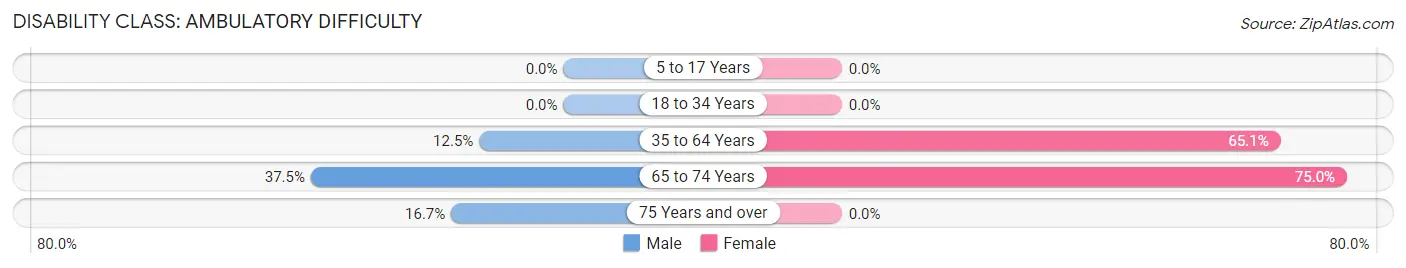
| Age Bracket | Male | Female |
| 5 to 17 Years | 0 (0.0%) | 0 (0.0%) |
| 18 to 34 Years | 0 (0.0%) | 0 (0.0%) |
| 35 to 64 Years | 7 (12.5%) | 71 (65.1%) |
| 65 to 74 Years | 3 (37.5%) | 3 (75.0%) |
| 75 Years and over | 1 (16.7%) | 0 (0.0%) |
Disability Class: Self-Care Difficulty
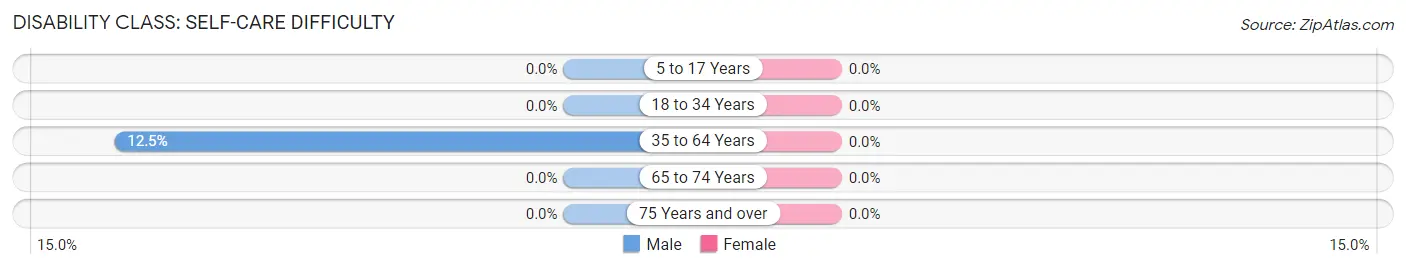
| Age Bracket | Male | Female |
| 5 to 17 Years | 0 (0.0%) | 0 (0.0%) |
| 18 to 34 Years | 0 (0.0%) | 0 (0.0%) |
| 35 to 64 Years | 7 (12.5%) | 0 (0.0%) |
| 65 to 74 Years | 0 (0.0%) | 0 (0.0%) |
| 75 Years and over | 0 (0.0%) | 0 (0.0%) |
Technology Access in Denton
Computing Device Access in Denton
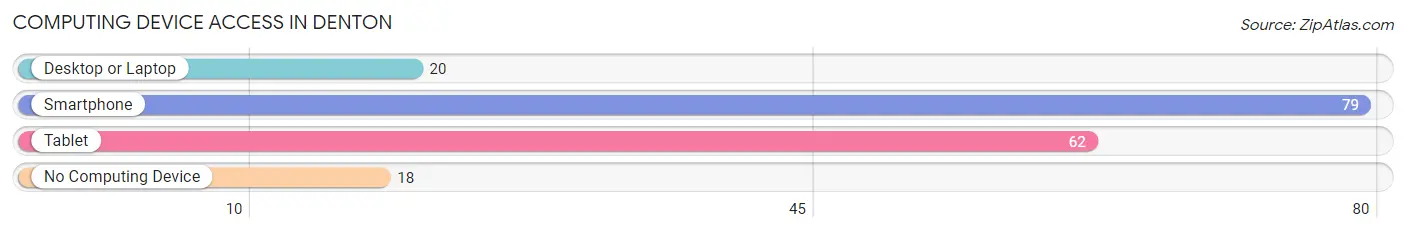
| Device Type | # Households | % Households |
| Desktop or Laptop | 20 | 20.6% |
| Smartphone | 79 | 81.4% |
| Tablet | 62 | 63.9% |
| No Computing Device | 18 | 18.6% |
| Total | 97 | 100.0% |
Internet Access in Denton
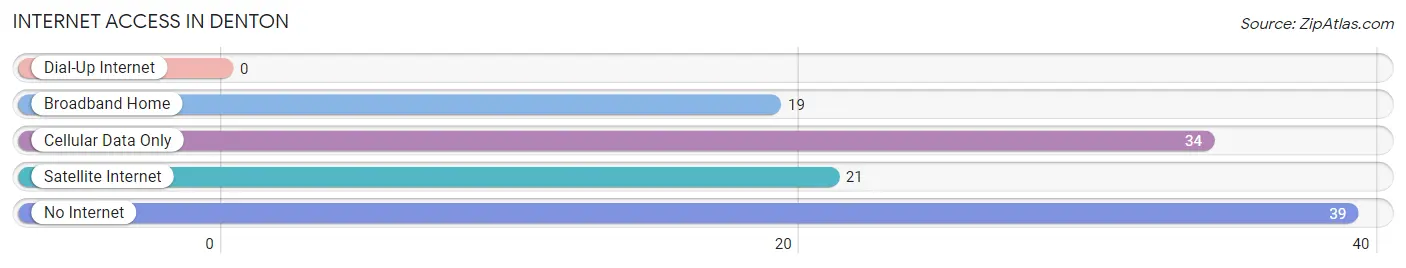
| Internet Type | # Households | % Households |
| Dial-Up Internet | 0 | 0.0% |
| Broadband Home | 19 | 19.6% |
| Cellular Data Only | 34 | 35.0% |
| Satellite Internet | 21 | 21.6% |
| No Internet | 39 | 40.2% |
| Total | 97 | 100.0% |
Denton Summary
Denton is a small town located in the state of Georgia, United States. It is situated in the northwest corner of the state, in the foothills of the Appalachian Mountains. The town is part of the larger metropolitan area of Atlanta, and is located about an hour and a half away from the city. The population of Denton was estimated to be 1,845 in 2020.
History
Denton was first settled in the early 1800s by settlers from North Carolina. The town was originally known as “Dentonville” and was named after the Denton family, who were among the first settlers. The town was incorporated in 1883 and was officially named Denton.
In the late 1800s, Denton was a thriving agricultural community. The town was known for its production of cotton, corn, and tobacco. The town also had a thriving lumber industry, which provided jobs for many of the town’s residents.
In the early 1900s, Denton began to experience a decline in its agricultural industry. This was due to the introduction of new technologies and the development of larger cities in the area. As a result, many of the town’s residents began to move away in search of better opportunities.
Geography
Denton is located in the northwest corner of Georgia, in the foothills of the Appalachian Mountains. The town is situated on the banks of the Etowah River, which flows through the town. The town is surrounded by rolling hills and forests, and is home to several small lakes.
The climate in Denton is humid subtropical, with hot summers and mild winters. The average temperature in the summer is around 80 degrees Fahrenheit, and the average temperature in the winter is around 40 degrees Fahrenheit.
Economy
The economy of Denton is largely based on agriculture and tourism. The town is home to several farms, which produce a variety of crops, including corn, cotton, and tobacco. The town also has a thriving tourism industry, with many visitors coming to the area to enjoy the natural beauty of the Appalachian Mountains.
In addition to agriculture and tourism, Denton also has a small manufacturing sector. The town is home to several small businesses, including a furniture factory, a printing company, and a metal fabrication shop.
Demographics
The population of Denton was estimated to be 1,845 in 2020. The town is predominantly white, with a small African American population. The median household income in Denton is $41,000, and the median home value is $125,000. The town has a low unemployment rate, and the poverty rate is below the national average.
Common Questions
What is Per Capita Income in Denton?
Per Capita income in Denton is $15,937.
What is the Median Family Income in Denton?
Median Family Income in Denton is $30,250.
What is the Median Household income in Denton?
Median Household Income in Denton is $30,250.
What is Income or Wage Gap in Denton?
Income or Wage Gap in Denton is 35.9%.
Women in Denton earn 64.1 cents for every dollar earned by a man.
What is Inequality or Gini Index in Denton?
Inequality or Gini Index in Denton is 0.31.
What is the Total Population of Denton?
Total Population of Denton is 257.
What is the Total Male Population of Denton?
Total Male Population of Denton is 117.
What is the Total Female Population of Denton?
Total Female Population of Denton is 140.
What is the Ratio of Males per 100 Females in Denton?
There are 83.57 Males per 100 Females in Denton.
What is the Ratio of Females per 100 Males in Denton?
There are 119.66 Females per 100 Males in Denton.
What is the Median Population Age in Denton?
Median Population Age in Denton is 55.3 Years.
What is the Average Family Size in Denton
Average Family Size in Denton is 3.3 People.
What is the Average Household Size in Denton
Average Household Size in Denton is 2.6 People.
How Large is the Labor Force in Denton?
There are 59 People in the Labor Forcein in Denton.
What is the Percentage of People in the Labor Force in Denton?
26.6% of People are in the Labor Force in Denton.