Zip Codes with the Highest Percentage of Population Employed in Security & Protection in Warner Robins, GA
RELATED REPORTS & OPTIONS
Security & Protection
Warner Robins
Compare Zip Codes
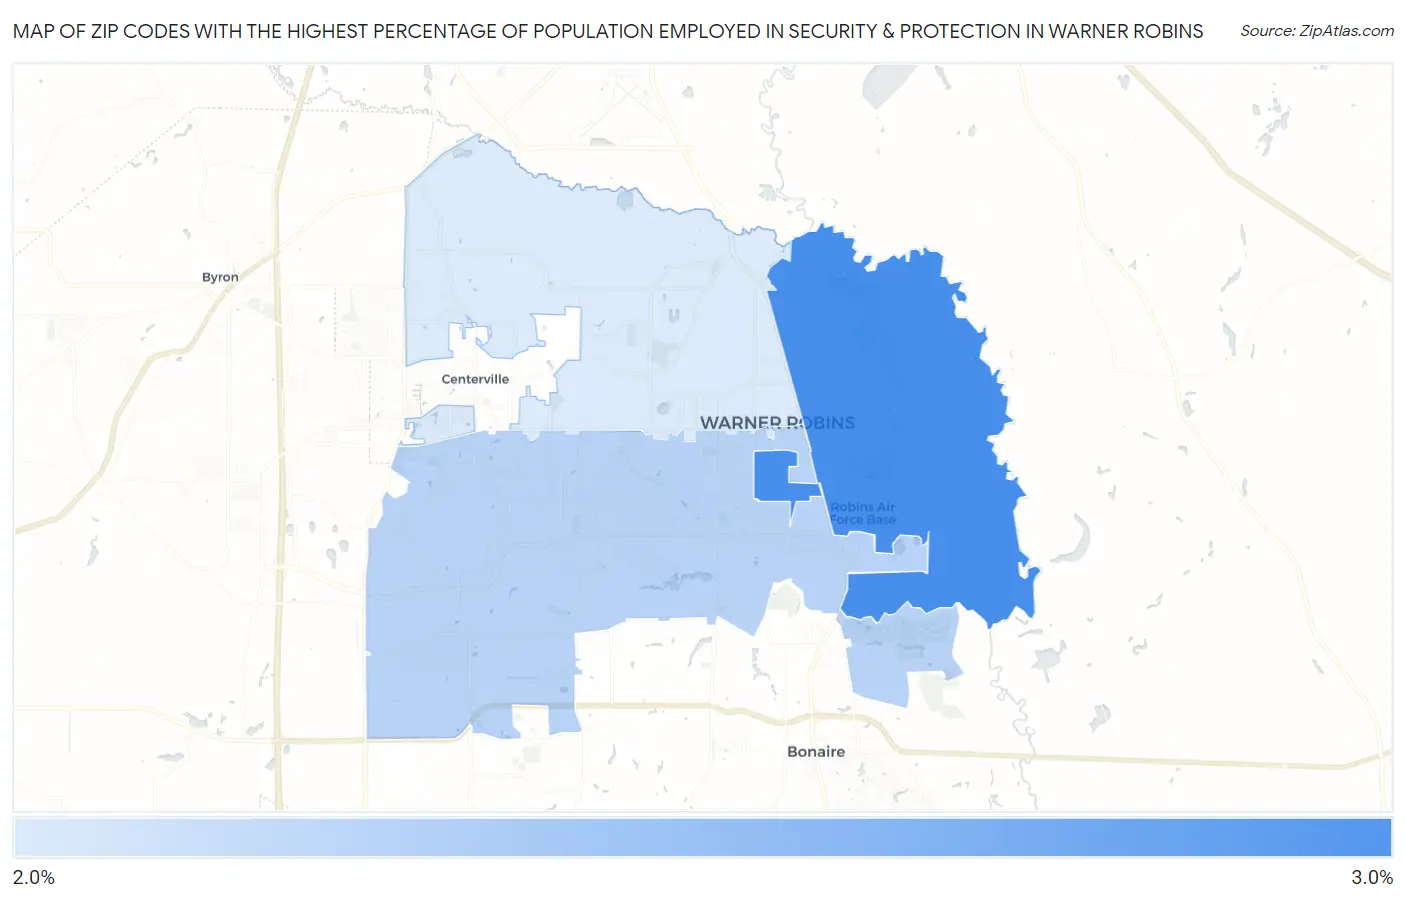
Map of Zip Codes with the Highest Percentage of Population Employed in Security & Protection in Warner Robins
2.5%
2.9%
Zip Codes with the Highest Percentage of Population Employed in Security & Protection in Warner Robins, GA
| Zip Code | % Employed | vs State | vs National | |
| 1. | 31098 | 2.9% | 2.2%(+0.705)#228 | 2.1%(+0.729)#7,742 |
| 2. | 31088 | 2.6% | 2.2%(+0.413)#267 | 2.1%(+0.437)#9,074 |
| 3. | 31093 | 2.5% | 2.2%(+0.317)#277 | 2.1%(+0.340)#9,572 |
1
Common Questions
What are the Top Zip Codes with the Highest Percentage of Population Employed in Security & Protection in Warner Robins, GA?
Top Zip Codes with the Highest Percentage of Population Employed in Security & Protection in Warner Robins, GA are:
What zip code has the Highest Percentage of Population Employed in Security & Protection in Warner Robins, GA?
31098 has the Highest Percentage of Population Employed in Security & Protection in Warner Robins, GA with 2.9%.
What is the Percentage of Population Employed in Security & Protection in Warner Robins, GA?
Percentage of Population Employed in Security & Protection in Warner Robins is 2.4%.
What is the Percentage of Population Employed in Security & Protection in Georgia?
Percentage of Population Employed in Security & Protection in Georgia is 2.2%.
What is the Percentage of Population Employed in Security & Protection in the United States?
Percentage of Population Employed in Security & Protection in the United States is 2.1%.